Oil & Gas Equipment & Services
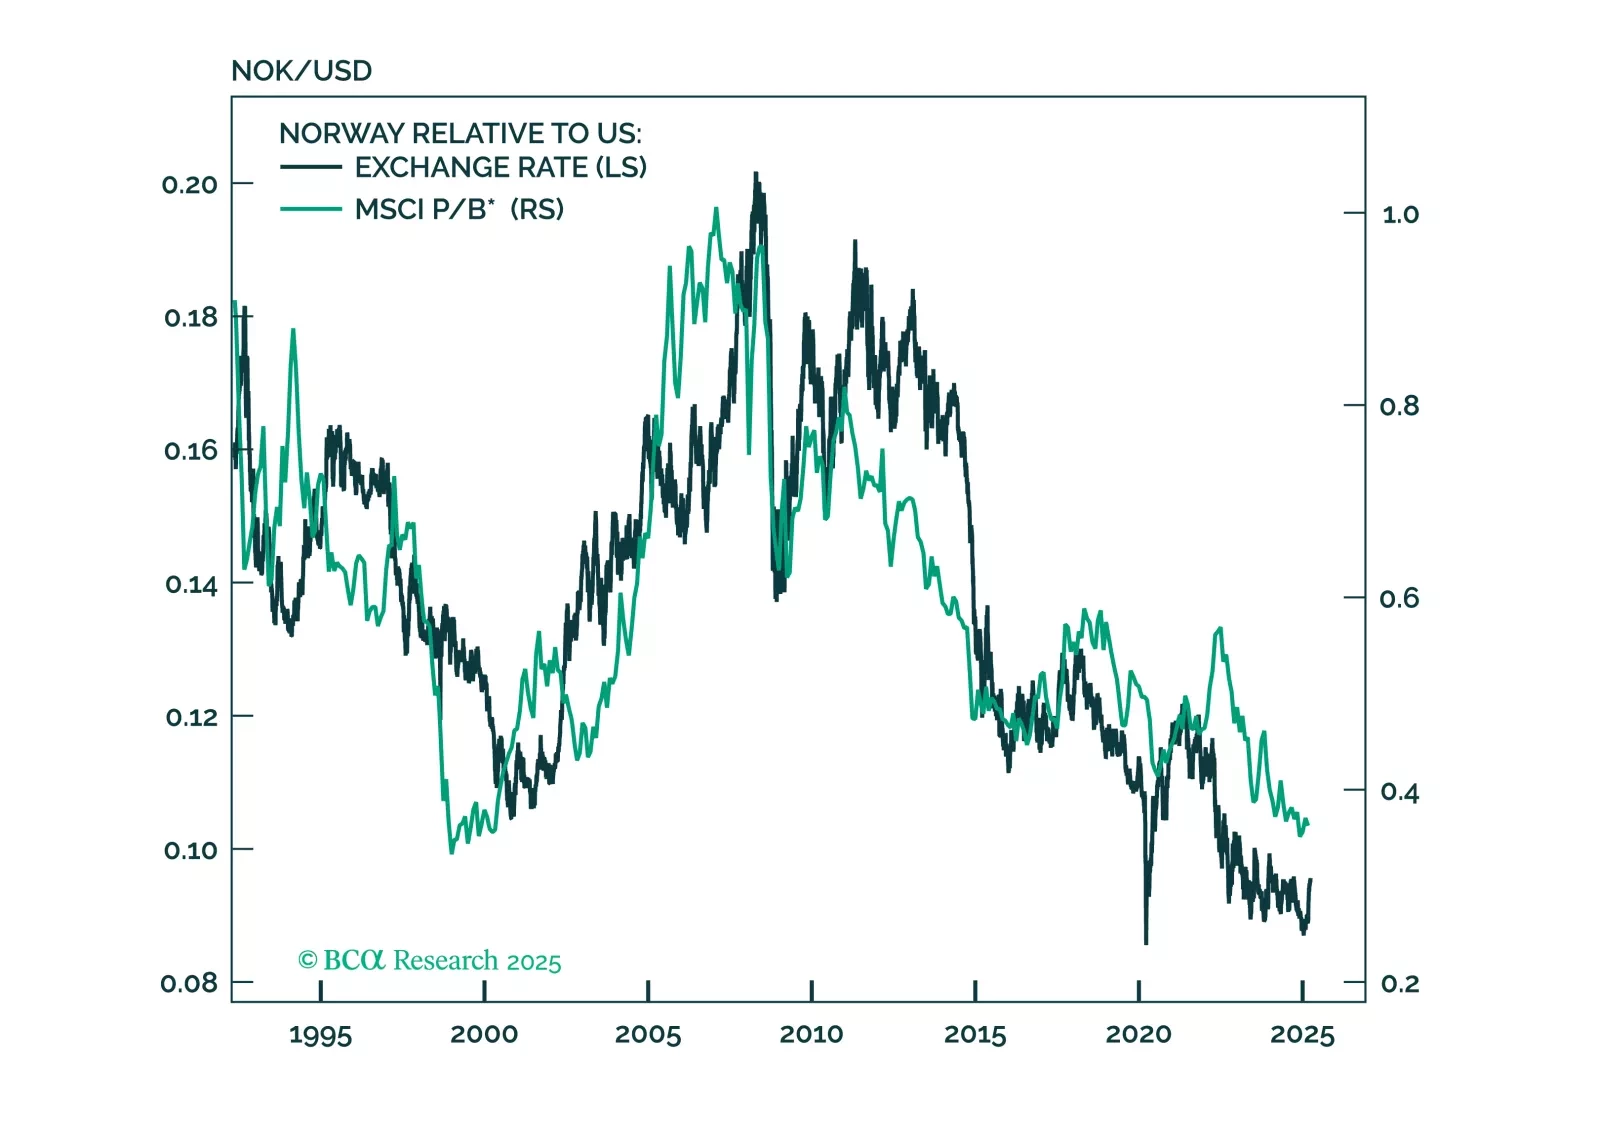
This report looks at investment implications, for Norwegian assets, given the recent meeting, from the Norges Bank.

China’s oil demand growth will moderate to a still robust 4%-6% in the next six-to-nine months. We recommend that investors in China’s onshore and offshore stock indexes overweight energy producers.
Overweight Quarter-to-date the S&P energy services index is up 12% compared with the 2% rise in the broad market. While the steep rebound in oil prices primarily lies behind such stellar outperformance (top panel), our capex upcycle theme for 2018 should support this nascent recovery. Energy related capital spending budgets are not only rising in the U.S. (primarily in shale oil), but also globally. The global rig count is breaking out, and declining OECD oil stocks suggest that drilling activity will remain robust (second and third panels). Relative share price momentum does not yet fully reflect the rebound in industry investment (using national accounts) that remains in a V-shaped recovery since the Q1/2016 oil market trough (bottom panel). In sum, there are more gains in store for the S&P energy services index. Firming industry demand at a time when global energy capital spending budgets are renormalizing, along with rising crude oil prices, signal that high-beta energy services equities have more running room. Bottom Line: Stay overweight the S&P energy service index and see our Weekly Report for more details. The ticker symbols for the stocks in this index are: BLBG: S5ENRE: NOV, SLB, FTI, BHGE, HAL, HP.
Energy services shares have pulled back as oil prices have marked time over the last few weeks, but in the background, the conditions to sustain a rally are falling into place. The growth in total OECD oil stocks has rolled over decisively, and a continued supply/demand rebalancing should occur given that world oil production growth has slipped to nil courtesy of OPEC output cuts. The bond market has increased confidence that oil prices will not tumble anew, as reflected in the sharp narrowing in energy corporate bond spreads. Many companies have used the recovery in oil prices to refinance and bolster balance sheets, underscoring that the financial means to boost exploration exist. With energy services pricing power trying to make an early exit from deflation on only a small boost to the global rig count, there is scope for the attractively valued S&P oil & gas field services index to surprise on the upside. We have this at high-conviction overweight. The ticker symbols for the stocks in the S&P oil & gas field services index are: BLBG: S5ENRE - SLB, HAL, BHI, NOV, FTI, HP, RIG.
Highlights Portfolio Strategy If the Fed is about to begin interest rate re-normalization in earnest, then investors should heed the message from historic sector performance during tightening cycles. The tech sector remains vulnerable to tighter monetary conditions. Downshift communications equipment to neutral and stay clear of software. The OPEC supply agreement reinforces our current energy sector bias, overweight oil services and underweight refiners. Recent Changes S&P Communications Equipment - Reduce to neutral. Table 1 Feature Chart 1Why Is Equity Vol So Low? The equity market has been in a remarkably low volatility uptrend in recent weeks, powered by hopes that political regime shifts will invigorate growth. Signs of economic life have also played a role. The risk is that investors have pulled forward profit growth expectations on the basis of anticipated fiscal stimulus that may disappoint. In the meantime, the tighter domestic monetary conditions get, the less likely equity resilience can persist, especially in the face of rising instability in other financial markets. Volatility has jumped across asset classes, with the bond market leading the charge. The MOVE index of Treasury bond volatility has spiked. Typically, the MOVE leads the VIX index of implied equity market volatility (Chart 1, second panel). Currency and commodity price volatility has also picked up. It would be dangerous to assume that the equity market can remain so sedate. If the economy is about to grow in line with analysts double-digit profit growth expectations and/or what the surge in some cyclical sectors would suggest, then a re-pricing of Fed interest rate hike expectations is likely to persist. Against this backdrop, it is instructive to revisit historic sector performance during past Fed tightening cycles. If one views the next interest rate hike as the start of a sustained trend based on the steep trajectory of expected profit growth embedded in valuations and forecasts, then it is useful to use that as a starting point rather than last year's token 'one and done' interest rate hike. Charts 2 and 3 show the one-year and two-year average sector relative returns after Fed tightening cycles have commenced. A clear pattern is evident: defensive sectors have been the best performers by a wide margin, followed by financials, while cyclical sectors have underperformed over both time horizons. To be sure, every cycle is different, but this is a useful frame of reference for investors that have ramped up growth and cyclical sector earnings expectations in recent months. There has already been considerable tightening based on the Shadow Fed Funds Rate, a bond market-derived fed funds rate not bound by zero percent (Chart 4, shown inverted, top panel). The latter foreshadows a much tougher slog for the broad market. The point is that tighter monetary conditions can overwhelm valuation multiples and growth expectations. Chart 212-Month Performance After Fed Hikes Chart 324-Month Performance After Fed Hikes Chart 4A Blow-Off Top? The violent sub-surface equity rotation has presented a number of rebalancing opportunities. The defensive health care and consumer staples sectors have been shunned in recent weeks, with capital rotating into financials and industrials. As discussed previously, the industrials and materials sectors cannot rise in tandem for long with the U.S. dollar. These sectors should be used as a source of funds to take advantage of value creation in consumer discretionary, staples and health care where value has reappeared. Chart 5It's Not A ''Growth'' Trade Indeed, the abrupt jump in the cyclical vs. defensive share price ratio appears to have been driven solely by external forces, i.e. the sell-off in the bond market, rather than a shift in underlying operating profit drivers. For instance, emerging market (EM) equities and the cyclical vs. defensive share price ratio have tended to move hand-in-hand (Chart 5). The former are pro-cyclical, and outperform when economic growth prospects are perceived to be improving. Recent sharp EM underperformance has created a large negative divergence with the U.S. cyclical vs. defensive share price ratio. The surging U.S. dollar is a growth impediment for many developing countries with large foreign debt liabilities, and the lack of EM equity participation reinforces that the recent rise in industrials is not a one way bet. As a result, our preferred cyclical sector exposure lies in the consumer discretionary sector, and not in capital spending-geared deep cyclical sectors. A market weight in financials, utilities and energy is warranted, as discussed below, while the tech sector is vulnerable. A Roundtrip For The Tech Sector? After a semiconductor M&A-driven spurt of strength, the S&P technology sector has stumbled. As a long duration sector, technology has borne a disproportionate share of the backlash from a higher discount rate, similar to the taper-tantrum period in 2013. Then, bond yields soared as the Fed floated trial balloons about tapering QE. Tech stocks did not trough until yields peaked (Chart 6). In addition, a recovery in tech new orders confirmed that the sales outlook had brightened. Now, the capital spending outlook remains shaky, and tech new order growth is nil (Chart 6). Meanwhile, tech pricing power has nosedived (Chart 6). Domestic deflationary pressures are likely to intensify as the U.S. dollar appreciates, particularly against the manufacturing and tech-sensitive emerging Asian currencies. Tech sales growth is already sliding rapidly toward negative territory (Chart 7), with no reprieve in sight based on the contraction in emerging market exports, as well as U.S. consumer and capital goods import prices. Chart 6Tech Doesn't Like Rising Bond Yields Chart 7No Sales Growth True, tech stocks have a solid relative performance track record when the U.S. dollar initially embarks on a long-term bull market (Chart 8). Why? Because tech business models incorporate deflationary conditions, investors have been comfortable bidding up valuations in excess of the negative sales impact from a stronger U.S. dollar. Nevertheless, history shows that this relationship becomes untenable the longer currency appreciation persists. Chart 8 shows that in the final phase of the past two U.S. dollar bull markets, tech stocks have abruptly reversed course, rapidly ceding the previously accrued gains. Apart from a loss of competitiveness from currency strength, the new anti-globalization trend is bad for tech as it has the highest foreign sales exposure. The bottom line is that there is no rush to lift underweight tech sector allocations. In fact, we are further tweaking weightings to reduce exposure. For instance, software companies are worth another look through a bearish lens. Software sales growth is at risk from pricing power slippage amidst cooling final demand (Chart 9). Chart 8Beware Phase II Of Dollar Bull Markets Chart 9Sell Software... The financial sector is an influential technology sector end market. On the margin, financial companies are likely to reduce capital spending on the back of deteriorating credit quality. Chart 9 demonstrates that when financial sector corporate bond ratings start to trend negatively, it is a sign that software investment will stumble. A similar message is emanating from the decline in overall CEO confidence (Chart 10), which mirrors the relentless narrowing in the gap between the return on and cost of capital (Chart 8, bottom panel). Even C&I bank loans, previously an economic bright spot, are signaling that corporate sector demand for external funds and working capital are softening, consistent with slower capital spending. Against a backdrop of fading software M&A activity, we are skeptical that the S&P software index can maintain its premium valuation (Chart 11). Chart 10... Before Sales Erode Chart 11Not Worth A Premium Elsewhere, the communications equipment industry will have trouble sustaining this summer's outperformance. Communications equipment stocks broke out of a long-term downward sloping trend-line on the back of productivity improvement. Chart 12 shows that after a period of intense cost cutting, wage inflation was negative. Our productivity proxy, defined as sales/employment, is growing rapidly. These trends are supportive of profit margins, and at least a modest valuation re-rating from washed out levels. Nevertheless, our confidence that a major bullish trend change has occurred after years of underperformance has been shaken. The budding reacceleration in top-line growth has hit a snag. New orders for communications equipment have rolled over relative to inventories. Investment in communications equipment has dipped (Chart 13). The telecom services sector has scaled back capital spending (Chart 13, third panel), suggesting that final demand will continue to soften. It will be difficult for companies to maintain high productivity if revenue growth stagnates. Chart 12Productivity Strength... Chart 13... May Be Pressured Consequently, the most likely scenario is that relative performance is entering a base-building phase rather than a new bull market, warranting benchmark weightings. Bottom Line: Reduce the S&P communications equipment index (BLBG: S5COMM - CSCO, MSI, HRS, JNPR, FFIV) to neutral, in a move to further reduce underweight tech sector exposure. Stay underweight software (BLBG: S5SOFT - MSFT, ORCL, ADBE, CRM, INTU, ATVI, EA, ADSK, SYMC, RHT, CTXS, CA). Energy Strategy Post-OPEC Production Cut Chart 14Energy Stocks Need Rising Oil Prices The energy sector continues to mark time relative to the broad market, but that has masked furious sub-surface movement. We have maintained a benchmark exposure to the broad sector since the spring, but shifted our sub-industry exposure in October to favor oil field services over producers, while underemphasizing refiners. OPEC's recent agreement to trim flatters this positioning. Whether OPEC's announcement actually feeds through into meaningfully lower production next year and higher oil prices remains to be seen, but at a minimum, supply discipline should put a floor under prices. Rather than expecting the overall energy sector to break out of its lateral move relative to the broad market, we continue to recommend a targeted approach. The energy sector requires sustained higher commodity prices to outperform, and our concern is that a trading range is more likely (Chart 14). OPEC producers suffered considerable pain over the last two years as they overproduced in order to starve marginal producers of the capital needed for reinvestment. U.S. shale producers slashed capital expenditures by 65% from 2014 to 2016, and the International Oil Companies (IOCs) cut capital expenditures by 40% over the same period. Chart 15 shows that only OPEC has been expanding production. That has set the stage for limited global production growth, allowing for demand growth to eat into overstocked crude inventories in the coming years. OPEC's decision to trim output should mitigate downside commodity price risks, providing debt and equity markets with confidence to increase capital availability to the sector. With a lower cost and easier access to capital, producers, especially shale, will be able to accelerate drilling programs. The rig count has already troughed. The growth in OECD oil inventories has crested, which is consistent with a gradual rise in the number of active drilling rigs. As oversupply is absorbed, investment in oil field services will accelerate, unlocking relative value in the energy services space (Chart 16). Chart 15OPEC Cuts Would Help... Chart 16... Erode Excess Oil Supply This overweight position is still high risk, because it will take time to absorb the excesses from the previous drilling cycle. There is still considerable overcapacity in the oil field services industry, as measured by our idle rig proxy. Pricing power does not typically return until the latter rises above 1 (Chart 17). Companies will be eager to put crews to work and better cover overhead, and may accept suboptimal pricing, at least initially. Meanwhile, if EM currencies continue to weaken, confidence in EM oil demand growth may be shaken, eroding valuations. Still, we are willing to accept these risks, but will keep this overweight position on a tight leash and will take profits if OPEC does not follow through with plans to limit production. On the flipside, refiners will not receive any relief in feedstock prices, which should ensure that the gap between Brent and WTI prices remains non-existent (Chart 18). That is a strain on refining margins. Our model warns that there is little profit upside ahead. That is confirmed by both domestic and global trends. Chart 17Risks To A Sustained Rally Chart 18Sell Refiners Chart 19Global Capacity Growth Refiners have continued to produce flat out, even as domestic crude production has dropped (Chart 18). As a result, inventories of gasoline and distillates have surged, despite solid consumption growth. In fact, refined product output is about to eclipse the rate of consumption growth, which implies persistently swelling inventories. There is no export outlet to relieve excess supply. U.S. exports are becoming much less competitive on the back of U.S. dollar strength and the elimination of the gap between WTI and Brent input costs (Chart 19). Moreover, rising capacity abroad has trigged an acceleration of refined product exports in a number of low cost producer countries, including India, China and Saudi Arabia (Chart 19). Increased global refining capacity is a structural trend, and will keep valuation multiples lower than otherwise would be the case. The relative price/sales ratio is testing cyclical peaks, warning that downside risks remain acute. Bottom Line: Maintain a neutral overall sector weighting, with outsized exposure to the oil & gas field services industry (BLBG: S5ENRE - SLB, HAL, BHI, NOV, HP, FTI, RIG), and undersized allocations to the refining group (BLBG: S5OILR - PSX, VLO, MPC, TSO). Current Recommendations Current Trades Size And Style Views Favor small over large caps and growth over value.
The mini-consolidation in equities reflects the ongoing tension between market-supportive liquidity and a sketchy corporate profit backdrop.