Australia

HighlightsThe power shortage in China due to depleted coal inventories and low hydro availability will push copper and aluminum inventories lower, as refineries there – which account for roughly one-half of global capacity – are shut to conserve power (Chart of the Week).Given the critical role base metals will play in the decarbonization of the global economy, alternative capacity will have to be incentivized ex-China by higher prices to reduce refining-concentration risk in the future.Unexpectedly low renewable-energy output in the EU and UK following last year's cold winter will keep competition with China for LNG cargoes elevated this winter. It also highlights the unintended consequences of phasing down fossil-fuel generation without sufficient back-up.The US Climate Prediction Center kept its expectation for a La Niña at 70-80%, which raises the odds of a colder-than-normal winter for the Northern Hemisphere. Normal-to-warmer temps cannot be entirely dismissed, however.Increased production of highly efficacious COVID-19 vaccines globally – particularly in EM economies – will stoke economic growth and release pent-up demand among consumers.We remain long 1Q22 natgas exposure via call spreads; long commodity index exposure (S&P GSCI and COMT ETF) to benefit from increasing backwardation as inventories of industrial commodities fall; and long the PICK ETF to benefit from expected tightening of base metals markets.FeatureNatgas prices are surging in the wake of China's and Europe's scramble to cover power shortages arising from depleted coal inventories and low hydroelectric generation in the former, and unexpectedly low output from renewables in the latter (Chart 2).1Given all the excitement of record-high gas prices in the EU and surging oil prices earlier this week, it is easy to lose sight of the longer-term implications of these developments for the global decarbonization push. Chart of the WeekBase Metals Refining Concentrated In China
La Niña And The Energy Transition
La Niña And The Energy Transition
Chart 2Surge In Gas Prices Continues
La Niña And The Energy Transition
La Niña And The Energy Transition
Global copper inventories have been tightening (Chart 3) along with aluminum balances (Chart 4).2 Power shortages in China- which accounts for ~40% of global refined copper output and more than 50% of refined aluminum - are forcing shutdowns in production by authorities seeking to conserve energy going into winter. In addition, the upcoming Winter Olympics in February likely will keep restrictions on steel mills, base-metals refiners, and smelters in place, so as to keep pollution levels down and skies blue. Chart 3Supply-Demand Balance Tightening In Copper
Supply-Demand Balance Tightening In Copper
Supply-Demand Balance Tightening In Copper
Chart 4Along With Aluminum Balances...
Along With Aluminum Balances...
Along With Aluminum Balances...
This will keep prices well supported and force manufacturers to draw on inventories, which will keep forward curves for copper (Chart 5) and aluminum (Chart 6) backwardated. Higher costs for manufactured goods can be expected as well, which will exacerbate the cost-push inflation coming through from clogged global supply chains. This slowdown in global supply chains is largely the result of global aggregate demand improving at a faster rate than supply.3 Chart 5Copper Prices And Backwardation
Copper Prices And Backwardation
Copper Prices And Backwardation
Chart 6...Will Increase Along With Aluminum
...Will Increase Along With Aluminum
...Will Increase Along With Aluminum
The pressures on base metals markets highlight the supply-concentration risks associated with the large share of global refining capacity located in China. This makes refined base metals supplies and inventories globally subject to whatever dislocations are impacting China at any point in time. As the world embarks on an unprecedented decarbonization effort, this concentration of metals refining capacity becomes increasingly important, given the centrality of base metals in the build-out of renewable-energy and electric-vehicles (EVs) globally (Chart 7).In addition, increasing tension between Western states and China supports arguments to diversify supplies of refined metals in the future (e.g., the US, UK and Australia deal to supply US nuclear-powered submarine technology to Australia, and the tense Sino-Australian trade relationship that led to lower Chinese coal inventories).4 Chart 7The Need For Refined Metals Grows
La Niña And The Energy Transition
La Niña And The Energy Transition
EU's Renewables Bet SoursUnlike China, which gets ~ 11% of its electricity from renewables and ~ 63% of its power from coal-fired generation (Chart 8), the EU gets ~ 26% of its power from renewables and ~ 13% from coal (Chart 9). In fact, the EU's made a huge bet on renewables, particularly wind power, which accounts for ~55% of its renewables supply. Chart 8China's Dependence On Coal …
La Niña And The Energy Transition
La Niña And The Energy Transition
Chart 9… Greatly Exceeds The EU's
La Niña And The Energy Transition
La Niña And The Energy Transition
Unexpectedly low renewable-energy output in the EU and UK this summer – particularly wind power – forced both to scramble for natgas and coal supplies to cover power needs.5 As can be seen in Chart 9, the EU has been winding down its fossil-fuel-fired electric generation in favor of renewables. When the wind stopped blowing this year the EU was forced into an intense competition with China for LNG cargoes in order to provide power and rebuild storage for the coming winter (Chart 10). Chart 10The Scramble For Natgas Continues
La Niña And The Energy Transition
La Niña And The Energy Transition
The current heated – no pun intended – competition for natgas going into the coming winter is the result of two policy errors, which will be corrected by Spring of next year. On China's side, coal inventories were allowed to run down due to diplomacy, which left inventories short going into winter. In the EU, wind power availability fell far short of expectations, another result of a policy miscalculation: Nameplate wind capacity is meaningless if the wind stops blowing. Likewise for sun on a cloudy day.Natgas Price Run-Up Is TransitoryThe run-up in natgas prices occasioned by China's and the EU's scramble for supplies is transitory. Still, uncertainty as to the ultimate path global gas prices will take is at its maximum level at present.The US Climate Prediction Center kept its expectation for a La Niña at 70-80%, which raises the odds of a colder-than-normal winter for the Northern Hemisphere. Even so, this is a probabilistic assessment: Normal-to-warmer temps cannot be dismissed, given this probability. A normal to warmer winter would leave US inventories and the availability to increase LNG exports higher, which would alleviate much of the pricing pressure holding Asian and European gas prices at eye-watering levels presently.Going into 1Q22, we expect increased production of highly efficacious COVID-19 vaccines globally – particularly in EM economies – will stoke economic growth and release pent-up demand among consumers as hospitalization and death rates continue to fall (Chart 11).6 At that point, we would expect economic activity to pick up significantly, which would be bullish for natgas. We also expect US and Russian natgas production to pick up, with higher prices supporting higher rig counts in the US in particular. Chart 11Expect Continued COVID-19 Progress
La Niña And The Energy Transition
La Niña And The Energy Transition
Investment ImplicationsAs the world embarks on an unprecedented decarbonization effort, it is important to follow the supply dynamics of base metals, which will provide the materials needed to build out renewable generation and EVs.The current price pressure in natural gas markets resulting from policy miscalculations cannot be ignored. Still, this pressure is more likely to be addressed quickly and effectively than the structural constraints in base metals markets.On the base metals side, producers remain leery of committing to large capex projects at the scale implied by policy projections for the renewables buildout.7In addition, current market conditions highlight concentration risks in these markets – particularly on the refining side in base metals, where much of global capacity resides in China. On the production and refining side of EV materials, battery technology remains massively concentrated to a few countries (e.g., cobalt mining and refining in the Democratic Republic of Congo and China, respectively).This reinforces our view that oil and gas production and consumption likely will not decay sharply unless and until these capex issues and concentration risks are addressed. For this reason, we remain bullish oil and gas. Robert P. Ryan Chief Commodity & Energy Strategistrryan@bcaresearch.comAshwin ShyamResearch AssociateCommodity & Energy Strategyashwin.shyam@bcaresearch.com Commodities Round-UpEnergy: BullishDelegates at OPEC 2.0's Ministerial Meeting on Monday likely will agree to increase the amount of oil being returned to markets by an additional 100-200k b/d. This would take the monthly production rate of production being restored from 400k b/d to 500-600k b/d. Depending on how quickly mRNA vaccine production in large EM markets is rolled out, this incremental increase could remain in place into 2Q22. This would assuage market concerns prices could get to the point that demand is destroyed just as economic re-opening is beginning in EM economies. Our view remains that the producer coalition led by Saudi Arabia and Russia will continue to balance the need for higher revenues of member states with the fragile recovery in EM economies. We continue to expect prices in 2022 to average $75/bbl and $80/bbl in 2023 (Chart 12). This allows OPEC 2.0 states to rebuild their balance sheets and fund their efforts to diversify their economies without triggering demand destruction.Base Metals: BullishA power crunch and decarbonization policies in China are supporting aluminum prices at around 13-year highs, after reaching a multi-year peak earlier this month (Chart 13). The energy-intensive electrolytic process of converting alumina to metal makes aluminum production highly sensitive to fluctuations in power prices. High power prices and electricity shortages are impacting aluminum companies all over China, one of which is Yunnan Aluminium. According to the Financial Times, the company accounts for 10% of total aluminum supply in the world’s largest producer.Precious Metals: BullishGold prices dipped following a hawkish FOMC meeting last week. More Fed officials see a rate hike in 2022, compared to the previous set of projections released in June. Fed Chair Jay Powell also hinted at a taper in the asset purchase program on the back of a rebounding US economy, provided a resurgence in COVID-19 does not interrupt this progress. A confirmation of what markets were expecting – i.e., paring asset purchases by year-end – and possible rate hikes next year have buoyed the US dollar and Treasury yields. The USD competes directly with gold for safe-haven investment demand. Higher interest rates will increase the opportunity cost of holding the yellow metal. As a result, gold prices will be subdued when the USD is strengthening. We remain bearish the USD, and, therefore, bullish gold. Chart 12Oil Forecasts Hold Steady
Oil Forecasts Hold Steady
Oil Forecasts Hold Steady
Chart 12Aluminum Prices Recovering
Aluminum Prices Recovering
Aluminum Prices Recovering
Footnotes1 Please see China's Yunnan imposes output curbs on aluminium, steel, cement makers published by reuters.com on September 13, 2021.2 NB: Global aluminum inventory data are unreliable and we do not publish them.3 Please see, e.g., Supply Chains, Global Growth, and Inflation, published by gspublishing.com on September 20, 2021.4 Please see US-China: War Preparation Pushes Commodity Demand, a Special Report we published on August 26, 2021, for further discussion.5 We discuss this in last week's report entitled Natgas Markets Continue To Tighten, which is available at ces.bcaresearch.com.6 Please see Upside Price Risk Rises For Crude, which updated our oil-price balances and forecasts. We highlight the recent agreements to mass produce the highly effective mRNA COVID-19 vaccines globally as bullish for oil prices. It also will be bullish for natgas and other commodities.7 Please see Assessing Risks To Our Commodity Views, which we published on July 8, 2021, for additional discussion. Investment Views and ThemesStrategic RecommendationsTactical TradesCommodity Prices and Plays Reference TableTrades Closed in 2021Summary of Closed Trades
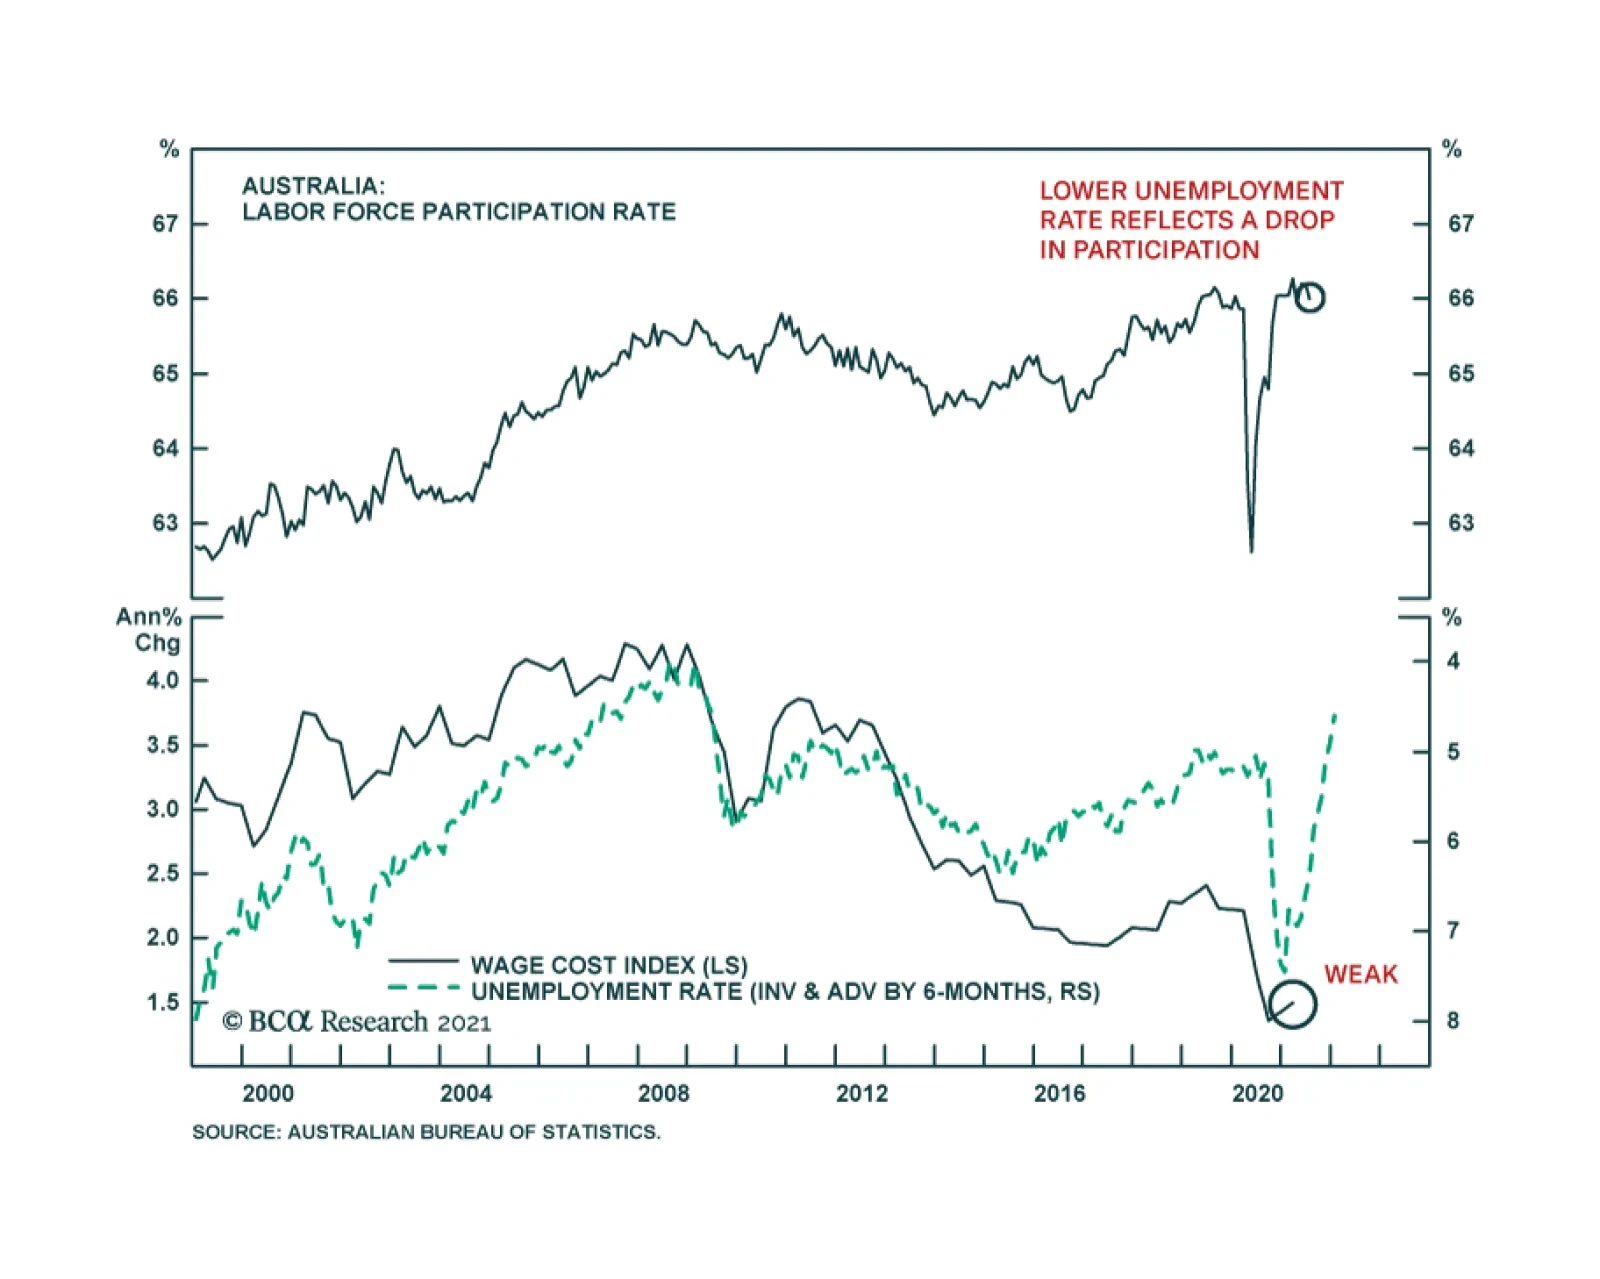
At first blush, Australia’s labor market recovery appears to have accelerated in August. The unemployment rate fell to a 13-year low of 4.5% versus expectations it would rise 0.4 percentage points to 5.0%. However, the lower unemployment rate reflects a…
Highlights The US Climate Prediction Center gives ~ 70% odds another La Niña will form in the August – October interval and will continue through winter 2021-22. This will be a second-year La Niña if it forms, and will raise the odds of a repeat of last winter's cold weather in the Northern Hemisphere.1 Europe's natural-gas inventory build ahead of the coming winter remains erratic, particularly as Russian flows via Ukraine to the EU have been reduced this year. Russia's Nord Stream 2 could be online by November, but inventories will still be low. China, Japan, South Korea and India – the four top LNG consumers in Asia – took in 155 Bcf of the fuel in June. A colder-than-normal winter would boost demand. Higher prices are likely in Europe and Asia (Chart of the Week). US storage levels will be lower going into winter, as power generation demand remains stout, and the lingering effects from Hurricane Ida reduce supplies available for inventory injections. Despite spot prices trading ~ $1.30/MMBtu above last winter's highs – currently ~ $4.60/MMBtu – we are going long 1Q22 NYMEX $5.00/MMBtu natgas calls vs short NYMEX $5.50/MMBtu natgas calls expecting even higher prices. Feature Last winter's La Niña was a doozy. It brought extreme cold to Asia, North America and Europe, which pulled natural gas storage levels sharply lower and drove prices sharply higher as the Chart of the Week shows. Natgas storage in the US and Europe will be tight going into this winter (Chart 2). Europe's La Niña lingered a while into Spring, keeping temps low and space-heating demand high, which delayed the start of re-building inventory for the coming winter. In the US, cold temps in the Midwest hampered production, boosted demand and caused inventory to draw hard. Chart of the WeekA Return Of La Niña Could Boost Global Natgas Prices
A Return Of La Niña Could Boost Global Natgas Prices
A Return Of La Niña Could Boost Global Natgas Prices
Chart 2Europe, US Gas Stocks Will Be Tight This Winter
NatGas: Winter Is Coming
NatGas: Winter Is Coming
Summer in the US also produced strong natgas demand, particularly out West, as power generators eschewed coal in favor of gas to meet stronger air-conditioning demand. This is partly due to the closing of coal-fired units, leaving more of the load to be picked up by gas-fired generation (Chart 3). The EIA estimates natgas consumption in July was up ~ 4 Bcf/d to just under 76 Bcf/d. Hurricane Ida took ~ 1 bcf/d of demand out of the market, which was less than the ~ 2 Bcf/d hit to US Gulf supply resulting from the storm. As a result, prices were pushed higher at the margin. Chart 3Generators Prefer Gas To Coal
NatGas: Winter Is Coming
NatGas: Winter Is Coming
US natgas exports (pipeline and LNG) also were strong, at 18.2 Bcf/d in July (Chart 4). We expect US LNG exports, in particular, to resume growth as the world recovers from the COVID-19 pandemic (Chart 5). This strong demand and exports, coupled with slightly lower supply from the Lower 48 states – estimated at ~ 98 Bcf/d by the EIA for July (Chart 6) – pushed prices up by 18% from June to July, "the largest month-on-month percentage change for June to July since 2012, when the price increased 20.3%" according to the EIA. Chart 4US Natgas Exports Remain Strong
US Natgas Exports Remain Strong
US Natgas Exports Remain Strong
Chart 5US LNG Exports Will Resume Growth
NatGas: Winter Is Coming
NatGas: Winter Is Coming
Chart 6US Lower 48 Natgas Production Recovering
US Lower 48 Natgas Production Recovering
US Lower 48 Natgas Production Recovering
Elsewhere in the Americas, Brazil has been a strong bid for US LNG – accounting for 32.3 Bcf of demand in June – as hydroelectric generation flags due to the prolonged drought in the country. In Asia, demand for LNG remains strong, with the four top consumers – China, Japan, South Korea, and India – taking in 155 Bcf in June, according to the EIA. Gas Infrastructure Ex-US Remains Challenged A combination of extreme cold weather in Northeast Asia, and a lack of gas storage infrastructure in Asia generally, along with shipping constraints and supply issues at LNG export facilities, led to the Asian natural gas price spike in mid-January.2 Very cold weather in Northeast Asia, drove up LNG demand during the winter months. In China, LNG imports for the month of January rose by ~ 53% y-o-y (Chart 7).3 The increase in imports from Asia coincided with issues at major export plants in Australia, Norway and Qatar during that period. Chart 7China's US LNG Exports Surged Last Winter, And Remain Stout Over The Summer
NatGas: Winter Is Coming
NatGas: Winter Is Coming
Substantially higher JKM (Japan-Korea Marker) prices incentivized US exporters to divert LNG cargoes from Europe to Asia last winter. The longer roundtrip times to deliver LNG from the US to Asia – instead of Europe – resulted in a reduction of shipping capacity, which ended up compounding market tightness in Europe. Europe dealt with the switch by drawing ~ 18 bcm more from their storage vs. the previous year, across the November to January period. Countries in Asia - most notably Japan – however, do not have robust natural gas storage facilities, further contributing to price volatility, especially in extreme weather events. These storage constraints remain in place going into the coming winter. In addition, there is a high probability the global weather pattern responsible for the cold spells around the globe that triggered price spikes in key markets globally – i.e., a second La Niña event – will return. A Second-Year La Niña Event The price spikes and logistical challenges of last winter were the result of atmospheric circulation anomalies that were bolstered by a La Niña event that began in mid-2020.4 The La Niña is characterized by colder sea-surface temperatures that develops over the Pacific equator, which displaces atmospheric and wind circulation and leads to colder temperatures in the Northern Hemisphere (Map 1). Map 1La Niña Raises The Odds Of Colder Temps
NatGas: Winter Is Coming
NatGas: Winter Is Coming
The IEA notes last winter started off without any exceptional deviations from an average early winter, but as the new year opened "natural gas markets experienced severe supply-demand tensions in the opening weeks of 2021, with extremely cold temperature episodes sending spot prices to record levels."5 In its most recent ENSO update, the US Climate Prediction Center raised the odds of another La Niña event for this winter to 70% this month. If similar conditions to those of the 2020-21 winter emerge, US and European inventories could be stretched even thinner than last year, as space-heating demand competes with industrial and commercial demand resulting from the economic recovery. Global Natgas Supplies Will Stay Tight JKM prices and TTF (Dutch Title Transfer Facility) prices are likely to remain elevated going into winter, as seen in the Chart of the Week. Fundamentals have kept markets tight so far. Uncertain Russian supply to Europe will raise the price of the European gas index (TTF). This, along with strong Asian demand, particularly from China, will keep JKM prices high (Chart 8). The global economic recovery is the main short-term driver of higher natgas demand, with China leading the way. For the longer-term, natural gas is considered as the ideal transition fuel to green energy, as it emits less carbon than other fossil fuels. For this reason, demand is expected to grow by 3.4% per annum until 2035, and reach peak consumption later than other fossil fuels, according to McKinsey.6 Chart 8BCAs Brent Forecast Points To Higher JKM Prices
BCAs Brent Forecast Points To Higher JKM Prices
BCAs Brent Forecast Points To Higher JKM Prices
Spillovers from the European natural gas market impact Asian markets, as was demonstrated last winter. Russian supply to Europe – where inventories are at their lowest level in a decade – has dropped over the last few months. This could either be the result of Russia's attempts to support its case for finishing Nord Stream 2 and getting it running as soon as possible, or because it is physically unable to supply natural gas.7 A fire at a condensate plant in Siberia at the beginning of August supports the latter conjecture. The reduced supply from Russia, comes at a time when EU carbon permit prices have been consistently breaking records, making the cost of natural gas competitive compared to more heavy carbon emitting fossil fuels – e.g., coal and oil – despite record breaking prices. With Europe beginning the winter season with significantly lower stock levels vs. previous years, TTF prices will remain volatile. This, and strong demand from China, will support JKM prices. Investment Implications Natural gas prices are elevated, with spot NYMEX futures trading ~ $1.30/MMBtu above last winter's highs – currently ~ $4.60/MMBtu. Our analysis indicates prices are justifiably high, and could – with the slightest unexpected news – move sharply higher. Because natgas is, at the end of the day, a weather market, we favor low-cost/low-risk exposures. In the current market, we recommend going long 1Q22 NYMEX $5.00/MMBtu natgas calls vs short NYMEX $5.50/MMBtu natgas calls expecting even higher prices. This is the trade we recommended on 8 April 2021, at a lower level, which was stopped out on 12 August 2021 with a gain of 188%. Robert P. Ryan Chief Commodity & Energy Strategist rryan@bcaresearch.com Ashwin Shyam Research Associate Commodity & Energy Strategy ashwin.shyam@bcaresearch.com Commodities Round-Up Energy: Bullish Earlier this week, Saudi Aramco lowered its official selling price (OSP) by more than was expected – lowering its premium to the regional benchmark to $1.30/bbl from $1.70/bbl – in what media reports based on interviews with oil traders suggest is an attempt to win back customers electing not to take volumes under long-term contracts. This is a marginal adjustment by Aramco, but still significant, as it shows the company will continue to defend its market share. Pricing to Northwest Europe and the US markets is unchanged. Aramco's majority shareholder, the Kingdom of Saudi Arabia (KSA), is the putative leader of OPEC 2.0 (aka, OPEC+) along with Russia. The producer coalition is in the process of returning 400k b/d to the market every month until it has restored the 5.8mm b/d of production it took off the market to support prices during the COVID-19 pandemic. We expect Brent crude oil prices to average $70/bbl in 2H21, $73/bbl in 2022 and $80/bbl in 2023. Base Metals: Bullish Political uncertainty in Guinea caused aluminum prices to rise to more than a 10-year high this week (Chart 9). A coup in the world’s second largest exporter of bauxite – the main ore source for aluminum – began on Sunday, rattling aluminum markets. While iron ore prices rebounded primarily on the record value of Chinese imports in August, the coup in Guinea – which has the highest level of iron ore reserves – could have also raised questions about supply certainty. This will contribute to iron-ore price volatility. However, we do not believe the coup will impact the supply of commodities as much as markets are factoring, as coup leaders in commodity-exporting countries typically want to keep their source of income intact and functioning. Precious Metals: Bullish Gold settled at a one-month high last Friday, when the US Bureau of Labor Statistics released the August jobs report. The rise in payrolls data was well below analysts’ estimates, and was the lowest gain in seven months. The yellow metal rose on this news as the weak employment data eased fears about Fed tapering, and refocused markets on COVID-19 and the delta variant. Since then, however, the yellow metal has not been able to consolidate gains. After falling to a more than one-month low on Friday, the US dollar rose on Tuesday, weighing on gold prices (Chart 10). Chart 9
Aluminum Prices Recovering
Aluminum Prices Recovering
Chart 10
Weaker USD Supports Gold
Weaker USD Supports Gold
Footnotes 1 Please see the US Climate Prediction Center's ENSO: Recent Evolution, Current Status and Predictions report published on September 6, 2021. 2 Please see Asia LNG Price Spike: Perfect Storm or Structural Failure? Published by Oxford Institute for Energy Studies. 3 Since China LNG import data were reported as a combined January and February value in 2020, we halved the combined value to get the January 2020 amount. 4 Please see The 2020/21 Extremely Cold Winter in China Influenced by the Synergistic Effect of La Niña and Warm Arctic by Zheng, F., and Coauthors (2021), published in Advances in Atmospheric Sciences. 5 Please see the IEA's Gas Market Report, Q2-2021 published in April 2021. 6 Please see Global gas outlook to 2050 | McKinsey on February 26, 2021. 7 Please see ICIS Analyst View: Gazprom’s inability to supply or unwillingness to deliver? published on August 13, 2021. Investment Views and Themes Recommendations Strategic Recommendations Tactical Trades Commodity Prices and Plays Reference Table Trades Closed in 2021 Summary of Closed Trades
The Reserve Bank of Australia maintained its benchmark cash rate target unchanged at 0.1% at its meeting on Tuesday. Instead, the central bank announced a reduction in the pace of its asset purchases to AUD 4 billion a week from the previous AUD 5 billion. …
Highlights A lot of pessimism is embedded in the Aussie dollar, making it a potent candidate for a powerful mean-reversion rally. The key catalyst will be a reversal in COVID-19 infection rates which are holding the Aussie economy hostage. Marginally, there is good news on that front. On a terms-of-trade basis, the Australian dollar is very cheap. Falling commodity prices are a handicap, but the valuation margin of safety makes the AUD a safer bet on a reflationary theme. At the crosses, we are already long AUD/NZD, but AUD/JPY and AUD/CHF should be winners in the next six-to-nine months. Feature The Australian economy was on a strong recovery path before a resurgence in Covid-19 infections handicapped this improvement. Australian GDP recovered to pre-pandemic levels in Q1 and the latest Q2 release suggests the Australian economy was on the path to achieve escape velocity (Chart I-1). Chart I-1The Aussie Economy Has Recovered
Is The Australian Dollar A Buy?
Is The Australian Dollar A Buy?
The bounce in the Australian dollar has mirrored the improvement in the economy. From a low of 55 cents in early 2020, the Aussie rose over 40% to a high of 80 cents in earlier this year. However, more recently, there has been a strong correction in the AUD, reflecting both domestic and global concerns about growth. The key question for investors is whether the decline in the Aussie represents an excessive move or heralds a more malignant outcome for the currency. In our view, if risk sentiment stays ebullient, then the Australian dollar will be a potent candidate for a coiled-spring rebound. However, on the downside, there has already been a lot of bad news priced into the Aussie, making the reward/risk picture more favorable (Chart I-2). The Delta Variant The Delta variant of Covid-19 is ravaging across most countries, and the Australian economy has been particularly susceptible. While in absolute terms, Australia’s infection rates are faring better than most developed markets, the momentum of the latest wave has knocked down a nascent boom in Aussie economic conditions (Chart I-3). Chart I-2The Aussie And Global Stocks Have Diverged
The Aussie And Global Stocks Have Diverged
The Aussie And Global Stocks Have Diverged
Chart I-3The Delta Variant Is Ravaging Australia
The Delta Variant Is Ravaging Australia
The Delta Variant Is Ravaging Australia
Sydney is now entering its third month of lockdown, and the state of Victoria has just extended mobility restrictions for another three weeks. However, the population is getting vaccinated quickly, with almost 40% having received two jabs. Should the current trajectory of vaccinations continue, Australia could fully lift restrictions on its citizens by the fourth quarter. It is noteworthy that Australia has been here before, and during the last two waves in March and August of last year, the country was able to weather the storm with lower vaccination rates. As such, the latest wave should prove transient, allowing economic conditions to normalize after a weak Q3. AUD And The Global Cycle As a premier commodity producer, the Australian economy is intricately linked to the global economic cycle, especially what happens in China. Chart I-4 shows that both the Caixin and National Bureau of Statistics manufacturing PMIs in China lead Australian manufacturing activity. With the majority of Australian exports going to China, it makes the Aussie economy very sensitive to Chinese domestic conditions. Our China Investment Strategy colleagues believe that fiscal policy will be eased going forward, while the tightening in monetary conditions is past its peak, especially in the face of Covid-19 and floods ravaging China. Chinese bond yields have already dropped, reflecting an easing in domestic financial conditions. With the Chinese bond market becoming more and more liberalized, it is becoming a good proxy for monetary conditions in China. As such, the trend in bond yields has tended to lead Chinese imports. This suggests that Aussie exports should remain robust in the coming months (Chart I-5). Chart I-4How Long Will The China Slowdown Last?
How Long Will The China Slowdown Last?
How Long Will The China Slowdown Last?
Chart I-5Easing Financial Conditions In China
Easing Financial Conditions In China
Easing Financial Conditions In China
Chart I-6Chinese Policy And The AUD
Chinese Policy And The AUD
Chinese Policy And The AUD
A similar pattern to March of last year might be repeated this year, should Covid-19 fears remain persistent. China led the pack vis-à-vis other countries by injecting stimulus much earlier on, which helped ease domestic financial conditions. As a result, imports of key raw materials such as copper, iron ore, steel, and crude oil rose higher, helping Australian export volumes. This time around, excess money supply in China is rebounding from extremely depressed levels. While the near-term trajectory suggests some more volatility for the Aussie, the cyclical outlook is improving (Chart I-6). A Terms-Of-Trade Boom Despite a slowing Chinese economy, commodity prices remain resilient. Australian terms-of-trade have outperformed that of other commodity-producing nations (Chart I-7). Australia is relatively competitive in supplying the types of raw materials that China needs and wants. For example, Australian exporters produce higher-grade ore, which is more expensive, pollutes less, and is in high demand in China. Similarly, Australia is a big exporter of liquefied natural gas, whose prices have been soaring in recent months. Going forward, Australia’s terms-of-trade improvement is likely to continue. China’s clear energy policy shift away from coal and towards natural gas will buffet LNG export volumes. Also, given that reducing, if not outright eliminating, pollution is a long-term strategic goal in China, this will provide a multi-year tailwind for both cleaner ore and gas exports. The pattern of an improving terms-of-trade picture but deteriorating domestic fundamentals has placed the AUD in a tug-of-war scenario. One of the key primary drivers of the AUD exchange rate has been the basic balance, the sum of the current account and long-term capital flows. The basic balance is making secular highs, suggesting the AUD should be above its 2011 peak near 1.10 (Chart I-8). This suggests that room for mean reversion is substantive. Chart I-7A Boom In Aussie Terms Of Trade
A Boom In Aussie Terms Of Trade
A Boom In Aussie Terms Of Trade
Chart I-8The AUD Has Lagged Terms Of Trade
The AUD Has Lagged Terms Of Trade
The AUD Has Lagged Terms Of Trade
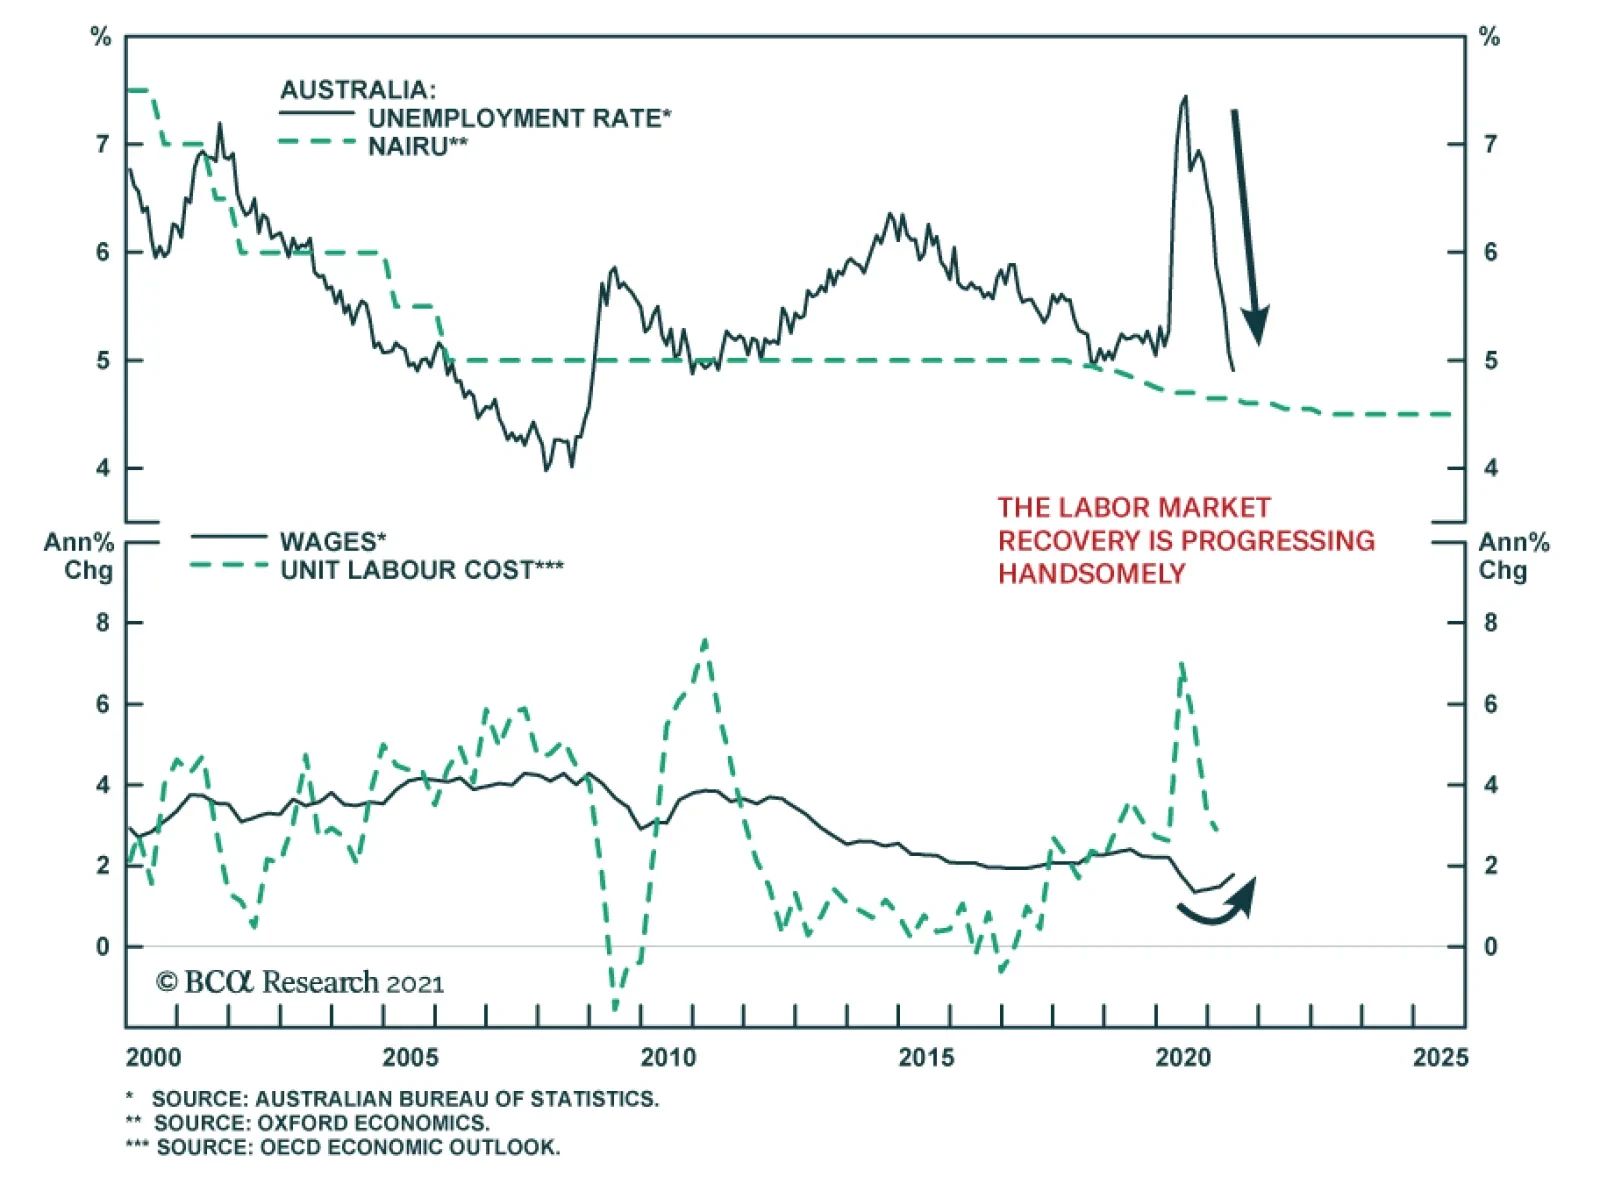
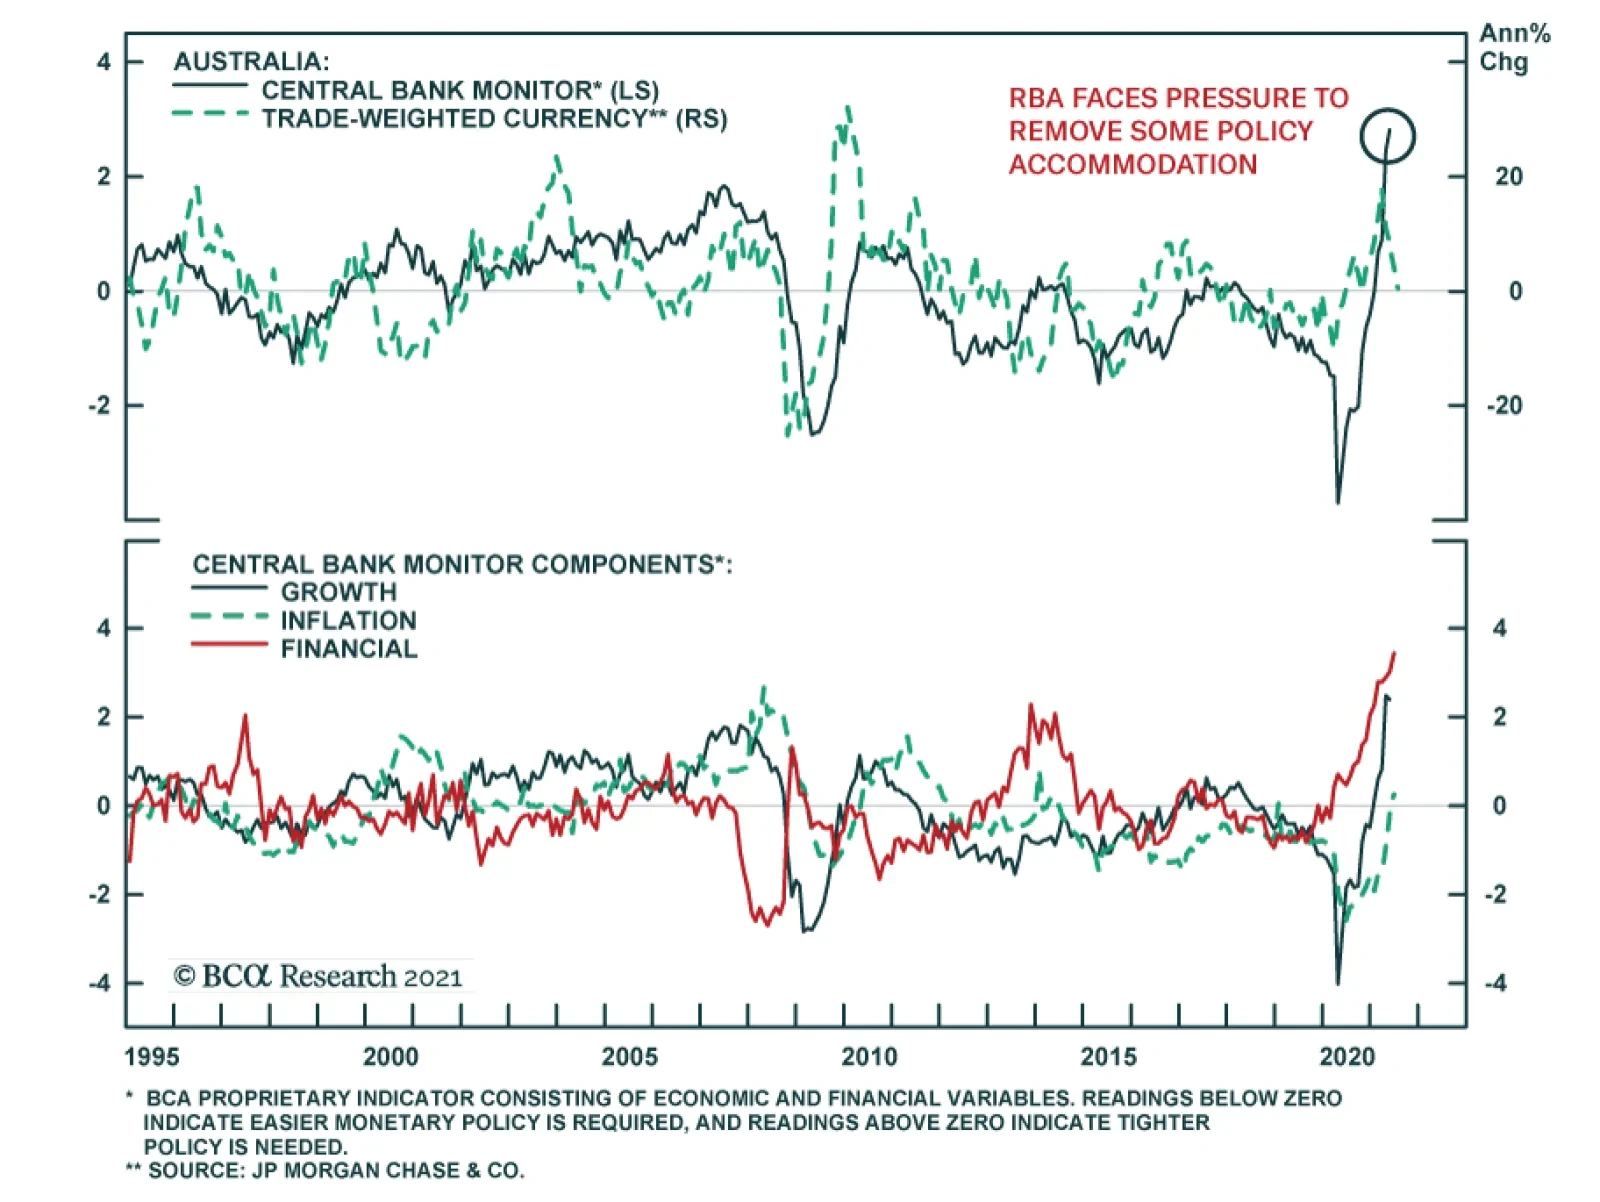
In a nutshell, Australia sports the best improvement in both trade and current account balances in the G10 over the last few years (Chart I-9). Investment in projects in the resource space are now bearing fruit, easing the external funding requirement. This has ended the 35-year-long deficit in the current account. A rising current account naturally increases the demand for the Australian dollar, which buffets the currency. Domestic Considerations And The RBA By most accounts, the Reserve Bank of Australia (RBA) has achieved its objectives. Most measures of inflation are near target, unemployment is close to NAIRU, and wages have bottomed and are marginally inflecting higher (Chart I-10). The next batch of numbers coming out of Australia will likely be weak, as the RBA will outline next week, but any weakness in the Aussie will represent a buying opportunity. Chart I-9A Record Surplus In Australias Basic Balance
A Record Surplus In Australias Basic Balance
A Record Surplus In Australias Basic Balance
Chart I-10Fundamentals In The Aussie Economy Are On The Mend
Fundamentals In The Aussie Economy Are On The Mend
Fundamentals In The Aussie Economy Are On The Mend
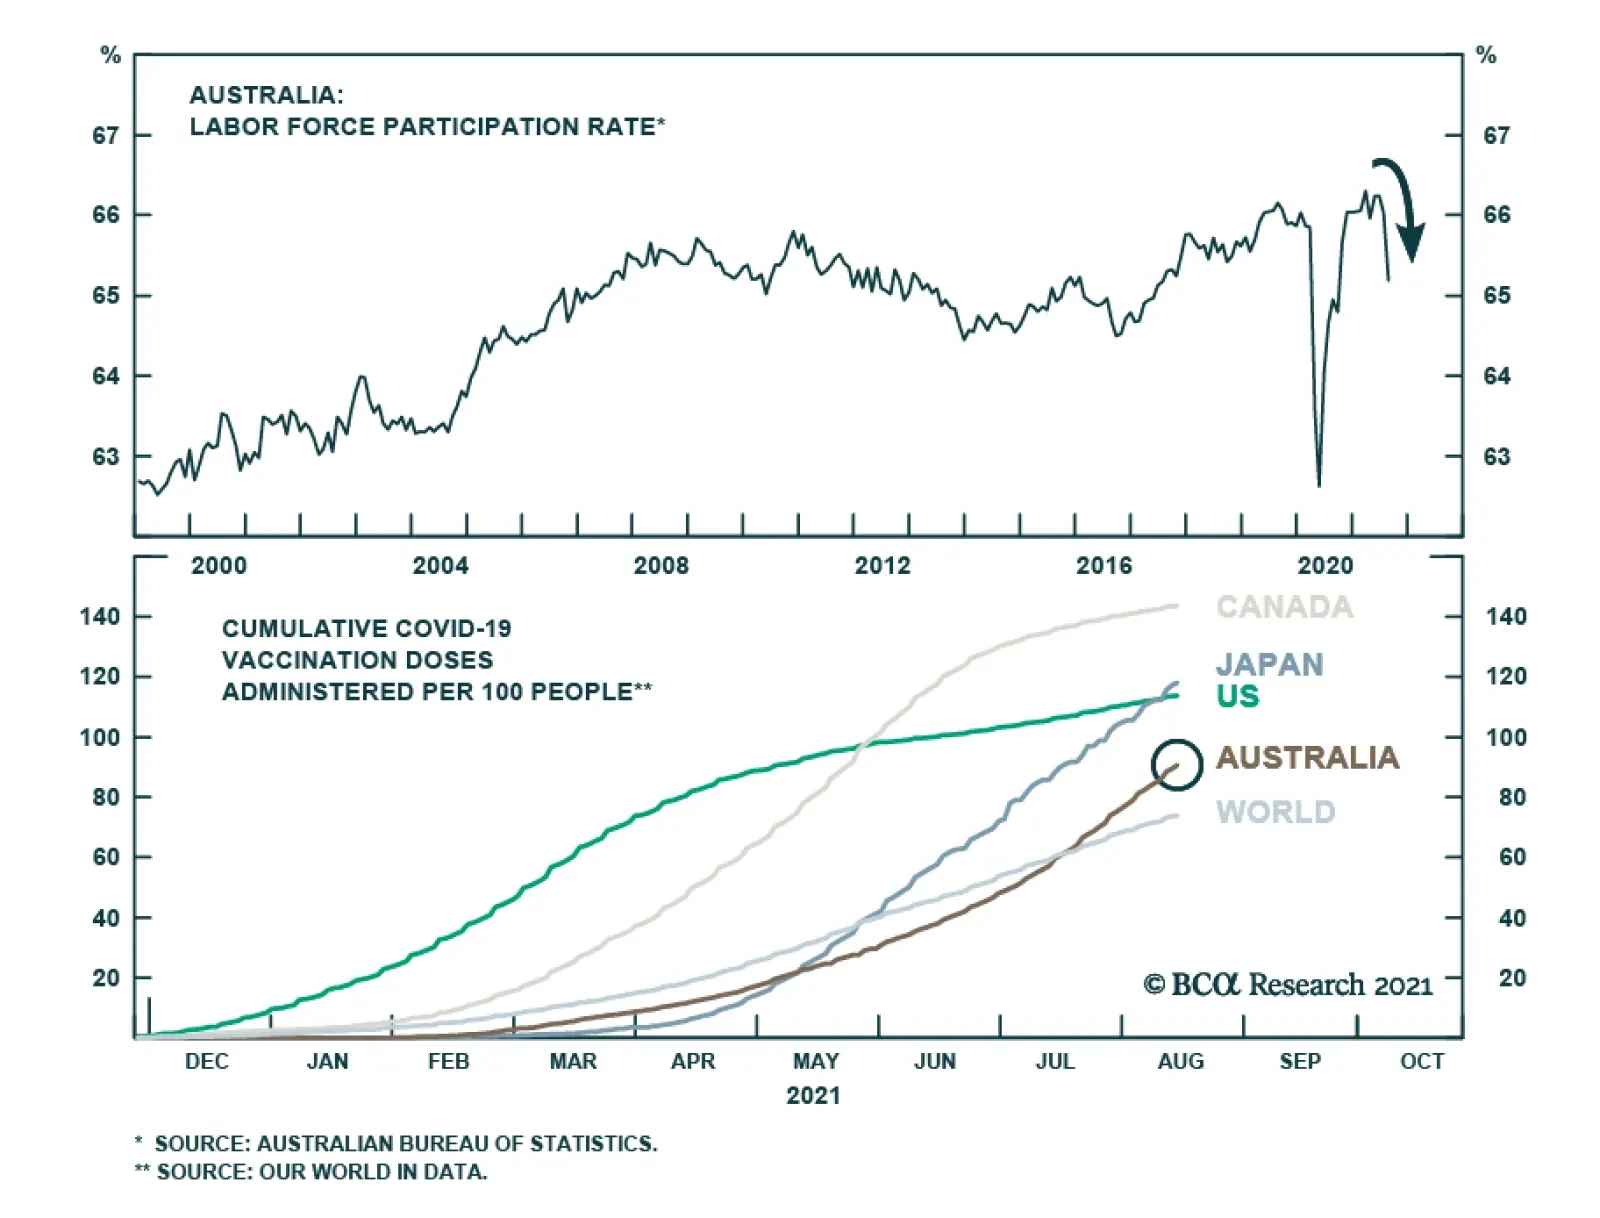
Taking a step back, the recovery in the Australian jobs market has been spectacular. Unemployment is at 4.6%, very close to NAIRU. Meanwhile, the participation rate has recovered to pre-pandemic levels as pandemic-aid schemes wear off. The Liberal-National coalition government was very proactive, especially with the “Job Seeker” and “Job Keeper” schemes, providing a valuable cushion for domestic economic conditions. With a very low government debt burden, there is obviously scope to expand the scheme further should conditions dictate. House prices are rebounding in a trajectory the RBA likes to see, driven by credit from owner-occupied housing (Chart I-11). This suggests that at least at the margin, house prices are being driven by domestic demand/supply fundamentals. The key takeaway is that relative to its commodity-currency peers, Australia is well along its house-price adjustment path, having been one of the first developed market countries to introduce macroprudential measures. This suggests that beyond the very near term, emergency policy settings are no longer appropriate for the Aussie economy. The RBA is likely to taper asset purchases from $A5 billion a week, to $A4 billion as telegraphed (Chart I-12), but there is scope for a hawkish surprise at next week’s meeting. Markets are already discounting an increasing path for interest rates starting next year, but not so relative to the US. This could change as the RBA responds to improving economic conditions. Chart I-11A Sustainable Increase In House Prices
A Sustainable Increase In House Prices
A Sustainable Increase In House Prices
Chart I-12The RBA Could Unexpectedly Change Policy Settings
The RBA Could Unexpectedly Change Policy Settings
The RBA Could Unexpectedly Change Policy Settings
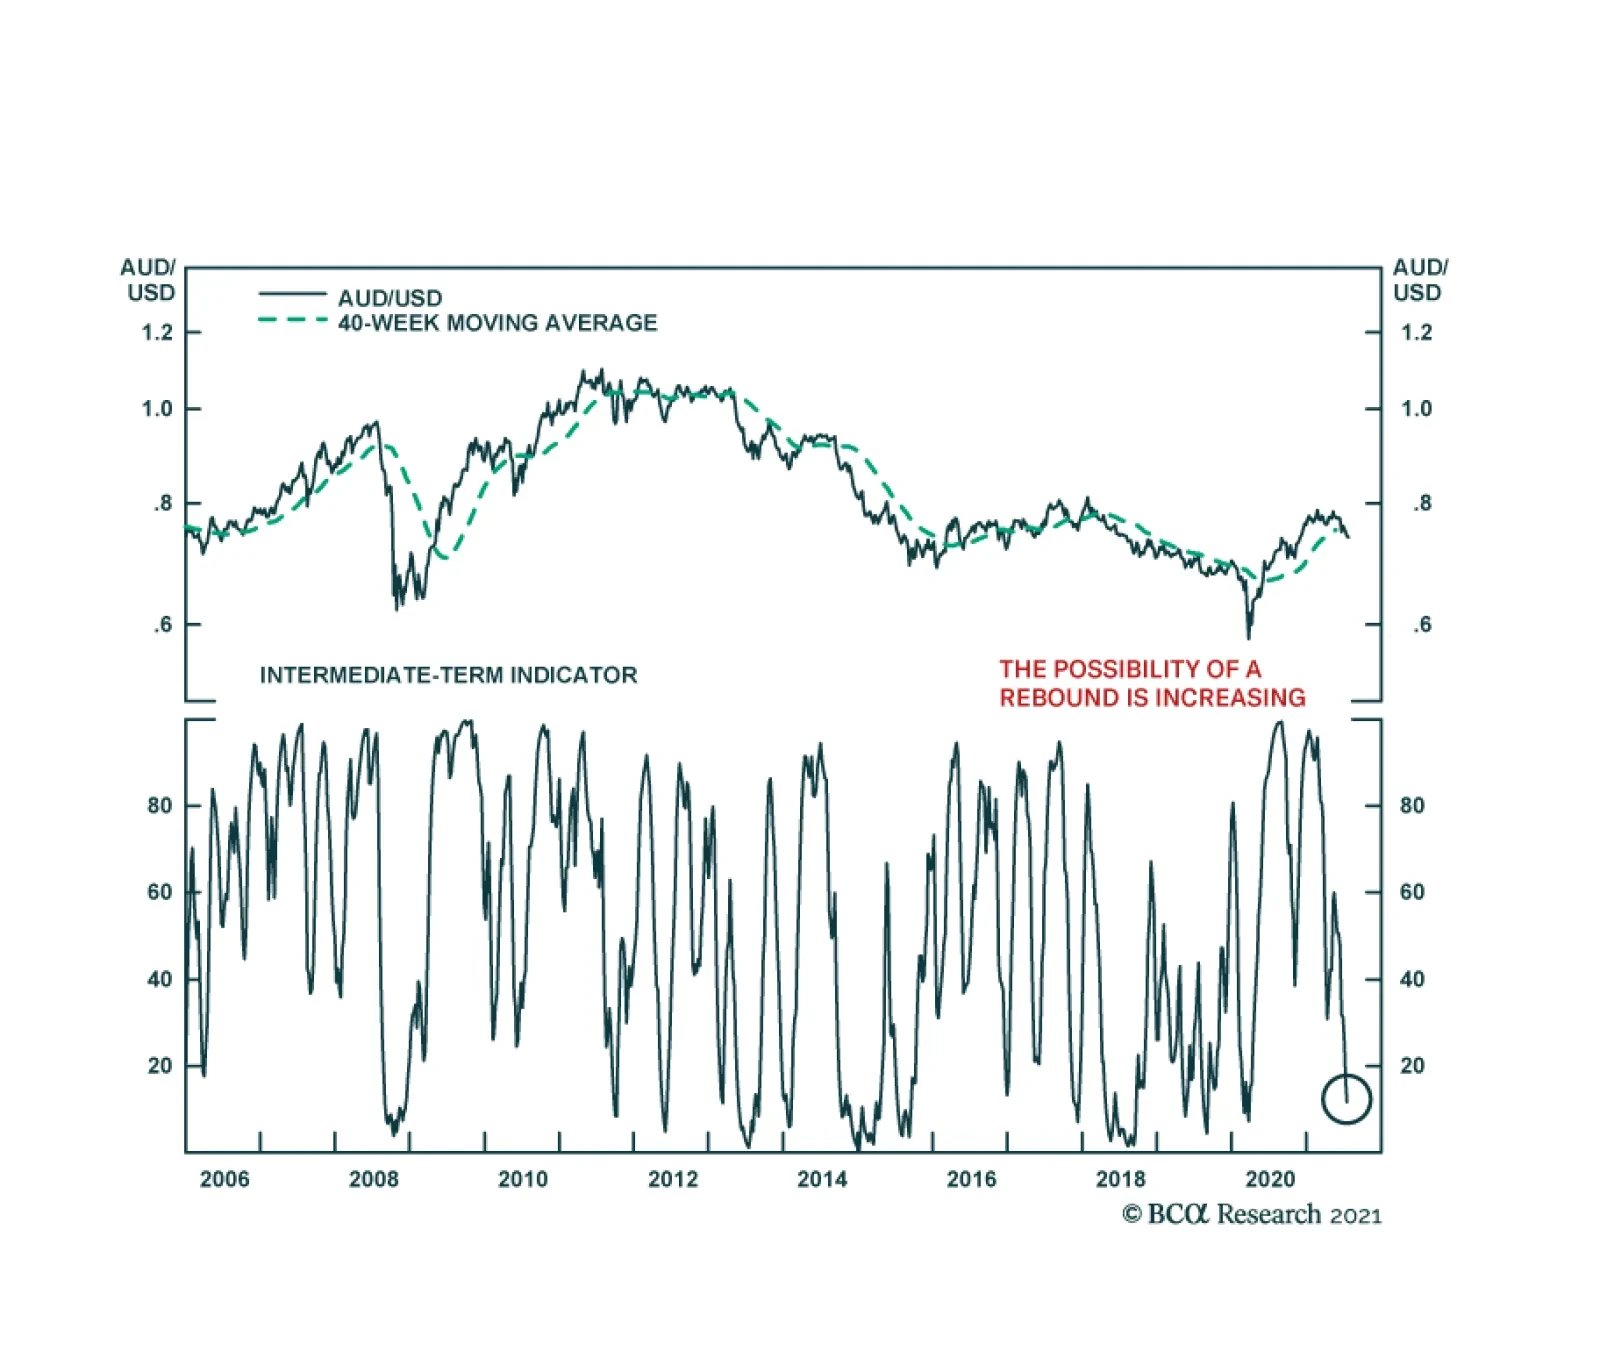
Meanwhile, real rates are already more attractive in Australia compared to the US, especially at the short end of the curve. A Valuation Cushion The cherry on the cake for the Aussie is that it is cheap according to most of our valuation measures. As we highlighted in a recent report, trading the Aussie on a valuation basis alone has added significant alpha over the last several years. One of our favorite metrics for the Australian dollar’s fair value is its real effective exchange rate relative to its terms of trade. On this basis, the Aussie dollar is cheap by about 20% (Chart I-13). Our intermediate-term timing models, published a fortnight ago, shows the Australian dollar as 9% cheap, or near one standard deviation below the mean. Our purchasing power parity (PPP) models point to a slight undervaluation in the Australian dollar. It also helps that speculators are very short the Aussie, which is bullish from a contrarian perspective (Chart I-14). Chart I-13The AUD Is Cheap
The AUD Is Cheap
The AUD Is Cheap
Chart I-14Investors Are Short The AUD
Investors Are Short The AUD
Investors Are Short The AUD
How Should Investors Position Themselves? AUD/USD will close its undervaluation gap in the medium-to-long term, as happens with most currencies. This will lift the AUD towards 85 cents. In the short term, long AUD/NZD and long AUD/JPY remain attractive bets for those not willing to take directional dollar bets. In our portfolio, we are already long AUD/NZD for the following reasons: The markets have already priced in a very hawkish RBNZ and a very dovish RBA (Chart I-15). Our bias is that as Covid-19 proves to be a global problem, there will be a renormalization in interest rate expectations. Terms of trade in Australia will continue to outperform that of New Zealand. AUD/NZD and relative terms of trade tend to move together (Chart I-16). Chart I-15AUD/NZD Remains A Buy
AUD/NZD Remains A Buy
AUD/NZD Remains A Buy
Chart I-16Terms Of Trade And AUD/NZD
Terms Of Trade And AUD/NZD
Terms Of Trade And AUD/NZD
AUD/NZD is very cheap on a historical basis. This level of valuation has provided strong support in the past (Chart I-17). Meanwhile, the Australian yield curve has steepened, albeit with some recent flattening, but banks have still underperformed the improvement in the interest rate term structure (Chart I-18). A bottoming economy will benefit banks, which make up almost 35% of the Australian MSCI index, and thus there could be renewed foreign inflows. Chart I-17AUD/NZD Is Cheap
AUD/NZD Is Cheap
AUD/NZD Is Cheap
Chart I-18Stay Long Aussie Banks
Stay Long Aussie Banks
Stay Long Aussie Banks
Chester Ntonifor Foreign Exchange Strategist chestern@bcaresearch.com Currencies U.S. Dollar Chart II-1USD Technicals 1
USD Technicals 1
USD Technicals 1
Chart II-2USD Technicals 2
USD Technicals 2
USD Technicals 2
Data out of the US this week was mixed: The payrolls report was well below expectations. Non-farm payrolls came in at 235K, versus an expected increase of 733K. Both the labor force participation rate and average hourly earnings remained steady at 61.7% and 4.3% year-on-year, respectively. The ISM report was robust for August. The manufacturing PMI improved from 59.5 to 59.9. New orders rose from 64.9 to 66.7 The PCE deflator came it at 3.6% year-on-year, in line with estimates. The US dollar DXY index fell this week. The weak payrolls report reiterates the fact that risks from tighter monetary policy in the US are overstated. This was the conclusion from the Jackson Hole meeting last week, that saw a drop in both the US dollar and bond yields. Report Links: Arbitrating Between Dollar Bulls And Bears - March 19, 2021 The Dollar Bull Case Will Soon Fade - March 5, 2021 Are Rising Bond Yields Bullish For The Dollar? - February 19, 2021 The Euro Chart II-3EUR Technicals 1
EUR Technicals 1
EUR Technicals 1
Chart II-4EUR Technicals 2
EUR Technicals 2
EUR Technicals 2
Euro area data remains robust: Core CPI came in at 1.6% year-on-year in August. Headline CPI was a more robust 3%. The final read from the Markit manufacturing PMI remained at a robust 61.4 in August. The services PMI did decline from 59.5 to 59. Retail sales increased by a robust 3.1% in July. The euro rose by almost 1% this week. Covid-19 cases seem to be rolling over in Europe while firing in other nations. This will increase support for the euro, as well as expectations the ECB could dial back monetary accommodation. Report Links: Relative Growth, The Euro, And The Loonie - April 16, 2021 The Euro Dance: One Step Back, Two Steps Forward - April 2, 2021 On Japanese Inflation And The Yen - January 29, 2021 The Yen Chart II-5JPY Technicals 1
JPY Technicals 1
JPY Technicals 1
Chart II-6JPY Technicals 2
JPY Technicals 2
JPY Technicals 2
Recent Japanese data has been on the strong side: Retail sales rose 2.4% year-on-year in July. The employment report was strong. The unemployment rate fell to 2.85 and the job-to-applicant ratio rose from 1.13 to 1.15. Housing starts rose 10% year-on-year in July. Capital spending for Q2 was 5.3% year-on-year, well above expectations. The yen was flat against the dollar this week. In an environment where global risk is ebullient, the yen tends to underperform other pro-cyclical currencies. This was very evident this week. Report Links: The Case For Japan - June 11, 2021 The Dollar Bull Case Will Soon Fade - March 5, 2021 On Japanese Inflation And The Yen - January 29, 2021 British Pound Chart II-7GBP Technicals 1
GBP Technicals 1
GBP Technicals 1
Chart II-8GBP Technicals 2
GBP Technicals 2
GBP Technicals 2
Data out of the UK this week was encouraging: The Lloyds business barometer improved from 30 to 36. Nationwide home prices rose 11% year-on-year in August. The Markit services PMI was steady at 55 in August. The pound rose by 0.6% this week. UK will continue to benefit from higher vaccination rates, compared to the rest of the G10. That said, other pro-cyclical currencies, such as the AUD, could benefit from a robust vaccination campaign, outperforming GBP. Report Links: Why Are UK Interest Rates Still So Low? - March 10, 2021 Portfolio And Model Review - February 5, 2021 Thoughts On The British Pound - December 18, 2020 Australian Dollar Chart II-9AUD Technicals 1
AUD Technicals 1
AUD Technicals 1
Chart II-10AUD Technicals 2
AUD Technicals 2
AUD Technicals 2
Australian data is slated to slow, but the recent numbers have been encouraging: Private sector credit rose 4% year-on-year in August. Q2 GDP was a robust 9.6% year-on-year. Exports rose 5% month-on-month in July. The AUD was the best-performing currency this week, rising almost 2%. We discuss the AUD at length in this week’s front section. Our bias is that the AUD will benefit from easing monetary policy in China and high commodity prices. Report Links: The Dollar Bull Case Will Soon Fade - March 5, 2021 Portfolio And Model Review - February 5, 2021 Australia: Regime Change For Bond Yields & The Currency? - January 20, 2021 New Zealand Dollar Chart II-11NZD Technicals 1
NZD Technicals 1
NZD Technicals 1
Chart II-12NZD Technicals 2
NZD Technicals 2
NZD Technicals 2
The was scant data out of New Zealand this week: Building permits rose 2.1% month-on-month in July. CoreLogic house prices are inflecting 27% year-on-year in August. ANZ Business confidence slipped from -3.8 to -14.2 in August. The NZD was up almost 2% this week. We like the NZD cyclically, but our bias is that hawkish expectations from the RBNZ could be watered down, which could make the kiwi lag other commodity currencies like the Aussie. Report Links: How High Can The Kiwi Rise? - April 30, 2021 Portfolio And Model Review - February 5, 2021 Currencies And The Value-Versus-Growth Debate - July 10, 2020 Canadian Dollar Chart II-13CAD Technicals 1
CAD Technicals 1
CAD Technicals 1
Chart II-14CAD Technicals 2
CAD Technicals 2
CAD Technicals 2
Data out of Canada this week has been weak: Q2 GDP missed expectations, falling 1.1% versus an expected increase of 2.5%. The Markit manufacturing PMI increased from 56.2 to 57.2 in August. Net trade deteriorated in July, but Canada is still booking a C$0.8bn surplus. The CAD rose by 0.7% this week. The backdrop for the loonie is positive as the Bank of Canada continues to taper asset purchases and remains on a path to increase interest rates. The upcoming election could also usher in more fiscal stimulus for Canada. Report Links: Relative Growth, The Euro, And The Loonie - April 16, 2021 Will The Canadian Recovery Lead Or Lag The Global Cycle? - February 12, 2021 The Outlook For The Canadian Dollar - October 9, 2020 Swiss Franc Chart II-15CHF Technicals 1
CHF Technicals 1
CHF Technicals 1
Chart II-16CHF Technicals 2
CHF Technicals 2
CHF Technicals 2
The data out of Switzerland this week was weak: The KOF indicator declined from 129.8 to 113.5 in August. This was well below expectations. CPI in August was slightly above expectations at 0.4% year-on-year for the core and 0.9% for headline. GDP for Q2 was in line with expectations, at 1.8% quarter-on-quarter. The Swiss franc was flat this week. The franc will continue to benefit from rolling bouts of volatility, but at the margin, it will lag the bounce in other currencies as global risk sentiment stays ebullient. Report Links: An Update On The Swiss Franc - April 9, 2021 Portfolio And Model Review - February 5, 2021 The Dollar Conundrum And Protection - November 6, 2020 Norwegian Krone Chart II-17NOK Technicals 1
NOK Technicals 1
NOK Technicals 1
Chart II-18NOK Technicals 2
NOK Technicals 2
NOK Technicals 2
Data out of Norway this week was positive: Credit growth improved 5.3% year-on-year in July The current account balance was a healthy NOK 93.2bn in June. The unemployment rate fell from 3.1% to 2.7%. The NOK was up around 1% this week. We are long Scandinavian currencies on a bet that the dollar will fall cyclically. Meanwhile, the Norges Bank has signaled they will increase interest rates ahead of both the Federal Reserve and the ECB. This will benefit real rates in Norway. Report Links: The Norwegian Method - June 4, 2021 Portfolio And Model Review - February 5, 2021 Revisiting Our High-Conviction Trades - September 11, 2020 Swedish Krona Chart II-19SEK Technicals 1
SEK Technicals 1
SEK Technicals 1
Chart II-20SEK Technicals 2
SEK Technicals 2
SEK Technicals 2
Recent data from Sweden have been improving: The Swedbank manufacturing and services PMI remained robust in August at 60.1 and 64.7 respectively. The August current account balance showed a healthy surplus of SEK 80.3 billion. The economic tendency survey for August came in at 121.1 from 119.8. Consumer confidence rose from 106.5 to 108.6 in August. The SEK was up almost 1% this week. There are many signs the Swedish economy is improving. This is paring back expectations of more stimulus from the Riksbank. We are short both EUR/SEK and USD/SEK as reflation plays. Report Links: Revisiting Our High-Conviction Trades - September 11, 2020 More On Competitive Devaluations, The CAD And The SEK - May 1, 2020 Sweden Beyond The Pandemic: Poised To Re-leverage - March 19, 2020 Trades & Forecasts Forecast Summary Core Portfolio Tactical Trades Limit Orders Closed Trades Footnotes
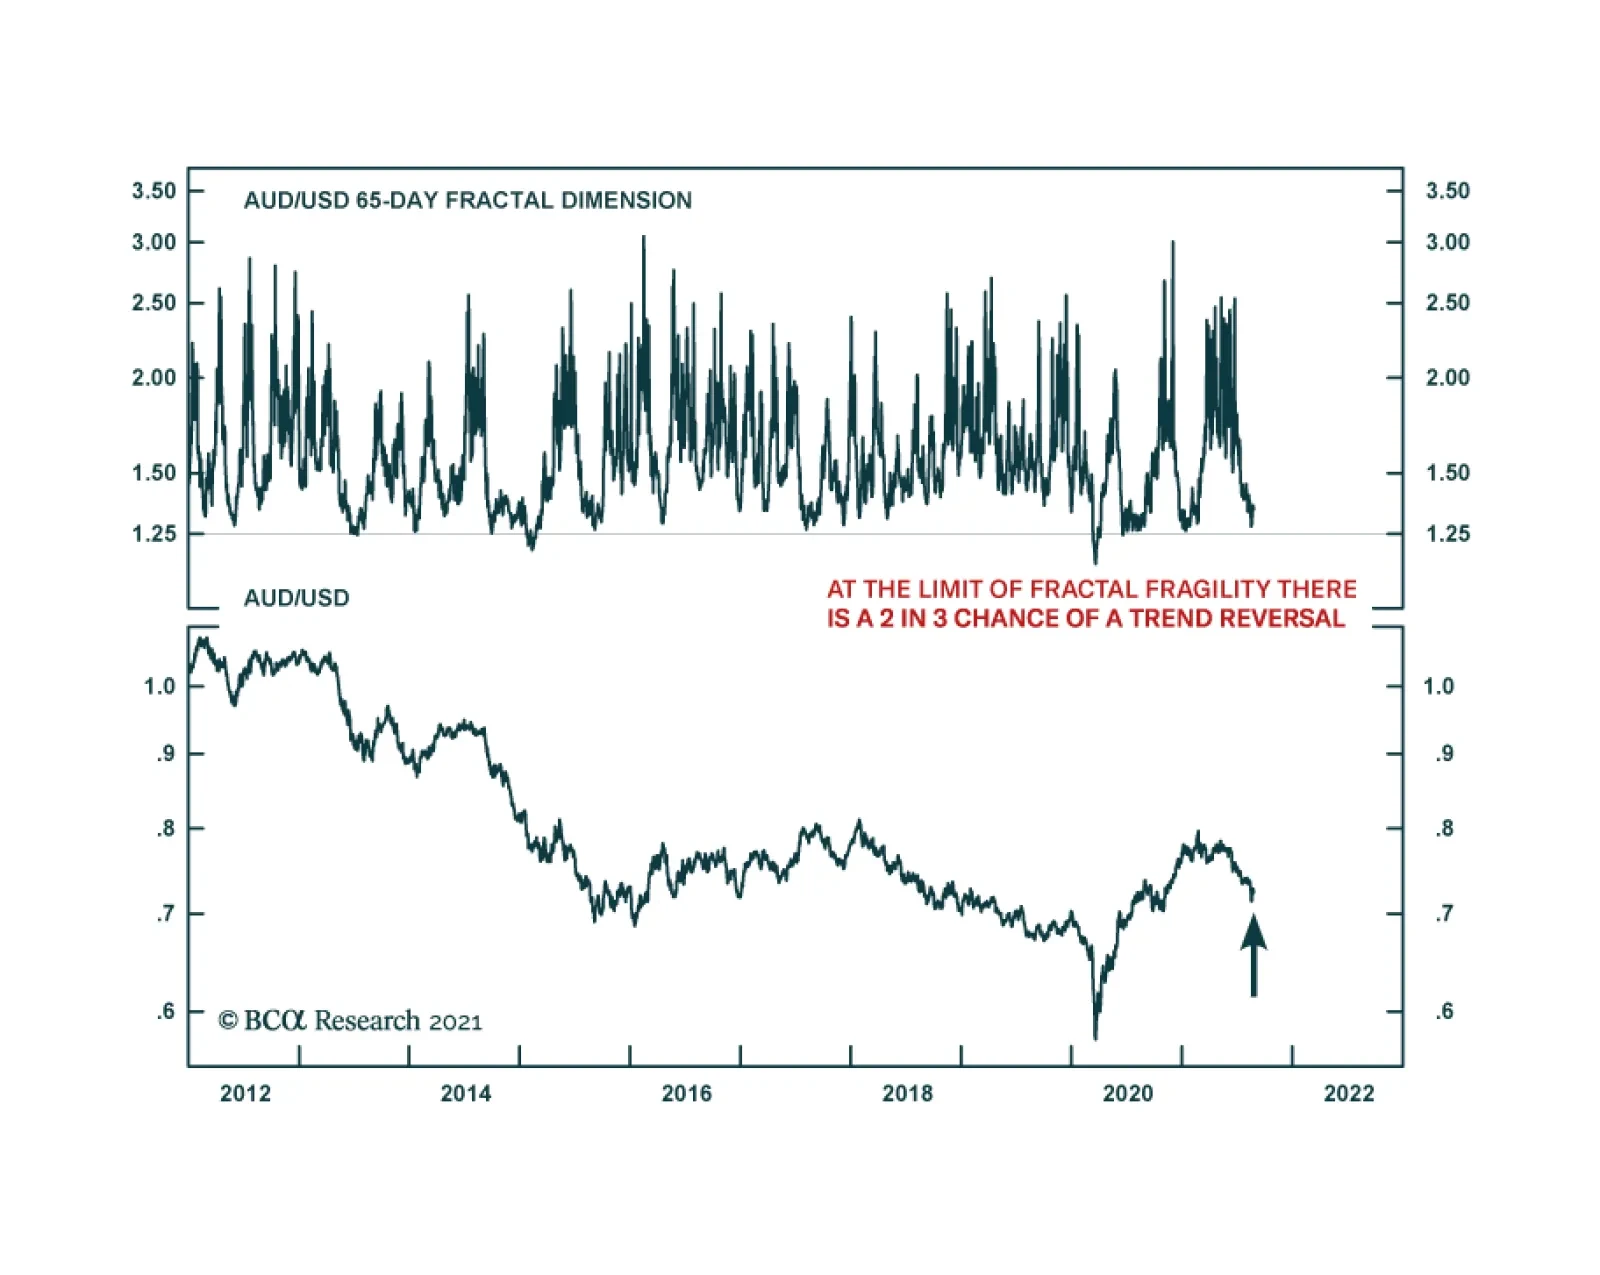
BCA Research's 65-day fractal dimension is signalling a near term counter-trend reversal in the Australian dollar versus the US dollar. When an asset's fractal dimension breaches its natural lower bound, the fractal indicator signals a coalescence of…
The 0.3 percentage point decline in Australia’s unemployment rate to a 12-year low of 4.6% in July came as a surprise to expectations it would tick up to 5.0%. The Delta wave of COVID-19 infections has been extremely destructive in Australia, where less than…
On Tuesday, the RBA announced that it will stick to its plan to reduce the pace of its weekly asset purchases from AUD 5 billion to AUD 4 billion starting in September. Moreover, the possibility of another taper in November is also still on the table. The…
Highlights The dollar is fighting a tug of war between two diverging forces: an economic slowdown around the world but plunging real interest rates in the US. The litmus test for determining which force will gain the upper hand is if the DXY fails to break above the 93-94 level that marked the March highs. So far that appears to be the case. In the interim, investors can capitalize on a few themes that will ultimately unfold: an end to the China slowdown, a bet on real rates staying low for longer, and a play on the Olympics. The expressions of these themes are long AUD/MXN, long silver and long the yen, respectively. Natural disasters are also rising in frequency globally. Historically, this has coincided with rising currency volatility. Long CHF/NZD positions can be a potent play on this trend. We ultimately expect the dollar lower 9-12 months from now. The best currencies to express this view today are NOK and SEK. Feature We are a month into the second half of year, and it is instructive to revisit the dollar view and our roadmap towards year-end. As a starting point, two key themes are propping the dollar on a tactical basis: The first is a global economic slowdown, one that could be exacerbated by increased infections of the COVID-19 Delta variant. The dollar tends to rise in an environment where global growth is weak. This is especially the case when US growth is relatively resilient, like now (Chart I-1). The second is the resilience of the US equity market, not only due to superior earnings, but also as regulatory crackdowns hit shares in China specifically, and emerging markets in general. Equity inflows into the US were a key reason the dollar did not collapse in 2020. Renewed inflows into US equities will be particularly beneficial for the dollar (Chart I-2). This will especially be the case if technology and healthcare earnings keep surprising to the upside. Chart I-1The Dollar And Relative Economic Momentum
The Dollar And Relative Economic Momentum
The Dollar And Relative Economic Momentum
Chart I-2The US Is Leading The Earnings ##br##Cycle
The US Is Leading The Earnings Cycle
The US Is Leading The Earnings Cycle
At the same time, real interest rates in the US are very depressed. In its latest meeting, the Federal Reserve reiterated that it will keep running the economy hot, a thesis central to our bearish dollar view. This puts the dollar in a tug of war between two diverging forces: an economic slowdown around the world but plunging real interest rates in the US. Arbitrating The Tug Of War Historically, unless the world economy experiences a recession, the interest rate story has dominated currency market action. Our report last week showed that real interest rates matter for currencies both short term and longer term. Given our bias that global growth will moderate rather than contract, the future path of interest rates will once again become important for currency market action. In this light, lower real rates are negative for the US dollar. How long the outperformance of US equities will last is a tougher call. What we do know is that in a rising interest rate environment, the US equity market has tended to derate relative to the rest of the world. Our base case is that bond yields will be higher globally on a cyclical horizon, suggesting investors should fade the current outperformance of US equities. Scandinavian Currencies As A Strategic Dollar Play The best currencies to express a cyclically lower dollar are the NOK and SEK, for a few reasons other than the strong correlation with the DXY index (Chart I-3): Chart I-3NOK And SEK Are A Play On DXY
NOK and SEK Are A Play On DXY
NOK and SEK Are A Play On DXY
Economic momentum in both Norway and Sweden is picking up steam. In Norway, high oil prices will be a cyclical boost to the currency, as has been the case historically. Meanwhile, Sweden is benefiting from a strong manufacturing landscape, especially in autos where pricing has skyrocketed due to shortages. While the Swedish manufacturing PMI has moderated recently, it still sits at 65.8, the highest level since the mid-1990s. Both currencies remain very cheap according to our models. Our favored PPP model shows that NOK and SEK are trading at a discount of 20% and 17% respectively, amongst the cheapest in the G10 (Chart I-4). Chart I-4The Dollar Is Expensive
Trade Themes Into Year End
Trade Themes Into Year End
Norway, Sweden and Canada are among the countries whose output gaps are expected to close relatively fast (Chart I-5). In the case of Norway (and Canada), the central bank has been vocal about curtailing monetary accommodation, as market conditions improve. The upside surprise in Swedish GDP this week lowers the odds of more monetary accommodation from the Riksbank. This will boost real rates in these countries, supporting their currencies. Chart I-5Output Gaps Across The G10
Trade Themes Into Year End
Trade Themes Into Year End
In a nutshell, if the dollar heads lower 9-12 months from now, this will benefit most procyclical currencies, with the NOK and SEK as winners. The Yen As An Olympian Chart I-6Currencies And The Olympics
Trade Themes Into Year End
Trade Themes Into Year End
We made the case last month that the yen was the most underappreciated G10 currency, and that certainly remains true. Since then, there has been improvement in the Japanese economy: The vaccination campaign is progressing smoothly, with 27% of the population having been inoculated from almost nil earlier this year. Meanwhile, about 38% have received at least one dose. This should curtail hospitalizations, despite the increase in new cases. Economic momentum remains tepid, but there are green shoots. Real cash earnings are inflecting higher, which is boosting household spending. There was also remarkable improvement in the Eco Watchers Survey, a sign of optimism among small and medium-sized businesses. Global trade remains strong, which is a boost to the Japanese external sector. While this may slow going forward, it will be a benign headwind. Japan is less exposed to China, a key market for exports, compared to its developed market peers like Australia and New Zealand. Meanwhile, China is already easing policy at the margin. The true catalyst for the yen could be the Olympics. Since the 1970s, the median performance of a currency hosting the Olympics is 4% over a year. The performance of the yen today falls well below the 25th percentile of this performance gap (Chart I-6). This year’s games have obviously been unique given the pandemic but given that the yen is the most shorted G10 currency, this is probably already in the price. It also it does raise the prospect that the yen rises from being an underdog to staging a powerful mean reversion rally. While Japan will not get a tourism boost this summer that will buffet discretionary spending, foreigners are likely to return as the pandemic is put behind us. It is remarkable that Japanese shares, even construction and material companies, that should have benefited from the leadup to the Olympics, have massively underperformed (Chart I-7). This suggests that at the margin, many investors have folded hands and sold Japanese equities indiscriminately. Chart I-7Japanese Shares Have Underperformed
Japanese Shares Have Underperformed
Japanese Shares Have Underperformed
Finally, real rates in Japan are among the highest in the G10. This will not only prevent Japanese concerns from deploying yen cash on foreign paper, but could also lead to some repatriation of funds, boosting the yen. Low Real Rates: Buy Silver (And Platinum) The case for buying silver has become compelling, at least on a tactical basis. First, the runup in prices from under $12/oz in March to almost $30/oz in August ushered silver into a well-defined wedge formation, with a series of higher lows. We are now sitting close to the lower bound of this wedge. Given our expectation that any DXY rally will be capped at 93-94, this puts a solid floor under silver prices around the $22-$23/oz level (Chart I-8). This makes for an attractive risk/reward since silver could overtake its 2011 highs near $50/oz, once strong resistance at $30/oz is breached. Second, similar to gold, silver benefits from low interest rates, plentiful liquidity, and the incentive for fiat money debasement. But unlike gold or even cryptocurrencies, physical use for silver is quite elevated. Silver fabrication demand benefits from electronic production (whereby there is a shortage, so it is bound to eventually increase), as well as new green industries such as solar power that are dominating the manufacturing landscape (Chart I-9). Meanwhile, our Commodity & Energy Strategists have flagged that the surplus of silver is expected to shrink significantly this year, driven by both industrial and investment demand (Chart I-10). Chart I-8Buy Some Silver
Buy Some Silver
Buy Some Silver
Chart I-9Silver Demand Is Picking Up
Trade Themes Into Year End
Trade Themes Into Year End
Chart I-10The Silver Surplus Is Shrinking
Trade Themes Into Year End
Trade Themes Into Year End
Third, silver is also a more potent play on a lower dollar. This is because the silver market is thinner and more volatile, with futures open interest at about one-third that of gold. Put another way, volatility in silver has always been historically higher than gold, which is why silver tends to outperform gold when the dollar is falling (Chart I-11). Chart I-11Silver Is A More Potent Play On The Dollar
Silver Is A More Potent Play On The Dollar
Silver Is A More Potent Play On The Dollar
It is worth pointing out that the velocity of money between the US and China is slowing again, suggesting growth is likely to start outperforming outside the US, beyond the current slowdown. The US benefits less from a pickup in Chinese growth, compared to other countries. This has generally pushed the dollar lower and set fire under the silver/gold ratio (Chart I-12). Finally, there is also a case to be made for platinum. It has lagged both gold and palladium prices (Chart I-13). Meanwhile, breakthroughs are being made in substituting palladium for platinum in gasoline catalytic converters. Chart I-12Money Velocity And The GSR
Money Velocity And The GSR
Money Velocity And The GSR
Chart I-13Platinum And Silver Have Lagged Gold
Platinum And Silver Have Lagged Gold
Platinum And Silver Have Lagged Gold
China Slowdown Almost Over: Buy AUD/MXN Soon We highlighted in February that a tactical opportunity had opened to go short the AUD/MXN cross. With the cross down 11% from its recent highs, an opportunity to go long will soon open up. China has started easing policy at the margin. The AUD/MXN cross correlates quite strongly with the Chinese credit cycle, as Australia is economically tied to China while Mexico depends more on the US (Chart I-14). The Australian PMI has remained quite firm, despite a slowdown in the Chinese credit impulse. Strong commodity prices have been a factor, but it also points to endogenous strength in the Aussie economy. Relative terms of trade favor the Aussie. We had expected terms of trade between Australia and Mexico to relapse on the basis of destocking in China, but that has not been the case (Chart I-15). With oil prices structurally challenged by EVs, while metal prices benefit from the buildout of green infrastructure, terms of trade will remain favorable for the cross longer term. Australian stocks have been underperforming the more defensive Mexican bourse (Chart I-16). This should reverse as cyclicals start to regain the upper hand. Chart I-14AUD/MXN Tracks Chinese Credit
AUD/MXN Tracks Chinese Credit
AUD/MXN Tracks Chinese Credit
Chart I-15AUD/MXN And Terms Of Trade
AUD/MXN And Terms Of Trade
AUD/MXN And Terms Of Trade
Chart I-16AUD/MXN And Relative Equity Prices
AUD/MXN And Relative Equity Prices
AUD/MXN And Relative Equity Prices
The timing for a long position is tricky as Chinese economic activity is likely to slow in the coming months, and cyclical equities could remain under pressure. Meanwhile, as value investors, we are also uncomfortable with AUD/MXN valuations. This suggests that in the very near term, short positions still make sense. That said, the 13-14 zone should provide formidable support to go long, an opportunity likely to unfold in the next 3 months (Chart 17). Chart I-17AUD/MXN And Momentum
AUD/MXN And Momentum
AUD/MXN And Momentum
A Final Thought On Rising Catastrophes We have been watching with obvious trepidation the rising incidence of catastrophes globally. The occurrence of weather events such as droughts, floods, storms, cyclones, and wildfires has been skyrocketing (Chart I-18). Chart I-18Disasters And Volatility
Trade Themes Into Year End
Trade Themes Into Year End
The direct play is to buy global construction and machinery stocks that are likely to benefit from increased reconstruction activity. It also favors agricultural futures. As for currency markets, the one observation is rising volatility with the VIX having spiked significantly in the years with numerous weather events. We are already long CHF/NZD and the yen as a play on rising currency volatility, and we will be exploring this thesis more deeply in future publications. Chester Ntonifor Foreign Exchange Strategist chestern@bcaresearch.com Currencies U.S. Dollar Chart II-1USD Technicals 1
USD Technicals 1
USD Technicals 1
Chart II-2USD Technicals 2
USD Technicals 2
USD Technicals 2
Data out of the US this week was relatively robust: The Markit manufacturing PMI for July edged up from 62.1 to 63.1. That said, the services PMI fell from 64.6 to 59.8. Durable goods orders were rather weak, rising 0.8% year on year in June, versus a consensus of a 2.2% increase. Admittedly, the core non-defense measure, excluding aircraft and parts, rose by 0.5% from 0.1%. Consumer confidence remains resilient, rising from 127.3 to 129.1 in July, well above expectations. Q2 GDP came in at 6.5% quarter on quarter, versus an 8.4% consensus. The US dollar DXY index fell this week. The Fed meeting highlighted that the authorities are in no rush to tighten monetary policy, despite what has been a robust recovery in labor market conditions and inflation. The aftermath of the meeting saw a drop in US real yields and the dollar. The Fed’s dovish stance has been a central theme to our bearish dollar view. Report Links: Arbitrating Between Dollar Bulls And Bears - March 19, 2021 The Dollar Bull Case Will Soon Fade - March 5, 2021 Are Rising Bond Yields Bullish For The Dollar? - February 19, 2021 The Euro Chart II-3EUR Technicals 1
EUR Technicals 1
EUR Technicals 1
Chart II-4EUR Technicals 2
EUR Technicals 2
EUR Technicals 2
Data out of the eurozone this week softened: The manufacturing PMI fell to 62.6 in July from 63.4. The services PMI surprisingly improved, rising from 58.3 to 60.4 in July. Economic confidence rose from 117.9 to 119 in July. The German IFO survey was below consensus in July, but the expectations component did rise from 99.6 to 100.4. The euro rose by 1% this week. We went long the euro at 1.18 on expectations that at the margin, monetary policy in the euro area will shift in a more hawkish fashion. Since then, the ECB has adopted a symmetric inflation target, promising to keep interest rates low for longer. The euro’s indifference to this dovish development suggests a strong floor under the currency, and upside should euro area growth beat consensus. Report Links: Relative Growth, The Euro, And The Loonie - April 16, 2021 The Euro Dance: One Step Back, Two Steps Forward - April 2, 2021 On Japanese Inflation And The Yen - January 29, 2021 The Japanese Yen Chart II-5JPY Technicals 1
JPY Technicals 1
JPY Technicals 1
Chart II-6JPY Technicals 2
JPY Technicals 2
JPY Technicals 2
Japanese data was rather mixed this week: The Jibun manufacturing PMI eased slightly in July, to 52.2 from 52.4. The services component also fell to 46.4. Department store sales came in at 3.7% year on year in June. We highlighted last week that supermarket sales also remain strong. The yen was up 0.4% against the dollar this week. In the history of the Olympics, the incumbent currency has tended to rise over the course of the year. Given the yen is the most shorted developed-market currency currently, this sets it up for a coiled spring rebound. Report Links: The Case For Japan - June 11, 2021 The Dollar Bull Case Will Soon Fade - March 5, 2021 On Japanese Inflation And The Yen - January 29, 2021 British Pound Chart II-7GBP Technicals 1
GBP Technicals 1
GBP Technicals 1
Chart II-8GBP Technicals 2
GBP Technicals 2
GBP Technicals 2
There were some mixed data out of the UK this week: Retail sales in the UK were in line with expectations. The measure excluding automobiles and fuel rose by 7.4% year on year in June. The PMIs generally slowed from very strong levels. The manufacturing print for July was 60.4, while the services component came in at 57.8. House price inflation remains strong, with the nationwide measure coming in at 10.5% year on year in July. Mortgage approvals fell slightly in June but remain at a robust 81.3K. The pound rose by 1.5% this week. The big surprise in the UK has been a reversal in the COVID-19 infection rate, despite an economy that is reopening quite briskly. This sets cable up for a volatile few weeks and months, given a poor technical picture (speculations are cutting long positions from very aggressive levels). We like GBP long term but will stand aside for now. Report Links: Why Are UK Interest Rates Still So Low? - March 10, 2021 Portfolio And Model Review - February 5, 2021 Thoughts On The British Pound - December 18, 2020 Australian Dollar Chart II-9AUD Technicals 1
AUD Technicals 1
AUD Technicals 1
Chart II-10AUD Technicals 2
AUD Technicals 2
AUD Technicals 2
The inflation report in Australia was in line with expectations for Q2: Headline CPI rose from 1.1% to 3.8%. The trimmed mean and median measure came in at 1.6% and 1.7% respectively. The AUD was flat this week, the worst performing G10 currency. The dominant story remains the renewed restrictions from a resurgence in COVID-19, particularly in Sydney. That said, weakness in AUD is starting to create an attractive reward/risk profile. Speculators are net short the Australian dollar, and our bias is that there has been spillover pressure from the recent turmoil in Asian/Chinese markets. In the end, this only makes for a coiled spring rebound in the AUD. Report Links: The Dollar Bull Case Will Soon Fade - March 5, 2021 Portfolio And Model Review - February 5, 2021 Australia: Regime Change For Bond Yields & The Currency? - January 20, 2021 New Zealand Dollar Chart II-11NZD Technicals 1
NZD Technicals 1
NZD Technicals 1
Chart II-12NZD Technicals 2
NZD Technicals 2
NZD Technicals 2
The was scant data out of New Zealand this week: The trade balance came in at NZ$261 million, even with stronger imports in June. The ANZ activity outlook index fell in July, to 26.3 from 31.6. The NZD was up 0.5% this week. The strong rally in NZD after a hawkish RBNZ a fortnight ago continues to fade. This week, we highlighted a new theme, which is the rising incidence of natural disasters. Historically, this has been great for agricultural prices, benefiting NZD. But it has also been accompanied by a tremendous rise in currency volatility, which hurts the NZD vis-à-vis safe-haven currencies. We are currently long CHF/NZD and will be exploring this theme in future publications. Report Links: How High Can The Kiwi Rise? - April 30, 2021 Portfolio And Model Review - February 5, 2021 Currencies And The Value-Versus-Growth Debate - July 10, 2020 Canadian Dollar Chart II-13CAD Technicals 1
CAD Technicals 1
CAD Technicals 1
Chart II-14CAD Technicals 2
CAD Technicals 2
CAD Technicals 2
Data out of Canada this week has been mixed: Retail sales fell month on month in May by 2.1% but this was above expectations. Inflation remains robust. Headline CPI was 3.1%, while the core trim, median and common measures came in at 2.6%, 2.4% and 1.7% respectively. The CAD rose by 0.8% this week. The backdrop for the loonie remains positive as the Bank of Canada is leaning against monetary accommodation by tapering asset purchases, and signaling interest rate increases, while the Fed remains on hold. These pin real interest rate differentials in favor of the loonie. Report Links: Relative Growth, The Euro, And The Loonie - April 16, 2021 Will The Canadian Recovery Lead Or Lag The Global Cycle? - February 12, 2021 The Outlook For The Canadian Dollar - October 9, 2020 Swiss Franc Chart II-15CHF Technicals 1
CHF Technicals 1
CHF Technicals 1
Chart II-16CHF Technicals 2
CHF Technicals 2
CHF Technicals 2
There was scant data out of Switzerland this week: Investor confidence from the Credit Suisse survey fell in July, from 51.3 to 42.8. Total sight deposits were unchanged at CHF 712 bn for the week of July 23. The Swiss franc was up 1.3% this week. Incoming Swiss inflation data next week will dictate whether the SNB steps up the pace of FX intervention. So far, there have been no big moves in the CHF exchange rate to implore central bank attention. A rebound in global bond yields will be a welcome relief since the franc tends to weaken in that environment. For the time being, we believe volatility can continue to rise. As such, the franc will benefit, justifying long CHF/NZD bets. Report Links: An Update On The Swiss Franc - April 9, 2021 Portfolio And Model Review - February 5, 2021 The Dollar Conundrum And Protection - November 6, 2020 Norwegian Krone Chart II-17NOK Technicals 1
NOK Technicals 1
NOK Technicals 1
Chart II-18NOK Technicals 2
NOK Technicals 2
NOK Technicals 2
There was scant data out of Norway this week: Retail sales were flat month on month in June. The NOK was up 1% this week. Our limit buy on Scandinavian currencies was triggered a fortnight ago, nudging us in the money with this week’s currency moves. We are not fighting the Norges Bank, which has signaled they will increase interest rates this year, ahead of both the Federal Reserve and the ECB. As such, we are short EUR/NOK and USD/NOK. Report Links: The Norwegian Method - June 4, 2021 Portfolio And Model Review - February 5, 2021 Revisiting Our High-Conviction Trades - September 11, 2020 Swedish Krona Chart II-19SEK Technicals 1
SEK Technicals 1
SEK Technicals 1
Chart II-20SEK Technicals 2
SEK Technicals 2
SEK Technicals 2
Recent data from Sweden have been improving: The PPI for July came in at 9.6%, up from 7.9%. The June trade balance showed a healthy surplus of SEK 10.3 billion. The economic tendency survey for July came in at 122.4 from 119.8. Manufacturing confidence continues to inflect higher, rising from 125.2 to 129.2 in July. The SEK was the strongest performing G10 currency this week, rising 1.5%. Swedish Q2 GDP was a welcome positive surprise, up by 10.5% year on year and 0.9% quarter on quarter. This is paring back expectations of more stimulus from the Riksbank. We have been highlighting that SEK remains one of our most potent plays on a global growth recovery. As such, we are short EUR/SEK and USD/SEK. Report Links: Revisiting Our High-Conviction Trades - September 11, 2020 More On Competitive Devaluations, The CAD And The SEK - May 1, 2020 Sweden Beyond The Pandemic: Poised To Re-leverage - March 19, 2020 Trades & Forecasts Forecast Summary Core Portfolio Tactical Trades Limit Orders Closed Trades
The Australian dollar has been under pressure recently, falling below its 40-week moving average on June 18. AUD/USD is down 7.5% since its late-February apex and over the past three months it has been among the worst performing currencies against the US…