China
The United States is insulated from global trade, but only to a point – it cannot escape a global recession should one develop, given that its economy is still closely linked to the rest of the world. With global and U.S. equities vulnerable to additional…
Trump’s predicament suggests that he will have to adjust his policies. Global trade, capital spending, and sentiment have deteriorated significantly since the last escalation-and-delay episode with China in May and June. Beijing’s economic stimulus measures…

Highlights The chance of a U.S.-China trade agreement is still only 40% – but an upgrade may be around the corner. Trump is on the verge of a tactical trade retreat due to fears of economic slowdown and a loss in 2020. Xi Jinping is now the known unknown. His aggressive foreign policy is a major risk even if Trump softens. Political divisions in Greater China – Hong Kong unrest and Taiwan elections – could harm the trade talks. Maintain tactical caution but remain cyclically overweight global equities. Feature “I am the chosen one. Somebody had to do it. So I’m taking on China. I’m taking on China on trade. And you know what, we’re winning.” – U.S. President Donald J. Trump, August 21, 2019 On August 1, United States President Donald Trump declared that he would raise a new tariff of 10% on the remaining $300 billion worth of imports from China not already subject to his administration’s sweeping 25% tariff. Then, on August 13, with the S&P 500 index down a mere 2.4%, Trump announced that he would partially delay the tariff, separating it into two tranches that will take effect on September 1 and December 15 (Chart 1). Chart 1Trump's Latest Tariff Salvo
Trump's Latest Tariff Salvo
Trump's Latest Tariff Salvo
Chart 2
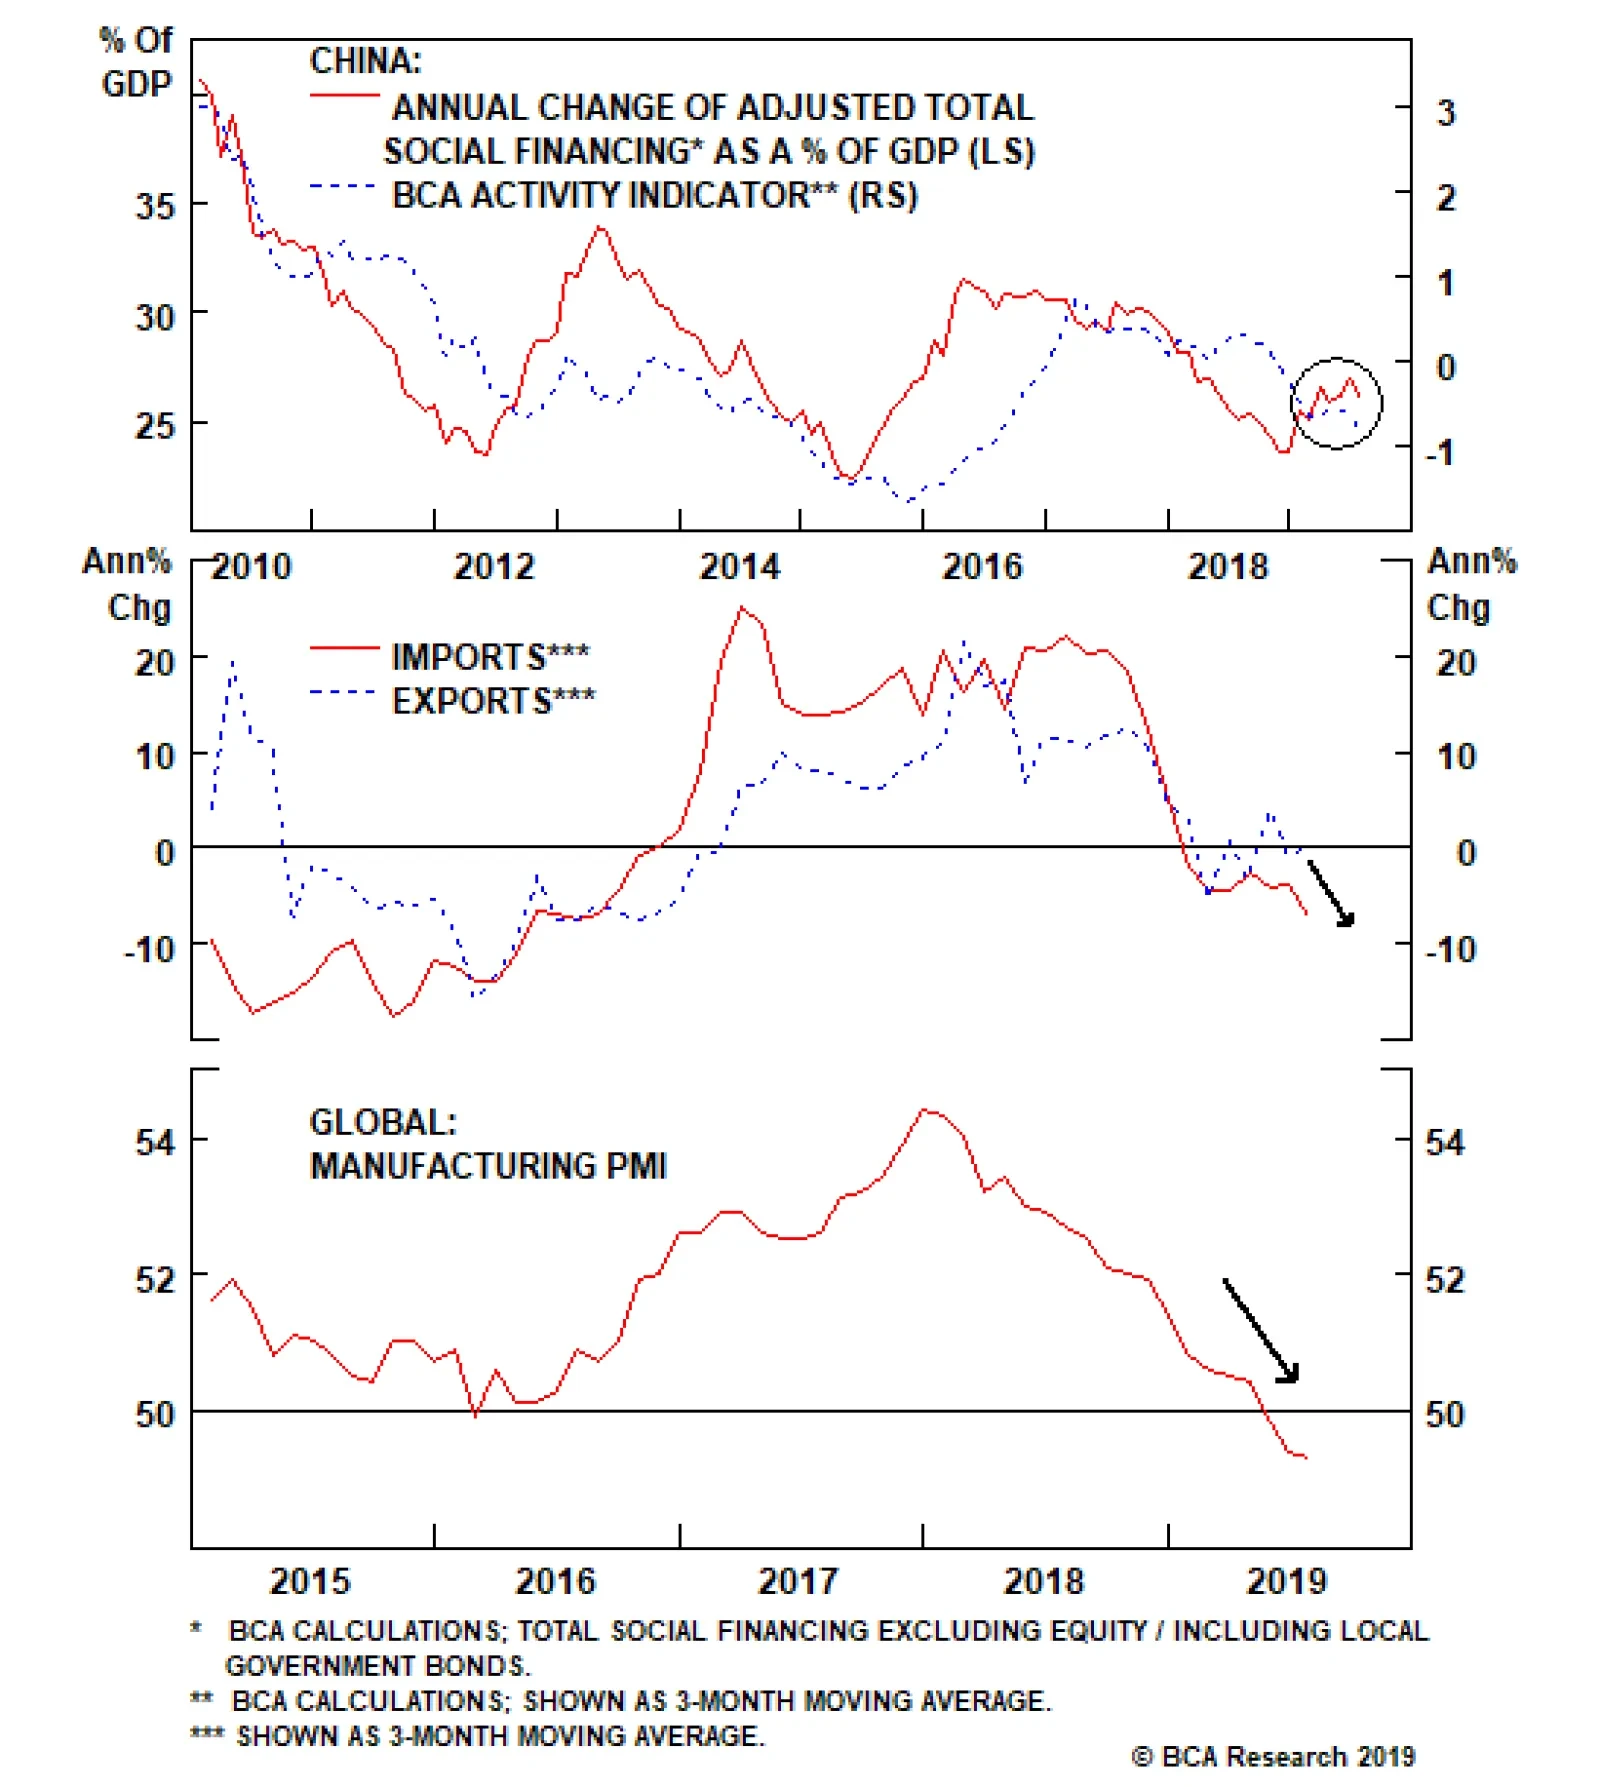
Six days later Trump’s Commerce Department renewed the 90-day temporary general license for U.S. companies to do business with embattled Chinese telecom company Huawei, which has ties to the Chinese state and is viewed as a threat to U.S. network security. Trump’s tendency to take two steps forward with coercive measures and then one step back to control the damage is by now familiar to global investors. Yet this backpedaling reveals that like other politicians he is concerned about reelection. After all, there is a clear chain of consequence leading from trade war to bear market to recession to a Democrat taking the White House in November 2020. Trump’s approval rating is already similar to that of presidents who fell short of re-election amid recession (Chart 2) – an actual recession would consign him to the dustbin of history. Will Trump Stage A Tactical Retreat On Trade? Yes. Trump’s predicament suggests that he will have to adjust his policies. Global trade, capital spending, and sentiment have deteriorated significantly since the last escalation-and-delay episode with China in May and June. Beijing’s economic stimulus measures disappointed expectations, exacerbating the global slowdown (Chart 3). This leaves him less room for maneuver going forward. Chart 3China's Gradual Stimulus Yet To Revive Global Economy
China's Gradual Stimulus Yet To Revive Global Economy
China's Gradual Stimulus Yet To Revive Global Economy
Chart 4Trump's Economy Grew Slower Than Thought Despite Fiscal Stimulus
Trump's Economy Grew Slower Than Thought Despite Fiscal Stimulus
Trump's Economy Grew Slower Than Thought Despite Fiscal Stimulus
Even “Fortress America” – consumer-driven and relatively insulated from global trade – has seen manufacturing, private investment, and business sentiment weaken. GDP growth is slowing and has been revised downward for 2018 despite a surge in budget deficit projections to above $1 trillion dollars (Chart 4). Q4 may be Trump’s last chance to save the business cycle and his presidency. The U.S. Treasury yield curve inversion is deepening. While we at BCA would point out reasons that this may not be a reliable signal of imminent recession, Trump cannot afford to ignore it. He is sensitive to the widening talk of “recession” in American airwaves and is openly contemplating stimulus options (Chart 5). His approval rating has lost momentum, partly due to his perceived mishandling of a domestic terrorist attack motivated by racist anti-immigrant sentiment in El Paso, Texas, but negative financial and economic news have likely also played a part (Chart 6). Chart 5Trump Fears Growing Talk Of Recession
Trump Fears Growing Talk Of Recession
Trump Fears Growing Talk Of Recession
Chart 6
In short, the fourth quarter of 2019 may be Trump’s last chance to save the business cycle and his presidency. The core predicament for Trump continues to be the divergence in American and Chinese policy. Chart 7Trump's Fiscal Policy Undid His Trade Policy
Trump's Fiscal Policy Undid His Trade Policy
Trump's Fiscal Policy Undid His Trade Policy
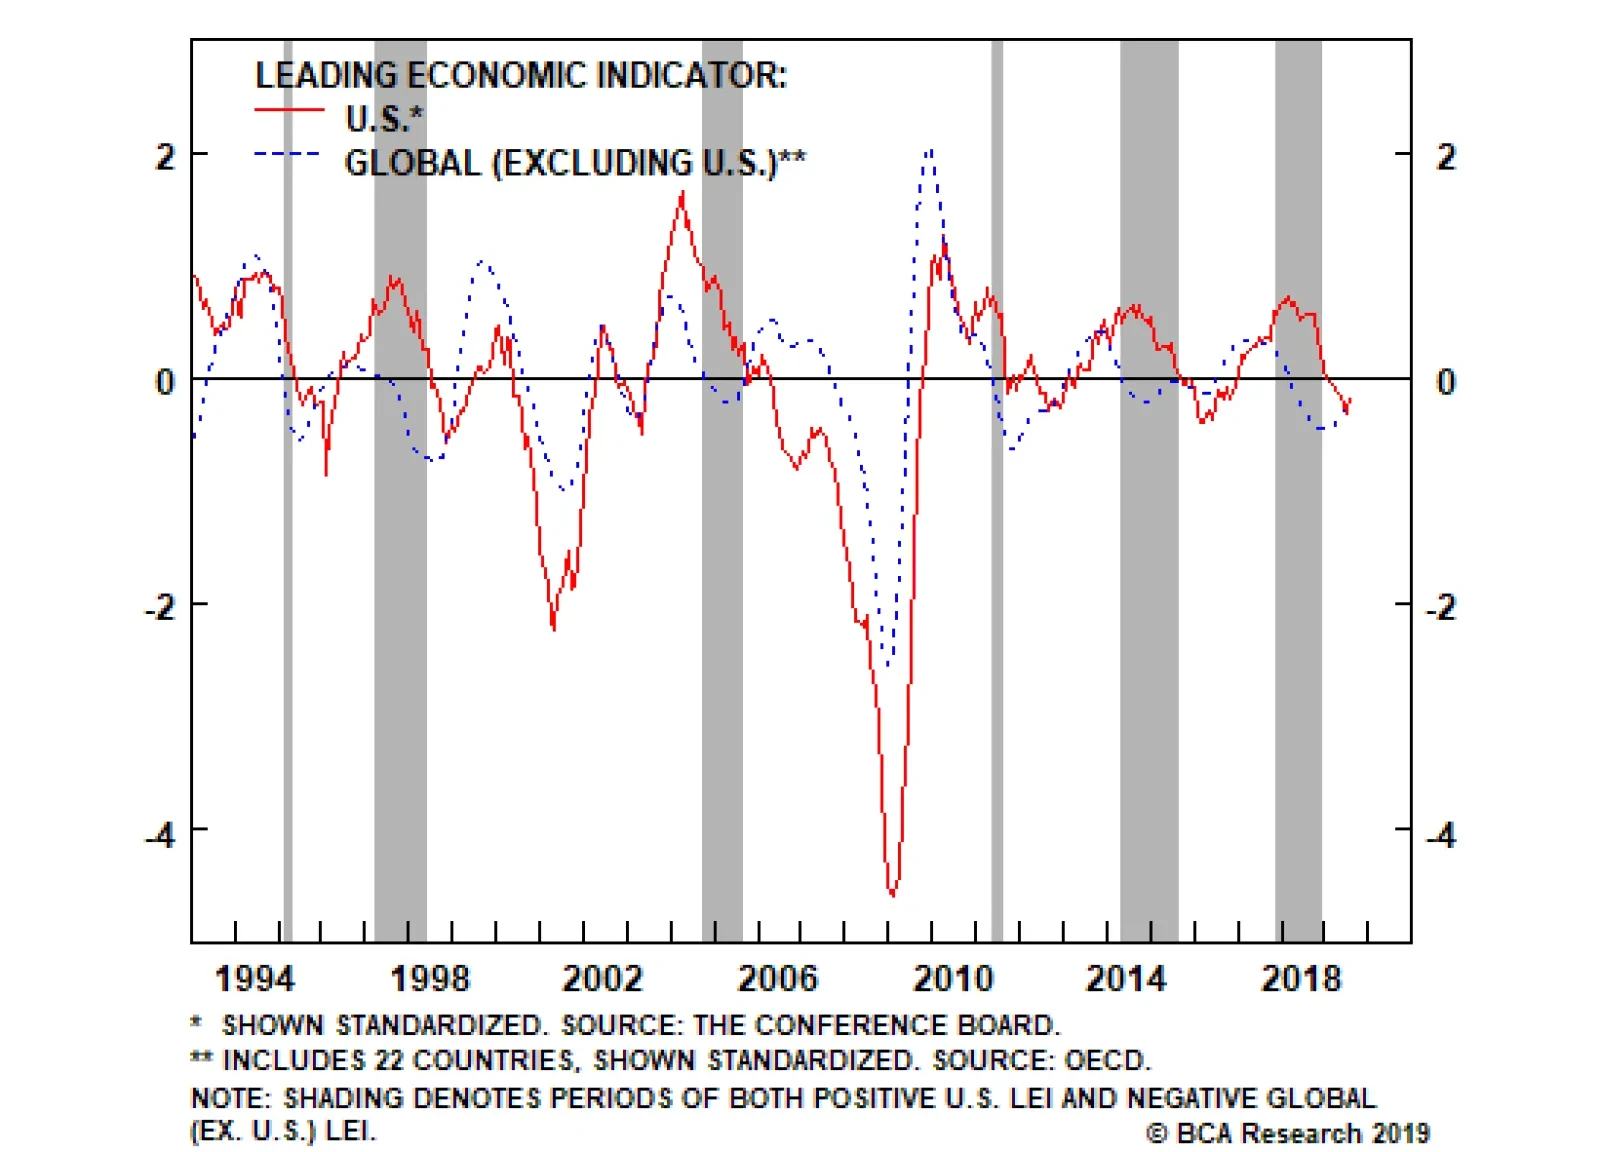
In the U.S., the stimulating effect of Trump’s Tax Cut and Jobs Act is wearing off just as the deflationary effect of his trade policy begins to bite. In China, the lingering effects of Xi’s all-but-defunct deleveraging campaign are combining with the trade war, and slowing trend growth, to produce a drag on domestic demand and global trade. The result is a rising dollar, which increases the trade deficit – the opposite of what Trump wants and needs (Chart 7). The United States is insulated from global trade, but only to a point – it cannot escape a global recession should one develop, given that its economy is still closely linked to the rest of the world (Chart 8). With global and U.S. equities vulnerable to additional volatility in the near term, Trump will have to make at least a tactical retreat on his trade policy over the rest of the year. First and foremost this would mean: Chart 8If Total Trade War Causes A Global Relapse, The U.S. Economy Cannot Escape
If Total Trade War Causes A Global Relapse, The U.S. Economy Cannot Escape
If Total Trade War Causes A Global Relapse, The U.S. Economy Cannot Escape
Expediting a trade deal with Japan – this should get done before a China deal, possibly as early as September. Ratifying the U.S.-Mexico-Canada “NAFTA 2.0” agreement – this requires support from moderate Democrats in Congress. The window for passage is closing fast but not closed. Removing the threat to slap tariffs on European car and car part imports in mid-November. There is some momentum given Europe’s need to boost growth and recent progress on U.S. beef exports to the EU. Lastly, if financial and economic pressure are sustained, Trump will be forced to soften his stance on China. The problem for global risk assets – in the very near term – is that Trump’s tactical retreat has not fully materialized yet. The new tariff on China is still slated to take effect on September 1. This tariff hike or other disagreements could result in a cancellation of talks or failure to make any progress.1 Even if Trump does pivot on trade, China’s position has hardened. It is no longer clear that Beijing will accept a deal that is transparently designed to boost Trump’s reelection chances. Thus, the biggest question in the trade talks is no longer Trump, but Xi. Is Xi prepared to receive Trump kindly if the latter comes crawling back? How will he handle rising political risk in Hong Kong SAR and Taiwan island,2 and will the outcome derail the trade talks? Bottom Line: Global economic growth is fragile and President Trump has only tentatively retracted his latest salvo against China. Nevertheless, the clear signal is that he is sensitive to the financial and economic constraints that affect his presidential run next year – and therefore investors should expect U.S. trade policy to turn less market-negative on the margin in the coming months. This is positive for the cyclical view on global risk assets. But the risk to the view is China: whether Trump will take a conciliatory turn and whether Xi will reciprocate. Can Xi Jinping Accept A Deal? Yes. It is extremely difficult for Xi Jinping to offer concessions in the short term. He is facing another tariff hike, U.S. military shows of force, persistent social unrest in Hong Kong, and a critical election in Taiwan. Certainly, he will not risk any sign of weakness ahead of the 70th anniversary of the People’s Republic of China on October 1, which will be a nationalist rally in defiance of imperialist western powers. After that, however, there is potential for Xi to be receptive to any Trump pivot on trade. China’s strategy in the trade talks has generally been to offer limited concessions and wait for Trump to resign himself to them. Concessions thus far are not negligible, but they can easily be picked apart. They consist largely of preexisting trends (large commodity purchases); minor adjustments (e.g. to car tariffs and foreign ownership rules); unverifiable promises (on foreign investment, technological transfer, and intellectual property); or reversible strategic cooperation (partial enforcement of North Korean and Iranian sanctions) (Table 1). Many of these concessions have been postponed as a result of Trump’s punitive measures. Table 1China’s Offers Thus Far In The Trade War
Big Trouble In Greater China
Big Trouble In Greater China
It is unlikely that Beijing will offer much more under today’s adverse circumstances. The exception is cooperation on North Korea, which should improve. So the contours of a deal are generally known. This is what Trump will have to accept if he seeks to calm markets and restore confidence in the economy ahead of his election. But this slate of concessions is ultimately acceptable for the U.S. China’s demands are that Trump roll back all his tariffs, that purchases of U.S. goods must be reasonable in scale, and that any agreement be balanced and conducted with mutual respect. Of these three, the tariffs and the “balance” pose the most trouble. Trade balance: Washington and Beijing can agree on the terms of specific purchases. China can increase select imports substantially – it remains a cash-rich nation with a state sector that can be commanded to buy American goods. Tariff rollback: This is tougher but can be done. The U.S. will insist on some tariffs – or the threat of tech sanctions – as an enforcement mechanism to ensure that Beijing implements the structural concessions necessary for an agreement. But China might accept a deal in which tariffs were mostly rolled back – say to the original 25% tariff on $50 billion worth of goods. This would likely offset the degree of yuan appreciation to be expected from the likely currency addendum to any agreement. Balance and respect: This qualitative demand is the sticking point. Fundamentally, China cannot reward Trump for his aggressive and unilateral protectionist measures. This would be to set a precedent for future American presidents that sweeping tariffs on national security grounds are a legitimate way of coercing China into making economic structural reforms. Moreover if the U.S. wants to improve the trade balance, China thinks, it cannot embargo Chinese high-tech imports but must actually increase its high-tech exports. Clearly this is a major impasse in the talks. The last point is the likeliest deal-breaker. It may ultimately hinge on strategic events outside of the realm of trade. But before discussing it further, it is important to recognize that China is not invincible – it has a pain threshold. The threat of a divorce from the U.S. is a danger to China’s economy and the Communist regime. Chart 9China's Ultimate Economic Constraint
China's Ultimate Economic Constraint
China's Ultimate Economic Constraint
Deterioration in China’s labor market is of utmost seriousness to any Chinese leader (Chart 9). And the economy is still struggling to revive. Xi’s reform and deleveraging campaign of 2017-18 has been postponed but the lingering effects are weighing on growth and the property sector remains under tight regulation. Moreover the removal of implicit guarantees, and rare toleration of creative destruction (Chart 10), have left banks and corporations afraid to take on new risks. The state’s reflationary measures, including a big boost to local government spending, have so far been merely sufficient for domestic stability. These problems can be addressed by additional policy easing. But the domestic political crackdown and the break with the U.S. have shaken manufacturers and private entrepreneurs to the bone, suppressing animal spirits and reducing the demand for loans. Chart 10Creative Destruction In China
Creative Destruction In China
Creative Destruction In China
Ultimately a short-term trade deal to ease this economic stress would make sense for Xi Jinping, even though he knows that U.S. protectionism and the conflict over technological acquisition will persist beyond 2020 and beyond Trump. The threat of a sharp and destabilizing divorce from the U.S. is a real and present danger to the long-term stability of China’s economy and the Communist regime. Xi is a strongman leader, but is he really ready for Mao Zedong-style austerity? Is he not more like former President Jiang Zemin (ruled 1993-2003), who imposed some austerity while prizing domestic economic and political stability above all? To this question we now turn. Bottom Line: China has become the wild card in the trade war. Trump’s need to prevent a recession is known. Beijing has a higher pain threshold and could walk away from the deal to punish Trump (upsetting the global economy and diminishing Trump’s reelection prospects). This would set the precedent for future American presidents that China will not bow to gunboat diplomacy. Will Xi Jinping Overplay His Hand? Be Afraid. For decades China’s main foreign policy principle has been to “lie low and bide its time,” to paraphrase former leader Deng Xiaoping. In the current context this means maintaining a willingness to engage with the U.S. whenever it engages sincerely. This approach implies making the above concessions to minimize the immediate threat to stability from the trade war, while biding time in the longer run rivalry against the United States. Such an approach would also imply assisting the diplomatic process on the Korean peninsula, avoiding a military crackdown in Hong Kong, and refraining from aggressive military intimidation ahead of Taiwan’s election in January. Chart 11China's Vast Market Its Most Persuasive Tool
China's Vast Market Its Most Persuasive Tool
China's Vast Market Its Most Persuasive Tool
After all, there is no better way for the Communist Party to undercut dissidents in Hong Kong and Taiwan than to strike a deal with the United States. This would demonstrate that Xi is a pragmatic leader who is still committed to “reform and opening up.” It would help generate an economic rebound that would bring other countries deeper into Beijing’s orbit (Chart 11). China’s vast domestic market is ultimately its greatest strength in its contest with the United States. In short, conventional Chinese policy suggests that Xi should perpetuate the long success story since 1978 by striking another deal with another Republican president. The catch is that Xi Jinping is not conventional. Since coming to power in 2012, Xi has eschewed the subtle strategies of Sun Tzu and Deng Xiaoping in favor of a more ambitious approach: that of declaring China’s arrival as a major power and leveraging its economic and military heft to pursue foreign policy and commercial interests aggressively. Xi’s reassertion of Communist rule and state-guided technological acquisition is the biggest factor behind the new U.S. political consensus – entirely aside from Trump – that China is foe rather than friend. There are several empirical reasons to think that Xi might overplay his hand: Xi failed to make substantive concessions with President Barack Obama’s administration on North Korea, the South China Sea, and cyber security, resulting in Obama’s decision to harden U.S. policy toward both China and North Korea in 2015 – a trend that predates Trump. Xi formally removed presidential term limits from China’s constitution even though he could have attracted less negative attention from the West by ruling from behind the scenes after his term in office, like Deng Xiaoping or Jiang Zemin. China has mostly played for time in negotiations with the Trump administration, as mentioned, and this aggravated tensions. Deep revisions to the draft agreement, which was supposedly 90% complete, broke the negotiations in May, sparking this summer’s standoff. Aggressive policies in territorial disputes have alienated even China’s potential allies. This includes regional states whose current ruling parties have courted China in recent years, in some cases obsequiously – South Korea, the Philippines, and Vietnam. The East and South China Seas remain a genuine source of “black swans” – unpredictable, low-probability, high-impact events – due to their status as critical sea lanes for the major Asian economies. China continues to militarize the islands there and aggressively prosecute its maritime-territorial disputes. We calculate that $6.4 trillion worth of goods flowed through this bottleneck in the year ending April 2019, 8% of which consists of energy goods from the Middle East that are vital to China and its East Asian neighbors, none of whom can stomach Chinese domination of this geographic space (Diagram 1). Even if Washington abandoned the region, Japan, South Korea, and Taiwan would see Chinese control as a threat to their security. Diagram 1The South China Sea As The World’s Traffic Roundabout
Big Trouble In Greater China
Big Trouble In Greater China
Ultimately, however, China’s adventures in its neighboring seas are a matter of choice. Not so for Greater China – in Hong Kong and Taiwan, political risk is rapidly mounting in a way that enflames the U.S.-China strategic distrust and threatens to prevent a trade agreement. Hong Kong: The Dust Has Not Settled Mass protests in Hong Kong have lost some momentum, based on the size of the largest rally in August versus June. But do not be fooled: the political crisis is deepening. A plurality of Hong Kongers now harbors negative feelings toward mainland Chinese people as well as the government in Beijing – a trend that is spiking amid today’s protests but began with the Great Recession and has roots in the deeper socioeconomic malaise of this capitalist enclave (Chart 12A & 12B).
Chart 12
Chart 12
Chart 13
A majority also lacks confidence in the political arrangement that ensures some autonomy from Beijing – known as “One Country, Two Systems” (Chart 13). This is a particularly worrisome sign since this is the fundamental basis for stable political relations with Beijing. With clashes continuing between protesters and police, students calling for a boycott of school this fall, and Beijing openly drilling its security forces in Shenzhen for a potential intervention, Hong Kong’s unrest is not yet laid to rest and could flare up again ahead of China’s sensitive National Day celebration. U.S. tariffs and sanctions are already in effect, reducing the ability of the U.S. to deter China from using force if it believes instability has gone too far. And as President Trump has warned – and would be true of any U.S. administration – a violent crackdown on civilian demonstrators would greatly reduce the political viability of a trade deal in the United States. Taiwan: The Black Swan Arrives Since Taiwan’s 2016 election, we have argued that it is a potential source of “black swans.” Mass protests in Hong Kong may have taken the cake. But these protests are now affecting the Taiwanese election dynamic and potentially the U.S.-China trade talks. Chart 14U.S. Approves Big New Arms Sale To Taiwan
U.S. Approves Big New Arms Sale To Taiwan
U.S. Approves Big New Arms Sale To Taiwan
On August 20, the United States Department of Defense informed Congress that it is proceeding with an $8 billion sale of F-16 fighter jets and other military arms and equipment to Taiwan – the largest sale in 22 years and the largest aircraft sale since 1992 (Chart 14). This sale is not yet complete and delivered, but ultimately will be – the question is the timing. Arms sales to Taiwan are a perennial source of tension between the United States and China – and China is increasingly assertive in using economic sanctions to get its way over such issues, as it showed in the lead up to South Korea’s election in 2017. This sale is not a military “game changer” – the U.S. did not send over fifth-generation F-35s, for instance – but China will respond vehemently. It is threatening to impose sanctions on American companies like Lockheed Martin and General Electric for their part in the deal. The sale does not in itself preclude the chance of a trade agreement but it contributes to a rise in strategic tensions that ultimately could. The context is Taiwan’s hugely important election in January. Four years ago, President Tsai Ing-wen and her pro-independence Democratic Progressive Party swept to power on the back of a popular protest movement – the “Sunflower Movement” – that opposed deeper cross-strait economic integration. It dangerously resembled the kind of anti-Communist “color revolutions” that motivate Xi Jinping’s hardline policies. Tsai shocked the world when she called Trump personally to congratulate him after his election, which violated diplomatic protocol given that Taiwan is a territory of China and not an independent nation-state. Since then Trump has largely avoided provoking the Taiwan issue so as not to strike at a core Chinese interest and obliterate the chance of a trade deal. But the U.S. has always argued that the provision of defensive arms to Taiwan is a condition of the U.S.-China détente – and Trump is so far moving forward with the sale. Chart 15A 'Fourth Taiwan Strait Crisis' Would Have A Seismic Equity Impact
A 'Fourth Taiwan Strait Crisis' Would Have A Seismic Equity Impact
A 'Fourth Taiwan Strait Crisis' Would Have A Seismic Equity Impact
How will Xi Jinping react if the sale goes through? In 1995-96, China’s use of missile tests to try to intimidate Taiwan produced the opposite effect – driving voters into the arms of Lee Teng-hui, the candidate Beijing opposed. This was the occasion of the Third Taiwan Strait Crisis, in which U.S. President Bill Clinton sent two aircraft carriers to the region, one that sailed through the Taiwan Strait. The negative effect on markets at that time was local, whereas anything resembling this level of tensions would today be a seismic global risk-off (Chart 15). Since the 1990s, leaders in Beijing have avoided direct military coercion ahead of elections. But Xi Jinping has hardened his stance on Taiwan throughout his term. He has dabbled with such coercion in his use of military drills that encircle Taiwan in recent years. While one must assume that he will use economic sanctions rather than outright military threats – as he did with South Korea – saber-rattling cannot be ruled out. The pressure on him is rising. Prior to the Hong Kong unrest, Taiwan’s elections looked likely to return the pro-mainland Kuomintang (KMT) to power and remove the incumbent President Tsai – a boon for Beijing. That outlook has changed and Tsai now has a fighting chance of staying in power (Chart 16). The prospect of four more years of Tsai would not be too problematic for Beijing if not for the fact that the U.S. political establishment is now firmly in agreement on challenging China. But even if Tsai loses, Taiwan’s outlook is troublesome. And this makes Xi’s decision-making harder to predict.
Chart 16
Chart 17
It is not that Tsai or her party will necessarily prevail. The manufacturing slowdown will take a toll and third-party candidates, particularly Ko Wen-je, would likely split Tsai’s vote. Moreover her Democratic Progressives still tie the KMT in opinion polling (Chart 17). The Taiwanese people are primarily concerned about maintaining the strong economy and cross-strait peace and stability, which her reelection could jeopardize (Chart 18). Tsai could very well lose, or she could be a lame duck presiding over the KMT in the legislature.
Chart 18
Chart 19
Rather, the problem for Xi Jinping is that the Taiwanese people clearly sympathize with the protesters in Hong Kong (Chart 19). They fear that their own governance system faces the same fate as Hong Kong’s, with the Communist Party encroaching on traditional political liberties over time. While Hong Kong ultimately has zero choice as to whether to accept Beijing’s supremacy, Taiwan has much greater autonomy – and the military support of outside forces. It is not a foregone conclusion that Taiwan must suffer the same political dependency as Hong Kong. Indeed, Taiwan has a long history of exercising the democratic vote and has even dabbled into the realm of popular referendums. In short, Taiwan has a lot more dry powder for a political crisis in the long run than Hong Kong. But the Hong Kong events have accentuated this fact, for two key reasons: First, Taiwanese people identify increasingly as exclusively Taiwanese, rather than as both Taiwanese and Chinese (Chart 20). The incidents in Hong Kong reveal that this sentiment is tied to immediate political relations and therefore deterioration would encourage further alienation from the mainland.
Chart 20
Chart 21
Second, while a strong majority of Taiwanese wish to maintain the political status quo to avoid conflict with the mainland, a substantial subset – approaching one-fourth – supports eventual or immediate independence (Chart 21). This means that relations with the mainland will eventually deteriorate even if the KMT wins the election. The KMT itself must respond to popular demand not to cozy up too much with Beijing, which is how it fell from power in 2016. Taiwan has a lot more dry powder for a political crisis than Hong Kong. Meanwhile, under KMT rule, Taiwan’s progressive-leaning youth are likely to set about reviving their protest movement in the subsequent years and imitating their Hong Kong peers, especially if the KMT warms up relations too fast with the mainland. Ultimately these points suggest that Xi Jinping will strive to avoid a violent crackdown in Hong Kong. A crackdown would be the surest way for him to harm the KMT in the Taiwanese election and to hasten the rebuilding of U.S.-Taiwan security ties. Call The President The best argument for Xi to lie low and avoid a larger crisis in Greater China is that it would unify the West and its allies against China. So far Xi’s foreign policy has not been so aggressive as to lead to diplomatic isolation. Europe is maintaining a studied neutrality due to its own differences with the United States; Asian neighbors are wary of provoking Chinese sanctions or military threats. A humanitarian crisis in Hong Kong or a “Fourth Taiwan Strait Crisis” would change that. For markets, the best-case scenario is that Xi Jinping exercises restraint. This would help Hong Kong protests lose steam, North Korean diplomacy get back on track, and Taiwanese independence sentiment simmer down. China would be more likely to halt U.S. tariffs and tech sanctions, settle a short-term trade agreement, and delay the upgrade in U.S.-Taiwan defense relations. China would still face adverse long-term political trends in both the U.S. and Taiwan, but an immediate crisis would be averted. The worst-case scenario is that Xi indulges his ambition. Hong Kong protests could explode, relations with Taiwan would deteriorate, and U.S.-China relations would move more rapidly in their downward spiral. Trade talks could collapse. Xi Jinping would face the possibility of a unified Western front, instability within Greater China, and a global recession. This might get rid of Donald Trump, but it would not get rid of the U.S. Congress, Navy, or Department of Defense. The choice seems pretty clear. Xi, like Trump, faces constraints that should motivate a tactical retreat from confrontation, at least after October 1. While this does not necessarily mean a settled trade agreement, it does suggest at least a ceasefire or truce. Our GeoRisk indicators show that market-based political risk in Taiwan – and less so South Korea – moves in keeping with global economic policy uncertainty. The underlying U.S.-China strategic confrontation and trade war are driving both (Chart 22). A deterioration in this region has global consequences. Chart 22U.S.-China Strategic Conflict Fuels Global Economic Uncertainty And Taiwanese Geopolitical Risk In Tandem
U.S.-China Strategic Conflict Fuels Global Economic Uncertainty And Taiwanese Geopolitical Risk In Tandem
U.S.-China Strategic Conflict Fuels Global Economic Uncertainty And Taiwanese Geopolitical Risk In Tandem
Xi is a markedly aggressive “strongman” Chinese leader who has not been afraid to model his leadership on that of Chairman Mao. He could still overplay his hand. This is why we maintain that the odds of a U.S.-China trade agreement remain 40%, though we are prepared to upgrade that probability if Trump and Xi make pro-market decisions. Investment Implications On the three-month tactical horizon, BCA’s Geopolitical Strategy is paring back our tactical safe-haven trades: we are closing our “Doomsday Basket” of long gold and Swiss bonds for a gain of 13.6%, while maintaining our simple gold portfolio hedge going forward. Trump has not yet decisively staged his tactical retreat on trade policy, while rising political risk in Greater China increases uncertainty over Xi Jinping’s next moves. On the cyclical horizon, the above suggests that there is a light at the end of the tunnel – if both Trump and Xi recognize their political constraints. This means that there is still a political and geopolitical basis to reinforce BCA’s House View to remain optimistic on global and U.S. equities over the next 12 months, with the potential for non-U.S. equities to recover and bond yields to reverse their deep dive. Matt Gertken, Vice President Geopolitical Strategist mattg@bcaresearch.com Footnotes 1 Negotiations between Trump and Xi are slated for September in Washington. There is a prospect for Trump to hold another summit with Communist Party General Secretary Xi Jinping on the sidelines of the United Nations General Assembly in New York in late September and at the APEC summit in Chile in mid-November. 2 Hong Kong is a Special Administrative Region of the People’s Republic of China, while Taiwan is recognized as a province or territory.
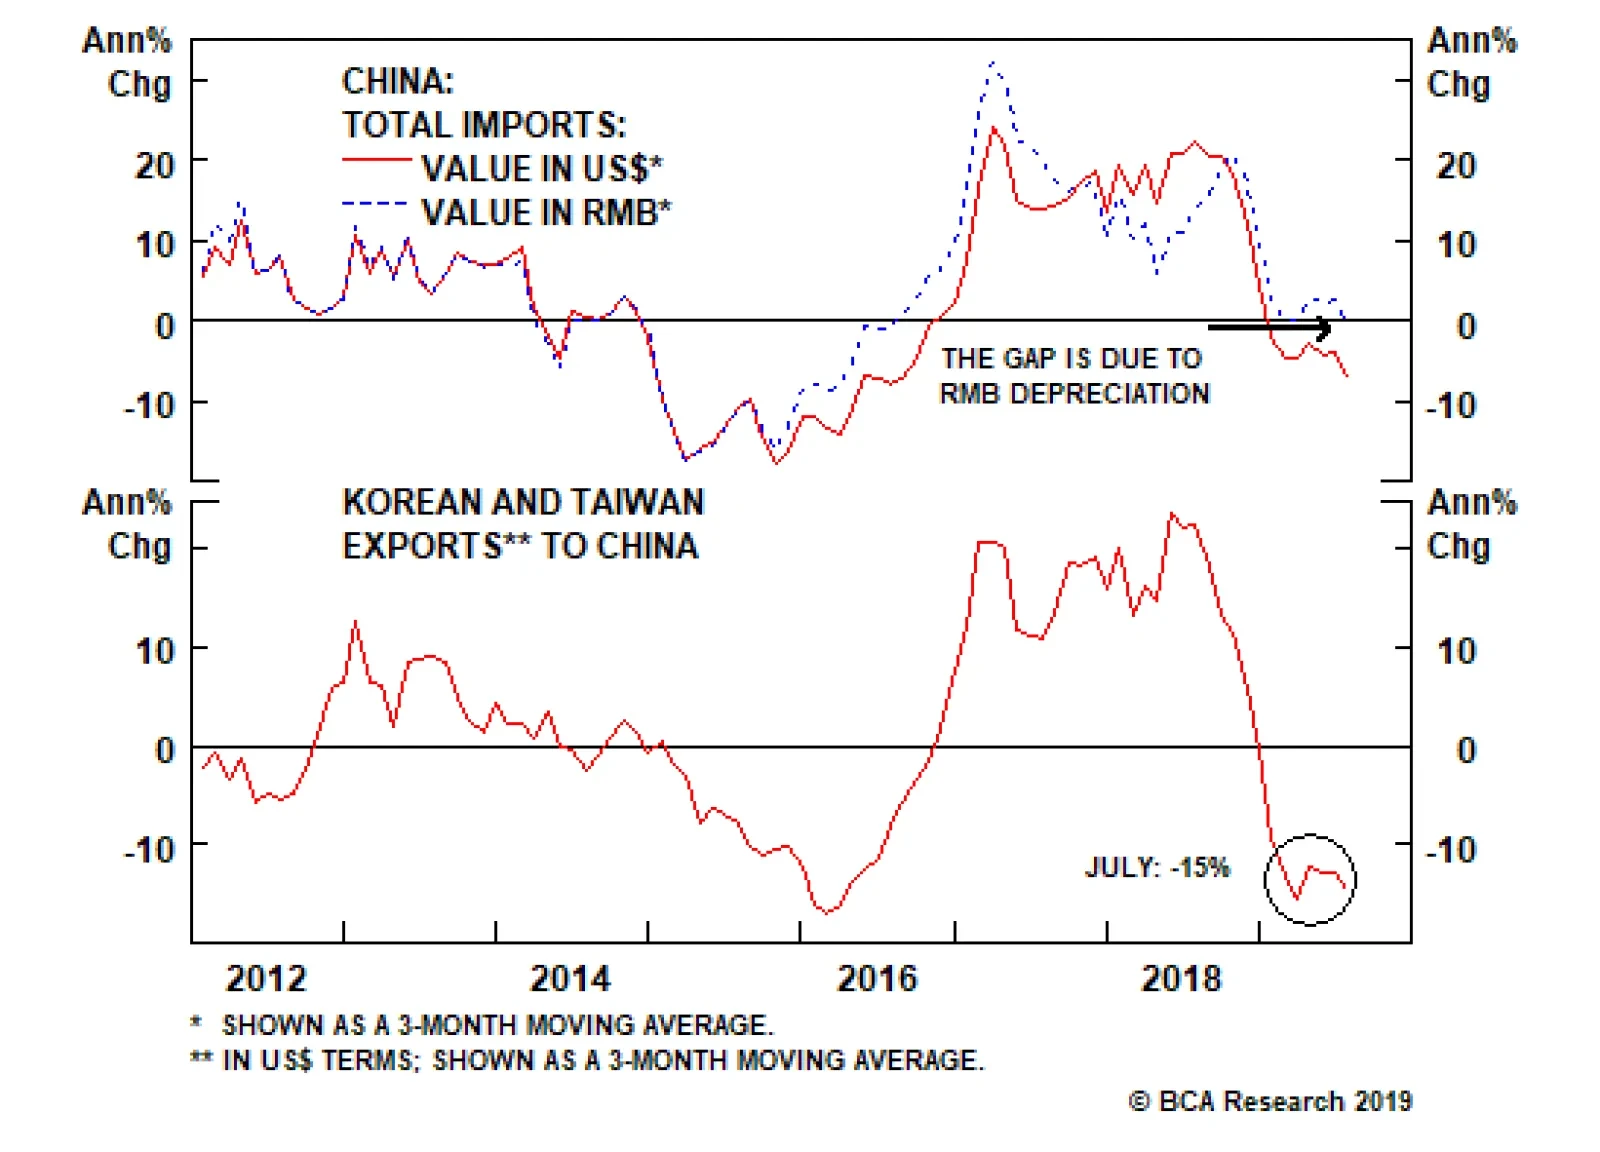
The recent RMB depreciation will likely intensify the Chinese import contraction, as the same amount of yuan will buy less goods priced in U.S. dollars. Since the majority of goods and commodities procured by mainland companies are priced in dollars,…
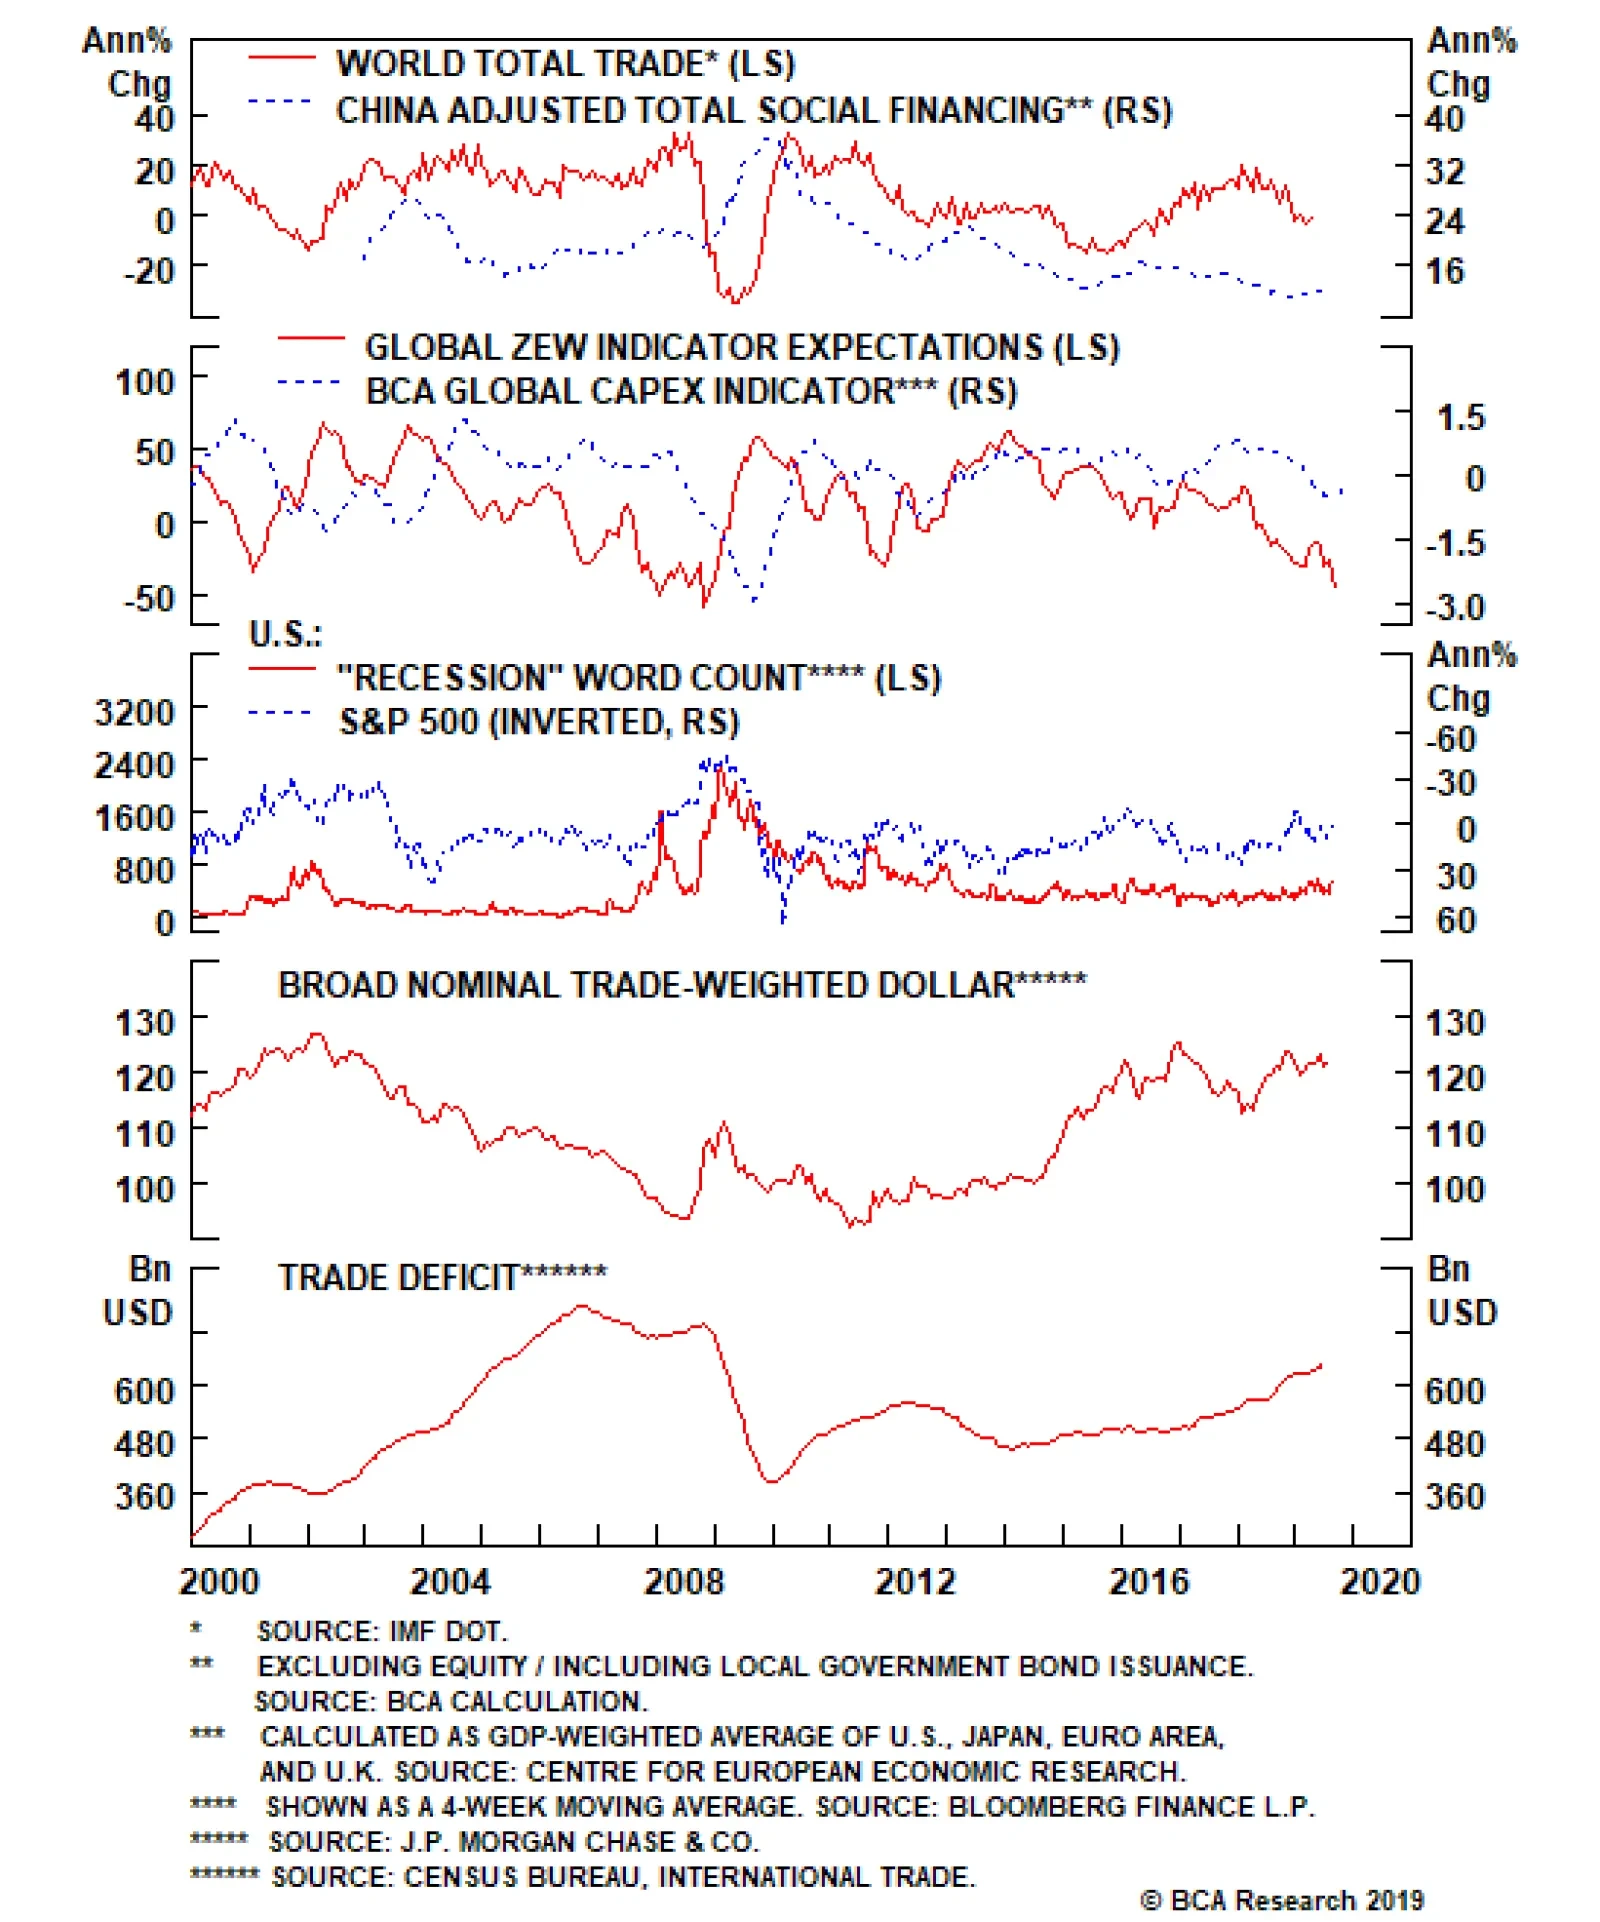
The media and many investors seem to be solely focused on the impact of U.S. tariffs against imports from China. Yet, these tariffs have not been the primary cause of the ongoing global manufacturing and trade recessions. The global trade contraction and…
Chart II-1Is Deflation In Steel And Coal Back?
Is Deflation In Steel And Coal Back?
Is Deflation In Steel And Coal Back?
Unlike 2015 when steel, iron ore and coal prices collapsed, in the current downturn they have so far held up reasonably well. They have begun falling only recently (Chart II-1). Even though we do not anticipate a 2015-type Armageddon in steel, iron ore and coal prices, they will deflate further due to supply outpacing demand in China. For both steel and coal, the pace of “de-capacity” reforms in China has diminished considerably, with declining shutdowns of inefficient capacity and rising advanced capacity, as we argued in a couple of reports last year. This has led to a faster growth in supply, while demand has been dwindling with weak economic growth. Lower steel, iron ore and coal prices will harm Chinese and global producers along with their respective countries.1 Steel And Iron Ore First, both crude steel and steel products output will likely grow at a pace of 5-7% (Chart II-2). As the 2016-2020 steel de-capacity target (150 million tons capacity reduction) was already achieved by the end of 2018, the scale of further shutdowns will be limited. In addition, collapsing graphite electrode prices reflect an increased supply of this material. This along with more availability of scrap steel will facilitate the continuing expansion of cleaner technology (electric furnace (EF)) steel capacity and their output in China. The newly added EF steel capacity is planned at about 21 million tons in 2019 (representing 1.8% of official aggregate steel production capacity), slightly lower than the 25 million tons in 2018. Second, we expect steel products demand to grow at 3-5%, slightly weaker than output. Construction accounts for about 55% of Chinese final steel demand, with about 35% stemming from the property market and 20% from infrastructure. The automotive sector contributes about 10% of final Chinese steel demand. All of these end markets are weak and do not yet show signs of revival (Chart II-3). Chart II-2Steel Production In China
Steel Production In China
Steel Production In China
Chart II-3No Recovery In Chinese Demand
No Recovery In Chinese Demand
No Recovery In Chinese Demand
Concerning iron ore price, we expect more downside than in steel. Supply disruptions among Brazilian and Australian producers were the main cause for the significant rally in iron ore prices this year. Evidence is that these producers have already resumed their output recovery. Current iron ore prices are still well above marginal production costs of major global iron ore producers. Besides, ongoing large currency depreciation in commodity producing countries will push down their marginal production costs in U.S. dollars terms. This will encourage further supply. As China has increased its use of scrap steel in its crude steel production, the country’s iron ore demand has not grown much. In fact, imports of this raw material have contracted (Chart II-4) As scrap steel prices are currently very low relative to the price of imported iron ore (Chart II-5), steel producers in China will continue to use scrap steel instead of iron ore. Chart II-4China's Imports Of Iron Ore Have Been Shrinking
China's Imports Of Iron Ore Have Been Shrinking
China's Imports Of Iron Ore Have Been Shrinking
Chart II-5Scrap Steel Is A Cheap Substitute For Iron Ore
Scrap Steel Is A Cheap Substitute For Iron Ore
Scrap Steel Is A Cheap Substitute For Iron Ore
Coal Chart II-6Coal Output Is Rising, But Beijing's Goal To Reduce Its Usage
Coal Output Is Rising, But Beijing's Goal To Reduce Its Usage
Coal Output Is Rising, But Beijing's Goal To Reduce Its Usage
Chinese coal prices will also be under downward pressure. First, coal output growth will likely slow but will still stand at 2-4% down from a current 6% level (Chart II-6, top panel). The government has set a production goal of 3900 million tons for 2020. Given last year’s output of 3680 million tons, this implies only a 2.9% annual growth rate this year and the next. Second, the demand for both thermal coal and coking coal will likely weaken. They account for 80% and 20% of total coal demand, respectively. About 60% of Chinese coal is used to generate thermal power. As the country continues to promote the use of clean energy, thermal power output growth will likely slow further. Increasing the nation’s reliance on clean energy is an imperative strategic objective for Beijing. Given that thermal coal still accounts for a whopping 70% of electricity production, China will maintain its effort on reducing coal in its energy mix (Chart II-6, bottom panel). In the same vein, the government will continue to replace coal with natural gas in home heating. Finally, Chinese coal import volumes are likely to decline as the nation is increasingly relying on its domestic sources. In particular, the strategic Menghua railway construction will be completed in October. It will be used to transport the commodity from large producers in the north to the coal-deficit provinces in the south. This will reduce the nation’s coal imports, as the transportation cost of shipping domestic coal to the southern power plants will become more competitive than imported coal. Macro And Investment Implications First, companies and economies producing these commodities will face deflationary pressures. These include - but are not limited to - Indonesia, Australia, Brazil and South Africa, as well as steel producers around the world. Second, the RMB depreciation will allow China to gain further market share in the global steel market. In fact, China’s share of global steel output has been rising (Chart II-7, top panel). The bottom panel of Chart II-7 shows that steel production in the world excluding China have actually come to a grinding halt at a time when mainland producers have enjoyed high output growth. Global steel stocks have broken down and global mining equities are heading into a breakdown (Chart II-8). Chart II-7China Has Been Gaining A Share In Global Steel Market
China Has Been Gaining A Share In Global Steel Market
China Has Been Gaining A Share In Global Steel Market
Chart II-8Breakdown In Steel And Mining Stocks
Breakdown In Steel And Mining Stocks
Breakdown In Steel And Mining Stocks
Finally, we remain bearish on commodities and other global growth sensitive currencies. In particular, we continue shorting the following basket of EM currencies against the U.S. dollar: ZAR, CLP, COP, IDR, MYR and KRW. Ellen JingYuan He, Associate Vice President ellenj@bcaresearch.com Footnotes 1 This is BCA’s Emerging Markets Strategy view and is different from BCA’s house view.
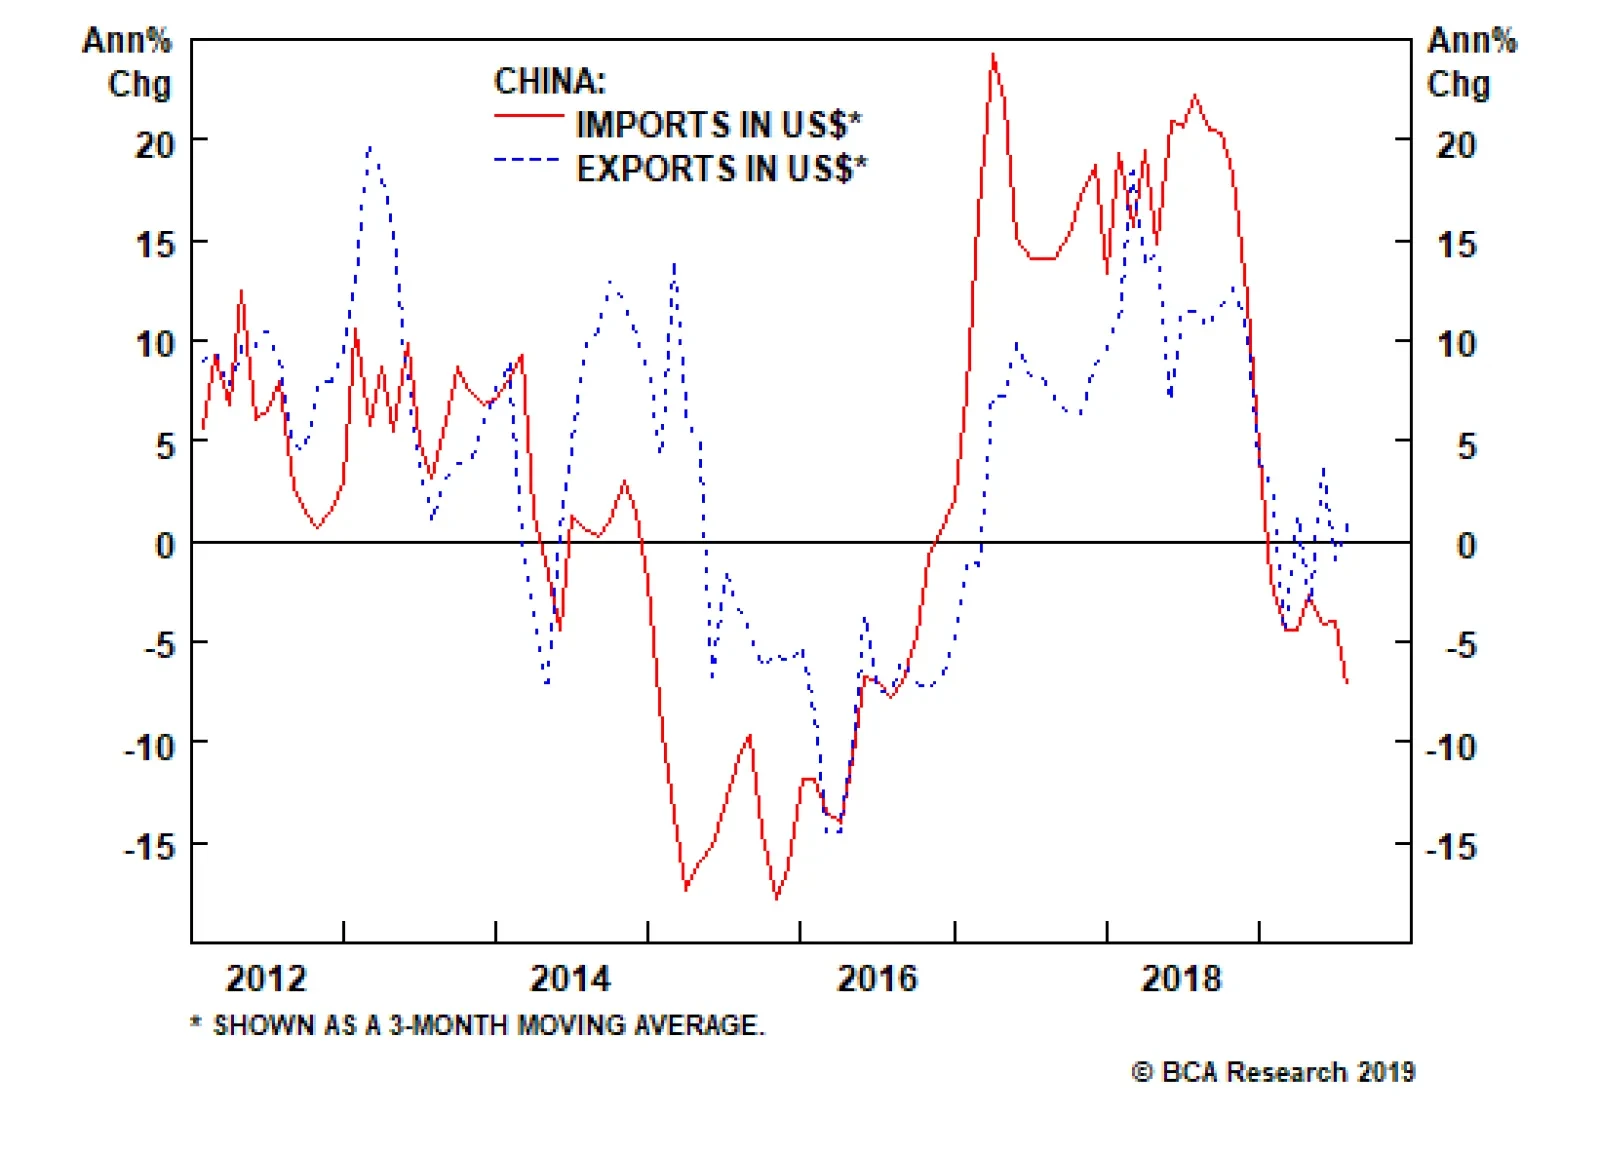
Highlights The current global trade downtrend has primarily been due to a contraction in Chinese imports. The latter reflects weakness in China's domestic demand in general and capital spending in particular. The current global manufacturing and trade downturns will prove to be drawn out. Several important markets have already experienced technical breakdowns, and a few others are at risk of doing so. EM domestic bonds and EM credit markets could be the last shoe to drop in this EM selloff. Steel, iron ore and coal prices, will all deflate further due to supply outpacing demand in China. Feature In our report last week, we argued that the odds of a liquidation phase in EM are growing. This week’s report continues exploring this theme, offering additional rationale and evidence of a pending breakdown in EM. Trade Tariffs: The Wrong Focus? The media and many investors seem to be solely focused on the impact of U.S. tariffs against imports from China. Yet these tariffs have not been the primary cause of the ongoing global manufacturing and trade recessions. It appears that the headlines and many investors are looking at individual trees and ignoring the forest. Chart I-1Chinese Imports Are Worse Than Exports
Chinese Imports Are Worse Than Exports
Chinese Imports Are Worse Than Exports
Global trade contraction and China’s growth slump are not solely due to the trade tariffs imposed by the U.S. but rather stem from weakening domestic demand in China. Chart I-1 illustrates that Chinese aggregate exports are faring much better than imports. If the imposed tariffs were the main culprit behind both weakness in Chinese growth and global trade, mainland exports would have registered a far-greater hit by now than imports. However, they have not yet done so. This entails that U.S. tariffs have so far not had a substantial impact on Chinese and global manufacturing. The key point we would like to emphasize is that the current global trade downtrend has primarily been due to a contraction in Chinese imports. In turn, the accelerating decline in mainland imports is a reflection of relapsing domestic demand in China. The latter has been instigated by lethargic money/credit impulses owing to the government’s 2017-2018 deleveraging campaign and its reluctance to undertake an economy-wide irrigation type stimulus. What’s more, the recent RMB depreciation will likely intensify the Chinese import contraction already underway, as the same amount of yuan will buy less goods priced in U.S. dollars than before (Chart I-2). Given the majority of goods and commodities procured by mainland companies are priced in dollars, suppliers will receive fewer dollars, and their revenue derived from sales to and in China will continue to shrink (Chart I-3). Chart I-2RMB Depreciation Will Depress China's Purchases From Rest Of The World
RMB Depreciation Will Depress China's Purchases From Rest Of The World
RMB Depreciation Will Depress China's Purchases From Rest Of The World
Chart I-3China Is In A Recession From Perspective Of Its Suppliers
China Is In A Recession From Perspective Of Its Suppliers
China Is In A Recession From Perspective Of Its Suppliers
We do not deny that the trade war has prompted a deterioration in sentiment among Chinese businesses and consumers as well as multinational companies, which in turn has dented both their spending and global trade. We do not see these issues reversing anytime soon. If the imposed tariffs were the main culprit behind both weakness in Chinese growth and global trade, mainland exports would have registered a far-greater hit by now than imports. Chart I-4EM EPS Are Contracting
EM EPS Are Contracting
EM EPS Are Contracting
Even though U.S. President Donald Trump is flip-flopping on tariffs and their implementation, barring a major deal between the U.S. and China, business sentiment worldwide will not improve on a dime. In brief, delaying some import tariffs from September to December is unlikely to promote an imminent global trade recovery. The confrontation between the U.S. and China is profoundly not about trade: it is a geopolitical confrontation for global hegemony that will last years if not decades. Businesses in China and CEOs of multinational companies realize this, and they will not change their investment plans on Trump’s latest tweet delaying some tariffs. For now, we do not detect signs of an impending growth turnaround in China’s domestic demand and global trade. Therefore, China-related risk assets, commodities and global cyclicals are at risk of breaking down. Economic Rationale The global trade and manufacturing recession will linger for a while longer, and a recovery is not in the offing: The business cycle in EM/China continues to downshift. Consistently, corporate earnings are already or soon will be contracting in EM, China and the rest of emerging Asia (Chart I-4). EM corporate EPS contraction is broad-based (Chart I-5A and I-5B). The recent declines in oil and base metals prices entail earnings shrinkage for energy and materials companies (Chart I-5B, bottom two panels). Chart I-5AEM EPS Contraction Is Broad Based
EM EPS Contraction Is Broad Based
EM EPS Contraction Is Broad Based
Chart I-5BEM EPS Contraction Is Broad Based
EM EPS Contraction Is Broad Based
EM EPS Contraction Is Broad Based
China’s monetary and fiscal stimulus has not yet been sufficient to revive capital spending in general and construction activity in particular (Chart I-6). Chinese household spending is also exhibiting little signs of recovery (Chart I-7). Chart I-6China: Building Construction Is Dwindling
China: Building Construction Is Dwindling
China: Building Construction Is Dwindling
Chart I-7China: Consumer Spending Has Not Yet Recovered
China: Consumer Spending Has Not Yet Recovered
China: Consumer Spending Has Not Yet Recovered
Domestic demand continues to deteriorate, not only in China but also in other emerging economies, as we documented in our July 25 report. In EM ex-China, imports of capital goods and auto sales are contracting (Chart I-8). High-frequency freight data point to ongoing weakness in shipments in both the U.S. and China (Chart I-9). Chart I-8EM Ex-China: Domestic Demand Is Depressed
EM Ex-China: Domestic Demand Is Depressed
EM Ex-China: Domestic Demand Is Depressed
Bottom Line: The current global manufacturing and trade downturns will prove to be drawn out, and investors should be wary of betting on an impending recovery. This is BCA’s Emerging Markets Strategy view and is different from BCA’s house view which is anticipating an imminent global business cycle recovery. Chart I-9Global Freight Does Not Signal Recovery
Global Freight Does Not Signal Recovery
Global Freight Does Not Signal Recovery
Breakdown Watch Financial market segments sensitive to the global business cycle have been splintering at the edges. These cracks appear to be proliferating to the center and will render considerable damage to aggregate equity indexes. EM corporate EPS contraction is broad-based. We explained our rationale behind using long-term moving averages to identify significant breakouts and breakdowns in last week’s report. We also highlighted the numerous breakdowns that have already transpired. Today, we supplement the list: EM equity relative performance versus DM has fallen below its previous lows (Chart I-10, top panel). Crucially, emerging Asian stocks’ relative performance versus DM has clearly breached its 2015-2016 lows (Chart I-10, bottom panel). The KOSPI and Chinese H-share indexes have broken below their three-year moving averages (Chart I-11, top two panels). Chart I-10EM Equities Relative Performance Has Broken Down
EM Equities Relative Performance Has Broken Down
EM Equities Relative Performance Has Broken Down
Chinese bank stocks in particular have been responsible for dragging China’s H-share index lower (Chart I-11, bottom panel). In addition, Chinese small-cap stocks dropped below their December low, as have copper prices and our Risk-On versus Safe-Haven currency ratio1 (Chart I-12). Finally, German chemical and industrial share prices such as BASF, Siemens and ThyssenKrupp have decisively broken down (Chart I-13). Chart I-11Breakdowns In Korea And China...
Breakdowns In Korea And China...
Breakdowns In Korea And China...
Chart I-12...In Commodities Space As Well
bca.ems_wr_2019_08_15_s1_c12
bca.ems_wr_2019_08_15_s1_c12
Chart I-13German Manufacturing Stocks Are In Free Fall
German Manufacturing Stocks Are In Free Fall
German Manufacturing Stocks Are In Free Fall
This implies that Germany’s manufacturing slowdown is not limited to the auto sector but rather is pervasive. Besides, these companies are greatly exposed to China/EM demand, and their share prices simply reflect the ongoing slump in China/EM capital spending. There are several other market signals that are at a critical technical juncture, and their move lower will confirm our downbeat view on global growth and cyclical markets. In particular: The global stocks-to-U.S. Treasurys ratio has dropped to a critical technical line (Chart I-14, top panel). Failure to hold this defense line would signal considerable downside in global cyclical assets. Similarly, the Chinese stock-to-bond ratio – calculated using total returns of both the MSCI China All-Share index and domestic government bonds – has plunged. The path of least resistance for this ratio might be to the downside (Chart I-14, bottom panel). Given China is the epicenter of the global slowdown, this ratio is of vital importance. The lack of recovery in this ratio signifies lingering downside growth risks. Finally, global cyclical sectors’ relative performance versus defensive ones is sitting on its three-year moving average (Chart I-15). A move lower will qualify as a major breakdown and confirm the absence of a global manufacturing and trade recovery. Chart I-14Global Stocks-To-Bonds Ratio: Sitting On Edge
Global Stocks-To-Bonds Ratio: Sitting On Edge
Global Stocks-To-Bonds Ratio: Sitting On Edge
Chart I-15Global Cyclicals Versus Defensives: At A Critical Juncture
Global Cyclicals Versus Defensives: At A Critical Juncture
Global Cyclicals Versus Defensives: At A Critical Juncture
Bottom Line: Several important markets have already experienced technical breakdowns, and a few others are at risk of doing so. All in all, these provide us with confidence in maintaining our downbeat stance on EM risk assets and currencies. EM Bonds: The Last Shoe To Drop? Although EM share prices are back to their December lows, EM local currency and U.S. dollar bonds have done well this year, benefiting from the indiscriminate global bond market rally. However, there are limits to how far and for how long the performance of EM domestic and U.S. dollar bonds can diverge from EM stocks, currencies and commodities prices (Chart I-16). EM domestic bond yields have plunged close to the 2013 lows they touched prior to the Federal Reserve’s ‘Taper Tantrum’ selloff (Chart I-17, top panel). That said, on a total return basis in common currency terms, the GBI EM domestic bond index has not outperformed U.S. Treasurys, as shown in the bottom panel of Chart I-17. Chart I-16Which Way These Gaps Will Close?
Which Way These Gaps Will Close?
Which Way These Gaps Will Close?
Chart I-17EM Domestic Bonds: Poor Risk-Reward Profile
EM Domestic Bonds: Poor Risk-Reward Profile
EM Domestic Bonds: Poor Risk-Reward Profile
Looking forward, EM exchange rates remain critical to the returns of this asset class. With the GBI EM local currency bond index’s yield spread over five-year U.S. Treasurys at about 400 basis points, EM currencies have very little room to depreciate before foreign investors begin experiencing losses. We believe that further RMB depreciation, commodities prices deflation and EM exports contraction all bode ill for EM exchange rates. Consequently, we expect EM local bonds to underperform U.S. Treasurys of similar duration over the next several months. German chemical and industrial share prices such as BASF, Siemens and ThyssenKrupp have decisively broken down. Finally, the euro has begun rapid appreciation versus EM currencies. This will erode EM local bonds’ returns to European investors and trigger a period of outflows. Within this asset class, our overweights are Mexico, Russia, Central Europe, Chile, Korea and Thailand, while we continue to recommend underweight positions in the Philippines, Indonesia, Turkey, South Africa, Brazil, Argentina and Peru within an EM local currency bond portfolio. As to EM credit space (hard currency bonds), these markets are overbought, and investors positioning is heavy. EM currency depreciation and lower commodities prices typically herald widening spreads. Argentina has a large weight in the EM credit indexes, and the crash in Argentine markets could be a trigger for outflows from this asset class. Technically speaking, there are already several negative signposts. The excess returns on EM sovereign and corporate bonds seem to have rolled over, having failed to surpass their early 2018 highs (Chart I-18). Besides, EM sovereign CDS spreads are breaking out (Chart I-19, top panel). Chart I-18EM Credit Markets Is Toppy
EM Credit Markets Is Toppy
EM Credit Markets Is Toppy
Chart I-19EM Credit Space Is Entering Selloff
EM Credit Space Is Entering Selloff
EM Credit Space Is Entering Selloff
Finally, there are noticeable cracks in the emerging Asian corporate credit market. The price index of China’s high-yield property bonds – that account for a very large portion not only of the Chinese but also the emerging Asian corporate bond universes – has petered out at an important technical resistance level (Chart I-19, bottom panel). Further, the relative total return of emerging Asia’s investment-grade corporate bonds against their high-yield peers is correlated with Asia corporate spreads, and presently points to wider spreads (Chart I-20). The rationale is that periods when safer parts of the credit universe outperform the riskier ones are usually associated with widening credit spreads. China’s property market remains vulnerable as the central authorities in Beijing have not provided much housing-related stimulus in the current downtrend. Furthermore, companies in this space are overleveraged, generate poor cash flow and have limited access to credit. The euro has begun rapid appreciation versus EM currencies. This will erode EM local bonds’ returns to European investors and trigger a period of outflows. Overall, Chinese property developers will affect the EM credit space in two ways. First, their credit spreads will likely continue to shoot up, generating investor anxiety and outflows from this asset class. Second, reduced investment by debt-laden and cash-strapped property developers will inflict pain on industrial and materials companies in Asia and beyond. We discuss the outlook for steel, iron ore and coal, which are very exposed to Chinese construction, in the section below. Bottom Line: For asset allocators, we recommend underweighting EM sovereign and corporate credit versus U.S. investment grade, a strategy we have been advocating since August 16, 2017 (Chart I-21). For dedicated portfolios, the list of our overweights and underweights, as always, is presented at the end of the report (page 21). Chart I-20Emerging Asian Corporate Spreads Will Widen
Emerging Asian Corporate Spreads Will Widen
Emerging Asian Corporate Spreads Will Widen
Chart I-21Favor U.S. Investment Grade Versus EM Overall Credit
Favor U.S. Investment Grade Versus EM Overall Credit
Favor U.S. Investment Grade Versus EM Overall Credit
As for EM domestic bonds, we continue to recommend betting on yield declines in select countries without taking on currency risk. These include Korea, Chile, Mexico and Russia. We will warm up to this asset class in general when we alter our negative EM currency view. Arthur Budaghyan Chief Emerging Markets Strategist arthurb@bcaresearch.com Chinese Steel, Iron Ore And Coal Markets: Renewed Deflation Chart II-1Is Deflation In Steel And Coal Back?
Is Deflation In Steel And Coal Back?
Is Deflation In Steel And Coal Back?
Unlike 2015 when steel, iron ore and coal prices collapsed, in the current downturn they have so far held up reasonably well. They have begun falling only recently (Chart II-1). Even though we do not anticipate a 2015-type Armageddon in steel, iron ore and coal prices, they will deflate further due to supply outpacing demand in China. For both steel and coal, the pace of “de-capacity” reforms in China has diminished considerably, with declining shutdowns of inefficient capacity and rising advanced capacity, as we argued in a couple of reports last year. This has led to a faster growth in supply, while demand has been dwindling with weak economic growth. Lower steel, iron ore and coal prices will harm Chinese and global producers along with their respective countries.2 Steel And Iron Ore First, both crude steel and steel products output will likely grow at a pace of 5-7% (Chart II-2). As the 2016-2020 steel de-capacity target (150 million tons capacity reduction) was already achieved by the end of 2018, the scale of further shutdowns will be limited. In addition, collapsing graphite electrode prices reflect an increased supply of this material. This along with more availability of scrap steel will facilitate the continuing expansion of cleaner technology (electric furnace (EF)) steel capacity and their output in China. The newly added EF steel capacity is planned at about 21 million tons in 2019 (representing 1.8% of official aggregate steel production capacity), slightly lower than the 25 million tons in 2018. Second, we expect steel products demand to grow at 3-5%, slightly weaker than output. Construction accounts for about 55% of Chinese final steel demand, with about 35% stemming from the property market and 20% from infrastructure. The automotive sector contributes about 10% of final Chinese steel demand. All of these end markets are weak and do not yet show signs of revival (Chart II-3). Chart II-2Steel Production In China
Steel Production In China
Steel Production In China
Chart II-3No Recovery In Chinese Demand
No Recovery In Chinese Demand
No Recovery In Chinese Demand
Concerning iron ore price, we expect more downside than in steel. Supply disruptions among Brazilian and Australian producers were the main cause for the significant rally in iron ore prices this year. Evidence is that these producers have already resumed their output recovery. Current iron ore prices are still well above marginal production costs of major global iron ore producers. Besides, ongoing large currency depreciation in commodity producing countries will push down their marginal production costs in U.S. dollars terms. This will encourage further supply. As China has increased its use of scrap steel in its crude steel production, the country’s iron ore demand has not grown much. In fact, imports of this raw material have contracted (Chart II-4) As scrap steel prices are currently very low relative to the price of imported iron ore (Chart II-5), steel producers in China will continue to use scrap steel instead of iron ore. Chart II-4China's Imports Of Iron Ore Have Been Shrinking
China's Imports Of Iron Ore Have Been Shrinking
China's Imports Of Iron Ore Have Been Shrinking
Chart II-5Scrap Steel Is A Cheap Substitute For Iron Ore
Scrap Steel Is A Cheap Substitute For Iron Ore
Scrap Steel Is A Cheap Substitute For Iron Ore
Coal Chart II-6Coal Output Is Rising, But Beijing's Goal To Reduce Its Usage
Coal Output Is Rising, But Beijing's Goal To Reduce Its Usage
Coal Output Is Rising, But Beijing's Goal To Reduce Its Usage
Chinese coal prices will also be under downward pressure. First, coal output growth will likely slow but will still stand at 2-4% down from a current 6% level (Chart II-6, top panel). The government has set a production goal of 3900 million tons for 2020. Given last year’s output of 3680 million tons, this implies only a 2.9% annual growth rate this year and the next. Second, the demand for both thermal coal and coking coal will likely weaken. They account for 80% and 20% of total coal demand, respectively. About 60% of Chinese coal is used to generate thermal power. As the country continues to promote the use of clean energy, thermal power output growth will likely slow further. Increasing the nation’s reliance on clean energy is an imperative strategic objective for Beijing. Given that thermal coal still accounts for a whopping 70% of electricity production, China will maintain its effort on reducing coal in its energy mix (Chart II-6, bottom panel). In the same vein, the government will continue to replace coal with natural gas in home heating. Finally, Chinese coal import volumes are likely to decline as the nation is increasingly relying on its domestic sources. In particular, the strategic Menghua railway construction will be completed in October. It will be used to transport the commodity from large producers in the north to the coal-deficit provinces in the south. This will reduce the nation’s coal imports, as the transportation cost of shipping domestic coal to the southern power plants will become more competitive than imported coal. Macro And Investment Implications First, companies and economies producing these commodities will face deflationary pressures. These include - but are not limited to - Indonesia, Australia, Brazil and South Africa, as well as steel producers around the world. Second, the RMB depreciation will allow China to gain further market share in the global steel market. In fact, China’s share of global steel output has been rising (Chart II-7, top panel). The bottom panel of Chart II-7 shows that steel production in the world excluding China have actually come to a grinding halt at a time when mainland producers have enjoyed high output growth. Global steel stocks have broken down and global mining equities are heading into a breakdown (Chart II-8). Chart II-7China Has Been Gaining A Share In Global Steel Market
China Has Been Gaining A Share In Global Steel Market
China Has Been Gaining A Share In Global Steel Market
Chart II-8Breakdown In Steel And Mining Stocks
Breakdown In Steel And Mining Stocks
Breakdown In Steel And Mining Stocks
Finally, we remain bearish on commodities and other global growth sensitive currencies. In particular, we continue shorting the following basket of EM currencies against the U.S. dollar: ZAR, CLP, COP, IDR, MYR and KRW. Ellen JingYuan He, Associate Vice President ellenj@bcaresearch.com Footnotes 1 Average of CAD, AUD, NZD, BRL, CLP & ZAR total return (including carry) indices relative to average of JPY & CHF total returns. 2 This is BCA’s Emerging Markets Strategy view and is different from BCA’s house view. Equities Recommendations Currencies, Fixed-Income And Credit Recommendations
The recent performance of China’s domestic financial markets has been consistent with a timid credit response, and is not yet signaling a meaningful change in China’s policy stance. The A-share market has closely tracked China’s domestic credit growth over…
Scenario 1 (Bullish): Effects of Stimulus – Impact of Tariff Shock > 0 Scenario 2 (Bearish): Effects of Stimulus – Impact of Tariff Shock ≤ 0 In scenario 1, the impact of China’s reflationary efforts more than offsets the negative shock to aggregate…
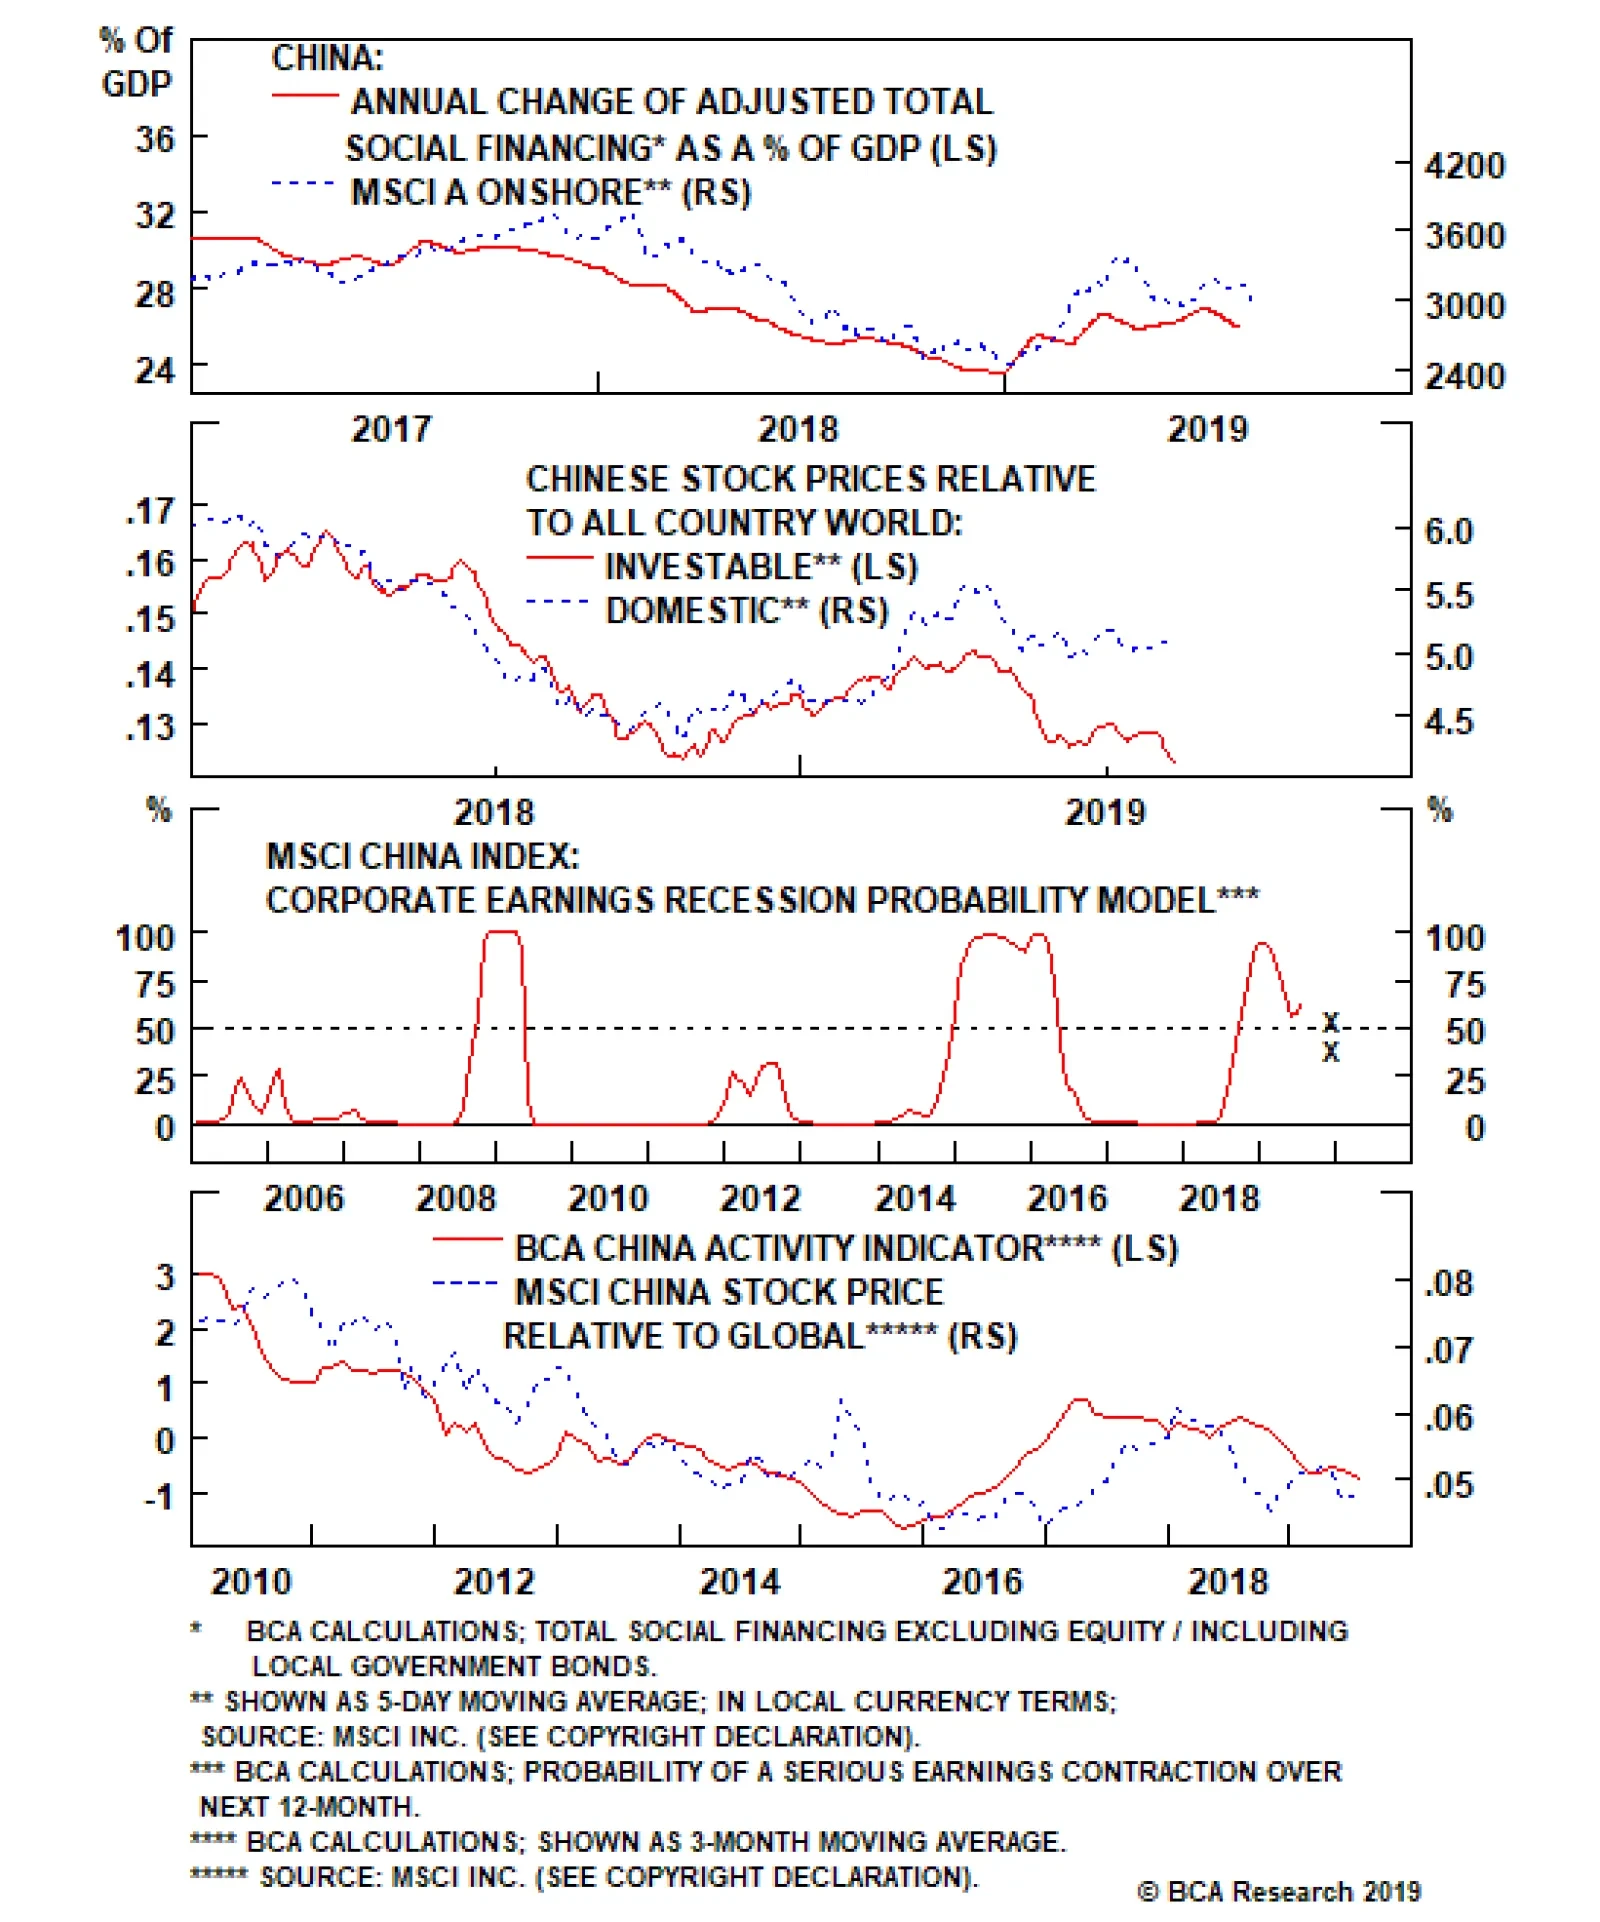
Highlights Economic data suggest the current business cycle in China has not yet reached a bottom. Stimulus measures have not been forceful enough to fully offset a slowing domestic economy and weakening global demand. With possibly more U.S. tariffs to come, intensifying political unrest in Hong Kong and a currency set to depreciate further, the potential downside risks outweigh any potential upside over the near term. Investors who are already positioned in favor of Chinese equities should stay long. We are still early in a credit expansionary cycle, and we expect further economic weakness to pave the way for more policy support in China. However, we recommend investors who are not yet invested in Chinese assets to remain on the sidelines until clearer signs of materially stronger stimulus emerge. Feature Chart 1A Breakdown In Chinese Stocks
A Breakdown In Chinese Stocks
A Breakdown In Chinese Stocks
Financial market volatility surged in the first half of the month following U.S. President Donald Trump’s recent tweet, vowing to impose a 10% tariff on the remaining $300 billion of U.S. imports of Chinese goods by September 1st. By the end of last week, prices of China investable stocks relative to global equities had nearly wiped out all their 2019 year-to-date gains. (Chart 1) The extent of the decline has left some investors wondering whether the time has come to bottom-fish Chinese assets. In our view, the answer is no. In this week’s report we detail five reasons why the near-term outlook for China-related assets remains negative. We remain bullish on Chinese stocks over the cyclical (i.e. 6-12 month) horizon and recommend investors who are already positioned in favor of China-related assets stay long. However, we also recommend investors who are not yet invested to remain on the sidelines until surer signs of materially stronger stimulus emerge. As we go to press, the U.S. Trade Representative Office announced that the Trump administration would delay imposing the 10% tariff on a series of consumer goods imported from China — including laptops and cell phones — until December.1 Stocks in the U.S. surged on the news. Today’s rally in the equity market highlights our view, that short-term market performance can be dominated and distorted by news on the trade front. However, market rallies based on headline news will not sustain without the support of economic fundamentals. Reason #1: Chinese Economic Growth Has Not Yet Bottomed In a previous China Investment Strategy report,2 we presented some simple arithmetic to help investors formulate their outlook on the Chinese economy. We argued that in a full-tariff scenario, investors should focus on the likely outcome of one of the two following possibilities: Scenario 1 (Bullish): Effects of Stimulus – Impact of Tariff Shock > 0 Scenario 2 (Bearish): Effects of Stimulus – Impact of Tariff Shock ≤ 0 In scenario 1, the impact of China’s reflationary efforts more than offsets the negative shock to aggregate demand from the sharp decline in exports to the U.S. Scenario 2 denotes an outcome where China’s reflationary response is not larger than the magnitude of the shock. For now, we remain in scenario 2 due to Chinese policymakers’ continual reluctance to allow the economy to re-leverage. The magnitude of the credit impulse so far has been “half measured” relative to previous cycles.3 More than seven months into the current credit expansionary cycle, Chinese economic data have not yet exhibited a clear bottom. As a result, more than seven months into the current credit expansionary cycle, Chinese economic data have not yet exhibited a clear bottom, with the main pillars supporting China’s “old economy” still in the doldrums (Chart 2 and Chart 3). Chart 2No Clear Bottom, Yet
No Clear Bottom, Yet
No Clear Bottom, Yet
Chart 3Key Economic Drivers Struggling To Trend Higher
Key Economic Drivers Struggling To Trend Higher
Key Economic Drivers Struggling To Trend Higher
In addition to a weakening domestic economy, China’s external sector has been weighed down by U.S. import tariffs as well as slowing global demand. (Chart 4). The possibility of adding a 10% tariff by year end on the remaining $300 billion of Chinese goods exports to the U.S. may trigger another tariff “front-running” episode in the 3rd quarter. However, Chart 5 and Chart 6 highlight that any front-running would be against the backdrop of sluggish global demand. Therefore, not only the upside in Chinese export growth will be very limited in the subsequent months following the front-running, but export growth is also likely to fall deeper into contraction. Chart 4Domestic Demand More Concerning Than Exports
Domestic Demand More Concerning Than Exports
Domestic Demand More Concerning Than Exports
Chart 5Pickup In Global Demand Not Yet Visible
Pickup In Global Demand Not Yet Visible
Pickup In Global Demand Not Yet Visible
Chart 6Bottoming In Global Manufacturing Also Delayed
Bottoming In Global Manufacturing Also Delayed
Bottoming In Global Manufacturing Also Delayed
Reason # 2: A-Shares Are Not Yet Signaling A Sizeable Policy Response
Chart 7
In previous China Investment Strategy reports, we have written at length about how Chinese policymakers are reluctant to undo their financial deleveraging efforts and push for more stimulus. After incorporating July credit data, our credit impulse, at a very subdued 26% of nominal GDP, was in fact a pullback from June’s credit growth number (Chart 7). This confirms our view that the current stimulus is clearly falling short compared to the 2015-2016 credit expansionary cycle. It underscores Chinese policymakers’ commitment to keep their foot off the stimulus pedal. What’s more, the recent performance of China’s domestic financial markets has been consistent with a half-measured credit response, and is not yet signaling a meaningful change in China’s policy stance. The A-share market since last summer has been trading off of the likely policy response to the trade war. Chart 8Market Not Signaling Significant Policy Shift
Market Not Signaling Significant Policy Shift
Market Not Signaling Significant Policy Shift
Chart 8 (top panel) shows that the A-share market has closely tracked China’s domestic credit growth over the past year. Given this, we believe that the A-share market is reacting more to the likely policy response to the trade war, in contrast to the investable market which rises and falls in near-lockstep with trade-related news (middle panel). The fact that A-share stocks have been trending sideways underscores that China’s domestic equity market continues to expect “half measured” stimulus. This week’s sharp decline in China’s 10-year government bond yield is in part related to escalating political unrest in Hong Kong (bottom panel), and in our view does not yet signal any major change in the PBOC’s stance. Finally, our corporate earnings recession probability model provides another perspective on the equity market implications of the current path of stimulus. If the current size of stimulus holds through the end of 2019, our model suggests that the probability of an outright contraction in corporate earnings lasting through year end remains quite elevated, at close to 50% (first X in Chart 9). The July Politburo statement signaled a greater willingness to stimulate the economy; as a result, we are penciling in a slightly more optimistic scenario on forthcoming credit growth through the remainder of the year, by adding 300 billion yuan of debt-to-bond swaps4 and 800 billion yuan of extra infrastructure spending5 to our baseline estimate for the rest of 2019. However, this would only add a credit impulse equivalent of 1 percentage point of nominal GDP and would only marginally reduce the probability of an earnings recession to 40% (second X in Chart 9). A 40% chance of an earnings recession is well above “normal” levels that would be consistent with a durable uptrend in stock prices, and in previous cycles, Chinese stock prices picked up only after business cycles and corporate earnings had bottomed (Chart 10). In sum, the current pace of credit growth, signals from the domestic equity market, and our earnings recession model all suggest that it is too early to bottom fish Chinese stocks. Chart 9A "Measured" Pickup in Stimulus Will Not Be A Game Changer
A "Measured" Pickup in Stimulus Will Not Be A Game Changer
A "Measured" Pickup in Stimulus Will Not Be A Game Changer
Chart 10Too Early To Bottom Fish
Too Early To Bottom Fish
Too Early To Bottom Fish
Reason #3: The Trade War Is Far From Over Our Geopolitical Strategy team maintains that the U.S. and China have only a 40% chance of concluding a trade agreement by November 2020, and that any trade truce is likely to be shallow.6 We agree with this assessment, which has clear negative near-term implications for Chinese investable stocks, even if temporary rallies such as what took place yesterday periodically occur. Since the onset of the trade war, Chinese investable stocks appear to have traded nearly entirely in reaction to trade-related events. Hence, until global investors are given proof that much stronger stimulus can and will offset the impact of the trade war on corporate earnings, Chinese stocks are likely to continue to underperform their global peers. Reason #4: The Hong Kong Crisis Is A Near-Term Risk Another near-term catalyst for financial market turbulence in China is the worsening situation in Hong Kong. For now, we hold the view that a full-blown crisis (i.e. China intervening with military force) can be avoided, but we are not ruling out the possibility of a severe escalation or its potential impact on market sentiment towards Chinese assets. On the surface, China investable stocks (the MSCI China Index, the predominantly investable index that now includes some mainland A-shares) are not directly linked to businesses in Hong Kong: Out of the top 10 constituents of the MSCI China Index, which account for roughly 50% of the index’s market capitalization, seven are headquartered in mainland China and do not appear to have significant revenue exposure to Hong Kong. By contrast, at least 30% of Hang Seng Index-listed companies have business operations in Hong Kong. The remaining three companies in the top 10 MSCI China Index are Tencent (the largest component of the index, with a weight of approximately 15%), Ping An Insurance (4% weight), and China Mobile (3% weight) – all of which registered large losses in the past week. Both Tencent and Ping An Insurance are headquartered in Shenzhen, a southeastern China metropolis that links Hong Kong to mainland China. China Mobile appears to have the most revenue exposure to Hong Kong of any top constituent through its CMHK subsidiary, which is the largest telecommunications provider in Hong Kong. It is true that there has been little evidence so far that Chinese investable stocks have been more impacted by the escalation in political unrest in Hong Kong than by the escalation in the trade war. Indeed, the fact that the two escalations were overlapping this past week makes it difficult to isolate their effects. But if unrest in Hong Kong spirals out of control, it could result in mainland China intervening. According to an analysis done by BCA’s Geopolitical Strategy team,6 the deployment of mainland troops would likely lead to casualties and could trigger sanctions from western countries. The 1989 Tiananmen Square incident shows that such an event could lead to a non-negligible hit to domestic demand and foreign exports under sanctions. Should this to occur, the near-term idiosyncratic risk to Chinese stocks in both onshore and offshore markets will be significant. Reason #5: Further RMB Depreciation May Weigh On Stock Prices Whether due to manipulation or market forces, last week’s depreciation in the Chinese currency (RMB) was economically justified and long overdue. Chart 11RMB Depreciation Long Overdue
RMB Depreciation Long Overdue
RMB Depreciation Long Overdue
Chart 11 shows the close relationship between the U.S.-China one-year swap rate differential and the USD/CNY exchange rate. The true source of the correlation shown in the chart remains somewhat of a mystery, given that Chinese capital controls, particularly following the 2015 devaluation episode, prevent the arbitrage activities that link rate differentials and exchange rates in economies with fully open capital accounts. However, Chart 11 clearly shows that China’s currency would have already weakened by now if it was fully market-driven, and we do not believe that the People’s Bank of China will be inclined to tighten monetary policy in order to reverse the recent devaluation. Hence, the path of least resistance for the CNY is further depreciation. If the threatened 10% tariff on all remaining U.S. imports from China is imposed this year, our back-of-the-envelope calculation based on Chart 12 suggests that a market-driven “equilibrium” USD/CNY exchange rate should be at around 7.6. We have high conviction, based on previous RMB devaluation episodes, that China’s central bank will not allow its currency to depreciate in a manner that invites speculation of meaningful further weakness – meaning we are not likely to see a straight-lined or rapid depreciation down to the 7.6 mark. Chart 12Market Driven 'Equilibrium' Provides Some Guidance On The Exchange Rate
Market Driven 'Equilibrium' Provides Some Guidance On The Exchange Rate
Market Driven 'Equilibrium' Provides Some Guidance On The Exchange Rate
A “managed” currency depreciation is in and of itself stimulative for the Chinese economy. At the same time, aggressive market intervention via the PBoC burning through its foreign exchange reserves is also unlikely: A “managed” currency depreciation is in and of itself stimulative for the economy. It improves Chinese export goods’ price competitiveness and helps mitigate some of the pain caused by increased tariffs. Therefore it is in the PBoC’s every interest to allow such depreciation. However, no matter how “orderly” RMB depreciation may be, the fact that the PBoC has signaled it is no longer defending a “line in the sand” exchange-rate mark is likely to trigger another round of “race to the bottom” currency devaluation from other regional, export-dependent economies.7 A weaker RMB and emerging market currencies will also contribute to USD strength. A strong dollar has been negatively correlated with global risky assets, implying that for a time, a weaker RMB will be a risk-off event for risky assets and thus presumably for Chinese and EM equity relative performance. Investment Implications Our analysis above highlights that the near-term outlook for Chinese stocks is fraught with risk, and it is for this reason that we recommended an underweight tactical position in Chinese stocks for the remainder of the year in our July 24 Weekly Report.8 However, by next summer (the tail-end of our cyclical investment horizon), it is our judgement that one of two things will have likely occurred: The trade war with the U.S. will have abated or been called off, and investors will have determined that a “half-strength” credit cycle is likely enough to stabilize Chinese domestic demand and the earnings outlook. In this scenario, Chinese stocks are likely to rise US$ terms over the coming year, relative to global stocks. The trade war with the U.S. will have continued, and Chinese policymakers will have acted on the need to stimulate aggressively further in order to stabilize domestic demand. In combination with an ultimately stimulative (although near-term negative) decline in the RMB, the relative performance of Chinese stocks versus the global benchmark will likely be higher in hedged currency terms. Because of the near-term risks to the outlook, we agree that investors who are not yet invested should remain on the sidelines until surer signs of materially stronger stimulus emerge. But investors who are already positioned in favor of Chinese equities should stay long, and should bet on the latter scenario: rising relative Chinese equity performance in local currency terms, alongside a falling CNY-USD / appreciating USD-CNY exchange rate. Jing Sima China Strategist JingS@bcaresearch.com Footnotes 1 “US to delay some tariffs on Chinese goods”, Financial Times, August 13, 2019. 2 Please see China Investment Strategy Weekly Report, “Simple Arithmetic”, dated May 15, 2019, available at cis.bcaresearch.com. 3 Please see China Investment Strategy Weekly Reports, “Threading A Stimulus Needle (Part 1): A Reluctant PBoC”, dated July 10, 2019, and “Threading A Stimulus Needle (Part 2): Will Proactive Fiscal Policy Lose Steam?”, dated July 24, 2019, available at cis.bcaresearch.com. 4 The remaining of 14 trillion debt-to-bond swap program rounds up to 315 billion yuan. 5 The relaxed financing requirement for infrastructure projects can add 800 billion yuan. 6 Please see Geopolitical Strategy Weekly Report, “The Rattling Of Sabers”, dated August 9, 2019, available at gps.bcaresearch. 7 Please see Emerging Markets Strategy Weekly Report, “The RMB: Depreciation Time?”, dated May 23, 2019, available at ems.bcaresearch.com. 8 Please see China Investment Strategy Weekly Report, Threading A Stimulus Needle (Part 2): Will Proactive Fiscal Policy Lose Steam?”, dated July 24, 2019, available at cis.bcaresearch.com. Cyclical Investment Stance Equity Sector Recommendations