China
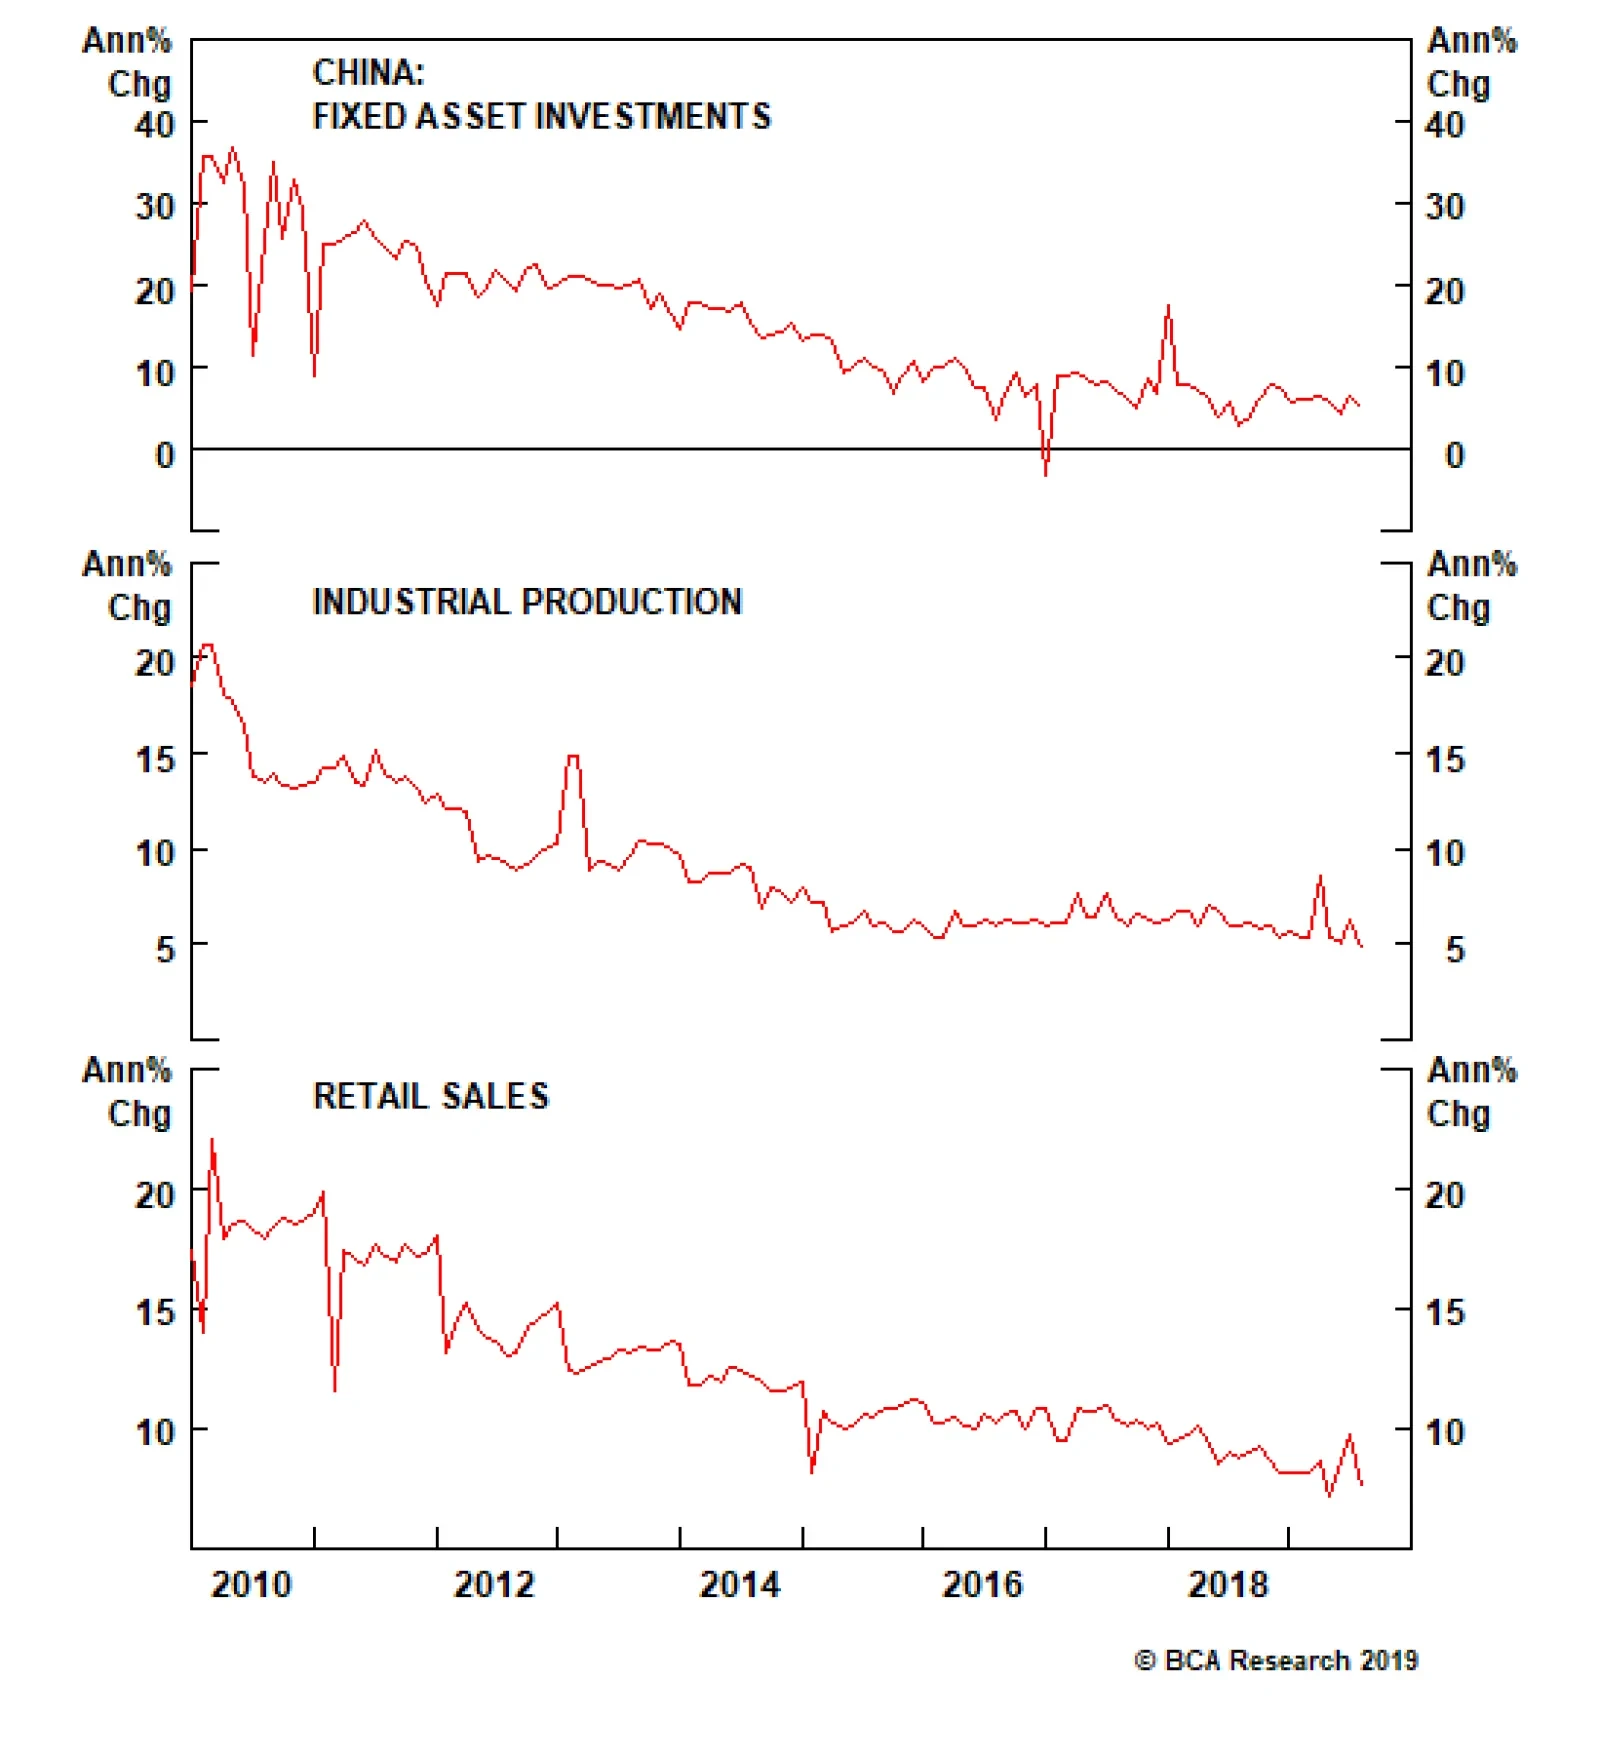
Whether it was the weak credit data released on Monday, or the fixed asset investments, industrial production and retail sales numbers that came out overnight, it is clear that the Chinese economy is not showing any improvements. China is suffering from…
Neither the U.S. nor China would gain from a prolonged trade war. This does not mean that a “World War I” scenario, where all parties end up severely worse off from their actions, can be completely excluded. However, it does mean that powerful forces will…
For the Chinese, it is not just a matter of losing access to the vast U.S. market. It’s also about losing access to vital technologies that China needs to further its ambitions in everything from robotics, to AI, to genomics. From Trump’s perspective, a…

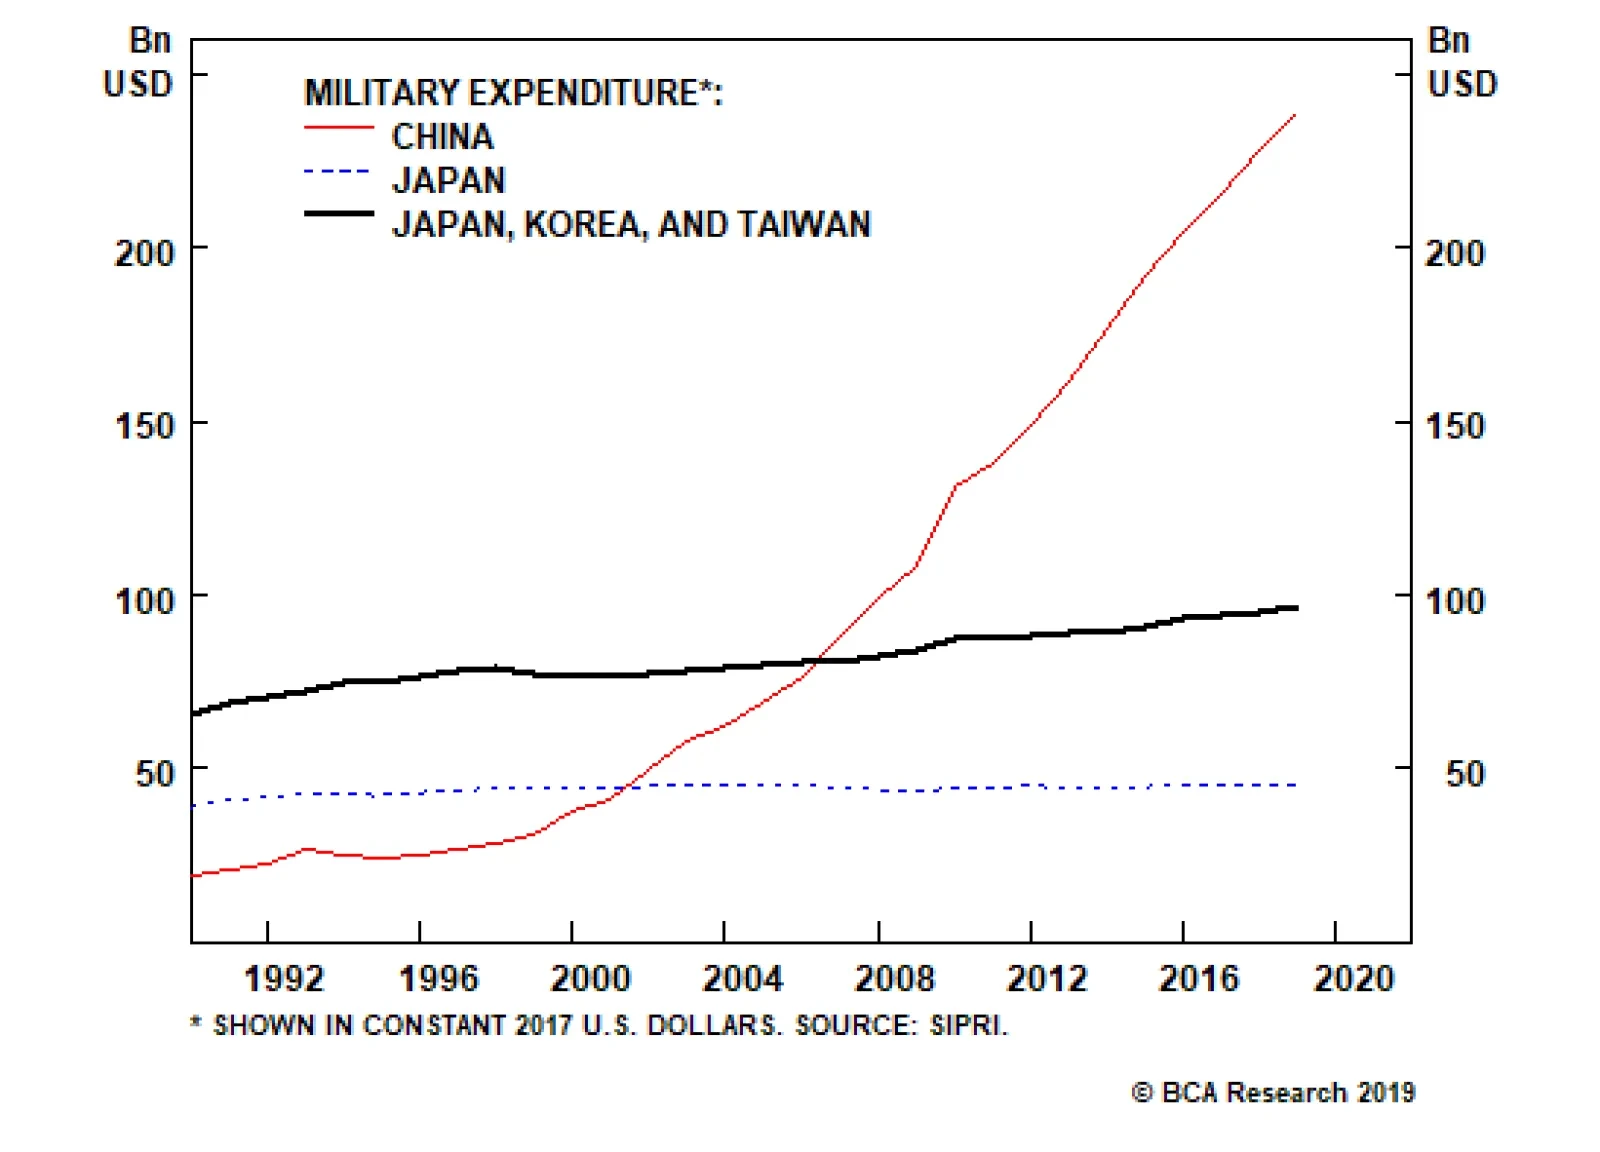
Dear Client, Instead of our regular report, this week we are sending you a Special Report penned by Matt Gertken, Chief Geopolitical Strategist of our sister Geopolitical Strategy service, titled “The Polybius Solution.” In this report Matt argues that a full-fledged cold war with China would put a cap on American political polarization, putting China at a disadvantage. By contrast, a U.S. war with Iran would exacerbate polarization, giving China a huge strategic opportunity. We trust that you will find this Special Report useful and insightful. Best regards, Anastasios Avgeriou, U.S. Equity Strategist Highlights So What? U.S.-Iran risk is front-loaded, but U.S.-China is the greater risk overall. A full-fledged cold war with China will put a cap on American political polarization, putting China at a disadvantage. By contrast, a U.S. war with Iran would exacerbate polarization, giving China a huge strategic opportunity. War with Iran or trade war escalation with China are both ultimately dollar bullish – even though tactically the dollar may fall. Feature The idea of the “Thucydides Trap” has gone viral in recent years – for good reason. The term, coined by Harvard political scientist Graham Allison, refers to the ancient Greek historian Thucydides (460-400 BC), author of the seminal History of the Peloponnesian War. The “trap” is the armed conflict that most often develops when a dominant nation that presides over a particular world order (e.g. Sparta, the U.S.) faces a young and ambitious rival that seeks fundamental change to that order (e.g. Athens, China).1 This conflict between an “established” and “revisionist” power was highlighted by the political philosopher Thomas Hobbes in his translation of Thucydides in the seventeenth century; every student of international relations knows it. Allison’s contribution is the comparative analysis of various Thucydides-esque episodes in the modern era to show how today’s U.S.-China rivalry fits the pattern. The implication is that war (not merely trade war) is a major risk. We have long held a similar assessment of the U.S.-China conflict. It is substantiated by hard data showing that China is gaining on America in various dimensions of power (Chart 1). Assuming that the U.S. does not want to be replaced, the current trade conflict will metastasize to other areas. If the U.S. and China really engage in an epic conflict, American political polarization should fall. There is an important but overlooked corollary to the Thucydides Trap: if the U.S. and China really engage in an epic conflict, American political polarization should fall. Polarization fell dramatically during the Great Depression and World War II and remained subdued throughout the Cold War. It only began to rise again when the Soviet threat faded and income inequality spiked circa 1980. Americans were less divided when they shared a common enemy that posed an existential threat; they grew more divided when their triumph proved to benefit some disproportionately to others (Chart 2). Chart 1China Is Gaining On The U.S.
China Is Gaining On The U.S.
China Is Gaining On The U.S.
Chart 2U.S. Polarization Falls During Crisis
U.S. Polarization Falls During Crisis
U.S. Polarization Falls During Crisis
If the U.S. and China continue down the path of confrontation, a similar pattern is likely to emerge in the coming years – polarization is likely to decline. China possesses the raw ability to rival or even supplant the United States as the premier superpower over the very long run. Its mixed economy is more sustainable than the Soviet command economy was, and it is highly integrated into the global system, unlike the isolated Soviet bloc. As long as China’s domestic demand holds up and Beijing does not suppress its own country’s technological and military ambitions, Trump and the next president will face a persistent need to respond with measures to limit or restrict China’s capabilities. Eventually this will involve mobilizing public opinion more actively. Further, if the U.S.-China conflict escalates, it will clarify U.S. relations with the rest of the world. For instance, Trump’s handling of trade suggests that he could refrain from trade wars with American allies to concentrate attention on China, particularly sanctions on its technology companies. Meanwhile a future Democratic president would preserve some of these technological tactics while reinstituting the multilateral approach of the Barack Obama administration, which launched the “Pivot to Asia,” the Trans-Pacific Partnership, and intensive freedom of navigation operations in the South China Sea. These are all aspects of a containment strategy that would reinforce China’s rejection of the western order. Bottom Line: If the White House, any White House, were to pursue a consistent strategy to contain China, the result would be a major escalation of the trade conflict that would bring Americans together in the face of a common enemy. It would also encourage the U.S. to form alliances in pursuit of this objective. So far these things have not occurred, but they are logical corollaries of the Thucydides Trap and they will occur if the Thucydides thesis is validated. How Would China Fare In The Thucydides Trap? China would be in trouble in this scenario. The United States, if the public unifies, would have a greater geopolitical impact than it currently does in its divided state. And a western alliance would command still greater coercive power than the United States acting alone (Chart 3). External pressure would also exacerbate China’s internal imbalances – excessive leverage, pollution, inefficient state involvement in the economy, poor quality of life, and poor governance (Chart 4). China has managed to stave off these problems so far because it has operated under relative American and western toleration of its violations of global norms (e.g. a closed financial system, state backing of national champions, arbitrary law, censorship). This would change under concerted American, European, and Japanese efforts. Chart 3China Fears A Western 'Grand Alliance'
China Fears A Western 'Grand Alliance'
China Fears A Western 'Grand Alliance'
Chart 4China's Domestic Risks Underrated
China's Domestic Risks Underrated
China's Domestic Risks Underrated
Concerted external pressure would make it harder for China to manage its internal imbalances. How would the Communist Party respond? First, it could launch long-delayed and badly needed structural reforms and parlay these as concessions to the West. The ramifications would be negative for Chinese growth on a cyclical basis but positive on a structural basis since the reforms would lift productivity over the long run – a dynamic that our Emerging Markets Strategy has illustrated, in a macroeconomic context, in Diagram 1. This is already an option in the current trade war, but China has not yet clearly chosen it – likely because of the danger that the U.S. would exploit the slowdown. Diagram 1Foreign Pressure And Structural Reform = Short-Term Pain For Long-Term Gain
The Polybius Solution
The Polybius Solution
Alternatively the Communist Party could double down on confrontation with the West, as Russia has done. This would strengthen the party’s grip but would be negative for growth on both a cyclical and structural basis. The effectiveness of China’s fiscal-and-credit stimulus would likely decline because of a drop in private sector activity and sentiment – already a nascent tendency – while the lack of “reform and opening up” would reduce long-term growth potential. This option makes structural reforms look more palatable – but again, China has not yet been forced to make this choice. None of the above is to say that the West is destined to win a cold war with China, but rather that the burden of revolutionizing the global order necessarily falls on the country attempting to revolutionize it. Bottom Line: If the Thucydides Trap fully takes effect, western pressure on China’s economy will force China into a destabilizing economic transition. China could lie low and avoid conflict in order to undertake reforms, or it could amplify its aggressive foreign policy. This is where the risk of armed conflict rises. Introducing … The Polybius Solution The problem with the above is that there is no sign of polarization abating anytime soon in the United States. Extreme partisanship makes this plain (Chart 5). Rising polarization could prevent the U.S. from responding coherently to China. The Thucydides Trap could be avoided, or delayed, simply because the U.S. is distracted elsewhere. The most likely candidate is Iran.
Chart 5
A lesser known Greek historian – who was arguably more influential than Thucydides – helps to illustrate this alternative vision for the future. This is Polybius (208-125 BC), a Greek who wrote under Roman rule. He described the rise of the Roman Empire as a result of Rome’s superior constitutional system. Polybius explains domestic polarization whereas Thucydides explains international conflict. Polybius took the traditional view that there were three primary virtues or powers governing human society: the One (the king), the Few (the nobles), and the Many (the commons). These powers normally ran the country one at a time: a dictator would die; a group of elites would take over; this oligarchy would devolve into democracy or mob-rule; and from the chaos would spring a new dictator. His singular insight – his “solution” to political decay – was that if a mixture or balance of the three powers could be maintained, as in the Roman republic, then the natural cycle of growth and decay could be short-circuited, enabling a regime to live much longer than its peers (Diagram 2). Diagram 2Polybius: A Balanced Political System Breaks The Natural Cycle Of Tyranny And Chaos
The Polybius Solution
The Polybius Solution
In short, just as post-WWII economic institutions have enabled countries to reduce the frequency and intensity of recessions (Chart 6), so Polybius believed that political institutions could reduce the frequency and intensity of revolutions. Eventually all governments would decay and collapse, but a domestic system of checks and balances could delay the inevitable. Needless to say, Polybius was hugely influential on English and French constitutional thinkers and the founders of the American republic. Chart 6Orthodox Economic Policy Has Made Recessions Less Frequent And Less Acute
Orthodox Economic Policy Has Made Recessions Less Frequent And Less Acute
Orthodox Economic Policy Has Made Recessions Less Frequent And Less Acute
What is the cause of constitutional decay, according to Polybius? Wealth, inequality, and corruption, which always follow from stable and prosperous times. “Avarice and unscrupulous money-making” drive the masses to encroach upon the elite and demand a greater share of the wealth. The result is a vicious cycle of conflict between the commons and the nobles until either the constitutional system is restored or a democratic revolution occurs. Compared to Thucydides, Polybius had less to say about the international balance of power. Domestic balance was his “solution” to unpredictable outside events. However, states with decaying political systems were off-balance and more likely to be conquered, or to overreach in trying to conquer others. Bottom Line: The “Polybius solution” equates with domestic political balance. Balanced states do not allow the nation’s leader, the elite, or the general population to become excessively powerful. But even the most balanced states will eventually decline. As they accumulate wealth, inequality and corruption emerge and cause conflict among the three powers. Why Polybius Matters Today It does not take a stretch of the imagination to apply the Polybius model to the United States today. Just as Rome grew fat with its winnings from the Punic Wars and decayed from a virtuous republic into a luxurious empire, as Polybius foresaw, so the United States lurched from victory over the Soviet Union to internal division and unforced errors. For instance, the budget surplus of 2% of GDP in the year 2000 became a budget deficit of 9% of GDP after a decade of gratuitous wars, profligate social spending and tax cuts, and financial excesses. It is on track to balloon again when the next recession hits – and this is true even without any historic crisis event to justify it. U.S. polarization is contaminating foreign policy. The rise in polarization has coincided with a rise in wealth inequality, much as Polybius would expect (Chart 7). In all likelihood the Trump tax cuts will exacerbate both of these trends (Chart 8). Even worse, any attempts by “the people” to take more wealth from the “nobles” will worsen polarization first, long before any improvements in equality translate to a drop in polarization. Chart 7Polarization Unlikely To Drop While Inequality Rises
Polarization Unlikely To Drop While Inequality Rises
Polarization Unlikely To Drop While Inequality Rises
Chart 8Trump Tax Cuts Fuel Inequality
Trump Tax Cuts Fuel Inequality
Trump Tax Cuts Fuel Inequality
Most importantly, from a global point of view, U.S. polarization is contaminating foreign policy. Just as the George W. Bush administration launched a preemptive war in Iraq, destabilizing the region, so the Obama administration precipitously withdrew from Iraq, destabilizing the region. And just as the Obama administration initiated a hurried détente with Iran in order to leave Iraq, the Trump administration precipitously withdrew from this détente, provoking a new conflict with Iran and potentially destabilizing Iraq. Major foreign policy initiatives have been conducted, and revoked, on a partisan basis under three administrations. And a Democratic victory in 2020 would result in a reversal of Trump’s initiatives. In the meantime Trump’s policy could easily entangle him in armed conflict with Iran – as nearly occurred on June 21. Iranian domestic politics make it very difficult, if not impossible, to go back to the 2015 setting. Despite Trump’s recent backpedaling, his administration runs a high risk of getting sucked into another Middle Eastern quagmire as long as it enforces the sanctions on Iranian oil stringently. China would be the big winner if such a war occurred, just as it was one of the greatest beneficiaries of the long American distraction in Afghanistan and Iraq. It would benefit from another 5-10 years of American losses of blood and treasure. It would be able to pursue regional interests with less Interference and could trade limited cooperation with the U.S. on Iran for larger concessions elsewhere. And a nuclear-armed Iran – which is a long-term concern for the U.S. – is not in China’s national interest anyway. Bottom Line: The U.S. is missing the “Polybius solution” of balanced government; polarization is on the rise. As a result, the grand strategy of “pivoting to Asia” could go into reverse (Chart 9). If that occurs, the conflict with China will be postponed or ineffective. Chart 9Will The Pivot To Asia Reverse?
Will The Pivot To Asia Reverse?
Will The Pivot To Asia Reverse?
Iran Is The Wild Card If the U.S. gets bogged down in the Middle East yet again, the “Pivot To Asia” will go into reverse and the “Thucydides Trap” with China will be delayed. A war with Iran manifestly runs afoul of the Trump administration’s and America’s national interests, whereas a trade war with China does not. First, although an Iranian or Iranian-backed attack on American troops would give Trump initial support in conducting air strikes, the consequences of war would likely be an oil price shock that would sink his approval rating over time and reduce his chances of reelection (Chart 10). We have shown that such a shock could come from sabotage in Iraq as well as from attacks on shipping in the Strait of Hormuz. Iran could be driven to attack if it believes the U.S. is about to attack. Second, not only would Democrats oppose a war with Iran, but Americans in general are war-weary, especially with regard to the Middle East (Chart 11). President Trump capitalized on this sentiment during his election campaign, especially in relation to Secretary Hillary Clinton who supported the war in Iraq. Over the past two weeks, he has downplayed the Iranian-backed tanker attacks, emphasized that he does not want war, and has ruled out “boots on the ground.” Chart 10Carter Gained Then Lost From Iran Oil Shock
Carter Gained Then Lost From Iran Oil Shock
Carter Gained Then Lost From Iran Oil Shock
Chart 11
Third, it follows from the above that, in the event of war, the United States would lack the political will necessary to achieve its core strategic objectives, such as eliminating Iran’s nuclear program or its power projection capabilities. And these are nearly impossible to accomplish from the air alone. And U.S. strategic planners are well aware that conflict with Iran will exact an opportunity cost by helping Russia and China consolidate spheres of influence. The wild card is Iran. President Hassan Rouhani has an incentive to look tough and push the limits, given that he was betrayed on the 2015 deal. And the regime itself is probably confident that it can survive American air strikes. American military strikes are still a serious constraint, but until the U.S. demonstrates that it is willing to go that far, Iran can test the boundaries. In doing so it also sends a message to its regional rivals – Saudi Arabia, the Gulf Arab monarchies, and Israel – that the U.S. is all bark, no bite, and thus unable to protect them from Iran. This may lead to a miscalculation that forces Trump to respond despite his inclinations. The China trade war, by contrast, is less difficult for the Trump administration to pursue. There is not a clear path from tariffs to economic recession, as with an oil shock: the U.S. economy has repeatedly shrugged off counter-tariffs and the Fed has been cowed. While Americans generally oppose the trade war, Trump’s base does not, and the health of the overall economy is far more important for most voters. And a majority of voters do believe that China’s trade practices are unfair. Strategic planners also favor confronting China – unlike Trump they are not concerned with reelection, but they recognize that China’s advantages grow over time, including in critical technologies. Bottom Line: While the media and market focus on China and Iran risks can alternate in the short run, the Trump administration is likely to continue downgrading the conflict with Iran and upgrading the conflict with China over the next six-to-18 months. Neither politics nor grand strategy support a war with Iran, whereas politics might support a trade war with China and grand strategy almost certainly does. China Could Learn From Polybius Too China also lacks the Polybius solution. It suffers from severe inequality and social immobility, just like the Latin American states and the U.S., U.K., and Italy (Chart 12). But unlike the developed markets, it lacks a robust constitutional system. Political risks are understated given the emergence of the middle class, systemic economic weaknesses, and poor governance. Over the long run, Xi Jinping will need to step down, but having removed the formal system for power transition, a succession crisis is likely.
Chart 12
China’s imbalances could cause domestic instability even if the U.S. becomes distracted by conflict in the Middle East. But China has unique tools for alleviating crises and smoothing out its economic slowdown, so the absence of outside pressure will probably determine its ability to avoid a painful economic slump. China also lacks the “Polybius solution” of balanced government – and it even lacks a robust constitutional system. This helps to explain China’s interest in dealing with the U.S. on North Korea. President Xi Jinping’s first trip to Pyongyang late last month helped pave the way for President Trump to resume negotiations with the North’s leader Kim Jong Un at the first-ever visit of an American president north of the demilitarized zone (DMZ). China does not want an unbridled nuclear North Korea or an American preventative war on the peninsula. If Beijing could do a short-term deal with the U.S. on the basis of assistance in reining in North Korea’s nuclear and missile programs, it could divert U.S. animus away from itself and encourage the U.S. to turn its attention toward the next rogue nuclear aspirant, Iran. It would also avoid structural economic concessions. Of course, a smooth transition today means short-term gain but long-term pain for Chinese and global growth. Productivity and potential GDP will decline if China does not reform (Diagram 3). But this kind of transition is the regime’s preferred option since Beijing seeks to minimize immediate threats and maintain overall stability. Diagram 3Stimulus And Delayed Reforms = Socialist Put = Stagflation
The Polybius Solution
The Polybius Solution
If Chinese internal divisions do flare up, China’s leaders will take a more aggressive posture toward its neighbors and the United States in order to divert public attention and stir up patriotic support. Bottom Line: China suffers from understated internal political risk. While U.S. political divisions could lead to a lack of coherent strategy toward China, a rift in China could lead to Chinese aggression in its neighborhood, accelerating the Thucydides Trap. Investment Conclusions If the U.S. reverses the pivot to Asia, attacks Iran, antagonizes European allies, and exhausts its resources in policy vacillation, its budget deficit will balloon (Chart 13), oil prices will rise, and China will be left to manage its economic transition without a western coalition against it. The implication is a weakening dollar, at least initially. But the U.S. is nearing the end of its longest-ever business expansion and an oil price spike would bring forward the next recession, both of which will push up the greenback. Much will depend on the extent of any oil shock – whether and how long the Strait of Hormuz is blocked. Beyond the next recession, the dollar could suffer severe consequences for the U.S.’s wild policies. Chart 13An Iran War Will Bust The Budget
An Iran War Will Bust The Budget
An Iran War Will Bust The Budget
Persian Gulf risks are coming to the fore. But over the next six-to-18 months, U.S.-China conflict will be the dominant marketmover. If the U.S. continues the pivot to Asia, and the U.S. and China proceed with tariffs, tech sanctions, saber-rattling, diplomatic crises, and possibly even military skirmishes, China will be forced into an abrupt and destabilizing economic transition. The U.S. dollar will strengthen as global growth decelerates. Developed market equities will outperform emerging market equities, but equities as a whole will underperform sovereign bonds and other safe-haven assets. Our highest conviction call on this matter is that any trade deal before the U.S. 2020 election will be limited in scope. It will fall far short of a “Grand Compromise” that ushers in a new era of U.S.-China engagement – and hence it will be a disappointment to global equities. Our trade war probabilities, updated on July 26, can be found in Diagram 4. The combined risk of further escalation is 60% -- meaning that the U.S. will either implement the final batch of tariffs or refuse to renew Huawei’s trade license, or both. We are maintaining our risk-off trades: long JPY/USD, long gold, long Swiss bonds, and long USD/CNY. Diagram 4U.S.-China Trade War Decision Tree (Updated July 26, 2019)
The Polybius Solution
The Polybius Solution
Matt Gertken, Vice President Geopolitical Strategist mattg@bcaresearch.com Footnotes 1 See Graham Allison, “The Thucydides Trap: Are The U.S. And China Headed For War?” The Atlantic, September 24, 2015, and Destined For War: Can America and China Escape Thucydides’s Trap? (New York: Houghton Mifflin Harcourt, 2017).
Chinese money and credit growth, especially forward-looking liquidity indicators such as M2 relative to GDP, have bottomed. Historically, this led the cycle by a few months. The drop in Chinese bond yields is also reflationary, and should soon stimulate…
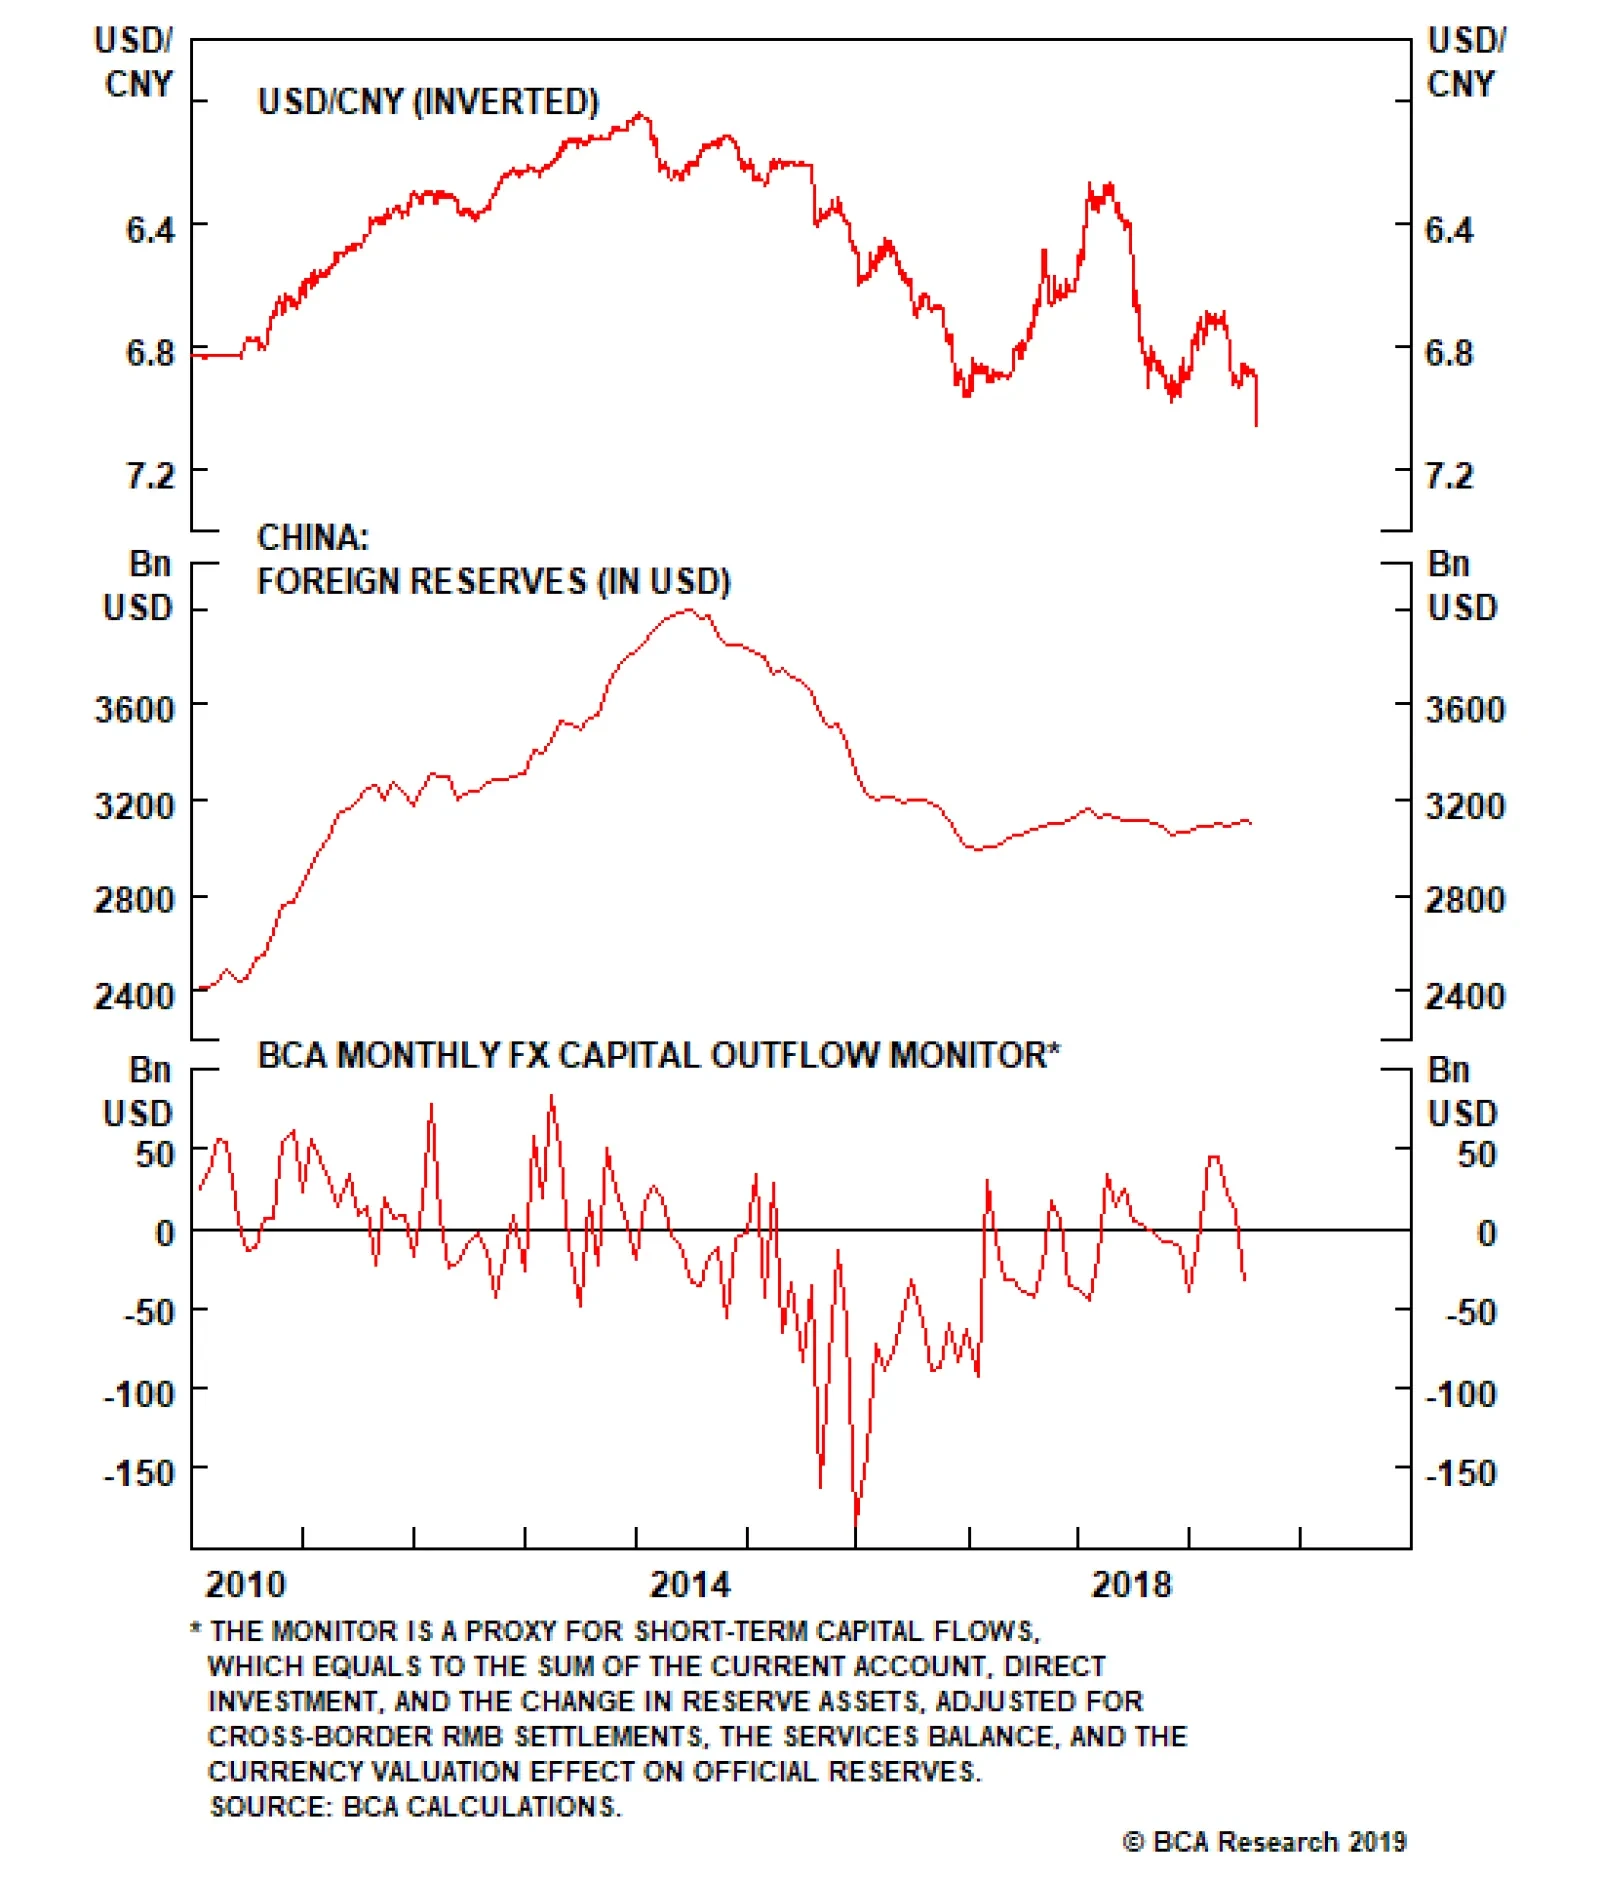
The RMB has been trading like a pro-cyclical currency, meaning it is becoming an important signaling mechanism for the evolution of the cycle. The USD/CNY has been moving tick-for-tick with emerging market equities, Asian currencies, and even some commodity…
Japan and the East China Sea: Japan’s top military official – General Koji Yamazaki – recently warned that Chinese military intrusions are increasing around the disputed Senkaku (Diaoyu) islands in the East China Sea. He called particular attention to China’s…
While the U.S. threatens to cut off Chinese tech companies like Huawei, Beijing has signaled that countermeasures would include an embargo on U.S. imports of rare earth elements and products. When China implemented a partial rare earth export ban on Japan,…
Highlights A unified push among central banks to drop their currencies inevitably leads to lower interest rates, which eventually sows the seeds of a recovery. However, with prospects of a full-blown trade war in front view, fundamentals could be put to the wayside for longer, as markets keep the switch on risk aversion. The new round of tariffs could pin USD/CNY at about 7.3-7.4, given the impact from negative feedback loops. The breakdown in the AUD/JPY cross is precarious. Stay short USD/JPY, but focus on the crosses rather than on outright bets versus the dollar. The RBNZ’s dovish surprise was a positive catalyst for our AUD/NZD and SEK/NZD positions. Remain long. Feature Chart I-1Summer Blues
Summer Blues
Summer Blues
Just as summer trading volumes are falling close to new lows, central banks appear to be weaponizing their exchange rates in a renewed currency war salvo. Both the Reserve Bank of India (RBI) and the Reserve Bank of New Zealand (RBNZ) surprised market participants this week by slashing rates by more than expected. In retrospect, the European Central Bank probably fired the first shot at its forum in Sintra, Portugal this June. ECB President Mario Draghi highlighted back then that if the inflation outlook failed to improve, the central bank had considerable headroom to launch a fresh expansion of its balance sheet. What has followed is a renewed wave of dovishness by global central banks, which should intensify, given the latest flare-up in the trade war. For currency strategy, this means fundamentals could be temporarily put to the wayside, as markets keep the switch on risk aversion (Chart I-1). This is because there is little visibility on either the political or the economic front. Our strategy remains three-fold: First, maintain tight stops on tactical positions. Second, we prefer trades at the crosses rather than versus the dollar, for now. Finally, maintain portfolio insurance by being short the USD/JPY. USD/CNY And The Economics Of Tariffs Chart I-2Sino-U.S. Trade Is Small Relative To Domestic Demand
Sino-U.S. Trade Is Small Relative To Domestic Demand
Sino-U.S. Trade Is Small Relative To Domestic Demand
Standard theory suggests that exchange rates should move to equalize prices across any two countries. The question that naturally follows is by how much? The answer is that the exchange rate should move by exactly the same percentage point as the price change, everything else equal. If both countries produce homogeneous goods, then it is easy to see why, since there is perfect substitution. All demand will flow to one country, until its currency rises by enough to equalize prices across borders again. However, assume countries ‘A’ and ‘B’ produce heterogeneous goods (‘A’ being the U.S. in this case, and ‘B’ China). Then the loss of purchasing power in Country ‘A’ will lead to less demand for Country ‘B’’s goods. The former loses purchasing power because prices of imports have increased by the amount of the tariff. This means the latter’s currency will have to adjust downwards for the markets to clear. The decrease has to match the magnitude of the price increase, if there are no other outlets to liquidate Country ‘B’’s goods. This is obviously a very simplified version of the real world economy, but it highlights an important point that is central to the discussion: The currency move necessary to realign competitiveness will always be equal to, or less than, in percentage point terms, to the price increase. In the case where the entire production base is tradeable, it will be the former. But with a rise in the number of trading partners, a more complex export basket, import substitution, shipping costs, and many other factors that influence tradeable prices, the currency adjustment needed should be smaller. Since the onset of 2018, the U.S. has slapped various tariffs on China, the latest of which is 10% on $300 billion worth of Chinese goods. The U.S. currently imports $509 billion worth of goods from China, about 16% of its total imports. However, as a percentage of overall U.S. demand, this only represents 2.4% (Chart I-2). This suggests that at best, a 25% tariff on all Chinese imports will only lift import prices by 4% and consumer prices by much less. On the Chinese side of the equation, exports to the U.S. account for 18.4% of total exports, a ratio that has been falling since 2018. Therefore, a tariff of 25% should only lift export prices by 4.5%. The conclusion is that the yuan and the dollar only need to adjust by 4-5% to negate the impact of a 25% tariff. Part of the rise in the dollar and fall in the RMB has been due to tariffs, but it has mostly been due to the fact that global trade has been slowing. This brings us to an important point: Part of the rise in the dollar and fall in the RMB has been due to tariffs, but it has mostly been due to the fact that global trade has been slowing (Table I-1). The DXY index is up 10% since its 2018 trough, while the USD/CNY has risen by 12%. This is much more than economic theory would suggest. In quantity terms, the IMF estimated that a 20% import tariff from East Asia would lift the U.S. dollar’s REER by 5% over five years, while dropping output by 0.6% over the same timeframe.1 But if past is prologue, the new round of tariffs will pin USD/CNY at about 7.3-7.4, given the impact from negative feedback loops – mainly a slowing global economy and a slowing Chinese economy.
Chart I-
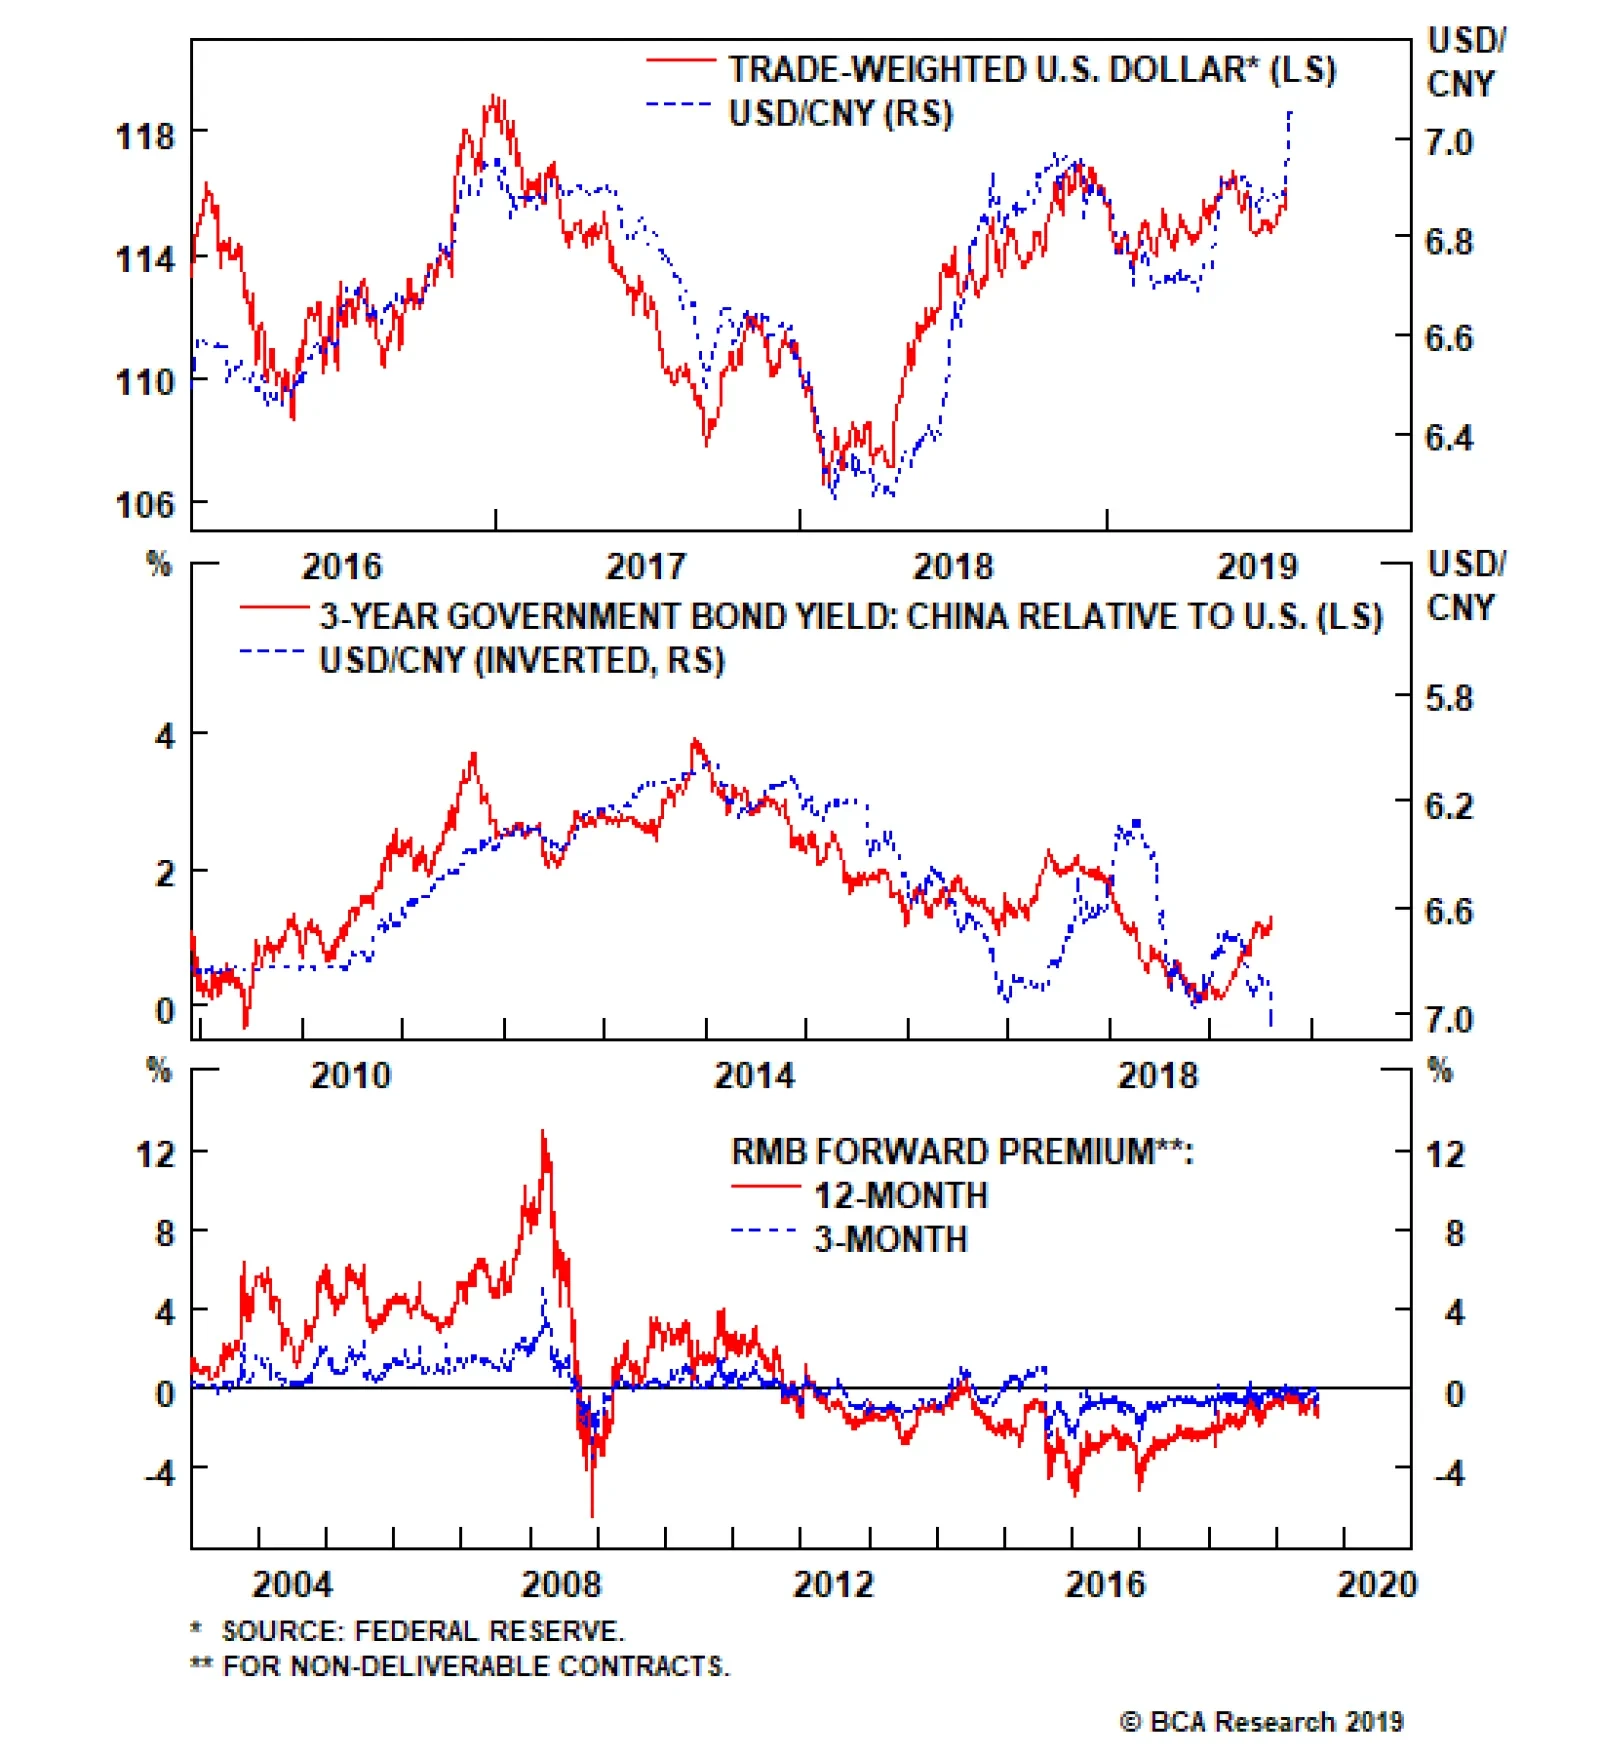
With no corresponding export subsidy for U.S. goods, however, the rise in the dollar makes exporters worse off. And with over 40% of S&P 500 sales coming from outside the U.S., this will make a meaningful dent in corporate profits. This is an important political impediment. Historically, trade wars are usually synonymous with recessions. As such, there are acute political constraints inching both sides towards an agreement. A Disorderly Breakdown Or Steady Depreciation? The RMB has been trading like a pro-cyclical currency, meaning it is becoming an important signaling mechanism for the evolution of the cycle. The USD/CNY has been moving tick-for-tick with emerging market equities, Asian currencies, and even some commodity prices (Chart I-3). It has also closely mirrored the broad trade-weighted dollar (Chart I-4). This has implications for developed market currencies, especially those tied to Chinese demand. Therefore, it will be important to see if the RMB has a disorderly breakdown towards 7.4 or if it stabilizes at higher levels. A few barometers will be key to watch: Chart I-3The Yuan Is Pro-cyclical
The Yuan Is Pro-cyclical
The Yuan Is Pro-cyclical
Chart I-4Is The Dollar Headed Higher?
Is The Dollar Headed Higher?
Is The Dollar Headed Higher?
In a world of rapidly falling yields, Chinese rates remain attractive. Historically, USD/CNY has moved in line with interest rate differentials between the U.S. and China. The current divergence is unsustainable (Chart I-5). Typically, offshore markets have had a good track record of anticipating depreciation in the yuan. Back in 2014, offshore markets started pricing in a rising USD/CNY rate, and maintained that view all the way through to 2018, when the yuan eventually bottomed. Right now, not much depreciation is being priced in (Chart I-6). The reason offshore markets in Hong Kong and elsewhere can be prescient is because more often than not, they are the destination for illicit flows out of China. Chart I-5The Chinese Bond Market Is Attractive
The Chinese Bond Market Is Attractive
The Chinese Bond Market Is Attractive
Chart I-6Forward Markets Not Concerned As In 2015
Forward Markets Not Concerned As In 2015
Forward Markets Not Concerned As In 2015
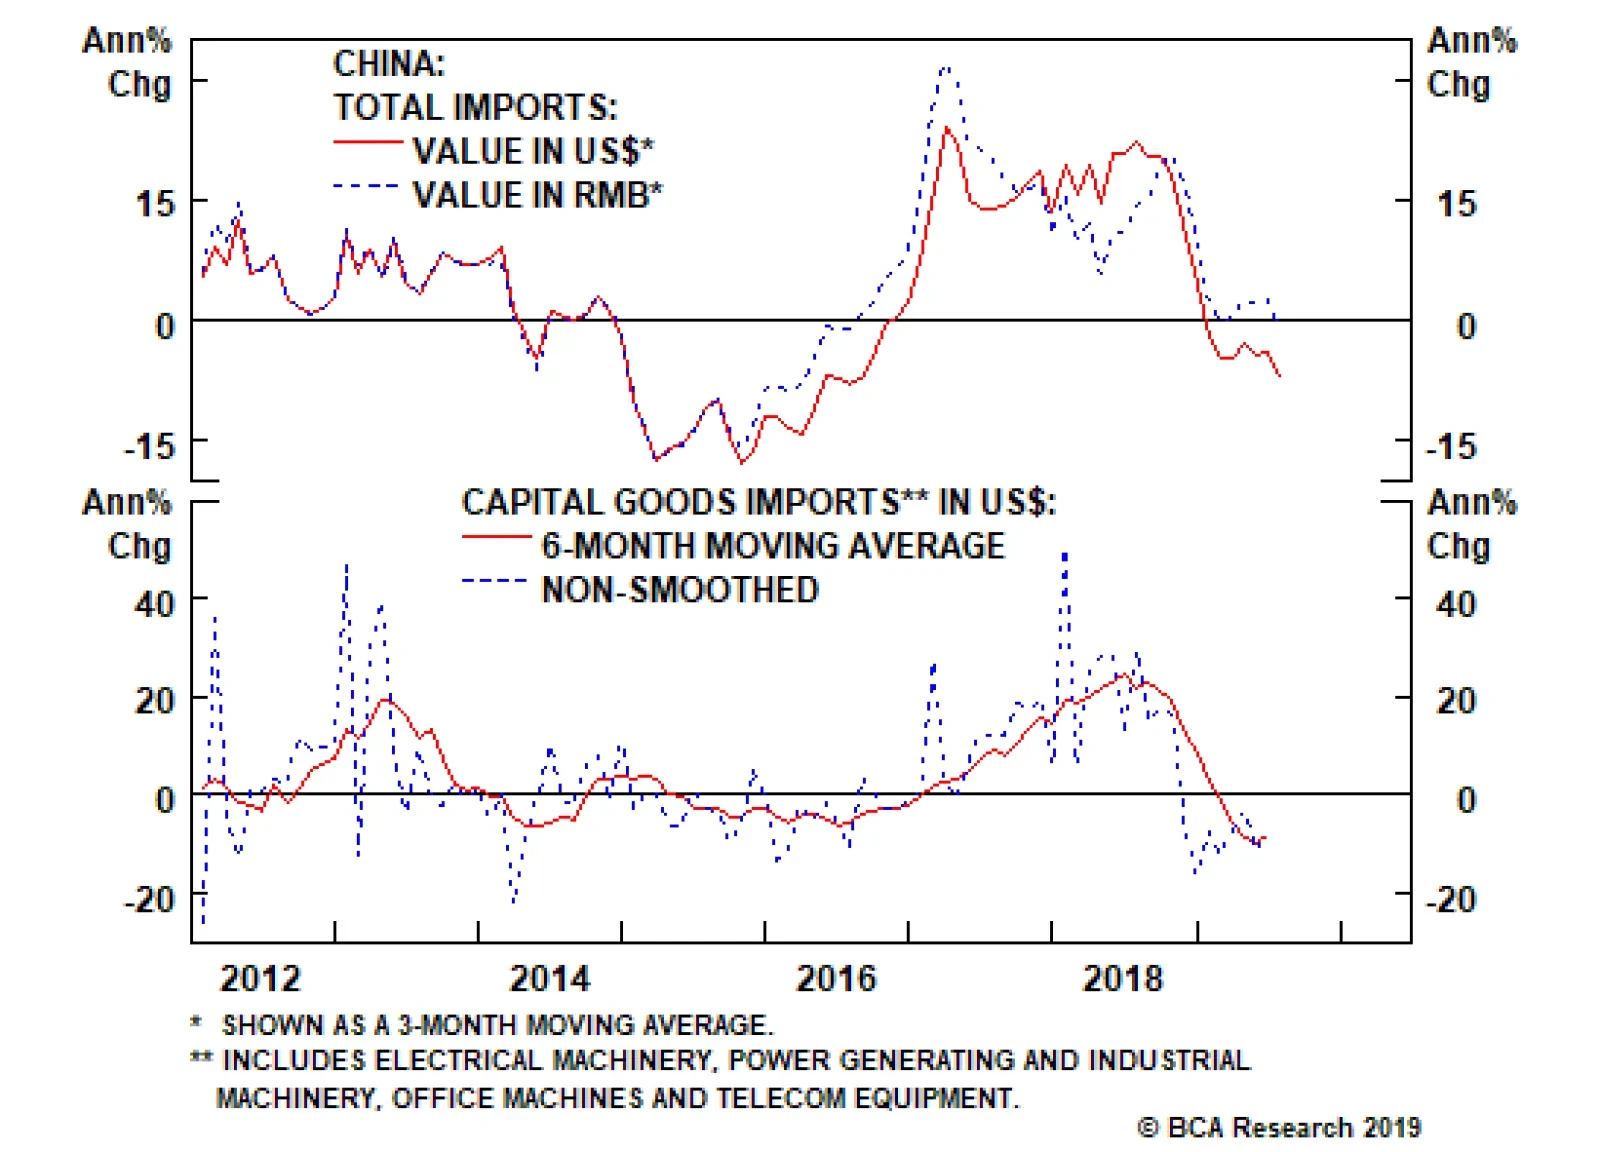
Chinese money and credit growth, especially forward-looking liquidity indicators such as M2 relative to GDP, have bottomed. Historically, this led the cycle by a few months. The drop in Chinese bond yields is also reflationary, and should soon stimulate imports, especially if the improvement in exports continues (Chart I-7). Chinese government expenditures are likely to inflect higher, especially given acute weakness in the July manufacturing data. Again, this suggests stimulus this time around may be more fiscal than monetary (Chart I-8). In addition, the recent VAT cuts for manufacturing firms, a cut to social security contributions, and a pickup in infrastructure spending are all net positives. Chart I-7Trade War Extends Traditional Lags
Trade War Extends Traditional Lags
Trade War Extends Traditional Lags
Chart I-8Government Spending Set To Increase
Government Spending Set To Increase
Government Spending Set To Increase
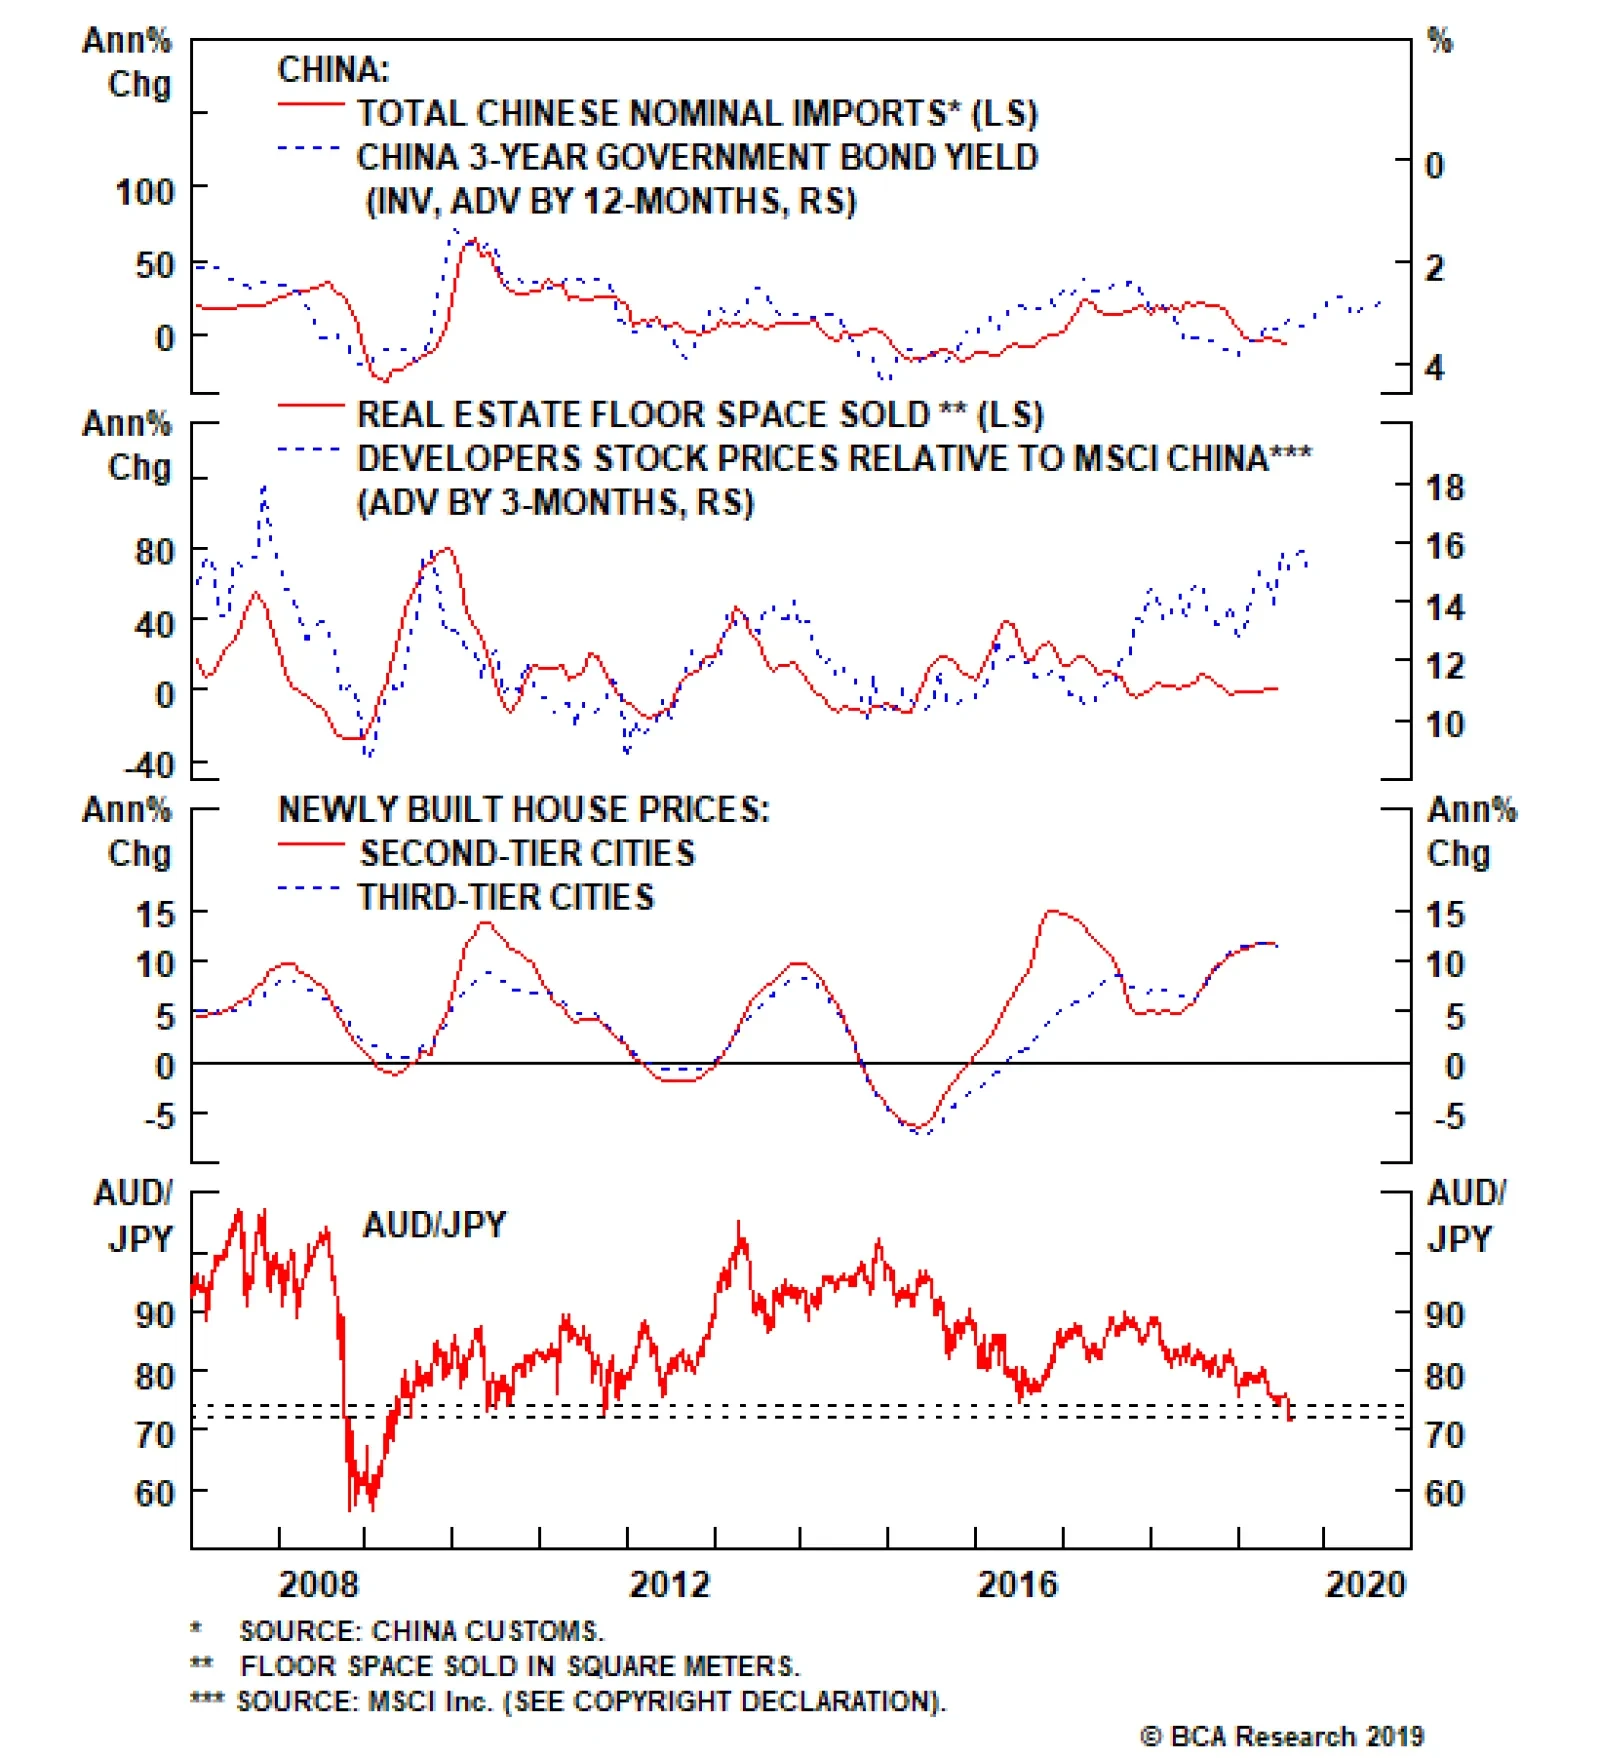
The housing market remains healthy. A revival in the property market will support construction activity and investment. House prices have been rising to the tune of 10% year-on-year, and real estate stocks in China remain firm relative to the overall index. If house prices roll over, this will be a negative development (Chart I-9). The housing market remains healthy. A revival in the property market will support construction activity and investment. If house prices roll over, this will be a negative development. In terms of market dynamics, the AUD/JPY cross breached the important technical level of 72 cents, but has since recovered. This is important, since the cross failed to break below this level both during the euro area debt crisis in 2011-2012 and the China slowdown of 2015-2016. It will be especially important to see a clear breach to signal we are entering a deflationary bust (Chart I-10). Chart I-9China Housing Is Fine
China Housing Is Fine
China Housing Is Fine
Chart I-10AUD/JPY Breakdown Is Precarious
AUD/JPY Breakdown Is Precarious
AUD/JPY Breakdown Is Precarious
Bottom Line: We are watching a few key reflationary indicators to gauge whether it pays to be contrarian. The message is that it is not time yet, given the ramp-up in the trade war rhetoric. Notes On The RBNZ Chart I-11AUD/NZD Is Cheap
AUD/NZD Is Cheap
AUD/NZD Is Cheap
This week, the RBNZ surprised markets by cutting interest rates by 50 basis points to parity (expectations were for a 25-basis-point cut). From an external standpoint, this makes sense. Australia and China are New Zealand’s biggest trading partners, and have been easing policy much earlier. The RBNZ’s bet was that demand was probably going to recover by now. The latest salvo in the trade war probably dashed those hopes. Meanwhile, over the last 35 years, the AUD/NZD cross has spent more than 95% of the time over 1.06. With the AUD/NZD near record lows, the cross is cheap on a real effective exchange rate basis (meaning NZD is expensive) (Chart I-11). This suggests that even though interest rates are aligning in both Australia and New Zealand, the Aussie should be 11% higher relative to the Kiwi because of the valuation starting point (Chart I-12). The market remains more dovish on Australia relative to New Zealand, in part due to a more accelerated downturn in house prices and a significant slowdown in China. The reality is that the downturn in Australia has allowed some cleansing of sorts, and brought it far along the adjustment path relative to New Zealand. Economic data in New Zealand are now converging to the downside relative to Australia (Chart I-13). Chart I-12Interest Rates Could Move In Favor Of AUD
Interest Rates Could Move In Favor Of AUD
Interest Rates Could Move In Favor Of AUD
Chart I-13New Zealand Has More Economic Downside
New Zealand Has More Economic Downside
New Zealand Has More Economic Downside
The RBNZ began a new mandate on April 1st to include full employment in addition to inflation targeting. But given that the RBNZ has been unable to fulfill its price stability mandate over the last several years, it is hard to argue it will find a dual mandate any easier. Business confidence is rapidly falling, and employment will soon follow suit (Chart I-14). Meanwhile, for an economy driven by agricultural exports, productivity gains will be hard to come by. Economic data in New Zealand are now converging to the downside relative to Australia. The final catalyst for the AUD/NZD cross will be a terms-of-trade shock which, at the moment, is turning in favor of the Aussie (Chart I-15). Iron ore prices may face further downside, given that supply from Brazil is back online, but China’s clear environmental push has lifted the share of liquefied natural gas in Australia’s export mix. Since eliminating pollution is a strategic goal in China, this will be a multi-year tailwind. As the market becomes more liberalized and long-term contracts are revised to reflect higher spot prices, the Aussie will get a boost. Chart I-14Employment Growth Could Collapse In New Zealand
Employment Growth Could Collapse In New Zealand
Employment Growth Could Collapse In New Zealand
Chart I-15Terms Of Trade Favors##br## Aussie
Terms Of Trade Favors Aussie
Terms Of Trade Favors Aussie
Bottom Line: Remain long AUD/NZD as a strategic position and SEK/NZD as a tactical position. Housekeeping The stop on our short XAU/JPY position was triggered at 158,000 with a loss of -3.27%. This was a mean-reversion trade between two safe-havens, likely to work even if volatility remains elevated. Put it back on. Finally, lift the limit sell on EUR/GBP to 0.95. Chester Ntonifor, Foreign Exchange Strategist chestern@bcaresearch.com Footnotes 1 Maurice Obstfeld, “Tariffs Do More Harm Than Good At Home,” IMFBlog, September 8, 2016. Currencies U.S. Dollar Chart II-1USD Technicals 1
USD Technicals 1
USD Technicals 1
Chart II-2USD Technicals 2
USD Technicals 2
USD Technicals 2
Recent data in the U.S. have been mostly positive: Labor market remains tight: Unemployment rate was steady at 3.7%; Participation rate increased to 63%; Average hourly earnings increased by 3.2% year-on-year; Nonfarm payrolls increased by 164 thousand. Initial jobless claims fell to 209 thousand last week. Trade balance narrowed slightly to $55.2 billion in June. Michigan sentiment index was unchanged at 98.4 in July. Markit composite and services PMI both increased to 52.6 and 53 respectively in July, while ISM non-manufacturing PMI fell to 53.7 in July. DXY index fell by 1% this week, erasing the gains following the Fed’s hawkish surprise last week. Weakness in the dollar given a ramp-up in trade war rhetoric suggest that dollar tailwinds are facing diminishing marginal returns. A few of our favorite dollar indicators, including the bond-to-gold ratio, are sending a warning signal. Report Links: Focusing On the Trees But Missing The Forest - August 2, 2019 Global Growth And The Dollar - July 19, 2019 On Gold, Oil And Cryptocurrencies - June 28, 2019 The Euro Chart II-3EUR Technicals 1
EUR Technicals 1
EUR Technicals 1
Chart II-4EUR Technicals 2
EUR Technicals 2
EUR Technicals 2
Recent data in the euro area have continued to deteriorate: Producer price inflation fell to 0.7% year-on-year in June. Retail sales increased by 2.6% year-on-year in June, surprising to the upside. Markit composite PMI was unchanged at 51.5 in July, while services PMI fell slightly to 53.2. Sentix investor confidence fell further to -13.7 in August, the lowest since 2014. EUR/USD increased by 1% this week. In the most recent Economic Bulletin, the ECB highlighted the risk of a weaker Q2 global services PMI which might lead to a more broad-based deterioration in global growth. With negative interest rates and diminishing marginal returns to monetary policy, the euro area will be ever dependent on fiscal stimulus. Report Links: Battle Of The Central Banks - June 21, 2019 EUR/USD And The Neutral Rate Of Interest - June 14, 2019 Take Out Some Insurance - May 3, 2019 Japanese Yen Chart II-5JPY Technicals 1
JPY Technicals 1
JPY Technicals 1
Chart II-6JPY Technicals 2
JPY Technicals 2
JPY Technicals 2
Recent data in Japan have been mixed: Composite PMI was unchanged at 51.2 in July, while services PMI fell to 51.8. Household spending yearly growth fell to 2.7% in June. That said, previous growth of 4% was too high relative to Japan’s potential. Wages increased by 0.4% year-on-year in June. Leading economic index and coincident index both fell to 93.3 and 100.4 respectively in June. The trade balance increased to ¥759.3 billion in June. Current account balance narrowed to ¥1,211 billion in June. USD/JPY fell by 0.9% this week. In the Summary of Opinions released this week, the BoJ concluded that the Japanese economy has been moderately expanding, a trend that is likely to continue in the second half. However, this may be too ambitious. As we go to press, Q2 GDP growth is still pending, and a marked slowdown could be a harbinger for a much softer second half, especially given renewed trade tensions. That said, the path to easier monetary policy will be lined by a stronger yen. Report Links: Portfolio Tweaks Into Thin Summer Trading - July 5, 2019 Battle Of The Central Banks - June 21, 2019 Short USD/JPY: Heads I Win, Tails I Don’t Lose Too Much - May 31, 2019 British Pound Chart II-7GBP Technicals 1
GBP Technicals 1
GBP Technicals 1
Chart II-8GBP Technicals 2
GBP Technicals 2
GBP Technicals 2
Recent data in the U.K. have been mostly positive: Markit composite PMI increased to 50.7 in July. Services and construction components also increased to 51.4 and 45.3 respectively. Retail sales increased by 0.1% year-on-year in July. Halifax house prices contracted by 0.2% month-on-month in July. GBP/USD has been very volatile but returned flat this week. All eyes are on the new PM Boris Johnson and new Brexit developments. Our Geopolitical strategist is assigning 21% risk of a no-deal Brexit, and the probability would rise to 30% if negotiations with the EU fail. We believe that the pound could easily drop to 1.10-1.15 if there is no deal. That being said, we are looking to sell EUR/GBP at 0.94, given Europe will also absorb some collateral damage from a hard Brexit. Report Links: Battle Of The Central Banks - June 21, 2019 A Contrarian View On The Australian Dollar - May 24, 2019 Take Out Some Insurance - May 3, 2019 Australian Dollar Chart II-9AUD Technicals 1
AUD Technicals 1
AUD Technicals 1
Chart II-10AUD Technicals 2
AUD Technicals 2
AUD Technicals 2
Recent data in Australia have been mostly positive: Producer price inflation increased to 2% year-on-year in Q2. Retail sales grew by 0.4% month-on-month in June. Both composite and services PMI increased to 52.1 and 52.3 respectively in July. Australian Industry Group (AiG) construction index fell to 39.1 in July. Exports grew by 1% month-on-month in June, while imports contracted by 4% month-on-month. This nudged the trade surplus to A$8 billion in June, a record. AUD/USD fell by 1.8% initially, then rebounded, returning flat this week. The RBA held interest rates unchanged at 1% on Tuesday, after cutting by 25 bps both in June and July. Long-term government bond yields declined to record-lows. Currency markets are currently focused on interest rate differentials. Once the focus shifts to other fundamentals as global interest rates converge, the Aussie dollar will get a boost. Report Links: A Contrarian View On The Australian Dollar - May 24, 2019 Beware Of Diminishing Marginal Returns- April 19, 2019 Not Out Of The Woods Yet - April 5, 2019 New Zealand Dollar Chart II-11NZD Technicals 1
NZD Technicals 1
NZD Technicals 1
Chart II-12NZD Technicals 2
NZD Technicals 2
NZD Technicals 2
Recent data in New Zealand have been positive: Consumer confidence decreased by 5.1% month-on-month in July. On the labor market front, the participation rate was steady at 70.4% in Q2; Unemployment rate fell to 3.9%; Wages increased by 2.2% year-on-year in Q2. NZD/USD fell by 0.8% this week. RBNZ shocked the market with the half-percentage point rate cut this Wednesday, stating that a larger initial move would be best to meet the inflation and employment objectives in New Zealand. The RBNZ also lowered 2-year inflation expectations from 2.01% to 1.86% in Q3. Relative terms-of-trade favors our long AUD/NZD position. Stay with it. Report Links: Where To Next For The U.S. Dollar? - June 7, 2019 Not Out Of The Woods Yet - April 5, 2019 Balance Of Payments Across The G10 - February 15, 2019 Canadian Dollar Chart II-13CAD Technicals 1
CAD Technicals 1
CAD Technicals 1
Chart II-14CAD Technicals 2
CAD Technicals 2
CAD Technicals 2
Recent data in Canada have been mostly positive: Imports and exports both fell to C$50.2 billion and C$50.3 billion in June. The trade balance thus narrowed to C$0.14 billion. Bloomberg Nanos confidence index increased to 58.6 last week. Ivey PMI increased to 54.2 in July. New housing price index contracted by 0.2% year-on-year in June. USD/CAD increased by 0.2% this week. The sudden oil prices drop has dragged down the Canadian dollar. WTI crude oil prices plunged by more than 10% during the past week, and Western Canadian Select crude oil spot prices fell by 14.5%. Report Links: Portfolio Tweaks Into Thin Summer Trading - July 5, 2019 On Gold, Oil And Cryptocurrencies - June 28, 2019 Currency Complacency Amid A Global Dovish Shift - April 26, 2019 Swiss Franc Chart II-15CHF Technicals 1
CHF Technicals 1
CHF Technicals 1
Chart II-16CHF Technicals 2
CHF Technicals 2
CHF Technicals 2
Recent data in Switzerland have been mostly negative: Headline and core consumer price inflation dropped to 0.3% and 0.4% year-on-year respectively in July. Manufacturing PMI fell to 44.7 in July. Consumer confidence fell to -8 in July. Real retail sales increased by 0.7% year-on-year in June. USD/CHF fell by 1.2% this week. The concerns over the global growth, an escalating trade war, a potential hard-Brexit, political tensions in the Middle East and East Asia continue to weigh on investors’ sentiment. VIX once again touched 24 following Trump’s tweet to threaten to impose 10% tariffs over $300 billion Chinese goods last Thursday. We continue to favor the safe-haven Swiss franc as a tactical portfolio hedge. Report Links: What To Do About The Swiss Franc? - May 17, 2019 Beware Of Diminishing Marginal Returns - April 19, 2019 Balance Of Payments Across The G10 - February 15, 2019 Norwegian Krone Chart II-17NOK Technicals 1
NOK Technicals 1
NOK Technicals 1
Chart II-18NOK Technicals 2
NOK Technicals 2
NOK Technicals 2
There is little data from Norway this week: Manufacturing production yearly growth fell from 5% in May to 3% in June. USD/NOK has been flat this week. Next week, the Norges Bank is likely to reverse its well-telegraphed forward guidance of rate hikes, following global developments. With oil prices down, and a new trade war, they will stand pat in line with market expectations, but an interest rate cut cannot be ruled out. Report Links: Portfolio Tweaks Into Thin Summer Trading - July 5, 2019 On Gold, Oil And Cryptocurrencies - June 28, 2019 Currency Complacency Amid A Global Dovish Shift - April 26, 2019 Swedish Krona Chart II-19SEK Technicals 1
SEK Technicals 1
SEK Technicals 1
Chart II-20SEK Technicals 2
SEK Technicals 2
SEK Technicals 2
Recent data in Sweden have been mixed: Industrial production contracted by 0.7% year-on-year in June. Services production yearly growth also fell to 1.3% in June. However, industrial orders increased by 7.5% year-on-year in June, the strongest since July 2018. Budget balance widened to SEK 28.2 billion in July. USD/SEK fell by 0.9% this week. The upside surprise in industrial orders is mainly led by transport equipment. Mining and quarrying also rebounded to 9.3% compared with -7.8% in May. Our SEK/NZD position is now 0.4% in the money. The negative carry has been narrowed following RBNZ’s 50 bps rate cut. Report Links: Where To Next For The U.S. Dollar? - June 7, 2019 Balance Of Payments Across The G10 - February 15, 2019 A Simple Attractiveness Ranking For Currencies - February 8, 2019 Trades & Forecasts Forecast Summary Core Portfolio Tactical Trades Limit Orders Closed Trades
It is impossible to know whether the recent RMB depreciation was market-driven or engineered by the PBoC. Our best guess is that the latest RMB depreciation was driven by both market pressures as well as the authorities’ increased tolerance of a weaker RMB. …