China

BCA takes pride in its independence. Strategists publish what they really believe, informed by their framework and analysis. Occasionally, this independence results in strongly diverging views and we currently are in one of those times. Within BCA, two views on the cyclical (six to 12-months) outlook for assets have emerged. One camp expects global growth to rebound in the second half of the year. Along with accelerating growth, they anticipate stock prices and risk assets to remain firm, cyclical equities to outperform defensive ones, safe-haven yields to move up, and the dollar to weaken. Meanwhile, another group foresees a further deterioration in activity or a delayed recovery, additional downside in stocks and risk assets, outperformance of defensives relative to cyclicals, low safe-haven yields, and a generally stronger dollar. For the sake of transparency, we have asked representatives of each camp to make their case in a round-table discussion, allowing our clients to decide for themselves which view is more appealing to them. Global Investment Strategy’s Peter Berezin, U.S. Investment Strategy’s Doug Peta, and Global Fixed Income Strategy’s Rob Robis take the mantle for the bullish camp. U.S. Equity Strategy’s Anastasios Avgeriou, Emerging Market Strategy’s Arthur Budaghyan, and European Investment Strategy’s Dhaval Joshi represent the bearish group.1 The round-table discussion below focuses on the cyclical outlook. For longer investment horizons, most strategists agree that a recession is highly likely by 2022. Moreover, on a long-term basis, valuations in both risk assets and safe-haven bonds are very demanding. In this context, a significant back up in yields could hammer risk assets. The BCA Round Table Mathieu Savary: Yield curve inversions have often been harbingers of recessions. Anastasios, you are amongst those investors troubled by this inversion. Do you not worry that this episode might prove similar to 1998, when the curve only inverted temporarily and did not foreshadow a recession? Moreover, how do you account for the highly variable time lags between the inversion of the yield curve and the occurrence of a recession? Anastasios Avgeriou: The yield curve inverts at or near the peak of the business cycle and it eventually forewarns of upcoming recessions. This past December, parts of the yield curve inverted and now, BCA’s U.S. Equity Strategy service is heeding the signal from this simple indicator, especially given that the SPX has subsequently made all-time highs as our research predicted.2 Chart 1 (ANASTASIOS)The 1998 Episode Revisited
The 1998 Episode Revisited
The 1998 Episode Revisited
The yield curve inversion forecasts a Fed rate cut, and it has never been wrong on that front. It served well investors that heeded the message in June of 1998 as the market soon thereafter fell 20% in a heartbeat. If investors got out at the 1998 peak near 1200 and forwent about 350 points of gains until the March 2000 SPX cycle peak, they still benefited if they held tight as the market ultimately troughed near 777 in October 2002 (Chart 1). With regard to timing the previous seven recessions using the yield curve, if we accept that mid-1998 is the starting point of the inversion, it took 33 months before the recession commenced. Last cycle, the recession began 24 months after the inversion. Consequently, December 2020 is the earliest possible onset of recession and September 2021, the latest. Our forecast calls for SPX EPS to fall 20% in 2021 to $140 with the multiple dropping between 13.5x and 16.5x for an SPX end-2020 target range of 1,890-2,310.3 In other words we are not willing to play a 100-200 point advance for a potential 1,000 point drawdown. The risk/reward tradeoff is to the downside, and we choose to sit this one out. Mathieu: Rob, you take a much more sanguine view of the current curve inversion. Why? Rob Robis: While the four most dangerous words in investing are “this time is different,” this time really does appear to be different. Never before have negative term premia on longer-term Treasury yields and a curve inversion coexisted (Chart 2). Longer-term Treasury yields have therefore been pushed down to extremely low levels by factors beyond just expectations of a lower fed funds rate. The negative Treasury term premium is distorting the economic message of the U.S. yield curve inversion. Chart 2 (ROB)Negative Term Premium Distorting The Economic Message Of An Inverted Yield Curve
Negative Term Premium Distorting The Economic Message Of An Inverted Yield Curve
Negative Term Premium Distorting The Economic Message Of An Inverted Yield Curve
Term premia are depressed everywhere, as seen in German, Japanese and other yields, reflecting the intense demand for safe assets like government bonds during a period of heightened uncertainty. Global bond markets may also be discounting a higher probability of the ECB restarting its Asset Purchase Program, as term premia typically fall sharply when central banks embark on quantitative easing. This has global spillovers. Prior to previous recessions, U.S. Treasury curve inversions occurred when the Fed was running an unequivocally tight monetary policy. That is not the case today. The real fed funds rate still is not above the Fed’s estimate of the neutral real rate, a.k.a. “r-star,” which was the necessary ingredient for all previous Treasury curve inversions since 1960 (Chart 3). Chart 3 (ROB)Fed Policy Is Not Tight Enough For Sustained Curve Inversion
Fed Policy Is Not Tight Enough For Sustained Curve Inversion
Fed Policy Is Not Tight Enough For Sustained Curve Inversion
Mathieu: The level of policy accommodation will most likely determine whether Anastasios or Rob is proven right. Peter, you have been steadfastly arguing that policy, in the U.S. at least, remains easy. Can you elaborate why? Peter Berezin: Remember that the neutral rate of interest is the rate that equalizes the level of aggregate demand with the economy’s supply-side potential. Loose fiscal policy and fading deleveraging headwinds are boosting demand in the United States. So is rising wage growth, especially at the bottom of the income distribution. Given that the U.S. does not currently suffer from any major imbalances, I believe that the economy can tolerate higher rates without significant ill-effects. In other words, monetary policy is currently quite easy. Of course, we cannot observe the neutral rate directly. Like a black hole, one can only detect it based on the effect that it has on its surroundings. Housing is by far the most interest rate-sensitive sector of the economy. If history is any guide, the recent decline in mortgage rates will boost housing activity in the remainder of the year (Chart 4). If that relationship breaks down, as it did during the Great Recession, it would suggest that the neutral rate is quite low. Chart 4 (PETER)Declining Mortgage Rates Bode Well For Housing
Declining Mortgage Rates Bode Well For Housing
Declining Mortgage Rates Bode Well For Housing
Given that mortgage underwriting standards have been quite strong and the homeowner vacancy is presently very low, our guess is that housing will hold up well. We should know better in the next few months. Mathieu: Dhaval, you do not agree. Why do you think global rates are not accommodative? Dhaval Joshi: Actually, I think that global rates are accommodative, but that the global bond yield can rise by just 70 bps before conditions become perilously un-accommodative. Here’s where I disagree with Peter: for me, the danger doesn’t come from economics, it comes from the mathematics of ultra-low bond yields. The unprecedented and experimental panacea of our era has been ‘universal QE’ – which has led to ultra-low bond yields everywhere. But what is not understood is that when bond yields reach and remain close to their lower bound, weird things happen to the financial markets.
Chart 5
I refer you to other reports for the details, but in a nutshell, the proximity of the lower bound to yields increases the risk of owning supposedly ‘safe’ bonds to the risk of owning so-called ‘risk-assets’. The result is that the valuation of risk-assets rises exponentially (Chart 5). Because when the riskiness of the asset-classes converges, investors price risk-assets to deliver the same ultra-low nominal return as bonds.4 Comparisons with previous economic cycles miss the current danger. The post-2000 policy easing distorted the global economy by engineering a credit boom – so the subsequent danger emanated from the most credit-sensitive sectors in the economy such as mortgage lending. In contrast, the post-2008 ‘universal QE’ has severely distorted the valuation relationship between bonds and global risk-assets – so this is where the current danger lies. Higher bond yields can suddenly undermine the valuation support of global risk-assets whose $400 trillion worth dwarfs the global economy by five to one. Where is this tipping point? It is when the global 10-year yield – defined as the average of the U.S., euro area,5 and China – approaches 2.5%. Through the past five years, the inability of this yield to remain above 2.5% confirms the hyper-sensitivity of financial conditions to this tipping point (Chart 6). Right now, I agree that bond yields are accommodative. But the scope for yields to move higher is quite limited. Chart 6 (DHAVAL)Since 2015, the Global Long Bond Yield Has Struggled To Surpass 2.5 Percent
Since 2015, the Global Long Bond Yield Has Struggled To Surpass 2.5 Percent
Since 2015, the Global Long Bond Yield Has Struggled To Surpass 2.5 Percent
Mathieu: Monetary policy is important to the outlook, but so is the global manufacturing cycle. The global growth slowdown has been concentrated in the manufacturing sector, tradeable goods in particular. Across advanced economies, the service and consumer sectors have been surprisingly resilient, but this will not last if the industrial sector decelerates further. Arthur, you still do not anticipate any major improvement in global trade and industrial production. Can you elaborate why? Chart 7 (ARTHUR)Global Trade Is Down Due To China Not U.S.
Global Trade Is Down Due To China Not U.S.
Global Trade Is Down Due To China Not U.S.
Arthur Budaghyan: To properly assess the economic outlook, one needs to understand what has caused the ongoing global trade/manufacturing downturn. One thing we know for certain: It originated in China, not the U.S. Chart 7 illustrates that Korean, Japanese, Taiwanese and Singaporean exports to China have been shrinking at an annual rate of 10%, while their shipments to the U.S. have been growing. China’s aggregate imports have also been contracting. This entails that from the perspective of the rest of the world, China has been and remains in recession. U.S. manufacturing is the least exposed to China, which is the main reason why it has been the last shoe to drop. Hence, the U.S. has lagged in this downturn, and one should not be looking to the U.S. for clues about a potential global recovery. We need to gauge what will turn Chinese demand around. In this regard, the rising credit and fiscal spending impulse is positive, but it has so far failed to kick start a recovery (Chart 8). The key reason has been a declining marginal propensity to spend among households and companies. Notably, the marginal propensity to spend of mainland companies leads industrial metals prices by a few months, and it currently continues to point south (Chart 8, bottom panel). The lack of willingness among Chinese consumers and enterprises to spend is due to several factors: (1) the U.S.-China confrontation; (2) high levels of indebtedness among both enterprises and households (Chart 9); (3) ongoing regulatory scrutiny over banks and shadow banking as well as local government debt; and (4) a lack of outright government subsidies for purchases of autos and housing. Chart 8 (ARTHUR)Stimulus Versus Marginal Propensity To Spend
Stimulus Versus Marginal Propensity To Spend
Stimulus Versus Marginal Propensity To Spend
Chart 9 (ARTHUR)Chinese Households Are More Leveraged Than U.S. Ones
Chinese Households Are Leveraged Than U.S. Ones
Chinese Households Are Leveraged Than U.S. Ones
On the whole, the falling marginal propensity to spend will all but ensure that any recovery in mainland household and corporate spending is delayed. Mathieu: Meanwhile, Peter, you have a much more optimistic stance. Why do you differ so profoundly with Arthur’s view? Peter: China’s deleveraging campaign began more than a year before global manufacturing peaked. I have no doubt that slower Chinese credit growth weighed on global capex, but we should not lose sight of the fact there are natural ebbs and flows at work. Most manufactured goods retain some value for a while after they are purchased. If spending on, say, consumer durable goods or business equipment rises to a high level for an extended period, a glut will form, requiring a period of lower production. Chart 10 (PETER)The Global Manufacturing Cycle Has Likely Reached A Bottom
The Global Manufacturing Cycle Has Likely Reached A Bottom
The Global Manufacturing Cycle Has Likely Reached A Bottom
These demand cycles typically last about three years; roughly 18 months on the way up, 18 months on the way down (Chart 10). The last downleg in the global manufacturing cycle began in early 2018, so if history is any guide, we are nearing a trough. The fact that U.S. manufacturing output rose in both May and June, followed by this week’s sharp rebound in the July Philly Fed Manufacturing survey, supports this view. Of course, extraneous forces could complicate matters. If trade tensions ratchet higher, this would weaken my bullish thesis. Nevertheless, with China stimulating its economy again, it would probably take a severe trade war to push the global economy into recession. Mathieu: Dhaval, you are not as negative as Arthur, but nonetheless expect a slowdown in the second half of the year. What is your rationale? Dhaval: To be clear, I am not forecasting a recession or major downturn – unless, as per my previous answer, the global 10-year bond yield approaches 2.5% and triggers a severe dislocation in global risk-assets. In fact, many people get the relationship between recession and financial market dislocation back-to-front: they think that the recession causes the financial market dislocation when, in most cases, the financial market dislocation causes the recession! Nevertheless, I do believe that European and global growth is entering a regular down-oscillation based on the following compelling evidence: From a low last summer, quarter-on-quarter GDP growth rates in the developed economies have already rebounded to the upper end of multi-year ranges. Short-term credit impulses in Europe, the U.S., and China are entering down-oscillations (Chart 11). The best current activity indicators, specifically the ZEW economic sentiment indicators, have rolled over. The outperformance of industrials – the equity sector most exposed to global growth – has also rolled over. Why expect a down-oscillation? Because it is the rate of decline in the bond yield that drove the rebound in growth after its low last summer. Furthermore, it is impossible for the rate of decline in the bond yield to keep increasing, or even stay where it is. Counterintuitively, if bond yields decline, but at a reduced pace, the effect is to slow economic growth. Mathieu: A positive and a negative view of the world logically result in bifurcated outlooks for interest rates and the dollar. Rob, how do you see U.S., German, and Japanese yields evolving over the coming 12 months? Rob: If global growth rebounds, U.S. Treasury yields will have far more upside than Bund or JGB yields. Inflation expectations should recover faster in the U.S., with the Fed taking inflationary risks by cutting rates with a 3.7% unemployment rate and core CPI inflation at 2.1%. The Fed is also likely to disappoint by delivering fewer rate cuts than are currently discounted by markets (90bps over the next 12 months). Treasury yields can therefore increase more than German and Japanese yields, with the ECB and BoJ more likely to deliver the modest rate cuts currently discounted in their yield curves (Chart 12). Chart 11 (DHAVAL)Short-Term Impulses Rebounded... But Are Now Rolling Over
Short-Term Impulses Rebounded... But Are Now Rolling Over
Short-Term Impulses Rebounded... But Are Now Rolling Over
Chart 12 (ROB)U.S. Treasuries Will Underperform Bunds & JGBs
U.S. Treasuries Will Underperform Bunds & JGBs
U.S. Treasuries Will Underperform Bunds & JGBs
Japanese yields will remain mired at or below zero over the next 6-12 months, as wage growth and core inflation remain too anemic for the BoJ to alter its 0% target on 10-year JGB yields. German yields have a bit more potential to rise if European growth begins to recover, but will lag any move higher in Treasury yields. That means that the Treasury-Bund and Treasury-JGB spreads will move higher over the next year. Negative German and Japanese yields may look completely unappetizing compared to +2% U.S. Treasury yields, but this handicap vanishes when all three yields are expressed in U.S. dollar terms. Hedging a 10-year German Bund or JGB into higher-yielding U.S. dollars creates yields that are 50-60bps higher than a 10-year U.S. Treasury. It is abundantly clear that German and Japanese bonds will outperform Treasuries over the next year if global growth recovers. Mathieu: Peter, your positive view on global growth means that the Fed will cut rates less than what is currently priced into the OIS curve. So why do you expect the dollar to weaken in the second half of 2019? Peter: What the Fed does affects interest rate differentials, but just as important is what other central banks do. The ECB is not going to raise rates over the next 12 months. However, if euro area growth surprises on the upside later this year, investors will begin to question the need for the ECB to keep policy rates in negative territory until mid-2024. The market’s expectation of where policy rates will be five years out tends to correlate well with today’s exchange rate. By that measure, there is scope for interest rate differentials to narrow against the U.S. dollar (Chart 13). Chart 13A (PETER)Interest Rate Expectations Against The U.S. Should Narrow (I)
Interest Rate Expectations Against The U.S. Should Narrow (I)
Interest Rate Expectations Against The U.S. Should Narrow (I)
Chart 13B (PETER)Interest Rate Expectations Against The U.S. Should Narrow (II)
Interest Rate Expectations Against The U.S. Should Narrow (II)
Interest Rate Expectations Against The U.S. Should Narrow (II)
Keep in mind that the U.S. dollar is a countercyclical currency, meaning that it moves in the opposite direction of global growth (Chart 14). This countercyclicality stems from the fact that the U.S. economy is more geared towards services than manufacturing compared with the rest of the world. Chart 14 (PETER)The Dollar Is A Countercyclical Currency
The Dollar Is A Countercyclical Currency
The Dollar Is A Countercyclical Currency
As such, when global growth accelerates, capital tends to flow from the U.S. to the rest of the world, translating into more demand for foreign currency and less demand for dollars. If global growth picks up in the remainder of the year, as I expect, the dollar will weaken. Mathieu: Arthur, as you are significantly more negative on growth than either Rob or Peter, how do you see the dollar and global yields evolving over the coming six to 12 months? Arthur: I am positive on the trade-weighted U.S. dollar for the following reasons: The U.S. dollar is a countercyclical currency – it exhibits a negative correlation with the global business cycle. Persistent weakness in the global economy emanating from China/EM is positive for the dollar because the U.S. economy is the major economic block least exposed to a China/EM slowdown. Meanwhile, the greenback is only loosely correlated with U.S. interest rates. Thereby, the argument that lower U.S. rates will drive the value of the U.S. currency much lower is overemphasized. The Federal Reserve will cut rates by more than what is currently priced into the market only in a scenario of a complete collapse in global growth. Yet this scenario would be dollar bullish. In this case, the dollar’s strong inverse relationship with global growth will outweigh its weak positive relationship with interest rates. Contrary to consensus views, the U.S. dollar is not very expensive. According to unit labor costs based on the real effective exchange rate – the best currency valuation measure – the greenback is only one standard deviation above its fair value. Often, financial markets tend to overshoot to 1.5 or 2 standard deviations below or above their historical mean before reversing their trend. One of the oft-cited headwinds facing the dollar is positioning, yet there is a major discrepancy between positioning in DM and EM currencies versus the U.S. dollar. In aggregate, investors – asset managers and leveraged funds – have neutral exposure to DM currencies, but they are very long liquid EM exchange rates such as the BRL, MXN, ZAR and RUB versus the greenback. The dollar strength will occur mostly versus EM and commodities currencies. In other words, the euro, other European currencies and the yen will outperform EM exchange rates. I have less conviction on global bond yields. While global growth will disappoint, yields have already fallen a lot and the U.S. economy is currently not weak enough to justify around 90 basis points of rate cuts over the next 12 months. Mathieu: Before we move on to investment recommendations, Anastasios, you have done a lot of interesting work on the outlook for U.S. profits. What is the message of your analysis? Chart 15 (ANASTASIOS)Gravitational Pull
Gravitational Pull
Gravitational Pull
Anastasios: While markets cheered the trade truce following the recent G-20 meeting, no tariff rollback was agreed. Since the tariff rate on $200bn of Chinese imports went up from 10% to 25% on May 10, odds are high that manufacturing will remain in the doldrums. This will likely continue to weigh on profits for the remainder of the year. Profit growth should weaken further in the coming six months. Periods of falling manufacturing PMIs result in larger negative earnings growth surprises as market forecasters rarely anticipate the full breadth and depth of slowdowns. Absent profit growth, equity markets lack the necessary ‘oxygen’ for a durable high-quality rally. Until global growth momentum turns, investors should fade rallies. Our four-factor SPX EPS growth model is flirting with the contraction zone. In addition, our corporate pricing power proxy and Goldman Sachs’ Current Activity Indicator both send a distress signal for SPX profits (Chart 15). Already, more than half of the S&P 500 GICS1 sectors’ profits are estimated to have contracted in Q2, and three sectors could see declining revenues on a year-over-year basis, according to I/B/E/S data. Q3 depicts an equally grim profit picture that will also spill over to Q4. Adding it all up, profits will underwhelm into year-end. Mathieu: Doug, you do not share Anastasios’s anxiety. What offsets do you foresee? Moreover, you are not concerned by the U.S. corporate balance sheets. Can you share why? Doug Peta: As it relates to earnings, we foresee offsets from a revival in the rest of the world. Increasingly accommodative global monetary policy and reviving Chinese growth will give global ex-U.S. economies a boost. That inflection may go largely unnoticed in U.S. GDP, but it will help the S&P 500, as U.S.-based multinationals’ earnings benefit from increased overseas demand and a weaker dollar. When it comes to corporate balance sheets, shifting some of the funding burden to debt from equity when interest rates are at generational lows is a no-brainer. Even so, non-financial corporates have not added all that much leverage (Chart 16). Low interest rates, wide profit margins and conservative capex have left them with ample free cash flow to service their obligations (Chart 17). Chart 16 (DOUG)Corporations Have Not Added Much Leverage ...
Corporations Have Not Added Much Leverage ...
Corporations Have Not Added Much Leverage ...
Chart 17 (DOUG)...Though They Have Ample Cash Flow To Service It
...Though They Have Ample Cash Flow To Service It
...Though They Have Ample Cash Flow To Service It
Every single viable corporate entity with an effective federal tax rate above 21% became a better credit when the top marginal rate was cut from 35% to 21%. Every such corporation now has more net income with which to service debt, and will have that income unless the tax code is revised. You can’t see it in EBITDA multiples, but it will show up in reduced defaults. Mathieu: The last, and most important question. What are each of your main investment recommendations to capitalize on the economic trends you anticipate over the coming 6-12 months? Let’s start with the pessimists: Arthur: First, the rally in global cyclicals and China plays since December has been premature and is at risk of unwinding as global growth and cyclical profits disappoint. Historical evidence suggests that global share prices have not led but have actually been coincident with the global manufacturing PMI (Chart 18). The recent divergence is unprecedented. Chart 18 (ARTHUR)Global Stocks Historically Did Not Lead PMIs
Global Stocks Historically Did Not Lead PMIs
Global Stocks Historically Did Not Lead PMIs
Second, EM risk assets and currencies remain vulnerable. EM and Chinese earnings per share are shrinking. The leading indicators signal that the rate of contraction will deepen, at least the end of this year (Chart 19). Asset allocators should continue underweighting EM versus DM equities. Finally, my strongest-conviction, market-neutral trade is to short EM or Chinese banks and go long U.S. banks. The latter are much healthier than EM/Chinese ones, as we discussed in our recent report.6 Anastasios: The U.S. Equity Strategy team is shifting away from a cyclical and toward a more defensive portfolio bent. Our highest conviction view is to overweight mega caps versus small caps. Small caps are saddled with debt and are suffering a margin squeeze. Moreover, approximately 600 constituents of the Russell 2000 have no forward profits. Only one S&P 500 company has negative forward EPS. Given that both the S&P and the Russell omit these figures from the forward P/E calculation, this is masking the small cap expensiveness. When adjusted for this discrepancy, small caps are trading at a hefty premium versus large caps (Chart 20). Chart 19 (ARTHUR)China And EM Profits Are Contracting
China And EM Profits Are Contracting
China And EM Profits Are Contracting
Chart 20 (ANASTASIOS)Continue To Avoid Small Caps
Continue To Avoid Small Caps
Continue To Avoid Small Caps
We have also upgraded the S&P managed health care and the S&P hypermarkets groups. If the economic slowdown persists into early 2020, both of these defensive subgroups will fare well. In mid-April, we lifted the S&P managed health care group to an above benchmark allocation and posited that the selloff in this group was overdone as the odds of “Medicare For All” becoming law were slim. Moreover, a tight labor market along with melting medical cost inflation would boost the industry’s margins and profits (Chart 21). This week, we upgraded the defensive S&P hypermarkets index to overweight arguing that the souring macro landscape coupled with a firming industry demand outlook will support relative share prices (Chart 22). Chart 21 (ANASTASIOS)Buy Hypermarkets
Buy Hypermarkets
Buy Hypermarkets
Chart 22 (ANASTASIOS)Stick With Managed Health Care
Stick With Managed Health Care
Stick With Managed Health Care
Dhaval: To be fair, I am not a pessimist. Provided the global bond yield stays well below 2.5 percent, the support to risk-asset valuations will prevent a major dislocation. But in a growth down-oscillation, the big game in town will be sector rotation into pro-defensive investment plays, especially into those defensives that have underperformed (Chart 23). Chart 23 (DHAVAL)Switch Out Of Growth-Sensitives Into Healthcare
Switch Out Of Growth-Sensitives Into Healthcare
Switch Out Of Growth-Sensitives Into Healthcare
On this basis: Overweight Healthcare versus Industrials. Overweight the Eurostoxx 50 versus the Shanghai Composite and the Nikkei 225. Overweight U.S. T-bonds versus German bunds. Overweight the JPY in a portfolio of G10 currencies. Mathieu: And now, the optimists: Doug: So What? is the overriding question that guides all of BCA’s research: What is the practical investment application of this macro observation? But Why Now? is a critical corollary for anyone allocating investment capital: Why is the imbalance you’ve observed about to become a problem? As Herbert Stein said, “If something cannot go on forever, it will stop.” Imbalances matter, but Dornbusch’s Law counsels patience in repositioning portfolios on their account: “Crises take longer to arrive than you can possibly imagine, but when they do come, they happen faster than you can possibly imagine.” Look at Chart 24, which shows a vast white sky (bull markets) with intermittent clusters of gray (recessions) and light red (bear markets) clouds. Market inflections are severe, but uncommon. When the default condition of an economy is to grow, and equity prices to rise, it is not enough for an investor to identify an imbalance, s/he also has to identify why it’s on the cusp of reversing. Right now, as it relates to the U.S., there aren’t meaningful imbalances in either markets or the real economy. Chart 24 (DOUG)Recessions And Bear Markets Travel Together
Recessions And Bear Markets Travel Together
Recessions And Bear Markets Travel Together
Even if we had perfect knowledge that a recession would arrive in 18 months, now would be way too early to sell. The S&P 500 has historically peaked an average of six months before the onset of a recession, and it has delivered juicy returns in the year preceding that peak (Table 1). Bull markets tend to sprint to the finish line (Chart 25). If this one is like its predecessors, an investor risks significant relative underperformance if s/he fails to participate in its go-go latter stages. Table 1 (DOUG)The S&P 500 Doesn’t Peak Until Six Months Before A Recession …
What Goes On Between Those Walls? BCA’s Diverging Views In The Open
What Goes On Between Those Walls? BCA’s Diverging Views In The Open
Chart 25
We are bullish on the outlook for the next six to twelve months, and recommend overweighting equities and spread product in balanced U.S. portfolios while significantly underweighting Treasuries. Peter: I agree with Doug. Equity bear markets seldom occur outside of recessions and recessions rarely occur when monetary policy is accommodative. Policy is currently easy, and will get even more stimulative if the Fed and several other central banks cut rates. Global equities are not super cheap, but they are not particularly expensive either. They currently trade at about 15-times forward earnings. Given the ultra-low level of global bond yields, this generates an equity risk premium (ERP) that is well above its historical average (Chart 26). One should favor stocks over bonds when the ERP is high. Chart 26A (PETER)Equity Risk Premia Remain Elevated (I)
Equity Risk Premia Remain Elevated (I)
Equity Risk Premia Remain Elevated (I)
Chart 26B (PETER)Equity Risk Premia Remain Elevated (II)
Equity Risk Premia Remain Elevated (II)
Equity Risk Premia Remain Elevated (II)
The ERP is especially elevated outside the United States. This is partly because non-U.S. stocks trade at a meager 13-times forward earnings, but it also reflects the fact that bond yields are lower overseas. Chart 27 (PETER)EM And Euro Area Equities Outperform When Global Growth Improves
EM And Euro Area Equities Outperform When Global Growth Improves
EM And Euro Area Equities Outperform When Global Growth Improves
As global growth accelerates, the dollar will weaken. Equity sectors and regions with a more cyclical bent will benefit (Chart 27). We expect to upgrade EM and European stocks later this summer. A softer dollar will also benefit gold. Bullion will get a further boost early next decade when inflation begins to accelerate. We went long gold on April 17, 2019 and continue to believe in this trade. Rob: For fixed income investors, the most obvious way to play a combination of monetary easing and recovering global growth is to overweight corporate debt versus government bonds (Chart 28). Within the U.S., corporate bond valuations look more attractive in high-yield over investment grade. Assuming a benign outlook for default risk in a reaccelerating U.S. economy, with the Fed easing, going for the carry in high-yield looks interesting. Emerging market credit should also do well if we see a bit of U.S. dollar weakness and additional stimulus measures in China. Chart 28 (ROB)Best Bond Bets: Overweight Global Corporates & Inflation-Linked Bonds
Best Bond Bets: Overweight Global Corporates & Inflation-Linked Bonds
Best Bond Bets: Overweight Global Corporates & Inflation-Linked Bonds
European corporates, however, may end up being the big winner if the ECB chooses to restart its Asset Purchase Program and ramps up its buying of European company debt. There are fewer restrictions for the ECB to buy corporates compared to the self-imposed limits on government bond purchases. The ECB would be entering a political minefield if it chose to buy more Italian debt and less German debt, but nobody would mind if the ECB helped finance European companies by buying their bonds. If one expects reflation to be successful, a below-benchmark stance on portfolio duration also makes sense given the current depressed level of government bond yields worldwide. Yields are more likely to grind upward than spike higher, and will be led first by increasing inflation expectations. Inflation-linked bonds should feature prominently in fixed income portfolios, especially in the U.S. where TIPS will outperform nominal yielding Treasuries. Mathieu: Thank you very much to all of you. Below is a comparative summary of the main arguments and investment recommendations of each camp. Summary Of Views And Recommendations
What Goes On Between Those Walls? BCA’s Diverging Views In The Open
What Goes On Between Those Walls? BCA’s Diverging Views In The Open
What Goes On Between Those Walls? BCA’s Diverging Views In The Open
What Goes On Between Those Walls? BCA’s Diverging Views In The Open
Anastasios Avgeriou U.S. Equity Strategist anastasios@bcaresearch.com Peter Berezin Chief Global Strategist peterb@bcaresearch.com Arthur Budaghyan Chief Emerging Markets Strategist arthurb@bcaresearch.com Dhaval Joshi Chief European Investment Strategist dhaval@bcaresearch.com Doug Peta Chief U.S. Investment Strategist dougp@bcaresearch.com Robert Robis Chief Fixed Income Strategist rrobis@bcaresearch.com Mathieu Savary The Bank Credit Analyst mathieu@bcaresearch.com Footnotes 1 To be fair to each individual involved, this is simplifying their views. Even within each camp, the negativity or positivity ranges on a spectrum, as you will be able to tell from the debate itself. 2 Please see BCA U.S. Equity Strategy Weekly Report, “Signal Vs. Noise,” dated December 17, 2018, available at uses.bcaresearch.com. 3 Please see BCA U.S. Equity Strategy Weekly Report, “A Recession Thought Experiment,” dated June 10, 2019, available at uses.bcaresearch.com. 4 Please see the European Investment Strategy Weekly Report “Risk: The Great Misunderstanding Of Finance,” October 25, 2018 available at eis.bcaresearch.com. 5 France is a good proxy for the euro area. 6 Please see Emerging Markets Strategy Weekly Report, “On Chinese Banks And Brazil,” available at ems.bcaresearch.com.
Chart I-1Chinese Bank Share Prices Are On Edge
Chinese Bank Share Prices Are On Edge
Chinese Bank Share Prices Are On Edge
Banks are crucial to financing the private sector as well as all levels of government in China. Not only do banks originate a substantial share of credit, but also they account for 82% of purchases of government bonds. That is why today we revisit the fundamentals of the Chinese banking sector. Besides, their equity valuations appear very cheap, and many investors are tempted to buy their shares. Chinese banks’ financial ratios look healthy and valuations appear extremely cheap because they have not recognized and provisioned for non-performing assets. By expanding their balance sheets enormously and not provisioning for bad assets, their profits have mushroomed. Banks have retained a share of these profits, boosting their capital. Yet, their share prices have been flat over the past 10 years. Recently, investable bank stocks have been lingering around their December lows. Another gap down could be lurking around the corner (Chart I-1). We highlight their poor financial health in the section below, where we perform stress tests for both large as well as small and medium sized banks (SMB). The principal danger to shareholders is equity dilution that will continue occurring among mainland banks (Chart I-2). Our bearish view on Chinese bank stocks has not been contingent on a systematic financial crisis but on inevitable and substantial equity dilution. Investment conclusions: Absolute return investors should stay clear of Chinese bank stocks – they are the ultimate value trap. For relative value traders, we reiterate our long U.S. banks/short Chinese bank shares trade, and within the latter our long large/short SMB stocks position (Chart I-3). Chart I-2Beware Of Equity Dilution
Beware Of Equity Dilution
Beware Of Equity Dilution
Chart I-3Our Trades On Chinese Banks
Our Trades On Chinese Banks
Our Trades On Chinese Banks
Large Versus Small And Medium Banks China’s banking system consists of five large banks (Industrial and Commercial Bank of China, China Construction Bank, Bank of China, Agricultural Bank of China, and Bank of Communications) and about 3150 small- and medium-sized banks (SMBs). All five large banks are publically listed but the central government still holds about 70-80% of their equity. About 36 of the SMBs are also listed but the central authorities in Beijing have a stake in some of the medium-sized banks. Notably, the central government has no equity in any of the small banks. In recent years, SMBs have been playing a greater role in sustaining the credit boom: First, on aggregate SMBs have actually outgrown the five large banks in terms of balance sheet size. The former’s risk-weighted assets1 (RWAs) of RMB 73 trillion exceeds the RMB 65 trillion of large banks (Chart I-4). The value of RWAs emphasizes banks’ claims on enterprises, non-bank financial institutions and households over holdings of government bonds. Hence, RWAs of banks are a more pertinent measure of non-government financing than total assets. Second, over the past 12 months large banks and SMBs have accounted for 40% and 60% of the rise in the aggregate banking system’s RWAs, respectively (Chart I-5). Therefore, further credit acceleration will be difficult to engineer if – as we discuss below – SMBs begin retrenching under regulatory pressures and amid tighter market financing in the wake of the Baoshang bank failure. Chart I-4SMBs Have Outgrown Large Ones
SMBs Have Outgrown Large Ones
SMBs Have Outgrown Large Ones
Chart I-5SMBs Have Contributed Enormously To The Credit Boom
SMBs Have Contributed Enormously To The Credit Boom
SMBs Have Contributed Enormously To The Credit Boom
Finally, there has so far been no deleveraging among SMBs. Large banks’ RWAs-to-nominal GDP ratio has been in decline since 2014, but the same ratio for SMBs has not dropped at all (Chart I-6). This chart corroborates that the credit boom between 2015 and 2017 was driven by SMBs, rather than by large banks. In fact, SMBs along with shadow banking are what primarily drove the credit boom that occurred over the past decade. This confirms the thesis that the unprecedented credit bubble has spiraled beyond the central authorities’ control. While China’s entire banking system is in poor health, SMBs are in considerably worse shape than large ones. In particular: SMBs have much more assets classified as equity and other investments than large banks (Chart I-7). Equity and other investments stands for non-standard credit assets that are typically much riskier than loans and corporate bonds. This is the principal reason why in our stress test we use higher ratios of non-performing assets for SMBs than for large banks. Chart I-6No Deleveraging Among SMBs
No Deleveraging Among SMBs
No Deleveraging Among SMBs
Chart I-7SMBs Exposure To Non-StandarD Credit Assets Is Huge
SMBs Exposure To Non-StandarD Credit Assets Is Huge
SMBs Exposure To Non-StandarD Credit Assets Is Huge
Chart I-8Large Banks Versus SMBs
Large Banks Versus SMBs
Large Banks Versus SMBs
Big banks are better capitalized than SMBs. The capital adequacy ratio among big banks is higher compared with the other banks (Chart I-8, top panel). Similarly, the ratio of non-performing loans (NPL) to total loans is considerably lower for large banks than for SMBs (Chart I-8, bottom panel). On the liquidity side, SMBs are more dependent on the wholesale funding market than their larger peers. Interbank transactions account for 10% of SMBs own liabilities. On the other hand, big banks are the main lenders in the interbank market. Bottom Line: SMBs have become more important than large ones in providing financing to companies and households. Yet these SMBs are much more vulnerable. A Stress Test We conducted separate stress tests on large banks and SMBs. Our findings are not optimistic. Some 71% of equity of SMBs will be wiped out if 14% of their RWAs turn sour (Table I-1). 43% of large banks’ equity will be impaired if 12% of their RWAs become non-performing (Table I-2).
Chart I-
Chart I-
The reason we use RWAs rather than loans is because banks have been accumulating claims on enterprises, non-bank financial institutions and households beyond their loan books. Hence, RWAs better captures all credit assets. We use a higher impairment rate for SMBs than for large banks because the former have substantially more non-standard credit assets. Typically, the quality of non-standard credit assets is inferior to those of corporate bonds or loans. We used the following assumptions in our stress tests: For large banks, we assumed non-performing assets (NPAs) ratios of 10% in the optimistic scenario, 12% (baseline), and 14% (pessimistic) (Table I-2). For SMBs, we employed NPAs ratios of 12% (optimistic), 14% (baseline), and 16% (pessimistic) (Table I-1). The magnitude and duration of China’s current credit boom has considerably surpassed that of the 1990s, when Chinese banks held over 25% of non-performing loans (Chart I-9). Therefore, our stress test assumption that the NPAs ratio will rise above 10% is reasonable. Chart I-9China's Credit Booms In Perspective
China's Credit Booms In Perspective
China's Credit Booms In Perspective
We applied a 30% recovery rate on NPAs. The recovery rate on Chinese banks’ NPLs from 2001 to 2005 was 20%. This occurred amid much stronger economic growth. Thus, an assumption of a 30% recovery rate today is realistic. Finally, we calculated overvaluations assuming the fair price-to-book value ratio for all banks is 1. How has it been possible for banks in China to continue expanding their balance sheets aggressively despite such moribund financial health? Banks can operate and expand their balance sheets with zero or even negative de facto equity capital, so long as they obtain liquidity from other banks or the central bank. This is how many Chinese SMBs have been operating in recent years. Barring institutional and regulatory constraints, banks theoretically can expand their balance sheets indefinitely by creating loans and deposits “out of thin air.” We have deliberated extensively in past reports that banks do not intermediate savings or deposits into loans and credit. Rather, they create deposits when they make a loan to or buy an asset from a non-bank entity. Loans and deposits are nothing other than accounting entries on banks’ books. It is regulators’ and shareholders’ forbearance – or lack of it – that allows banks to, or prevents banks from, expanding their balance sheets. Although Chinese authorities have been easing both monetary and fiscal policies, they have not completely abandoned their regulatory tightening efforts on banks and shadow banking, or their plans to curb leverage and speculation in the real estate market. For example, in April bank regulators released draft rules on how banks should classify all types of assets and provision for them. Over the past several years, many banks have transformed their bad loans into non-loan assets to disguise the true level of their non-performing loans (NPLs). The new regulation, if and when it is adopted and properly executed, will force banks to recognize NPAs and increase their provisions. Ultimately, this will substantially impair banks’ capital and dampen their ability to originate new credit – both in the form of making loans and buying securities. Consequently, the credit impulse will relapse and the business cycle recovery will be delayed. Bottom Line: If banks in China are forced by regulators to properly recognize and provision for NPAs, large banks would become substantially undercapitalized while many SMBs would have little equity capital left. That would hammer their ability to finance the economy. Investment Ramifications Given the increased importance of SMBs in China, the precarious state of their financial health has become a matter of macro significance. Even if regulators partially reinforce recognition of provisions for NPAs, aggregate credit growth will decelerate. A simple simulation to illustrate this point: If SMBs RWAs growth were to decelerate from 11% currently to 8% – which is the level of current nominal GDP growth – large banks’ RWA annual growth would need to surge from 8% now to 16%. For all banks’ RWA growth to accelerate from the current 9.5% to 12%. The latter is probably what is required to promote an economic recovery. Such a ramp-up in large banks’ RWAs is unlikely, given they would also be facing stricter regulatory requirements. The key point is that the positive effects of monetary and fiscal easing continue to be hampered by regulatory tightening on the credit system. The latter will delay a business cycle recovery in China. For now, although the credit plus fiscal spending impulse has picked up, economic growth has not yet revived (Chart I-10, top two panels). The reason has been a declining marginal propensity to spend among households and companies (Chart I-10, bottom two panels). We have discussed this issue at great length in past reports. Chart I-10Stimulus Versus Marginal Propensity To Spend
Stimulus Versus Marginal Propensity To Spend
Stimulus Versus Marginal Propensity To Spend
Chart I-11Chinese Economy: No Recovery So Far
Chinese Economy: No Recovery So Far
Chinese Economy: No Recovery So Far
Chart I-12Chinese Corporate EPS: The Outlook Is Downbeat
Chinese Corporate EPS: The Outlook Is Downbeat
Chinese Corporate EPS: The Outlook Is Downbeat
Consistently, nominal industrial output, car sales and smartphone sales as well as total imports are either very weak or are in outright contraction (Chart I-11). All series in Chart I-11 and I-12 include June data. Importantly, Chinese corporate per-share earnings in RMB are contracting for the MSCI investable universe and will soon be contracting for A-share companies as well (Chart I-12). We maintain our negative outlook for EM risk assets and China-plays globally due to our downbeat view on China’s credit cycle. This differs from BCA’s House View, which is positive on global/Chinese growth. Arthur Budaghyan Chief Emerging Markets Strategist arthurb@bcaresearch.com Lin Xiang, Research Analyst linx@bcaresearch.com Footnotes
Highlights Analysis on Brazil is available below. If banks in China are forced by regulators to properly recognize and provision for non-performing assets, large banks would become substantially undercapitalized while many small- and medium-sized banks (SMBs) would have little equity capital left. That would hammer their ability to finance the economy. Provided on aggregate SMBs have actually outgrown larger ones in terms of balance sheet size, the precarious state of the former’s financial health has become a matter of macro significance. The principal danger to shareholders of mainland banks is equity dilution. We reiterate our long U.S. banks/short Chinese bank shares trade, and within the latter our long large/short SMB stocks position. Feature Chinese Banks: A Value Trap Chart I-1Chinese Bank Share Prices Are On Edge
Chinese Bank Share Prices Are On Edge
Chinese Bank Share Prices Are On Edge
Banks are crucial to financing the private sector as well as all levels of government in China. Not only do banks originate a substantial share of credit, but also they account for 82% of purchases of government bonds. That is why today we revisit the fundamentals of the Chinese banking sector. Besides, their equity valuations appear very cheap, and many investors are tempted to buy their shares. Chinese banks’ financial ratios look healthy and valuations appear extremely cheap because they have not recognized and provisioned for non-performing assets. By expanding their balance sheets enormously and not provisioning for bad assets, their profits have mushroomed. Banks have retained a share of these profits, boosting their capital. Yet, their share prices have been flat over the past 10 years. Recently, investable bank stocks have been lingering around their December lows. Another gap down could be lurking around the corner (Chart I-1). We highlight their poor financial health in the section below, where we perform stress tests for both large as well as small and medium sized banks (SMB). The principal danger to shareholders is equity dilution that will continue occurring among mainland banks (Chart I-2). Our bearish view on Chinese bank stocks has not been contingent on a systematic financial crisis but on inevitable and substantial equity dilution. Investment conclusions: Absolute return investors should stay clear of Chinese bank stocks – they are the ultimate value trap. For relative value traders, we reiterate our long U.S. banks/short Chinese bank shares trade, and within the latter our long large/short SMB stocks position (Chart I-3). Chart I-2Beware Of Equity Dilution
Beware Of Equity Dilution
Beware Of Equity Dilution
Chart I-3Our Trades On Chinese Banks
Our Trades On Chinese Banks
Our Trades On Chinese Banks
Large Versus Small And Medium Banks China’s banking system consists of five large banks (Industrial and Commercial Bank of China, China Construction Bank, Bank of China, Agricultural Bank of China, and Bank of Communications) and about 3150 small- and medium-sized banks (SMBs). All five large banks are publically listed but the central government still holds about 70-80% of their equity. About 36 of the SMBs are also listed but the central authorities in Beijing have a stake in some of the medium-sized banks. Notably, the central government has no equity in any of the small banks. In recent years, SMBs have been playing a greater role in sustaining the credit boom: First, on aggregate SMBs have actually outgrown the five large banks in terms of balance sheet size. The former’s risk-weighted assets1 (RWAs) of RMB 73 trillion exceeds the RMB 65 trillion of large banks (Chart I-4). Recently, investable bank stocks have been lingering around their December lows. Another gap down could be lurking around the corner. The value of RWAs emphasizes banks’ claims on enterprises, non-bank financial institutions and households over holdings of government bonds. Hence, RWAs of banks are a more pertinent measure of non-government financing than total assets. Second, over the past 12 months large banks and SMBs have accounted for 40% and 60% of the rise in the aggregate banking system’s RWAs, respectively (Chart I-5). Therefore, further credit acceleration will be difficult to engineer if – as we discuss below – SMBs begin retrenching under regulatory pressures and amid tighter market financing in the wake of the Baoshang bank failure. Chart I-4SMBs Have Outgrown Large Ones
SMBs Have Outgrown Large Ones
SMBs Have Outgrown Large Ones
Chart I-5SMBs Have Contributed Enormously To The Credit Boom
SMBs Have Contributed Enormously To The Credit Boom
SMBs Have Contributed Enormously To The Credit Boom
Finally, there has so far been no deleveraging among SMBs. Large banks’ RWAs-to-nominal GDP ratio has been in decline since 2014, but the same ratio for SMBs has not dropped at all (Chart I-6). This chart corroborates that the credit boom between 2015 and 2017 was driven by SMBs, rather than by large banks. In fact, SMBs along with shadow banking are what primarily drove the credit boom that occurred over the past decade. This confirms the thesis that the unprecedented credit bubble has spiraled beyond the central authorities’ control. While China’s entire banking system is in poor health, SMBs are in considerably worse shape than large ones. In particular: SMBs have much more assets classified as equity and other investments than large banks (Chart I-7). Equity and other investments stands for non-standard credit assets that are typically much riskier than loans and corporate bonds. This is the principal reason why in our stress test we use higher ratios of non-performing assets for SMBs than for large banks. Chart I-6No Deleveraging Among SMBs
No Deleveraging Among SMBs
No Deleveraging Among SMBs
Chart I-7SMBs Exposure To Non-StandarD Credit Assets Is Huge
SMBs Exposure To Non-StandarD Credit Assets Is Huge
SMBs Exposure To Non-StandarD Credit Assets Is Huge
Chart I-8Large Banks Versus SMBs
Large Banks Versus SMBs
Large Banks Versus SMBs
Big banks are better capitalized than SMBs. The capital adequacy ratio among big banks is higher compared with the other banks (Chart I-8, top panel). Similarly, the ratio of non-performing loans (NPL) to total loans is considerably lower for large banks than for SMBs (Chart I-8, bottom panel). On the liquidity side, SMBs are more dependent on the wholesale funding market than their larger peers. Interbank transactions account for 10% of SMBs own liabilities. On the other hand, big banks are the main lenders in the interbank market. Bottom Line: SMBs have become more important than large ones in providing financing to companies and households. Yet these SMBs are much more vulnerable. A Stress Test We conducted separate stress tests on large banks and SMBs. Our findings are not optimistic. Some 71% of equity of SMBs will be wiped out if 14% of their RWAs turn sour (Table I-1). 43% of large banks’ equity will be impaired if 12% of their RWAs become non-performing (Table I-2).
Chart I-
Chart I-
The reason we use RWAs rather than loans is because banks have been accumulating claims on enterprises, non-bank financial institutions and households beyond their loan books. Hence, RWAs better captures all credit assets. We use a higher impairment rate for SMBs than for large banks because the former have substantially more non-standard credit assets. Typically, the quality of non-standard credit assets is inferior to those of corporate bonds or loans. We used the following assumptions in our stress tests: For large banks, we assumed non-performing assets (NPAs) ratios of 10% in the optimistic scenario, 12% (baseline), and 14% (pessimistic) (Table I-2). For SMBs, we employed NPAs ratios of 12% (optimistic), 14% (baseline), and 16% (pessimistic) (Table I-1). The magnitude and duration of China’s current credit boom has considerably surpassed that of the 1990s, when Chinese banks held over 25% of non-performing loans (Chart I-9). Therefore, our stress test assumption that the NPAs ratio will rise above 10% is reasonable. Chart I-9China's Credit Booms In Perspective
China's Credit Booms In Perspective
China's Credit Booms In Perspective
We applied a 30% recovery rate on NPAs. The recovery rate on Chinese banks’ NPLs from 2001 to 2005 was 20%. This occurred amid much stronger economic growth. Thus, an assumption of a 30% recovery rate today is realistic. Finally, we calculated overvaluations assuming the fair price-to-book value ratio for all banks is 1. How has it been possible for banks in China to continue expanding their balance sheets aggressively despite such moribund financial health? Banks can operate and expand their balance sheets with zero or even negative de facto equity capital, so long as they obtain liquidity from other banks or the central bank. This is how many Chinese SMBs have been operating in recent years. Barring institutional and regulatory constraints, banks theoretically can expand their balance sheets indefinitely by creating loans and deposits “out of thin air.” We have deliberated extensively in past reports that banks do not intermediate savings or deposits into loans and credit. Rather, they create deposits when they make a loan to or buy an asset from a non-bank entity. Loans and deposits are nothing other than accounting entries on banks’ books. It is regulators’ and shareholders’ forbearance – or lack of it – that allows banks to, or prevents banks from, expanding their balance sheets. Although Chinese authorities have been easing both monetary and fiscal policies, they have not completely abandoned their regulatory tightening efforts on banks and shadow banking, or their plans to curb leverage and speculation in the real estate market. For example, in April bank regulators released draft rules on how banks should classify all types of assets and provision for them. Over the past several years, many banks have transformed their bad loans into non-loan assets to disguise the true level of their non-performing loans (NPLs). The new regulation, if and when it is adopted and properly executed, will force banks to recognize NPAs and increase their provisions. Although Chinese authorities have been easing both monetary and fiscal policies, they have not completely abandoned their regulatory tightening efforts on banks and shadow banking, or their plans to curb leverage and speculation in the real estate market. Ultimately, this will substantially impair banks’ capital and dampen their ability to originate new credit – both in the form of making loans and buying securities. Consequently, the credit impulse will relapse and the business cycle recovery will be delayed. Bottom Line: If banks in China are forced by regulators to properly recognize and provision for NPAs, large banks would become substantially undercapitalized while many SMBs would have little equity capital left. That would hammer their ability to finance the economy. Investment Ramifications Given the increased importance of SMBs in China, the precarious state of their financial health has become a matter of macro significance. Even if regulators partially reinforce recognition of provisions for NPAs, aggregate credit growth will decelerate. A simple simulation to illustrate this point: If SMBs RWAs growth were to decelerate from 11% currently to 8%, large banks’ RWA annual growth would need to surge from 8% now to 16% for all banks’ RWA growth to accelerate from the current 9.5% to 12%. The latter is probably what is required to promote an economic recovery. Such a ramp-up in large banks’ RWAs is unlikely, given they would also be facing stricter regulatory requirements. The key point is that the positive effects of monetary and fiscal easing continue to be hampered by regulatory tightening on the credit system. The latter will delay a business cycle recovery in China. For now, although the credit plus fiscal spending impulse has picked up, economic growth has not yet revived (Chart I-10, top two panels). The reason has been a declining marginal propensity to spend among households and companies (Chart I-10, bottom two panels). We have discussed this issue at great length in past reports. Consistently, nominal industrial output, car sales and smartphone sales as well as total imports are either very weak or are in outright contraction (Chart I-11). All series in Chart I-11 and I-12 include June data. Chart I-10Stimulus Versus Marginal Propensity To Spend
Stimulus Versus Marginal Propensity To Spend
Stimulus Versus Marginal Propensity To Spend
Chart I-11Chinese Economy: No Recovery So Far
Chinese Economy: No Recovery So Far
Chinese Economy: No Recovery So Far
Chart I-12Chinese Corporate EPS: The Outlook Is Downbeat
Chinese Corporate EPS: The Outlook Is Downbeat
Chinese Corporate EPS: The Outlook Is Downbeat
Importantly, Chinese corporate per-share earnings in RMB are contracting for the MSCI investable universe and will soon be contracting for A-share companies as well (Chart I-12). We maintain our negative outlook for EM risk assets and China-plays globally due to our downbeat view on China’s credit cycle. This differs from BCA’s House View, which is positive on global/Chinese growth. Arthur Budaghyan Chief Emerging Markets Strategist arthurb@bcaresearch.com Lin Xiang, Research Analyst linx@bcaresearch.com Brazil: Buy The Rumor, Sell The News? Having surged on the back of Congress’s initial approval of the social security reform, Brazilian financial markets are attempting to break above important technical resistance levels both in absolute and relative terms (Chart II-1 and Chart II-2). If the Bovespa decisively breaks above these technical resistance lines, it would mean it is in a structural bull market. A failure to break out will lead to a sizable setback. Chart II-1Are Brazilian Equities Poised For A Breakout In Absolute Terms…
Are Markets Poised For A Breakout In Absolute Terms...
Are Markets Poised For A Breakout In Absolute Terms...
Chart II-2…And Relative Terms?
...And Relative Terms?
...And Relative Terms?
We upgraded Brazilian equity and fixed-income markets right after the first round of presidential elections on October 7, but then downgraded them in early April. In retrospect, the downgrade was a miscalculation. Presently, investor confidence in Brazil is very high, sentiment is very bullish and markets are overbought. Faced with the choice of chasing the market higher or waiting, we are opting for the latter. Pension Reform: Necessary But Not Sufficient Chart II-3Public Debt-To-GDP Ratio Will Rise Further
Public Debt-To-GDP Ratio Will Rise Further
Public Debt-To-GDP Ratio Will Rise Further
The nation’s pension bill is a very positive and much-needed step in the structural reform process. However, in its current form, it is insufficient to make public debt dynamics sustainable – i.e., halt the rise in the government debt-to-GDP ratio (Chart II-3). Table II-1 illustrates the savings from the social security reform adopted in the lower house. As estimated by the Independent Fiscal Institute, an advisory think-tank of the Senate, the reform would bring only BRL 744 billion of savings over the next decade. Is this sufficient to stabilize the public debt-to-GDP ratio?
Chart II-
One way these reforms could contain the rise in the public debt-to-GDP ratio is if the savings generated significantly exceed the primary fiscal deficits over the next several years – i.e., the government runs continuous robust primary fiscal surpluses. Yet, the pension bill falls short of achieving this goal. The estimated savings in the first four years will likely be around BRL 130 billion. This amounts to annual savings of BRL 33 billion. Chart II-4 demonstrates that savings from the reform are too small to flip the government’s (often optimistic) projected primary fiscal deficit into a surplus in the forecast period. One way these reforms could contain the rise in the public debt-to-GDP ratio is if the savings generated significantly exceed the primary fiscal deficits over the next several years. Another scenario for stabilizing the public debt-to-GDP ratio is for interest rates to drop meaningfully below nominal GDP growth. Having plummeted amid very benign global and domestic backdrops, local currency bond yields still remain about 100 basis points above current nominal GDP growth (Chart II-5). It remains to be seen whether local currency borrowing costs will drop and stay below nominal GDP in the years to come. Chart II-4Primary Fiscal Balance Will Remain Negative Despite Pension Reform
Primary Fiscal Balance Will Remain Negative Despite Pension Reform
Primary Fiscal Balance Will Remain Negative Despite Pension Reform
Chart II-5Borrowing Costs Remain Above Nominal GDP Growth
Borrowing Costs Remain Above Nominal GDP Growth
Borrowing Costs Remain Above Nominal GDP Growth
Overall, the pension reform in current form does not guarantee public debt sustainability in Brazil: It is simply insufficient to get the government to run recurring primary fiscal surpluses. Another prerequisite – nominal GDP growth exceeding local bond yields over next several years – is contingent on further reforms as well as on a substantial improvement in confidence among investors, companies and households. It Is All About Confidence The sustainability of public debt, economic growth and financial markets are interlinked, with the common thread being confidence. In a virtuous cycle, financial markets typically rally while the currency stays firm. Subdued inflation will allow the central bank to rapidly reduce interest rates. This will help boost confidence among businesses and consumers, buoying the economy. In turn, lower policy rates could sustain the stampede into domestic bonds, pushing government borrowing costs below rising nominal GDP growth. At that point, the country’s public debt dynamics will become sustainable, the risk premium will continue to fall, and the nation’s financial markets will be in a secular bull market. On the contrary, a vicious cycle is possible if there is a negative external or internal shock that prompts the Brazilian real to depreciate by more than 10%. On the contrary, a vicious cycle is possible if there is a negative external or internal shock that prompts the Brazilian real to depreciate by more than 10%. In this case, the central bank cannot slash interest rates. On the contrary, government bond yields – which are presently at record lows – could or will likely rise (Chart II-6 and Chart II-7). These events will hurt confidence and suppress nominal GDP growth below borrowing costs. This could aggravate investors’ anxiety over Brazil’s public debt, leading them to demand a higher risk premium. As a result, a vicious cycle could unfold. Chart II-6Government Bond Yields Are At Historical Lows
Government Bond Yields Are At Historical Lows
Government Bond Yields Are At Historical Lows
Chart II-7Credit Spreads Are Very Tight
Credit Spreads Are Very Tight
Credit Spreads Are Very Tight
Chart II-8Commodity Prices And The BRL: Positive Correlation
Commodity Prices And The BRL: Positive Correlation
Commodity Prices And The BRL: Positive Correlation
To be clear, we are not presently forecasting the onset of a vicious cycle. Nevertheless, given our negative view on EM risk assets and currencies, we expect a pullback in the Brazilian real and risk assets in the near term. The U.S. dollar is about to rally, as we discussed in detail in last week’s report. Commodities prices will tumble as China’s growth downshift persists. Given that the Brazilian real is a high-beta currency and is often positively correlated with commodities prices (Chart II-8), it could depreciate quite a bit. Patience is especially warranted in the case of Brazilian equities because share prices have decoupled from corporate profits and the business cycle. Stock prices have surged despite plummeting net EPS revisions and contracting profits of non-financial and non-resource companies (Chart II-9) and relapsing economic growth (Chart II-10). Clearly, the rally has been driven by expanding equity multiples due to progress on the social security reform. Chart II-9Stock Prices Are Diverging From Corporate Profits
Stock Prices Are Diverging From Corporate Profits
Stock Prices Are Diverging From Corporate Profits
Chart II-10Domestic Demand Has Stalled
Domestic Demand Has Stalled
Domestic Demand Has Stalled
Bottom Line: A lot of good news has been priced into Brazilian financial markets. For now, the risk-reward profile is not attractive: investors should wait for a better entry point. This is true for both absolute return investors and dedicated EM equity and fixed-income managers. Andrija Vesic, Research Analyst andrijav@bcaresearch.com Arthur Budaghyan Chief Emerging Markets Strategist arthurb@bcaresearch.com Footnotes 1 Risk-weighted asset is a bank's assets or off-balance sheet exposures, weighted according to risk. It is used in determining the capital requirement or Capital Adequacy Ratio (CAR) for a financial institution. Usually, different classes of assets have different risk weights associated with them. Equity Recommendations Fixed-Income, Credit And Currency Recommendations
Chart II-
Chinese trade numbers are still weak. Exports in USD terms are contracting at a 1.3% annual pace, and imports are falling at a 7.3% rate. In CNY terms, imports growth is faring better, but nonetheless, remains slightly below zero. The Sino-U.S. trade tensions…
Incredibly, the tone shifted again in February, when Premier Li Keqiang and the PBoC publicly disputed whether the January credit spike represented “flood irrigation-style” stimulus, something Premier Li made clear was to be avoided. These shifts impacted…
The events of the past year have also demonstrated that the effectiveness of Chinese monetary policy has declined relative to past economic cycles. This, in conjunction with the reluctant/reactive nature of the monetary authorities, has clear implications for…
NOTE: There will be no report on Wednesday, July 17 due to our regular summer break. Highlights Chinese policymakers as well as the People’s Bank of China (PBoC) have historically been reactive, meaning they have typically waited for economic pain to become entrenched before accelerating reflationary measures. The agreement reached at the June G20 Summit to renew trade negotiations with the U.S., while temporary, takes the pressure off the immediate need to further stimulate the economy. While China has the ability to juice the economy, the pain threshold has been raised higher during this cycle, and the country’s leadership has been reluctant to let go of its financial deleveraging campaign. This approach has resulted in a “half measure” stimulus over the past 12 months. The outlook for Chinese stocks is negative over the next three months, as a flip-flop policy approach will increase market volatility. However, over a cyclical (i.e. six- to 12-month) time horizon, we are maintaining a bullish stance toward Chinese stocks in hedged currency terms. Feature Last week marked the first anniversary of the imposition of tariffs on imports from China by the U.S. – an event that has clearly had a lasting and meaningful impact on global economic activity. Last week was also the first anniversary of a significant monetary easing measure: China’s 3-month interbank repo rate fell 90 basis points on July 3, 2018, 3 days before the first tranche of import tariffs took effect. This decline was just under half of what would ultimately occur (the 3-month repo rate fell from 4.5% in early July to 2.4% in early August), and was taken as a sign by many investors that the PBoC had shifted to a maximum reflationary stance (Chart 1). Chart 1Indecisively Falling Interbank Rate
Indecisively Falling Interbank Rate
Indecisively Falling Interbank Rate
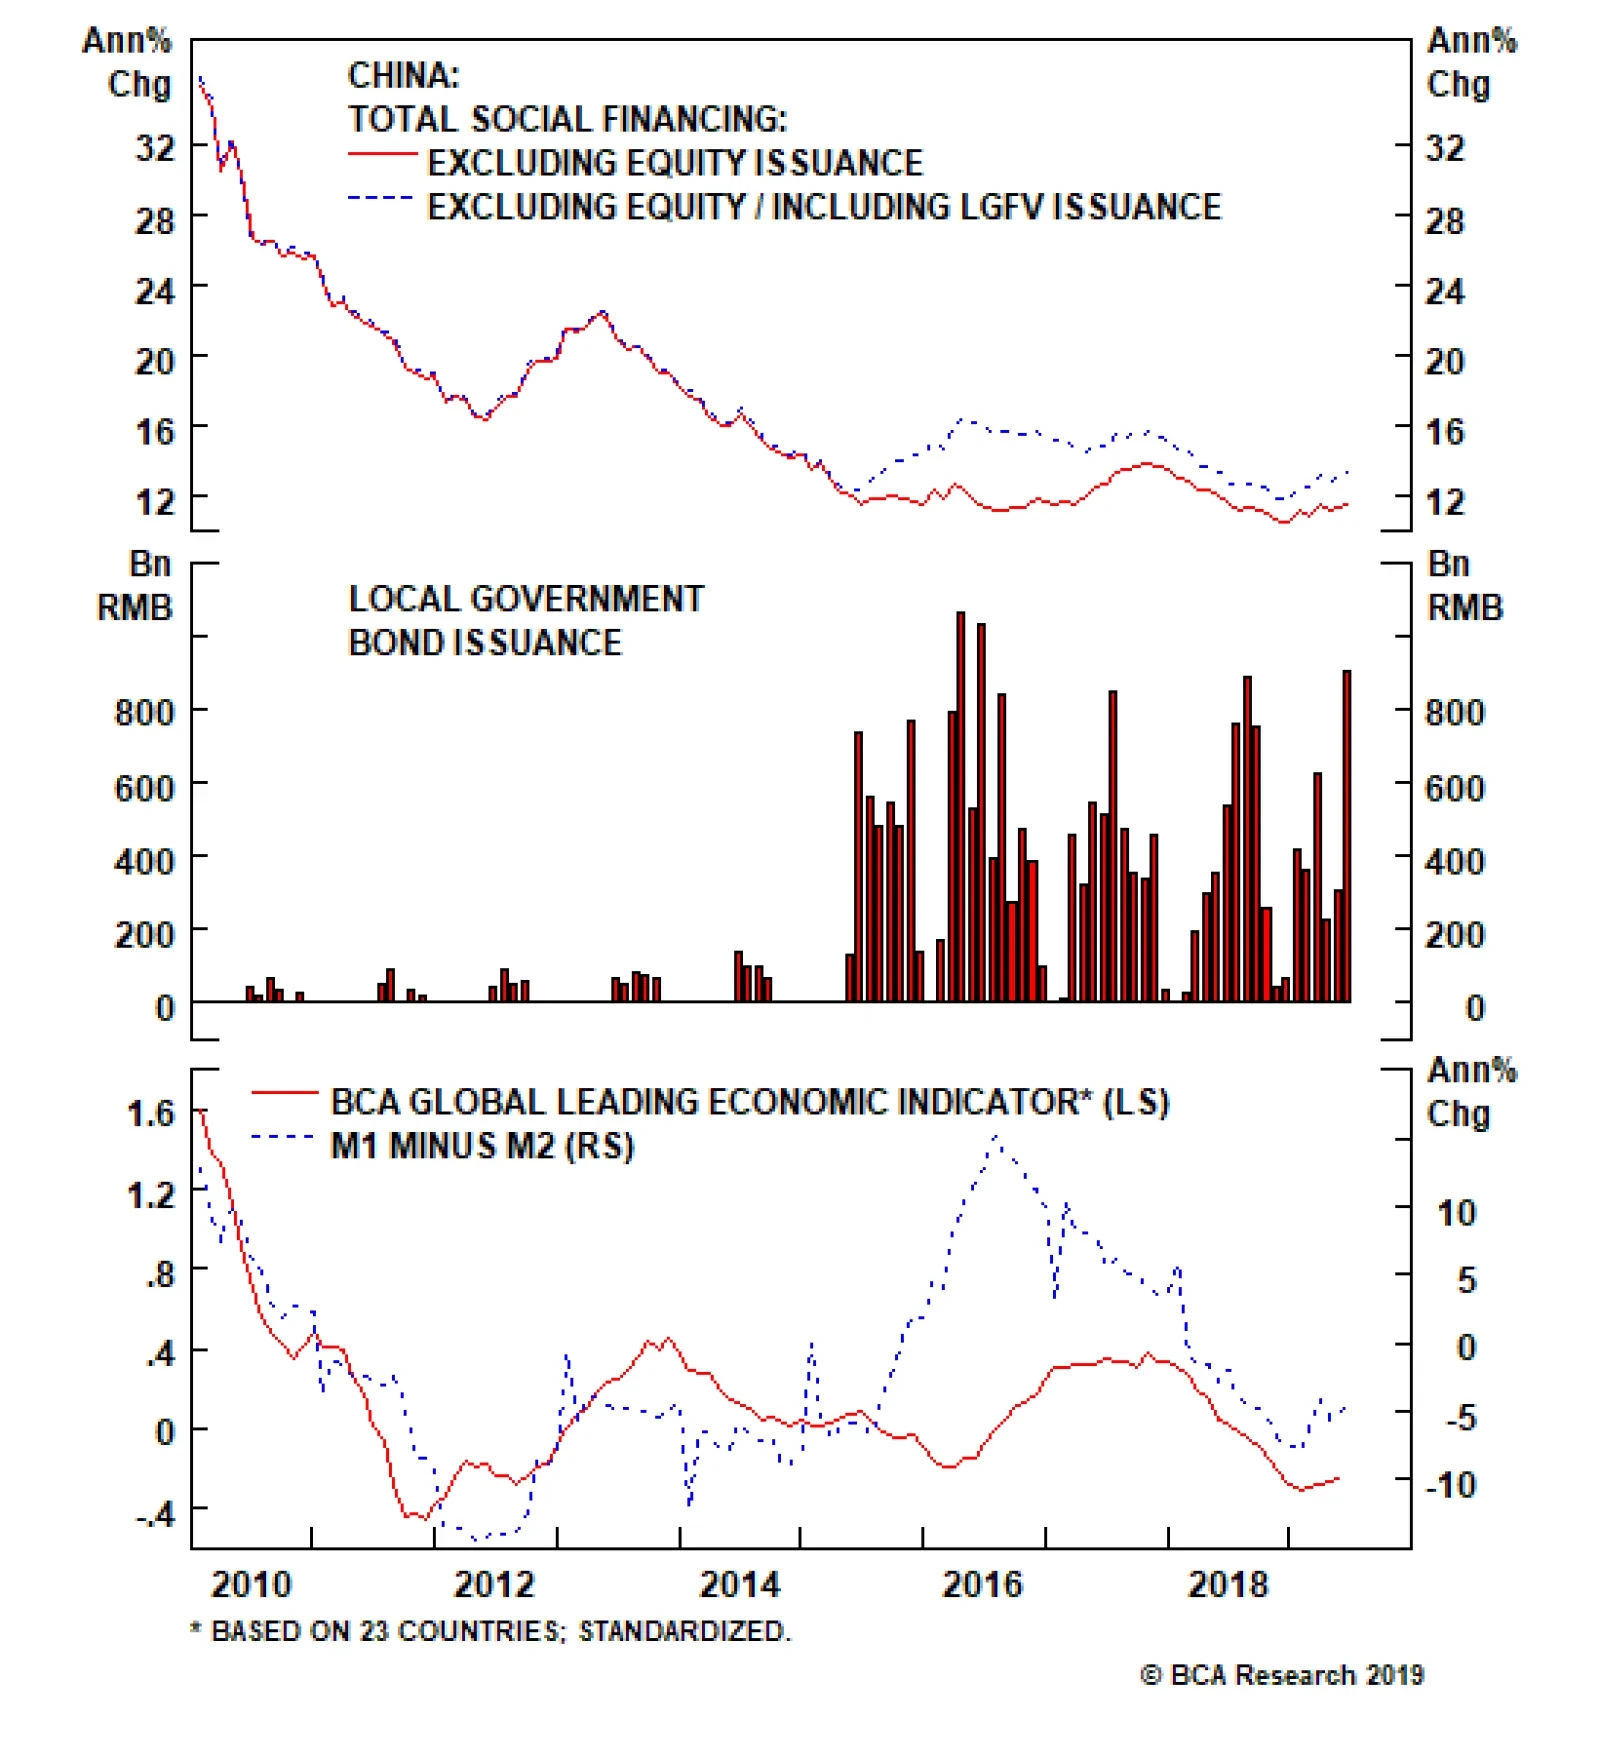
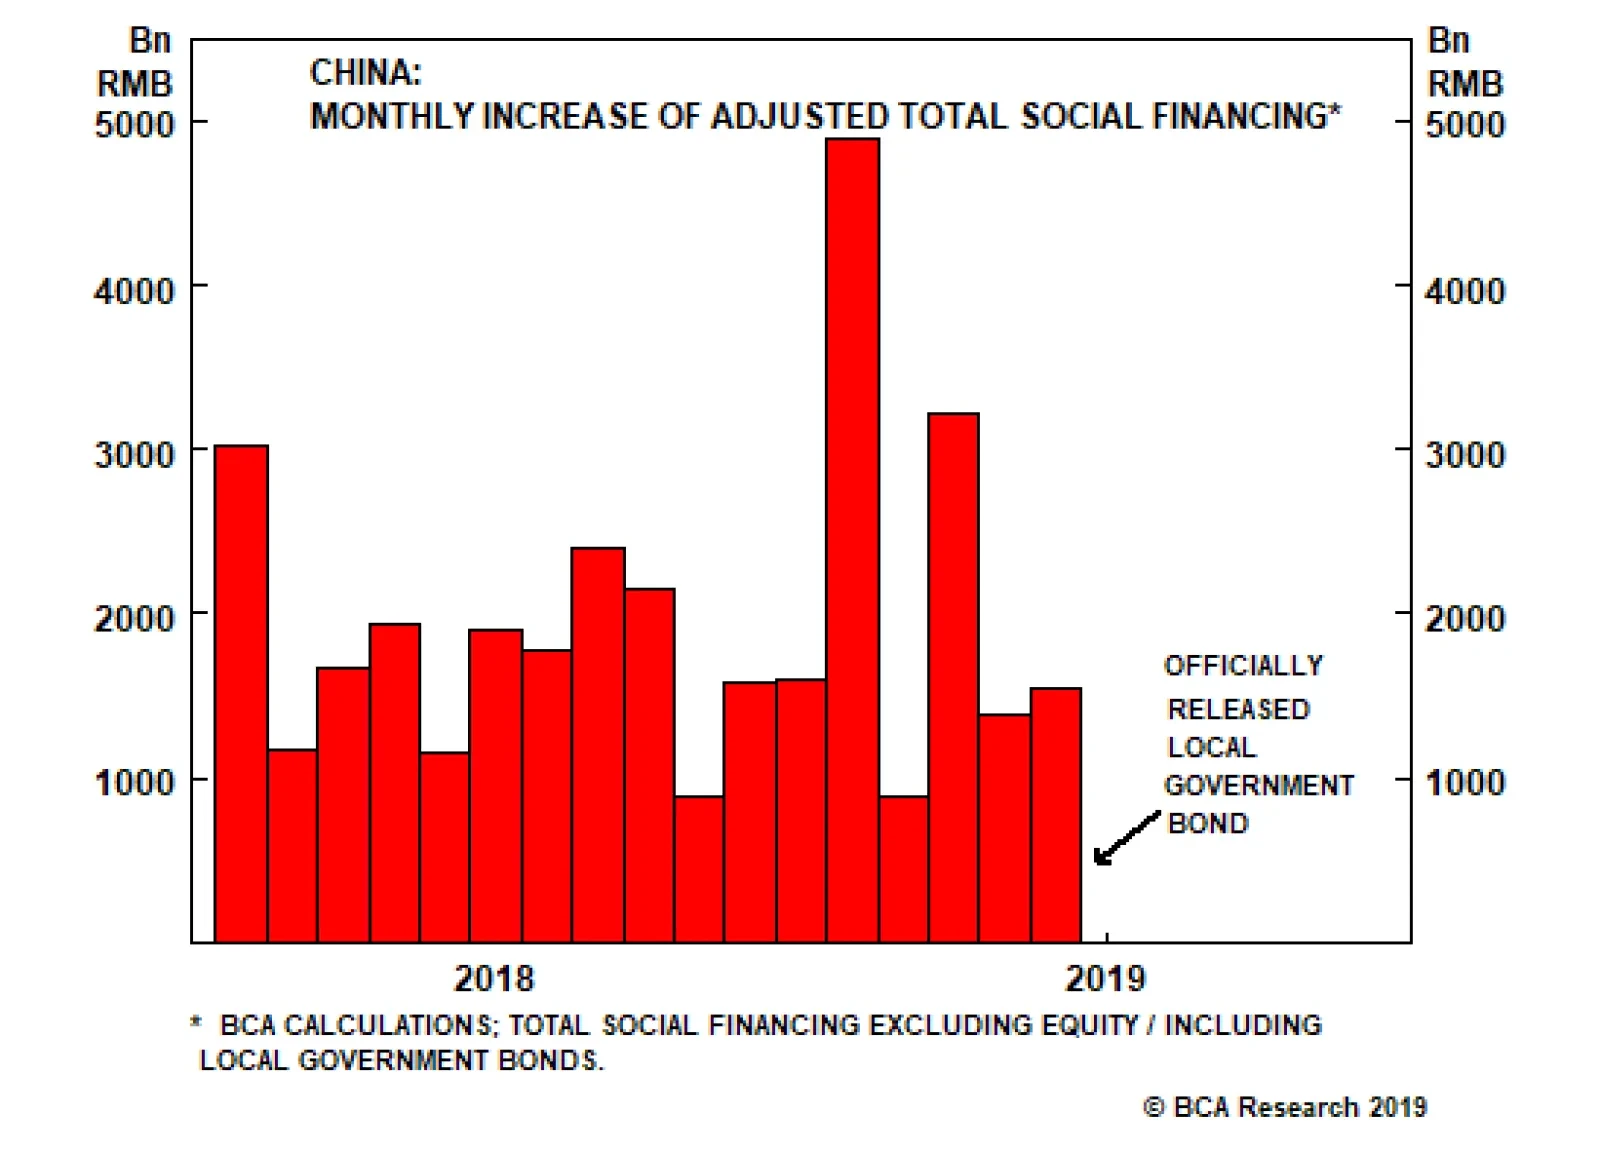
However, several facts underscore that either the PBoC did not, in retrospect, move completely toward a pro-growth stance, or that China’s monetary transmission mechanism is seriously impaired. In our view, it is a combination of both: Despite evidence suggesting it should, the PBoC did not cut its benchmark lending rate. The repo rate declined in the third quarter last year on the back of increased liquidity supply in the interbank market. The weighted average lending rate also fell, but not massively, and not by as much as our model had predicted (Chart 2). A pickup in credit expansion has significantly lagged easing. Excluding local government bonds, the general pickup in credit has been modest. Based on this measure of Total Social Financing, new credit to GDP still remains lower today than at any point during the 2015-2016 downturn (Chart 3). Chart 2Lending Rate: Not Much Easing
Lending Rate: Not Much Easing
Lending Rate: Not Much Easing
Chart 3No Strong Re-Leveraging
No Strong Re-leveraging
No Strong Re-leveraging
With the conclusion of the G20 Summit temporarily halting the trade war escalation and implementation of additional tariffs, these observations raise important questions: Will the PBoC be proactive in easing policy? What does this mean for investors over the coming year? The PBoC Will Be Reactive Rather Than Proactive Chart 4Shadow-Banking Crackdown Continues
Shadow-Banking Crackdown Continues
Shadow-Banking Crackdown Continues
In our view, the PBoC’s policy actions last year can at best be described as half-measures, despite the fact that the central bank was quick to reduce interbank interest rates in last July by cutting the reserve requirement ratio (RRR). The reason is that the PBoC clearly maintained macro-prudential/administrative restrictions on shadow banking activity, despite significantly easing liquidity in the interbank market. Chart 4 shows that shadow-banking credit as a share of total adjusted social financing continued to decelerate rapidly throughout 2018. It now accounts for a mere 12% of the stock of total adjusted social financing, by far the lowest point since 2009. This underscores that the PBoC and policymakers more generally have a deep-seated desire to avoid (further) inflating China’s substantial money and credit excesses – a dynamic that we have discussed in previous reports.1 Looking forward, there are three reasons why the PBoC’s reactive nature is unlikely to change in the near term, in addition to policymakers’ concerns about financial system’s excesses. First, the PBoC has historically been a reactive central bank, in a way that goes beyond the now-typical “data dependent” approach of its developed-market peers. Chart 5 provides a close look at China’s previous economic growth cycles and their corresponding credit expansions. The chart highlights that Chinese policymakers tend to stay behind the curve when it comes to monetary easing: In the previous three growth cycles, the first sign of monetary easing (defined as an RRR and/or benchmark lending rate cut) lagged the peak of nominal GDP growth by an average of four quarters. Rate cuts took place not when economic growth peaked, but once economic activity had already weakened considerably (Chart 6). Chart 5Chinese Policymakers Tend To Stay 'Behind The Curve'
Chinese Policymakers Tend To Stay 'Behind The Curve'
Chinese Policymakers Tend To Stay 'Behind The Curve'
Chart 6More 'Pain' Needed For Massive Easing
More 'Pain' Needed for Massive Easing
More 'Pain' Needed for Massive Easing
The same pattern has applied to other monetary easing tools that the PBoC has deployed in the past, including the Medium Lending Facility (MLF), the Targeted Medium-term Lending Facility (TMLF), the standing Lending Facility (SLF), and the Pledged Supplementary Lending program (PSL) – all of which only took shape after the economy had already shown across-the-board weakness. It will take more widespread and entrenched economic weakness for the PBoC to meaningfully ease further. The local government debt-to-bond swap program was also launched well into the 2015 growth downturn. When widespread and sustained weakness in activity emerged, Chinese policymakers responded by “throwing the kitchen sink” at the economy – by moving forward with multiple rate cuts and often creating new forms of easing in an attempt to catalyze a quick rebound. Since the PBoC has already implemented a series of easing measures, we believe it will take more widespread and entrenched weakness in the real economy for the PBoC to meaningfully ease further. Chart 7Chinese Currency Is Under Pressure
Chinese Currency Is Under Pressure
Chinese Currency Is Under Pressure
Second, the PBoC is likely to be reactive because of the potentially negative effects that proactive rate cuts could cause on sentiment towards the RMB. Chart 7 highlights the close historical correlation between the RRR, interest rate differentials and the USD/CNY. USD/CNY was trading at 7.8 the last time the weighted average RRR was at 11%, which was back in 2007. At the current juncture, interest rate differentials already point to a weaker currency. The PBoC has signaled that USD/CNY at 7 is no longer a line in the sand that must be defended, meaning this level is not a hard constraint that would prevent the central bank from cutting either the RRR or the benchmark lending rates if warranted. In fact, a measured depreciation in the RMB would help mitigate some of the blow from increased tariffs. Nevertheless, in an environment where the currency has already weakened significantly, cutting the RRR or the benchmark lending rates quickly or by a large amount could create self-reinforcing expectations of further depreciation. China has implemented a better counter-cyclical mechanism to defend the RMB than it had in 2015-‘16,2 but the potential for capital outflows remains a serious concern.3 Third, the Trump-Xi meeting at the June G20 Summit in Osaka temporarily averted a further escalation of the trade war and additional tariffs. The agreement to continue trade negotiations lacks tangible progress from either side, and thus the “truce” is likely to be short-lived. Chart 8Markets So Far Unimpressed By Stimulus
Markets So Far Unimpressed By Stimulus
Markets So Far Unimpressed By Stimulus
However, as we pointed out in last week’s report,4 the existence of talks is likely to take some pressure off Chinese policymakers’ immediate need to floor the reflation accelerator. Readouts from recent PBoC leadership meetings indicate that speculative excesses in the financial system remain a top concern for Chinese policymakers. China’s onshore market, after rallying by 2% following the good news from the G20 meeting, has given back all its gain (Chart 8). Given that the onshore equity market is extremely sensitive to China’s credit growth, the short-lived rally since the G20 meeting suggests markets have been unimpressed by the authorities’ reflationary efforts so far. Bottom Line: Chinese policymakers have not fully abandoned their financial deleveraging campaign, which President Xi Jinping initiated two years ago. This implies China’s central bank is likely to maintain its reactive approach in further easing monetary policy, and will likely try to avoid going “all-in” on stimulus for as long as possible. The Reduced Effectiveness Of Monetary Policy The events of the past year have also demonstrated that the effectiveness of Chinese monetary policy has declined relative to past economic cycles. This, in conjunction with the reluctant/reactive nature of the monetary authorities, has clear implications for investors over the coming year. When there is lack of clarity in policy interpretation, Chinese banks tend to stay on the sidelines. Chart 9A Long Delayed Credit Response To Monetary Easing
A Long Delayed Credit Response To Monetary Easing
A Long Delayed Credit Response To Monetary Easing
The PBoC has cut the RRR five times since the second quarter of last year, which has freed up a total of 3.35 trillion yuan of liquidity for the banking system5 and has helped spur significant easing in overall monetary conditions. Yet, as we noted earlier, overall credit growth did not pick up until January of this year, lagging the first rate cut by three quarters (Chart 9). Prior to the economic slowdown in 2015-2016, credit growth used to respond to cuts in the RRR almost immediately. In other words, when banking system liquidity was ample, banks historically lent without hesitation. Post-2015, however, this relationship has changed. The PBoC has increasingly been having trouble channeling new liquidity into actual financing for the real economy. A sharp deterioration in reported bank asset quality that began in 2014 is likely part of the explanation,6 but we suspect that more recent extreme policy contradiction – in particular, repeated flip-flopping among authorities between their desire to support growth and their focus on financial stability – has caused economic agents to wait on the sidelines. While monetary conditions eased and the government urged banks to lend (particularly to the private sector) in the second half of 2018, the “prudent” stance coming from Chinese top leaders was little changed, and tight regulations on financial institutions remained in place. This combination did not give banks the confidence to lend. This changed in the first quarter of this year, when new credit creation-to-GDP surged from 23.6% to 25.6%. The surge occurred shortly after the late-December Central Economic Work Conference (CEWC), which sent a clear message that the central government’s policy focus had shifted to “stabilizing aggregate demand.” Incredibly, the tone shifted again in February, when Premier Li Keqiang and the PBoC publicly disputed whether the January credit spike represented “flood irrigation-style” stimulus, something Premier Li made clear was to be avoided.7 Charts 10 and 11 highlight how these shifts impacted credit growth: The first quarter was clearly on track for a 2015-2016-magnitude outcome, whereas April and May saw the path of credit growth return back to a moderate re-leveraging scenario.
Chart 10
Chart 11
To get back on track for a 2015-2016 magnitude reflation, we will need to see June’s credit creation at or above 5 trillion yuan – equivalent to January’s credit numbers (Chart 12). Chart 12'Credit Binge' In June Unlikely
Credit Binge' in June Unlikely
Credit Binge' in June Unlikely
As we go to press, the number for June’s total social financing has not been officially released yet. But the official reading from the total local government bond issuance in June (including both general bond and special-purpose bond issuance), a key component of our adjusted total social financing series, came in at 900 billion yuan. This is three times more than local government bonds issued in May and twice the size of January’s. Nevertheless, January’s bank lending, particularly short-term lending, was unusually large; an episode highly criticized by Chinese leadership as we mentioned above. As PBoC stated in its defense to this criticism, January is “traditionally the biggest month of the year for bank loans due to seasonal factors”. Therefore, without a clear shift in policy signal from China’s top leadership, we do not expect June’s bank lending number to be a repeat of January’s. Instead, June’s total credit impulse will likely put the cumulative progress in credit growth closer to our 27% of nominal GDP assumption (assuming an 8% nominal GDP growth for the remainder of 2019). This would fall into our “half-strength” credit cycle scenario relative to past reflationary episodes. Bottom Line: Ultimately, we do not doubt that Chinese policymakers will be able to engineer a significant re-acceleration in economic activity should they choose to do so. But in order for policymakers to achieve this goal, policy ambiguity and inconsistency will have to be meaningfully reduced. Investment Implications Over a cyclical time horizon, we recommend staying long/overweight Chinese stocks in hedged currency terms. From our perspective, neither policymakers’ bias towards reluctance nor the reduced effectiveness of monetary policy convincingly argue against our bullish stance towards Chinese stocks over a cyclical (i.e. six- to twelve-month) time horizon, but the tactical implications are clearly negative. Over a cyclical horizon, one of two scenarios is likely to unfold: Either downside risk brought on by current tariffs and weakness in domestic demand is contained enough such that Chinese economic activity does not materially decelerate, or the trade dispute escalates into a full-tariff scenario of 25% on all U.S. imports from China that dramatically impacts Chinese growth. In the first scenario, policymakers will likely to continue providing half-measured responses, and unconstrained “across-the-board” easing will not occur. But Chart 13 highlights that Chinese stocks, particularly the investable market, are priced for a much worse economic outcome, suggesting Chinese relative equity performance would trend higher in these circumstances. Chart 13Chinese Stocks Priced In For A Worse Economic Outlook
Chinese Stocks Priced In For A Worse Economic Outlook
Chinese Stocks Priced In For A Worse Economic Outlook
Chart 14Bullish On A Cyclical Horizon, Bearish In The Near Term
Bullish On A Cyclical Horizon, Bearish In The Near Term
Bullish On A Cyclical Horizon, Bearish In The Near Term
In the second scenario, Chinese business and consumer sentiment is likely to collapse and policymakers will be facing high odds of a substantial slowdown in economic activity. This will create the political will necessary for unconstrained “across-the-board” easing, similar to what occurred in 2015-2016. The sharp re-acceleration in economic activity that would result from broad-based stimulus would clearly be positive for listed Chinese earnings per share (Chart 14), meaning the cyclical outlook for Chinese stocks would likely be even more positive than in the first scenario. However, the near-term equity market outlook of the second scenario would be extremely negative, as a financial market meltdown in of itself would likely be required to build the political will necessary to ultimately ease. Bottom Line: For investors with a time horizon of less than three months, we would not recommend a long position in Chinese stocks, neither in absolute terms nor relative to the global benchmark. However, over a strictly cyclical (i.e. six- to 12-month) time horizon, we recommend staying long/overweight Chinese stocks in hedged currency terms. Jing Sima China Strategist JingS@bcaresearch.com Footnotes 1 Please see Geopolitical Strategy Special Report, “China: How Stimulating is The Stimulus?”, dated August 8, 2018, available at cis.bcaresearch.com 2 A series of countercyclical measures China implemented in 2016-2017 includes: tightening controls on capital outflows, reducing offshore RMB liquidity supply, raising offshore RMB borrowing costs, and setting a firmer daily reference point for the RMB’s trading band. 3 Please see China Investment Strategy Special Report, “Monitoring Chinese Capital Outflows”, dated March 20, 2019, available at cis.bcaresearch.com 4 Please see China Investment Strategy Weekly Report, “China Macro and Market Review”, dated July 4, 2019, available at cis.bcaresearch.com 5 According to PBoC announcements. 6 Please see China Investment Strategy Weekly Report, “Trade Is Not China’s Only Problem”, dated November 21, 2018, available at cis.bcaresearch.com 7 Please see “Chinese Premier In Rare Spat With Central Bank”, Financial Times. Cyclical Investment Stance Equity Sector Recommendations
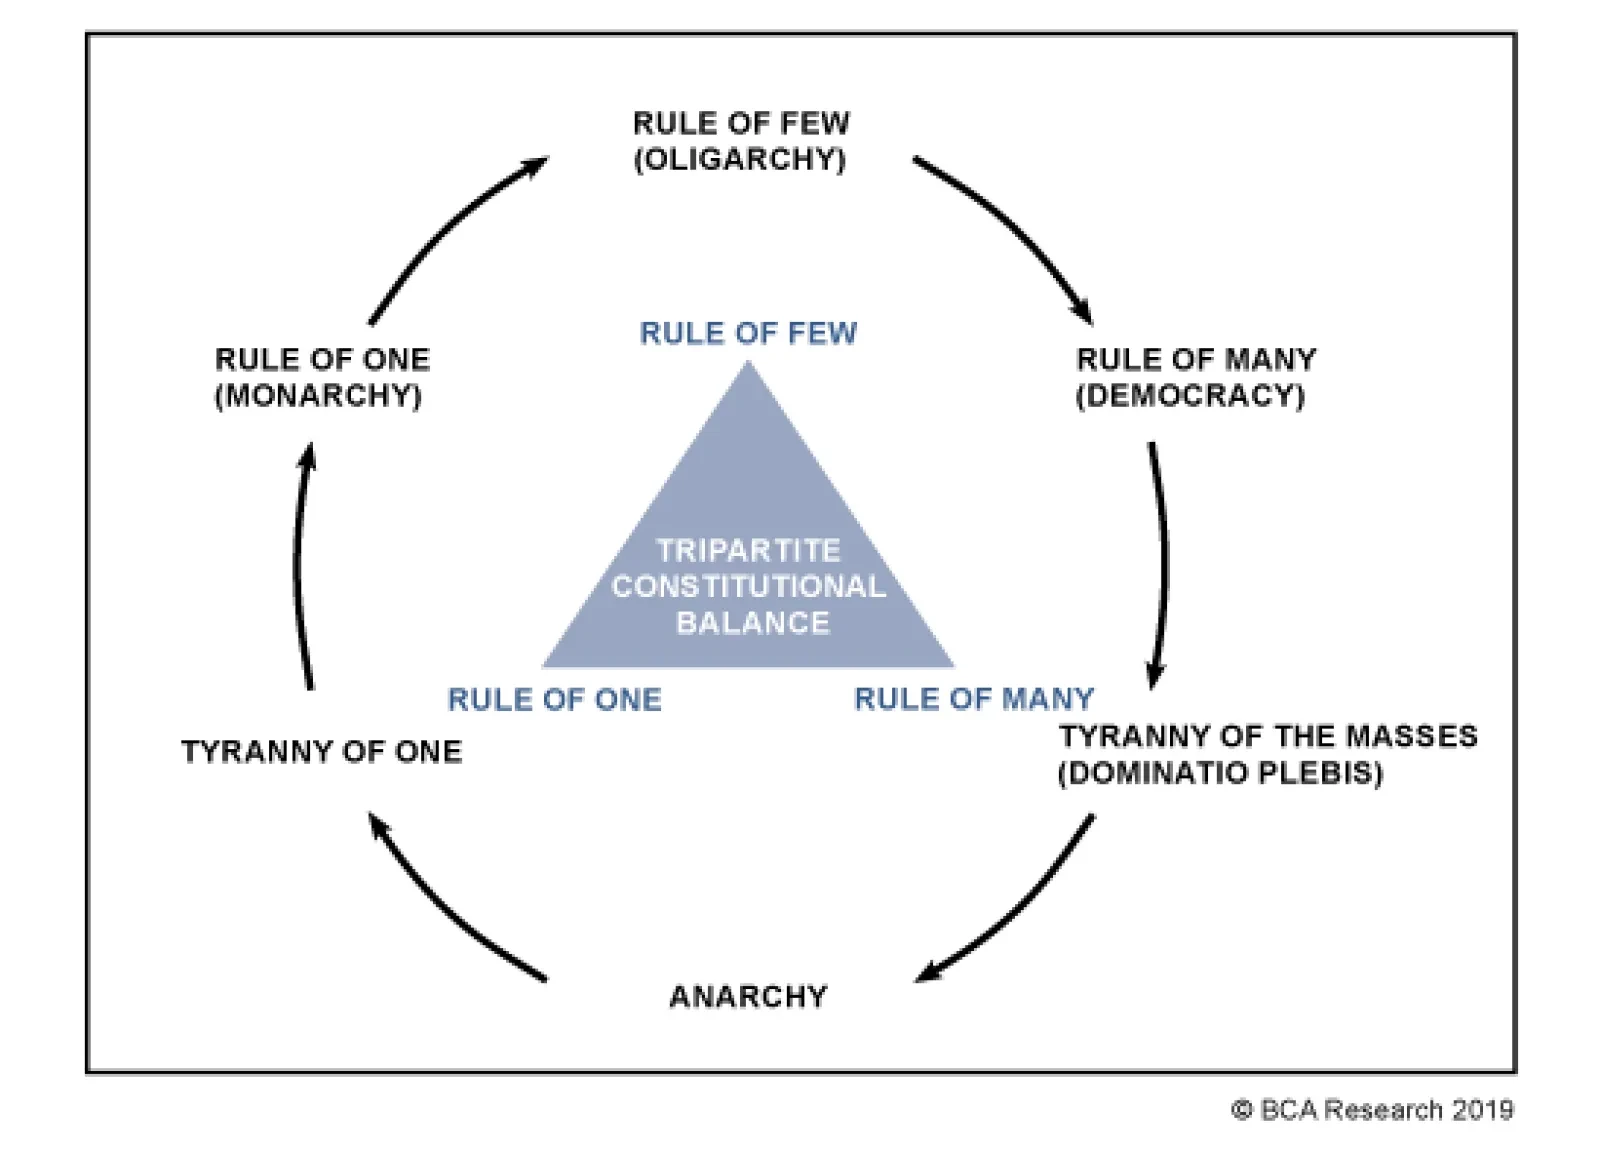
Rising polarization could prevent the U.S. from responding coherently to China. The Thucydides Trap could be avoided, or delayed, simply because the U.S. is distracted elsewhere. The most likely candidate is Iran. A lesser known Greek historian – who was…
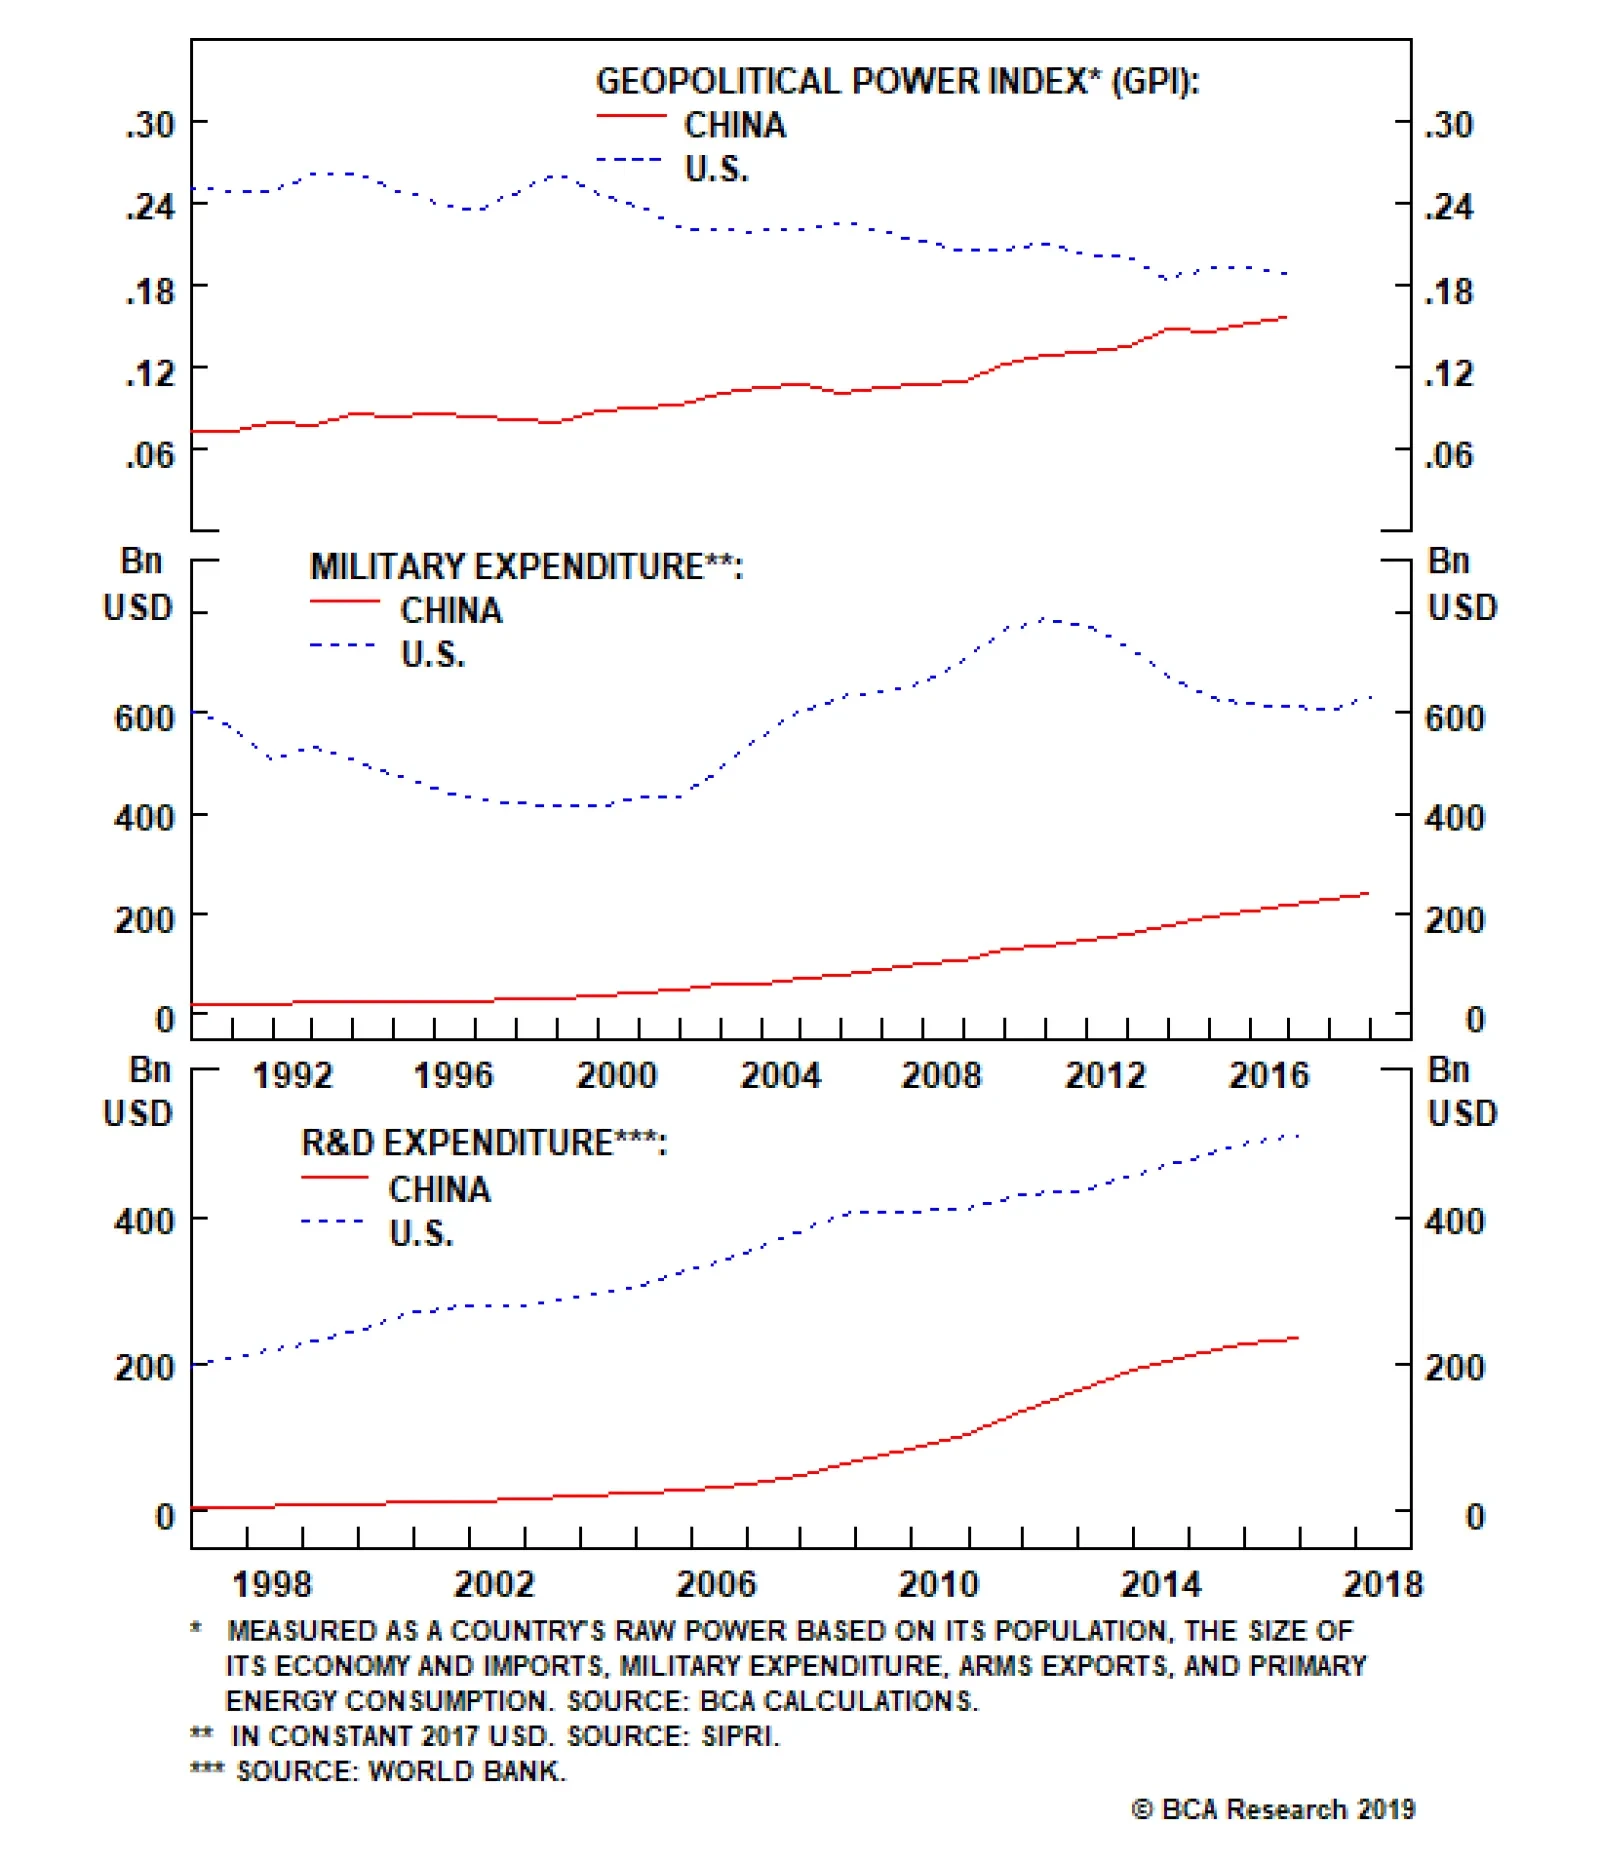
The term, coined by Harvard political scientist Graham Allison, refers to the ancient Greek historian Thucydides (460-400 BC), author of the seminal History of the Peloponnesian War. The “trap” is the armed conflict that most often develops when a dominant…
Highlights So What? U.S.-Iran risk is front-loaded, but U.S.-China is the greater risk overall. In the medium-to-long run the trade war with China should reaccelerate while the U.S. should back away from war with Iran. But for now the opposite is happening. A full-fledged cold war with China will put a cap on American political polarization, putting China at a disadvantage. By contrast, a U.S. war with Iran would exacerbate polarization, giving China a huge strategic opportunity. War with Iran or trade war escalation with China are both ultimately dollar bullish – even though tactically the dollar may fall. Feature Two significant geopolitical events occurred over the past week. First, U.S. President Donald Trump declared his third pause to the trade war with China. The terms of the truce are vague and indefinite, but it has given support to the equity rally temporarily. Second, Iran edged past the limits on uranium stockpiling, uranium enrichment, and the Arak nuclear reactor imposed by the 2015 nuclear pact. Trump instigated this move by walking away from the pact and re-imposing oil sanctions. If these events foreshadow things to come, global financial markets should position for lower odds of a deflationary trade shock and higher odds of an inflationary oil shock in the coming six-to-18 months. But is this conclusion warranted? Is the American “Pivot to Asia” about to shift into reverse? If the White House pursued a consistent strategy to contain China, it would bring Americans together and require forming alliances. In the short run, perhaps – but the conflict with China is ultimately the greater of the two geopolitical risks. We expect it to intensify again, likely in H2, but at latest by Q3 of 2020, ahead of the U.S. presidential election. Our highest conviction call on this matter, however, is that any trade deal before that date will be limited in scope. It will fall far short of a “Grand Compromise” that ushers in a new era of U.S.-China engagement – and hence it will be a disappointment to global equities. Our trade war probabilities, updated on June 14 to account for the expected resumption of negotiations at the G20, can be found in Diagram 1. The combined risk of further escalation is 68%. Diagram 1Trade War Decision Tree (Updated June 13, 2019 To Include G20 Tariff Pause)
The Polybius Solution
The Polybius Solution
The risk to the view? The U.S.-Iran conflict could spiral out of control and the Trump administration could get entangled in the Middle East. This would create a very different outlook for global politics, economy, and markets over the next decade than a concentrated conflict with China. The Missing Corollary Of The “Thucydides Trap” The idea of the “Thucydides Trap” has gone viral in recent years – for good reason. The term, coined by Harvard political scientist Graham Allison, refers to the ancient Greek historian Thucydides (460-400 BC), author of the seminal History of the Peloponnesian War. The “trap” is the armed conflict that most often develops when a dominant nation that presides over a particular world order (e.g. Sparta, the U.S.) faces a young and ambitious rival that seeks fundamental change to that order (e.g. Athens, China).1 This conflict between an “established” and “revisionist” power was highlighted by the political philosopher Thomas Hobbes in his translation of Thucydides in the seventeenth century; every student of international relations knows it. Allison’s contribution is the comparative analysis of various Thucydides-esque episodes in the modern era to show how today’s U.S.-China rivalry fits the pattern. The implication is that war (not merely trade war) is a major risk. We have long held a similar assessment of the U.S.-China conflict. It is substantiated by hard data showing that China is gaining on America in various dimensions of power (Chart 1). Assuming that the U.S. does not want to be replaced, the current trade conflict will metastasize to other areas. There is an important but overlooked corollary to the Thucydides Trap: if the U.S. and China really engage in an epic conflict, American political polarization should fall. Polarization fell dramatically during the Great Depression and World War II and remained subdued throughout the Cold War. It only began to rise again when the Soviet threat faded and income inequality spiked circa 1980. Americans were less divided when they shared a common enemy that posed an existential threat; they grew more divided when their triumph proved to benefit some disproportionately to others (Chart 2). Chart 1China Is Gaining On The U.S.
China Is Gaining On The U.S.
China Is Gaining On The U.S.
Chart 2U.S. Polarization Falls During Crisis
U.S. Polarization Falls During Crisis
U.S. Polarization Falls During Crisis
If the U.S. and China continue down the path of confrontation, a similar pattern is likely to emerge in the coming years – polarization is likely to decline. China possesses the raw ability to rival or even supplant the United States as the premier superpower over the very long run. Its mixed economy is more sustainable than the Soviet command economy was, and it is highly integrated into the global system, unlike the isolated Soviet bloc. As long as China’s domestic demand holds up and Beijing does not suppress its own country’s technological and military ambitions, Trump and the next president will face a persistent need to respond with measures to limit or restrict China’s capabilities. Eventually this will involve mobilizing public opinion more actively. Further, if the U.S.-China conflict escalates, it will clarify U.S. relations with the rest of the world. For instance, Trump’s handling of trade suggests that he could refrain from trade wars with American allies to concentrate attention on China, particularly sanctions on its technology companies. Meanwhile a future Democratic president would preserve some of these technological tactics while reinstituting the multilateral approach of the Barack Obama administration, which launched the “Pivot to Asia,” the Trans-Pacific Partnership, and intensive freedom of navigation operations in the South China Sea. These are all aspects of a containment strategy that would reinforce China’s rejection of the western order. Bottom Line: If the White House, any White House, were to pursue a consistent strategy to contain China, the result would be a major escalation of the trade conflict that would bring Americans together in the face of a common enemy. It would also encourage the U.S. to form alliances in pursuit of this objective. So far these things have not occurred, but they are logical corollaries of the Thucydides Trap and they will occur if the Thucydides thesis is validated. How Would China Fare In The Thucydides Trap? China would be in trouble in this scenario. The United States, if the public unifies, would have a greater geopolitical impact than it currently does in its divided state. And a western alliance would command still greater coercive power than the United States acting alone (Chart 3). External pressure would also exacerbate China’s internal imbalances – excessive leverage, pollution, inefficient state involvement in the economy, poor quality of life, and poor governance (Chart 4). China has managed to stave off these problems so far because it has operated under relative American and western toleration of its violations of global norms (e.g. a closed financial system, state backing of national champions, arbitrary law, censorship). This would change under concerted American, European, and Japanese efforts. Chart 3China Fears A Western 'Grand Alliance'
China Fears A Western 'Grand Alliance'
China Fears A Western 'Grand Alliance'
Chart 4China's Domestic Risks Underrated
China's Domestic Risks Underrated
China's Domestic Risks Underrated
How would the Communist Party respond? First, it could launch long-delayed and badly needed structural reforms and parlay these as concessions to the West. The ramifications would be negative for Chinese growth on a cyclical basis but positive on a structural basis since the reforms would lift productivity over the long run – a dynamic that our Emerging Markets Strategy has illustrated, in a macroeconomic context, in Diagram 2. This is already an option in the current trade war, but China has not yet clearly chosen it – likely because of the danger that the U.S. would exploit the slowdown. Diagram 2Foreign Pressure And Structural Reform = Short-Term Pain For Long-Term Gain
The Polybius Solution
The Polybius Solution
Alternatively the Communist Party could double down on confrontation with the West, as Russia has done. This would strengthen the party’s grip but would be negative for growth on both a cyclical and structural basis. The effectiveness of China’s fiscal-and-credit stimulus would likely decline because of a drop in private sector activity and sentiment – already a nascent tendency – while the lack of “reform and opening up” would reduce long-term growth potential. This option makes structural reforms look more palatable – but again, China has not yet been forced to make this choice. None of the above is to say that the West is destined to win a cold war with China, but rather that the burden of revolutionizing the global order necessarily falls on the country attempting to revolutionize it. Bottom Line: If the Thucydides Trap fully takes effect, western pressure on China’s economy will force China into a destabilizing economic transition. China could lie low and avoid conflict in order to undertake reforms, or it could amplify its aggressive foreign policy. This is where the risk of armed conflict rises. Introducing … The Polybius Solution The problem with the above is that there is no sign of polarization abating anytime soon in the United States. Extreme partisanship makes this plain (Chart 5). Rising polarization could prevent the U.S. from responding coherently to China. The Thucydides Trap could be avoided, or delayed, simply because the U.S. is distracted elsewhere. The most likely candidate is Iran.
Chart 5
A lesser known Greek historian – who was arguably more influential than Thucydides – helps to illustrate this alternative vision for the future. This is Polybius (208-125 BC), a Greek who wrote under Roman rule. He described the rise of the Roman Empire as a result of Rome’s superior constitutional system. Polybius explains domestic polarization whereas Thucydides explains international conflict. Polybius took the traditional view that there were three primary virtues or powers governing human society: the One (the king), the Few (the nobles), and the Many (the commons). These powers normally ran the country one at a time: a dictator would die; a group of elites would take over; this oligarchy would devolve into democracy or mob-rule; and from the chaos would spring a new dictator. His singular insight – his “solution” to political decay – was that if a mixture or balance of the three powers could be maintained, as in the Roman republic, then the natural cycle of growth and decay could be short-circuited, enabling a regime to live much longer than its peers (Diagram 3). Diagram 3Polybius: A Balanced Political System Breaks The Natural Cycle Of Tyranny And Chaos
The Polybius Solution
The Polybius Solution
In short, just as post-WWII economic institutions have enabled countries to reduce the frequency and intensity of recessions (Chart 6), so Polybius believed that political institutions could reduce the frequency and intensity of revolutions. Eventually all governments would decay and collapse, but a domestic system of checks and balances could delay the inevitable. Needless to say, Polybius was hugely influential on English and French constitutional thinkers and the founders of the American republic. Chart 6Orthodox Economic Policy Has Made Recessions Less Frequent And Less Acute
Orthodox Economic Policy Has Made Recessions Less Frequent And Less Acute
Orthodox Economic Policy Has Made Recessions Less Frequent And Less Acute
What is the cause of constitutional decay, according to Polybius? Wealth, inequality, and corruption, which always follow from stable and prosperous times. “Avarice and unscrupulous money-making” drive the masses to encroach upon the elite and demand a greater share of the wealth. The result is a vicious cycle of conflict between the commons and the nobles until either the constitutional system is restored or a democratic revolution occurs. Compared to Thucydides, Polybius had less to say about the international balance of power. Domestic balance was his “solution” to unpredictable outside events. However, states with decaying political systems were off-balance and more likely to be conquered, or to overreach in trying to conquer others. Bottom Line: The “Polybius solution” equates with domestic political balance. Balanced states do not allow the nation’s leader, the elite, or the general population to become excessively powerful. But even the most balanced states will eventually decline. As they accumulate wealth, inequality and corruption emerge and cause conflict among the three powers. Why Polybius Matters Today It does not take a stretch of the imagination to apply the Polybius model to the United States today. Just as Rome grew fat with its winnings from the Punic Wars and decayed from a virtuous republic into a luxurious empire, as Polybius foresaw, so the United States lurched from victory over the Soviet Union to internal division and unforced errors. For instance, the budget surplus of 2% of GDP in the year 2000 became a budget deficit of 9% of GDP after a decade of gratuitous wars, profligate social spending and tax cuts, and financial excesses. It is on track to balloon again when the next recession hits – and this is true even without any historic crisis event to justify it. The rise in polarization has coincided with a rise in wealth inequality, much as Polybius would expect (Chart 7). In all likelihood the Trump tax cuts will exacerbate both of these trends (Chart 8). Even worse, any attempts by “the people” to take more wealth from the “nobles” will worsen polarization first, long before any improvements in equality translate to a drop in polarization. Chart 7Polarization Unlikely To Drop While Inequality Rises
Polarization Unlikely To Drop While Inequality Rises
Polarization Unlikely To Drop While Inequality Rises
Chart 8Trump Tax Cuts Fuel Inequality
Trump Tax Cuts Fuel Inequality
Trump Tax Cuts Fuel Inequality
Most importantly, from a global point of view, U.S. polarization is contaminating foreign policy. Just as the George W. Bush administration launched a preemptive war in Iraq, destabilizing the region, so the Obama administration precipitously withdrew from Iraq, destabilizing the region. And just as the Obama administration initiated a hurried détente with Iran in order to leave Iraq, the Trump administration precipitously withdrew from this détente, provoking a new conflict with Iran and potentially destabilizing Iraq. Major foreign policy initiatives have been conducted, and revoked, on a partisan basis under three administrations. And a Democratic victory in 2020 would result in a reversal of Trump’s initiatives. In the meantime Trump’s policy could easily entangle him in armed conflict with Iran – as nearly occurred on June 21. Iranian domestic politics make it very difficult, if not impossible, to go back to the 2015 setting. Despite Trump’s recent backpedaling, his administration runs a high risk of getting sucked into another Middle Eastern quagmire as long as it enforces the sanctions on Iranian oil stringently. Persian Gulf risks are coming to the fore. But over the next six-to-18 months, U.S.-China conflict will be the dominant market-mover. China would be the big winner if such a war occurred, just as it was one of the greatest beneficiaries of the long American distraction in Afghanistan and Iraq. It would benefit from another 5-10 years of American losses of blood and treasure. It would be able to pursue regional interests with less Interference and could trade limited cooperation with the U.S. on Iran for larger concessions elsewhere. And a nuclear-armed Iran – which is a long-term concern for the U.S. – is not in China’s national interest anyway. Chart 9Will The Pivot To Asia Reverse?
Will The Pivot To Asia Reverse?
Will The Pivot To Asia Reverse?
Bottom Line: The U.S. is missing the “Polybius solution” of balanced government; polarization is on the rise. As a result, the grand strategy of “pivoting to Asia” could go into reverse (Chart 9). If that occurs, the conflict with China will be postponed or ineffective. Iran Is The Wild Card A war with Iran manifestly runs afoul of the Trump administration’s and America’s national interests, whereas a trade war with China does not. First, although an Iranian or Iranian-backed attack on American troops would give Trump initial support in conducting air strikes, the consequences of war would likely be an oil price shock that would sink his approval rating over time and reduce his chances of reelection (Chart 10). We have shown that such a shock could come from sabotage in Iraq as well as from attacks on shipping in the Strait of Hormuz. Iran could be driven to attack if it believes the U.S. is about to attack. Second, not only would Democrats oppose a war with Iran, but Americans in general are war-weary, especially with regard to the Middle East (Chart 11). President Trump capitalized on this sentiment during his election campaign, especially in relation to Secretary Hillary Clinton who supported the war in Iraq. Over the past two weeks, he has downplayed the Iranian-backed tanker attacks, emphasized that he does not want war, and has ruled out “boots on the ground.” Chart 10Carter Gained Then Lost From Iran Oil Shock
Carter Gained Then Lost From Iran Oil Shock
Carter Gained Then Lost From Iran Oil Shock
Chart 11
Third, it follows from the above that, in the event of war, the United States would lack the political will necessary to achieve its core strategic objectives, such as eliminating Iran’s nuclear program or its power projection capabilities. And these are nearly impossible to accomplish from the air alone. And U.S. strategic planners are well aware that conflict with Iran will exact an opportunity cost by helping Russia and China consolidate spheres of influence. The wild card is Iran. President Hassan Rouhani has an incentive to look tough and push the limits, given that he was betrayed on the 2015 deal. And the regime itself is probably confident that it can survive American air strikes. American military strikes are still a serious constraint, but until the U.S. demonstrates that it is willing to go that far, Iran can test the boundaries. In doing so it also sends a message to its regional rivals – Saudi Arabia, the Gulf Arab monarchies, and Israel – that the U.S. is all bark, no bite, and thus unable to protect them from Iran. This may lead to a miscalculation that forces Trump to respond despite his inclinations. The China trade war, by contrast, is less difficult for the Trump administration to pursue. There is not a clear path from tariffs to economic recession, as with an oil shock: the U.S. economy has repeatedly shrugged off counter-tariffs and the Fed has been cowed. While Americans generally oppose the trade war, Trump’s base does not, and the health of the overall economy is far more important for most voters. And a majority of voters do believe that China’s trade practices are unfair. Strategic planners also favor confronting China – unlike Trump they are not concerned with reelection, but they recognize that China’s advantages grow over time, including in critical technologies. Bottom Line: While short-term events are pushing toward truce with China and war with Iran, the Trump administration is likely to downgrade the conflict with Iran and upgrade the conflict with China over the next six-to-18 months. Neither politics nor grand strategy support a war with Iran, whereas politics might support a trade war with China and grand strategy almost certainly does. China Could Learn From Polybius Too China also lacks the Polybius solution. It suffers from severe inequality and social immobility, just like the Latin American states and the U.S., U.K., and Italy (Chart 12). But unlike the developed markets, it lacks a robust constitutional system. Political risks are understated given the emergence of the middle class, systemic economic weaknesses, and poor governance. Over the long run, Xi Jinping will need to step down, but having removed the formal system for power transition, a succession crisis is likely.
Chart 12
China’s imbalances could cause domestic instability even if the U.S. becomes distracted by conflict in the Middle East. But China has unique tools for alleviating crises and smoothing out its economic slowdown, so the absence of outside pressure will probably determine its ability to avoid a painful economic slump. This helps to explain China’s interest in dealing with the U.S. on North Korea. President Xi Jinping’s first trip to Pyongyang late last month helped pave the way for President Trump to resume negotiations with the North’s leader Kim Jong Un at the first-ever visit of an American president north of the demilitarized zone (DMZ). China does not want an unbridled nuclear North Korea or an American preventative war on the peninsula. If Beijing could do a short-term deal with the U.S. on the basis of assistance in reining in North Korea’s nuclear and missile programs, it could divert U.S. animus away from itself and encourage the U.S. to turn its attention toward the next rogue nuclear aspirant, Iran. It would also avoid structural economic concessions. Of course, a smooth transition today means short-term gain but long-term pain for Chinese and global growth. Productivity and potential GDP will decline if China does not reform (Diagram 4). But this kind of transition is the regime’s preferred option since Beijing seeks to minimize immediate threats and maintain overall stability. Diagram 4Stimulus And Delayed Reforms = Socialist Put = Stagflation
The Polybius Solution
The Polybius Solution
If Chinese internal divisions do flare up, China’s leaders will take a more aggressive posture toward its neighbors and the United States in order to divert public attention and stir up patriotic support. Bottom Line: China suffers from understated internal political risk. While U.S. political divisions could lead to a lack of coherent strategy toward China, a rift in China could lead to Chinese aggression in its neighborhood, accelerating the Thucydides Trap. Investment Conclusions Chart 13An Iran War Will Bust The Budget
An Iran War Will Bust The Budget
An Iran War Will Bust The Budget
If the U.S. reverses the pivot to Asia, attacks Iran, antagonizes European allies, and exhausts its resources in policy vacillation, its budget deficit will balloon (Chart 13), oil prices will rise, and China will be left to manage its economic transition without a western coalition against it. The implication is a weakening dollar, at least initially. But the U.S. is nearing the end of its longest-ever business expansion and an oil price spike would bring forward the next recession, both of which will push up the greenback. Much will depend on the extent of any oil shock – whether and how long the Strait of Hormuz is blocked. Beyond the next recession, the dollar could suffer severe consequences for the U.S.’s wild policies. If the U.S. continues the pivot to Asia, and the U.S. and China proceed with tariffs, tech sanctions, saber-rattling, diplomatic crises, and possibly even military skirmishes, China will be forced into an abrupt and destabilizing economic transition. The U.S. dollar will strengthen as global growth decelerates. Developed market equities will outperform emerging market equities, but equities as a whole will underperform sovereign bonds and other safe-haven assets. Over the past week, developments point toward the former scenario, meaning that Persian Gulf risks are coming to the fore. But over the next six-to-18 months, we think the latter scenario will prevail. We are maintaining our risk-off trades: long JPY/USD, long gold, long Swiss bonds, and long USD/CNY. Matt Gertken, Vice President Geopolitical Strategist mattg@bcaresearch.com Footnotes 1 See Graham Allison, “The Thucydides Trap: Are The U.S. And China Headed For War?” The Atlantic, September 24, 2015, and Destined For War: Can America and China Escape Thucydides’s Trap? (New York: Houghton Mifflin Harcourt, 2017).