China
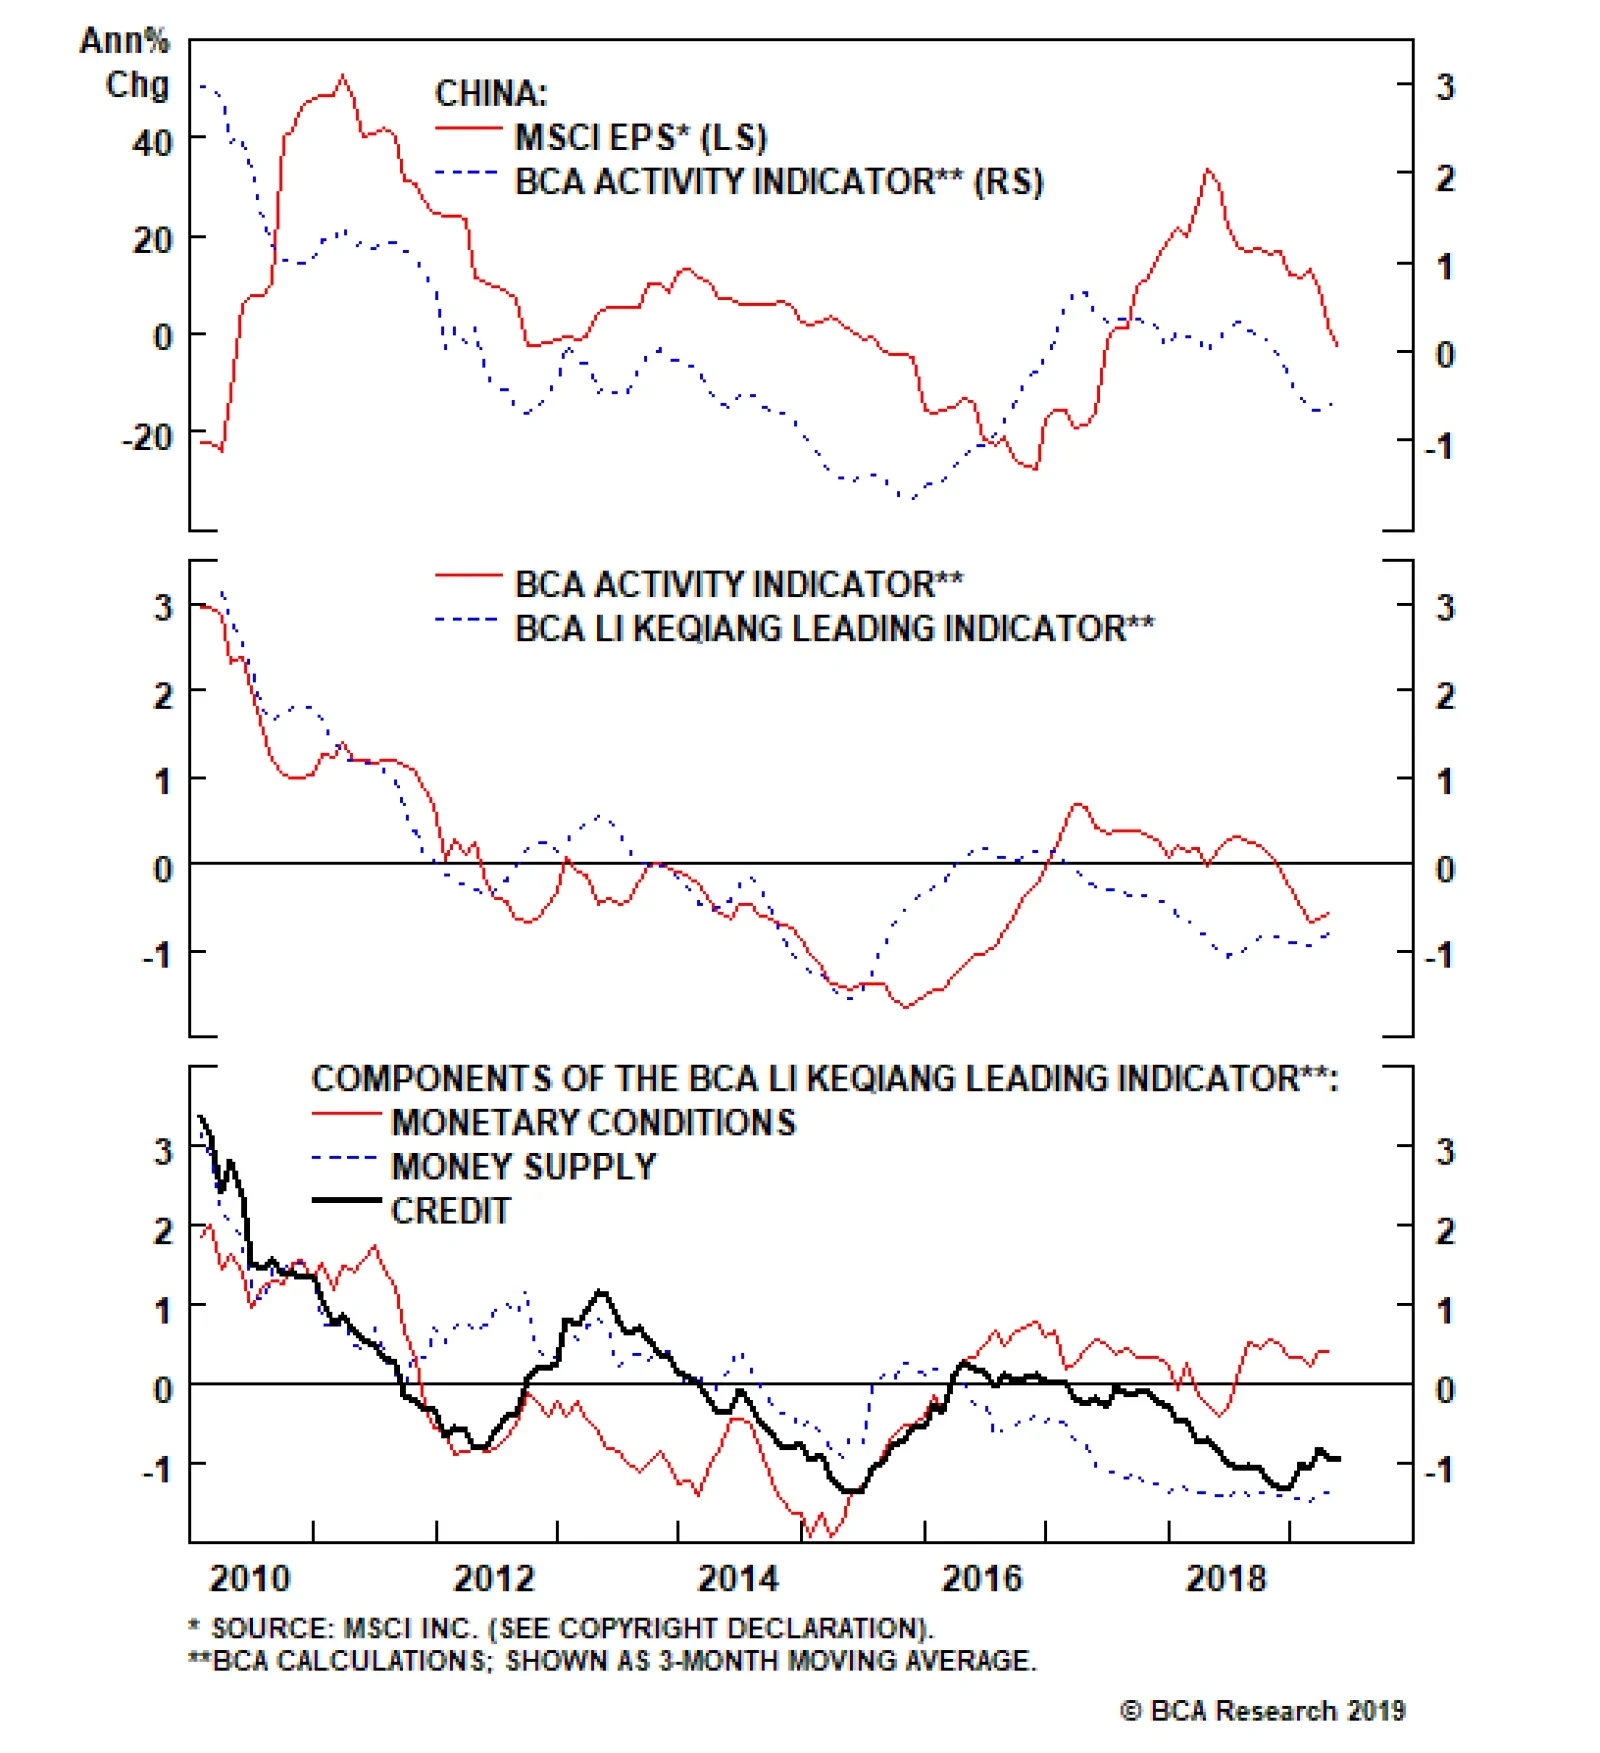
The first element of our framework for predicting Chinese investable earnings per share (EPS) growth is the strong leading relationship between the BCA China Activity Indicator and the year-over-year growth rate of investable EPS. This…

Analysis on Thailand is available below. Feature Last week we were on the road meeting with some of our U.S. clients. This week’s report presents some of the key topics of our discussions in a Q&A format. Question: You have been downplaying the potentially positive impact of lower bond yields in advanced economies on EM risk assets. Why do you think lower bond yields in developed markets (DM) and potential rate cuts by DM central banks won’t suffice to lift EM markets on a sustainable basis? Answer: Falling interest rates are positive for share prices when profits are growing, even at a slower rate. When corporate profits are contracting, lower interest rates typically do not preclude equity prices from dropping. Presently, EM and Chinese corporate earnings are shrinking rapidly (Chart I-1). This is the primary reason why we believe DM monetary easing will not help EM share prices much. Furthermore, EM exchange rates follow relative EPS cycles in local currency terms (Chart I-2). In short, EM currencies are driven by relative corporate profitability between EM and the U.S. – not by interest rate differentials. Chart I-1EM & China EPS Are Contracting
EM & China EPS Are Contracting
EM & China EPS Are Contracting
Chart I-2Relative EPS And Exchange Rate
Relative EPS And Exchange Rate
Relative EPS And Exchange Rate
The contraction in EM and China EPS has not been caused by higher interest rates and slump in DM domestic demand. Rather, the EM/China profit contraction has been due to China’s economic slowdown spilling over to the rest of EM. Crucially, there is no empirical evidence that interest rate cuts and QEs in DM preclude EM selloffs when EM/Chinese growth is slumping. Specifically: Chart I-3A and I-3B illustrate that neither the level of G4 central banks’ assets nor their annual rate of change correlates with EM share prices or EM local bonds’ total returns in U.S. dollar terms. Hence, QEs have not always guaranteed positive returns for EM financial markets. Chart I-3APace Of QE And EM Performance
Pace Of QE And EM Performance
Pace Of QE And EM Performance
Chart I-3BPace Of QE And EM Performance
Pace Of QE And EM Performance
Pace Of QE And EM Performance
Chart I-4U.S. Treasury Yields And EM Performance
U.S. Treasury Yields And EM Performance
U.S. Treasury Yields And EM Performance
Chart I-4 demonstrates the correlation between U.S. 5-year Treasurys yields on the one hand and EM spot exchange rates, EM sovereign credit spreads and EM share prices on the other. There has been no stable relationship – at times it has been positive, and at other times negative. We are not implying that DM interest rates have no bearing on EM financial markets. Our point is that lower interest rates and QEs in DM do not constitute sufficient conditions for EM financial markets to rally. Even though DM monetary policy has not been the driving force of cyclical fluctuations in EM financial markets, it has had a structural impact. QEs and lower bond yields in DM have prompted an expanded search for yield and have produced substantial compression in risk premia worldwide. For example, Chart I-5 demonstrates that excess returns on EM corporate bonds have historically been correlated with the global manufacturing cycle, but the correlation has diminished in recent years. The widening gap between the two lines is due to investors’ search for yield. Investors have bought and continue to hold securities of “zombie” companies and countries that have low productivity and poor fundamentals. In short, QEs have undermined the efficiency of global capital allocation. This is marginally adverse for productivity in the global economy in the long run. Question: But doesn’t DM monetary policy influence DM demand, which in turn affects EM corporate profits? Answer: DM monetary policy influences DM domestic demand, but there is little correlation between DM domestic demand and EM corporate profits. For example, U.S. import volumes have been growing at a decent pace, yet EM corporate profits have shrunk (Chart I-6). Indeed, robust growth in U.S. imports did not preclude EM EPS contraction in 2012, 2014-‘15 and 2018-‘19, as shown in this chart. Chart I-5Fundamentals Have Become Less Important Due To QE Programs
Fundamentals Have Become Less Important Due To QE Programs
Fundamentals Have Become Less Important Due To QE Programs
Chart I-6EM EPS And U.S. Imports
EM EPS And U.S. Imports
EM EPS And U.S. Imports
Chart I-7 reveals additional evidence of the diminished impact of U.S. growth on Asian exports. Korean, Taiwanese, Japanese and Singaporean exports to the U.S. are growing at 7% rate, while their shipments to China are contracting at an 11% rate from a year ago as of May. As a result, these countries’ overall exports are shrinking because they ship to China considerably more than they do to the U.S. We are not implying that DM interest rates have no bearing on EM financial markets. Our point is that lower interest rates and QEs in DM do not constitute sufficient conditions for EM financial markets to rally. The current global slowdown did not originate in the U.S. or Europe. Rather, it originated in China and has spilt across the world, affecting the economies that sell to China the most. The deceleration in global trade can be tracked to Chinese imports contraction (Chart I-8). Chart I-7Asia's Exports To China And U.S.
Asia's Exports To China And U.S.
Asia's Exports To China And U.S.
Chart I-8Chinese Imports And Global Trade
Chinese Imports And Global Trade
Chinese Imports And Global Trade
U.S. manufacturing is the least exposed to China, which is the main reason why it was the last shoe to drop in the global manufacturing recession. Question: So, what drives EM business cycles if it is not DM growth and DM interest rates? Chart I-9China's Credit & Fiscal Impulse And EM EPS
China's Credit & Fiscal Impulse And EM EPS
China's Credit & Fiscal Impulse And EM EPS
Answer: The key and dominant driver of EM risk assets – stocks, credit markets and currencies – has been the global trade and EM/China growth cycles. There is a much stronger correlation between EM financial markets and the global business cycle in general, and Chinese imports in particular than with DM interest rates. In turn, Chinese imports are driven by its capital spending cycle. 85% of the mainland’s good imports are composed of industrial goods and devices, machinery, chemicals, various commodities and autos. Only 15% are non-auto consumer goods. Meanwhile, the credit/money cycles drive capital spending. That is why China’s credit and fiscal spending impulse leads EM corporate profits (Chart I-9). This is also why we spend a significant amount of time analyzing and discussing China's credit cycle. Question: Why has the policy stimulus in China not revived growth in its economy and its suppliers around the world? Answer: Our aggregate credit and fiscal spending impulse bottomed in January of this year, but its recovery has so far been timid. In the past, this indicator led China’s business cycle and the global manufacturing PMI by an average of about nine months (Chart I-10, top panel) and EM corporate profits by 12 months (Chart I-9). According to this pattern, the bottom in global manufacturing should occur in August of this year. However, global share prices have not led global manufacturing PMI during this decade; they have instead been coincident (Chart I-10, bottom panel). Hence, there was no historical justification for global share prices to rally since early January - well ahead of a potential bottom in the global manufacturing PMI in August. The current global slowdown did not originate in the U.S. or Europe. Rather, it originated in China and has spilt across the world, affecting the economies that sell to China the most. That said, due to the U.S.-China confrontation and other structural reasons currently prevailing in China – including high levels of indebtedness and more regulatory scrutiny over shadow banking as well as local government debt – a recovery in mainland household and corporate spending is likely to be delayed. Crucially, as we have documented in previous reports, the marginal propensity to spend for consumers and companies continues to fall (Chart I-11). This is the opposite of what occurred in early 2016. Chart I-10Chinese Stimulus, Global Manufacturing And Global Stocks
Chinese Stimulus, Global Manufacturing And Global Stocks
Chinese Stimulus, Global Manufacturing And Global Stocks
Chart I-11China: What Is Different From 2016
China: What Is Different From 2016
China: What Is Different From 2016
Overall, a revival in China’s growth will likely take longer to unfold and EM risk assets will likely sell off anew before bottoming. Chart I-12Global Slowdown Is Not Yet Over
Global Slowdown Is Not Yet Over
Global Slowdown Is Not Yet Over
Chart I-13Global Semiconductor Demand Is Shrinking
Global Semiconductor Demand Is Shrinking
Global Semiconductor Demand Is Shrinking
Question: Apart from China’s credit and fiscal spending impulse and marginal propensity to spend among households and companies, what other indicators are you monitoring to gauge a bottom in the global manufacturing cycle? Answer: Among many variables and indicators we continuously monitor, there are a few we have been paying particular attention to: The difference between global narrow (M1) and broad money growth correlates well with global corporate earnings (Chart I-12). The rationale for this indicator is that it is akin to the marginal propensity to spend: When demand deposits (M1) outpace time/savings deposits, it is indicative that households and companies are getting ready to spend on large-ticket items or kick off capital spending, and vice versa. Presently, this narrow-to-broad money growth differential continues to point to lower global growth. Last week we published a report on the global semiconductor industry, arguing that upstream demand for semiconductors is withering as sales of servers, smartphones, PCs and autos are all shrinking globally (Chart I-13). With consumption of these goods contracting, demand for semiconductors remains lackluster, and semiconductor prices are still deflating (Chart I-14). Hence, semiconductor prices can be used as an indicator of final demand dynamics in many important segments of the global economy. China’s Container Freight Index – the price to ship containers – is also currently lackluster, reflecting weak global trade dynamics (Chart I-15, top panel). Chart I-14Semiconductor Prices Are Still Deflating
Semiconductor Prices Are Still Deflating
Semiconductor Prices Are Still Deflating
Chart I-15Global Shipments Are Very Weak
Global Shipments Are Very Weak Global Shipments Are Very Weak
Global Shipments Are Very Weak Global Shipments Are Very Weak
In the U.S., both total intermodal carloads and railroad carloads excluding petroleum and coal are tanking, reflecting subsiding growth (Chart I-15, middle and bottom panel). In turn, Chinese imports continue to contract. This is the primary channel in terms of how the Middle Kingdom affects the rest of the world economy. From the rest of the world’s perspective, China is in recession because their shipments to the mainland are shrinking. In China and Taiwan, the seasonally adjusted manufacturing PMI new orders have rolled over after the temporary pick up early this year (Chart I-16). Finally, we are monitoring our Reflation Indicator and Risk-On/Safe-Haven Currency Ratio (Chart I-17). Both are market-based indicators and are very sensitive to global growth conditions – especially to the dynamics in commodities markets – making them very pertinent to EM investors. Chart I-16Manufacturing PMI: New Orders Seasonally-Adjusted
Manufacturing PMI: New Orders Seasonally-Adjusted
Manufacturing PMI: New Orders Seasonally-Adjusted
Chart I-17Market-Based Indicators
Market-Based Indicators
Market-Based Indicators
As with any marked price-based signals, both are very volatile. Even though both indicators have rebounded in recent days, only a major trend reversal matters for macro investors. Technically speaking, the profile of both indicators is consistent with a breakdown rather than a breakout. Question: You have highlighted that EM corporate EPS is contracting. How widespread is the profit contraction, and how long will it persist? Answer: EM corporate EPS contraction is widespread across almost all sectors. Chart I-18A and I-18B illustrate EPS growth in U.S. dollar terms for all sectors. EPS growth is negative for most sectors, close to zero for three (technology, financials and materials) and still positive for the energy sector. However, technology, materials and energy EPS are heading into contraction, given the drop in semiconductor, industrial metals and oil prices, respectively. Chart I-18ASynchronized EM EPS Contraction
Synchronized EM EPS Contraction
Synchronized EM EPS Contraction
Chart I-18BSynchronized EM EPS Contraction
Synchronized EM EPS Contraction
Synchronized EM EPS Contraction
Consequently, all EM equity sectors will soon be experiencing synchronized profit contraction. EM corporate EPS contraction is widespread across almost all sectors. Our credit and fiscal spending impulse for China leads EM EPS growth by about 12 months, and it currently entails that the profit contraction will continue to deepen all the way through December (Chart I-9 on page 6). It would be surprising if EM share prices stage a major rally amid a hastening decline in corporate EPS (please refer to Chart I-1 on page 1). Arthur Budaghyan Chief Emerging Markets Strategist arthurb@bcaresearch.com Thailand: A Defensive Play Within EM The Thai parliament has elected to keep the ex-military general Prayuth Chan-ocha as the country’s prime minister. This will instill political stability for now, which is positive for investor confidence. In absolute terms, Thai financial markets are leveraged to global trade and will, therefore, sell off if our negative views on the latter and EM risk assets play out. Chart II-1Thailand's Current Account Is In Surplus
Thailand's Current Account Is In Surplus
Thailand's Current Account Is In Surplus
Relative to their EM peers, Thai equities, credit, currency and domestic bonds will continue outperforming: The Thai current account balance remains in large surplus, which provides a large cushion for the Thai baht amid the slowdown in global growth (Chart II-1). Critically, Thailand is less exposed to China and is more leveraged to the U.S. and Europe than its EM peers. Thailand’s shipments to China account for 12% of the former’s total exports, while exports to the U.S. and EU together account for 21%. Both U.S. and European imports are holding up better than those of China. Thailand also has the lowest foreign debt obligations (FDO) among EM countries. FDOs measure the sum of short-term claims, interest payments and amortization over the next 12 months. The country’s current FDOs stand at 8% relative to its exports of goods and services and 12% relative to the central bank’s foreign exchange reserves. The rest of EM countries have much higher ratios. In addition, foreign ownership of local currency bonds is amongst the lowest in the region (18%). As a result, currency depreciation will not trigger major portfolio outflows and a self-reinforcing downtrend in Thai financial markets. Thailand also has the lowest foreign debt obligations (FDO) among EM countries. Chart II-2Thailand: Moderate Growth In Private Consumption
Thailand: Moderate Growth In Consumption
Thailand: Moderate Growth In Consumption
Thailand’s private consumption is growing reasonably well (Chart II-2, top panel). Likewise, passenger and commercial vehicle sales are rising and so is household credit (Chart II-2, bottom two panels). The Thailand MSCI index carries a large weight in domestic and defensive stocks such as transportation, utilities, telecommunication, and consumer staples. These sectors will benefit from moderate consumption growth. In fact, Thai equity outperformance versus EM has been justified by its non-financial companies’ EBITDA outpacing that of EM non-financials (Chart II-3). This trend remains intact. Concerning banks, Thailand’s commercial banks suffer from credit excesses, as do many of their EM peers. However, Thai commercial banks have been responsible in terms of recognizing NPLs and have been properly provisioning for them (Chart II-4). This is contrary to many other EM banks. This means that share prices of Thai commercial banks will outperform their EM counterparts. Finally, although the Thai bourse is more expensive than its EM counterparts, relative equity valuation will likely get even more stretched before a major reversal occurs. Given our cautious view on overall EM, we continue to prefer this richly valued and defensive bourse to the more cyclical, albeit cheaper, but fundamentally vulnerable EM peers. Chart II-3Equity Outperformance Has Been Justified By Earnings
Equity Outperformance Has Been Justified By Earnings
Equity Outperformance Has Been Justified By Earnings
Chart II-4Thai Commercial Banks Are Well Provisioned
Thai Commercial Banks Are Well Provisioned
Thai Commercial Banks Are Well Provisioned
Bottom Line: Investors should keep an overweight position in Thai equities, currency, domestic bonds and credit markets. Ayman Kawtharani, Editor/Strategist ayman@bcaresearch.com Footnotes Equity Recommendations Fixed-Income, Credit And Currency Recommendations
Following up on our May 30th Chinese apparent diesel demand and SPX momentum pictorial, the latest KOMATSU monthly demand growth rate update on Chinese excavator sales corroborates the plunging diesel demand data (as a reminder most earthmoving machinery are diesel-powered). In more detail, over the last three months ending in May, KOMATSU Chinese excavator sales have registered -10%, -16% and -27% year-over-year contraction rates, respectively.1 Such an accelerated decline is telling. Japanese construction machinery companies are not tangled up in the U.S./China trade tussle, at least not yet, so this appears to be a clean/reliable number. Moreover, it seems as though infrastructure spending is not the preferred way to stimulate the Chinese economy at the current juncture. This is important and likely serves as a near-real time indicator of Chinese reflation efforts translating into economic activity. The chart shows that in late-2015/early-2016 this economic data series went parabolic, led the U.S. stock market and clearly signaled that a Chinese reflationary push was being successful. Currently, excavator sales data suggest that Chinese reflation is either delayed or the transmission mechanism is broken, warning that U.S. stocks are in danger of disappointment. Bottom Line: Broad U.S. equity market caution is still warranted.
The Hope Rally
The Hope Rally
Footnotes 1https://home.komatsu/en/ir/demand-orders/__icsFiles/afieldfile/2019/06/07/201903main_products_order_e_0607.pdf
Highlights The report reviews our framework for predicting broad market earnings in China based on the experience of the past decade, and documents the relationship between sector earnings and broad market earnings for both the investable and domestic market. We also review the cyclicality of earnings in each sector, and highlight the sectors where relative earnings have been successful at predicting relative performance. Energy and consumer discretionary in both markets, along with real estate and financials in the domestic market, have historically been the best candidates for a classic top-down fundamental “sector rotation” strategy. Compared with these sectors, investable telecom stocks have exhibited a weaker link between sector and index earnings, but this has occurred because of relatively steady, low volatility earnings growth. As such, telecom stocks are reliably defensive, but only in the investable market. We conclude by noting the extreme nature of long-term de/re-rating trends that have occurred for several of China’s equity sectors, and argue that the strength of the relationship between earnings and stock prices for these sectors is set to rise over a secular time horizon. Over the coming few years, investors should focus nearly exclusively on the earnings outlook for high flying and beaten down sectors, as further multiple expansion/contraction is unlikely to drive future returns (without an earnings catalyst). Feature Last week’s joint report with our Geopolitical Strategy service provided investors with an update on the trade war in the lead up to the G20 meeting in Osaka.1 While a new tariff ceasefire may emerge from the meeting, the report underscored why the odds are skewed against a positive outcome over the coming 18 months. Our bet is that investors are unlikely to assume that a deal will occur merely in response to a new timetable for talks, implying that any near-term boost to stock prices will be minimal until negotiators provide market participants with evidence (rather than hope) that a deal is achievable. This means that a financial market riot point remains likely over the coming few months, and that a cyclically bullish stance towards Chinese stocks rests on the likelihood of a major policy response in China to counter the likely shock to its export sector. During times of high policy uncertainty, we often take the opportunity to review and update our framework for key asset drivers. In today’s report we review our framework for predicting broad market earnings in China based on the experience of the past decade, and then document the relationship between sector earnings and broad market earnings for both the investable and domestic market. We review the cyclicality of earnings in each sector, and highlight the sectors where relative earnings have been successful at predicting relative performance. We conclude with a summary of what our results would imply over the tactical and cyclical investment horizons given our view of China’s likely growth trajectory, and highlight why several sectors may see a stronger relationship between their earnings and stock prices over the secular horizon. The report illustrates our key conclusions in the body of the text, but reference charts for each sector/industry group in both the investable and domestic market are provided as a convenience on pages 12 - 23. Predicting Chinese Equity Index Earnings Our framework for predicting index EPS is straightforward but reliable. Chart 1Stronger Economic Activity = Stronger Investable Earnings
Stronger Economic Activity = Stronger Investable Earnings
Stronger Economic Activity = Stronger Investable Earnings
Chart 1 presents the first element of our framework for predicting Chinese investable earnings per share (EPS) growth. The chart illustrates the strong leading relationship between our BCA China Activity Indicator and the year-over-year growth rate of investable EPS, which underscores that the fundamental performance of Chinese equities is still predominantly driven by China’s “old economy”. The leading nature of our activity index partly reflects the fact that earnings per share are measured on a trailing basis; the key point for investors is that indicators such as our Activity Index have been more successful at capturing the coincident trend in China’s economy than, for example, real GDP growth has over the past several years. Chart 2illustrates that the earnings cycle for the investable and domestic equity markets is the same, with the magnitude of a given cycle accounting for the difference between the two markets. This means that investors exposed to the Chinese equity market should be focused heavily on predicting the coincident trend in the economy, as doing so will lead investors to the same conclusion about the trend in H- and A-share EPS growth. Chart 2Same Earnings Cycle In The Investable And Domestic Markets
Same Earnings Cycle In The Investable And Domestic Markets
Same Earnings Cycle In The Investable And Domestic Markets
Chart 3Our Leading Indicator Reliably Predicts Economic Activity
Our Leading Indicator Reliably Predicts Economic Activity
Our Leading Indicator Reliably Predicts Economic Activity
In turn, Chart 3 presents our framework for predicting Chinese economic activity, which we originally laid out in our November 30, 2017 Special Report.2 The chart shows that our leading activity indicator has reliably predicted inflection points in actual activity over the past several years, including the slowdown of the past two years (the leading indicator peaked in Q1 2017). As detailed in the report, our indicator is based on monetary conditions and money & credit growth. Panel 2 of Chart 3 shows that monetary conditions are very easy and credit growth is picking up, though it needs to continue to improve alongside a forceful pickup in money growth in order for the economy to strengthen. The key takeaway for investors is that the overall earnings cycle in China is strongly linked to “old economy” economic activity, which in turn appears to reliably predicted by our indicator. This provides us with a stable platform from which we can examine (and ultimately predict) equity sector EPS. Sector Earnings: Predictability And Cyclicality Given the strong link between Chinese economic activity and equity market EPS that we noted above, the question for equity-oriented investors is then to identify the relationship between sector and overall index EPS. In other words, to what degree are sector EPS in China linked to the overall earnings trend (versus being driven by idiosyncratic factors), and is this relationship pro- or counter-cyclical in nature? Charts 4 and 5 present the answers to these questions, based on the 2011 – 2018 period.3 The charts present the highest R-squared value resulting from a regression of detrended sector EPS versus broad market EPS for both the investable and domestic markets, after accounting for any leading/lagging relationships. The color/shading of each bar denotes whether the beta of the relationship for each sector or industry group is above or below 1.
Chart 4
Chart 5
The charts present a mix of surprising and unsurprising results. Among the latter in the investable market, the cyclicality of typically high-beta sectors such as energy, materials, industrials, consumer discretionary, and technology would be readily accepted by most investors, as would the defensive characteristics of financials, telecom services, health care, utilities, and consumer staples. Investable consumer staples, health care, and utilities EPS are driven by either bottom-up/industry-specific factors or macro factors that are not fully captured by the trend in China’s business cycle. However, there were several less-intuitive results that emerged from our analysis, related to both the investable and domestic markets:
Chart 6
Within the investable market, the low predictability of health care, utilities, and consumer staples EPS is somewhat difficult to explain. A weak relationship would easily be explained if EPS growth for these sectors were somewhat constant in the face of fluctuations in overall index EPS, but Chart 6 shows that the volatility in EPS growth for these sectors are not bottom-ranked (see also pages 16, 17 and 22). In fact, utilities EPS growth vol has been relatively high, and it is higher for health care and consumer staples than it is for financials and banks, whose EPS growth are highly linked to the overall earnings cycle. This result suggests that the determinants of earnings for these sectors are driven by either bottom-up/industry-specific factors or macro factors that are not fully captured by the trend in China’s business cycle. The low predictability of consumer staples and utilities EPS observed in the investable market is also evident in the domestic market, suggesting that this finding is not the result of quirky data. We noted earlier that overall index earnings are highly correlated with our BCA China Activity Index, and we have noted in past reports that China’s business cycle continues to be subject to its “old” growth model centered on investment and exports rather than the services and consumer sectors.4 This may explain the relatively idiosyncratic EPS profile for consumer staples, although it still fails to explain the low predictability and relatively high volatility of utilities earnings. Telecom services and technology earnings also have a very low correlation with overall earnings in the domestic market, which is similar to the investable market but more extreme. On the tech front, this is explained by the fact that Alibaba and Tencent, China’s tech giants, are not listed in the domestic market, underscoring that investable tech and domestic tech should be considered by investors to be distinctly separate sectors. In the investable market the low predictability and defensive characteristic of telecom services EPS can be explained by stable, low-volatility growth, but this is not true in the domestic market. In fact, over the past several years the volatility of domestic telecom EPS growth has been among the highest of any of China’s domestic equity sectors, and it has been cyclical rather than defensive in nature. These findings are difficult to explain from a top-down perspective. Finally, while Charts 4 and 5 show a difference in the cyclicality of real estate earnings between the investable and domestic markets, the difference is not substantial: the beta of the former is 1.03 versus 0.94 for the latter. The truly surprising result from real estate stocks is that their EPS growth is not considerably high-beta, given the boom & bust nature of Chinese property prices and the enormous amount of activity that has occurred in Chinese real estate over the past decade. Given that beta is determined relative to the overall index, this is emblematic (and an important reminder) of the underlying cyclicality of China’s economy and its financial markets relative to its global counterparts. Sector Earnings: Relevance For Stock Prices Following our review of the predictability and cyclicality of Chinese sector EPS, Charts 7 and 8 illustrate the relationship between relative EPS and relative stock price performance for these sectors. The charts highlight several notable points:
Chart 7
Chart 8
In both the investable and domestic markets, the relative performance of energy and consumer discretionary stocks have been highly explained by the trend in relative EPS. Both of these sectors have also shown reasonably high EPS predictability (based on overall index EPS), suggesting that these two sectors have historically been the best candidates for a classic top-down fundamental “sector rotation” strategy. The relative re-rating of consumer staples and de-rating of banks reflects the existence of a long consumer economy / short industrial economy trade. Chart 9Multiples Have Been More Important In Driving The Returns Of These Sectors
Multiples Have Been More Important In Driving The Returns Of These Sectors
Multiples Have Been More Important In Driving The Returns Of These Sectors
Within the investable market, relative EPS has not been successful at predicting relative stock price performance for financials/banks, health care, consumer staples, and industrials. This means that multiple expansion/contraction has been a relatively more important factor in driving returns, which can clearly be seen in Chart 9. The chart shows that investable banks, health care, and industrials have been meaningfully de-rated over the past several years, whereas the relative P/E ratio for consumer staples stocks has risen (albeit in a choppy fashion). Domestic consumer staples have also benefited from re-rating, although it has occurred entirely within the past three years and has merely made up for the substantial de-rating that took place in 2012 (Chart 9, panel 2). Taken together, the relative re-rating of consumer staples and de-rating of banks and industrials reflects, at least in part, the existence of a long consumer economy / short industrial economy trade. The relative EPS trend of utilities in both markets and that of telecom services stocks in the investable market have done a decent-to-good job of predicting relative stock price performance. We noted earlier that investable telecom services earnings appear to have a weak relationship with overall index earnings because of their low variability, meaning that they have also been a good top-down rotation candidate on the defensive side of the spectrum. The high responsiveness of the relative equity performance of Chinese utilities to relative EPS raises the importance of predicting the latter, which is likely to be a topic of future reports for BCA’s China Investment Strategy service. Finally, Chart 7 shows that the most important sector trend in the investable market over the past several years, the outperformance of information technology, has been strongly explained by the trend in relative EPS. This is good news for investors, as it suggests that relative tech returns can be reasonably predicted by accurate earnings analysis. From a top-down perspective, we noted earlier that the relationship between tech and overall index EPS has not been extremely high, which raises the bar for investors to understand the idiosyncratic drivers of earnings for the BAT (Baidu, Alibaba, and Tencent) stocks. Chinese consumer spending remains the most important macro factor for these stocks, but our understanding of this relationship is not complete and is an area of ongoing research at BCA. Investment Conclusions Chart 10 summarizes the results of Charts 4-5 and 7-8, by grouping investable and domestic equity sectors into four quadrants based on top-down EPS predictability (x-axis) and the impact of the trend in relative EPS on relative stock price performance (y-axis):
Chart 10
Over a multi-year time horizon, the relationship between relative earnings and relative stock prices is likely to rise for several sectors. As we noted above, energy and consumer discretionary in both markets along with real estate and financials in the domestic market have had the strongest relationship across both dimensions (top-right quadrant). The EPS relationship is cyclical in both markets in the case of energy and consumer discretionary, whereas it is modestly cyclical for domestic real estate and defensive for domestic financials. Sectors in the top-left quadrant have shown a strong link between earnings and stock price performance, but a weaker link between sector and index earnings. This is the case for telecom services because of relatively steady, low volatility earnings growth, meaning that telecom stocks are reliably defensive. Fluctuations in the growth of index EPS do not explain the majority of changes in investable tech EPS, but it is an important driver in a cyclical relationship. Sectors in the bottom-right quadrant have a predominantly strong and defensive relationship with index earnings growth (with the exception of domestic industrials), but have experienced significant changes in multiples over the past several years that have materially impacted their relative stock price performance. We showed in Chart 9 that banks have been meaningfully de-rated over the past several years; this process appears to have halted at the end of 2017, suggesting that the relationship between relative earnings and relative stock prices may be stronger going forward. Chart 11Investable Real Estate And Materials Stocks Trade At A Huge Discount
Investable Real Estate And Materials Stocks Trade At A Huge Discount
Investable Real Estate And Materials Stocks Trade At A Huge Discount
Finally, sectors in the bottom left quadrant have had relatively idiosyncratic earnings trends, and relative EPS have not explained a majority of the trend in relative performance. We would draw a distinction between investable industrials, real estate, and materials and the rest of the sectors shown, as they are on the cusp of being in the top-right or bottom-right quadrants, and all three appear to have suffered from meaningful de-rating. Investable real estate and materials now trade at over a 40% discount to the overall index (Chart 11), raising a serious question as to whether relative P/Es can continue to compress and explain the majority of relative equity performance. However, investable consumer staples and health care, along with domestic technology and telecom services stocks, do appear to be legitimately idiosyncratic, suggesting that an equity beta approach (regressing sector returns against index returns) is the best top-down method available to investors when allocating to these sectors. For investable staples and health care their equity return betas are clearly defensive, whereas domestic tech and telecom services stocks are market neutral. What does this all mean for investors? Our findings above lead us to some specific conclusions over the tactical (0-3 months), cyclical (6-12 months), and secular (multi-year) horizons: Over the cyclical horizon, we expect Chinese co-incident economic activity to pick up and for overall index EPS to improve, suggesting that global investors have a fundamental basis to be overweight investable energy, consumer discretionary, materials, media & entertainment (within the new communication services sector) and industrial stocks, at the expense of telecom services and financials.5 Investable health care, consumer staples, and utilities stocks are also likely to underperform, although this view is based on a statistical/empirical relationship rather than a fundamental one. In the domestic market, our findings support substituting real estate for technology in comparison to the investable sectors we listed above, but we are concerned that policymakers may crack down more heavily on the property sector if they allow overall credit growth to rise meaningfully as part of a stimulative response. For now, we would not recommend aggressive bets in favor of the domestic real estate sector. Chart 12Flagging Earnings Growth Heightens Tactical Risks To Chinese Stocks
Flagging Earnings Growth Heightens Tactical Risks To Chinese Stocks
Flagging Earnings Growth Heightens Tactical Risks To Chinese Stocks
Over the tactical horizon, however, we would advise either the opposite stance, or a benchmark sector allocation. In addition to our view that a financial market riot point remains likely over the coming few months to force policymakers to address the economic weakness that an escalated tariff scenario would entail, broad-market Chinese EPS growth continues to decelerate (Chart 12). We see this continued slowdown as a lagged response to past economic weakness, which we expect will be reversed over the coming year due to stronger money & credit growth. However, sectors with pro-cyclical earnings growth may fare poorly in the near term until investors gain confidence that the (inevitable) policy response will stabilize the earnings outlook. Over the secular horizon, the most important conclusion is that there have been several long-term sectoral de/re-rating trends within China’s equity market. In the investable market, health care, consumer staples, and consumer discretionary (of which Alibaba is heavily represented) trade at 100-200% of a premium relative to the broad equity market on a trailing earnings basis, whereas financials, materials, and real estate stocks trade at a 40-60% discount. These divergences also exist in the domestic market, although the range is somewhat less extreme. A simple contrarian instinct might be to strategically overweight/underweight expensive/cheap sectors, but to us the simpler conclusion is that the extreme nature of these trends means that the strength of the relationship between EPS and stock prices for these sectors is set to rise. Over the coming few years, investors should focus nearly exclusively on the earnings outlook for high flying and beaten down sectors, a question that is very likely to be the topic of additional China Investment Strategy reports this year. Stay tuned! Jonathan LaBerge, CFA, Vice President Special Reports jonathanl@bcaresearch.com Reference Charts Energy Chart 13
Energy
Energy
Chart 14
Energy
Energy
Materials Chart 15
Materials
Materials
Chart 16
Materials
Materials
Industrials Chart 17
Industrials
Industrials
Chart 18
Industrials
Industrials
Consumer Discretionary Chart 19
Consumer Discretionary
Consumer Discretionary
Chart 20
Consumer Discretionary
Consumer Discretionary
Consumer Staples Chart 21
Consumer Staples
Consumer Staples
Chart 22
Consumer Staples
Consumer Staples
Health Care Chart 23
Health Care
Health Care
Chart 24
Health Care
Health Care
Financials Chart 25
Financials
Financials
Chart 26
Financials
Financials
Banking Chart 27
Banking
Banking
Chart 28
Banking
Banking
Information Technology Chart 29
Information Technology
Information Technology
Chart 30
Information Technology
Information Technology
Telecom Services Chart 31
Telecom Services
Telecom Services
Chart 32
Telecom Services
Telecom Services
Utilities Chart 33
Utilities
Utilities
Chart 34
Utilities
Utilities
Real Estate Chart 35
Real Estate
Real Estate
Chart 36
Real Estate
Real Estate
Footnotes 1 Please see Geopolitical Strategy and China Investment Strategy Special Report, “Another Phony G20? And A Word On Hong Kong”, dated June 14, 2019, available at cis.bcaresearch.com. 2 Please see China Investment Strategy Special Report, “The Data Lab: Testing The Predictability Of China’s Business Cycle”, dated November 30, 2017, available at cis.bcaresearch.com. 3 S&P Dow Jones and MSCI Inc. implemented major structural changes to the Global Industry Classification Standard (GICS) in Q4 2018 that substantially altered the sector composition of the MSCI China Investable index. The weight of the information technology sector in the investable index dropped dramatically after the GICS changes occurred. Investors should note that we used Q3 2018 as the end date of our analysis in order to remove any impact from the GICS sector change; the reference charts shown on pages 12 – 23 provide all data since 2011. 4 Please see China Investment Strategy Weekly Report, “The Three Pillars Of China’s Economy”, dated May 16, 2018, available at cis.bcaresearch.com. 5 Due to the changes to the GICS classification structure noted in footnote 3, the tech sector relationships that we highlighted above now apply to the consumer discretionary sector (level 1) and media & entertainment industry-group (level 2, within the new level 1 communication services sector. Cyclical Investment Stance Equity Sector Recommendations
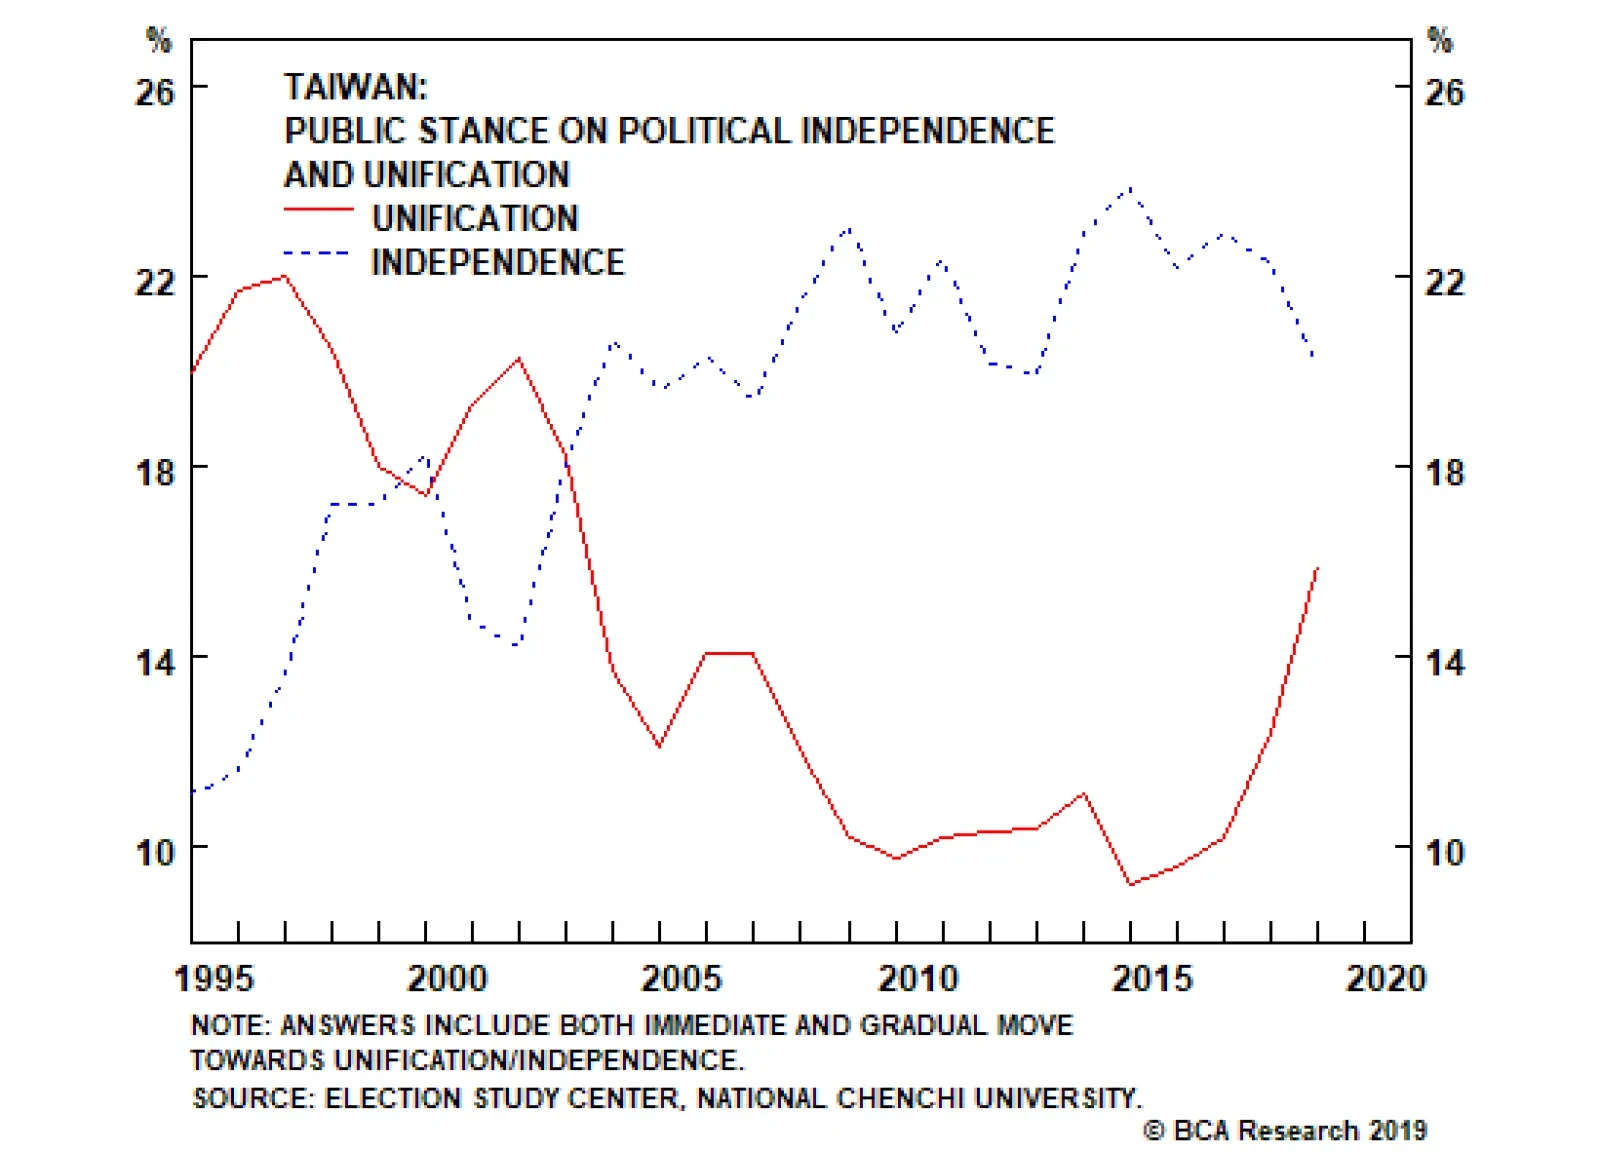
The pressures in Hong Kong also highlight why we view Taiwan as a potential “Black Swan.” Similar political fissures are emerging as Beijing expands its economic and military dominance over Taiwan. Of course, the political backlash against Beijing has…
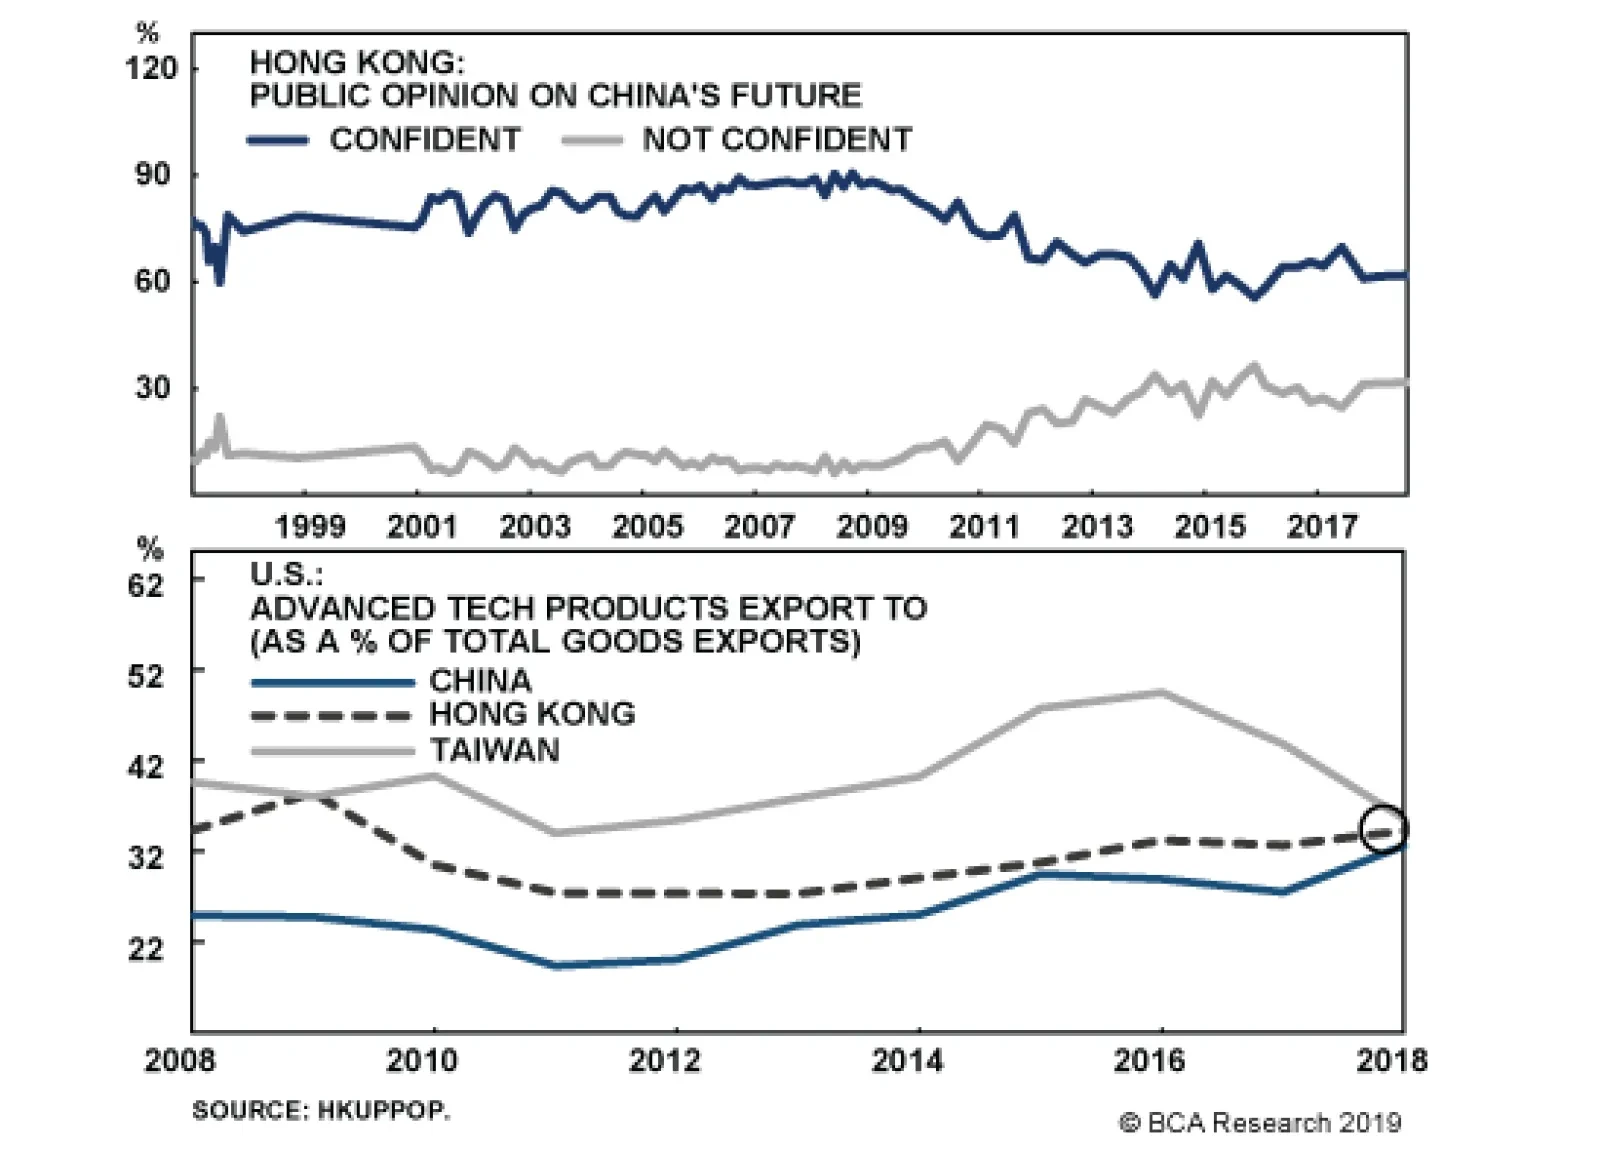
The current protests are part of a process going back to 2012 in which the disaffected and marginalized parts of Hong Kong society began speaking up against the political establishment. This emerged because of high income inequality, shortcomings in quality…
Highlights The odds of a cyclical upturn in the global semiconductor sector over the next three to six months are low. Global semiconductor demand will continue to decline due to contracting demand for smartphones, automobiles, personal computers (PCs), and servers. Global semiconductor stocks are still facing considerable downside in absolute terms. We recommend going long Asian semiconductor stocks versus the U.S. S&P 500 semiconductor index. Dedicated EM equity portfolios should stay neutral on the Taiwanese bourse and Korean technology sector relative to the overall EM benchmark. Feature Chart 1 shows share prices of the global semiconductor sector and global semiconductor sales in the past two decades. Chart 1Global Semiconductor Market: Sales & Share Prices
Global Semiconductor Market: Sales & Share Prices
Global Semiconductor Market: Sales & Share Prices
Was last December’s trough in global semiconductor equity prices the ultimate bottom in this cycle? The odds are in favor of a continued contraction in global semiconductor sales and further downside in semiconductor share prices over the next three to six months. Cycle-On-Cycle Analysis Semiconductor sales experienced five recessions over the past 20 years. Table 1 illustrates the peak-to-bottom percentage decline in nominal global semiconductor sales and the magnitude of the drop in global semiconductor share prices in U.S. dollar terms during these five cyclical downturns in this industry. It also indicates the duration of each downturn and the number of months that semiconductor stocks led the bottom in global semiconductor sales. Table 1Key Statistics Of Five Cyclical Downturns In Global Semiconductor Market
The Global Semiconductor Sector: Is A Cyclical Upturn Imminent?
The Global Semiconductor Sector: Is A Cyclical Upturn Imminent?
The current shrinkage of semiconductor sales is worse than the 2011-12 and 2015 downturns. Yet, it is still smaller than the magnitude during the 2008 Great Financial Crisis and the 2001 tech bubble bust. The revenue of semiconductor companies has so far contracted by 24%, which is disproportionally more than the decline in share prices of these companies. The global semiconductor equity index is only 14% below its March 2018 high. It appears as though the market is expecting a quick recovery in semiconductor sales. As per Table 1, in the downturns of 2008, 2011 and 2015, global semiconductor stocks all bottomed before the bottom of global semiconductor sales. Only in the 2001 episode, stock prices bottomed eight months after the bottom in sales. In the current cyclical downturn, global semiconductor sales have so far had only four months of growth contraction,1 far less than the 13-16 months experienced in all the past four cycles. All in all, we would lean against the market’s expectation of an imminent recovery in the semiconductor cycle. The demand downturn will last another three to six months and share prices are facing major headwinds. Global Semiconductor Demand Semiconductor sales are in contraction across countries and regions (Chart 2). In April – before President Trump’s tweet on imposing new import tariff on China, global semiconductor sales growth sank to a negative 15% year-on-year. The short-term (three-to-six month) outlook for global semiconductor demand remains dismal. Chart 3 shows global semiconductor revenue breakdown in terms of end usage. Mobile phones account for the largest share (29%) of the market, followed by PCs (12%), miscellaneous consumer products (12%), and servers (11%). All of these major demand sources are under downward pressure: Smartphone Sales Global smartphone sales are shrinking (Chart 4). According to the International Data Corporation (IDC), global smartphone shipments declined 6.6% year-on-year in volume terms in the first quarter of this year, worse than last year’s 4.4% drop. Chart 2Semiconductor Sales Are In Contraction Across Countries
Semiconductor Sales Are In Contraction Across Countries
Semiconductor Sales Are In Contraction Across Countries
In the current cyclical downturn, global semiconductor sales have so far had only four months of growth contraction, far less than the 13-16 months experienced in all the past four cycles.
Chart 3
Chart 4Global Smartphone Sales: Contracting
Global Smartphone Sales: Contracting
Global Smartphone Sales: Contracting
We expect smartphone shipments to continue contracting in the second half of this year. Major markets such as mainland China and advanced economies have entered the saturation phase of mobile-phone demand. For example, U.S. shipments were down 15% year-on-year in the first quarter due to near-full market penetration. In China, smartphone sales have shown signs of stabilization (Chart 5). However, this is probably temporary and has been driven by the boom in Huawei smartphone sales in China since early this year. The incredible 50% year-on-year growth of Huawei smartphone sales in the first quarter is not sustainable. While global sales of Huawei smartphones increased by 20 million units, total global smartphone sales of all brands fell by 22 million units (Chart 6). The U.S. punitive actions towards China and Huawei have also instigated nationalism in China. This has triggered a Chinese buying-spree of the Huawei smartphone. Chart 5Chinese Smartphone Sales: Temporary Stabilization
Chinese Smartphone Sales: Temporary Stabilization
Chinese Smartphone Sales: Temporary Stabilization
Chart 6
Yet, this has probably reduced the number of potential Chinese smartphones buyers in the near future. After all, many buyers likely made the purchase earlier than otherwise planned in the absence of a trade war. Although Samsung, Huawei, OnePlus, Xiaomi, Motorola, LG, and ZTE have either released or will release their 5G phones this year, the sales growth from 5G phones will not be able to offset the loss in 2G, 3G and 4G phone sales, at least not in 2019. The IDC estimated that 5G phones would only account for about 0.5% of the market share this year. 5G will likely only begin affecting overall semiconductor demand next year, when they account for a larger share of smartphone sales. Huawei is the market leader in 5G technology. The U.S. boycott of Huawei will likely continue. This will only slow the pace of 5G phone adoption and the development of 5G networks worldwide. On balance, global smartphone demand may only recover next year. Server Demand Global server shipments also experienced a 5% contraction in volume terms in the first quarter of this year, according to IDC (Chart 7). The outlook for the rest of 2019 does not look promising. Global server demand will likely remain in contraction in the second half of this year. Many hyperscale data centers have already purchased considerable amounts of servers in advance of the trade war to avoid tariffs.2 Meanwhile, the escalation in the U.S.-China confrontation has increased economic uncertainties. This may delay potential datacenter investments. Decelerating 5G network development worldwide due to the U.S. ban on Huawei will also tend to discourage new datacenter and cloud services projects. This is because the 5G technology enables datacenter and cloud services to experience a huge improvement in terms of data transfer speeds, latency, connectivity, capacity, reliability and mobility. Chart 7Global Server Shipment: Are In Contraction
Global Server Shipment: Are In Contraction
Global Server Shipment: Are In Contraction
Personal Computers (PC) PCs sales are also in contraction (Chart 8). PC demand has entered into the deep-maturation phase while facing strong competition from tablets and laptops. Auto Sales Global auto sales also sank by 5% in April from a year ago, registering the worst contraction since 2009 (Chart 9). Chart 8Global PCs Sales: Deeply Saturated
Global PCs Sales: Deeply Saturated
Global PCs Sales: Deeply Saturated
Chart 9Global Auto Sales Are In Contraction As Well
Global Auto Sales Are In Contraction As Well
Global Auto Sales Are In Contraction As Well
Regarding auto demand, the Chinese government may continue to implement more supportive policies to stimulate car sales in China. However, we believe the recovery will be delayed. The government has already implemented a number of policies to lift domestic car sales since late January, including providing subsidies to encourage new energy vehicle sales, to promote auto sales in rural areas, and to increase auto replacement. The central government recently loosened auto sales restrictions in the first tier cities of Guangzhou and Shenzhen that have restrictive auto sales policies. However, all of these policies have failed to lift Chinese domestic car sales out of deep contraction. The key reason has been a diminishing willingness to spend among Chinese consumers, as suggested by falling households’ marginal propensity to consume (Chart 10). Bottom Line: Global semiconductor demand growth will likely remain weak and will fail to recover in the second half of this year. The basis is that its major upstream markets (smartphone, servers, PCs and automobiles) are all facing cyclically declining demand. Chart 10Chinese Consumers: Diminishing Willingness To Consume
Chinese Consumers: Diminishing Willingness To Consume
Chinese Consumers: Diminishing Willingness To Consume
Inventories And Prices Chart 11 shows the semiconductor supply chain illustrating the process of manufacturing semiconductors starting with silicon wafers and up to final electronic products.
Chart 11
Box 1 explains the role of key segments and players along the supply chain. Box 1 A Brief Explanation Of The Key Segments/Players Of The Supply Chain Both integrated device manufacturers (IDM) and foundries are at the center of the supply chain, responsible for chip manufacturing. In terms of semiconductor sales revenue, Samsung, Intel and SK Hynix are the world’s top three IDM companies and TSMC, Global Foundries and United Microelectronics Corp (UMC) are the world’s top three foundries. While IDMs cover most of the process from IC design, chip fabrication, assembly, testing and packaging, IDM companies still have to purchase raw materials and equipment for the chip-making process. Foundry companies receive orders from IC designing companies like Qualcomm, Nvidia, and Huawei HiSilicon, then purchase needed raw materials and equipment to proceed in the chip-manufacturing process. Both IDMs and foundries can either outsource the tasks of semiconductor assembly and testing or perform them on their own. The final semiconductor products will be used in electronics products, such as smartphones, computers, home appliances, automobiles, etc. Global semiconductor demand growth will likely remain weak and will fail to recover in the second half of this year. The basis is that its major upstream markets (smartphone, servers, PCs and automobiles) are all facing cyclically declining demand. In a typical business cycle, a cyclical downturn begins with a slump in demand for final electronic products (upstream demand). This leads to falling semiconductor sales. As a result, inventory buildup will occur across most of the segments along the semiconductor supply chain. Chipmakers: Producers’ semiconductor inventory in both Taiwan and Korea have reached either a record high or a near-record high (Chart 12). The installed wafer capacities at these two countries are the world’s largest, together accounting for 43% of total global wafer capacity. In addition, the inventory of some major electronic parts and components have also increased considerably in Taiwan (Chart 13). This also implies weaker demand for semiconductor raw materials. Chart 12Chipmakers: A Rapid Buildup In Inventory
Chipmakers: A Rapid Buildup In Inventory
Chipmakers: A Rapid Buildup In Inventory
Chart 13Rising Inventory Of Some Major Electronic Parts And Components
Rising Inventory Of Some Major Electronic Parts And Components
Rising Inventory Of Some Major Electronic Parts And Components
Raw material suppliers: Silicon wafer is the indispensable raw material required in the chip manufacturing process. Japanese companies account for over half of global silicon wafer supply.Chart 14 shows that silicon wafer inventory in Japan has had a significant buildup in volume terms since late last year. Importantly, it is not declining yet. Chart 14Silicon Wafer Inventory: A Significant Buildup As Well
Silicon Wafer Inventory: A Significant Buildup As Well
Silicon Wafer Inventory: A Significant Buildup As Well
Outsourced semiconductor assembly and test (OSAT) providers: Both Singapore and Thailand are OSAT providers while they also manufacture, assemble and export electronic products. Both countries are closer to the downstream side of the semiconductor supply chain. Semiconductor inventory at these two countries has also jumped to a record high (Chart 15). Chart 15Singapore and Thailand: Record High Semiconductor inventory
Singapore and Thailand: Record High Semiconductor inventory
Singapore and Thailand: Record High Semiconductor inventory
Importantly, a marginal improvement in demand will tend to support spot prices. For example, in the memory chip market, falling prices denote weak demand relative to excess supply. When prices of DRAM and NAND start to form a bottom or decisively move up, this may indicate the arrival of a cyclical upturn. So far, both DRAM and NAND prices are continuing to fall (Chart 16). In addition, the prices of silicon wafer – the most important raw material used in the chip-making process – have declined in the first half of this year.3 Chart 16Still Falling Memory Chip Prices
Still Falling Memory Chip Prices
Still Falling Memory Chip Prices
Chart 17Deflating DRAM Prices Suggest Downside Risks To Korean Tech Stocks
Deflating DRAM Prices Suggest Downside Risks To Korean Tech Stocks
Deflating DRAM Prices Suggest Downside Risks To Korean Tech Stocks
In short, prices are the most important variable to monitor. Chart 17 exhibits the high correlation between DRAM prices and the Korean technology sector stock prices. Falling DRAM prices suggest downside risks to technology stocks in Korea. Samsung accounts for about 65% of Korea’s tech index and 27% of the overall Korean equity index. Memory chips accounted for 68% of Samsung’s operating profits in the first quarter of this year. Bottom Line: There has been involuntary inventory accumulation along the entire supply chain of semiconductors. This and ongoing price deflation among various types of semiconductors foreshadow a downbeat near-term outlook. The Interpretation Of Some Positive Developments There have been some positive developments in the past several months. Taiwanese PMI new orders diffusion index in the electronics sector jumped out of deep contraction to reach zero, and Chinese semiconductor imports halted their decline in both volume and value terms (Chart 18). The improvement in the aforementioned data was probably mainly due to large semiconductor purchases by China to hedge the rising risk of U.S. blocking China’s technological development (Chart 19). Chart 18Some Positive Development
Some Positive Development
Some Positive Development
Chart 19China: More Semiconductors Purchases Before The Tariff And U.S. Huawei Ban?
China: More Semiconductors Purchases Before The Tariff And U.S. Huawei Ban?
China: More Semiconductors Purchases Before The Tariff And U.S. Huawei Ban?
Besides, Huawei smartphone sales have been booming, which we deliberated on page 5, could have been responsible for the improvement in these data. This one-off surge will likely dwindle going forward. Investment Conclusions We remain negative on Asian semiconductor share prices in absolute terms. A continued contraction in global semiconductor sales will further squeeze their profits. In relative terms, we are neutral on the Asian semiconductor sector: we continue recommending market-weight allocation to Taiwan’s overall market and the Korean technology sector within the EM equity benchmark. As a new trade, we recommend going long Asian semiconductor stocks and short the S&P 500 semiconductor index over the next three to six months (Chart 20). The Bloomberg Asia Pacific semiconductor index has nine stocks. Samsung and TSMC account for 42% and 38% of the index, respectively. There has been involuntary inventory accumulation along the entire supply chain of semiconductors. This and ongoing price deflation among various types of semiconductors foreshadow the downbeat near-term outlook. Samsung will likely benefit from the U.S. ban on Huawei in the smartphone sector outside of China. In addition, Samsung will win some market share from Apple as the latter does not have a 5G phone to release this year. These positive factors may partially offset the negative impact from falling memory prices and demand on Samsung. The S&P 500 semiconductor index has 13 stocks. Intel, Broadcom, Texas Instruments and Qualcomm are the top five constituents, together accounting for nearly 70% of the index. Most of these companies are IC designing companies, which will likely suffer as Chinese demand for their products shrink due to the U.S. administration's ban on Huawei. This position will also benefit from U.S. dollar appreciation. A firm dollar will hurt profits of U.S. semiconductor stocks. In turn, currency depreciation in Korea and Taiwan will on the margin benefit Asian semiconductor stocks. Chart 20Recommend Long Asia Pacific Semiconductor Stock Vs. S&P 500 Semiconductor Index
Recommend Long Asia Pacific Semiconductor Stock Vs. S&P 500 Semiconductor Index
Recommend Long Asia Pacific Semiconductor Stock Vs. S&P 500 Semiconductor Index
Chart 21The 2015 Experience
The 2015 Experience
The 2015 Experience
Chart 21 shows that global foundry companies outperformed global IC designing companies during the final phase of the 2015 cyclical downturn. Odds are that these dynamics will play out in this downturn as well. Finally, the relative performance of Asian semiconductor stocks versus U.S. ones is oversold and might stage some sort of mean reversion (Chart 20). Ellen JingYuan He, Associate Vice President ellenj@bcaresearch.com Footnotes 1 Please note that here the calculation for “the number of months of the growth contraction” is different from the one for the “peak-to-bottom duration” in Table 1. “The number of months of the growth contraction” equals the number of months when semiconductor sales year-on-year growth is negative. 2 https://marketrealist.com/2019/05/nvidias-data-center-revenue-inference-rendering-and-edge/ 3 http://www.sohu.com/a/300386061_132567, http://news.moore.ren/industry/104958.htm
Highlights We spent nearly all of last week engaged in dialogue with clients: Over the course of a dozen face-to-face meetings, and multiple follow-up questions, we learned that crowding out is a real phenomenon. The Fed and trade tensions were essentially all that people wanted to discuss. We’re expecting a 25-basis-point rate cut in July, but our investment recommendations have not changed: We remain bullish on risk assets and bearish on Treasuries, and we continue to recommend that investors maintain below-benchmark duration positioning. Feature It turns out that you really can’t fight the Fed. Not when meeting with investors right now, anyway, as its impending moves dominated our discussions with several U.S.-based clients last week. We expect monetary policy will be Topic A on our meetings schedule this week and next, especially if the plot thickens after the FOMC releases its updated Summary of Economic Projections (“the dots”) and markets mull over Wednesday’s post-meeting statement and press conference. This report covers our recent exchanges with investors on the points that came up most often. Chart 1Healing, If Not Yet Fully Healed
Healing, If Not Yet Fully Healed
Healing, If Not Yet Fully Healed
Q: How likely is it that the Fed will cut rates? We think a rate cut at the FOMC meeting beginning tomorrow is unlikely. Fed officials only revealed that they were seriously contemplating the idea recently, and it would feel rather sudden if they followed through so soon, especially when the Mexican tariff cloud has lifted, economic data have been reasonably firm and financial conditions are still easing (Chart 1). We pay particularly close attention when Fed speakers all start singing from the same sheet, though, and the prepared-to-adjust-the-target-range-as-necessary refrain is signaling a rate cut. Our base case is that changes in the post-meeting statement and the updated dots will point in the direction of a cut at the next FOMC conclave at the end of July. Q: Why has the Fed changed its tune so much since mid-December? We view the Fed’s evolution from a tightening bias to an easing bias as having unfolded in three distinct stages. The first stage occurred in early January, following the sharp fourth-quarter selloff in equities and corporate bonds. The decline in stock prices amounted to a meaningful decline in household wealth, the sudden widening in bond spreads heralded higher debt-service costs for corporations and consumers, and the surge in mortgage rates caused several would-be homebuyers to lose their nerve (Chart 2). With the accumulated tightening in financial conditions equating to at least one, if not two, 25-basis-point hikes in the fed funds rate, additional hikes would have amounted to piling on, and the Fed opted to move to the sidelines for perhaps a six-month stay. Financial conditions are still tighter than they were before the fourth-quarter selloff, but they’ve eased quite a bit. Chart 2The Rate Backup Spooked Homebuyers, But They'll Be Back
The Rate Backup Spooked Homebuyers, But They'll Be Back
The Rate Backup Spooked Homebuyers, But They'll Be Back
The Fed signaled an even lengthier pause in March, bemoaning the risk of too-low inflation expectations, at a time when global growth was already slumping (Chart 3). It seemed to us that it began to worry about the prospect of entering the next recession with inflation expectations below 2%, from which it would not be able to lower the real fed funds rate below -2%. Inflation expectations of 2.5%, on the other hand, would support a real fed funds rate of -2.5%, providing the Fed with additional firepower to restart the economy. The post-meeting dots removed two full rate hikes from the median voter’s terminal-rate projection, and appeared to stretch the Fed’s pause from six months to twelve. Chart 3As Global Trade Goes, So Goes Global Growth
As Global Trade Goes, So Goes Global Growth
As Global Trade Goes, So Goes Global Growth
Global trade facilitates global growth. Impediments to trade can cast a long shadow over the global economy, and the escalation of trade tensions provided the catalyst for the Fed’s latest dovish turn. Against a backdrop of uninspiring global growth, taking out some monetary policy insurance to protect against increasing trade frictions may well be a prudent course of action, especially in a low-inflation environment. At the moment, we assign slightly better than a 50% probability that the FOMC will cut the target rate at its July 30-31 meeting, but much could change between now and then. Q: What will happen if the Fed cuts rates? If the Fed cuts the fed funds rate in response to a rapidly weakening economy, risk assets will fare poorly. If the economy’s doing fine, and the rate cut is simply an insurance policy, the additional accommodation would give the economy an incremental boost, extending the longevity of the expansion. A longer runway for the business cycle, in turn, would mean longer (and bigger) bull markets in equities and spread product. In our base-case scenario in which the economy’s doing fine, a rate cut (or cuts) would be tantamount to spiking the punchbowl, and would therefore extend the sell-by date on our overweight equities and spread product recommendations. We don’t think the U.S. economy needs easier monetary policy, but there’s nothing in the current low-inflation environment that would prevent the Fed from cutting the fed funds rate as insurance against a downturn. Q: But what will happen if the Fed falls short of the rate-cut expectations that are already being discounted by the markets? As implied by the overnight index swap (OIS) curves, the money markets are pricing in 75 basis points (“bps”) of rate cuts in 2019, and another 25 in 2020 (Chart 4). Those expectations are awfully aggressive, and they are flatly incompatible with our constructive view. If the economy proves to be more resilient than expected, spread product will outperform Treasuries, especially given how much the latter have surged on the pickup in risk aversion. In line with our U.S. Bond Strategy service’s Golden Rule of Bond Investing,1 we expect that long-maturity Treasuries will underperform the overall Treasury index if actual rate cuts fall short of expected rate cuts over the next twelve months. We expect that the yield curve will first shift higher as the market discounts a better economic future (real rates rise) and then steepen as investors begin to discount the inflation implications of unneeded incremental monetary accommodation. Chart 4The Money Market Seems To Foresee A Recession
The Money Market Seems To Foresee A Recession
The Money Market Seems To Foresee A Recession
Chart 5Stocks Do Better When Real Rates Are Rising
Stocks Do Better When Real Rates Are Rising
Stocks Do Better When Real Rates Are Rising
If the economy surprises to the upside, the resulting boost to earnings should help equity investors overcome any disappointment resulting from a rate-cut shortfall. In terms of equity analysts’ spreadsheets, we expect that the boost to the earnings numerator would be large enough to overcome the drag from a larger interest rate denominator. Empirically, U.S. equities perform better over periods when real rates are rising than they do when real rates are falling (Chart 5). Q: What do you see for the rest of the world? We see improvement for the rest of the world. After 2017’s globally synchronized upturn, the first since the crisis, 2018 was marked by a sharp divergence in momentum. The U.S., fueled by fiscal stimulus, powered ahead, while China slowed, hobbled by monetary tightening. We think it is telling that the rest of the world followed China, the world’s second largest standalone economy, rather than the U.S., the comparatively closed number one (Chart 6). Chart 6Divergent Paths
Divergent Paths
Divergent Paths
Our China Investment Strategy and Geopolitical Strategy teams have repeatedly made the case that investors have underestimated the lagged impact of tight monetary policy and slowing domestic credit growth on the Chinese economy over the past two years. While the existing tariffs on imports to the U.S. are a drag on Chinese growth, policymakers’ efforts to redirect credit creation from the shadow banking system to the regulated banking system has had a larger impact on economic activity. Now that the regulatory impediment has been removed, total social financing growth has picked up, and our China team expects it to rise meaningfully over the coming year in order to overcome the combination of still-muted economic momentum and a larger shock to the export sector (Chart 7). The key takeaway is that ongoing policy efforts will allow Chinese growth to stabilize and there is scope for policy to induce re-acceleration over the coming six to twelve months. The bullish scenario holds that Chinese growth will rebound as policymakers make use of that capacity. Chart 7Add Leverage In Case Of Tariffs
Add Leverage In Case Of Tariffs
Add Leverage In Case Of Tariffs
Chinese imports are the key channel by which China impacts growth in the rest of the world. Increased Chinese aggregate demand will feed increased demand for materials and goods imports. China’s imports are Europe’s, Japan’s, emerging Asia’s, and the resource economies’ exports. If China bottoms and turns higher, we anticipate that its trading partners will as well with a lag of a few months. We side with the bulls and expect that it will, and we expect that the China-driven revival in the global economy, ex-U.S., will help spark a modest self-reinforcing acceleration cycle. As this virtuous circle begins to turn, the growth divergence between the U.S. (where the fiscal thrust from the stimulus package is nearly spent) and the rest of the world will narrow. We expect the dollar will peak once markets catch on to the shift, and that U.S. equities will shift from leader to laggard, in common-currency terms. Narrowing equity outperformance should help push the dollar lower at the margin, which in turn should help blunt Treasuries’ appeal to foreign investors, steering investment capital away from the U.S. Dollar softness, at the margin, should help contribute to S&P 500 earnings gains, reinforcing our bullish equity take in absolute terms. An exogenous shock could trip up the U.S. economy, but it’s hard to find clear-cut signs of internal weakness. Q: What data are you watching to tell you that your view may not come to pass? Much of our sanguine take turns on the idea that monetary policy settings have not yet turned restrictive. We cannot know in real time where the line of demarcation between reflationary and restrictive monetary policy lies, however, so we are on the lookout for data that might disprove our assessment that the fed funds rate is still comfortably in reflationary territory. Housing is the segment of the economy that is most sensitive to interest rates, and we would be concerned if it took a turn for the worse. For now, though, we’re encouraged by the homebuilder sentiment survey, which has retraced nearly all of its fourth-quarter losses (Chart 8), and suggests that the modest recovery in housing starts and new home sales will continue. Chart 8Homebuilders Are Feeling Pretty Chipper
Homebuilders Are Feeling Pretty Chipper
Homebuilders Are Feeling Pretty Chipper
Chart 9What Recession?
What Recession?
What Recession?
The inverted yield curve has gotten everyone’s attention, but one month of inversion is not enough to declare that a recession is on the way. It also appears that the inversion may have been inspired by investor risk aversion more than a sense that recession is nigh. Our Global Fixed Income Strategy service looked at the average position of several key data series at the onset of the last five recessions and found that conditions look a lot better than they did when those recessions were developing (Chart 9).2 The Leading Economic Index’s (LEI) recession forecasting record matches the yield curve’s. When it contracts on a year-over-year basis, recessions have reliably followed (Chart 10). The LEI is still expanding, but it has been steadily decelerating, and we are keeping a close eye on it. If it contracted while the yield curve was inverted, we would probably have to throw in the towel on our view that policy is still easy, and a recession is therefore still a ways off. Chart 10The LEI Is Not Yet Sounding The Recession Alarm
The LEI Is Not Yet Sounding The Recession Alarm
The LEI Is Not Yet Sounding The Recession Alarm
Doug Peta, CFA Chief U.S. Investment Strategist dougp@bcaresearch.com Footnotes 1 Please see the U.S. Bond Strategy Special Report titled, “The Golden Rule Of Bond Investing,” published July 24, 2018, available at usbs.bcaresearch.com. 2 Please see the Global Fixed Income Strategy Weekly Report titled, “The Risk Aversion Curve Inversion,” published June 4, 2019, available at gfis.bcaresearch.com.
Highlights Bad news is still looming in the trade war. Public opinion polling in the U.S. gives President Trump more leeway to push the envelope on tariffs and sanctions against China than the consensus recognizes. Trump’s tendency to push the envelope is forcing China into a corner in which structural concessions become too risky. Unrest in Hong Kong reveals the city-state’s political woes as well as the tail-risk of a geopolitical incident in Taiwan. Tariffs on Mexico are still possible. Close long MXN/BRL. Maintain tactical safe-haven plays. Feature Judging by the S&P 500, the Federal Reserve has cut interest rates and the G20 summit between Presidents Donald Trump and Xi Jinping has been a success (Chart 1). Chart 1Trade War? Who Cares!
Trade War? Who Cares!
Trade War? Who Cares!
The problem is that there is not yet a compelling, positive, political catalyst on the trade front. And the Fed has an incentive to wait until after the June 28-29 G20 to make its decision on any cut. At least in the case of the December 1 G20 summit in Buenos Aires there was significant diplomatic preparation ahead of time. That is not yet the case for the summit in Osaka, Japan. And even Buenos Aires ended up being a flop given the subsequent tariff escalation. We are maintaining our tactical safe-haven recommendations – long gold, Swiss bonds, and Japanese yen – until we see a clearer pathway for the risk-on phase to resume amid a summer loaded with fair-probability geopolitical risks: Trump’s aggressive foreign policy, the Democratic primary, China’s domestic policy, the U.S. immigration crisis, and Brexit. Beyond this near-term caution, we agree with BCA’s House View in remaining overweight equities on a cyclical basis (12 months). China’s economic stimulus is likely to pick up further this summer and it still has the capacity to deliver positive surprises. Preparing For The G20 Over the course of this year we have argued for a 50% chance and then 40% chance that the U.S. and China would conclude a trade deal by the G20 summit. However, Commerce Secretary Wilbur Ross and other administration officials, including Chief of Staff Mick Mulvaney, have recently indicated that the best case at the G20 is for the leaders to have dinner and agree to a new timetable that aims to close the negotiations in the coming months. The Trump-Xi summit itself remains unconfirmed as we go to press. This suggests that we were too optimistic about even a barebones trade deal at the G20. We are now extending our time frame to the November 2020 election -- the only deadline that really matters. Diagram 1 presents a cogent and conservative decision tree that results in a 41% chance of a major, Cold War-style escalation in tensions; a 27% chance of a minor escalation that is contained but without a final trade agreement; and a 28% chance of a tenuous or short-term deal. It gives only a 4% chance of a “grand compromise” that initiates a new phase of re-engagement between the two economies. These outcomes clearly represent a large downside risk given where equities are positioned today. Diagram 1Trade War Decision Tree (Updated June 13, 2019)
Another Phony G20? And A Word On Hong Kong
Another Phony G20? And A Word On Hong Kong
Why such gloom when the two sides may be on the brink of a new tariff ceasefire? First, delaying the talks beyond the G20 is disadvantageous for Trump and will make him angry sooner or later. The Trump administration, unlike its predecessors, has made a point of opposing China’s traditional playbook of drawing out negotiations. China benefits in talks over the long run because it gains economic and strategic leverage. This has been the case in every major round of dialogue since the 1980s and it is specifically the case today, as China gradually stimulates its way out of the slowdown that afflicted it at the time of the last G20 (Chart 2). Chart 2China's Bargaining Leverage To Improve On Stimulus
China's Bargaining Leverage To Improve On Stimulus
China's Bargaining Leverage To Improve On Stimulus
Trump would not have called a ceasefire on Dec. 1, 2018 if the stock market had held up amid Fed rate hikes and the Sept. 24 implementation of the 10% tariff on $200 billion. This year the U.S. equity market has bounced back and the Fed has paused, but China’s economy has not yet fully recovered. This gives Trump an advantage that may not last if the talks extend through the rest of the year. And this reasoning explains why Trump raised the tariff rate and blacklisted China’s tech companies in May – to try to clinch a deal by the end of June. He is also threatening to impose tariffs on the remaining $300 billion worth of imports if Xi snubs him in Osaka. If the G20 fails to produce progress, we would bet that Trump will proceed with a sweeping tariff on the remaining $300 billion worth of Chinese imports, whether immediately after the summit or at some later point when he decides that the Chinese are indeed playing for time. How can we be confident of this? After all, Trump’s approval rating has fallen since he escalated the trade war in May and it remains well beneath the average post-World War II presidents at this stage in their first terms, including President Obama’s rating in the summer of 2011 (Chart 3). Recent opinion polls suggest that voters are getting wise to the negative impact of tariffs on their pocketbooks. The financial and political constraints on Trump are not very pressing.
Chart 3
We are confident because the financial and political constraints on Trump are not very pressing, at least not at the moment. First, the stock market has risen despite the tariff hikes, so Trump is likely emboldened. Second, Trump is less constrained in the use of tariffs than in other areas. He is bogged down with a Democratic Congress, investigations, and scandals at home. He cannot pursue policy through legislation – he shifted to the threat of tariffs on Mexico because he could not build his border wall. By turbo-charging his trade policy and foreign policy – against China, Iran, Mexico, Russia, most recently Germany … basically everyone except North Korea – he creates the option of turning 2020 into a “foreign policy election” rather than an election about the economy or social policy. A strong economy has not enabled him to break through his ceiling in public opinion thus far and he will lose a social policy election easily (see health care). The risk of his aggressive foreign policy is that it triggers an international crisis. But that would likely benefit him in the polls, given the natural inclination to defend America against foreign enemies. See George W. Bush, 2004 (Chart 4). Third, popular opposition to Trump’s trade war is not clear-cut – voters are ambivalent. In the past we have shown that President Trump’s 2020 run still depends on his ability to increase voter turnout among whites, specifically white males, low-income whites, and whites without college degrees. Recent polls suggest that voters have turned against tariffs and the trade war – namely the Quinnipiac and Monmouth University polls released in late May after the latest tariff hike. But it is essential to dig beneath the surface. These polls reveal that the key voting groups look more favorably than the rest of the country upon Trump’s policies on both trade and China (Chart 5).
Chart 4
Chart 5
These voters’ assessment of Trump’s performance overall, across a range of policies, is not disapproving, despite all of the unorthodox and disruptive decisions that Trump has made in his presidency thus far (Chart 6).
Chart 6
American voters are neither as enthusiastic about free trade nor as appalled by protectionism as the headline polling suggests. For instance, take the Monmouth University poll, which asked very specific questions about trade, tariffs, and retaliation. If we combine the group of voters who are clearly protectionist with those who are “not sure” or think the answer “depends,” the results do not suggest that Trump is heavily constrained (Table 1). Table 1Americans Are Not As Pro-Free Trade As It Seems
Another Phony G20? And A Word On Hong Kong
Another Phony G20? And A Word On Hong Kong
In swing counties 51% of voters think that free trade is either a bad idea or are undecided. And even 57% percent of voters in counties that voted for Hillary Clinton by more than a 10% margin are in favor of tariffs or unsure. And a majority of voters in the most relevant categories – independents, moderates, non-college graduates, low-income earners – believe that Trump’s tariffs will bring manufacturing back, a highly relevant point for an election that will likely swing on the Rust Belt yet again. This includes Clinton’s most secure districts (Chart 7)!
Chart 7
The point is not that Trump lacks political constraints on the trade war – after all, these voters are on the borderline in many cases and concerned about all-out trade war with China. Rather, his aggressive trade tactics enable him to reconnect with and energize his voter base at a time when his other signature policies are tied down. This is critical because his reelection prospects, which we have pegged at 55%, are in great peril, at least judging by his lag in the head-to-head polling against the top Democrats in swing states. Bottom Line: Going forward, Trump has more room to push the envelope than investors realize. A failed G20 summit poses the risk of another selloff in global equities. We are maintaining our tactical safe-haven trades. What About Xi Jinping’s Constraints? Xi is president for life and must be attentive to long-term ramifications. Chart 8Xi Jinping's Immediate Constraint
Xi Jinping's Immediate Constraint
Xi Jinping's Immediate Constraint
If Trump is tempted to continue pushing the envelope, will President Xi back down? While not constrained by the stock market or elections, he does face the prospect of instability in the manufacturing sector and large-scale unemployment (Chart 8), which Beijing has not had to deal with for 20 years. The point is not to claim that laid-off Chinese workers will turn around and protest against their own country in the face of gunboat diplomacy by capitalist imperialists – on the 70th anniversary of the regime, no less. Rather, Xi is president for life and must be attentive to the long-term ramifications of a disruptive transition in the excessively large manufacturing sector. This would cause economic and, yes, ultimately socio-political problems for him down the road. If Trump continues to move toward his 2016 campaign pledge of a 45% tariff on all Chinese imports, as the 2020 election approaches, China’s leaders have far less incentive to put their careers (and lives) on the line to produce structural concessions. A tariff covering all Chinese goods is an absolutist position that China can only address by doubling down on its demand for full tariff rollback. Yet Trump needs to retain some tariffs to enforce the implementation of any agreement. Thus slapping tariffs on all Chinese imports is almost, but not quite, an irreversible step. This is captured in Diagram 1 via the 29% chance that tensions are contained even if a deal falls through. Tensions are even less likely to be contained if the Trump administration follows through on its threats against China’s tech sector. On August 19, the Commerce Department will decide whether to renew the license for U.S. companies to sell key components to Huawei and other blacklisted companies. If the administration denies the license – and moves further ahead with export controls on emerging and foundational technologies – then Beijing faces an outright technological blockade. It will retaliate against U.S. companies – a process already beginning1 – and will likely act on other threats such as a rare earths embargo. In this case strategic tensions will escalate dramatically, including saber-rattling in the air, in cyberspace, or on the high seas. At the moment political frictions in Hong Kong are exacerbating U.S.-China distrust. Bottom Line: Since President Xi’s constraints are longer-term, he has the ability to deny structural concessions to Trump. But Trump’s ability to push the trade war further and further risks forcing China to a point of no return. There is not a clear basis for the geopolitical risk affecting the global trade and growth outlook to fall. Hong Kong: A New Front In The U.S.-China Struggle The large-scale protests that have erupted in Hong Kong – first on April 28 and most recently on June 9 –are important for several reasons: they highlight the immense geopolitical pressure in East Asia emanating from China’s “New Era” under Xi Jinping; they are rapidly becoming entangled in U.S.-China tensions, particularly over technological acquisition; and they foreshadow the political instability on the horizon in Taiwan. Tensions have been rising between Hong Kong and mainland China since the Great Recession and the shock to capitalist financial centers around the world. The tensions are symptomatic of the dramatic change in China over the past decade; the decline of the post-Cold War status quo; and the broader decline of the western world order (e.g. the British Empire). After all, the West is lacking tools to preserve the rights and privileges that Hong Kong was supposed to be guaranteed when the transfer of sovereignty occurred in 1997. More immediately, the current protests are part of a process going back to 2012 in which the disaffected and marginalized parts of Hong Kong society began speaking up against the political establishment. This emerged because of high income inequality (Chart 9), shortcomings in quality of life, excessive property prices (Chart 10), and the mainland’s reassertion of Communist Party rule and encroachments on Hong Kong’s autonomy.
Chart 9
Chart 10Another Source Of Hong Kong's Unrest
Another Source Of Hong Kong's Unrest
Another Source Of Hong Kong's Unrest
A simple comparison with Singapore, the other major East Asian city-state, shows that Hong Kong has trailed in GDP per capita and wage gains, while property price inflation has soared ahead (Chart 11). These structural economic factors contributed to the emergence of the “Occupy Central” protests in 2014, which were smaller than today’s protests but signaled the abrupt shift in the political sphere toward disenchantment and activism. Chart 11Why Hong Kong Is Not As Quiet As Singapore
Why Hong Kong Is Not As Quiet As Singapore
Why Hong Kong Is Not As Quiet As Singapore
The 2016 elections for the Legislative Council (LegCo) resulted in a fiasco by which a number of pro-democracy activists, known as “localists,” were squeezed out of the legislature through a combination of juvenile mistakes and heavy-handed intervention by Beijing and the pro-mainland Hong Kong authorities (Chart 12 A&B). Beijing exploited the occasion to extend its legal writ over Hong Kong society and curb some of the city’s freedoms.2 The democratic opposition and dissidents have been sidelined or repressed — and now they face the prospect of being extradited, given that the LegCo is highly likely to pass the “Fugitive Offenders and Mutual Legal Assistance in Criminal Matters” bill that sparked the protests this year.
Chart 12
Chart 12
The exclusion of the localists from power runs the risk of radicalizing them and increasing disaffection, making mass protests likely to recur both in the near term and in future. Hong Kongers are losing confidence in the “One Country, Two Systems” arrangement (Chart 13). They are similarly becoming more disillusioned with mainland China, adding fuel to the fire over time (Chart 14). However, in the specific case of the city-state, there is no alternative to Beijing’s ultimate say – and the older generations will continue to support the political establishment.
Chart 13
Chart 14
Nevertheless Hong Kong’s discontents will become entangled in the broader Cold War emerging between the U.S. and China. Beijing is accusing the protesters of being lackeys of foreign powers. The U.S. Congress, on both sides of the aisle, is threatening to declare that Hong Kong is no longer sufficiently autonomous from Beijing and therefore no longer eligible for special privileges. Hong Kong faces rising political dependency on China and the potential for special relations with the United States to decline.
Chart 15
Part of Washington’s concern lies with Beijing’s aggressive technological acquisition program. Hong Kong has been able to import advanced dual-use technology products from the United States without Beijing’s restrictions. This is not apparent from the proportion of exports but it is important on the technological level (Chart 15). It introduces a backdoor for China to acquire these goods and has prompted a rethink in Washington. Hong Kong is also accused of facilitating the circumventing of sanctions on U.S. enemies. It thus faces rising political dependency on China and the potential for special relations with the United States to decline. These pressures also highlight why we view Taiwan as a potential “Black Swan.” Similar political fissures are emerging as Beijing expands its economic and military dominance over Taiwan. Of course, the political backlash against Beijing has recently been receding in Taiwanese opinion, due to the fact that the nominally pro-independence Democratic Progressive Party has lost most of the momentum it gained after the large-scale “Sunflower” student protests of 2014 (Chart 16). But there are still several reasons that the January 2020 election could become a geopolitical flashpoint: namely the developments in Hong Kong, China’s handling of them, Beijing’s tensions with Washington, and the Trump administration’s temptation to achieve some key goals with the Tsai Ing-wen administration before it leaves office (including arms sales). Even if the Taiwanese political winds shift to become less confrontational toward Beijing after January, the time between now and then is ripe for an “incident” of some kind. Beyond that, the pro-independence opposition will begin activating and marching against the next government if it proves obsequious to the mainland. Chart 16Taiwan: Pro-Mainland Forces Revive
Taiwan: Pro-Mainland Forces Revive
Taiwan: Pro-Mainland Forces Revive
Chart 17
Over the long run, Taiwan is far more autonomous than Hong Kong, harder for Beijing to control, and much more attractive for Beijing’s enemies to defend – namely the U.S. and Japan. Moreover, as the tech conflict with Washington heats up, Taiwan becomes vital for China’s technological self-sufficiency, putting it at higher risk (Chart 17). Beijing will also frown upon the role of Taiwanese companies like FoxConn for taking early steps to diversify the supply chain away from China. This regional strategic reality is not conducive to U.S.-China trade negotiations. And even aside from the U.S., Beijing’s growing power generates resistance from its periphery. This is true of Chinese ally North Korea, which is trying to broaden its options, as well as a historic enemy like Vietnam. Other countries at a bit more of a distance are trying to accommodate both Beijing and Washington, but are increasingly seeing their regimes vacillate based on their orientation toward China – this is true of Thailand in 2014, the Philippines in 2015, South Korea in 2017, and Malaysia in 2018. These changes inject economic policy uncertainty on the country level. Over the long run we see Southeast Asia as a beneficiary of the relocation of supply chains out of China. But at the moment, with the trade war escalating and unresolved and with China taking a heavier hand, we are only recommending holding relatively insulated countries like Thailand. Bottom Line: Our theme of U.S.-China conflict is intertwined with our theme of geopolitical risk rotation to East Asia. States that have domestic-oriented economies, limited exposure to China, or greater U.S. support – including Japan, Thailand, South Korea, Indonesia, and Malaysia – face less geopolitical risk than those heavily exposed to China (Taiwan) or that lack U.S. security guarantees (Hong Kong, Vietnam). Investment Recommendations In addition to our safe-haven tactical trades – long spot gold, long Swiss bonds, and long JPY-USD – we are maintaining our long recommendation for a basket of companies in the MVIS global rare earth and strategic metals index. The basket includes companies not based in mainland China that have seen their stock prices appreciate this year yet have a P/E ratio under 35 (Chart 18). Chart 18Go Long Rare Earth Firms Ex-China
Go Long Rare Earth Firms Ex-China
Go Long Rare Earth Firms Ex-China
We remain short the CNY-USD on the expectation that trade tensions will encourage Beijing to use depreciation as a countervailing tool, despite our expectation of increasing fiscal-and-credit stimulus. Over the long run, we would observe that trade escalation between the U.S. and China bodes poorly for China’s long-term productivity and efficiency. The basis for a reduction in trade tensions is a recommitment to the liberal structural reform agenda that Chinese state economists outlined at the beginning of Xi Jinping’s term in 2012-13. The current trajectory of “the New Long March,” in which Beijing pursues personalized power and uses stimulus to improve self-sufficiency and import-substitution, goes the opposite direction. It is not a pathway for innovation, openness, and technological progress. A simple comparison of China’s long-term equity total return highlights the market’s lack of enthusiasm about the current administration’s approach (Chart 19). The contexts were different, but the earlier outperformance grew from painful structural reforms and a grand compromise with the United States in the late 1990s and early 2000s. Chart 19The Market Wants Reforms And Trade Deal
The Market Wants Reforms And Trade Deal
The Market Wants Reforms And Trade Deal
We are closing our long MXN / short BRL trade for a gain of 4.6%. This trade has bounced back from the U.S.-Mexico deal to avert tariffs. The agreement was not entirely hollow compared to earlier agreements: it calls for Mexico to accelerate the deployment of the National Guard to stem the flow of refugees from Guatemala and central America and expand the Migrant Protection Protocols across the southern border. Trump’s reversal – under Senate pressure, entirely unlike the China dynamic – gave the peso a boost, benefiting our trade. However, one of the fundamental reasons for this trade – the improvement in Mexico’s relative current account balance – has now rolled over (Chart 20) and the tariff threat will reemerge if Mexico proves unable or unwilling to stem the inflow of asylum seekers into the United States (Chart 21). Chart 20Peso Has Outperformed The Real
Peso Has Outperformed The Real
Peso Has Outperformed The Real
Chart 21
As we go to press, the attacks on tankers in Oman highlight our view that oil prices will witness policy-induced volatility and a rising geopolitical risk premium as “fire and fury” shifts to the U.S. and Iran in the near-term. Our expectation of increasing Chinese stimulus helps underpin the constructive view on oil and energy-producing emerging markets. Matt Gertken, Vice President Geopolitical Strategist mattg@bcaresearch.com Footnotes 1 The American Chamber of Commerce in China and Shanghai released a survey on May 22, 2019 revealing that while 53% of companies have not yet experienced “non-tariff” retaliation by Chinese authorities, 47% had experienced it: 20.1% through increased inspections; 19.7% through slower customs clearance; 14.2% through slow license approvals; another 14.2% through bureaucratic and regulatory complications; and smaller numbers dealing with problems associated with American employees’ visas, increased difficulty closing investment deals, products rejected by customs, and rejections of licenses and applications. 2 We noted at the time, “Mainland forces will bring down the hammer on the pro-independence movement. The election of a new chief executive will appear to reinforce the status quo but in reality Beijing will tighten its legal, political, and security grip. Large protests are likely; political uncertainty will remain high.” See BCA Geopolitical Strategy, “Strategic Outlook 2017: We Are All Geopolitical Strategists Now,” December 14, 2016, available at www.bcaresearch.com.
Highlights The odds of a cyclical upturn in the global semiconductor sector over the next three to six months are low. Global semiconductor demand will continue to decline due to contracting demand for smartphones, automobiles, personal computers (PCs), and servers. Global semiconductor stocks are still facing considerable downside in absolute terms. We recommend going long Asian semiconductor stocks versus the U.S. S&P 500 semiconductor index. Dedicated EM equity portfolios should stay neutral on the Taiwanese bourse and Korean technology sector relative to the overall EM benchmark. Feature Chart 1 shows share prices of the global semiconductor sector and global semiconductor sales in the past two decades. Chart 1Global Semiconductor Market: Sales & Share Prices
Global Semiconductor Market: Sales & Share Prices
Global Semiconductor Market: Sales & Share Prices
Was last December’s trough in global semiconductor equity prices the ultimate bottom in this cycle? The odds are in favor of a continued contraction in global semiconductor sales and further downside in semiconductor share prices over the next three to six months. Cycle-On-Cycle Analysis Semiconductor sales experienced five recessions over the past 20 years. Table 1 illustrates the peak-to-bottom percentage decline in nominal global semiconductor sales and the magnitude of the drop in global semiconductor share prices in U.S. dollar terms during these five cyclical downturns in this industry. It also indicates the duration of each downturn and the number of months that semiconductor stocks led the bottom in global semiconductor sales. Table 1Key Statistics Of Five Cyclical Downturns In Global Semiconductor Market
The Global Semiconductor Sector: Is A Cyclical Upturn Imminent?
The Global Semiconductor Sector: Is A Cyclical Upturn Imminent?
The current shrinkage of semiconductor sales is worse than the 2011-12 and 2015 downturns. Yet, it is still smaller than the magnitude during the 2008 Great Financial Crisis and the 2001 tech bubble bust. The revenue of semiconductor companies has so far contracted by 24%, which is disproportionally more than the decline in share prices of these companies. The global semiconductor equity index is only 14% below its March 2018 high. It appears as though the market is expecting a quick recovery in semiconductor sales. As per Table 1, in the downturns of 2008, 2011 and 2015, global semiconductor stocks all bottomed before the bottom of global semiconductor sales. Only in the 2001 episode, stock prices bottomed eight months after the bottom in sales. In the current cyclical downturn, global semiconductor sales have so far had only four months of growth contraction,1 far less than the 13-16 months experienced in all the past four cycles. All in all, we would lean against the market’s expectation of an imminent recovery in the semiconductor cycle. The demand downturn will last another three to six months and share prices are facing major headwinds. Global Semiconductor Demand Semiconductor sales are in contraction across countries and regions (Chart 2). In April – before President Trump’s tweet on imposing new import tariff on China, global semiconductor sales growth sank to a negative 15% year-on-year. The short-term (three-to-six month) outlook for global semiconductor demand remains dismal. Chart 3 shows global semiconductor revenue breakdown in terms of end usage. Mobile phones account for the largest share (29%) of the market, followed by PCs (12%), miscellaneous consumer products (12%), and servers (11%). All of these major demand sources are under downward pressure: Smartphone Sales Global smartphone sales are shrinking (Chart 4). According to the International Data Corporation (IDC), global smartphone shipments declined 6.6% year-on-year in volume terms in the first quarter of this year, worse than last year’s 4.4% drop. Chart 2Semiconductor Sales Are In Contraction Across Countries
Semiconductor Sales Are In Contraction Across Countries
Semiconductor Sales Are In Contraction Across Countries
In the current cyclical downturn, global semiconductor sales have so far had only four months of growth contraction, far less than the 13-16 months experienced in all the past four cycles.
Chart 3
Chart 4Global Smartphone Sales: Contracting
Global Smartphone Sales: Contracting
Global Smartphone Sales: Contracting
We expect smartphone shipments to continue contracting in the second half of this year. Major markets such as mainland China and advanced economies have entered the saturation phase of mobile-phone demand. For example, U.S. shipments were down 15% year-on-year in the first quarter due to near-full market penetration. In China, smartphone sales have shown signs of stabilization (Chart 5). However, this is probably temporary and has been driven by the boom in Huawei smartphone sales in China since early this year. The incredible 50% year-on-year growth of Huawei smartphone sales in the first quarter is not sustainable. While global sales of Huawei smartphones increased by 20 million units, total global smartphone sales of all brands fell by 22 million units (Chart 6). The U.S. punitive actions towards China and Huawei have also instigated nationalism in China. This has triggered a Chinese buying-spree of the Huawei smartphone. Chart 5Chinese Smartphone Sales: Temporary Stabilization
Chinese Smartphone Sales: Temporary Stabilization
Chinese Smartphone Sales: Temporary Stabilization
Chart 6
Yet, this has probably reduced the number of potential Chinese smartphones buyers in the near future. After all, many buyers likely made the purchase earlier than otherwise planned in the absence of a trade war. Although Samsung, Huawei, OnePlus, Xiaomi, Motorola, LG, and ZTE have either released or will release their 5G phones this year, the sales growth from 5G phones will not be able to offset the loss in 2G, 3G and 4G phone sales, at least not in 2019. The IDC estimated that 5G phones would only account for about 0.5% of the market share this year. 5G will likely only begin affecting overall semiconductor demand next year, when they account for a larger share of smartphone sales. Huawei is the market leader in 5G technology. The U.S. boycott of Huawei will likely continue. This will only slow the pace of 5G phone adoption and the development of 5G networks worldwide. On balance, global smartphone demand may only recover next year. Server Demand Global server shipments also experienced a 5% contraction in volume terms in the first quarter of this year, according to IDC (Chart 7). The outlook for the rest of 2019 does not look promising. Global server demand will likely remain in contraction in the second half of this year. Many hyperscale data centers have already purchased considerable amounts of severs in advance of the trade war to avoid tariffs.2 Meanwhile, the escalation in the U.S.-China confrontation has increased economic uncertainties. This may delay potential datacenter investments. Decelerating 5G network development worldwide due to the U.S. ban on Huawei will also tend to discourage new datacenter and cloud services projects. This is because the 5G technology enables datacenter and cloud services to experience a huge improvement in terms of data transfer speeds, latency, connectivity, capacity, reliability and mobility. Chart 7Global Server Shipment: Are In Contraction
Global Server Shipment: Are In Contraction
Global Server Shipment: Are In Contraction
Personal Computers (PC) PCs sales are also in contraction (Chart 8). PC demand has entered into the deep-maturation phase while facing strong competition from tablets and laptops. Auto Sales Global auto sales also sank by 5% in April from a year ago, registering the worst contraction since 2009 (Chart 9). Chart 8Global PCs Sales: Deeply Saturated
Global PCs Sales: Deeply Saturated
Global PCs Sales: Deeply Saturated
Chart 9Global Auto Sales Are In Contraction As Well
Global Auto Sales Are In Contraction As Well
Global Auto Sales Are In Contraction As Well
Regarding auto demand, the Chinese government may continue to implement more supportive policies to stimulate car sales in China. However, we believe the recovery will be delayed. The government has already implemented a number of policies to lift domestic car sales since late January, including providing subsidies to encourage new energy vehicle sales, to promote auto sales in rural areas, and to increase auto replacement. The central government recently loosened auto sales restrictions in the first tier cities of Guangzhou and Shenzhen that have restrictive auto sales policies. However, all of these policies have failed to lift Chinese domestic car sales out of deep contraction. The key reason has been a diminishing willingness to spend among Chinese consumers, as suggested by falling households’ marginal propensity to consume (Chart 10). Bottom Line: Global semiconductor demand growth will likely remain weak and will fail to recover in the second half of this year. The basis is that its major upstream markets (smartphone, servers, PCs and automobiles) are all facing cyclically declining demand. Chart 10Chinese Consumers: Diminishing Willingness To Consume
Chinese Consumers: Diminishing Willingness To Consume
Chinese Consumers: Diminishing Willingness To Consume
Inventories And Prices Chart 11 shows the semiconductor supply chain illustrating the process of manufacturing semiconductors starting with silicon wafers and up to final electronic products.
Chart 11
Box 1 explains the role of key segments and players along the supply chain. Box 1 A Brief Explanation Of The Key Segments/Players Of The Supply Chain Both integrated device manufacturers (IDM) and foundries are at the center of the supply chain, responsible for chip manufacturing. In terms of semiconductor sales revenue, Samsung, Intel and SK Hynix are the world’s top three IDM companies and TSMC, Global Foundries and United Microelectronics Corp (UMC) are the world’s top three foundries. While IDMs cover most of the process from IC design, chip fabrication, assembly, testing and packaging, IDM companies still have to purchase raw materials and equipment for the chip-making process. Foundry companies receive orders from IC designing companies like Qualcomm, Nvidia, and Huawei HiSilicon, then purchase needed raw materials and equipment to proceed in the chip-manufacturing process. Both IDMs and foundries can either outsource the tasks of semiconductor assembly and testing or perform them on their own. The final semiconductor products will be used in electronics products, such as smartphones, computers, home appliances, automobiles, etc. Global semiconductor demand growth will likely remain weak and will fail to recover in the second half of this year. The basis is that its major upstream markets (smartphone, servers, PCs and automobiles) are all facing cyclically declining demand. In a typical business cycle, a cyclical downturn begins with a slump in demand for final electronic products (upstream demand). This leads to falling semiconductor sales. As a result, inventory buildup will occur across most of the segments along the semiconductor supply chain. Chipmakers: Producers’ semiconductor inventory in both Taiwan and Korea have reached either a record high or a near-record high (Chart 12). The installed wafer capacities at these two countries are the world’s largest, together accounting for 43% of total global wafer capacity. In addition, the inventory of some major electronic parts and components have also increased considerably in Taiwan (Chart 13). This also implies weaker demand for semiconductor raw materials. Chart 12Chipmakers: A Rapid Buildup In Inventory
Chipmakers: A Rapid Buildup In Inventory
Chipmakers: A Rapid Buildup In Inventory
Chart 13Rising Inventory Of Some Major Electronic Parts And Components
Rising Inventory Of Some Major Electronic Parts And Components
Rising Inventory Of Some Major Electronic Parts And Components
Raw material suppliers: Silicon wafer is the indispensable raw material required in the chip manufacturing process. Japanese companies account for over half of global silicon wafer supply.Chart 14 shows that silicon wafer inventory in Japan has had a significant buildup in volume terms since late last year. Importantly, it is not declining yet. Chart 14Silicon Wafer Inventory: A Significant Buildup As Well
Silicon Wafer Inventory: A Significant Buildup As Well
Silicon Wafer Inventory: A Significant Buildup As Well
Outsourced semiconductor assembly and test (OSAT) providers: Both Singapore and Thailand are OSAT providers while they also manufacture, assemble and export electronic products. Both countries are closer to the downstream side of the semiconductor supply chain. Semiconductor inventory at these two countries has also jumped to a record high (Chart 15). Chart 15Singapore and Thailand: Record High Semiconductor inventory
Singapore and Thailand: Record High Semiconductor inventory
Singapore and Thailand: Record High Semiconductor inventory
Importantly, a marginal improvement in demand will tend to support spot prices. For example, in the memory chip market, falling prices denote weak demand relative to excess supply. When prices of DRAM and NAND start to form a bottom or decisively move up, this may indicate the arrival of a cyclical upturn. So far, both DRAM and NAND prices are continuing to fall (Chart 16). In addition, the prices of silicon wafer – the most important raw material used in the chip-making process – have declined in the first half of this year.3 Chart 16Still Falling Memory Chip Prices
Still Falling Memory Chip Prices
Still Falling Memory Chip Prices
Chart 17Deflating DRAM Prices Suggest Downside Risks To Korean Tech Stocks
Deflating DRAM Prices Suggest Downside Risks To Korean Tech Stocks
Deflating DRAM Prices Suggest Downside Risks To Korean Tech Stocks
In short, prices are the most important variable to monitor. Chart 17 exhibits the high correlation between DRAM prices and the Korean technology sector stock prices. Falling DRAM prices suggest downside risks to technology stocks in Korea. Samsung accounts for about 65% of Korea’s tech index and 27% of the overall Korean equity index. Memory chips accounted for 68% of Samsung’s operating profits in the first quarter of this year. Bottom Line: There has been involuntary inventory accumulation along the entire supply chain of semiconductors. This and ongoing price deflation among various types of semiconductors foreshadow a downbeat near-term outlook. The Interpretation Of Some Positive Developments There have been some positive developments in the past several months. Taiwanese PMI new orders diffusion index in the electronics sector jumped out of deep contraction to reach zero, and Chinese semiconductor imports halted their decline in both volume and value terms (Chart 18). The improvement in the aforementioned data was probably mainly due to large semiconductor purchases by China to hedge the rising risk of U.S. blocking China’s technological development (Chart 19). Chart 18Some Positive Development
Some Positive Development
Some Positive Development
Chart 19China: More Semiconductors Purchases Before The Tariff And U.S. Huawei Ban?
China: More Semiconductors Purchases Before The Tariff And U.S. Huawei Ban?
China: More Semiconductors Purchases Before The Tariff And U.S. Huawei Ban?
Besides, Huawei smartphone sales have been booming, which we deliberated on page 5, could have been responsible for the improvement in these data. This one-off surge will likely dwindle going forward. Investment Conclusions We remain negative on Asian semiconductor share prices in absolute terms. A continued contraction in global semiconductor sales will further squeeze their profits. In relative terms, we are neutral on the Asian semiconductor sector: we continue recommending market-weight allocation to Taiwan’s overall market and the Korean technology sector within the EM equity benchmark. As a new trade, we recommend going long Asian semiconductor stocks and short the S&P 500 semiconductor index over the next three to six months (Chart 20). The Bloomberg Asia Pacific semiconductor index has nine stocks. Samsung and TSMC account for 42% and 38% of the index, respectively. There has been involuntary inventory accumulation along the entire supply chain of semiconductors. This and ongoing price deflation among various types of semiconductors foreshadow the downbeat near-term outlook. Samsung will likely benefit from the U.S. ban on Huawei in the smartphone sector outside of China. In addition, Samsung will win some market share from Apple as the latter does not have a 5G phone to release this year. These positive factors may partially offset the negative impact from falling memory prices and demand on Samsung. The S&P 500 semiconductor index has 13 stocks. Intel, Broadcom, Texas Instruments and Qualcomm are the top five constituents, together accounting for nearly 70% of the index. Most of these companies are IC designing companies, which will likely suffer as Chinese demand for their products shrink due to the U.S. administration's ban on Huawei. This position will also benefit from U.S. dollar appreciation. A firm dollar will hurt profits of U.S. semiconductor stocks. In turn, currency depreciation in Korea and Taiwan will on the margin benefit Asian semiconductor stocks. Chart 20Recommend Long Asia Pacific Semiconductor Stock Vs. S&P 500 Semiconductor Index
Recommend Long Asia Pacific Semiconductor Stock Vs. S&P 500 Semiconductor Index
Recommend Long Asia Pacific Semiconductor Stock Vs. S&P 500 Semiconductor Index
Chart 21The 2015 Experience
The 2015 Experience
The 2015 Experience
Chart 21 shows that global foundry companies outperformed global IC designing companies during the final phase of the 2015 cyclical downturn. Odds are that these dynamics will play out in this downturn as well. Finally, the relative performance of Asian semiconductor stocks versus U.S. ones is oversold and might stage some sort of mean reversion (Chart 20). Ellen JingYuan He, Associate Vice President ellenj@bcaresearch.com Footnotes 1 Please note that here the calculation for “the number of months of the growth contraction” is different from the one for the “peak-to-bottom duration” in Table 1. “The number of months of the growth contraction” equals the number of months when semiconductor sales year-on-year growth is negative. 2 https://marketrealist.com/2019/05/nvidias-data-center-revenue-inference-rendering-and-edge/ 3 http://www.sohu.com/a/300386061_132567, http://news.moore.ren/industry/104958.htm Equity Recommendations Fixed-Income, Credit And Currency Recommendations