China
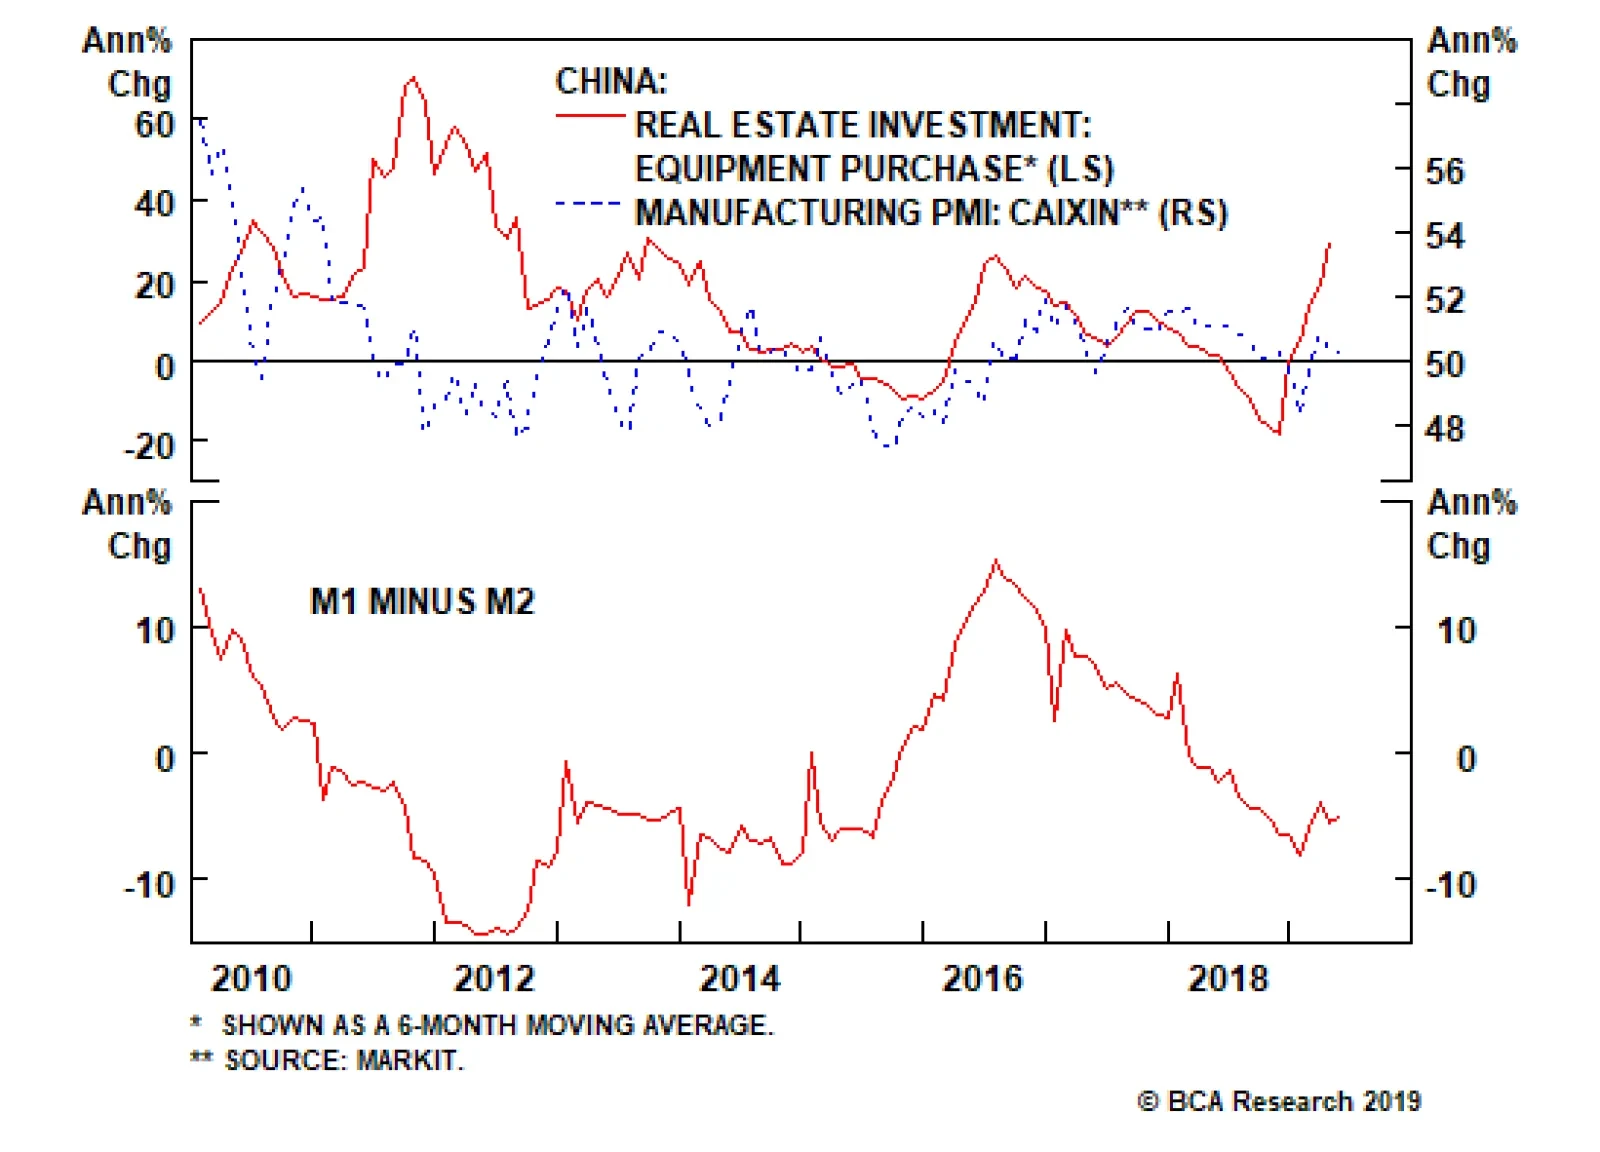
Chinese total social financing numbers for May increased to CNY1400 billion from CNY1360 billion. New loans rose to CNY1180 from CNY 1020 billion. M2 money supply was stable at 8.5% abut M1 increased to 3.4% from 2.9%. While these numbers are inconsistent…
Yes, banks can create deposits “out of thin air,” as Arthur says. However, people must be willing to hold those deposits. The amount of deposits that households and businesses wish to hold reflects many things, including the interest rate paid on deposits and…
It is simple: When people use the word “savings,” they typically and intuitively refer to bank deposits or securities investments; but this is incorrect. Money supply/deposits in the banking system have no relationship with the savings rate of a nation in…

Dear Client, Credit in China has expanded at an exponential pace, with the country’s debt-to-GDP ratio climbing from 143% to more than 250% over the last decade. The speed and scale of China’s debt surge dwarfs Japan and the U.S.’ respective credit binges in the 1980’s and 2000’s, each of which ultimately led to financial market meltdowns. Why should China’s experience be any different? Given that China has pursued a different economic model whereby the banking sector is largely state-sponsored and the currency is tightly managed by the central bank, the answer to this pressing question for global markets is the subject of spirited debate at BCA and within the investment community at large. Clients are already aware that my colleagues, Peter Berezin and Arthur Budaghyan, disagree on the macro and market ramifications of China’s decade-long credit boom. The aim of this report is to provide visibility on the root sources of the view divergence, not to reconcile the gaps. We hope these insights will help shape your own conviction about this important topic. Caroline Miller Global Strategy Feature Caroline: Arthur, your cautious outlook towards emerging markets in general and China’s prospects in particular stems from your belief that China’s economy is dangerously addicted to credit as a growth driver. Please explain why you dismiss the more sanguine view that China’s elevated debt burden is a function of an equally unusually high household savings rate. Arthur: It is simple: When people use the word “savings,” they typically and intuitively refer to bank deposits or securities investments; but this is incorrect. Chart 1 (Arthur)No Empirical Evidence That Deposits = 'Savings'
No Empirical Evidence That Deposits = 'Savings'
No Empirical Evidence That Deposits = 'Savings'
Money supply/deposits in the banking system have no relationship with the savings rate of a nation in general or households in particular (Chart 1). When households save, they do not change the amount of money supply and deposits. Hence, households’ decision to save neither alters liquidity in the banking system nor helps banks to originate loans. In fact, banks do not intermediate deposits into loans or savings into credit.1 The terms “savings” in economics does not denote an increase in the stock of money and deposits. The term “savings” in economics means the amount of goods and services produced but not consumed. When an economy produces a steel bar, it is registered as national “savings.” We cannot consume (say, eat or expense) a steel bar. Therefore, once a steel bar or any equipment is produced, economic statistics will count it as “savings.” Besides, the sole utilization of a steel bar is in capital goods and construction, and hence, it cannot be consumed. Once a steel bar is produced, both national savings and investment will rise. That is how the “savings” = “investment” identity is derived. Chart 2 (Arthur)Chinese Households Are More Leveraged Than U.S. Ones
Chinese Households Are More Leveraged Than U.S. Ones
Chinese Households Are More Leveraged Than U.S. Ones
It would avoid confusion and help everyone if economists were to call it “excess production” not “excess savings.” Banks do not need “excess production” – i.e., national “savings” – to create loans. Critically, the enormous amount of bank deposits in China is not due to household “savings” but is originated by banks “out of thin air.” In fact, Chinese households are now more leveraged than U.S. ones (Chart 2).
Chart 3
The surge of credit and money supply in China during the past 10 years has been due to animal spirits running wild among lenders and borrowers on the mainland, not its households’ “savings.” In short, the root of China’s credit bubble is not any different from Japan’s (in the 1980s), or the U.S.’ (in the 2000s) and so on. Peter: Yes, banks can create deposits “out of thin air,” as Arthur says. However, people must be willing to hold those deposits. The amount of deposits that households and businesses wish to hold reflects many things, including the interest rate paid on deposits and the overall wealth of the society. The interest rate is a function of savings. The more people save, the lower interest rates will be. And the lower interest rates are, the more demand for credit there will be (Chart 3). It’s like asking what determines how many apples are consumed. Is it how many apple trees farmers want to plant or how many apples people want to eat? The answer is both. Prices adjust so that supply equals demand. How about national wealth? To a large extent, wealth represents the accumulation of tangible capital – factories, plant and machinery, homes and office buildings: the sort of stuff that banks can use as collateral for lending. And what determines how much tangible capital a country possesses? The answer is past savings, of the exact sort Arthur is referring to: the excess of production over consumption. So this form of “economic” savings also plays an important indirect role in determining the level of bank deposits. Chart 4 (Peter)China: From Exporting Savings To Investing Domestically And Building Up Debt
China: From Exporting Savings To Investing Domestically And Building Up Debt
China: From Exporting Savings To Investing Domestically And Building Up Debt
I think the main problem with Arthur’s argument is that he is observing an accounting identity, which is that total bank assets (mostly loans) must equal liabilities (mostly deposits and capital) in equilibrium, without fully appreciating the economic forces – savings being one of them – that produce this equilibrium. In any case, the whole question of whether deposits create savings or savings create deposits misses the point. China’s fundamental problem is that it does not consume enough of what it produces. In the days when China had a massive current account surplus, it could export its excess savings abroad (Chart 4). It can’t do that anymore, so the government has consciously chosen to spur investment spending in order to prop up employment. Since a lot of investment spending is financed through credit, debt levels have risen. It really is just that simple. Arthur: First, neither the stock nor the flow of credit and deposits has any relevance to (1) the economic term “savings;” (2) a country’s capital stock; or (3) national wealth, contrary to what Peter claims. China’s broad money supply (M2) now stands at 190 trillion yuan, equivalent to US$28 trillion (Chart 5, top panel). It is equal to the size of broad money supply in the U.S. and the euro area combined (US$14 trillion each). Yet, China’s nominal GDP is only two-thirds the size of the U.S. Does the level of China’s wealth and capital stock justify it having broad money supply (US$28 trillion) equivalent to the U.S. and the euro area combined? Chart 5 (Arthur)“Helicopter” Money In China
“Helicopter” Money In China
“Helicopter” Money In China
Second, are Chinese households and companies willing to hold all RMB deposits that banks have created “out of thin air”? The answer: not really. Without capital controls, a notable portion of these deposits would have rushed into the foreign exchange markets and caused currency depreciation. Another sign of growing reluctance to hold the yuan is that households have been swapping their RMB deposits for real assets (property) at astronomical valuations. There is a bubble in China but people are looking for reasons to justify why it is different this time. Caroline: OK, let’s get away from the term “savings,” and agree that China continues to generate a chronic surplus of production of goods and services relative to consumption, and that how China chooses to intermediate that surplus is the most market-relevant issue. Arthur, you have used the terms “money bubble” and “helicopter money” in relation to China. This implies that banks are unconstrained in their ability to make loans. Just because savings don’t equal deposits, and banks can create deposits when they make loans doesn’t mean there is no relationship between the flow of credit and the stock of deposits. Arthur: Money supply and deposits expand only when banks originate a loan or buy an asset from a non-bank. In short, both credit and money/deposits are created by commercial banks “out of thin air.” This is true for any country.2 Consider a loan transaction by a German commercial bank. When it grants a €100 loan to a borrower, two accounting entries occur on its balance sheet. On the assets side, the amount of loans, and therefore total assets, increases by €100. Simultaneously, on the liabilities side, this accounting entry creates €100 of new deposits “out of thin air” (Figure 1). Hence, new purchasing power of €100 has been created via a simple accounting entry, which otherwise would not exist.
Chart
Critically, no one needed to save for this loan and money to be originated. The bank does not transfer someone else’s deposits to the borrower; it creates a new deposit when it lends. Banks also create deposits/money “out of thin air” when they buy securities from non-banks. In China, fiscal stimulus is largely financed by commercial banks – banks purchase more than 80% of government-issued bonds. This also leads to money creation. In short, when banks originate too much credit – as they have in China – they generate a money bubble. The money bubble is the mirror image of a credit bubble. Chinese banks have created 141 trillion yuan (US$21 trillion) of new money since 2009, compared with $8.25 trillion created in the U.S., euro area, and Japan combined over the same period (Chart 5, bottom panel). This is why I refer to it as “helicopter” money. Caroline: If banks need capital and liquidity to make loans, and deposits are one potential source of funds, don't these capital and liquidity constraints drive banks’ willingness and ability to lend, creating a link between the two variables? Arthur: Let me explain how mainland banks were able to circumvent those regulatory lending constraints. In 2009, they expanded their credit assets by about 30%. Even though a non-trivial portion of those loans were not paid back, banks did not recognize NPLs and instead booked large profits. By retaining a portion of those earnings, they boosted their equity, say, by 20%. As a result, the next year they were able to expand their credit assets by another 20% and so on. If banks lend and do not recognize bad loans, they can increase their equity and continue lending. With respect to liquidity, deposits are not liquidity for banks; excess reserves at the central bank are true liquidity for them. The reason why banks need to attract deposits is not to appropriate the deposits themselves, but to gain access to the excess reserves that come with them. When a person shifts her deposit from Bank A to Bank B, the former transfers a similar amount of excess reserves (liquidity) to the latter. When expanding their credit assets aggressively, banks can: (1) create more loans per one unit of excess reserves/liquidity, i.e., expand the money multiplier; and (2) borrow excess reserves/liquidity from the central bank or other banks. Chinese banks have used both channels to expand their balance sheets over the past 10 years (Chart 6). Chart 6 (Arthur)Broad Money Can Expand Without Growing Banks' Excess Reserves At The Central Bank
Broad Money Can Expand Without Growing Banks' Excess Reserves At The Central Bank
Broad Money Can Expand Without Growing Banks' Excess Reserves At The Central Bank
Crucially, commercial banks create deposits, but they cannot create excess reserves (liquidity).3 The latter are issued only by central banks “out of thin air.” So, neither deposits nor excess reserves have any relevance to household or national “savings.” Caroline: Peter, Arthur argues that Chinese credit policy has been unconstrained by the traditional metrics of capital adequacy that prevail in capitalist, free-market economies. In other words, there is no connection between the availability of funds to lend via deposits in the banking system, and the pace of credit creation. Rather, the central bank has controlled the terms and volume of lending via regulation and fiat reserve provisioning. You’ve argued that credit creation has served the greater good of propping up employment via investment spending. Moreover, you posit that countries with a surplus of production over consumption will invariably experience high levels of credit creation. Our colleague, Martin Barnes, has analyzed national savings rates (as a proxy for over-production) relative to debt-GDP ratios in other countries. The relationship doesn’t look that strong elsewhere (Chart 7). Please elaborate on why you see credit growth as an inevitable policy response to the dearth of aggregate demand we observe in China?
Chart 7
Peter: I would not say that countries with a surplus of production over consumption will invariably experience high levels of credit creation. For example, if most business investment is financed through retained earnings, you can have a lot of investment with little new debt. Debt can also result from activities not directly linked to the intermediation of savings. For instance, if you take out a mortgage to buy some land, your consumption and savings need not change, even though debt will be created. I think Arthur and I agree on this point. Thus, I am not saying that debt is always and everywhere the result of savings. I am simply pushing back against Arthur’s extremist position that debt never has anything to do with savings. Caroline: So what determines the level of debt in an economy in your view, Peter? Peter: In general, debt levels will rise if there are large imbalances between income and spending within society and/or if there are significant differences in the mix of assets people wish to hold. Think about the U.S. in the pre-financial crisis period. First, there was a surge in income inequality beginning in the early 1980s. For all intents and purposes, rich households with excess savings ended up lending their surplus income to poor households struggling to pay their bills. Overall savings did not rise, but debt levels still increased. That’s one reason why Martin’s chart doesn’t show a strong correlation between the aggregate savings rate and debt-to-GDP. Sometimes you need to look beneath the aggregate numbers to see the savings intermediation taking place. Unlike in the U.S., even poor Chinese households are net savers (Chart 8). Thus, the aggregate savings rate in China is very high4 (Chart 9). Much of these savings are funnelled to finance investment in the corporate and public sectors. This fuels debt growth.
Chart 8
Chart 9 (Peter)Chinese Households Have More Savings Than The U.S., Europe And Japan Combined
Chinese Household Savings Are More Than The U.S., Europe And Japan Combined
Chinese Household Savings Are More Than The U.S., Europe And Japan Combined
The second thing that happened in the U.S. starting in 2000 was a massive housing boom. If you bought a second home with credit, you ended up with one more asset (the house) but one more liability (the mortgage). The person who sold you the home ended up losing one asset (the house) but gaining another asset (a bigger bank deposit). The net result was both higher debt and higher bank deposits. Lending to finance asset purchases has also been a big source of debt growth in China, as it was in the U.S. before the crisis. The U.S. mortgage boom ended in tears, and so the question that we should be asking is whether the Chinese debt boom will end the same way. Arthur: We agreed not to use the term “savings,” yet Peter again refers to “savings” being funnelled into credit. As I explained above, banks do not funnel “savings” (i.e., “excess production”) into credit. China, Japan, and Germany have high “savings” rates because they produce a lot of steel, chemicals, autos, and machinery that literally cannot be consumed and, thus, are recorded as “savings.” The U.S. produces too many services that are consumed/expensed and, hence, not recorded as “savings.” That is why the U.S. has a lower “savings” rate. Chart 10 (Arthur)The Myth Of Deficient Demand In China
The Myth Of Deficient Demand In China
The Myth Of Deficient Demand In China
Economic textbook discussions on “savings” and “investment” are relevant for a barter economy where banks do not exist. When this framework is applied to modern economies with banks, it generates a lot of confusion.5 Caroline: OK, so Peter argues that an imbalance between spending and income CAN be a marker for high debt levels. Arthur, please explain why you see no relationship between China’s chronic shortfall in demand and authorities’ explicit decision to support growth via credit creation. Arthur: First, China does not have deficient demand – consumer spending and capital expenditures have been growing at 10% and 9.4%, respectively, in real terms annually compounded for the past 10 years (Chart 10). The mainland economy has been suffering from excess production, not a lack of demand. China has invested a lot (Chart 11) and ended up with too much capacity to produce steel, cement, chemicals and other materials as well as machinery and industrial goods. So, China has an excess production of goods relative to firms’ and households’ underlying demand. In a market economy, these producers would become non-profitable, halt their investments, and shut down some capacity. Chart 11 (Arthur)China Has Been Over-Investing On An Unprecedented Scale
China Has Been Over-Investing On An Unprecedented Scale
China Has Been Over-Investing On An Unprecedented Scale
In China, to keep the producers of these unwanted goods operating, the government has allowed and encouraged banks to originate loans creating new purchasing power literally “out of thin air” to purchase these goods. This has created a credit/money bubble. In a socialist system, banks do not ask debtors to repay loans and government officials are heavily involved in resource and capital allocation. China’s credit system and a growing chunk of its economy have been operating like a typical socialist system. Socialism leads to lower productivity growth for well-known reasons. With labor force growth set to turn negative, productivity is going to be the sole source of China’s potential growth rate. If the nation continues expanding this money/credit bubble to prop up zombie enterprises, its potential growth rate will fall considerably. As the potential growth rate drops, recurring stimulus will create nominal but not real growth. In short, the outcome will be stagflation. Caroline: The theoretical macro frameworks that you have both outlined make for interesting thought experiments, and spirited intellectual debate. However, investors are most concerned about the sustainability of China’s explosive credit growth, implications for the country’s growth rate, and the return on invested capital. Arthur, given your perspective on how Chinese credit policy has been designed and implemented, please outline the contours of how and when you see the music stopping, and the debt mountain crumbling. Arthur: Not every credit bubble will burst like the U.S. one did in 2008. For example, in the case of the Japanese credit bubble, there was no acute crisis. The bubble deflated gradually for about 20 years. In the cases of the U.S. (2008), Japan (1990), the euro area (2008-2014), Spain (2008-2014) and every other credit bubble, a common adjustment was a contraction in bank loans in nominal terms (Chart 12). Chart 12 (Arthur)All Credit Booms Have Been Followed By Contracting Bank Loans (I)
All Credit Booms Have Been Followed By Contracting Bank Loans
All Credit Booms Have Been Followed By Contracting Bank Loans
Chart 12 (Arthur)All Credit Booms Have Been Followed By Contracting Bank Loans (II)
All Credit Booms Have Been Followed By Contracting Bank Loans
All Credit Booms Have Been Followed By Contracting Bank Loans
Why do banks stop lending? The reason is that banks’ shareholders absorb the largest losses from credit booms. Given that banks are levered at least 20-to-1 at the peak of a typical credit boom, every $1 of non-performing loans leads to a $20 drop in their equity value. Bank shareholders halt the flow of credit to protect their wealth. Chart 13 (Arthur)China: Deleveraging Has Not Yet Begun
China: Deleveraging Has Not Yet Begun
China: Deleveraging Has Not Yet Begun
Chart 14
In fact, credit in China is still growing at a double-digit rate, above nominal GDP growth (Chart 13). Hence, aggregate deleveraging in China has not yet begun. If banks do not curtail credit origination, the music will not stop. However, uninterrupted credit growth happens only in a socialist system where banks subsidize the economy at the expense of their shareholders. But even then, there is no free lunch. Credit origination by banks also expands the money supply as discussed above. An expanding money bubble will heighten devaluation pressure on the yuan in the long run. The enormous amount of money supply/deposits – the money bubble – in China is like “the sword of Damocles” hanging over the nation’s currency. Chinese households and businesses are becoming reluctant to hold this ballooning supply of local currency. Continuous “helicopter” money will only increase their desire to diversify their RMB deposits into foreign currencies and assets. Yet, there is an insufficient supply of foreign currency to accommodate this conversion. The nation’s current account surplus has almost vanished while the central bank carries US$3 trillion in foreign exchange reserve representing only 11% of the yuan deposits and cash in circulation (Chart 14). It is inconceivable that China can open its capital account in the foreseeable future. “Helicopter” money also discourages innovation and breeds capital misallocation, which reduces productivity growth. A combination of slowing productivity growth, and thus potential GDP, and strong money growth ultimately lead to stagflation – the dynamics endemic to socialist systems. Peter: Arthur’s answer implicitly assumes that private investment would increase if the government removed credit/fiscal stimulus. But where is the evidence for that? We had just established that the Chinese economy suffers from a lack of aggregate demand. Public-sector spending, to the extent that it increases employment and incomes, crowds in private-sector investment rather than crowding it out. Ask yourself what would have happened if China didn’t build that “bridge to nowhere.” Would those displaced construction workers have found more productive work elsewhere or would they have remained idle? The answer is almost certainly the latter. After all, the reason the Chinese government built the bridge in the first place was to increase employment in an economy that habitually struggles to consume enough of what is produces. Arthur talks about the “misallocation” of resources. But doesn’t an unemployed worker also represent a misallocation of resources? In my view, it certainly does – and one that is much more threatening to social stability than an underutilized bridge or road. If you understand the point above, you will also understand why Arthur’s comparison between Chinese banks and say, U.S. banks is misplaced. The Chinese government is the main shareholder in Chinese banks. The government cares more about social stability than anything else. There is no way it would let credit growth plunge. Moreover, as the main shareholder, the government has a strong incentive to raise the share price of Chinese banks. After all, it is difficult to have a reserve currency that rivals the U.S. dollar, as China aspires to have, if your largest banks trade like penny stocks. My guess is that the Chinese government will shut down a few small banks to “show” that it is concerned about moral hazard, but then turn around and allow the larger banks to sell their troubled loans to state-owned asset management companies on very favourable terms (similar to what happened in the early 2000s). Once investors get wind that this is about to happen, Chinese bank shares will rally like crazy. Caroline: Isn’t shuffling debt from one sector of the economy to another akin to a shell game? Wouldn’t rampant debt growth eventually cause investors to lose confidence in the currency? Peter: China has a problem with the composition of its debt, not with its total value. Debt is a problem when the borrower can’t or won’t repay the loan. Chart 15 (Peter)China Is On Course To Lose More Than 400 Million Workers
China On Course To Lose More Than 400 Million Workers
China On Course To Lose More Than 400 Million Workers
I completely agree that there is too much shadow bank lending in China. There is also too much borrowing by state-owned enterprises. Ideally, the Chinese government would move all this quasi-public spending onto its own balance sheet. It would significantly raise social spending to discourage precautionary household savings. It would also adopt generous pro-natal policies — free childcare, education, government paid parental leave, and the like. The fact that the Chinese working-age population is set to shrink by 400 million by the end of the century is a huge problem (Chart 15). If the central government borrowed and spent more, state-owned companies and local governments would not have to borrow or spend as much. Banks could then increase their holding of high-quality central government bonds. Debt sustainability is only a problem if the interest rate the government faces exceeds the growth rate of the economy.6 That is manifestly not the case in China (Chart 16). And why are interest rates so low in relation to growth? Because Chinese households save so much! We simply can’t ignore the role of savings in the discussion. Chart 16 (Peter)China: High Levels Of Household Savings Have Kept Interest Rates Below The Growth Rate Of The Economy
China: High Levels Of Household Savings Have Kept Interest Rates Below The Growth Rate Of The Economy
China: High Levels Of Household Savings Have Kept Interest Rates Below The Growth Rate Of The Economy
As far as the currency is concerned, if debt growth rose so much that the economy overheated and inflation soared, then yes, the yuan would plunge. But that’s not what we are talking about here. We are talking about bringing debt growth to a level that generates just enough demand to achieve something resembling full employment. No one is calling for raising debt growth beyond that point. Curbing debt growth in a demand-deficient economy, as Arthur seems to be recommending, would cause unemployment to rise. Investors would then bet that the Chinese government would try to boost net exports by engineering a currency devaluation. Capital outflows would intensify. Far from creating the conditions for a weaker yuan, fiscal/credit stimulus obviates the need for a currency depreciation. Caroline: Peter, even if we accept your argument that the counterfactual of curbing credit growth in a demand-deficient economy would be a more deflationary outcome than sustaining the government-sponsored credit growth engine, how is building bridges to nowhere a positive sum for investors? Even if this strategy maintains social stability in the interests of the CCP’s regime preservation, won’t investors eventually recoil at the retreat to socialism that Arthur outlines, reducing the appeal of holding the yuan, even if, as you both seem to agree, no apocalyptic debt crisis is at hand? In other words, isn’t two times nothing still nothing? Peter: First of all, many of these infrastructure projects may turn out to be quite useful down the road, pardon the pun. Per capita vehicle ownership in China is only one one-fifth of what it is in the United States, and one-fourth of what it is in Japan (Chart 17). A sparsely used expressway today may be a clogged one tomorrow. Chart 17 (Peter)The Automobile Ownership Rate Is Still Quite Low In China
The Automobile Ownership Rate Is Still Quite Low In China
The Automobile Ownership Rate Is Still Quite Low In China
Would China really be better off if it had fewer infrastructure projects and more big screen TVs? An economy where people are always buying stuff they don’t need, with money they don’t have, to impress people they don’t like, is hardly a recipe for success. I am not sure what these references to socialism are supposed to accomplish. You want to see a real retreat to socialism? Try creating millions of unemployed workers with no jobs and no hope. All sorts of pundits decried Franklin Roosevelt’s New Deal as creeping socialism. The truth is that the New Deal took the wind out of the sails of the fledgling U.S. communist movement at the time. Arthur: I believe that Peter is confusing the structural and cyclical needs for stimulus. When an economy is in a recession – banks are shrinking their balance sheets and property prices are deflating – the authorities must undertake fiscal and credit stimulus. Chart 18 (Arthur)What Will Productivity Growth Look Like If Public Officials Allocate 55%-60% Of GDP?
What Will Productivity Growth Look Like If Public Officials Allocate 55%-60% Of GDP?
What Will Productivity Growth Look Like If Public Officials Allocate 55%-60% Of GDP?
Credit and fiscal stimulus made sense in China in early 2009 when growth plunged. However, over the past 10 years, we have witnessed credit and property market booms of gigantic proportions. Does this economy warrant continuous stimulus? What will productivity growth look like if government bureaucrats continuously allocate 55-60% of GDP each year (Chart 18)? Caroline: Arthur and Peter, you can both argue with one another about the semantic economic definition of the term ‘savings’, the implications of chronic excess production (relative to consumption), and the root drivers of credit growth in China long past the expiry of every BCA client’s investment horizon. Clients benefit from understanding your distinct perspectives only to the extent that they inform your outlook for markets. Will each of you now please outline how you see high levels of credit in China’s economy impacting the following over a cyclical (6-12 month) and structural (3-5 year) horizon: Global growth Commodity prices China-geared financial assets Peter: Regardless of what one thinks about the root causes of China’s high debt levels, it seems certain to me that the Chinese are going to pick up the pace of credit/fiscal stimulus over the next six months in response to slowing growth and trade war uncertainties. If anything, the incentive to open the credit spigots this time around is greater than in the past because the Chinese government wants to have a fast-growing economy to gain leverage over trade negotiations with the U.S. Chart 19 (Peter)Stronger Chinese Credit Growth Bodes Well For Commodity Prices
Stronger Chinese Credit Growth Bodes Well For Commodity Prices
Stronger Chinese Credit Growth Bodes Well For Commodity Prices
Chart 20 (Peter)The Dollar Is A Countercyclical Currency
The Dollar Is A Countercyclical Currency
The Dollar Is A Countercyclical Currency
Stronger Chinese growth will boost growth in the rest of the world. Commodity prices will rise (Chart 19). As a counter-cyclical currency, the U.S. dollar will likely peak over the next month or so and then weaken in the back half of 2019 and into 2020 (Chart 20). The combination of stronger Chinese growth, higher commodity prices, and a weaker dollar will be manna from heaven for emerging markets. If a trade truce between China and the U.S. is reached, investors should move quickly to overweight EM equities. European stocks should also benefit. Looking further out, China’s economy will slow in absolute terms. In relative terms, however, Chinese growth will remain near the top of the global rankings. China has one of the most educated workforces in the world (Chart 21). Assuming that output-per-hour reaches South Korean levels by the middle of the century, Chinese real GDP would need to expand by about 6% per year over the next decade (Chart 22). That’s a lot of growth – growth that will eventually help China outgrow its debt burden.
Chart 21
Chart 22 (Peter)China Has More Catching Up To Do
China Has More Catching Up To Do
China Has More Catching Up To Do
Keep in mind that credit growth of 1% when the debt-to-GDP ratio is 300% yields 3% of GDP in credit stimulus, compared with only 1% of stimulus when the debt-to-GDP ratio is 100%. That does not mean that more debt is intrinsically a good thing, but it does mean that China will eventually be able to slow debt growth even if excess savings remains a problem. Structurally, Chinese and EM equities will likely outperform their developed market peers over a 3-to-5 year horizon. The P/E ratio for EM stocks is currently 4.7 percentage points below that of developed markets, which is below its long-term average (Chart 23). While EM EPS growth has lagged DM earnings growth over the past eight years, the long-term trend still favors EM (Chart 24). EM currencies will appreciate over this period, with the RMB leading the way. Chart 23 (Peter)EM Stocks: Valuations Are Attractive
EM Stocks: Valuations Are Attractive
EM Stocks: Valuations Are Attractive
Chart 24 (Peter)Earnings Growth In EM Has Outpaced That Of DM Over The Long Haul
Earnings Growth In EM Has Outpaced That Of DM Over The Long Haul
Earnings Growth In EM Has Outpaced That Of DM Over The Long Haul
Arthur: China is facing a historic choice between two scenarios. Medium- and long-term macro outcomes will impact markets differently in each case. Table 1 shows my cyclical and structural investment recommendations for each scenario. Table 1 (Arthur)Arthur’s Recommended Investment Strategy For China-Geared Financial Assets
China’s Credit Cycle: A Spirited Debate
China’s Credit Cycle: A Spirited Debate
Allowing Markets to Play A Bigger Role = Lower credit growth (deleveraging), corporate restructuring, and weaker growth (Chart 25). This is bearish for growth and financial markets in the medium term but it will make Chinese stocks and the currency structural (long-term) buys. Credit/Money Boom Persists (Socialist Put) = Secular Stagnation, Inflation and Currency Depreciation: The structural outlook is downbeat but there are mini-cycles that investors could play (Chart 26). Cyclically, China-geared financial assets still remain at risk. However, lower asset prices and more stimulus in China could put a floor under asset prices later this year. Timing these mini-cycles is critical. A buy-and-hold strategy for Chinese assets will not be appropriate in this scenario. In short, capitalism is bad but socialism is worse. I hope China will pursue the first path.
Chart 25
Chart 26
Caroline: Thank you both for clarifying your perspectives. Over a multi-year horizon, markets will render the ultimate judgement on whether China’s credit boom has represented a reckless misallocation of capital, or a rational policy response to an imbalance between domestic spending and income. In the meantime, we will monitor the complexion of Chinese stimulus and evidence of its global growth multiplier effect over the coming weeks and months. These will be the key variables to watch as we determine when and at what level to upgrade BCA’s cyclical outlook for China-geared assets. Can’t wait for that debate. Footnotes 1 For a detailed discussion of these issues, please see Emerging Markets Strategy Special Reports, “Misconceptions About China's Credit Excesses,” dated October 26, 2016 and “The True Meaning Of China's Great 'Savings' Wall,” dated December 20, 2017. 2 For a detailed discussion of these issues, please see Emerging Markets Strategy Special Reports, “Misconceptions About China's Credit Excesses,” dated October 26, 2016 and “The True Meaning Of China's Great 'Savings' Wall,” dated December 20, 2017. 3 For a detailed discussion of these issues, please see Emerging Markets Strategy Special Report, “China's Money Creation Redux And The RMB,” dated November 23, 2016. 4 For a discussion on the reasons behind China’s high savings rate, please see Global Investment Strategy Weekly Report, “China’s Savings Problem,” dated January 25, 2019. 5 For a detailed discussion of these issues, please see Emerging Markets Strategy Special Report, “Is Investment Constrained By Savings? Tales Of China And Brazil,” dated March 22, 2018. 6 For a detailed discussion of these issues, please see Global Investment Strategy Weekly Report, “Is There Really Too Much Government Debt In The World?” dated February 22, 2019 and “Chinese Debt: A Contrarian View,” dated April 19, 2019.
Dear Client, Credit in China has expanded at an exponential pace, with the country’s debt-to-GDP ratio climbing from 143% to more than 250% over the last decade. The speed and scale of China’s debt surge dwarfs Japan and the U.S.’ respective credit binges in the 1980’s and 2000’s, each of which ultimately led to financial market meltdowns. Why should China’s experience be any different? Given that China has pursued a different economic model whereby the banking sector is largely state-sponsored and the currency is tightly managed by the central bank, the answer to this pressing question for global markets is the subject of spirited debate at BCA and within the investment community at large. Clients are already aware that my colleagues, Peter Berezin and Arthur Budaghyan, disagree on the macro and market ramifications of China’s decade-long credit boom. The aim of this report is to provide visibility on the root sources of the view divergence, not to reconcile the gaps. We hope these insights will help shape your own conviction about this important topic. Caroline Miller Global Strategy Feature Caroline: Arthur, your cautious outlook towards emerging markets in general and China’s prospects in particular stems from your belief that China’s economy is dangerously addicted to credit as a growth driver. Please explain why you dismiss the more sanguine view that China’s elevated debt burden is a function of an equally unusually high household savings rate. Arthur: It is simple: When people use the word “savings,” they typically and intuitively refer to bank deposits or securities investments; but this is incorrect. Chart 1 (Arthur)No Empirical Evidence That Deposits = 'Savings'
No Empirical Evidence That Deposits = 'Savings'
No Empirical Evidence That Deposits = 'Savings'
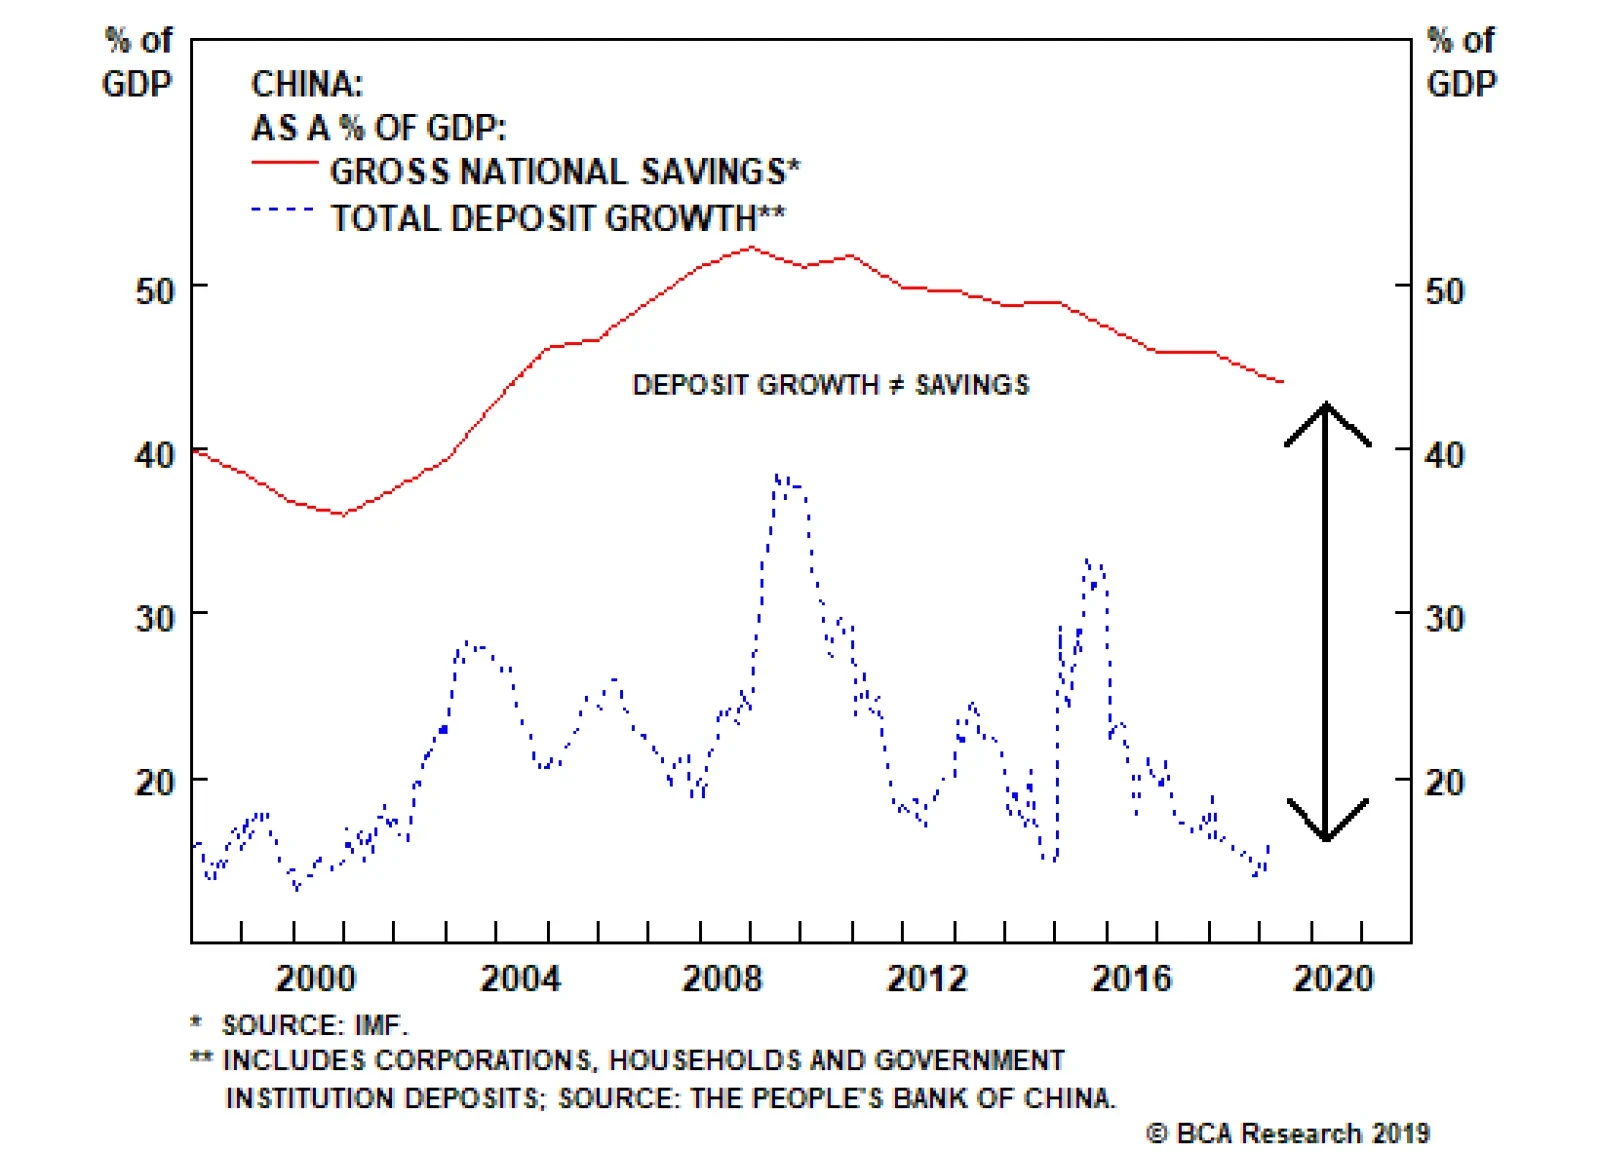
Money supply/deposits in the banking system have no relationship with the savings rate of a nation in general or households in particular (Chart 1). When households save, they do not change the amount of money supply and deposits. Hence, households’ decision to save neither alters liquidity in the banking system nor helps banks to originate loans. In fact, banks do not intermediate deposits into loans or savings into credit.1 The terms “savings” in economics does not denote an increase in the stock of money and deposits. The term “savings” in economics means the amount of goods and services produced but not consumed. When an economy produces a steel bar, it is registered as national “savings.” We cannot consume (say, eat or expense) a steel bar. Therefore, once a steel bar or any equipment is produced, economic statistics will count it as “savings.” Besides, the sole utilization of a steel bar is in capital goods and construction, and hence, it cannot be consumed. Once a steel bar is produced, both national savings and investment will rise. That is how the “savings” = “investment” identity is derived. Chart 2 (Arthur)Chinese Households Are More Leveraged Than U.S. Ones
Chinese Households Are More Leveraged Than U.S. Ones
Chinese Households Are More Leveraged Than U.S. Ones
It would avoid confusion and help everyone if economists were to call it “excess production” not “excess savings.” Banks do not need “excess production” – i.e., national “savings” – to create loans. Critically, the enormous amount of bank deposits in China is not due to household “savings” but is originated by banks “out of thin air.” In fact, Chinese households are now more leveraged than U.S. ones (Chart 2).
Chart 3
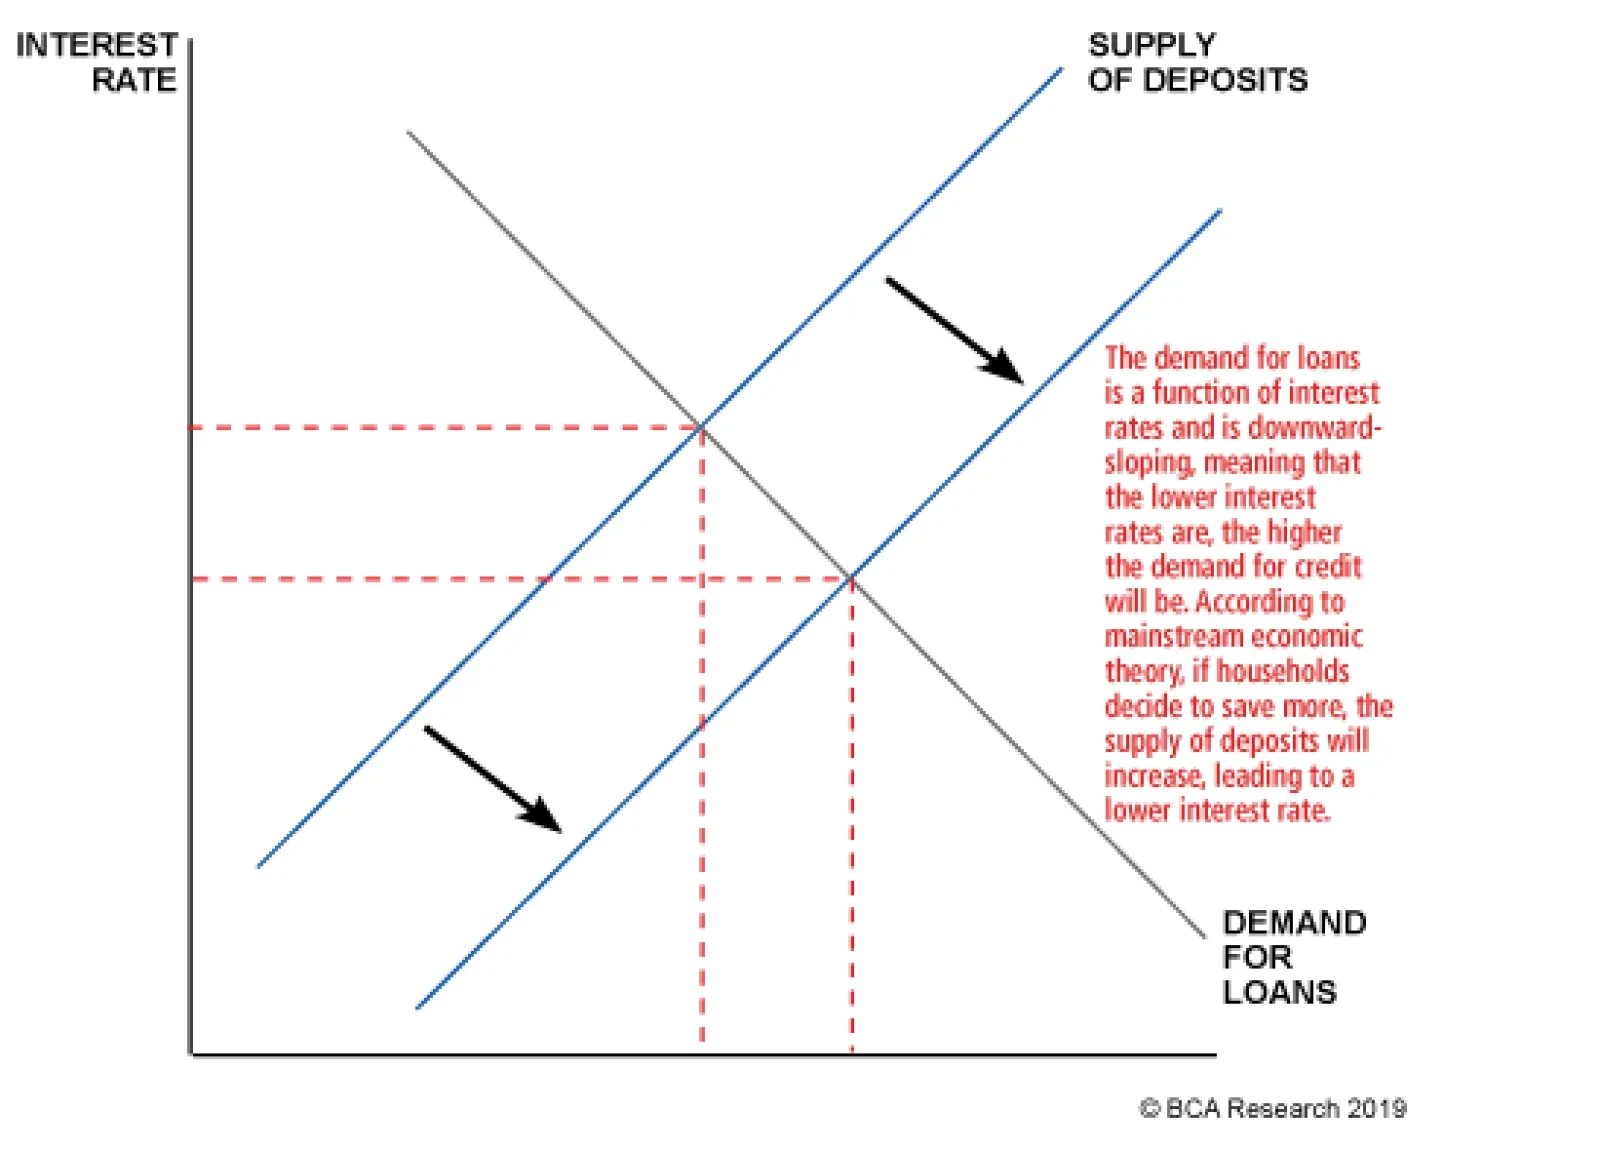
The surge of credit and money supply in China during the past 10 years has been due to animal spirits running wild among lenders and borrowers on the mainland, not its households’ “savings.” In short, the root of China’s credit bubble is not any different from Japan’s (in the 1980s), or the U.S.’ (in the 2000s) and so on. Peter: Yes, banks can create deposits “out of thin air,” as Arthur says. However, people must be willing to hold those deposits. The amount of deposits that households and businesses wish to hold reflects many things, including the interest rate paid on deposits and the overall wealth of the society. The interest rate is a function of savings. The more people save, the lower interest rates will be. And the lower interest rates are, the more demand for credit there will be (Chart 3). It’s like asking what determines how many apples are consumed. Is it how many apple trees farmers want to plant or how many apples people want to eat? The answer is both. Prices adjust so that supply equals demand. How about national wealth? To a large extent, wealth represents the accumulation of tangible capital – factories, plant and machinery, homes and office buildings: the sort of stuff that banks can use as collateral for lending. And what determines how much tangible capital a country possesses? The answer is past savings, of the exact sort Arthur is referring to: the excess of production over consumption. So this form of “economic” savings also plays an important indirect role in determining the level of bank deposits. Chart 4 (Peter)China: From Exporting Savings To Investing Domestically And Building Up Debt
China: From Exporting Savings To Investing Domestically And Building Up Debt
China: From Exporting Savings To Investing Domestically And Building Up Debt
I think the main problem with Arthur’s argument is that he is observing an accounting identity, which is that total bank assets (mostly loans) must equal liabilities (mostly deposits and capital) in equilibrium, without fully appreciating the economic forces – savings being one of them – that produce this equilibrium. In any case, the whole question of whether deposits create savings or savings create deposits misses the point. China’s fundamental problem is that it does not consume enough of what it produces. In the days when China had a massive current account surplus, it could export its excess savings abroad (Chart 4). It can’t do that anymore, so the government has consciously chosen to spur investment spending in order to prop up employment. Since a lot of investment spending is financed through credit, debt levels have risen. It really is just that simple. Arthur: First, neither the stock nor the flow of credit and deposits has any relevance to (1) the economic term “savings;” (2) a country’s capital stock; or (3) national wealth, contrary to what Peter claims. China’s broad money supply (M2) now stands at 190 trillion yuan, equivalent to US$28 trillion (Chart 5, top panel). It is equal to the size of broad money supply in the U.S. and the euro area combined (US$14 trillion each). Yet, China’s nominal GDP is only two-thirds the size of the U.S. Does the level of China’s wealth and capital stock justify it having broad money supply (US$28 trillion) equivalent to the U.S. and the euro area combined? Chart 5 (Arthur)“Helicopter” Money In China
“Helicopter” Money In China
“Helicopter” Money In China
Second, are Chinese households and companies willing to hold all RMB deposits that banks have created “out of thin air”? The answer: not really. Without capital controls, a notable portion of these deposits would have rushed into the foreign exchange markets and caused currency depreciation. Another sign of growing reluctance to hold the yuan is that households have been swapping their RMB deposits for real assets (property) at astronomical valuations. There is a bubble in China but people are looking for reasons to justify why it is different this time. Caroline: OK, let’s get away from the term “savings,” and agree that China continues to generate a chronic surplus of production of goods and services relative to consumption, and that how China chooses to intermediate that surplus is the most market-relevant issue. Arthur, you have used the terms “money bubble” and “helicopter money” in relation to China. This implies that banks are unconstrained in their ability to make loans. Just because savings don’t equal deposits, and banks can create deposits when they make loans doesn’t mean there is no relationship between the flow of credit and the stock of deposits. Arthur: Money supply and deposits expand only when banks originate a loan or buy an asset from a non-bank. In short, both credit and money/deposits are created by commercial banks “out of thin air.” This is true for any country.2 Consider a loan transaction by a German commercial bank. When it grants a €100 loan to a borrower, two accounting entries occur on its balance sheet. On the assets side, the amount of loans, and therefore total assets, increases by €100. Simultaneously, on the liabilities side, this accounting entry creates €100 of new deposits “out of thin air” (Figure 1). Hence, new purchasing power of €100 has been created via a simple accounting entry, which otherwise would not exist.
Chart
Critically, no one needed to save for this loan and money to be originated. The bank does not transfer someone else’s deposits to the borrower; it creates a new deposit when it lends. Banks also create deposits/money “out of thin air” when they buy securities from non-banks. In China, fiscal stimulus is largely financed by commercial banks – banks purchase more than 80% of government-issued bonds. This also leads to money creation. In short, when banks originate too much credit – as they have in China – they generate a money bubble. The money bubble is the mirror image of a credit bubble. Chinese banks have created 141 trillion yuan (US$21 trillion) of new money since 2009, compared with $8.25 trillion created in the U.S., euro area, and Japan combined over the same period (Chart 5, bottom panel). This is why I refer to it as “helicopter” money. Caroline: If banks need capital and liquidity to make loans, and deposits are one potential source of funds, don't these capital and liquidity constraints drive banks’ willingness and ability to lend, creating a link between the two variables? Arthur: Let me explain how mainland banks were able to circumvent those regulatory lending constraints. In 2009, they expanded their credit assets by about 30%. Even though a non-trivial portion of those loans were not paid back, banks did not recognize NPLs and instead booked large profits. By retaining a portion of those earnings, they boosted their equity, say, by 20%. As a result, the next year they were able to expand their credit assets by another 20% and so on. If banks lend and do not recognize bad loans, they can increase their equity and continue lending. With respect to liquidity, deposits are not liquidity for banks; excess reserves at the central bank are true liquidity for them. The reason why banks need to attract deposits is not to appropriate the deposits themselves, but to gain access to the excess reserves that come with them. When a person shifts her deposit from Bank A to Bank B, the former transfers a similar amount of excess reserves (liquidity) to the latter. When expanding their credit assets aggressively, banks can: (1) create more loans per one unit of excess reserves/liquidity, i.e., expand the money multiplier; and (2) borrow excess reserves/liquidity from the central bank or other banks. Chinese banks have used both channels to expand their balance sheets over the past 10 years (Chart 6). Chart 6 (Arthur)Broad Money Can Expand Without Growing Banks' Excess Reserves At The Central Bank
Broad Money Can Expand Without Growing Banks' Excess Reserves At The Central Bank
Broad Money Can Expand Without Growing Banks' Excess Reserves At The Central Bank
Crucially, commercial banks create deposits, but they cannot create excess reserves (liquidity).3 The latter are issued only by central banks “out of thin air.” So, neither deposits nor excess reserves have any relevance to household or national “savings.” Caroline: Peter, Arthur argues that Chinese credit policy has been unconstrained by the traditional metrics of capital adequacy that prevail in capitalist, free-market economies. In other words, there is no connection between the availability of funds to lend via deposits in the banking system, and the pace of credit creation. Rather, the central bank has controlled the terms and volume of lending via regulation and fiat reserve provisioning. You’ve argued that credit creation has served the greater good of propping up employment via investment spending. Moreover, you posit that countries with a surplus of production over consumption will invariably experience high levels of credit creation. Our colleague, Martin Barnes, has analyzed national savings rates (as a proxy for over-production) relative to debt-GDP ratios in other countries. The relationship doesn’t look that strong elsewhere (Chart 7). Please elaborate on why you see credit growth as an inevitable policy response to the dearth of aggregate demand we observe in China?
Chart 7
Peter: I would not say that countries with a surplus of production over consumption will invariably experience high levels of credit creation. For example, if most business investment is financed through retained earnings, you can have a lot of investment with little new debt. Debt can also result from activities not directly linked to the intermediation of savings. For instance, if you take out a mortgage to buy some land, your consumption and savings need not change, even though debt will be created. I think Arthur and I agree on this point. Thus, I am not saying that debt is always and everywhere the result of savings. I am simply pushing back against Arthur’s extremist position that debt never has anything to do with savings. Caroline: So what determines the level of debt in an economy in your view, Peter? Peter: In general, debt levels will rise if there are large imbalances between income and spending within society and/or if there are significant differences in the mix of assets people wish to hold. Think about the U.S. in the pre-financial crisis period. First, there was a surge in income inequality beginning in the early 1980s. For all intents and purposes, rich households with excess savings ended up lending their surplus income to poor households struggling to pay their bills. Overall savings did not rise, but debt levels still increased. That’s one reason why Martin’s chart doesn’t show a strong correlation between the aggregate savings rate and debt-to-GDP. Sometimes you need to look beneath the aggregate numbers to see the savings intermediation taking place. Unlike in the U.S., even poor Chinese households are net savers (Chart 8). Thus, the aggregate savings rate in China is very high4 (Chart 9). Much of these savings are funnelled to finance investment in the corporate and public sectors. This fuels debt growth.
Chart 8
Chart 9 (Peter)Chinese Households Have More Savings Than The U.S., Europe And Japan Combined
Chinese Household Savings Are More Than The U.S., Europe And Japan Combined
Chinese Household Savings Are More Than The U.S., Europe And Japan Combined
The second thing that happened in the U.S. starting in 2000 was a massive housing boom. If you bought a second home with credit, you ended up with one more asset (the house) but one more liability (the mortgage). The person who sold you the home ended up losing one asset (the house) but gaining another asset (a bigger bank deposit). The net result was both higher debt and higher bank deposits. Lending to finance asset purchases has also been a big source of debt growth in China, as it was in the U.S. before the crisis. The U.S. mortgage boom ended in tears, and so the question that we should be asking is whether the Chinese debt boom will end the same way. Arthur: We agreed not to use the term “savings,” yet Peter again refers to “savings” being funnelled into credit. As I explained above, banks do not funnel “savings” (i.e., “excess production”) into credit. China, Japan, and Germany have high “savings” rates because they produce a lot of steel, chemicals, autos, and machinery that literally cannot be consumed and, thus, are recorded as “savings.” The U.S. produces too many services that are consumed/expensed and, hence, not recorded as “savings.” That is why the U.S. has a lower “savings” rate. Chart 10 (Arthur)The Myth Of Deficient Demand In China
The Myth Of Deficient Demand In China
The Myth Of Deficient Demand In China
Economic textbook discussions on “savings” and “investment” are relevant for a barter economy where banks do not exist. When this framework is applied to modern economies with banks, it generates a lot of confusion.5 Caroline: OK, so Peter argues that an imbalance between spending and income CAN be a marker for high debt levels. Arthur, please explain why you see no relationship between China’s chronic shortfall in demand and authorities’ explicit decision to support growth via credit creation. Arthur: First, China does not have deficient demand – consumer spending and capital expenditures have been growing at 10% and 9.4%, respectively, in real terms annually compounded for the past 10 years (Chart 10). The mainland economy has been suffering from excess production, not a lack of demand. China has invested a lot (Chart 11) and ended up with too much capacity to produce steel, cement, chemicals and other materials as well as machinery and industrial goods. So, China has an excess production of goods relative to firms’ and households’ underlying demand. In a market economy, these producers would become non-profitable, halt their investments, and shut down some capacity. Chart 11 (Arthur)China Has Been Over-Investing On An Unprecedented Scale
China Has Been Over-Investing On An Unprecedented Scale
China Has Been Over-Investing On An Unprecedented Scale
In China, to keep the producers of these unwanted goods operating, the government has allowed and encouraged banks to originate loans creating new purchasing power literally “out of thin air” to purchase these goods. This has created a credit/money bubble. In a socialist system, banks do not ask debtors to repay loans and government officials are heavily involved in resource and capital allocation. China’s credit system and a growing chunk of its economy have been operating like a typical socialist system. Socialism leads to lower productivity growth for well-known reasons. With labor force growth set to turn negative, productivity is going to be the sole source of China’s potential growth rate. If the nation continues expanding this money/credit bubble to prop up zombie enterprises, its potential growth rate will fall considerably. As the potential growth rate drops, recurring stimulus will create nominal but not real growth. In short, the outcome will be stagflation. Caroline: The theoretical macro frameworks that you have both outlined make for interesting thought experiments, and spirited intellectual debate. However, investors are most concerned about the sustainability of China’s explosive credit growth, implications for the country’s growth rate, and the return on invested capital. Arthur, given your perspective on how Chinese credit policy has been designed and implemented, please outline the contours of how and when you see the music stopping, and the debt mountain crumbling. Arthur: Not every credit bubble will burst like the U.S. one did in 2008. For example, in the case of the Japanese credit bubble, there was no acute crisis. The bubble deflated gradually for about 20 years. In the cases of the U.S. (2008), Japan (1990), the euro area (2008-2014), Spain (2008-2014) and every other credit bubble, a common adjustment was a contraction in bank loans in nominal terms (Chart 12). Chart 12 (Arthur)All Credit Booms Have Been Followed By Contracting Bank Loans (I)
All Credit Booms Have Been Followed By Contracting Bank Loans
All Credit Booms Have Been Followed By Contracting Bank Loans
Chart 12 (Arthur)All Credit Booms Have Been Followed By Contracting Bank Loans (II)
All Credit Booms Have Been Followed By Contracting Bank Loans
All Credit Booms Have Been Followed By Contracting Bank Loans
Why do banks stop lending? The reason is that banks’ shareholders absorb the largest losses from credit booms. Given that banks are levered at least 20-to-1 at the peak of a typical credit boom, every $1 of non-performing loans leads to a $20 drop in their equity value. Bank shareholders halt the flow of credit to protect their wealth. Chart 13 (Arthur)China: Deleveraging Has Not Yet Begun
China: Deleveraging Has Not Yet Begun
China: Deleveraging Has Not Yet Begun
Chart 14
In fact, credit in China is still growing at a double-digit rate, above nominal GDP growth (Chart 13). Hence, aggregate deleveraging in China has not yet begun. If banks do not curtail credit origination, the music will not stop. However, uninterrupted credit growth happens only in a socialist system where banks subsidize the economy at the expense of their shareholders. But even then, there is no free lunch. Credit origination by banks also expands the money supply as discussed above. An expanding money bubble will heighten devaluation pressure on the yuan in the long run. The enormous amount of money supply/deposits – the money bubble – in China is like “the sword of Damocles” hanging over the nation’s currency. Chinese households and businesses are becoming reluctant to hold this ballooning supply of local currency. Continuous “helicopter” money will only increase their desire to diversify their RMB deposits into foreign currencies and assets. Yet, there is an insufficient supply of foreign currency to accommodate this conversion. The nation’s current account surplus has almost vanished while the central bank carries US$3 trillion in foreign exchange reserve representing only 11% of the yuan deposits and cash in circulation (Chart 14). It is inconceivable that China can open its capital account in the foreseeable future. “Helicopter” money also discourages innovation and breeds capital misallocation, which reduces productivity growth. A combination of slowing productivity growth, and thus potential GDP, and strong money growth ultimately lead to stagflation – the dynamics endemic to socialist systems. Peter: Arthur’s answer implicitly assumes that private investment would increase if the government removed credit/fiscal stimulus. But where is the evidence for that? We had just established that the Chinese economy suffers from a lack of aggregate demand. Public-sector spending, to the extent that it increases employment and incomes, crowds in private-sector investment rather than crowding it out. Ask yourself what would have happened if China didn’t build that “bridge to nowhere.” Would those displaced construction workers have found more productive work elsewhere or would they have remained idle? The answer is almost certainly the latter. After all, the reason the Chinese government built the bridge in the first place was to increase employment in an economy that habitually struggles to consume enough of what is produces. Arthur talks about the “misallocation” of resources. But doesn’t an unemployed worker also represent a misallocation of resources? In my view, it certainly does – and one that is much more threatening to social stability than an underutilized bridge or road. If you understand the point above, you will also understand why Arthur’s comparison between Chinese banks and say, U.S. banks is misplaced. The Chinese government is the main shareholder in Chinese banks. The government cares more about social stability than anything else. There is no way it would let credit growth plunge. Moreover, as the main shareholder, the government has a strong incentive to raise the share price of Chinese banks. After all, it is difficult to have a reserve currency that rivals the U.S. dollar, as China aspires to have, if your largest banks trade like penny stocks. My guess is that the Chinese government will shut down a few small banks to “show” that it is concerned about moral hazard, but then turn around and allow the larger banks to sell their troubled loans to state-owned asset management companies on very favourable terms (similar to what happened in the early 2000s). Once investors get wind that this is about to happen, Chinese bank shares will rally like crazy. Caroline: Isn’t shuffling debt from one sector of the economy to another akin to a shell game? Wouldn’t rampant debt growth eventually cause investors to lose confidence in the currency? Peter: China has a problem with the composition of its debt, not with its total value. Debt is a problem when the borrower can’t or won’t repay the loan. Chart 15 (Peter)China Is On Course To Lose More Than 400 Million Workers
China On Course To Lose More Than 400 Million Workers
China On Course To Lose More Than 400 Million Workers
I completely agree that there is too much shadow bank lending in China. There is also too much borrowing by state-owned enterprises. Ideally, the Chinese government would move all this quasi-public spending onto its own balance sheet. It would significantly raise social spending to discourage precautionary household savings. It would also adopt generous pro-natal policies — free childcare, education, government paid parental leave, and the like. The fact that the Chinese working-age population is set to shrink by 400 million by the end of the century is a huge problem (Chart 15). If the central government borrowed and spent more, state-owned companies and local governments would not have to borrow or spend as much. Banks could then increase their holding of high-quality central government bonds. Debt sustainability is only a problem if the interest rate the government faces exceeds the growth rate of the economy.6 That is manifestly not the case in China (Chart 16). And why are interest rates so low in relation to growth? Because Chinese households save so much! We simply can’t ignore the role of savings in the discussion. Chart 16 (Peter)China: High Levels Of Household Savings Have Kept Interest Rates Below The Growth Rate Of The Economy
China: High Levels Of Household Savings Have Kept Interest Rates Below The Growth Rate Of The Economy
China: High Levels Of Household Savings Have Kept Interest Rates Below The Growth Rate Of The Economy
As far as the currency is concerned, if debt growth rose so much that the economy overheated and inflation soared, then yes, the yuan would plunge. But that’s not what we are talking about here. We are talking about bringing debt growth to a level that generates just enough demand to achieve something resembling full employment. No one is calling for raising debt growth beyond that point. Curbing debt growth in a demand-deficient economy, as Arthur seems to be recommending, would cause unemployment to rise. Investors would then bet that the Chinese government would try to boost net exports by engineering a currency devaluation. Capital outflows would intensify. Far from creating the conditions for a weaker yuan, fiscal/credit stimulus obviates the need for a currency depreciation. Caroline: Peter, even if we accept your argument that the counterfactual of curbing credit growth in a demand-deficient economy would be a more deflationary outcome than sustaining the government-sponsored credit growth engine, how is building bridges to nowhere a positive sum for investors? Even if this strategy maintains social stability in the interests of the CCP’s regime preservation, won’t investors eventually recoil at the retreat to socialism that Arthur outlines, reducing the appeal of holding the yuan, even if, as you both seem to agree, no apocalyptic debt crisis is at hand? In other words, isn’t two times nothing still nothing? Peter: First of all, many of these infrastructure projects may turn out to be quite useful down the road, pardon the pun. Per capita vehicle ownership in China is only one one-fifth of what it is in the United States, and one-fourth of what it is in Japan (Chart 17). A sparsely used expressway today may be a clogged one tomorrow. Chart 17 (Peter)The Automobile Ownership Rate Is Still Quite Low In China
The Automobile Ownership Rate Is Still Quite Low In China
The Automobile Ownership Rate Is Still Quite Low In China
Would China really be better off if it had fewer infrastructure projects and more big screen TVs? An economy where people are always buying stuff they don’t need, with money they don’t have, to impress people they don’t like, is hardly a recipe for success. I am not sure what these references to socialism are supposed to accomplish. You want to see a real retreat to socialism? Try creating millions of unemployed workers with no jobs and no hope. All sorts of pundits decried Franklin Roosevelt’s New Deal as creeping socialism. The truth is that the New Deal took the wind out of the sails of the fledgling U.S. communist movement at the time. Arthur: I believe that Peter is confusing the structural and cyclical needs for stimulus. When an economy is in a recession – banks are shrinking their balance sheets and property prices are deflating – the authorities must undertake fiscal and credit stimulus. Chart 18 (Arthur)What Will Productivity Growth Look Like If Public Officials Allocate 55%-60% Of GDP?
What Will Productivity Growth Look Like If Public Officials Allocate 55%-60% Of GDP?
What Will Productivity Growth Look Like If Public Officials Allocate 55%-60% Of GDP?
Credit and fiscal stimulus made sense in China in early 2009 when growth plunged. However, over the past 10 years, we have witnessed credit and property market booms of gigantic proportions. Does this economy warrant continuous stimulus? What will productivity growth look like if government bureaucrats continuously allocate 55-60% of GDP each year (Chart 18)? Caroline: Arthur and Peter, you can both argue with one another about the semantic economic definition of the term ‘savings’, the implications of chronic excess production (relative to consumption), and the root drivers of credit growth in China long past the expiry of every BCA client’s investment horizon. Clients benefit from understanding your distinct perspectives only to the extent that they inform your outlook for markets. Will each of you now please outline how you see high levels of credit in China’s economy impacting the following over a cyclical (6-12 month) and structural (3-5 year) horizon: Global growth Commodity prices China-geared financial assets Peter: Regardless of what one thinks about the root causes of China’s high debt levels, it seems certain to me that the Chinese are going to pick up the pace of credit/fiscal stimulus over the next six months in response to slowing growth and trade war uncertainties. If anything, the incentive to open the credit spigots this time around is greater than in the past because the Chinese government wants to have a fast-growing economy to gain leverage over trade negotiations with the U.S. Chart 19 (Peter)Stronger Chinese Credit Growth Bodes Well For Commodity Prices
Stronger Chinese Credit Growth Bodes Well For Commodity Prices
Stronger Chinese Credit Growth Bodes Well For Commodity Prices
Chart 20 (Peter)The Dollar Is A Countercyclical Currency
The Dollar Is A Countercyclical Currency
The Dollar Is A Countercyclical Currency
Stronger Chinese growth will boost growth in the rest of the world. Commodity prices will rise (Chart 19). As a counter-cyclical currency, the U.S. dollar will likely peak over the next month or so and then weaken in the back half of 2019 and into 2020 (Chart 20). The combination of stronger Chinese growth, higher commodity prices, and a weaker dollar will be manna from heaven for emerging markets. If a trade truce between China and the U.S. is reached, investors should move quickly to overweight EM equities. European stocks should also benefit. Looking further out, China’s economy will slow in absolute terms. In relative terms, however, Chinese growth will remain near the top of the global rankings. China has one of the most educated workforces in the world (Chart 21). Assuming that output-per-hour reaches South Korean levels by the middle of the century, Chinese real GDP would need to expand by about 6% per year over the next decade (Chart 22). That’s a lot of growth – growth that will eventually help China outgrow its debt burden.
Chart 21
Chart 22 (Peter)China Has More Catching Up To Do
China Has More Catching Up To Do
China Has More Catching Up To Do
Keep in mind that credit growth of 1% when the debt-to-GDP ratio is 300% yields 3% of GDP in credit stimulus, compared with only 1% of stimulus when the debt-to-GDP ratio is 100%. That does not mean that more debt is intrinsically a good thing, but it does mean that China will eventually be able to slow debt growth even if excess savings remains a problem. Structurally, Chinese and EM equities will likely outperform their developed market peers over a 3-to-5 year horizon. The P/E ratio for EM stocks is currently 4.7 percentage points below that of developed markets, which is below its long-term average (Chart 23). While EM EPS growth has lagged DM earnings growth over the past eight years, the long-term trend still favors EM (Chart 24). EM currencies will appreciate over this period, with the RMB leading the way. Chart 23 (Peter)EM Stocks: Valuations Are Attractive
EM Stocks: Valuations Are Attractive
EM Stocks: Valuations Are Attractive
Chart 24 (Peter)Earnings Growth In EM Has Outpaced That Of DM Over The Long Haul
Earnings Growth In EM Has Outpaced That Of DM Over The Long Haul
Earnings Growth In EM Has Outpaced That Of DM Over The Long Haul
Arthur: China is facing a historic choice between two scenarios. Medium- and long-term macro outcomes will impact markets differently in each case. Table 1 shows my cyclical and structural investment recommendations for each scenario. Table 1 (Arthur)Arthur’s Recommended Investment Strategy For China-Geared Financial Assets
China’s Credit Cycle: A Spirited Debate
China’s Credit Cycle: A Spirited Debate
Allowing Markets to Play A Bigger Role = Lower credit growth (deleveraging), corporate restructuring, and weaker growth (Chart 25). This is bearish for growth and financial markets in the medium term but it will make Chinese stocks and the currency structural (long-term) buys. Credit/Money Boom Persists (Socialist Put) = Secular Stagnation, Inflation and Currency Depreciation: The structural outlook is downbeat but there are mini-cycles that investors could play (Chart 26). Cyclically, China-geared financial assets still remain at risk. However, lower asset prices and more stimulus in China could put a floor under asset prices later this year. Timing these mini-cycles is critical. A buy-and-hold strategy for Chinese assets will not be appropriate in this scenario. In short, capitalism is bad but socialism is worse. I hope China will pursue the first path.
Chart 25
Chart 26
Caroline: Thank you both for clarifying your perspectives. Over a multi-year horizon, markets will render the ultimate judgement on whether China’s credit boom has represented a reckless misallocation of capital, or a rational policy response to an imbalance between domestic spending and income. In the meantime, we will monitor the complexion of Chinese stimulus and evidence of its global growth multiplier effect over the coming weeks and months. These will be the key variables to watch as we determine when and at what level to upgrade BCA’s cyclical outlook for China-geared assets. Can’t wait for that debate. Footnotes 1 For a detailed discussion of these issues, please see Emerging Markets Strategy Special Reports, “Misconceptions About China's Credit Excesses,” dated October 26, 2016 and “The True Meaning Of China's Great 'Savings' Wall,” dated December 20, 2017. 2 For a detailed discussion of these issues, please see Emerging Markets Strategy Special Reports, “Misconceptions About China's Credit Excesses,” dated October 26, 2016 and “The True Meaning Of China's Great 'Savings' Wall,” dated December 20, 2017. 3 For a detailed discussion of these issues, please see Emerging Markets Strategy Special Report, “China's Money Creation Redux And The RMB,” dated November 23, 2016. 4 For a discussion on the reasons behind China’s high savings rate, please see Global Investment Strategy Weekly Report, “China’s Savings Problem,” dated January 25, 2019. 5 For a detailed discussion of these issues, please see Emerging Markets Strategy Special Report, “Is Investment Constrained By Savings? Tales Of China And Brazil,” dated March 22, 2018. 6 For a detailed discussion of these issues, please see Global Investment Strategy Weekly Report, “Is There Really Too Much Government Debt In The World?” dated February 22, 2019 and “Chinese Debt: A Contrarian View,” dated April 19, 2019. Strategy & Market Trends MacroQuant Model And Current Subjective Scores
Image
Tactical Trades Strategic Recommendations Closed Trades

The speed and scale of China’s recent debt surge dwarfs Japan and the U.S.’ respective credit binges in the 1980’s and 2000’s, each of which ultimately led to financial market meltdowns. Why should China’s experience be any different? Clients are already aware that Peter Berezin and Arthur Budaghyan disagree on the macro and market ramifications of China’s decade-long credit boom. The aim of this report is to provide visibility on the root sources of the view divergence. To access the full report entitled, “China’s Credit Cycle: A Spirited Debate,” please click here.
Highlights The May official PMI shows that manufacturing in China will slow over the coming year unless the recent doubling of U.S. import tariffs can be reversed and the imposition of the remaining tariffs can be avoided. The divergence between H-shares and both A-shares and the domestic fixed-income market suggests that China’s domestic financial market participants are pricing in some probability of a major reflationary response by Chinese authorities. We agree that such a response will occur over the coming 6-12 months, and would recommend that investors stay overweight Chinese equities within a global equity portfolio over that time horizon. Feature Tables 1 and 2 on pages 2 and 3 highlight key developments in China’s economy and its financial markets over the past month. On the growth front, April’s activity data provided early evidence that the trajectory of the economy was beginning to turn prior to the breakdown in U.S./China trade talks, in response to a meaningful credit improvement in Q1. The May Caixin manufacturing PMI was stable, but the official PMI fell and the experience of last year clearly shows that manufacturing in China will slow over the coming year unless the recent doubling of U.S. import tariffs can be reversed and the imposition of the remaining tariffs can be avoided. Assuming that the Trump administration follows through with its threat, investors are likely to see a repeat of last year’s perversely positive effects of tariff frontrunning on the Chinese trade data over the next few months; this should be viewed as confirmation of an impending collapse in trade activity, rather than a sign that the underlying trade situation is improving. Table 1China Macro Data Summary
China Macro And Market Review
China Macro And Market Review
Table 2China Financial Market Performance Summary
China Macro And Market Review
China Macro And Market Review
Within financial markets, the most notable development is the contrast between the relative performance of investable Chinese stocks on the one hand, and domestic equities and the Chinese fixed-income market on the other. The recent performance of investable stocks confirms that they have been driven nearly exclusively by trade war developments for the better part of the past year, whereas the somewhat better relative performance of A-shares and the calm in the government bond, corporate bond, and sovereign CDS markets suggests that China’s domestic financial market participants are pricing in some probability of a major reflationary response by Chinese authorities. We agree that such a response will occur over the coming 6-12 months, and would recommend that investors stay overweight Chinese equities within a global equity portfolio over that time horizon. In reference to Tables 1 and 2, we provide below several detailed observations concerning developments in China’s macro and financial market data: Chart 1A Strong Response From Policymakers Will Likely Offset The Coming Tariff Shock
A Strong Response From Policymakers Will Likely Offset The Coming Tariff Shock
A Strong Response From Policymakers Will Likely Offset The Coming Tariff Shock
Both Bloomberg’s and our alternative calculation of the Li Keqiang index (LKI) rose in April, albeit only fractionally in the case of the latter. Still, as we noted in last week’s report,1 the Q1 rebound in credit appears to have halted the decline in investment-relevant Chinese economic activity (Chart 1). This suggests that the trajectory of the economy was beginning to change in April prior to the breakdown in U.S./China trade talks, implying that an aggressively stimulative response from Chinese authorities to counter a full 25% tariff scenario has good odds of succeeding. This supports our cyclically overweight stance towards Chinese stocks. Our leading indicator for the LKI declined slightly in April, but remains in a very modest uptrend. The gap between accelerating credit growth and the sluggishness of our leading indicator is explained by the fact that growth in Chinese M2 and M3 has been slow to rise. A weaker-than-expected recovery in Chinese economic activity is much more likely if money growth remains weak, but we cannot reasonably envision an outcome where credit growth continues to trend higher and growth in the money supply does not meaningfully accelerate. The incoming Chinese housing data continues to provide conflicting signals. The annual change of the PBOC’s pledged supplementary lending injections declined further in April, which since 2015 has done an excellent job explaining weak housing demand. However, both floor space started and sold picked up in April (Chart 2), and house price growth remained steady despite a significant decline in the breadth of house price appreciation across 70 cities. Policymakers are likely to allow aggregate credit growth to accelerate significantly over the coming 6-12 months in order to counter the deflationary impact of a trade war with the U.S., but our sense is that policymakers will then refocus their financial stability efforts on the household sector (i.e. they will work to prevent another significant reacceleration in household debt growth). Given this, we continue to expect that housing demand will remain weak, although we will be closely watching floor space sold over the coming few months. The new export orders component of the official manufacturing PMI is signaling an external outlook that is as negative as the 2015/2016 episode. The May official manufacturing PMI fell back into contractionary territory, led by a very significant decline in the new export orders component (Chart 3). The Caixin manufacturing PMI was stable, but the outlook for manufacturing in China is clearly negative unless the recent doubling of U.S. import tariffs can be reversed and the imposition of the remaining tariffs can be avoided. Investors are likely to see a repeat of last year’s perversely positive effects of tariff frontrunning on the Chinese trade data over the next few months; this should be viewed as confirmation of an impending collapse in trade activity, rather than a sign that the underlying trade situation is improving. Chart 2Surprising Resilience In China's Housing Market (For Now)
Surprising Resilience In China's Housing Market (For Now)
Surprising Resilience In China's Housing Market (For Now)
Chart 3A Clearly Negative Outlook For Manufacturing
A Clearly Negative Outlook For Manufacturing
A Clearly Negative Outlook For Manufacturing
There has been a sharp contrast in the behavior of the Chinese investable and domestic equity markets over the past month, which in our view confirms that the former has been driven nearly exclusively by trade war developments for the better part of the past year. Chart 4 shows that the relative performance of investable stocks (versus global) has nearly fallen back to its late-October low, whereas A-shares technically remain in an uptrend despite having sold off. Some investors have attributed the relative support of A-shares to aggressive buying by the “national team”, state-related financial market participants that the government has relied on since 2015 to manage volatility in the domestic equity market. Chart 4Are A-Shares Acting More Rationally Than The Investable Market?
Are A-Shares Acting More Rationally Than The Investable Market?
Are A-Shares Acting More Rationally Than The Investable Market?
However, it is also possible that the A-share market is acting more rationally than the investable market, by focusing on the possibility of a major reflationary response to the Trump tariffs. This contrast in behavior between the investable and domestic markets was also observed pre- and post-February 15th, when the January credit data was released. Prior to this point, the A-share market was (rightly) not confirming the relative uptrend in investable stocks; following February 15th, A-shares exploded higher in response to tangible evidence that a upcycle in credit had arrived. If it is true that the A-share market is better reflecting the prospect of a reflationary response from Chinese policymakers, the relative performance trend for domestic stocks supports our decision to remain cyclically overweight Chinese stocks versus the global benchmark. Chinese utilities and consumer staples have outperformed in both the investable and domestic equity markets over the past month, which is not surprising given that these sectors typically outperform during risk-off phases. Within the investable market, the sharp underperformance of the BAT (Baidu, Alibaba, and Tencent) stocks has been the most interesting (Chart 5). To the extent that the selloff in BAT stocks reflects trade war retaliation risk (through, for example, delisting from U.S. exchanges), then the selloff is rational. But the fact that Tencent (which also trades in Hong Kong) has also declined so sharply suggests that investors are blanket selling Chinese technology-related stocks out of concern that the sector will be heavily implicated by punitive action from the Trump administration. The BAT stocks are domestically oriented, meaning that “Huawei risk” appears to be minimal. Chart 5A Potential (Future) Opportunity In The BAT Stocks
A Potential (Future) Opportunity In The BAT Stocks
A Potential (Future) Opportunity In The BAT Stocks
Beyond the near-term risk from deteriorating sentiment, the selloff in BAT stocks may present a cyclical opportunity for investors. Unlike Huawei, whose export-oriented business model relied on the U.S. as part of its supply chain, Alibaba and Tencent are largely domestically-driven businesses whose earnings will depend mostly on the outlook for Chinese consumer spending. We agree that reflationary efforts by Chinese policymakers will attempt to avoid stoking a significant acceleration in residential mortgage credit, but it is difficult to envision a scenario in which China stimulates aggressively and consumer spending growth does not accelerate. As such, investors should closely watch the performance of BAT stocks in response to reflationary announcements and developments on the credit front; we would strongly consider an outright long stance favoring BAT stocks if a technical breakout occurs alongside the release of data that is consistent with a significant improvement in the macro outlook. There has been little movement in the Chinese government bond market over the past month, with the Chinese 10-year government bond yield having fallen merely 10 basis points since late-April. This is in contrast to what has occurred in the U.S., with yields on 10-year Treasurys having come in roughly three times as much over the past month (Chart 6). The relative calm in the Chinese government bond market is echoed by the relative 5-year CDS spread between China and Germany, a component of our BCA Market-Based China Growth Indicator. While the spread has certainly moved higher in response to the breakdown in trade talks and President Trump’s full imposition of tariffs on the second tranche of imports from China, it remains below its 2018 average and well below levels that prevailed in 2015 and 2016 (Chart 7). Similarly, Chinese onshore corporate bond spreads have not reacted negatively to the resumption in the trade war, with the spread on the aggregate ChinaBond Onshore Corporate Bond Index up one basis point over the past month. Taken together with the relative performance of A-shares as well as Charts 6 and 7 we see this as evidence that China’s financial market participants are pricing in some probability of a major reflationary response by Chinese authorities. Chart 6Relative Calm In China's Fixed-Income Market
Relative Calm In China's Fixed-Income Market
Relative Calm In China's Fixed-Income Market
Chart 7China's Sovereign CDS Spread Is Rising, But The Level Remains Low
China's Sovereign CDS Spread Is Rising, But The Level Remains Low
China's Sovereign CDS Spread Is Rising, But The Level Remains Low
A decline in the RMB is necessary to stabilize China’s economy (and is thus reflationary), but global investors will not act like it is until the economy visibly improves. Global financial market commentary on the RMB has been focused almost exclusively over the past month on the USD-CNY exchange rate, but Chart 8 shows that the decline in the currency has been broad-based. The RMB has fallen roughly 1.4% versus the euro over the past month, and over 2% versus an equally-weighted basket of Asian currencies. We highlighted in our May 15 Weekly Report that a 25% increase in tariffs affecting all U.S.-China trade would cause economic conditions in China to deteriorate to 2015/2016-like levels, and that currency depreciation was essential in order to generate a 2015/2016-magnitude policy response.2 However, to the extent that the decline in the RMB will contribute to a period of greater volatility in the global foreign exchange market, China-related assets are not likely to respond positively to this form of stimulus until “hard” activity data clearly shows a meaningful rise. Chart 8The RMB Has Declined Against Everything, Not Just The Dollar
The RMB Has Declined Against Everything, Not Just The Dollar
The RMB Has Declined Against Everything, Not Just The Dollar
Jonathan LaBerge, CFA, Vice President Special Reports jonathanl@bcaresearch.com Footnotes 1 Please see China Investment Strategy Weekly Report, “Waiting For The Pain”, dated May 29, 2019, available at cis.bcaresearch.com. 2 Please see China Investment Strategy Weekly Report, “Simple Arithmetic”, dated May 15, 2019, available at cis.bcaresearch.com. Cyclical Investment Stance Equity Sector Recommendations
Feature Markets have turned jittery in the past month. Global growth data have deteriorated further (Chart 1), with Korean exports, the German manufacturing PMI, and even U.S. industrial production weak. Moreover, trade negotiations between the U.S. and China appear to have broken down, with China threatening to retaliate against U.S. sanctions on Huawei by blocking sales of rare earths, and refusing to negotiate further unless the U.S. eases tariffs. BCA’s Geopolitical Strategists now give only a 40% probability of a trade deal by the time of the G20 summit at the end of June (Table 1). As a result, BCA alerted clients on 10 May to the risk of a further short-term 5% correction in global equities.1 Recommended Allocation
Monthly Portfolio Update: China To The Rescue?
Monthly Portfolio Update: China To The Rescue?
Chart 1Worrying Signs?
Worrying Signs?
Worrying Signs?
Table 1Chances Of A Trade Deal Fading Fast
Monthly Portfolio Update: China To The Rescue?
Monthly Portfolio Update: China To The Rescue?
What is essentially behind the global slowdown, especially outside the U.S., is that both China and the U.S. last year were tightening monetary policy – China by slowing credit growth, the U.S. via Fed hikes. The U.S. economy was robust enough to withstand this, but economies in Europe, Asia, and Emerging Markets were not (Chart 2). The question now is whether the Chinese authorities and the Fed will come to the rescue and add stimulus that will cause a recovery in global growth. China has already triggered a rebound in credit growth since January (Chart 3). Chart 2U.S. Holding Up Better Than Elsewhere
U.S. Holding Up Better Than Elsewhere
U.S. Holding Up Better Than Elsewhere
Chart 3China Stimulus Has Only Just Begun
China Stimulus Has Only Just Begun
China Stimulus Has Only Just Begun
This has not come through clearly in Chinese – and other countries’ – activity data yet, partly because there is usually a lag of 3-12 months before this happens, and partly because Chinese authorities seemingly eased back somewhat on the gas pedal in April given rising expectations of a trade deal. But, judging by previous episodes such as 2009 and 2016, the Chinese will stimulate now based on the worst-case scenario. The risk is more that they overdo the stimulus than that they fail to do enough. Yes, China is worried about its excess debt situation. But this year they will prioritize growth – not least because of some sensitive anniversaries in the months ahead (for example, the 70th anniversary of the People’s Republic on October 1), and because the government is falling behind on its promise to double per capita real income between 2010 and 2020 (Chart 4). Chart 4Chinese Communist Party Needs To Prioritize Growth
Chinese Communist Party Needs To Prioritize Growth
Chinese Communist Party Needs To Prioritize Growth
Chart 5U.S. Consumers Look In Fine State
U.S. Consumers Look In Fine State
U.S. Consumers Look In Fine State
In the U.S., consumption is likely to continue to buoy the economy. Wages are growing 3.2% a year and set to accelerate further, and consumer confidence is close to a 50-year high (Chart 5). It is easy to exaggerate the impact of even an all-out trade war. For China, exports to the U.S. are only 3.4% of GDP. A hit to this could easily be offset by stimulus leading to greater capital expenditure. For the U.S, most academic studies show that the impact of tariffs will largely be passed on to the consumer via higher prices.2 But even if the U.S. imposes 25% tariffs on all Chinese exports and all is passed on to the consumer with no substitutions for goods from other countries the impact, about $130 billion, would represent only 1% of total U.S. consumption. The question now is whether the Chinese authorities and the Fed will come to the rescue and add stimulus that will cause a recovery in global growth. But if China will bail out the global economy, we are not so convinced that the Fed will cut rates any time soon. The market has priced in two Fed rate cuts over the next 12 months (Chart 6). But we agree with comments from Fed officials that recent softness in inflation is transitory. For example, financial services inflation (mostly comprising financial advisor fees, linked to assets under management, and therefore very sensitive to the stock market) alone has deducted 0.4 percentage points from core PCE inflation over the past six months (Chart 7). The trimmed mean PCE (which cuts out other volatile items besides energy and food, which are excluded from the commonly used core PCE measure) is close to 2% and continues to drift up. Chart 6Will The Fed Really Cut Twice In 12 Months?
Will The Fed Really Cut Twice In 12 Months?
Will The Fed Really Cut Twice In 12 Months?
Chart 7Soft Inflation Probably Is Transitory
Soft Inflation Probably Is Transitory
Soft Inflation Probably Is Transitory
Fed policy remains mildly accommodative: the current Fed Funds Rate is still two hikes below the neutral rate, as defined by the median terminal-rate dot in the FOMC’s Summary of Economic Projections (Chart 8). The market may be trying to push the Fed into cutting rates and could be disappointed if it does not. For now, we tend to agree with the Fed’s view that policy is about correct (Chart 9) but, if global growth does recover before the end of the year, one hike would be justified in early 2020 – before the upcoming Presidential election in November 2020 makes it less comfortable for the Fed to move. Chart 8Fed Policy Is Still Accommodative
Fed Policy Is Still Accommodative
Fed Policy Is Still Accommodative
Chart 9Fed Doesn't Need To Move For Now
Fed Doesn't Need To Move For Now
Fed Doesn't Need To Move For Now
In this macro environment, we see global bond yields bottoming not far below their current (very depressed) levels, and equities eking out reasonable gains over the next 12 months. The risk of a global recession over the next year or so is not high, in our opinion. We, therefore, continue to recommend an overweight on global equities and underweight on bonds over the cyclical horizon. We see global bond yields bottoming not far below their current (very depressed) levels, and equities eking out reasonable gains over the next 12 months. Fixed Income: Government bond yields have fallen sharply over the past eight months (by 110 basis points for the U.S. 10-year, for example) because of 1) falling inflation expectations, caused mostly by a weak oil price, 2) expectations of Fed rate cuts, 3) especially weak growth in Europe, which pulled German yields down to -20 basis points in May, and 4) global risk aversion which pushed asset allocators into government bonds, and lowered the term premium to near record low levels (Chart 10). If Brent crude rises to $80 a barrel this year as we forecast, the Fed does not cut rates, and European growth rebounds because of Chinese stimulus, we find it highly improbable that yields will fall much further. Ultimately, the global risk-free rate is driven by global growth (Chart 11). Investors are already positioned very aggressively for a further fall in yields (Chart 12). We would expect the U.S. 10-year yield to move back towards 3% over the next 12 months. We remain moderately positive on credit, which should also benefit from a growth rebound: U.S. high-yield spreads are still around 70 basis points for Ba-rated bonds, and 110 basis points for B-rated ones, above the levels at which they typically bottom in expansions; investment-grade bonds, though, have less room for spread contraction (Chart 13). Chart 10Term Premium Near Record Low
Term Premium Near Record Low
Term Premium Near Record Low
Chart 11Global Rebound Would Push Up Yields
Global Rebound Would Push Up Yields
Global Rebound Would Push Up Yields
Chart 12Investors Very Long Duration
Investors Very Long Duration
Investors Very Long Duration
Chart 13Credit Spreads Can Tighten Further
Credit Spreads Can Tighten Further
Credit Spreads Can Tighten Further
Equities: We remain overweight U.S. equities, partly as a hedge against our overweight on the equity asset class, since the U.S. remains a relatively low beta market. Our call for the second half will be 1) when will Chinese stimulus start to boost growth disproportionately for commodity and capital-goods exporters, and 2) does that justify a shift out of the U.S. (which may be somewhat hurt short term by the Trade War) and into euro zone and Emerging Markets equities. Given the structural headwinds in both (the chronically weak banking system and political issues in Europe; high debt and lack of structural reforms in EM), we want clear evidence that the Chinese stimulus is working before making this call. We are likely to remain more cautious on Japan, even though it is a clear beneficiary of Chinese growth, because of the risk presented by the rise in the consumption tax in October: after previous such hikes, consumption not only slumped immediately afterwards but remained depressed (Chart 14). Chart 14Japan's Sales Tax Hike Is A Worry
Japan's Sales Tax Hike Is A Worry
Japan's Sales Tax Hike Is A Worry
Chart 15Dollar Is A Counter-Cyclical Currency
Dollar Is A Counter-Cyclical Currency
Dollar Is A Counter-Cyclical Currency
Currencies: Again, China is the key. The dollar is a counter-cyclical currency, and a pickup in global growth would weaken it (Chart 15). Any further easing by the ECB – for example, significantly easier terms on the next Targeted Longer-Term Refinancing Operations (TLTRO) – might actually be positive for the euro since it would augur stronger growth in the euro area. Moreover, long dollar is a clear consensus view, with very skewed market positioning (Chart 16). Also, on a fundamental basis, compared to Purchasing Power Parity, the dollar is around 15% overvalued versus the euro and 11% versus the yen.
Chart 16
Chart 17Industrial Metals Driven By China Too
Industrial Metals Driven By China Too
Industrial Metals Driven By China Too
Commodities: Industrial metals prices have generally been weak in recent months with copper, for example, falling by 10% since mid-April. It will require a sustained rebound in Chinese infrastructure spending to push prices back up (Chart 17). Oil continues to be driven by supply-side factors, not demand. With OPEC discipline holding, Iran sanctions about to be reimposed, political turmoil in Libya and Venezuela, BCA’s energy strategists continue to see inventories drawing down this year, and therefore forecast Brent crude to reach $80 during 2019 (Chart 18). Chart 18Oil Supply Remains Tight
Oil Supply Remains Tight
Oil Supply Remains Tight
Garry Evans Chief Global Asset Allocation Strategist garry@bcaresearch.com Footnotes 1 Please see Global Investment Strategy, Special Report, “Stay Cyclically Overweight Global Equities, But Hedge Near-Term Downside Risks From An Escalation Of A Trade War,” dated May 10, 2019, available at gis.bcaresearch.com 2 Please see, for example, Mary Amiti, Sebastian Heise, and Noah Kwicklis, “The Impact of Import Tariffs on U.S. Domestic Prices,” Federal Reserve Bank of New York Liberty Street Economics, dated 4 January 2019. Recommended Asset Allocation
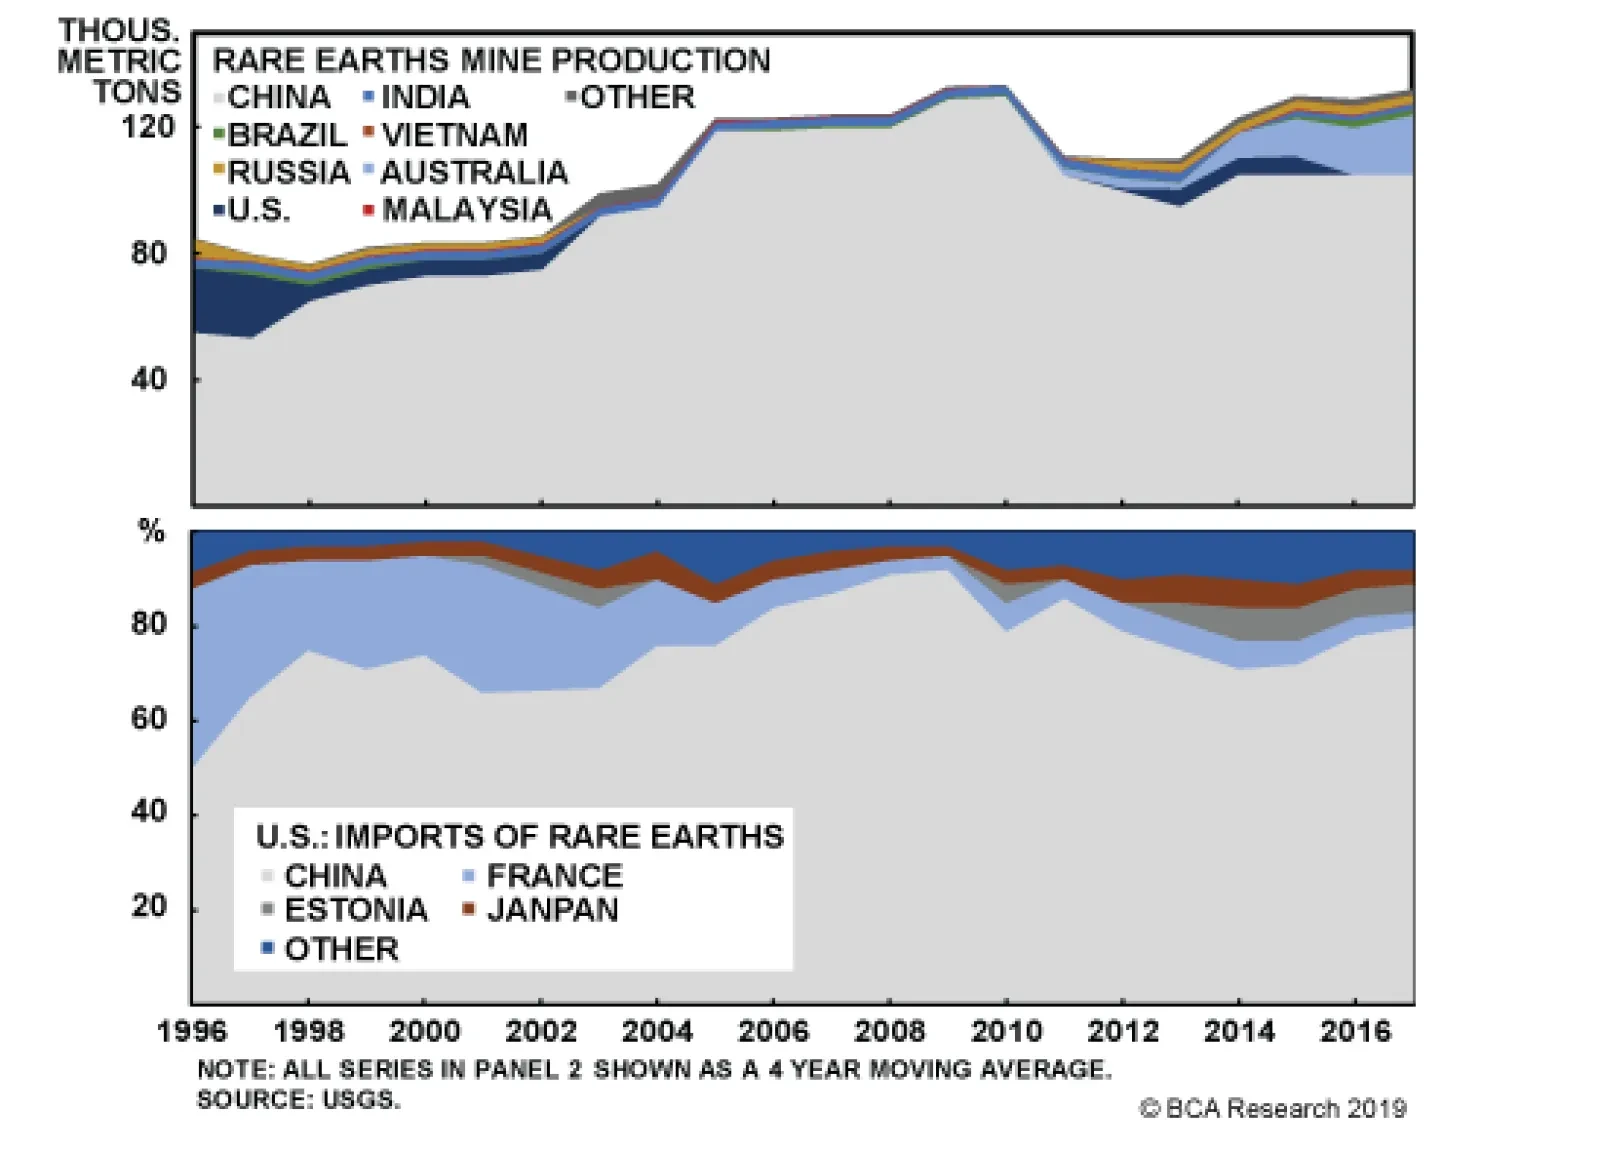
China dominates global production and export markets, so this would be a serious disruption in the near term. Global sentiment would worsen, weighing on all risk assets, and tech companies and manufacturers that rely on rare earth inputs from China would face…
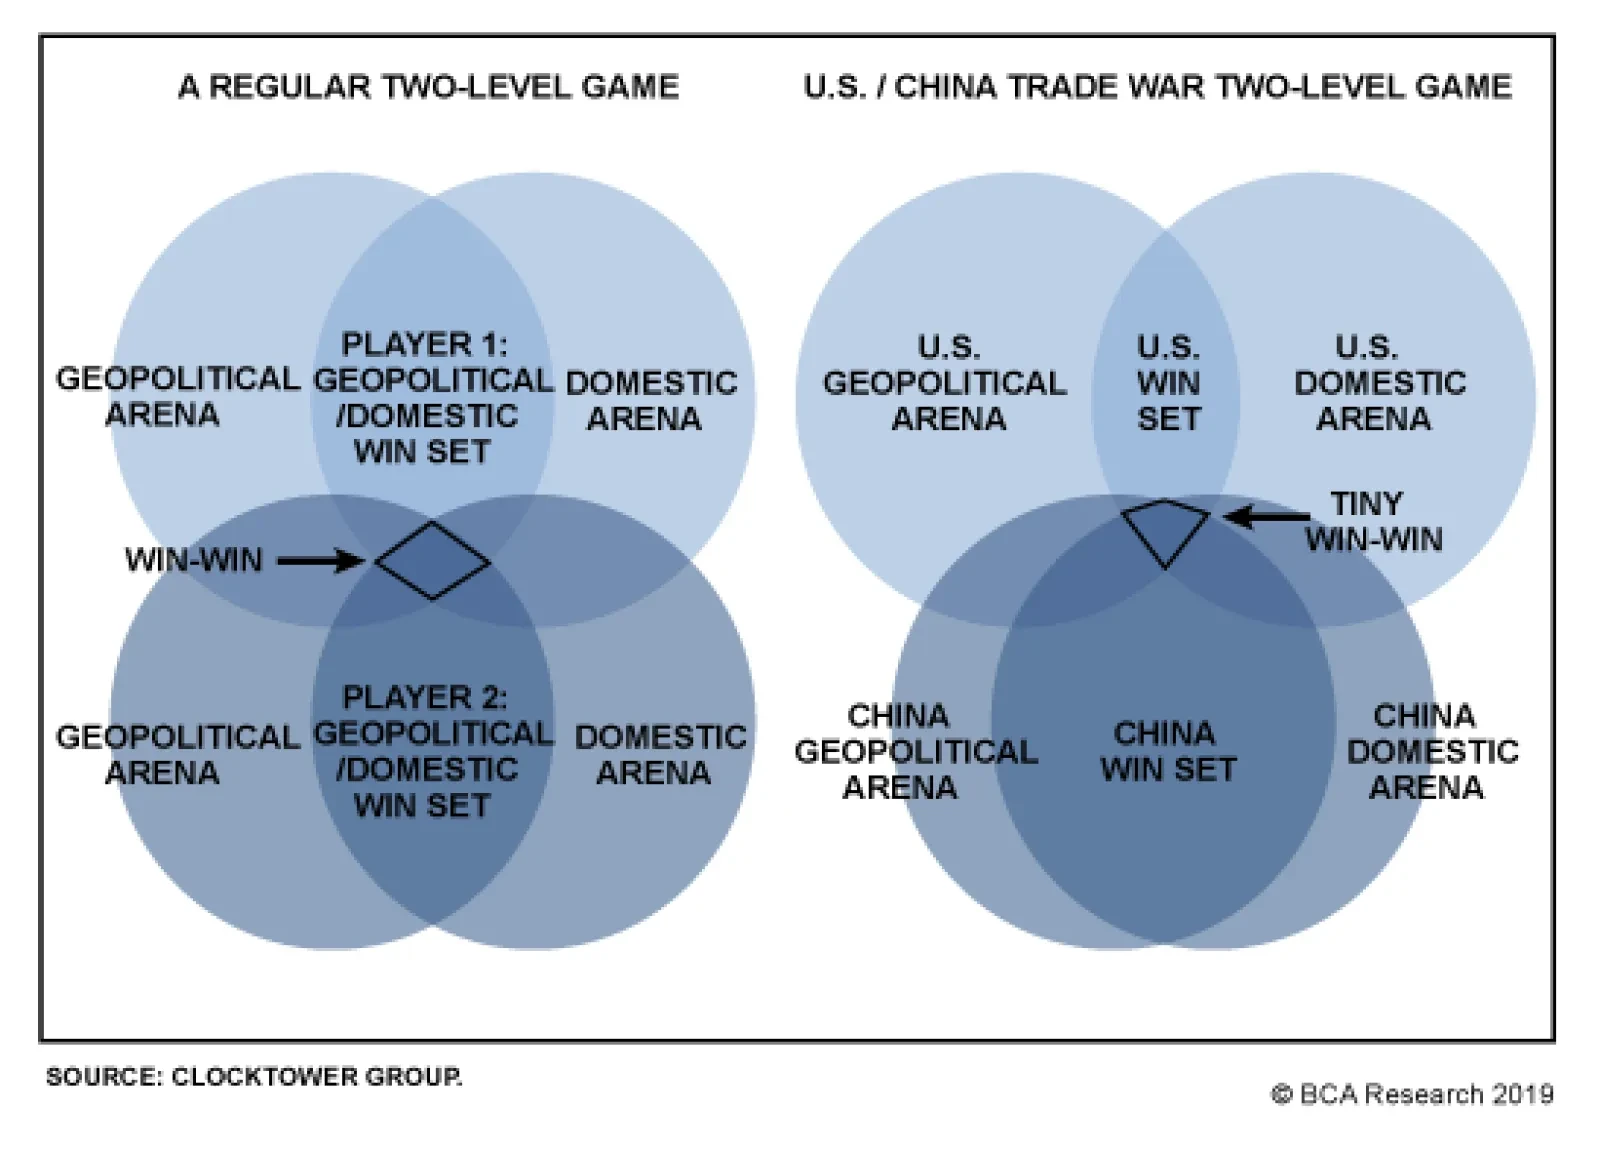
On March 6 our Geopolitical Strategy team argued that a deal had a 50% chance of getting settled by the June 28-29 G20 summit in Japan, with a 30% chance talks would totally collapse. Since then, they have reduced the odds of a deal to 40%, with a collapse at…