China

Highlights This report explores the structural potential for the A-share market by reviewing the performance of several MSCI factor indexes, as well as a number of our own factor portfolios. The persistent outperformance of several fundamental factors in China’s domestic equity market may suggest that A-shares are a less efficient market than other emerging or developed markets, but the evidence does not support the idea that A-shares are a “casino” market that is purely driven by speculation. An A-share portfolio formed of industry groups with above-median return on equity and below-median ex-post beta has significantly outperformed over the past decade, and we are comfortable recommending it relative to the MSCI China A Onshore index to global investors who are looking to increase their secular exposure to domestic Chinese stocks. Feature Chart 1Interest In A-Shares Rose Sharply In Q1, In Lockstep With Prices
Interest In A-Shares Rose Sharply In Q1, In Lockstep With Prices
Interest In A-Shares Rose Sharply In Q1, In Lockstep With Prices
Structural interest in domestic Chinese stocks is growing among global investors, which has been heightened somewhat over the past year by MSCI’s decision to progressively include A-shares in the MSCI Emerging Markets Index as well as the ongoing global search for yield/value. BCA’s China Investment Strategy team received many inquiries about the domestic market in Q1 of this year; this was mostly a response to the eye-popping 33% return for the market in the first quarter (Chart 1), but it also reflects a growing recognition of the domestic market and a desire among investors to increase their awareness. The performance of domestic stocks over the past decade has caused some investors to refer to A-shares as a “casino” market; i.e., a highly-volatile and speculative market divorced from fundamental performance, that is primarily driven by momentum-oriented retail investors. But, we have pushed back against the “strong-form” of this view in previous reports,1 arguing that while the A-share market is certainly volatile, it does not appear to be particularly irrational. In this Special Report we explore the structural potential for the A-share market by reviewing the performance of several MSCI factor indexes, both to identify profitable investment opportunities and to further investigate the claim that playing in the A-share market is akin to betting at a casino. We also build several of our own factor portfolios based on similar attributes at the industry group level, and compare the performance of these portfolios to the MSCI factor indexes. Despite obvious near-term risks facing the Chinese economy and equity market, we conclude by recommending a long position in a specific high-performance factor strategy relative to the A-share benchmark, and highlight how the factor performance of Chinese and global stocks challenges the view that the domestic market is driven largely by sentiment rather than fundamentals. The Performance Of MSCI’s Factor Indexes: Onshore China Vs. Global Table 1 presents the six MSCI factor indexes available for both the All Country World and China A Onshore parent indexes, along with a brief description of MSCI’s construction methodology. The methodology for the high dividend yield, size, and value portfolios are relatively straightforward, whereas the construction of the quality, momentum, and low volatility indexes is more involved and definition-dependent. Table 1Description Of MSCI Single Factor Indexes
Factor Investing In The A-Share Market
Factor Investing In The A-Share Market
MSCI defines quality stocks as those having a high return on equity, a low debt/equity ratio, and low earnings variability. Momentum portfolios are build using an average of 6- and 12-month return measures (adjusted for the most recent month’s return to eliminate any short-term reversal effects). Finally, MSCI’s low volatility methodology employs a constrained portfolio optimization approach, where the weight of each constituent stock is set in order to minimize overall portfolio variance. Charts 2 & 3 present the historical price performance of the six factor portfolios for both China A and global, relative to the main benchmark indexes for both regions. We note our observations below: Chart 2The Relative Performance MSCI’s Factor Indexes (Part I)
The Relative Performance MSCI's Factor Indexes (Part I)
The Relative Performance MSCI's Factor Indexes (Part I)
Chart 3The Relative Performance MSCI's Factor Indexes (Part II)
The Relative Performance MSCI's Factor Indexes (Part II)
The Relative Performance MSCI's Factor Indexes (Part II)
Until 2015, the relative price (under)performance of high dividend yielding (“HDY”) stocks had been similar for domestic Chinese and global stocks this cycle.2 Following 2015, high yield stocks continued to underperform at the global level, but massively outperformed in the domestic market to the tune of 11% per year in excess price return. This appears to reflect a shift in domestic Chinese investor sentiment following the 2015 collapse in the A-share market, and has caused a meaningful compression in the average yield of the onshore HDY index relative to the domestic benchmark. It remains unclear whether continued relative outperformance in the domestic market is likely from this factor given how aggressively the strategy has been pursued over the past four years. A low volatility strategy has paid off in the domestic market over the past several years, in contrast to the global market where there has been, at best, a slight uptrend in relative performance over time. Importantly, while the inception date of the MSCI China A Minimum Volatility index is fairly recent, the relative outperformance of the index appears to be much more consistent than that of the HDY index. The apparent success of the low volatility factor within a high volatility equity market is interesting, and serves as the basis of some important investment strategy conclusions to be highlighted later in the report. Similar to the HDY and minimum volatility factors, quality also has outperformed within China’s domestic market. However, this is also true for the global version, in a very consistent fashion over the past decade. The coincident outperformance of quality in both the domestic Chinese and global equity markets is interesting, and also links to some of our later conclusions. In one of the most surprising results of our report, the relative performance of the MSCI momentum index is completely different for the domestic Chinese market than for global stocks. Chart 3 shows that a cyclical momentum strategy has underperformed the MSCI China A onshore index, whereas it has steadily and fairly consistently outperformed at the global level. To us, this finding seems at odds with the common characterization of the A-share market as being driven heavily by momentum-oriented retail investors. In addition, it raises some questions about the efficiency of the global equity market over the past decade. By far, size has exhibited the most impressive potential for outperformance in the A-share market, with domestic small caps having risen three fold relative to large- and mid-cap stocks. However, this massive outperformance has stunningly reversed, with small caps losing 20% per year in relative terms since late-2016. The timing of the collapse appears to be strongly linked with the crackdown on shadow banking by the Chinese government over the past three years (Chart 4), and is consistent with the fact that small firms were disproportionately reliant on alternative financing relative to large firms. This also suggests that at least a portion of the prior massive run-up in small cap performance was boosted by easy access to credit, making it difficult to assess the true underlying impact of size on domestic equity performance. At the global level, small cap stocks have also outperformed the global benchmark, although nearly 80% of the uptrend in relative performance occurred within the first three years of the global expansion. Since mid-2011, global small caps have outperformed the All Country World index by approximately 30 bps per year. Based on MSCI’s indexes, quality and minimum volatility appear to be the most consistently beneficial factors in the A-share market. Finally, the relative performance of value stocks is similar in trend to that of the HDY indexes for both China and global, which is not especially surprising given that the dividend yield is one of three valuation metrics used by MSCI (and many other financial market participants) to define value. However, A-share value has achieved roughly 2/3rds of the annualized outperformance as the HDY factor, in a more consistent fashion that appears to be less influenced by the sentimental shift that occurred in 2015. At the global level, the underperformance of value and HDY stocks likely reflects sector effects, particularly the decade-long underperformance of financials in the aftermath of the global financial crisis (Chart 5). Chart 4Shadow Banking Crackdown = Major Small Cap Underperformance
Shadow Banking Crackdown = Major Small Cap Underperformance
Shadow Banking Crackdown = Major Small Cap Underperformance
Chart 5Globally, Long-Term Underperformance Of HDY And Value Reflects Financial Sector Decline
Globally, Long-Term Underperformance Of HDY And Value Reflects Financial Sector Decline
Globally, Long-Term Underperformance Of HDY And Value Reflects Financial Sector Decline
Building And Examining New Factor Portfolios CHART 6An Equally-Weighted Industry Group Portfolio Has Outperformed In China And Globally
An Equally-Weighted Industry Group Portfolio Has Outperformed In China And Globally
An Equally-Weighted Industry Group Portfolio Has Outperformed In China And Globally
Given the methodological complexity of some of the factor indexes provided by MSCI, we have created 10 of our own factor portfolios for both the China A onshore and All Country World benchmarks using a simpler approach. Several of these portfolios are conceptually similar to the six MSCI factor indexes, but in practice there are several differences: We identify attributes at the industry group level (GICS level 2), rather than at the individual security level. We use all 24 industry groups at the global level, but owing to certain data limitations, we use a mix of sectors and industry groups for domestic China (for a total of 20 groups). Our approach equally-weights stock groups based on whether the attribute in question is above or below the median of all of the groups. This means that attributes are compared across groups based on their actual current values, not relative to their own history (which is, in practice, what occurs when MSCI calculates a Z-score for a particular attribute). Our equally-weighted group approach means that a portfolio equally-weighted across all groups is the appropriate benchmark to test the performance of our portfolios, rather than the MSCI China A onshore index itself (which is weighted by market capitalization). This is an important difference, because Chart 6 shows that an equally-weighted industry group portfolio has outperformed the main equity benchmark both for global stocks and for A-shares. Thus, outperformance of our factor portfolios versus an equally-weighted industry group portfolio would imply even more outperformance vs the benchmark, value-weighted index. Table 2 describes our 10 factor portfolios, as well as the methodology used to construct them. Besides the general differences between our methodology and MSCI’s noted above, there are also a few specific differences even within factors: Table 2Description of BCA-Calculated Industry-Group Factor Portfolios For Onshore China And Global Stocks (US$)
Factor Investing In The A-Share Market
Factor Investing In The A-Share Market
Our version of a low volatility portfolio allocates to industry groups with below-median beta (rolling 12-month) versus the MSCI China A onshore index. Our momentum portfolio allocates to industry groups based on a simple rolling 12-month return without adjustment, and we include a short-term momentum portfolio for comparison purposes. We specifically test above-median ROE as a factor, rather than building a composite quality index. Our size factor measures whether smaller mid- and large-cap industry groups outperform over time, rather than the impact of size on individual stocks. We use a univariate measure of value, namely a low 12-month trailing P/E ratio. Finally, we include two new factors not explicitly measured by the MSCI indexes: rolling 12-month ex-post alpha (based on a simple regression against benchmark returns), and high 12-month trailing EPS growth. We present two versions of the alpha factor, one portfolio formed on alpha magnitude, and the other on alpha significance. Charts 7-9 present the relative performance of these factor portfolios versus an equally-weighted industry group benchmark, and we list our key findings below: Chart 7The High-Dividend Factor Has Indeed Outperformed Since 2015
The High-Dividend Factor Has Indeed Outperformed Since 2015
The High-Dividend Factor Has Indeed Outperformed Since 2015
Chart 8Momentum Works Better Globally Than In The A-Share Market
Momentum Works Better Globally Than In The A-Share Market
Momentum Works Better Globally Than In The A-Share Market
Chart 9ROE And Volatility Are Clearly Persistent Factors In China
ROE And Volatility Are Clearly Persistent Factors In China
ROE And Volatility Are Clearly Persistent Factors In China
Similar to the relative performance of the MSCI factor indexes, our factor portfolios performed better for China than they did for global stocks. With the exception of high (cyclical) momentum, high ROE, and to a lesser extent smaller industry group performance, the factors did not deliver consistently positive excess returns at the global level. Ex-post alpha worked well for global industry groups until 2015, but has since retraced a significant portion of its cumulative excess relative return. Among the domestic China factor portfolios that we created, 7 out of 10 delivered a positive cumulative excess return over the period in question. Size was the worst performing factor, followed closely by short-term momentum and by HDY. Industry groups with a high dividend yield have indeed outperformed substantially since 2015 (consistent with the MSCI China A High Dividend Yield index), but when measured against an equally-weighted industry group portfolio, this outperformance merely made up for a substantial downtrend in relative performance from 2009 to 2015. Among the successful factor portfolios, two stand out as having delivered exceptional relative performance: high ROE, and low beta. Chart 10 shows the performance of a portfolio that averages the industry group weights implied by these two factors, and Table 3 presents whole-period regression results for the portfolio versus both our equally-weighted industry group benchmark and the MSCI China A index. Taken together, Chart 10 and Table 3 make it clear that the combination of high ROE and low beta factors has not only significantly outperformed over time, but has done so with lower volatility. Chart 10High ROE And Low Beta Has Been, And Probably Will Remain, A Winning Combination
High ROE And Low Beta Has Been, And Probably Will Remain, A Winning Combination
High ROE And Low Beta Has Been, And Probably Will Remain, A Winning Combination
Table 3Risk And Excess Return Analysis Of Chinese Onshore High ROE / Low Beta Factor Portfolio*
Factor Investing In The A-Share Market
Factor Investing In The A-Share Market
Investment Conclusions What conclusions can investors draw from the above analysis? In our view, there are three key takeaways. Our factor indexes confirm that ROE and low volatility are persistent factors in the A-share market. First, the persistent outperformance of several fundamental factors in China’s domestic equity market may suggest that A-shares are a less efficient market than other emerging or developed markets. However, to us, the outperformance of legitimate fundamental factors, and the underperformance (or mediocre performance) of momentum is not consistent with the idea that A-shares are a “casino” market that is purely driven by speculation. China’s domestic market is certainly more volatile than others, but we draw a sharp distinction between a stock market that frequently moves in spite of fundamentals and one that moves in an outsized fashion but in a direction that is consistent with fundamental developments. Chart 11Different “Equally-Weighted” Approaches Can Have A Huge Impact On Performance
Different "Equally-Weighted" Approaches Can Have A Huge Impact On Performance
Different "Equally-Weighted" Approaches Can Have A Huge Impact On Performance
Second, an accidental conclusion of our report is that an equally-weighted industry group approach appears to have generated persistently positive excess returns over the past decade, for both domestic China and the global equity benchmark. Chart 11 shows the extreme contrast between the official MSCI equal-weight index for All Country World (which equally weights each component stock), and our equally-weighted industry-group portfolio. Stunningly, buying the latter over the former would have generated 3% extra return per year over the past 10 years. For investors seeking increased secular exposure to the A-share market, these results simply suggest that outsized sector or industry-group weightings should be viewed with caution and avoided if possible. Third, industry groups with high return on equity have persistently outperformed their peers over the past decade, both in China and around the world. However, we think that the joint outperformance of high ROE and low beta stocks in the A-share market carries special significance, one that is linked to China’s enormous increase in corporate and household debt over the past decade. Investors who are familiar with the DuPont approach to decomposing return on equity will recall that ROE (Net Income / Equity) can be broken down into the product of profit margins (Net Income / Sales), asset turnover (Sales / Assets), and financial leverage (Asset / Equity). Since higher financial leverage tends to increase the operating risk of a firm (and thus, presumably, its stock price), and the product of profit margins and asset turnover equals return on assets (ROA), the persistent outperformance of high ROE and low beta industry groups suggest that domestic investors have been focused on buying firms with a high ROA and relatively low financial leverage. Table 4Current High ROE / Low Beta Factor Industry Group Portfolio Weights*
Factor Investing In The A-Share Market
Factor Investing In The A-Share Market
Chart 12A High ROE & Low Beta Portfolio Isn’t Cheap, But Is No More Expensive Today Than In The Past
A High ROE & Low Beta Portfolio Isn't Cheap, But Is No More Expensive Today Than In The Past
A High ROE & Low Beta Portfolio Isn't Cheap, But Is No More Expensive Today Than In The Past
This is a sensible approach, and we are comfortable recommending it to global investors who are looking to increase their secular exposure to A-shares. We are also opening a long relative position in this high ROE / low beta portfolio in our trade book today to track the call, and to provide investors with timely updates on the weights in the portfolio (currently shown in Table 4). While it is true that valuation of this portfolio today is not as attractive as it is for the value-weighted benchmark, Chart 12 highlights that this has been true for the entire sample period, and it has not prevented the substantial outperformance that we have documented. This implies that, while not necessarily widespread, some “cheap” onshore industry groups represent a value trap, rather than true value. Jonathan LaBerge, CFA Vice President Special Reports jonathanl@bcaresearch.com Footnotes 1 Please see China Investment Strategy Weekly Report, “A-Shares: Stay Neutral, For Now,” dated March 14, 2018 and “A Shaky Ladder,” dated June 13, 2018, available at cis.bcaresearch.com. 2 While Charts 2 & 3 illustrate relative price instead of total return indexes, our conclusions are generally the same even when showing the latter. Cyclical Investment Stance Equity Sector Recommendations
While the aggregate $50bn worth of Chinese goods tariffed in the first two salvos mostly targeted industrial equipment and machinery, the third installment, covering $200bn worth of imports, extended the tariffs’ reach to consumer products. Major categories…
Analysis on central Europe and Pakistan is published below. Highlights There are several reasons why Chinese authorities will likely allow the yuan to depreciate 6-8% from current levels in the coming months. RMB depreciation will weigh not only on emerging Asian but also on other EM currencies via several channels. We continue to recommend shorting a basket of the following currencies versus the U.S. dollar: ZAR, CLP, COP, IDR, MYR, PHP and KRW. Feature Chinese authorities will likely allow the yuan to fall 6-8% vis-à-vis the U.S. dollar from current levels in the coming months. The value of the RMB holds the key to the broader trend in EM currencies. In turn, dynamics in EM exchange rates typically define the trajectory for EM asset classes: stocks, credit spreads and local currency bonds. Odds are that the RMB along with other emerging Asian currencies will continue to depreciate (Chart I-1). There are several reasons why Chinese authorities will likely allow the yuan to fall 6-8% vis-à-vis the U.S. dollar from current levels in the coming months. Chart I-1Emerging Asian Currency Index
Emerging Asian Currency Index
Emerging Asian Currency Index
Chart I-2Deflating Export Prices Herald Currency Depreciation
bca.ems_wr_2019_05_23_s1_c2
bca.ems_wr_2019_05_23_s1_c2
First, currency depreciation will help mitigate the impact of U.S. import tariffs. With global trade volumes shrinking and U.S. import prices from China deflating (Chart I-2, top panel), China will benefit from a cheaper currency. Second, RMB devaluation goes against the Trump’s administration’s preference. The U.S.-China trade talks have flopped, and both sides seem to be jockeying to better position themselves ahead of another round of discussions. From a negotiation strategy perspective, it makes sense for China to devalue the yuan before a new round of negotiations starts again. Third, China needs lower interest rates to reduce the strain on numerous debtors. However, narrowing interest rate differential with the U.S. has often coincided with periods of RMB depreciation over the past nine years (Chart I-3). Chart I-3CNY/USD And Interest Rate Differential
CNY/USD And Interest Rate Differential
CNY/USD And Interest Rate Differential
One reason why policymakers in China were previously reluctant to explore RMB/USD depreciation beyond the 7 mark was due to the risk of rampant capital exodus and a potential spike in financial market volatility. In other words, authorities were mindful that even mild and controlled depreciation could spiral out of control. However, with Chinese nationalistic rhetoric on the rise and the nation rallying around the flag, authorities now have more room to maneuver. They will not have a problem restricting capital outflows by residents, and there will be little general public dissatisfaction with a devaluation. Finally, at around $3 trillion, the central bank’s foreign exchange reserves are equivalent to only 14% of all yuan deposits, and 11% of broad money (M2) supply. In turn, the overhang of local currency money supply will exert structural downward pressure on the renminbi’s exchange rate in the coming years. This may be a convenient time to release some proverbial air out of the balloon – namely, the lingering money bubble in China – by devaluing the yuan. Bottom Line: The path of least resistance for the RMB is down. EM Currencies Are In Danger In recent months, we have been highlighting that the Korean won has been at a critical technical juncture and has broken down (Chart I-4, top panel). The Taiwanese and Singaporean dollars seem to be the next shoes to drop (Chart I-4, middle and bottom panels). Chart I-4
Tapering Wedge Patterns
Tapering Wedge Patterns
Chart I-5No Recovery In Asian Exports So Far
No Recovery In Asian Exports So Far
No Recovery In Asian Exports So Far
U.S. import prices from various Asian countries are deflating, as shown in the bottom panel of Chart 2 on page 2. This typically warrants currency depreciation to mitigate the impact of export price deflation on national producers. Furthermore, emerging Asian exports are still shrinking, as evidenced by the latest trade numbers. Korea’s total exports for the first 20 days of May and Taiwan’s exports of electronics parts as of April are still contracting at a rapid pace (Chart I-5). The latter leads cyclical turning points in global trade by a couple of months. Finally, the RMB is the anchor currency in emerging Asia, and its depreciation will filter through the exchange rates of other regional, export-dependent economies. Regarding other EM currencies, they are also at risk of Chinese yuan depreciation. Apart from manufacturing sector competitiveness (discussed above), China’s exchange rate affects other economies in two distinct ways: Less Chinese imports: An RMB devaluation reduces the amount of China’s U.S. dollar inflows/payments to its trade partners (Chart I-6). Many EM and some DM currencies will be negatively affected since China is a major source of demand for these economies. Less capital outflows from China: RMB depreciation will likely be accompanied with heightened controls over capital outflows from China. In fact, various proxies for capital flight out of the mainland suggest the authorities have already substantially clamped down on outflows (Chart I-7). Economies that have profited from capital flight from China over the years are already feeling pain. For example, relapsing Australian property prices can be attributed to reduced capital flows from China. Chart I-6Chinese Imports In RMB And USD
Chinese Imports In RMB And USD
Chinese Imports In RMB And USD
Chart I-7China: Reduced Capital Flight
China: Reduced Capital Flight
China: Reduced Capital Flight
Likewise, there will be a period of painful adjustment in many emerging economies in Asia and elsewhere that have profited from Chinese capital flows – both via official and non-official channels. Bottom Line: RMB depreciation will affect various currencies via diverse channels: (1) deteriorating export competitiveness for manufacturing-based economies; (2) diminished mainland imports from China’s trade partners; and (3) reduced capital flows from China to economies that have typically relied on Chinese capital flows. The U.S. Dollar: A Review Of The Indicators We believe that the cyclical and structural backdrops remain favorable for the dollar, and that it will likely overshoot before a major top sets in. The U.S. dollar bull market is extended, but that does not mean it is over. Odds are that the greenback will overshoot before making a major top. In our last weekly report, we revisited currency valuations and found the dollar to be only moderately (one standard deviation) expensive, according to the real effective exchange rate based on unit labor costs. The latter is our favored currency valuation metric. The greenback has been in a major structural bull market since 2011. Secular bull/bear markets do not typically end before valuations reach 1.5-2 standard deviations. We believe that the cyclical and structural backdrops remain favorable for the dollar, and that it will likely overshoot before a major top sets in. Chart I-8U.S. Equity And Economic Outperformance Warrants Dollar Appreciation
U.S. Equity And Economic Outperformance Warrants Dollar Appreciation
U.S. Equity And Economic Outperformance Warrants Dollar Appreciation
U.S. stocks are outperforming the rest of the world in local currency terms, not only based on market-cap equity benchmarks but also when measured using equal-weighted equity indexes (Chart I-8). This signals that return on capital is higher in the U.S. relative to the rest of the world. The latter has historically been positively related with the primary trend in the trade-weighted dollar (Chart I-8). The U.S. dollar currently offers an attractive yield relative to many of its peers. Chart I-9 illustrates the interest rate (3-month swap rate) differentials between the dollar and various EM and DM currencies. For each individual exchange rate, the bar denotes the U.S. interest rate spread over other markets, and the dot is the mean of this spread over the past 20 years. Not only is the current interest rate differential in favor of the greenback in the case of many currencies, but the spread is well above its 20-year mean for virtually all of the currencies included in Chart I-9. The sole exception is the Mexican peso – the latter’s current interest rate differential versus the U.S. is wider than its 20-year mean. In fact, the peso is among our most preferable EM currencies.
Chart I-9
The U.S. dollar currently offers an attractive yield relative to many of its peers. Bottom Line: Odds are in favor of a U.S. dollar overshoot, especially versus cyclical currencies such as EM and commodities-based ones. We continue to recommend shorting a basket of the following currencies versus the U.S. dollar: ZAR, CLP, COP, IDR, MYR, PHP and KRW. We are also structurally short the RMB versus the dollar. For investors who are looking for currencies with the least downside versus the U.S. dollar, our picks are MXN, RUB, THB, TWD, SGD and central European currencies. EM Credit Markets And Domestic Bonds: It’s All About Exchange Rates From a macro perspective, EM dollar-denominated and local currency bonds are primarily driven by exchange rates. EM sovereign spreads are very sensitive to both EM exchange rates and industrial metals prices (Chart I-10). The latter two are primarily driven by global trade cycles in general and China’s growth in particular. EM corporate spreads have been less sensitive to EM exchange rates. Yet they are unlikely to defy a major down-leg in EM currencies. The basis is as follows: when currencies depreciate, foreign-currency debt becomes more expensive to service warranting a period of wider credit spreads. Exchange rate fluctuations account for the bulk of domestic bonds’ total returns for foreign investors. We discussed this topic in our report titled Asset Allocation For EM Assets. Chart 11 shows the total return indexes in dollars and euros for the EM GBI local currency government bond index. Euro-based investors have fared much better than dollar-based ones. The euro’s depreciation versus the dollar explains this gap. However, from a technical point of view, total return in euros is facing a major resistance level (Chart I-11, bottom panel). European investors should take note. Chart I-10EM Sovereign Spreads Correlate With EM Currencies And Commodities
EM Sovereign Spreads Correlate With EM Currencies And Commodities
EM Sovereign Spreads Correlate With EM Currencies And Commodities
Chart I-11Total Returns on EM Local Bonds In USD And Euros
Total Returns on EM Local Bonds In USD And Euros
Total Returns on EM Local Bonds In USD And Euros
Arthur Budaghyan Chief Emerging Markets Strategist arthurb@bcaresearch.com Continue Favoring Central Europe Within EM Equities: An overweight position in Central European (CE) equities within an EM equity portfolio is still warranted due to the following reasons: First, CE economies are the least exposed to a Chinese and global trade slowdown - the main causes of the EM selloff. Even though these economies are leveraged to German and euro area manufacturing - both of which are currently weak - they have little direct exposure to China and commodities. Second, currency trends are critical for the relative performance of equities. We expect EM currencies will depreciate versus the euro and against CE currencies. This argues in favor of CE stocks within an EM portfolio. Third, CE domestic demand remains strong and private credit growth robust (Chart II-1). Additionally, the authorities are maintaining a loose fiscal policy stance. As to European equity portfolios, we recommend underweighting CE bourses versus the core European markets. Chart II-2 illustrates that when EM equities underperform DM ones, CE share prices lag behind euro area stocks. Chart II-1Private Credit Growth Is Robust
Private Credit Growth Is Robust
Private Credit Growth Is Robust
Chart II-2CE Underperforms Core Europe When EM Underperforms DM
CE Underperforms Core Europe When EM Underperforms DM
CE Underperforms Core Europe When EM Underperforms DM
Currencies and Fixed-Income Markets: CE growth outperformance relative to EM suggests that CE exchange rates will outperform the majority of EM currencies. Critically, odds are that the euro has made a major bottom versus most EM currencies. This will facilitate CE exchange rate appreciation versus many other EM currencies. The latter warrants overweighting CE fixed-income markets against respective EM benchmarks. Currency Trades: Today we recommend closing our long CZK / short euro position. This trade has generated a 4.4% gain since September 28, 2016 with extremely low volatility. The basis for closing this position is there are signs that Czech growth and labor market tightness are peaking, warranting an end to rate hikes. Specifically, both economic activity and wage growth are slowing. This will lead the central bank to halt its rate hikes. Instead, we are opening a new trade: Go long CZK versus an equal-weighted basket of PLN and HUF. For the first time, Czech short rates have risen above those in Poland and Hungary (Chart II-3). This will be a major driver for Czech koruna appreciation against the other two currencies. The PLN and HUF will underperform the CZK because their monetary and fiscal policies are much easier than is currently warranted. Chart II-3Czech Interest Rate Differentials Versus Hungary And Poland Are Positive
Czech Interest Rate Differentials Versus Hungary And Poland Are Positive
Czech Interest Rate Differentials Versus Hungary And Poland Are Positive
Chart II-4Trade Balances Favor CZK vs HUF & PLN
Trade Balances Favor CZK vs HUF & PLN
Trade Balances Favor CZK vs HUF & PLN
The Hungarian central bank will launch its corporate QE program in July 2019 with a total of HUF 300 billion in corporate bond purchases. This will likely weigh on the HUF as the central bank monetizes some of the country’s outstanding corporate debt. Additionally, the Polish government has announced large fiscal stimulus ahead of this year’s elections. The fiscal deficit is projected to widen from 1% currently to 2% of GDP by 2020. Finally, trade balances in Poland and Hungary are deteriorating while the Czech Republic is running a large trade surplus (Chart II-4). Bottom Line: Continue overweighting CE within both EM equity and local currency bond portfolios. We are taking profits on our long CZK / short the euro trade and initiating a new position: Long CZK / short an equal-weighted basket of HUF and PLN. Andrija Vesic, Research Analyst andrijav@bcaresearch.com Pakistan: No Pain, No Gain Pakistan’s economy and stock market are currently going through painful but necessary adjustments. The country has been suffering from a severe balance-of-payment crisis. Its exchange rate has already depreciated by 30% versus the U.S. dollar since December 2017. Its stock market in U.S. dollar terms has plunged 55% from its May 2017 peak. A bottom in the stock market is likely to occur when the currency stabilizes. Odds are that the Pakistani rupee is in its late phase of adjustment (Chart III-1). First, a US$ 6 billion worth IMF bailout fund is on its way. The country reached a staff-level agreement with the IMF on May 12. The IMF will release the funds in phases over a period of 39 months. Meanwhile, Pakistan will likely also receive US$ 2-3 billion from the World Bank and the Asian Development Bank (ADB) in the next three years. Altogether, multilateral financing will amount to about US$3 billion per year over the next three years. The country will also likely continue its bi-lateral borrowings from China, Saudi Arabia and the UAE. Last year, about US$10 billion of external borrowing and a nearly US$7 billion reduction in the central bank’s foreign reserves helped fund the US$18 billion current account deficit. Over the next 12 months, we expect the financing needs to be considerably smaller due to shrinking twin deficits (Chart III-2). Chart III-1Pakistan's Rupee: Close To A Bottom?
Pakistan's Rupee: Close To A Bottom?
Pakistan's Rupee: Close To A Bottom?
Chart III-2Twin Deficits Are Likely To Shrink
Twin Deficits Are Likely To Shrink
Twin Deficits Are Likely To Shrink
Both trade and current account balances have started showing improvement in U.S. dollar terms due to a steep contraction in imports. Going forward, we expect export growth to turn positive on the back of currency devaluation but import contraction will deepen. Lastly, the IMF agreement might allow Pakistan to issue some Eurobonds while higher local rates might attract some foreign portfolio capital. Second, Pakistan’s top leadership has cooperated with the IMF. Just earlier this month IMF economist Reza Baqir was appointed the new central bank governor. In addition, the Finance Minister and the Federal Bureau of Revenue chairman have been replaced. These new appointments increase the odds that the IMF program will be enforced in Pakistan. Indeed, after only two weeks on the job the new central bank governor raised the policy rate this Monday by 150 basis points to 12.25%. Meanwhile, significant fiscal consolidation is on the way, as the new policymakers will be committed to the IMF program. The budget for the next fiscal year (June 2019 – May 2020), which will be presented in Parliament on May 24, will likely show a considerable reduction in non-interest expenditures. Finally, the IMF is also pushing for increased central bank independence. In the last 17 months, the central bank purchased massive amounts of government securities – a de facto monetization of public debt. This has exacerbated domestic inflation and currency depreciation. So long as the country is under the IMF program, it is reasonable to expect no public debt monetization. In summary, the ongoing substantial monetary and fiscal tightening and accompanying reduction in the twin deficits, coupled with the increased availability of foreign funding are positive for the exchange rate. It is possible that Pakistan will follow the 2016-2017 Egyptian roadmap. Egypt experienced a severe balance-of-payment crisis and agreed to a similar IMF bailout program. In the case of Egypt, a 55% depreciation in its currency in late 2016 was followed by a 77% rally in share prices in U.S. dollar terms over the subsequent 18 months (Chart III-3). We are putting Pakistani stocks on our upgrade watch list. We are reluctant to upgrade it now because currency weakness might persist for a couple of months. Further, monetary and fiscal tightening will amplify the economic downturn weighing on corporate earnings. Banks’ NPL ratios and provisions will likely rise considerably. Chart III-3The 2016-2017 Egyptian Roadmap
The 2016-2017 Egyptian Roadmap
The 2016-2017 Egyptian Roadmap
Chart III-4Pakistani Equities: A Long-Term Profile
Pakistani Equities: A Long-Term Profile
Pakistani Equities: A Long-Term Profile
Bottom Line: We are putting Pakistani equities on an upgrade watch list. This bourse’s technicals are becoming interesting – it might bottom at its previous highs (Chart III-4). In addition, both absolute and relative valuations of Pakistani stocks appear attractive (Charts III-5 & Chart III-6). Chart III-5Equity Valuations Look Attractive
Equity Valuations Look Attractive
Equity Valuations Look Attractive
Chart III-6Relative Equity Valuations Also Look Attractive
Relative Equity Valuations Also Look Attractive
Relative Equity Valuations Also Look Attractive
We are waiting for share prices and the currency to stabilize before recommending an overweight position in Pakistani equities. Ellen JingYuan He, Associate Vice President ellenj@bcaresearch.com Footnotes Equity Recommendations Fixed-Income, Credit And Currency Recommendations
Indeed, the escalation of the trade war brings into focus two long-running Geopolitical Strategy themes: Sino-American Conflict: U.S. and Chinese exports to each other have already sharply fallen off. Trade is interconnected so this will further depress…
Highlights Duration: We see current bond market behavior as very similar to mid-2016, when heightened political uncertainty obscured the economy’s true strength and kept bond yields lower for longer than was justified by the economic fundamentals. The correct strategy at that time was to sell into the bond market’s strength, and we advocate a similar strategy today. China: Any attempt by the Chinese government to retaliate in the trade war by selling U.S. Treasury securities would be either self-defeating or ineffective, depending on the exact strategy employed. In either case, U.S. Treasury yields will be unaffected. Fed: At least part of the Fed’s dovish turn might represent a desire to send the labor share of national income higher. We introduce a new data series for Fed Watchers to track. Feature The Trump Administration fired the latest salvo in the trade war two weeks ago, expanding tariffs to a broader swathe of Chinese imports. Then last week, the escalation of tensions spilled over to the bond market, sending global yields abruptly lower. Chart 1Flight To Safety
Flight To Safety
Flight To Safety
The 10-year U.S. Treasury yield bounced off 2.35% last Thursday and has since settled at 2.39% (Chart 1). Meanwhile, the overnight index swap curve is now priced for 44 bps of Fed rate cuts over the next 12 months (Chart 1, bottom panel). It is possible, and even likely, that geopolitical tensions will keep yields low during the next month or two. In fact, our Geopolitical Strategy service places the odds of a complete breakdown in trade negotiations by the end of June at 50%.1 But we would encourage investors to sell into rallies, positioning for higher yields on a 6-12 month horizon. To see why, we return to a Weekly Report from early April where we walked through different factors that would be useful in the creation of a macroeconomic model for the 10-year U.S. Treasury yield.2 We consider what has changed during the past six weeks and what those developments mean for bond yields going forward. Back In The Bond Kitchen In early April, we ran through four different factors that should be included in any bond model and suggested macroeconomic indicators that best capture the trends in each. The four factors are: Global Growth: Best proxied by the Global Manufacturing PMI and Bullish Dollar Sentiment Policy Uncertainty: Best proxied by the Global Economic Policy Uncertainty Index Output Gap: Best proxied by Average Hourly Earnings Sentiment: Best proxied by the U.S. Economic Surprise Index We consider each factor in turn. Global Growth Chart 2Monitoring Global Growth
Monitoring Global Growth
Monitoring Global Growth
The Global Manufacturing PMI, our preferred series for tracking global growth, ticked down during the past month, continuing the free-fall that has been in place since the end of 2017 (Chart 2). At 50.3, it is now only slightly above the 50 boom/bust line and is close to where it was in mid-2016, when the 10-year yield hit its cyclical low. But on a positive note, several leading indicators have hooked up in recent months, suggesting that the Global PMI could soon trough and move higher in the second half of the year. Specifically, the ZEW survey of global economic sentiment is off its lows, as is the BCA Global Leading Economic Indicator (LEI). Meanwhile, the Global LEI Diffusion Index has surged, indicating that 74% of the 23 countries in our sample are seeing improvement in their LEIs. Historically, the Global LEI Diffusion Index leads changes in both the Global LEI and the Global Manufacturing PMI (Chart 2, panel 3). Financial market prices that are highly geared to global growth had been singing a similar tune, but they rolled over as trade tensions flared during the past two weeks. For example, cyclical equity sectors recently started to underperform defensive sectors (Chart 2, bottom panel), and the important CRB Raw Industrials index took a nosedive. We place particular importance on the CRB Raw Industrials index as a timely indicator of global growth, because the ratio between the CRB index and gold correlates nicely with the 10-year Treasury yield (Chart 3).3 Unsurprisingly, the ratio’s recent dip coincides with last week’s drop in the 10-year. Several leading indicators have hooked up in recent months, suggesting that the Global PMI could soon trough and move higher in the second half of the year. In addition to the Global Manufacturing PMI, we recommend including a survey of bullish sentiment toward the U.S. dollar in any bond model. More bullish dollar sentiment coincides with lower Treasury yields, and vice-versa. Our preferred survey shows that dollar sentiment remains elevated, but hasn’t changed much since April (Chart 4). The dollar itself, however, has begun to appreciate during the past two weeks (Chart 4, bottom panel). Chart 3A Falling CRB/Gold Ratio...
A Falling CRB/Gold Ratio...
A Falling CRB/Gold Ratio...
Chart 4...And The Greenback Is On The Rise
...And The Greenback Is On The Rise
...And The Greenback Is On The Rise
Bottom Line: The coincident global growth indicators that correlate best with bond yields – the Global Manufacturing PMI and Dollar Bullish Sentiment – are sending a similar message as in April. Meanwhile, leading economic indicators continue to suggest that we should expect improvement in the second half of the year. The biggest change from April is that global growth indicators derived from financial market prices – cyclical versus defensive equities, the CRB Raw Industrials index and the trade-weighted dollar – have responded negatively to heightened political risk. If this weakness persists and eventually infects the economic data, then it could prevent a second-half rebound in global growth, keeping Treasury yields low for even longer. Policy Uncertainty Spikes in the monthly Global Economic Policy Uncertainty Index often cause capital to seek out the safety of U.S. Treasuries, and we recommend including this index in any macroeconomic bond model (Chart 5A). Spikes in the monthly Global Economic Policy Uncertainty Index often cause capital to seek out the safety of U.S. Treasuries. While there have been no updates to the monthly index since the trade war’s recent escalation, one of its components – a daily index that tracks the number of relevant news stories – has surged during the past two weeks (Chart 5B). This clearly illustrates that a sharp increase in political uncertainty has been the catalyst for the bond market rally. Investors are obviously concerned that an ongoing and intensifying trade war might derail the economic recovery, and they are seeking out Treasuries as a hedge. Chart 5AGlobal Uncertainty Set To Spike
Global Uncertainty Set To Spike
Global Uncertainty Set To Spike
Chart 5BMarkets Are Concerned
Markets Are Concerned
Markets Are Concerned
In such situations, the traditional playbook is to fade any purely uncertainty-driven rally, on the view that markets tend to overreact to headline risk. This strategy worked well following the mid-2016 Brexit vote. The uncertainty shock from the vote sent the 10-year quickly down to 1.37%, but it then increased in the second half of the year when it became apparent that the economic recovery would continue. While higher tariffs will certainly be a drag on growth going forward, accommodative Fed policy and a probable increase in Chinese economic stimulus will mitigate the impact, keeping the economic recovery intact.4 Output Gap Chart 6Wages Are Headed Higher
Wages Are Headed Higher
Wages Are Headed Higher
The output gap is a concept that represents where the economy is operating relative to its peak capacity, and its progress during the past three years is the main reason why bond yields will not re-test 2016 lows. We have found that wage growth is the most reliable way to measure the output gap: higher wage growth signals less spare capacity, and less spare capacity coincides with higher bond yields. We recommend Average Hourly Earnings as the best wage measure to include in any bond model. Since April, average hourly earnings growth has been roughly flat, but leading indicators suggest that further acceleration is highly likely in the coming months (Chart 6). While the Fed is keen to let wage growth accelerate, rising wage growth also makes a rate cut difficult to justify. The combination of rising wage growth and an on-hold Fed should put a rising floor under long-maturity bond yields. Sentiment The final factor that should be included in any bond model is sentiment. In April, we suggested that the U.S. Economic Surprise Index is the best measure of sentiment. When the surprise index has been deeply negative for a long time, it usually means that investors are downbeat on the economy and that the bar for a positive surprise is low. This has actually been the case in recent months, and our simple auto-regressive model suggests that the surprise index is biased higher (Chart 7). Positioning data confirm this message, and in fact show that investors are taking as much duration risk as they were when yields troughed in mid-2016 (Chart 8). Chart 7Low Bar For Positive Surprises
Low Bar For Positive Surprises
Low Bar For Positive Surprises
Chart 8Similar Positioning As In Mid-2016
Similar Positioning As In Mid-2016
Similar Positioning As In Mid-2016
The overall message is that bond investors have a very dim view of the economy, and it will not take much positive news to send yields higher. Investment Strategy We see current bond market behavior as very similar to mid-2016, when heightened political uncertainty obscured the economy’s true strength and kept bond yields lower for longer than was justified by the economic fundamentals. The correct strategy at that time was to sell into the bond market’s strength, and we advocate a similar strategy today. Timing when the next move higher in bond yields will occur is difficult, but we take some comfort in the fact that the flatness of the yield curve makes it less costly than usual to carry below-benchmark duration positions. In fact, the average yield on the Bloomberg Barclays Cash index is 7 bps higher than the average yield on the Bloomberg Barclays Treasury Master Index. Bond investors have a very dim view of the economy, and it will not take much positive news to send yields higher. To further mitigate the cost of keeping duration low, we advocate taking duration-neutral positions that are short the belly (5-year & 7-year) part of the yield curve and long the very long and very short ends of the curve. Such trades are also provide a positive yield pick-up, and will earn capital gains when Treasury yields move higher.5 A Quick Note On China’s Treasury Purchases Chart 9Do Not Expect Treasuries To Be Used As A Weapon In This War
Do Not Expect Treasuries To Be Used As A Weapon In This War
Do Not Expect Treasuries To Be Used As A Weapon In This War
The trade war’s recent escalation has led some to speculate that China could retaliate against higher tariffs by dumping U.S. Treasury securities onto the open market. The speculation only increased when the TIC data revealed that Chinese net Treasury purchases totaled -$24 billion in March, the most deeply negative figure since October 2016 (Chart 9). We see low odds that China will employ this tactic in the trade war, and no meaningful impact on Treasury yields in any case. To see why, let’s consider two possible scenarios. In the first scenario, China sells a large amount of U.S. Treasury securities and keeps the proceeds from the sales in its domestic currency. Assuming the amounts in question are sufficiently large, these transactions would cause the RMB to appreciate and lead to a tightening of Chinese monetary conditions. Tighter monetary conditions are exactly what the Chinese government does not want as it seeks to counteract the negative economic impact from tariffs. In fact, China is much more likely to engineer a further easing of monetary conditions, much like in 2015/16 (Chart 9, bottom panel). In the second scenario, China could sell U.S. Treasuries and purchase other foreign bonds (German bunds, for example). This would nullify any impact on Chinese monetary conditions, but it would not have much impact on U.S. Treasury yields. With Chinese money still flowing into global bond markets, the re-balancing would only push other investors out of non-U.S. bond markets and into U.S. Treasuries. Without changing the overall demand for global bonds, it is difficult to envision much of an impact on U.S. yields. Bottom Line: Any attempt by the Chinese government to retaliate in the trade war by selling U.S. Treasury securities would be either self-defeating or ineffective, depending on the exact strategy employed. In either case, U.S. Treasury yields will be unaffected. A New Data Series For Fed Watchers: Rich’s Ratio A number of recent Fed speeches have referred to the time series plotted in Chart 10: The share of national income going to labor, as opposed to corporate profits. Chart 10Introducing Rich's Ratio
Introducing Rich's Ratio
Introducing Rich's Ratio
Vice-Chair Richard Clarida brought this analysis to the Fed, and the data series was actually once dubbed “Rich’s Ratio” by Clarida’s old PIMCO colleague Paul McCulley. The idea behind Rich’s Ratio is that while some late-cycle wage gains are passed through to prices, a portion also eat into corporate profits. Notice in Chart 10 that Rich’s Ratio has a tendency to rise late in the economic recovery. Based on his past writings, we would not be surprised if at least part of the Fed’s recent dovish turn represents a desire to send Rich’s Ratio higher, even if that goal might entail a modest overshoot of the Fed's 2 percent inflation target. We will have more to say about Rich’s Ratio in the coming weeks. For now, we simply want to make Fed Watchers aware that they have a new series to track. Stay tuned. Ryan Swift, U.S. Bond Strategist rswift@bcaresearch.com Footnotes 1 Please see Geopolitical Strategy Weekly Report, “How Trump Became A War President”, dated May 17, 2019, available at gps.bcaresearch.com 2 Please see U.S. Bond Strategy Weekly Report, “Bond Kitchen”, dated April 9, 2019, available at usbs.bcaresearch.com 3 The rationale for why the CRB/Gold ratio tracks the 10-year Treasury yield is found in U.S. Bond Strategy Weekly Report, “The Search For Aaa Spread”, dated March 12, 2019, available at usbs.bcaresearch.com 4 Please see Global Investment Strategy Weekly Report, “Tarrified”, dated May 16, 2019, available at gis.bcaresearch.com 5 Please see U.S. Bond Strategy Weekly Report, “Paid To Wait”, dated February 26, 2019, available at usbs.bcaresearch.com Fixed Income Sector Performance Recommended Portfolio Specification
Highlights We’ve searched in vain for imminent domestic weakness in the U.S. economy, … : Much of our work this spring has focused on trying to poke holes in our view that the equilibrium fed funds rate remains above the target fed funds rate, but we haven’t found any evidence of overheating in the real economy, or worrisome excesses in financial markets. … but an exogenous shock could well precipitate a recession if it were serious enough: The U.S. is a comparatively closed economy, but there’s no such thing as full-on decoupling. The U.S. may react more slowly than other major economies to what’s going on in the rest of the world, but it’s not immune to it. A trade war would threaten global growth, … : U.S.-China trade negotiations have taken center stage over the last couple weeks, and escalating tension between the world’s two largest standalone economies will surely cast a pall over the global outlook. … but there are other potential threats that bear monitoring: Tensions with Iran could be the catalyst for an oil price shock, while a significant rollback of globalization could crimp corporate profit margins. Either would hasten the end of the equity bull market and the expansion. Feature Tight monetary policy is a necessary, if not sufficient, condition for a recession. We deem policy to be tight if the fed funds rate exceeds our estimate of the equilibrium fed funds rate, and easy if it is below our estimate of equilibrium. Over the six decades for which we compute an estimate of the equilibrium fed funds rate, the U.S. has only ever experienced recessions when the fed funds rate has exceeded our estimate of equilibrium (Chart 1). Tight policy isn’t always tantamount to a recession – nothing came of tight settings in 1984 or 1995 – but recessions don’t occur without it. Chart 1Recessions Only Occur When Monetary Conditions Are Tight
Recessions Only Occur When Monetary Conditions Are Tight
Recessions Only Occur When Monetary Conditions Are Tight
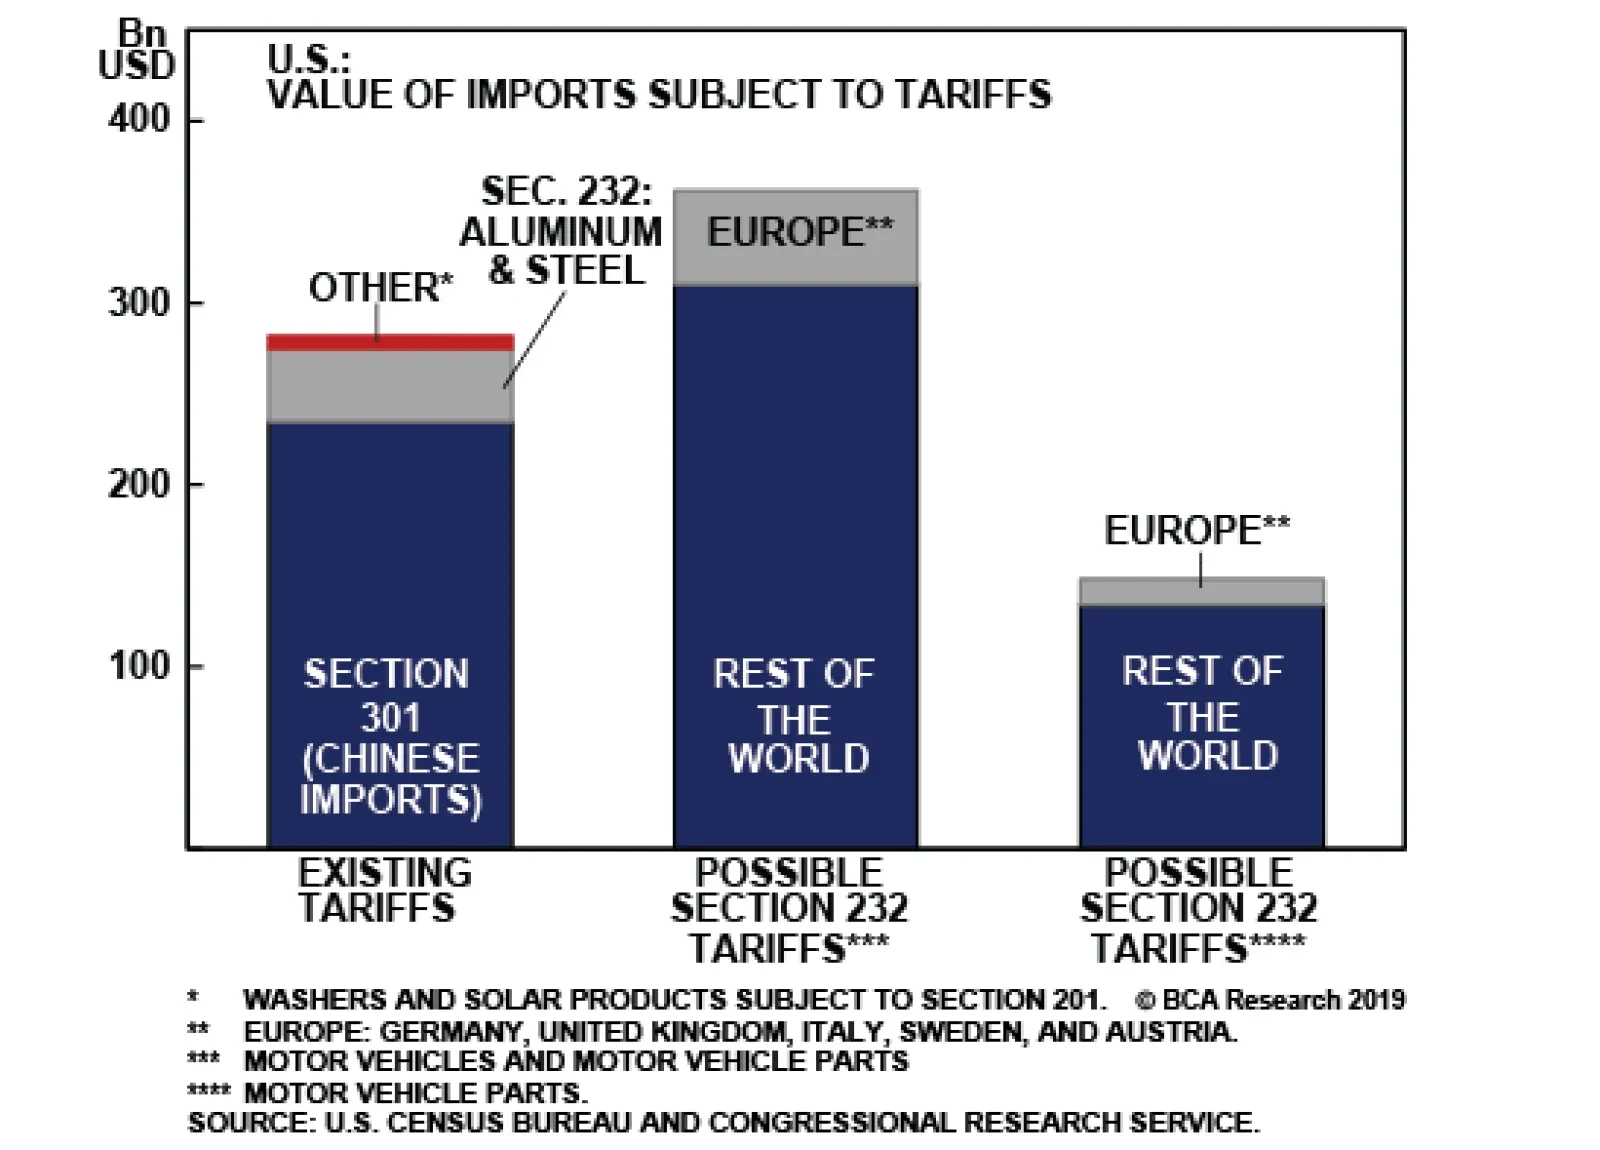
We currently estimate that the equilibrium fed funds rate, a.k.a. the neutral rate, is about 3⅛%, and we continue to project that it will be around 3⅜% by the end of the year. Those estimates leave the Fed with plenty of headroom before it materially slows the economy. If our estimate is on the money, it will take four more rate hikes to induce an inflection in the business cycle. We have not seen anything in the ongoing flow of macro data, or evidence of excesses in the financial markets, that would suggest a recession is already under way or is lurking around the corner. Internal dynamics should continue to support the expansion, but threats from outside the U.S. are growing. We therefore conclude that the next recession may well not arrive for another two years, in the absence of a significantly adverse exogenous event. This week, we extend our focus beyond the U.S. to try to uncover the external threats that could stop the U.S. economy, and the bull markets in risk assets, in their tracks. Beyond the tariff fireworks, we also contemplate the possibility that conflict with Iran could lead to an oil price shock, and the impact of a significant rollback of globalization. It is not our base case that any of the various external threats will tip the U.S. into a recession, but investors should keep tabs on the biggest ones. Tariffs The U.S.-China trade saga has unfolded in three pairs of moves and counter-moves (Diagram 1). While the aggregate $50bn worth of Chinese goods tariffed in the first two salvos mostly targeted industrial equipment and machinery, the third installment, covering $200bn worth of imports, extended the tariffs’ reach to consumer products. Major categories included not only commodities such as base metals, chemical products and mineral fuels and oils, but also a broad swath of foods, textiles, electronics, vehicles and spare parts. After a three-month cease-fire, the developments of the last two weeks arguably marked the most significant escalation of tensions on both sides. The U.S. is now threatening to levy tariffs on the remaining $325bn of Chinese goods that have so far been spared. Diagram 1Anything You Can Do
External Threats
External Threats
Our colleagues at BCA’s Geopolitical Strategy service suggest that recent foreign policy initiatives indicate that the White House does not feel any particular pressure to minimize economic risk this far ahead of the election. The risk of market-disruptive measures has therefore increased, and they see a 50-50 chance that the U.S. and China will fail to reach an accord (Table 1). Although the administration has delayed any action on autos and auto parts for now, Europe could be the next trade partner in its cross hairs. The odds that Section 232 (national-security-threat) tariffs will be levied on European auto imports is rising (Chart 2). Table 1U.S.-China Trade War: Probabilities Of A Deal By End Of June 2019
External Threats
External Threats
Chart 2
These heightened trade tensions may delay the global growth recovery that we were expecting to bloom in the summer, and they may also allow the dollar to keep advancing. The greenback is a countercyclical currency, moving inversely with global activity (Chart 3), and a bump in the road for global growth would likely extend its upward run. Chart 3The Countercyclical Dollar
The Countercyclical Dollar
The Countercyclical Dollar
Although a strong dollar would be a headwind for exporters, the U.S. economy is comparatively closed. Tariffs are likely to exert the greatest pressure on the economy via softer consumption and investment. So far, the available evidence suggests that U.S. consumers and corporations have borne the brunt of higher tariffs in the form of higher retail prices and lower profit margins.1 Iran Our geopolitical strategists contend that investors have underrated conflict with Iran as a market risk for a while. Now that the contentiousness of U.S.-Iran relations has ratcheted higher upon the administration’s decision not to extend the import waivers on Iranian oil, the issue is back in the spotlight. Our strategists caution that managing the dispute may require more delicacy than the more hawkish elements of the administration realize. In their view, the potential for a misstep increases the odds of a recession and poses a significant risk to the equity bull market. In a joint Special Report by our Commodity and Energy Strategy and Geopolitical Strategy services at the beginning of the month, our in-house experts stressed that there are multiple moving parts driving the supply-demand balance in the global oil market.2 Investors should realize that the world faces the prospect of the loss of Venezuelan production (approximately 600,000 barrels per day (b/d)) and significant outages in Libya (~600,000 to 800,000 b/d), in addition to our strategists’ base-case estimate of 700,000 b/d from Iran’s current 1.3 million b/d output. BCA does not expect that all of that output will be lost, but the key point is that Iran is not the only potential source of a supply shortfall. Our energy strategists believe that OPEC 2.0 – the producer coalition led by Saudi Arabia and Russia, and supported by Saudi Arabia’s OPEC allies – has the capacity to make up for even their larger shortfall scenarios (Chart 4). The problem is that OPEC 2.0 may not have the will to do so in a timely fashion. Saudi Arabia and the rest of the OPEC 2.0 coalition were caught completely off guard by the administration’s issuance of import waivers in November, after they had ramped up production at its request to limit the market disruptions that would have ensued when Iran’s output was taken off the market. The last-minute waiver decision caused oil prices to crater in the wake of a supply glut that OPEC 2.0 has been working to sop up ever since (Chart 5).
Chart 4
Chart 5... But The Oil Market Is Pretty Tight
... But The Oil Market Is Pretty Tight
... But The Oil Market Is Pretty Tight
OPEC 2.0’s members may feel that they were badly used last fall, and may not be inclined to move proactively now. Russia is managing its own low-grade conflict with the U.S., and all of the coalition should bear in mind that the U.S. could release over a million b/d from its Strategic Petroleum Reserve (SPR) for a solid six to nine months, according to our energy team’s estimates. If rising oil prices are often viewed as a tax on American consumers, a late summer/early fall release of holdings could be viewed as an election rebate, courtesy of the skilled economic managers in the White House. Our team expects that OPEC 2.0 will likely guard against an oversupply-driven swoon in oil prices by managing its production on something akin to a just-in-time inventory strategy. Our energy and geopolitical strategists caution that there are two other ways the administration may overplay its hand. First, it might overestimate U.S. shale drillers’ ability to export their production. While new pipeline construction will relieve the transportation bottleneck limiting the Permian Basin output that reaches the Gulf of Mexico, oil exports from the Gulf are limited by a shortage of deep-water harbor facilities. If global trade tensions do worsen, both the dollar and U.S. equities may attract safe-haven flows. There is also the possibility that Iran might strike at Iraq, putting some of its 3.5 million b/d output at risk. It could also make good on its repeated threat to close the Straits of Hormuz, through which nearly a fifth of global oil supplies travel daily. Either of these options would dramatically escalate the conflict, but a desperate Iran might pursue them if it felt cornered. The bottom line is that the probability of an oil price shock is not negligible. Brinkmanship with Iran could upset a delicate supply-demand balance in global oil markets, and a delicate geopolitical balance in the Middle East. If the Volcker double-dip is treated as a single event, a surge in oil prices has preceded every recession in the last 45 years, except for the 2001 recession precipitated by the bursting of the dot-com bubble (Chart 6). Chart 6Oil Price Spikes Often Precede Recessions
Oil Price Spikes Often Precede Recessions
Oil Price Spikes Often Precede Recessions
Significant Rollback Of Globalization Our Geopolitical Strategy and Global Asset Allocation services have cited peak globalization as an important long-term investment theme for the last several years. The tariff tensions between the U.S. and its trading partners would seem to have borne out their predictions, especially if one views them as having been inspired by unskilled workers’ losses from globalization. Taking on foreign exporters is likely to play well in the electorally decisive Rust Belt states, where manufacturing job losses have hit especially hard. We fully subscribe to the theory of comparative advantage as formulated by David Ricardo in the early 19th century. By allowing individual countries to specialize in what they do best, free trade increases the size of the global economic pie. Empirical evidence suggests that globalization also re-slices the pie, however. In the developed world, outsourcing manufacturing has operated to the benefit of investors and the detriment of less-skilled workers. For U.S.-based multinationals, tariffs are a minor irritant compared to the prospect of having to reroute supply chains around China. The modest headwinds to globalization observed before the U.S. began engaging in serial bilateral trade conflicts did not undermine corporate profit margins in any material way. A bigger anti-globalization push that forced global supply chains to be rerouted or partially unwound would have much more negative effects. The U.S. is a comparatively closed economy, but the multinationals that dominate equity market capitalization rely heavily on interactions with the rest of the world. Unwinding the global supply chains that have been carefully constructed over the last 30 years would be disruptive and costly. The worst-case scenario envisioned by our geopolitical strategists, in which U.S.-China relations dramatically worsen and the tariff back-and-forth escalates in a major way, would hit equities hard, especially if supply chains had to be rebuilt. As a proxy for what globalization has meant for investors’ and blue-collar workers’ share of the pie, we consider the path of real wages relative to productivity over the last 50 years. From 1970 through 2001, U.S. wages generally kept pace with productivity gains, observing a fairly narrow, well-defined range (Chart 7). Once China entered the WTO (as denoted by the vertical line on the chart), productivity-adjusted wages fell precipitously, and even their periodic bounces have fallen well short of the level that marked the lower end of the previous range. Chart 7The Pie Has Grown, But Unskilled Labor's Slice Has Shrunk
The Pie Has Grown, But Unskilled Labor's Slice Has Shrunk
The Pie Has Grown, But Unskilled Labor's Slice Has Shrunk
Bottom Line: Temporary barriers to free trade, implemented as a negotiating tactic, are not a big deal for equities. A significant rollback of globalization would be, however, and a need to divert global supply chains away from China could stop the bull market in its tracks. Investment Implications Along with our Global Investment Strategy colleagues, we are somewhat more sanguine than our Geopolitical Strategy service that a worst-case outcome between the U.S. and China can be averted. We therefore continue to believe that the U.S. expansion, and the bull markets in risk assets, will persist until the Fed tightens monetary conditions enough to spark the next recession. We reiterate our recommendations that investors should maintain at least an equal weight position in equities and spread product. Enough is at stake in the conflicts with China and Iran, however, that a worsening of either could cause us to change our view, and we will be watching developments on each front closely. Doug Peta, CFA Chief U.S. Investment Strategist dougp@bcaresearch.com Jennifer Lacombe Senior Analyst, Global ETF Strategy jenniferl@bcaresearch.com Footnotes 1 Mary Amiti, Stephen J. Redding, and David E. Weinstein, “The Impact of the 2018 Trade War on U.S. Prices and Welfare,” NBER Working Paper No. 25672, (March 2019). 2 Please see Commodity & Energy Strategy/Geopolitical Strategy Special Report, “U.S.-Iran: This Means War?,”dated May 3, 2019, available at ces.bcaresearch.com.
Highlights So What? Odds of a total breakdown in U.S.-China relations are highly underrated. Why? The key market-relevant geopolitical event is Trump’s large risk appetite. Inflationary pressures resulting from the trade tariffs are not prohibitive for Trump’s trade war. Chinese stimulus will surprise to the upside, but a massive stimulus package will depend on talks collapsing and maximum tariffs. Markets will sell before they recover. We will maintain our current portfolio hedge of Swiss bonds and gold. Feature Chart 1Equities Sell, Safe Havens Rally
Equities Sell, Safe Havens Rally
Equities Sell, Safe Havens Rally
Global equities have sold off and safe-haven assets caught a bid since the near-breakdown in U.S.-China trade negotiations on May 5 (Chart 1). Yet financial markets are still complacent, as the 2.8% drawdown to date on global equities and the S&P 500 does not yet reflect the depth of the geopolitical risk to sentiment and corporate earnings. To understand this risk we need to step away from the ups and downs of the trade negotiations and ask, What have we learned about U.S. policy over the past month and what does it mean for global markets on a cyclical and structural horizon? We have learned that in the lead-up to the 2020 election, President Trump is not seeking to protect his greatest asset – namely, a strong American economy – but rather to solidify his support through new ventures. By imposing the full brunt of sanctions on Iran and hiking the tariff rate on Chinese imports, Trump has made two highly significant decisions that could jeopardize the American voter’s pocketbook, with a full 18 months to go before November 3, 2020. Why has he done this? Because he believes the American economy can take the pain and he will achieve resounding foreign policy successes. These, he hopes, will make his reelection more likely. President Trump’s aggressive posture is a direct threat to the global equity bull market due to (1) higher odds of a negative shock to global trade when global growth is already weak, and (2) higher odds of an oil price shock due to a potential vicious spiral of Middle East conflict. Wreaking Havoc Historically, the United States thrives when the rest of the world is in chaos. This was obviously the case during World War I and II (Chart 2). But it also proved true in the chaotic aftermaths of the Soviet Union’s collapse and the global financial crisis, though the U.S. did suffer along with everyone else during the 2008-09 downturn. American equities have generally outperformed during periods of global chaos (Chart 3). Chart 2America Thrives Amid Global Chaos
America Thrives Amid Global Chaos
America Thrives Amid Global Chaos
Chart 3U.S. Equities Outperform During Global Crises
U.S. Equities Outperform During Global Crises
U.S. Equities Outperform During Global Crises
The reasons for U.S. immunity are well known: the U.S. has a large, insulated, consumer-driven economy; it has immense economic advantages enhanced by its dominance of North America; it has vast and liquid financial markets; and it is the world’s preponderant technological and military power. This position enables Washington to act more aggressively than other capitals in pursuit of the national interest – and to recover more quickly from mistakes. Chart 4U.S. Preponderance Declining
U.S. Preponderance Declining
U.S. Preponderance Declining
It follows that there is an influential idea or myth that the country can or should exploit this advantage, when necessary or desirable, by “wreaking havoc” abroad. The prime example is the preemptive invasion of Iraq. In this way Washington can turn the tables on its opponents and keep them off balance. The Trump administration, regardless of Trump’s intentions, could soon become the epitome of this school of thought. First, it is true that, structurally, American preponderance has been decreasing: despite various crises, there has been sufficient peace and prosperity in the twenty-first century to see the rest of the world’s wealth, trade, and arms grow relative to the United States (Chart 4). With the rise of China and resurgence of Russia, U.S. global leadership is at risk and the Trump administration has adopted unorthodox policies to confront its rivals and try to reverse this process. Second, cyclically, President Trump is stymied at home after his Republican Party lost the House of Representatives in the 2018 midterm election. Scandals and investigations plague his inner circle. Unable to secure funding for his signature campaign promise – the southern border wall – Trump faces the risk of irrelevance. Foreign policy, especially trade policy, thus becomes the clearest avenue for him to try to notch up victories. Trump faces the risk of irrelevance. Foreign policy thus becomes the clearest avenue for him to try to notch up victories. Bottom Line: The key market-relevant event over the past month has been the Trump administration’s demonstration of voracious risk appetite. This is fundamentally a cyclical not tactical risk to the bull market due to tit-for-tat tariffs, sanctions, and provocations with rivals like China and Iran. Pocketbooks Versus Patriotism Trump’s vulnerability becomes clear by looking at our electoral Map 1, which highlights his excruciatingly thin margins of victory in the critical “swing states” in the 2016 election. We emphasize the margin of victory among white voters – which are slightly higher than the margins overall – because the Trump campaign courted the white working class specifically in a calculated strategy to swing the Midwest “Rustbelt” states and win the election.
Chart
The problem for Trump is that while whites remain the majority of the eligible voting population, it is a declining majority due to demographic change. Demographics is not near-term destiny, but the vanishingly thin margins ensure that Trump cannot assume that he will win reelection without generating even more turnout and support among blue-collar whites in the key states.
Chart 5
Job creation and rising incomes are the chief hope. The problem is that Trump’s tax cuts and the red-hot economy in 2018 did not prevent Republicans from getting hit hard in the midterm elections, especially in the Midwest. Moreover today’s resilient economy is not preventing the top two Democratic candidates, former Vice President Joe Biden and independent Vermont Senator Bernie Sanders, from beating Trump in head-to-head polling in the key swing states (Chart 5). Trump’s national approval rating, at about 44%, is nearly as good as it gets, but the indications from the Midwest are worrisome, especially because the economy has slowed. If the economy is not winning the argument on the campaign trail in 2020, Trump will need to have another leg to stand on. In addition to hammering home his attempts to build a wall on the border, Trump will highlight his economic nationalism. Protectionism has won the Rustbelt over the past three elections. As we have since 2016 argued, this now boils down to pressure on China. If Trump’s policies provoke China (or Iran) to take aggressive actions, he will have a pretext to exercise American power in a way that will likely create a rally-around-the-flag effect, at least in the short term. Elections do not normally hinge on foreign policy, but they certainly can. While President Trump may not actually want a war with Iran, he knows that George W. Bush cruised to victory amid the Afghan and Iraqi wars. Or he may have in mind 1964, when Lyndon B. Johnson crushed Barry Goldwater, an offbeat, ideological “movement candidate” (can anyone say Bernie Sanders?) in the face of a hulking communist menace, the Soviet Union. A conflict with China (or Iran) could serve similar purposes in 2020, either distracting the populace from a weakening economy or adding to an election bid centered on a reaccelerating economy. The problem is that a patriotic conflict with China or Iran is an insurance policy that threatens to undermine the health and safety of the very thing being insured: the U.S. economy. Indeed, U.S. stocks did not outperform after the September 11th attacks or during the Bush administration’s wars abroad. In essence, Trump is a gambler and is now going for broke. This constitutes a huge risk to the global economy and financial markets – a risk that was subdued just a month ago due to oil sanction waivers and tariff-free trade talks. Bottom Line: President Trump is courting international chaos because his policy priorities are tied down with gridlock and scandal at home. Aggressive foreign policy is a strategy to rack up policy victories and potentially expand his voter base, but it comes at the risk of higher policy uncertainty and negative economic impacts that could derail this year’s fledgling economic rebound and the long-running bull market. “No Deal” Is More Likely Than A Weak Deal It wasn’t just a tweet that sent volatility higher over the past two weeks. Most likely, President Trump decided to raise tariffs on China at the advice of his trade negotiators, who had become convinced that China was not offering deep enough concessions (“structural changes”) and was playing for time. This was always the greatest risk in the trade talks. China is indeed playing for time, as it has no security guarantee from the United States and therefore cannot embrace structural changes in the way that Japan did during the U.S.-Japanese trade war in the 1980s. Originally, the talks were set to last 90 days with the tariff hike by March 1. Trump was apparently determined not to lose credibility on this threat as China drew out the negotiations. Hence, he piled on the pressure to try to force a conclusion by the June 28-29 G20 summit in Japan, which has been the target date for our trade war probabilities over the past several months (Table 1). We have now adjusted those probabilities to upgrade the risk that talks collapse (50%) and downgrade the odds of a deal to 40% by that date. Table 1U.S.-China Trade War: Probabilities Of A Deal By End Of June 2019
How Trump Became A War President
How Trump Became A War President
The underlying calculation from the Trump administration is that a cosmetic, short-term deal – along the lines of the NAFTA renegotiation – will be difficult to defend on the campaign trail and hence politically risky. We upgraded the risk that talks collapse (50%) and downgraded the odds of a deal to 40% by end of June. If China agreed arbitrarily to increase imports from the U.S. by 10% by 2020, it would only increase the level of imports above the pre-trade war 2015-18 trend by $23 billion dollars in 2029 (Chart 6, panel 1). It would also have a minimal impact on the trade deficit. The deficit has increased so much in recent years that the impact of a 10% increase in exports by 2020 would merely offset the high point we reached during the trade war, leaving Trump with a mere $800 million per year by 2029 (Chart 6, panel 2).
Chart 6
For commodities in particular – where China offered the largest purchases – the negative impact of the trade war has been so great that a 10% increase by 2020 over the status quo would fail to offset the recent damages over a ten-year period. China would have to increase imports by at least 17% to offset the trade war-induced decreases. If commodity imports were 30% higher in 2020 than otherwise, the impact 10 years down the line would amount to a mere $11 billion per year. These gains are smaller, as Chinese negotiators have long argued, than what could be made if the U.S. increased exports of advanced technology products to China. If the U.S. exported as many of these products to China as it does to the EU, as a share of EU GDP, it would amount to a $48 billion increase in exports. For Japan, the equivalent would be an $85 billion increase. Increasing the growth of these exports to China to match the recent trend of such exports globally would nearly double the amount sent to China by 2029, earning the U.S. an additional $60 billion that year (Chart 6, panel 3). The problem, of course, is that the confrontation with China is specifically focused on the latter’s technological acquisition and competition with the United States – it is precisely not about making reductions to the trade deficit at the expense of technological superiority. The tech war is more likely to derail the trade talks than the trade talks are likely to resolve the tech war. It is hugely significant that, at the moment of decision, President Trump sided with U.S. Trade Representative Robert Lighthizer and did not accept a deal focused on marginal improvements to the trade deficit. There was always a strong possibility – we previously put it at a 50% chance – that Trump would accept a short-term deal in order to get a “quick win” and minimize tariff pains ahead of the election, while punting the longer-term structural grievances until his second term when he would be less constrained by the economy. But this possibility has clearly fallen. We now put it at 35%, as shown in Table 1 above. Trump sees a shallow deal as a political liability. The most important takeaway from Table 1, however, is that the odds of a “Grand Compromise” have dropped to a mere 5%. Trump still may settle for a deal to reduce economic risks ahead of the election, but a grand compromise is very hard to get. Bottom Line: Our adjusted trade war probabilities suggest that global equities can fall further on a tactical horizon and that downside risks are grave, given a 50% chance that talks utterly collapse by the end of June. This would include a 30% chance of igniting an intense period of saber-rattling, sanctions, and Cold War-esque tensions that would cause a global flight to quality. Won’t The Trade War Turn Voters Against Trump? No.
Chart 7
While geopolitical and political constraints push against a weak deal, the economic constraints of a failure to conclude a deal are not prohibitive. The latest tariff hike doubles the dollar magnitude of the tariffs, and an additional 25% tariff on the remaining $300 billion of imports would more than quadruple the magnitude of the tariffs from the April 2019 level (Chart 7). With all U.S. imports from China affected, price rises will percolate upward through all tradable industries and consumer goods. A few points are worth noting: The domestic value-add of Chinese exports to the U.S. is not as low as consensus holds. China’s manufacturing sector is highly competitive, comparable to the EU and Germany in the degree to which its exports to the U.S. incorporate foreign value (Chart 8). This means that Americans cannot substitute other goods for Chinese goods as easily as one might think.
Chart 8
There remains a massive gulf between the nominal output of China’s manufacturing sector and the rest of Asia (Chart 9). Strategically it makes sense for the U.S. to want to decrease China’s share of American imports from Asia and reduce China’s centrality to the production process. But Asia cannot yet substitute for China. In practical terms this requires spreading China’s concentrated production system across the Indonesian archipelago. It is inefficient and will raise costs and import prices. Even in areas where China is lacking – such as technology, institutions, and governance – it still has a productivity advantage over the rest of Asia, pointing yet again to the cost-push inflationary consequences of an abrupt transition forced by tariffs (Chart 10). Chart 9Asia Cannot Replace China ... Yet
Asia Cannot Replace China ... Yet
Asia Cannot Replace China ... Yet
Chart 10China's Productivity Beats Rest Of Asia
China's Productivity Beats Rest Of Asia
China's Productivity Beats Rest Of Asia
Nevertheless, these cost factors are not so great as to force Trump into a weak deal. While the new and proposed tariff expansions will impact consumer goods more than the earlier batches that attempted to spare the consumer, the truth is that Chinese imports do not comprise a large share of the U.S. consumer basket (Chart 11). Chart 11American Shoppers Not Too Exposed To China
American Shoppers Not Too Exposed To China
American Shoppers Not Too Exposed To China
Chart 12Goods Price Inflation Not An Immediate Risk
Goods Price Inflation Not An Immediate Risk
Goods Price Inflation Not An Immediate Risk
Goods prices have been flat in the U.S., albeit in great part because of China, and they have fallen while the consumer price index and the real wage component of the CPI have risen by more than 20% since 2001 (Chart 12). Moreover, it is precisely in consumer goods where the American shopper does have considerable ability to substitute away from China – as opposed to the American corporation, which will have a harder time replacing Chinese-made capital goods quickly (Table 2). Thus, the risk impacts Wall Street differently than Main Street. Table 2Capital Goods Harder To Substitute
How Trump Became A War President
How Trump Became A War President
Further, the median American household’s real income growth is still elevated (Chart 13). This comes on top of the fact that net household worth and the saving rate are both in good shape. President Trump has some leeway in waging his trade war. The risk, of course, is that this income growth is decelerating and Trump has given the tariffs 18 months to cause negative impacts for consumers prior to the election. He is also simultaneously wagering that the U.S.’s newfound energy independence – and his own ability to tap the strategic petroleum reserve – will prevent gasoline prices from spiking (Chart 14). This would occur as a result of any Iranian-backed attacks on oil production and export facilities across the Middle East. Chart 13American Household Still In Good Shape
American Household Still In Good Shape
American Household Still In Good Shape
Chart 14Fuel Prices Already Rising
Fuel Prices Already Rising
Fuel Prices Already Rising
Bottom Line: Inflationary pressures will result from trade tariffs (and Iranian sanctions) but they are not prohibitive for Trump thus far. This is not a recipe for cost-push inflation significant enough to trigger a recession or derail Trump’s reelection odds at present, but it is a risk that will need to be monitored. How Will China Respond? More Stimulus! The immediate ramification of a heightened trade war is deteriorating global trade and sentiment and hence slower global growth that pushes down prices. Indeed, the escalation of the trade war brings sharply into focus two long-running Geopolitical Strategy themes: Sino-American Conflict: U.S. and Chinese exports to each other have already sharply fallen off (Chart 15). Trade is interconnected so this will further depress global and Asia-ex-China exports. Chart 15Trade War Hurts Bilateral Trade ... And All Trade
Trade War Hurts Bilateral Trade ... And All Trade
Trade War Hurts Bilateral Trade ... And All Trade
Chart 16Global Trade Already Rolling Over
Global Trade Already Rolling Over
Global Trade Already Rolling Over
Apex of Globalization: Global trade as a whole is contracting as a result of the global slowdown, which the trade war has exacerbated (Chart 16). The negative impact on China is acute and threatens something akin to the global manufacturing recession of 2015 (Chart 17). Given that the trade war is now piling onto a merely fledgling rebound in Chinese and global growth this year, it is possible that the manufacturing slowdown could even get worse than 2015 and culminate in a global recession in our worst case scenario of a major strategic escalation. Preventing this outcome, China will increase fiscal-and-credit stimulus, which we have argued is likely to overshoot expectations this year due to trade war and the country’s desire to meet 2020 urban income goals (Chart 18). The magnitude should be comparable to the 2015-16 stimulus, unless a global recession is immediately in view, in which case it will be larger. Chart 17A Relapse Would Point Toward 2015-Sized Crisis
A Relapse Would Point Toward 2015-Sized Crisis
A Relapse Would Point Toward 2015-Sized Crisis
It was the Xi administration that undertook the huge 2015-16 expansion of credit, so this magnitude is not out of the question. While Xi has attempted to contain leverage and reduce systemic financial risk, he is ultimately like his predecessors, most notably Jiang Zemin, in the sense that he will aim for social stability above all. Chart 18China Will Keep Stimulating
China Will Keep Stimulating
China Will Keep Stimulating
The pain threshold of today’s policymakers has already been discovered, seeing how President Xi and the Politburo began easing policy in July 2018 after the U.S. implemented the initial Section 301 tariffs. The Chinese leaders were willing to tighten credit controls until this external risk materialized. The fact that the trade war is the proximate cause of heightened stimulus was confirmed in the wake of the Buenos Aires summit, where Xi chose to stimulate the economy further – resulting in a surge of credit in Q1 – as a way of improving China’s leverage vis-à-vis the United States in the 90-day talks. China will increase fiscal-and-credit stimulus … The magnitude should be comparable to the 2015-16 stimulus. In short, Xi and his government will stimulate first and ask questions later. Both fiscal and credit stimulus will be utilized, including traditional fiscal infrastructure spending and permissiveness toward shadow banking. A dramatic renminbi depreciation could occur but would be evidence that talks will fail (Chart 19). Chart 19Currency Agreement: Far From A Plaza Accord
Currency Agreement: Far From A Plaza Accord
Currency Agreement: Far From A Plaza Accord
Stimulus will continue to be tactical, rolled out in piecemeal announcements, at least as long as the trade talks continue and there is a prospect of China’s economy rebounding without drastic measures. Only a total breakdown in negotiations – and collapse into outright Cold War – will prompt a massive stimulus package. Bottom Line: Chinese stimulus will surprise to the upside while talks are going, and it will increase dramatically if talks collapse. This will ultimately support global growth but it will not prevent market riots between a negative policy shock and the point at which markets are totally reassured about the magnitude of stimulus. How Will The Negotiations Proceed? Precariously. The risk of a strategic conflict is much higher than the markets are currently pricing. This is highlighted in Table 1 above, but there are additional reasons to have a high conviction on this point. We can demonstrate this by constructing a simple decision tree that outlines the step-by-step process by which the U.S. and China will proceed in their negotiations after the May 10 tariff rate hike (Diagram 1). To these we attach subjective probabilities that we believe are fair and slightly conservative. The result shows that it is not difficult to conclude that the conditional probability of a long-term, durable trade agreement is a mere 4%, whereas the conditional probability of an uncontained escalation in strategic tensions is as high as 59%! This is a much worse outcome than our actual view as expressed in Table 1. Diagram 1A Simple Decision Tree Says Geopolitical Risks Are Huge
How Trump Became A War President
How Trump Became A War President
A similar exercise – an analysis of competing hypotheses conducted according to analytical techniques used by the U.S. intelligence community – reinforces the point that the most likely scenario is a major escalation in tensions, while the least likely is a “grand compromise” (Appendix). While our final trade war probabilities in Table 1 are not as pessimistic as these exercises suggest, the latter reinforce the point that the market is too sanguine. An increase in tariffs after five months of negotiations, with a threat to impose even more sweeping tariffs with a one-month deadline, is not conducive to Chinese concessions and therefore increases the odds of talks failing and an escalation in strategic conflict unprecedented in U.S.-China relations since the rupture from 1989-91. And this rupture would be considerably worse for the global economy. The Trump administration’s political logic is willing to accept such a conflict on the basis that a foreign policy confrontation can produce a rally-around-the-flag effect whereas a short-term deal that does not address significant technological and national security concerns is a political liability on the campaign trail. Yes, it is important that Presidents Trump and Xi are making verifiable preparations to attend the G20 summit in Japan. But they could cancel their attendance or snub each other at the event. In our view investors should wait for something more substantial to become more optimistic about political risk – such as public commitments to structural changes by China and a complementary tariff rollback schedule by the United States. Bottom Line: The odds of a total breakdown in U.S.-China relations and a Cold War-style escalation of strategic conflict are highly underrated. Markets will sell before they recover. Investment Implications Chart 20China's Nuclear Option Might Fizzle
China's Nuclear Option Might Fizzle
China's Nuclear Option Might Fizzle
Equity markets are exposed to further downside in the short run. Even a minor escalation is not fully priced according to our Global Investment Strategy’s equity market forecasts based on our own geopolitical scenario probabilities (see Table 1 above). Our Chief Global Strategist Peter Berezin would recommend increasing exposure to risk if the S&P 500 falls 5% from current levels, other factors being equal. Cyclically, any trade agreement will fail to bring substantial benefits to the U.S.-China trade and investment outlook over a horizon beyond 12-24 months. The tech industries of the two countries will not benefit greatly from the deal. While multinational corporations exposed to the Asian manufacturing supply chain could suffer earnings downgrades from trade war, China’s stimulus will be a countervailing factor, particularly for commodities and commodity-oriented EMs. Therefore, we will keep our China Play Index and long Indonesia trades in place despite near-term risks. Ironically, U.S. treasuries can rally even when China is reducing its holdings, as global demand rises amid crisis (Chart 20). However, given that bonds have already rallied and we expect Chinese stimulus to come sooner rather than later, we will maintain our current portfolio hedge of Swiss bonds and gold, which is up 2%. We are closing our long small caps trade for a loss of 11.9%. Matt Gertken, Vice President Geopolitical Strategist mattg@bcaresearch.com Appendix
Image
Feature In what has become a tradition, I met with Ms. Mea following client meetings in Europe last week. Ms. Mea is a long-term BCA client who has been following our Emerging Markets Strategy very closely over the years. It was our fourth meet-up in the past 18 months. Ms. Mea keeps our meetings interesting by always challenging our views and questioning the nuances of our analysis. The timing of our most recent meeting was particularly notable, as we had just received news that the latest U.S.-China trade talks had not produced an agreement. In light of this, Ms. Mea started our conversation with a question on the link between geopolitics and financial markets: Ms. Mea: Why have the U.S. and China failed to reach a trade accord when it is clear that without one, both global financial markets and business sentiment will be hurt? Answer: The U.S. and China are intertwined in a geopolitical confrontation that will endure for decades. Their strategic national interests are not aligned at all. Therefore, any accord on trade and other geopolitical disputes will not be lasting. It is impossible to accurately forecast and time all turns of the negotiation process and the associated event risks. Therefore, an investment process should be informed and guided by a thematic approach. The U.S. and China are intertwined in a geopolitical confrontation that will endure for decades. Our theme has been, and remains, that China and the U.S. are in a long-term geopolitical confrontation that epitomizes a rivalry between an existing and a rising superpower. This suggests that the demands of one side will be unacceptable to the other. That makes any agreement unsustainable over the long run. In brief, there was a structural regime shift in the U.S.-China relationship last year. Yet global equity markets rallied this year on rising expectations of a major trade deal. Notably, most of the gains in EM equities since late December occurred on days when there was positive news on the progress of trade talks. Hence, the EM rally can largely be attributed to expectations of a trade deal. Not surprisingly, the failure to conclude a trade accord has quickly pushed EM share prices back down to their mid-January levels (Chart I-1). As such, the majority of investors who have bought the EM equity index since early this year lost a substantial part of their gains in the recent selloff. Chart I-1EM Equity Index: Between Support And Resistance
EM Equity Index: Between Support And Resistance
EM Equity Index: Between Support And Resistance
Given that these two nations are embroiled in a long-term geopolitical rivalry, it will be difficult to find solutions on trade and geopolitical disputes that can simultaneously satisfy both sides. Even so, this does not imply that global risk assets will be in freefall forever. Financial markets currently need to price in both (1) a geopolitical risk premium on a structural basis; and (2) the impact of trade tariffs on global business activity on a cyclical basis. Once these two components have been priced in, markets will become less sensitive to the ebbs and flows of tensions between the U.S. and China. Finally, China’s exports to the U.S. constitute only 3.5% of mainland GDP (Chart I-2). This is considerably smaller than capital spending, which makes up 42% of China’s GDP. Further, most of the investment outlays over the past 10 years have not been in productive capacity to supply goods to the American market. On the contrary, the overwhelming share of capital expenditures since 2008 have occurred in domestic segments of the economy rather than export industries. Certainly, the trade confrontation will weigh on consumer and business sentiment in China as well as reduce the flow of U.S. dollars to the Middle Kingdom, warranting RMB depreciation. Still, there are other predicaments unrelated to the U.S. import tariffs that Chinese policymakers are facing. These include the credit, money and property bubbles that we have written about extensively. China’s exports to the U.S. constitute only 3.5% of mainland GDP. Ms. Mea: With no trade deal, the odds appear to be rising that the Chinese authorities will ramp up both credit and fiscal stimulus. Should investors not be looking through the near-term volatility and be buying EM risk assets and China-plays – because this stimulus will produce a cyclical recovery in the mainland economy? Answer: It is a safe bet that the Chinese authorities will encourage more credit creation and ramp up fiscal spending. The difficulty for investors is in gauging two unknowns: What is the lead time between the stimulus and economic growth, and what will be the multiplier effect of these stimuli. Lead time: Chart I-3 portends our aggregate credit and fiscal spending impulse. Based on the past relationship between turning points in this indicator and the business cycle in China, the latter is likely to bottom around August. Chart I-2Structure Of Chinese Economy
Structure Of Chinese Economy
Structure Of Chinese Economy
Chart I-3China: Stimulus Works With A Time Lag
China: Stimulus Works With A Time Lag
China: Stimulus Works With A Time Lag
Chart I-4China's Stimulus And Financial Markets: 2012 Versus 2016
China's Stimulus And Financial Markets: 2012 Versus 2016
China's Stimulus And Financial Markets: 2012 Versus 2016
Multiplier effect: The impact of stimulus on the economy also depends on the multiplier effect. The latter is contingent on households’ and companies’ willingness to spend. If households and companies hasten the pace of spending, the economy can recover with little stimulus. If they reduce their expenditure growth, the economy may require much more stimulus. The majority of investors and commentators are comparing China’s current stimulus efforts with what occurred in 2016. However, our hunch is that the current Chinese business cycle might actually resemble the 2012-‘13 episode due to similarities in the multiplier effect. The size of credit and fiscal stimulus in 2012 was as large as in 2016. Nevertheless, the business cycle recovery in 2012-‘13 was very muted, as illustrated in Chart I-3 on page 3. Consistently, EM share prices and commodities did not stage a cyclical rally in 2012 as they did in 2016-‘17 (Chart I-4). Ms. Mea: It seems you are implying that differences between the 2012 and 2016 economic and financial markets outcomes are due to the multiplier. How does one appraise the multiplier effect? Answer: In a word, yes. Unfortunately, there is no easy way to forecast consumers’ and businesses’ willingness to spend – particularly in the midst of a clash between the positive effects of stimulus and the negative sentiment stemming from the ongoing U.S.-China confrontation. We have constructed indicators that measure the willingness to spend among households and companies in China. Our proxies for their marginal propensity to spend (MPS) are currently in decline (Chart I-5A and I-5B). Chart I-5AChina: Households' Marginal Propensity To Spend
China: Households' Marginal Propensity To Spend
China: Households' Marginal Propensity To Spend
Chart I-5BChina: Enterprises’ Marginal Propensity To Spend
China: Enterprises' Marginal Propensity To Spend
China: Enterprises' Marginal Propensity To Spend
MPS does not affect day-to-day expenditures, but rather captures consumer spending on large-ticket items such as housing, cars and durable goods, as well as investment expenditures by companies. Consistently, mainland companies’ MPS leads industrial metal prices by several months (Chart I-5B). Chart I-6 illustrates the critical difference between 2012 and 2016 in terms of the impact of credit and fiscal stimulus. In both episodes, the size of the stimulus was roughly the same, but the manufacturing PMI did not really recover in 2012-’13, gyrating in the 49-51 range. In contrast, it did stage a cyclical recovery in 2016-‘17 (Chart I-6, second panel). In brief, the difference between the 2012 and 2016 episodes was the MPS by companies and households (Chart I-6, third and fourth panels). There are other predicaments unrelated to the U.S. import tariffs that Chinese policymakers are facing. These include the credit, money and property bubbles that we have written about extensively. Provided the not-so-upbeat sentiment among Chinese households and businesses due to their high debt levels and the ongoing trade conflict, the odds are that their MPS will remain weak for now. As a result, the impact of credit and fiscal stimulus on China’s business cycle will be muted for now. As such, more stimulus and longer lead time may be required to engineer a cyclical recovery. Interestingly, the current profiles of both EM and developed equity markets closely resemble their 2012 trajectories – both in terms of direction and magnitude (Chart I-7). Chart I-6China's Stimulus In 2012 And 2016: Beware Of Multiplier Effect
China's Stimulus In 2012 And 2016: Beware Of Multiplier Effect
China's Stimulus In 2012 And 2016: Beware Of Multiplier Effect
Chart I-7Is 2018-2019 Akin ##br##2011-2012?
Is 2018-2019 Akin 2011-2012?
Is 2018-2019 Akin 2011-2012?
Ms. Mea: So, you are suggesting risks to China-related plays and EM financial markets are skewed to the downside. How should one assess how much downside there is, and what should investors look for to gauge turnings points in financial markets? Answer: We continuously assess the investment landscape, not only based on our fundamental analysis of the global/EM/China business cycles but also on various financial market valuations, positioning and technicals. Let’s review where we stand with respect to these metrics. Equity Valuations: EM stocks are not cheap. Our favored measure of equity valuations is the composite indicator-based 20% trimmed means of the following multiples: trailing and forward P/E, price-to-cash earnings, price-to-book value and price-to-dividend ratios (Chart I-8). On these metrics, EM stocks appear fairly valued. Nevertheless, these valuations should be viewed in the context of structural decline in EM corporate profitability. The measures of return on equity and assets for non-financial companies in EM are on par with their 2008 lows (Chart I-8, middle and bottom panels). When valuations are neutral, the equity market’s direction is dictated by the profit outlook. The latter currently remains negative for EM and Chinese companies (Chart I-9). Chart I-8EM Equities Are Not Cheap
bca.ems_wr_2019_05_16_s1_c8
bca.ems_wr_2019_05_16_s1_c8
Chart I-9Downside Profit Surprises In EM And China
Downside Profit Surprises In EM And China
Downside Profit Surprises In EM And China
Currency Valuations: The U.S. dollar is only moderately (one standard deviation) expensive, according to the real effective exchange rate based on unit labor costs (Chart I-10). The latter is our most favored currency valuation measure. The greenback has been in a major structural bull market since 2011. Secular bull/bear markets do not typically end before valuations reach 1.5-2 standard deviations. We reckon that the cyclical and structural backdrop remains favorable for the dollar, and odds are it will overshoot before a major top sets in. Going forward, most of the dollar’s additional gains will not occur versus the euro or the Japanese yen – which are already modestly undervalued (Chart I-10, middle and bottom panels) – but against other currencies. In particular, commodity currencies of developed economies have not yet cheapened enough (Chart I-11). Typically, a structural bear market in commodities does not end until these commodity currencies become cheap. Hence, the current valuation profile of these commodity currencies is consistent with the notion that the secular bear markets in commodities prices and EM are not yet over. Chart I-10The Euro Is Fairly Valued, The Yen Is Cheap G3 Currency Valuations
The Euro Is Fairly Valued, The Yen Is Cheap G3 Currency Valuations
The Euro Is Fairly Valued, The Yen Is Cheap G3 Currency Valuations
Chart I-11Commodities Currencies ##br##Are Not Cheap Yet
Commodities Currencies Are Not Cheap Yet
Commodities Currencies Are Not Cheap Yet
Unfortunately, there are no data for unit labor cost-based real effective exchange rates for the majority of EMs. However, it is a safe bet to infer that long- and medium-term cycles in EM currencies coincide with those of DM commodity currencies because they are all pro-cyclical. If DM commodity currencies have not yet bottomed, EM currencies remain vulnerable. Relative to the global equity benchmark, global materials have broken down to new cyclical lows. This could be a harbinger of EM relative equity performance making new lows. Ms. Mea: But the positioning in the U.S. dollar is long. How consistent is this with your view of further dollar strength? Positioning: While investors are long the U.S. dollar versus several DM currencies, they are short the greenback versus EM currencies. Chart I-12 illustrates the aggregate net long positions of both leveraged funds and asset managers in the BRL, MXN, RUB and ZAR. As of May 10 (the last datapoint available), investors were as long these EM high-beta currencies as they were at their cyclical peak in early 2018. As to emerging Asian currencies, ongoing RMB depreciation will drag emerging Asian currencies down. Notably, the Korean won has already broken down from its tapering wedge pattern. Concerning EM equities, investor positioning and sentiment was still very elevated before last week’s market turmoil. Chart I-13 demonstrates the number of net long positions in EM ETFs (EEM) by leveraged funds and asset managers. The last datapoint is also as of May 10. Chart I-12Investors Have Been Long EM Currencies
Investors Have Been Long EM Currencies
Investors Have Been Long EM Currencies
Chart I-13Investors Have Been Bullish On EM Stocks
Investors Have Been Bullish On EM Stocks
Investors Have Been Bullish On EM Stocks
In short, investor sentiment on EM was bullish and long positions in EM were extended before the U.S.-China trade confrontation escalated again. Tell-tale signs and technicals: Market profiles can sometimes help us gauge whether an asset class is in a bull or bear market, and what the next move is likely to be. We have the following observations: U.S. dollar volatility is close to its record lows (Chart I-14). Following the previous three low-volatility episodes, EM shares prices in dollar terms dropped substantially over the ensuing 18 months – 60% in 1997-1998, 65% in 2007-2008 and 30% in 2014-2015. The rationale is that very low global currency volatility indicates that investors do not foresee a major tectonic macro shift. When this does inevitably occur, currency markets move violently. The RMB depreciation could be a tectonic macro shift that global markets are not prepared for. The absolute and relative performances of EM stocks resemble that of global materials stocks. Global materials are breaking below their long-term moving averages (technical support lines) in absolute terms, raising the odds that the EM equity index will do the same. Relative to the global equity benchmark, global materials have broken down to new cyclical lows. This could be a harbinger of EM relative equity performance making new lows (Chart I-15). Chart I-14U.S. Dollar Volatility And ##br##EM Equity Returns
U.S. Dollar Volatility And EM Equity Returns
U.S. Dollar Volatility And EM Equity Returns
Chart I-15EM And Global Materials: Relative To Global Index
EM And Global Materials: Relative To Global Index
EM And Global Materials: Relative To Global Index
Consistently, industrial metals prices as well as our Risk-on/Safe-Haven Currency Index have potentially formed a head-and-shoulders pattern and may be entering a major down leg (Chart I-16). Further weakness in these variables would be consistent with a risk-off phase in EM financial markets. Finally, the relative performance of the MSCI China All-Share Index – which includes all onshore- and offshore-listed stocks – has relapsed relative to the global equity benchmark, failing to break above its long-term moving average (Chart I-17). This is a negative tell-tale sign, and often warrants considerable downside. Chart I-16A Head-And-Shoulder Pattern In Global Cyclical Markets?
bca.ems_wr_2019_05_16_s1_c16
bca.ems_wr_2019_05_16_s1_c16
Chart I-17China All-Share Index: Absolute And Relative Performance
China All-Share Index: Absolute And Relative Performance
China All-Share Index: Absolute And Relative Performance
Ms. Mea: It seems to me that the RMB holds the key. What are your thoughts on the Chinese currency? Answer: There are several reasons why the RMB will likely depreciate. First, yuan depreciation is needed to mitigate the impact of U.S. import tariffs on Chinese exporters’ profitability. Authorities could use the RMB depreciation to fight back against U.S. import tariffs – a response that U.S. President Donald Trump will certainly not like. Second, the ongoing cyclical downturn in China and rising deflationary pressures also warrant a cheaper currency. Third, there is a vast overhang of money supply in China: The broad money supply is equivalent to US$30 trillion. More stimulus will only make this oversupply of yuans larger. This, along with the desire of mainland households and businesses to diversify their deposits into foreign currencies/assets, is like “the sword of Damocles” on the yuan’s exchange rate. Finally, the sources of foreign currency that previously offset capital outflows in China are no longer available. The current account surplus has largely evaporated. In addition, the central bank seems to be reluctant to reduce its foreign exchange reserves to fund capital outflows. In fact, at US$3 trillion, its foreign currency reserves are equivalent to only 10% of local currency broad money supply. All in all, we are structurally short the RMB versus the dollar. Chart I-18China, Commodities, & EM: Identical Cycles
China, Commodities, & EM: Identical Cycles
China, Commodities, & EM: Identical Cycles
Ms. Mea: What are the investment implications? Where are we in the EM/China investment cycle? Answer: Our investment themes since early this decade have been that EM share prices and currencies are in a bear market, the U.S. dollar is in a structural bull market, and commodities are in a structural downtrend (Chart I-18). With the exception of 2016-‘17, these themes have played out quite well. These structural moves have not yet been exhausted. At the moment, we do not foresee a 2016-’17-type cyclical rally either. The failure of EM equities to outperform DM stocks and the resilience of the U.S. dollar during the risk-on period since early this year, give us comfort in maintaining a negative stance on EM risk assets. Importantly, a decade-long poor EM performance is likely to end with a bang rather than a whimper, especially when investors by and large remain bullish on EM. On the whole, we recommend trading EM stocks on the short side and underweighting EM equities in a global equity portfolio. Within the EM equity universe, our overweights are Russia, central Europe, Thailand, non-tech Korean stocks, Mexico, Chile, the UAE and Vietnam. Our underweights are Brazil, South Africa, Turkey, Peru, Indonesia, India, and the Philippines. Fixed-income investors should also position for higher volatility and weaker EM currencies, favoring low-beta versus high-beta markets. Russian and Mexican markets are our favored local currency and U.S. dollar bonds. Finally, we continue to recommend shorting a basket of the following EM currencies versus the U.S. dollar: ZAR, CLP, IDR, MYR, PHP and KRW. Our currency overweights are MXN, RUB, SGD and the THB as well as central European currencies. Arthur Budaghyan Chief Emerging Markets Strategist arthurb@bcaresearch.com Equity Recommendations Fixed-Income, Credit And Currency Recommendations
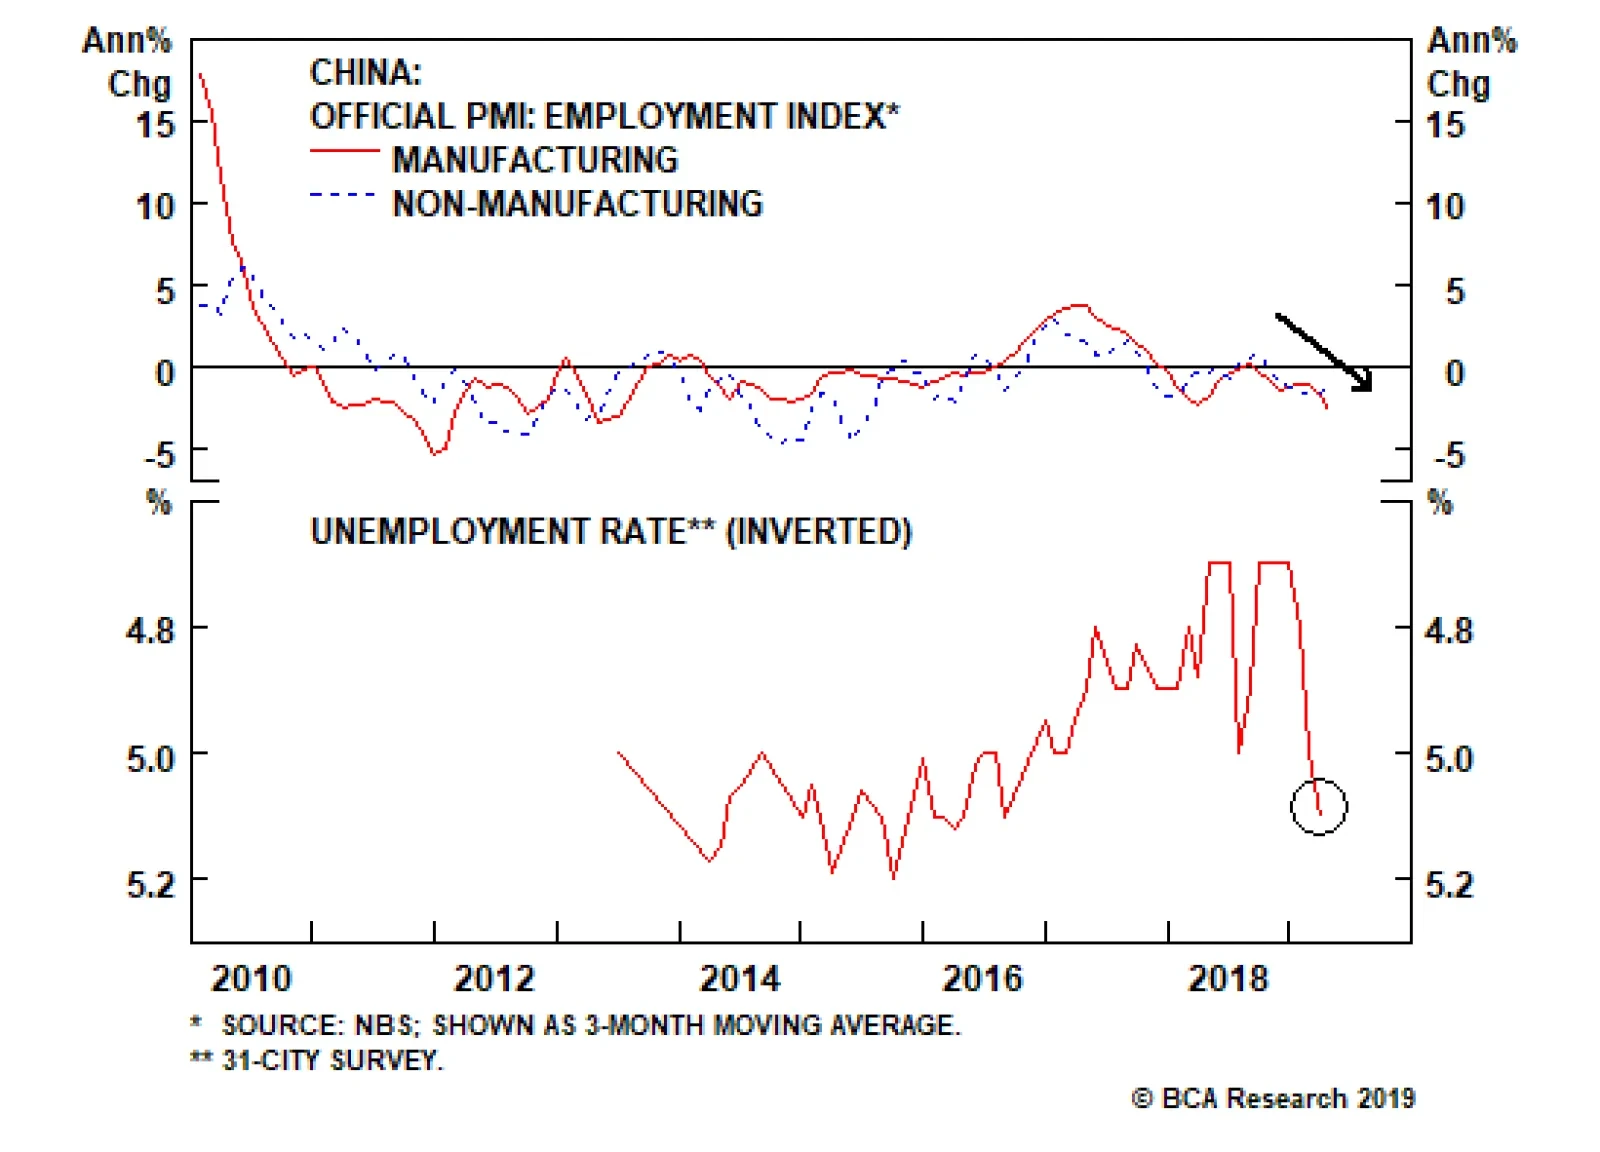
Those factors are: A 25% tariffs on all U.S.-China trade would constitute a meaningful shock, but it is also the case that this shock would be coming at a time when Chinese economic momentum is already relatively weak. This suggests that policymakers…
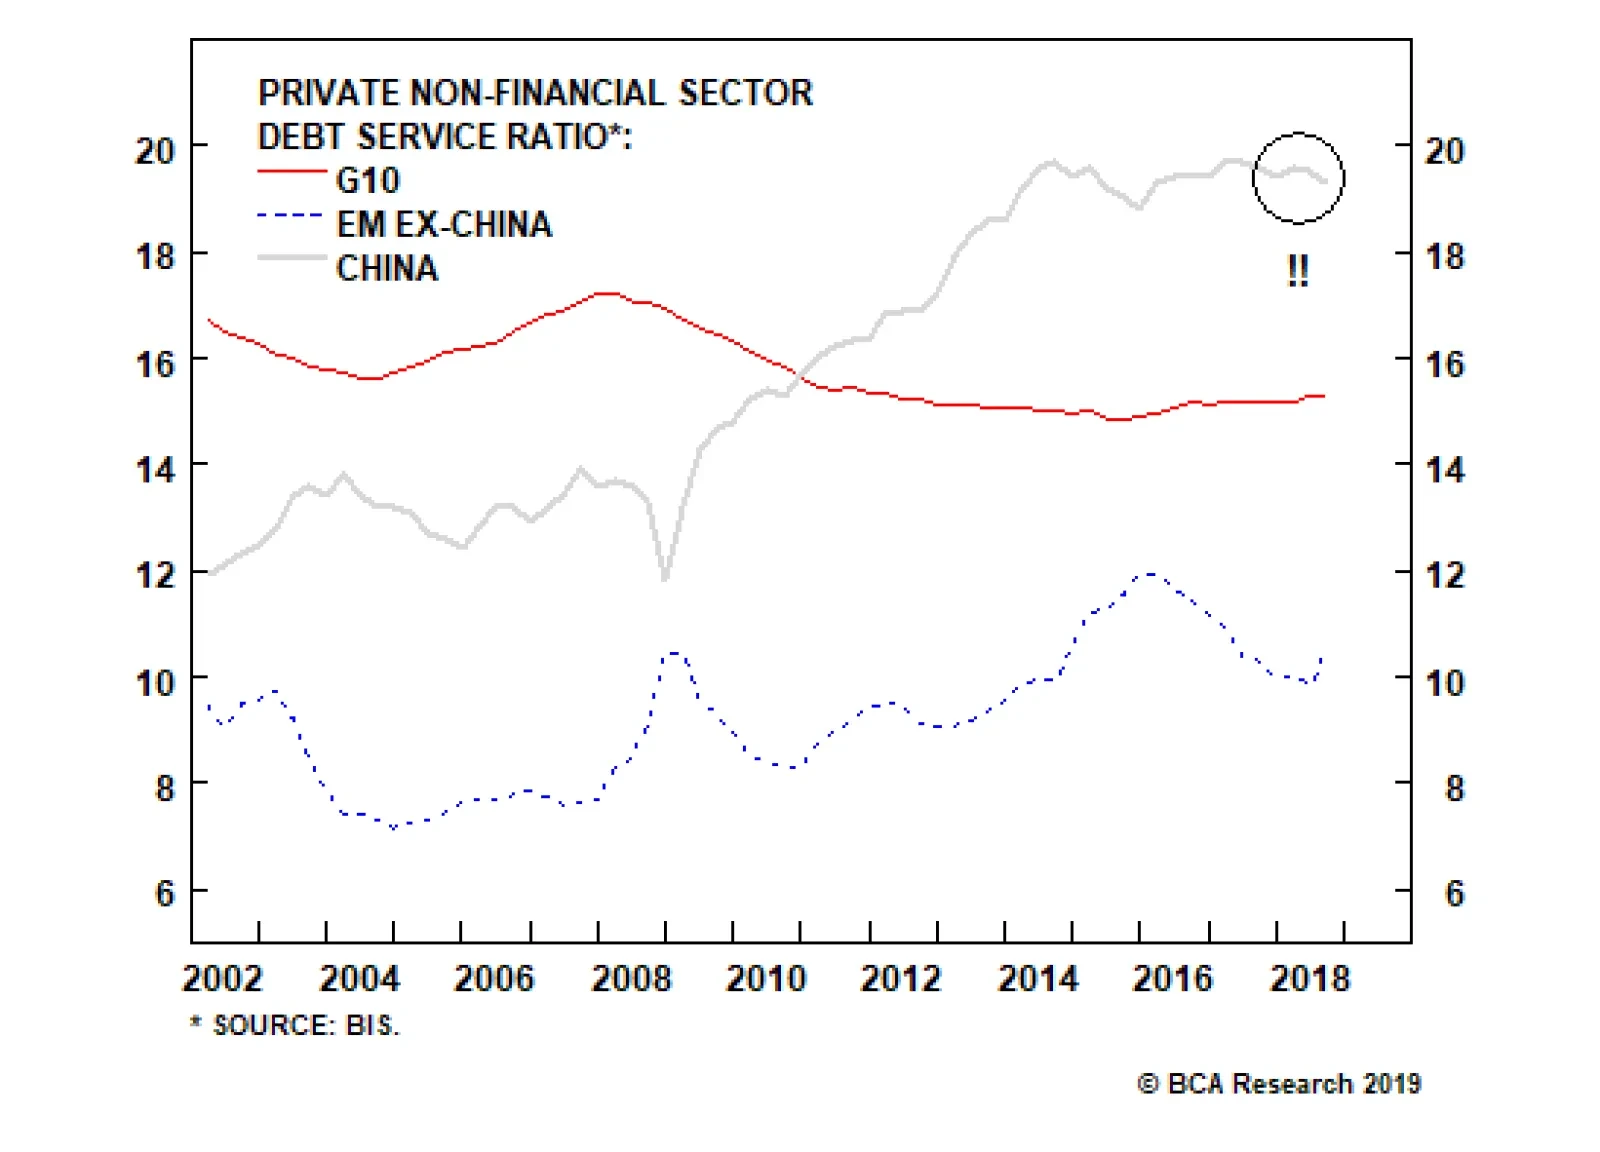
It seems reasonable to conclude that a 2015/2016-style policy response will again be required in order for policymakers to be confident that the shock will be overcome. If the answer to the aforementioned question was only dependent on the preferences of…