China

Highlights The March data brought the first signs of a stabilization in China’s “hard” economic data, albeit from a weak level. The April PMIs disappointed, but they remained in expansionary territory; this is in addition to a continued significant improvement in the trade-related subcomponents of the official survey. Chinese credit growth is unlikely to relapse over the coming year, despite recent investor concerns that Chinese policymakers may dial back their stimulus efforts. The pace of growth may moderate, but halting the uptrend in growth this year would constitute a major policy mistake that we do not expect. Chinese stocks may trend flat-to-down in the very near term as investors await a signed trade deal with the U.S. and further signs of a recovery in activity. Over the next 6-12 months, however, an overweight stance is warranted, barring a major relapse in our leading indicator. Feature Tables 1 and 2 on pages 2 and 3 highlight key developments in China’s economy and its financial markets over the past month. On the growth front, March’s data brought the very first (albeit modest) signs of stabilization in actual Chinese economic activity. While the April manufacturing PMIs released earlier this week disappointed, the trade related components of the official survey continued to improve meaningfully, which implies that an improvement in domestic demand is still early. This conclusion is not particularly surprising given that the first green shoots in the actual data are emerging from a depressed level of activity. Credit growth has only recently picked up, implying that actual activity will strengthen over the coming 6-12 months followed a signed trade deal and a continued (modest) uptrend in credit. Table 1China Macro Data Summary
China Macro And Market Review
China Macro And Market Review
Table 2China Financial Market Performance Summary
China Macro And Market Review
China Macro And Market Review
Within financial markets, the most significant recent development has been that Chinese stocks have sagged somewhat due to concerns that policymakers may meaningfully dial back their stimulus efforts over the coming year. In our view, recent statements from policymakers, as well as the fact that the recovery in activity is only now beginning, underscores that credit growth is unlikely to relapse over the coming year. It may not grow at the breakneck pace observed in the first quarter, but beyond the near-term jitters that this may introduce into the equity market, we do not see it as a threat to an overweight stance towards Chinese stocks over the coming 6-12 months. In reference to Tables 1 and 2, we provide below several detailed observations concerning developments in China’s macro and financial market data: Chart 1 highlights that March brought the first sign of a stabilization in actual Chinese economic activity. When measured on a smoothed basis, the Li Keqiang index itself weakened further in March, but total import growth moved sideways and nominal manufacturing output ticked higher. We noted in our last Macro & Market review that future changes in activity measures were now more likely to reflect actual changes in underlying economic circumstances given that the previously beneficial tariff front-running effect had probably washed out of the data. March’s data confirms this view, and underscores that activity will pickup in the second half of the year. Chart 1The First (Albeit Tentative) Sign Of Economic Stabilization
The First (Albeit Tentative) Sign Of Economic Stabilization
The First (Albeit Tentative) Sign Of Economic Stabilization
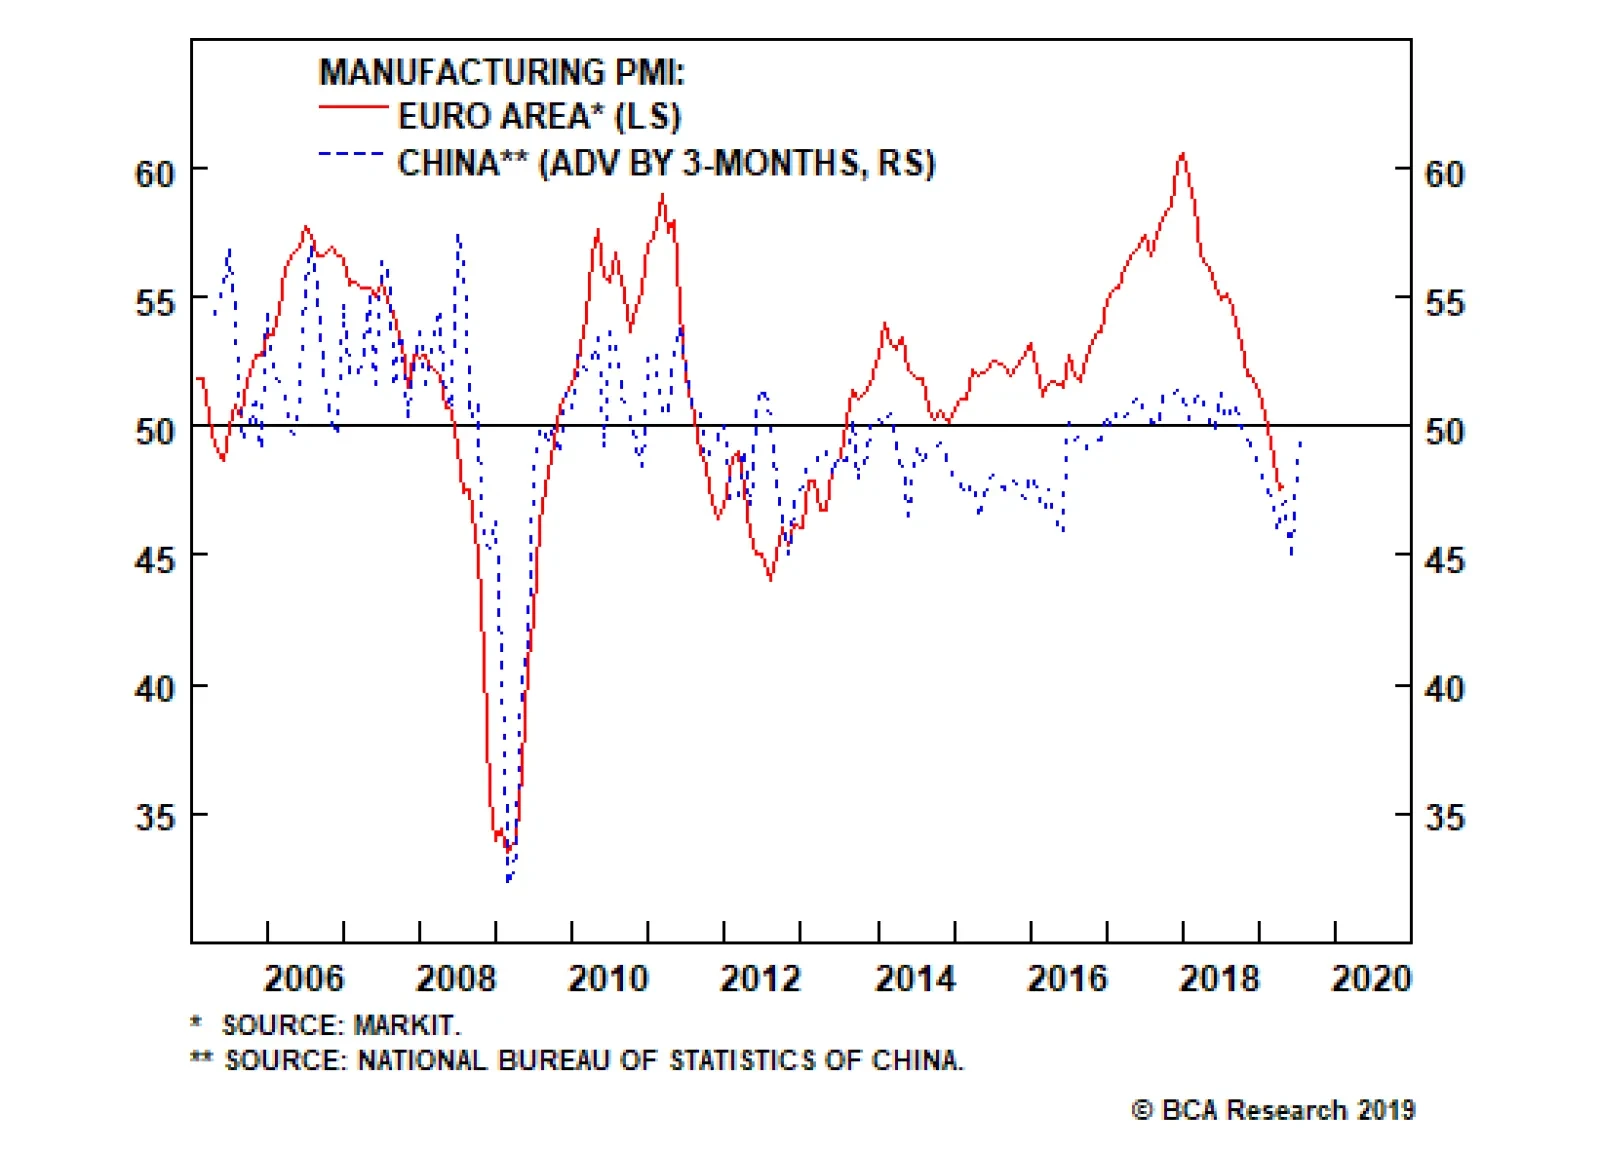
Chart 2 shows that the uptrend in our leading indicator for Chinese economic activity is so far modest, but also that it is now at a 2-year high relative to its 12-month moving average. The indicator is being weighed-down by weak money growth (M2 and our definition of M3), even though monetary conditions remain easy and our measures of credit growth picked up sharply in Q1. We doubt that the trend in Chinese money and credit growth can sustainably decouple in a scenario where the latter is sustainably improving, as it would imply that all of the credit improvement was originating from non-bank financial institutions. As such, we expect money growth to catch up to credit growth in the coming months. The annual change in the PBOC’s pledged supplementary lending injection remained in negative territory in March, and both floor space started and sold decelerated modestly further. Construction and sales activity continue to diverge, with the latter still pointing to a further slowdown in the former. We will be updating our Chinese housing outlook in a Special Report next week. April’s Caixin and official manufacturing PMI disappointed, but this overshadowed a continued significant improvement in the new export orders and import components of the official PMI (Chart 3). In our view, this is consistent with a stabilization in the export outlook, but implies that Chinese domestically-oriented manufacturing activity is not yet booming. Nonetheless, a signed trade deal, improving importer/exporter sentiment, and an uptrend in credit growth still implies that activity will pick up meaningfully later in the year. Chart 2Our Leading Indicator Is Now Modestly Trending Higher
Our Leading Indicator Is Now Modestly Trending Higher
Our Leading Indicator Is Now Modestly Trending Higher
Chart 3Trade-Related Components Of The Official PMI Continue To Rise
Trade-Related Components Of The Official PMI Continue To Rise
Trade-Related Components Of The Official PMI Continue To Rise
Over the past month, Taiwanese and domestic Chinese stocks have been the best performers within “Greater China”, relative to the MSCI Hong Kong index, the MSCI China index, and the Hang Seng China Enterprises index. The latter in particular has lagged other Chinese equity indexes since late-March (Chart 4), and may be due for a catch-up. Over the nearer-term, Chinese stocks, especially the domestic market, have sagged due to concerns that Chinese policymakers may meaningfully dial back their stimulus efforts over the coming year. We discussed this risk in our April 17thWeekly Report,1 and noted that while we expected credit growth to moderate somewhat, a more meaningful slowdown, particularly if coupled with signals from policymakers that a much slower pace of growth is desired, could pose a risk to our overweight equity stance. The April manufacturing PMIs disappointed, but the trade-related components of the official survey continued to improve meaningfully. In our view, recent statements from policymakers, particularly from PBOC Deputy Governor Liu Guoqiang,2 underscores that credit growth is unlikely to relapse over the coming year; it will simply not be growing at the breakneck pace observed in the first quarter. Beyond the near-term jitters that this may introduce into the equity market, we do not see it as a threat to an overweight stance towards Chinese stocks over the coming 6-12 months. Chart 5 highlights that Chinese consumer stocks have been the clear winners since the beginning of the year, particularly in the domestic market. Consumer stocks, including staples, sold off substantially in 2H2018 as investors responded to shockingly weak consumer spending data. Stimulus measures targeted to Chinese households, along with a meaningful improvement in some measures of consumer spending, has helped restore investor confidence in consumer stocks (which had previously been viewed as a bullish “no-brainer” structural trade). Chart 4Is An H-Share Catchup##br## Looming?
Is An H-Share Catchup Looming?
Is An H-Share Catchup Looming?
Chart 5Chinese Consumer Stocks Have Been On Fire
Chinese Consumer Stocks Have Been On Fire
Chinese Consumer Stocks Have Been On Fire
The sharp rise in the 7-day interbank repo rate in April fed concerns among equity investors that Chinese policymakers might be in the process of paring back their stimulus efforts. However, as Chart 6 shows, China’s 7-day repo rate is extraordinarily volatile, and is affected by a variety of seasonal and technical factors. The chart shows that a 1-month moving average of the 7-day repo rate is broadly in line with the level that has prevailed over the past 9 months. In addition, the 3-month repo rate (which we have argued has been a more informative predictor of China’s monetary policy stance) remains well on the low end of its range over the past year. In short, despite investor concerns, Chinese interbank repo rates are not signaling a change in China’s monetary policy stance. Tighter monetary policy is not in the cards for this year. After having risen noticeably in late-March, Chinese onshore corporate bond spreads have fallen back to the low end of their trading range over the past 8 months. We continue to recommend that domestic investors hold a diversified portfolio of SOE corporate bonds, on the basis that actual bond defaults over the coming 6-12 months are likely to be materially lower than what investors are pricing in even though they are indeed likely to rise. Chart 7 shows that USD-HKD has eased somewhat over the past month from the top end of the band, and now trades closed at 7.845. This modest appreciation in HKD appears to have been catalyzed by a further reduction in the supply of interbank liquidity by the HKMA. While the appreciation in HKD is some modest good news for Hong Kong’s monetary authority, it remains reluctant to reduce liquidity in the system given how extremely weak loan growth is in Hong Kong. This implies that, barring a meaningful upturn in credit, a significant appreciation in HKD is not likely in the cards. Chart 6Interbank Repo Rates Are Not Trending Higher
Interbank Repo Rates Are Not Trending Higher
Interbank Repo Rates Are Not Trending Higher
Chart 7A Modest Appreciation In HKD (Which Is Not Likely To Continue)
A Modest Appreciation In HKD (Which Is Not Likely To Continue)
A Modest Appreciation In HKD (Which Is Not Likely To Continue)
Jonathan LaBerge, CFA, Vice President Special Reports jonathanl@bcaresearch.com Footnotes 1 Please see China Investment Strategy Weekly Report “In The Wake Of An Upgrade: An Investment Strategy Post-Mortem,” dated April 17, 2019, available at cis.bcaresearch.com 2 During a PBOC briefing on April 25, Deputy Governor Guoqiang noted that “no one can bear it if policy swings back and forth between tightening and loosening many times a year”. Cyclical Investment Stance Equity Sector Recommendations
It’s official, the Italian technical recession is over. Italian GDP growth moved back into positive territory in the first quarter. Additionally, Spanish GDP growth rebounded to 0.7% on a quarterly basis, or 2.4% year-on-year. Thanks to those two surprises,…
European domestic demand should benefit from an easing of fiscal policy of around 0.5% of GDP. Faster growth in the U.S. in relation to the euro area has caused the spread in expected interest rates to widen between the two regions. The spread in…
The upturn we anticipated in China’s industrial output in the wake of fiscal and monetary stimulus is becoming more visible. Accommodative central banks, along with a likely resolution of the Sino – U.S. trade war, will continue to be positive for Chinese growth, which will bolster trade and commodity demand in general, base metals’ demand in particular. However, not all base metals will benefit equally from this fortuitous confluence of fiscal and monetary stimulus, and the renewed credit growth directed at China’s small and mid-sized enterprises (SMEs). Of the metals we follow, copper likely will benefit most from Chinese stimulus and the knock-on effects from increased trade, with aluminum running a close second. Zinc and nickel will not enjoy as much of a lift, based on our analysis. We are adding a tactical long aluminum position to our open long copper position. Highlights Energy: Overweight. The Trump administration’s decision to let waivers expire on U.S. oil-export sanctions leveled on Iran will give OPEC 2.0 greater control over the Brent forward curve. In the near term, markets will not tighten sharply. However, longer term, the continued loss of Iran’s and Venezuela’s exports, further increases in Libyan tensions and unplanned outages will lift the odds refiners will have to draw inventories harder than expected going into the high-demand Northern Hemisphere summer. We expect this to backwardate the Brent curve further, and accelerate the full backwardation of the WTI forward curve. Presently, OPEC 2.0 holds ~ 1.5mm b/d of ready spare capacity, due to recent production cuts made to drain global inventory. There is ~ 1.5mm b/d of additional spare capacity in the Kingdom of Saudi Arabia (KSA) that would take longer to bring on line. The ready spare capacity can cover the ~ 1.3mm b/d or so that could be removed by the Iran waivers’ expiration. But, with global commodity demand remaining robust (see base metals analysis below), further unplanned outages – on top of the falling Venezuelan output and mounting tensions in Libya – will stress the supply side of the market. KSA this week communicated it would coordinate with other producers to keep oil markets balanced.1 Russia’s recent threat to reignite a market-share war also reminded the market OPEC 2.0 has capacity it can quickly bring to the market should it choose to do so. The expiration of waivers on the Iran export sanctions strengthens OPEC 2.0’s hand by allowing it to calibrate the rate of growth in flowing oil supply at a level that forces refiners and traders to draw inventory. The growing backwardation will lift implied volatilities in crude and products markets. Iran’s reaction remains to be seen.2 This geopolitical uncertainty also will contribute to price volatility as well. We will be publishing a Special Report on the implications of the Trump administration’s waivers decision next week with our colleagues at BCA’s Geopolitical Strategy. Base Metals: Neutral. We expect copper to benefit from Chinese fiscal and monetary stimulus, moreso than the other base metals we follow (aluminum, nickel and zinc). We explore this in depth below. Precious Metals: Neutral. Gold prices continue to face downward pressures, the latest coming from Venezuela’s sale of ~ $400 million worth of the metal (~ 9 tons) last week, despite international sanctions.3 Going forward, China’s credit stimulus should revive global growth, which will negatively affect the counter-cyclical U.S. dollar. Our Global Investment strategists closed their long U.S. dollar recommendation last week. This will support gold in the 2H19. Feature The evolution of China’s credit cycle is key to our base-metals view, and integral to our high-conviction call commodity demand will surprise to the upside. Globally, the real economy is once again finding its groove. Maybe not as groovy as 2017, but still better than 2018. China is implementing tax cuts amounting to almost $300 billion (~ 2 trillion RMB), and loosening the credit screws that last year ground economic activity lower.4 Central banks around the world either are accommodative, or are not aggressively tightening. The evolution of China’s credit cycle is key to our base-metals view, and integral to our high-conviction call commodity demand will surprise to the upside beginning in the current quarter and extending into 2H19. And China’s credit growth has been stout this year. Aggregate China financing came in stronger than expected for March, registering a 12.3% year-over-year gain, versus an increase of 11.6% in February, based on calculations made by our colleagues in BCA’s Global Investment Strategy (GIS) service.5 The pick-up in the rate of growth – the so-called credit impulse – typically leads the import component of China’s manufacturing PMI, according to our GIS colleagues. This is good news for firms exporting to China, as well, as it indicates industrial activity ex-China also will pick up as fiscal and monetary stimulus take hold in the Middle Kingdom. So, putting it together: China’s fiscal and monetary stimulus will radiate outward to EM markets generally and DM export-oriented economies, which will lift base metals markets generally. China’s demand still dominates global demand, which means it also impacts prices globally (Chart of the Week).
Chart 1
Base Metals Sensitivity To Fundamental Information Given its importance to global growth, we again look at China’s effect on base metals prices – via demand – by ranking the metals we closely follow based on their sensitivity to China’s industrial activity and credit, along with our BCA Global Industrial Activity (GIA) Index. Table 1 shows the relationships between the year-on-year (y/y) percent changes in base metals, and the LME index versus the big correlates we have identified over the years with these metals: BCA’s GIA Index, our China credit policy gauge, China construction proxy, internally developed risky-versus-safe haven currency ratio and the Li Keqiang Index (LKI) of domestic Chinese industrial activity. We look at these from 2000 to now, and in the post-GFC period (2010 to now). Table 1Correlations Of Base Metals’ Prices (y/y % Change) Vs. Key Economic Variables
Copper Will Benefit Most From Chinese Stimulus
Copper Will Benefit Most From Chinese Stimulus
Two things stand out in this analysis: The GIA index, which is heavily weighted to EM demand, is a key driver for all of the LME base metals prices, and the LME Index itself;6 Copper is the most sensitive to all of these variables vs. the other base metals. The LME Index (LMEX) is the next-most-sensitive gauge. In the case of the latter, it likely is copper’s weight in the index driving this result (copper is 31.2% of the LMEX), and the fact that other metals tend to follow copper’s lead. Post-GFC, the correlations with BCA’s GIA index, our China Construction proxy and the LKI index all become stronger, suggesting rising Chinese demand and the global quantitative easing have had a fundamental effect on base metals prices. The weakening of the correlations once the analysis moves beyond copper and the LMEX indicates either the other base metals are not processing information from the market – supply-demand fundamentals and global monetary data – or these commodities’ fundamentals are more opaque than those available from the copper market. The other outstanding feature of this analysis is that post-GFC, the correlations with BCA’s GIA index, our China Construction proxy and the LKI index all become stronger, suggesting rising Chinese demand and the global quantitative easing have had a fundamental effect on base metals prices. We will be examining this in future research. Bottom Line: China’s impact on base metals prices is complex. Its internal demand obviously is significant, which is not unexpected for the market that accounts for ~ 50% of base metals demand globally. We also see evidence China’s economy influences EM ex-China, and DM economies – most likely those heavily reliant on exports to China. Fiscal and monetary stimulus in China will radiate outward and influence global growth – in EM and DM economies. This is a positive fundamental for base metals. Robert P. Ryan, Chief Commodity & Energy Strategist rryan@bcaresearch.com Hugo Bélanger, Senior Analyst Commodity & Energy Strategy HugoB@bcaresearch.com Appendix: Global Base Metals Balances
Image
Image
Image
Image
Footnotes 1 Please see “Saudi Arabia says to coordinate with other producers to ensure adequate oil supply,” published by reuters.com April 22, 2019. 2 According to the state-run Fars news agency, Iran’s head of the Revolutionary Guard Corps Navy force threatened it will close the Strait of Hormuz if the country is prevented from using it. Please see “Iran Raises Stakes in U.S. Showdown With Threat to Close Hormuz,” published April 22, 2019 by bloomberg.com. 3 Please see “Venezuela Is Said to Sell $400 Million in Gold Amid Sanctions,” published April 15, 2019 by bloomberg.com. 4 We added a measure of China’s credit cycle to our Global Industrial Activity (GIA) index last month. We noted China’s credit cycle was showing signs of bottoming. We now are expecting to see growth in the current quarter. Please see “Bottoming Of China’s Credit Cycle Bullish For Copper Over Near Term,” published by BCA Research’s Commodity & Energy Strategy March 14, 2019. It is available at ces.bcaresearch.com. 5 GIS’s aggregate financing measure excludes equity financing and other items but includes local government bond issuance. Please see “Chinese Debt: A Contrarian View,” published by BCA Research’s Global Investment Strategy April 19, 2019. It is available at gis.bcaresearch.com. 6 This is because the index is constructed to be sensitive to EM industrial-commodity demand growth. Please see “Oil, Copper Demand Worries Are Overdone,” where we introduce and discuss the GIA index. The article was published February 14, 2019, in BCA Research’s Commodity & Energy Strategy. It is available at ces.bcaresearch.com. Investment Views and Themes Recommendations Strategic Recommendations Tactical Trades TRADE RECOMMENDATION PERFORMANCE IN 2019 Q1
Image
Commodity Prices and Plays Reference Table Trades Closed in 2019 Summary of Closed Trades
Image
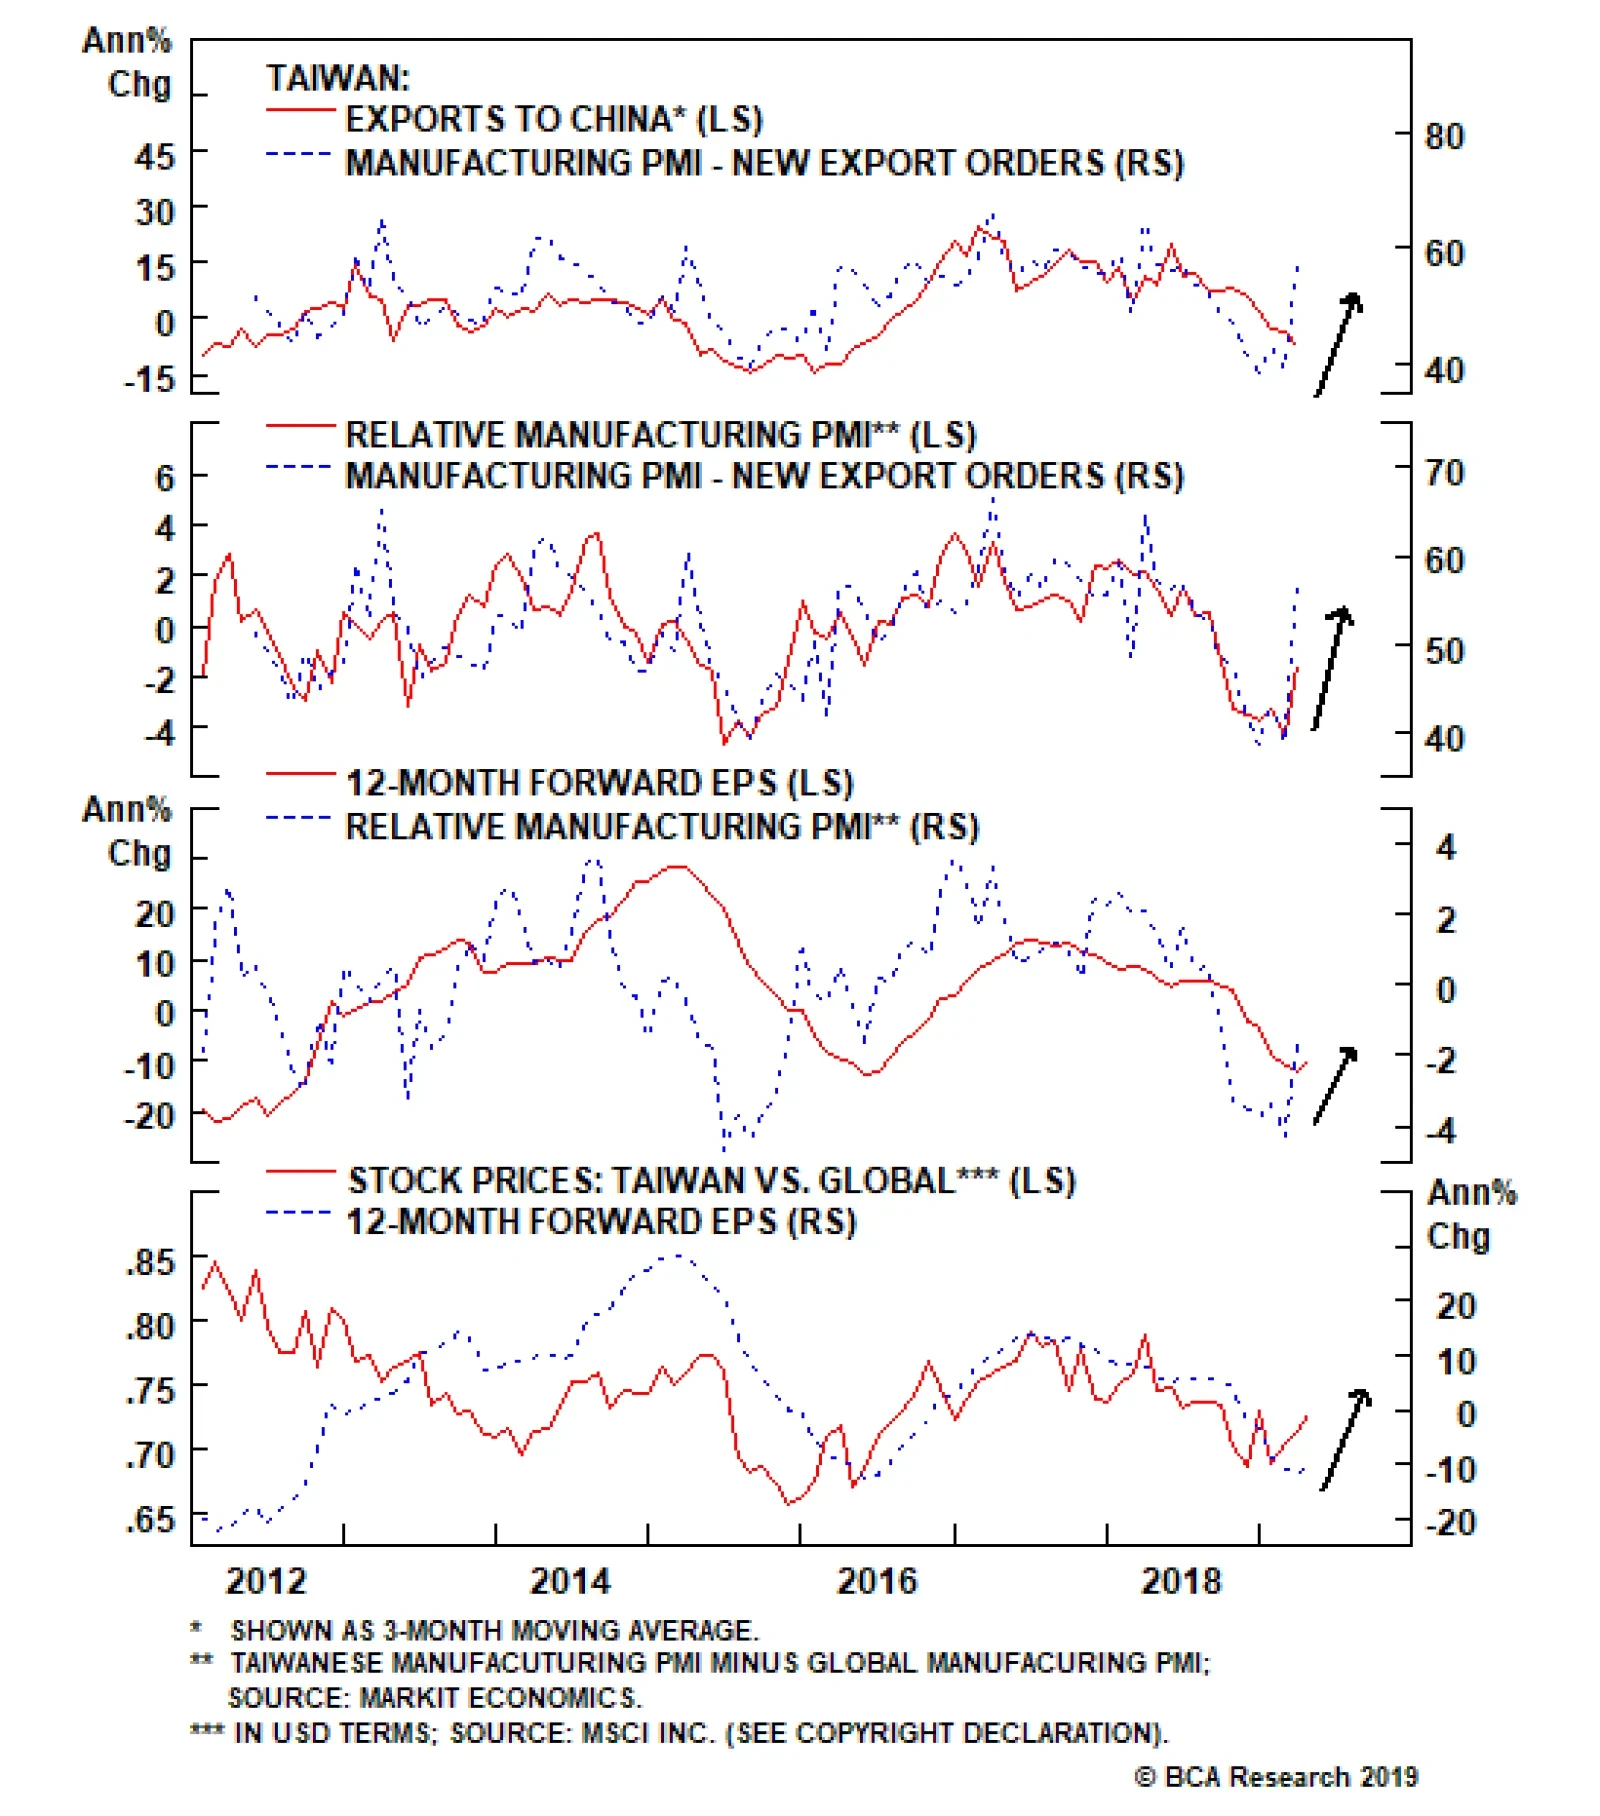
Taiwanese relative performance already reflects some expected improvement in Chinese growth, but we believe that investors stand to gain further over the coming year. The chart above presents the cyclical case for Taiwanese stocks in a nutshell. Panels 1…
Highlights The short-term trade is to overweight the DAX or Euro Stoxx 50… …versus German bunds or the S&P 500. These trades have outperformed since late last year and can continue to do so for a while longer. But moving into the second half of the year, it will be time to take profits in these growth-sensitive trades. The long-term position is to own German real estate equities. The hedged position is long German real estate equities, short Swedish real estate equities. Feature Let’s begin with a trivia question. What do Germany, Finland, and Ireland have in common, that the other EU28 countries do not have? Chart of the WeekEuro Stoxx 50 Vs. S&P500 And EM Vs. DM Have Followed Near Carbon Copy Profiles
Euro Stoxx 50 Vs. S&P500 And EM Vs. DM Have Followed Near Carbon Copy Profiles
Euro Stoxx 50 Vs. S&P500 And EM Vs. DM Have Followed Near Carbon Copy Profiles
The answer: Germany, Finland, and Ireland are the only three European countries that have a trade surplus with China.1 Germany Catches A Cold When China Sneezes… Chart 2Slowdown In Germany And Finland, No Slowdown In France And Spain
U.S. GDP Growth Slowed By 1.5 Percent Slowdown In Germany And Finland, No Slowdown In France And Spain
U.S. GDP Growth Slowed By 1.5 Percent Slowdown In Germany And Finland, No Slowdown In France And Spain
Germany and Finland are the European economies most exposed to China, with 17 percent and 14 percent respectively of their extra-EU28 exports heading to the dominant emerging economy (for Ireland it is only 7 percent). This equates to almost 3 percent of GDP for Germany and around 1.5 percent for Finland. Hence, when China sneezes – as it did last year – Germany and Finland are the European economies most likely to catch a cold. It is not a coincidence that Germany and Finland suffered near identical short-term slowdowns in 2018 with the pain focussed in the third quarter. By contrast, the European economies with much less exposure to China – say, France and Spain – suffered no discernible slowdown (Chart I-2). In fact, Spain seemed completely unaffected, growing at a steady and robust 2 percent clip throughout 2018! The corollary is that when China rebounds – as it has recently – Germany and Finland are the European countries most likely to benefit. Since early January, Germany’s DAX has outperformed the 10-year German bund by 15 percent. For the past three months, the DAX has also outperformed the S&P 500, albeit modestly. The trends can continue for a while, but be warned: these short-term cyclical moves are likely to reverse later in the year, perhaps viciously. More about this later. …But Germany’s Structural Growth Model Has Changed Germany’s gross exports of €1.6 trillion equate to almost half of its €3.4 trillion economy. Inevitably, this makes the German economy highly vulnerable to down-oscillations in global growth as, for example, when China sneezes. But here’s the paradox: while the level of German exports is very high, it has been flat-lining at this elevated level since 2012 (Chart I-3). Hence, Germany is no longer deriving any structural growth from its export sector. All of Germany’s post-2012 structural growth has come from domestic demand. Germany’s structural growth model has changed. Through 1999-2007, Germany’s net export contribution accounted for the vast majority of its structural growth; and in 2008, net exports accounted for two-thirds of Germany’s severe economic contraction. But remarkably, since 2012, net exports have made no contribution to Germany’s structural growth (Chart I-4). Meaning that all of Germany’s post-2012 structural growth has come from domestic demand. Chart 3The Level Of German Exports Is High But Flat-Lining
The Level Of German Exports Is High But Flat-Lining
The Level Of German Exports Is High But Flat-Lining
Chart 4Since 2012, Net Exports Have Made No Contribution To Germany's Structural Growth
Since 2012, Net Exports Have Made No Contribution To Germanys Structural Growth
Since 2012, Net Exports Have Made No Contribution To Germanys Structural Growth
One manifestation of this is the post-2012 recovery in Germany’s real estate market. When Germany was deriving most of its growth from external demand, the domestic real estate market withered. In recent years, when growth has come from domestic demand, Germany’s real estate market has started to flourish (Chart I-5). Chart 5German Real Estate Prices Still Need To Catch Up
German Real Estate Prices Still Need To Catch Up
German Real Estate Prices Still Need To Catch Up
Chart 6German Real Estate Book Values Have Trebled
German Real Estate Book Values Have Trebled
German Real Estate Book Values Have Trebled
With Germany’s average house price, in real terms, at the same level as it was in 1995, there is still considerable upside outside the major cities such as Berlin, Frankfurt, and Munich. Especially so, because one of the main enemies of the real estate market – substantially higher bond yields – will be absent for some time.2 The strong performance of German real estate equities – a near trebling since 2012 – is just tracking the strong performance of their book values (Chart I-6), which itself is a leveraged function of real estate prices. On the basis that the real estate sector is benefiting from a structural tailwind, the sector is a long-term hold, but for those who want to hedge their exposure, the recommendation is: long German real estate equities, short Swedish real estate equities. What Is Driving Euro Stoxx Outperformance? In response to this week’s title question, some people will ask: has Euro Stoxx 50 outperformance even started? The answer is a clear yes. Relative to both global equities and the S&P 500, the Euro Stoxx 50 has been in a well-established – though modest – uptrend since last September. Interestingly, emerging markets (EM) versus developed markets (DM) has followed a near carbon copy profile, albeit the outperformance was front-end loaded (Chart of the Week and Chart I-7). Euro Stoxx 50 has been gently outperforming. Can this continue? Recent history is not very encouraging. Since the Global Financial Crisis, no bout of Euro Stoxx 50 outperformance has lasted more than a year (Chart I-8). If this pattern continues to hold, it implies that the current bout of Euro Stoxx 50 outperformance will be exhausted within another four months. Chart 7Euro Stoxx 50 Has Been Gently Outperforming
Euro Stoxx 50 Has Been Gently Outperforming
Euro Stoxx 50 Has Been Gently Outperforming
Chart 8Euro Stoxx 50 Vs. S&P500 ##br##Follows…
Euro Stoxx 50 Vs. S&P500 Follows
Euro Stoxx 50 Vs. S&P500 Follows
Chart 9…Euro Area Banks Vs. U.S. Tech
Euro Area Banks Vs. U.S. Tech
Euro Area Banks Vs. U.S. Tech
Could it be different this time? We think not. Euro Stoxx 50 performance relative to the S&P 500 lines up almost perfectly with the relative performance of euro area banks versus U.S. tech (Chart I-9). Given that this defines the sector skew ‘fingerprint’ of the relative position, this defining relationship is fundamental. Meaning that for the Euro Stoxx 50 to outperform the S&P 500 on a sustained basis, euro area banks have to outperform U.S. tech. Likewise, EM versus DM lines up almost perfectly with the relative performance of global resources versus global healthcare (Chart I-10 and Chart I-11). Again, this is not surprising as this just defines the sector skew fingerprint of EM versus DM. Admittedly, in this case the causality could sometimes run from the EM economy to the sector performance – given China’s role in driving resource demand – rather than from sector relative performance to EM versus DM. Nevertheless, for EM to outperform DM, resources have to outperform healthcare. EM versus DM lines up almost perfectly with the relative performance of global resources versus global healthcare. Since last autumn, Euro Stoxx 50 versus S&P 500 and EM versus DM have followed near carbon copy profiles because growth-sensitive financials and resources have outperformed less growth-sensitive technology and healthcare. Chart 10EM Vs. DM Follows…
10. EM Vs. DM Follows
10. EM Vs. DM Follows
Chart 11…Basic Resources Vs. Healthcare
Basic Resources Vs. Healthcare
Basic Resources Vs. Healthcare
From Sweet Spot To Weak Spot Nevertheless, there is a puzzle: why have growth-sensitive sectors, the DAX, Euro Stoxx 50, and EM outperformed since late last year when the high-profile hard economic data – such as GDP growth and CPI inflation – have been unambiguously weak? High-profile hard data are a record of what happened in the past. The simple answer is that these high-profile hard data are a record of what happened in the past, sometimes the distant past. Yet they matter because central banks’ increasingly ‘data dependent’ reaction functions have become slaves to this backward-looking data. Here’s the paradox: the ‘sweet spot’ for growth-sensitive sectors and markets is when the high-profile backward-looking data – GDP and inflation – are actually weak, while real-time measures of growth – such as short-term credit impulses – are strengthening. This creates a win-win for markets because the dovish pivot by data-dependent central banks lifts asset valuations and the acceleration in real-time growth lifts profit expectations. Sound familiar? It describes the situation since last autumn, and explains why the DAX, Euro Stoxx 50, and EM have outperformed. Now comes the unfortunate corollary: the ‘weak spot’ for growth-sensitive sectors and markets is when the high-profile backward-looking data are strong, while real-time measures of growth – such as short-term credit impulses – are weakening. This is a lose-lose for markets because the hawkish pivot by central banks weighs on asset valuations and the deceleration in real-time growth depresses profit expectations. Almost certainly, this will be the situation later in the year as the high-profile hard data starts to perk up – removing some of the central bank support for valuations – just as short-term credit impulses inevitably roll over – weighing on profit growth expectations. To sum up, growth-sensitive sectors, the DAX, and Euro Stoxx 50 have outperformed since late last year, especially versus bonds and cash – in line with our house view. These trends can continue for a while longer. But moving into the second half of the year, these growth-sensitive positions will transition from sweet spot to weak spot, and it will be time to take profits. As ever, we will tell you when. Stay tuned. Dhaval Joshi, Chief European Investment Strategist dhaval@bcaresearch.com Fractal Trading System* This week, we note that that the 65-day fractal dimension for technology versus healthcare is at an all-time low – implying that the recent strong outperformance is highly vulnerable to a technical reversal. Accordingly, this week’s recommended trade is short technology versus healthcare with a profit target of 6.5 percent and a symmetrical stop-loss. In other trades, we are pleased to report that long aluminium versus tin achieved its 6.5 percent profit target at which it was closed. This leaves five open positions. For any investment, excessive trend following and groupthink can reach a natural point of instability, at which point the established trend is highly likely to break down with or without an external catalyst. An early warning sign is the investment’s fractal dimension approaching its natural lower bound. Encouragingly, this trigger has consistently identified countertrend moves of various magnitudes across all asset classes. Chart I-10
Short Tech Versus Healthcare
Short Tech Versus Healthcare
The post-June 9, 2016 fractal trading model rules are: When the fractal dimension approaches the lower limit after an investment has been in an established trend it is a potential trigger for a liquidity-triggered trend reversal. Therefore, open a countertrend position. The profit target is a one-third reversal of the preceding 13-week move. Apply a symmetrical stop-loss. Close the position at the profit target or stop-loss. Otherwise close the position after 13 weeks. Use the position size multiple to control risk. The position size will be smaller for more risky positions. * For more details please see the European Investment Strategy Special Report “Fractals, Liquidity & A Trading Model,” dated December 11, 2014, available at eis.bcaresearch.com. Footnotes 1 Based on the EU28 net exports of goods to China in 2018 by Member State. 2 Please see the European Investment Strategy Weekly Report ‘Monetarists, Keynesians, And Modern Monetary Theory’ April 11 2019 available at eis.bcaresearch.com. Recommendations Asset Allocation Equity Regional and Country Allocation Equity Sector Allocation Bond and Interest Rate Allocation Currency and Other Allocation Closed Fractal Trades Trades Closed Trades Asset Performance Currency & Bond Equity Sector Country Equity Indicators Bond Yields Chart II-1Indicators To Watch - Bond Yields
Indicators To Watch - Bond Yields
Indicators To Watch - Bond Yields
Chart II-2Indicators To Watch - Bond Yields
Indicators To Watch - Bond Yields
Indicators To Watch - Bond Yields
Chart II-3Indicators To Watch - Bond Yields
Indicators To Watch - Bond Yields
Indicators To Watch - Bond Yields
Chart II-4Indicators To Watch - Bond Yields
Indicators To Watch - Bond Yields
Indicators To Watch - Bond Yields
Interest Rate Chart II-5Indicators To Watch - Interest Rate Expectations
Indicators To Watch - Interest Rate Expectations
Indicators To Watch - Interest Rate Expectations
Chart II-6Indicators To Watch - Interest Rate Expectations
Indicators To Watch - Interest Rate Expectations
Indicators To Watch - Interest Rate Expectations
Chart II-7Indicators To Watch - Interest Rate Expectations
Indicators To Watch - Interest Rate Expectations
Indicators To Watch - Interest Rate Expectations
Chart II-8Indicators To Watch - Interest Rate Expectations
Indicators To Watch - Interest Rate Expectations
Indicators To Watch - Interest Rate Expectations
3. Chinese Debt Growth Is Sustainable Much of China’s debt stock is composed of state-owned enterprise, local government, and other forms of quasi-public sector debt. Credit policy in China is often indistinguishable from fiscal policy. Given the abundant…
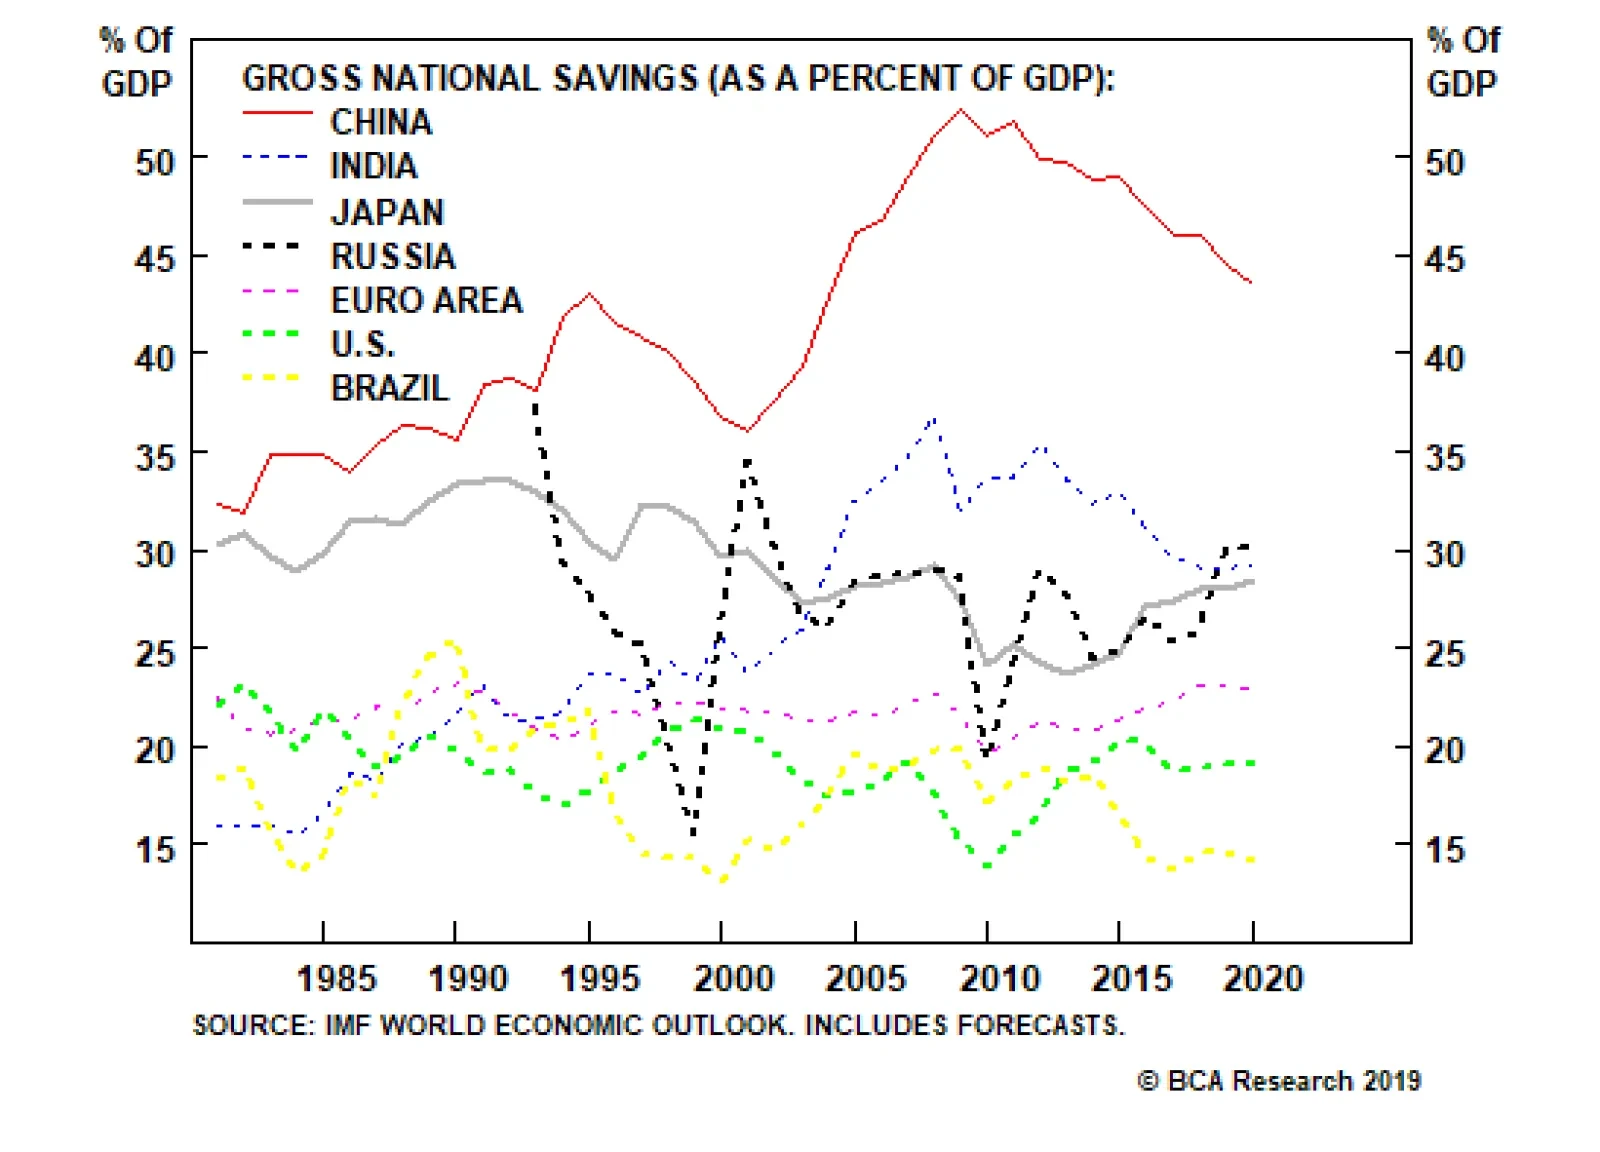
Long-term investors should steer clear of any growth-sensitive assets. It is a seductive argument. But our Global Investment Strategy service argues that it is wrong. Chinese re-leveraging is: 1) inevitable; 2) desirable; and 3) sustainable. 1. Chinese…
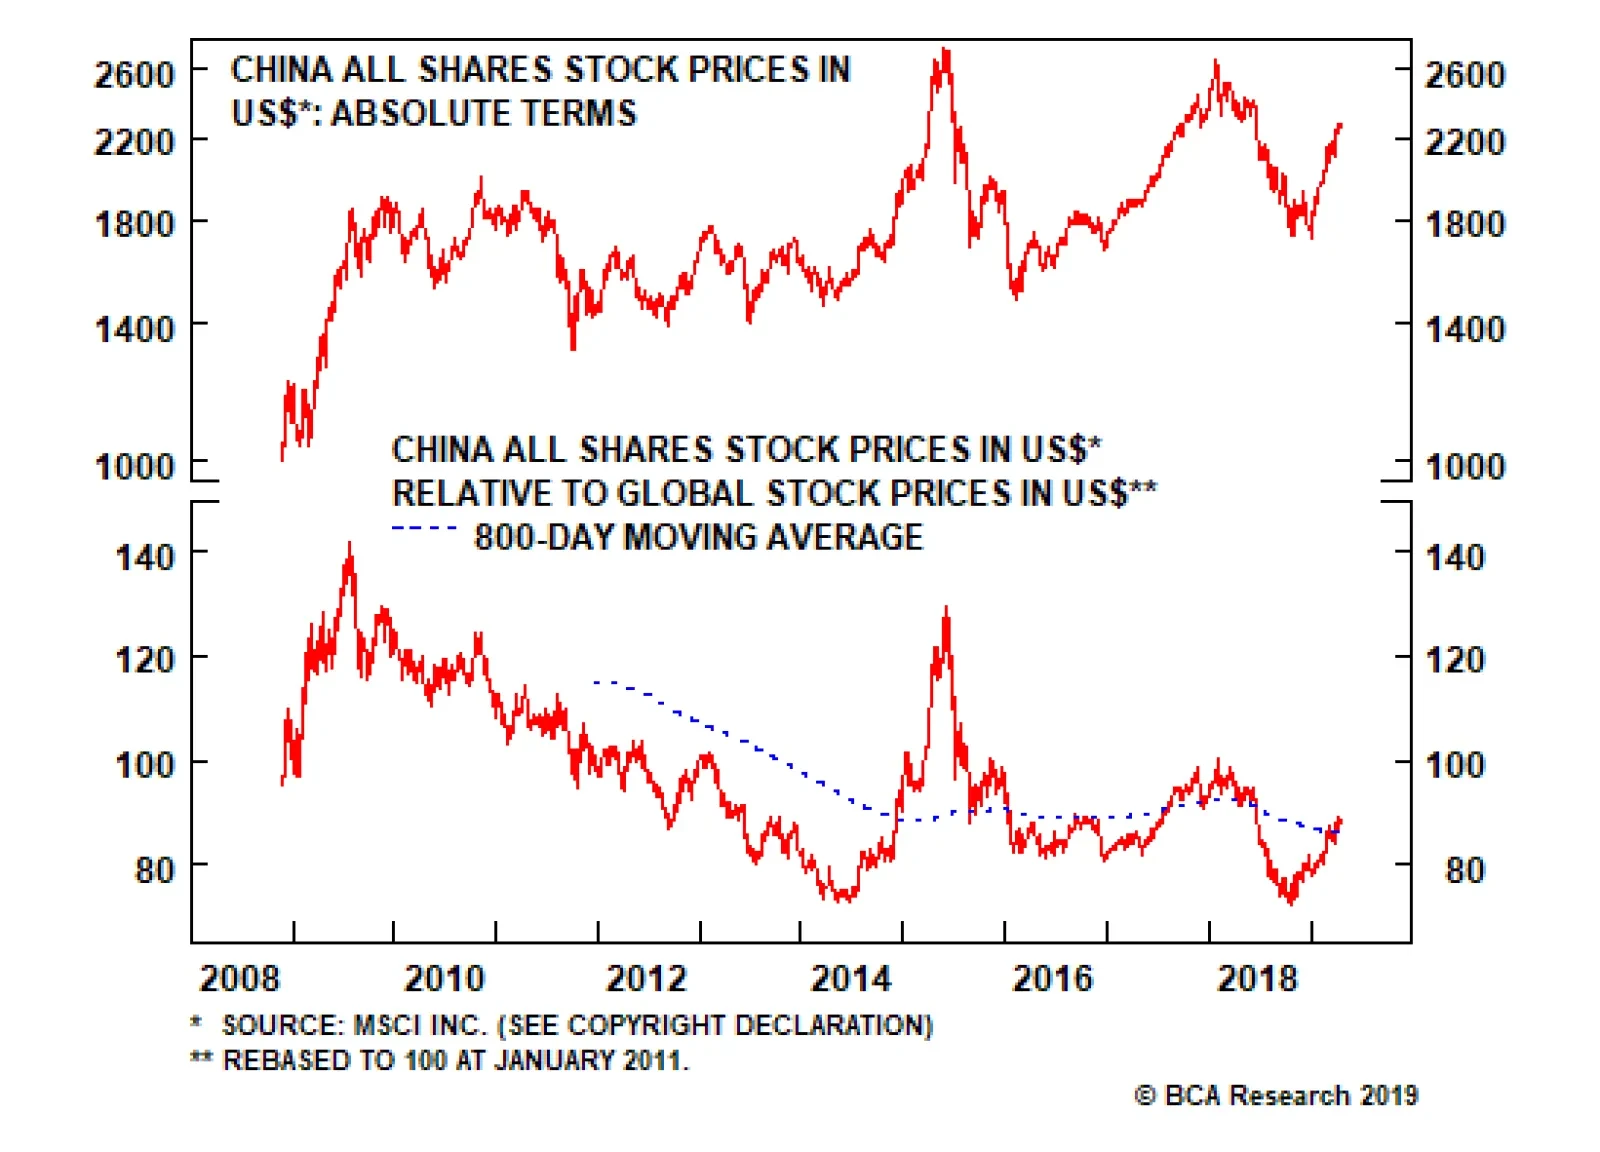
In reality, however, economic and especially financial market mini-cycles are not symmetric, and investors can make money only if they time them properly. In fact, this decade Chinese share prices – both in absolute terms and relative to global stocks – have…
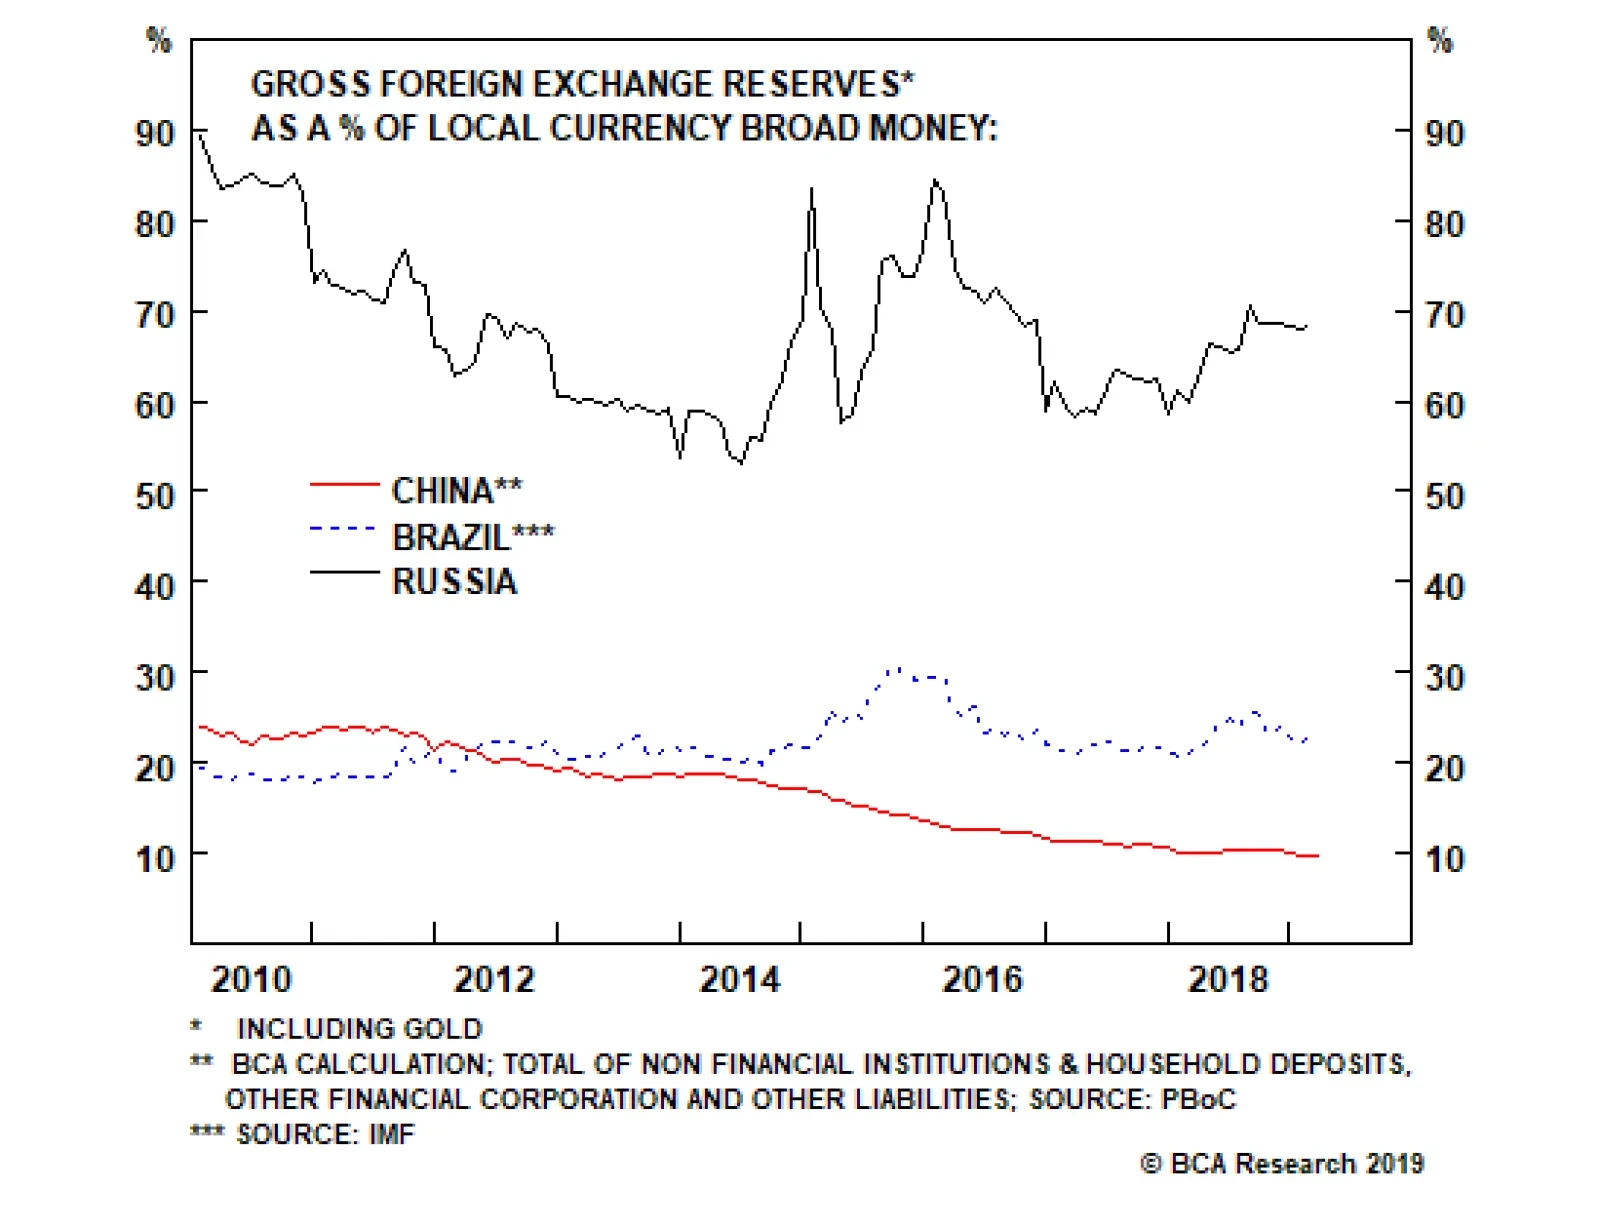
Chinese households and businesses are eager to diversify their copious and mushrooming renminbi deposits into foreign currencies and assets. The PBoC’s foreign exchange reserves of $3 trillion are equal to only 10% of the amount of yuan deposits and cash in…