China

Feature This week, instead of our regular Weekly Report, we will answer clients’ most frequently asked questions (FAQs) from our recent marketing trip to the old continent. Table 1 lists these questions and below we will attempt to weave a cohesive piece and answer all of these interesting questions. Clients inquiring about “how is everyone else positioned” or the related “what is the general investor sentiment like” is by far the most FAQ we always get from the road and we purposefully omit it from Table 1. Table 1Most FAQs From The Road
10 Most FAQs From The Road
10 Most FAQs From The Road
During our last three developed markets (DM) trips, while we cannot comment on the positioning question, with regard to general investor sentiment, Australia and New Zealand are off the charts bullish. On the opposite end of the spectrum, Europe is extremely bearish, especially continental Europe. The U.S. is somewhere in the middle. Chart 1Fed’s Pivot On Display
Fed’s Pivot On Display
Fed’s Pivot On Display
With that out of the way, the recent broadening out of the U.S. yield curve inversion to the 10/fed funds rate took center stage in our client interactions, especially the implications of the inversion for sector positioning and the duration of the business cycle. To set the record straight, a yield curve inversion does not forecast recession. Instead, it explicitly signals that the market expects the Fed’s next move to be an interest rate cut (top panel, Chart 1). In that context, the yield curve has never had a false-positive reading. Even in May 1998, it accurately forecast that the Fed would decrease the fed funds rate as it actually did in the fallout of the LTCM meltdown later that year (bottom panel, Chart 1). As equity investors, what consumes us is the SPX’s performance following the yield curve inversion. On that front, mid-December last year we showed the results of our research and made a simple observation that the yield curve inversion almost always takes place prior to the S&P peak (Table 2, Charts 2 & 3). Table 2Yield Curve Inversions And S&P 500 Peaks
10 Most FAQs From The Road
10 Most FAQs From The Road
Chart 2
Chart 3…And Then The SPX Peaks
…And Then The SPX Peaks
…And Then The SPX Peaks
In addition, today we show the S&P 500’s return and the sector returns from the time the 10/2 yield curve slope inverts until the S&P peaks, and we summarize the results in Table 3. Table 3Sector Returns From Y/C Inversion To SPX Peak
10 Most FAQs From The Road
10 Most FAQs From The Road
While every cycle is different, clearly it pays to have energy exposure more often than not. In contrast, high-yielding defensive sectors like utilities and telecom services fare poorly in these late-cycle iterations. Meanwhile, Table 4 highlights sector performance from the SPX peak until the U.S. recession hits. We first showed these results on May 22, 2018, and we are on track to publish a Special Report on May 5 on how to position portfolios at the onset of a Fed easing cycle, so stay tuned. Table 4Defensive Stocks Beat Late
10 Most FAQs From The Road
10 Most FAQs From The Road
Investors remain infatuated with the recession signal that the yield curve inversion emits. Moreover, recent news of an onslaught of Unicorn IPOs that would bring stock supply to the equity market, near the $100bn mark on an annualized basis according to some estimates, have also brought forward recession fears, as smart money is cashing in on their investments. Chart 4 shows that $100bn per annum in IPOs has coincided with the SPX peak in the previous two cycles. Our long-held view remains that either a mega M&A deal in the tech or biotech space or Uber’s IPO at a stratospheric valuation could serve as the anecdote that confirms the current cycle’s peak. On the yield curve front specifically, the top panel of Chart 5 shows that the most important yield curve, the 10/2, has not yet inverted. Moreover, the 30/10 and the 30/5 slopes are steepening. True, we are late cycle, but we need all the slopes to invert to get a confirmation that the recession is a foregone conclusion. Chart 4Mind The Excess Supply
Mind The Excess Supply
Mind The Excess Supply
Chart 510/2 Y/C Has Yet To Invert
10/2 Y/C Has Yet To Invert
10/2 Y/C Has Yet To Invert
The Fed’s tightening cycle has not only inverted most parts of the yield curve starting early last December, but has inflicted some damage on profit margins. Following up from our recent profit margin work highlighting nil corporate pricing power at a time when wage costs are perking up, BCA’s Monetary Indicator signals more SPX margin pain in the coming months (Chart 6). In fact, sell-side estimates call for another three consecutive quarters of a year-over-year contraction in profit margins. Chart 6Margin Trouble
Margin Trouble
Margin Trouble
In more detail, the earnings deceleration that commenced in Q4 2018 and is gaining steam is disconcerting. As a reminder, Q4 included the lower corporate tax rate and the Q/Q deceleration is not solely due to the tech sector profit warnings. Eight out of the 11 GICS1 sectors sharply decelerated, two modestly accelerated and only industrials steeply accelerated to a cyclical EPS peak growth rate (Table 5). This EPS breadth deterioration is eerily reminiscent of early-2015 (Chart 7) and is disquieting. Short-term caution is also warranted given the increase in investor complacency. The one sided positioning in the VIX futures market is worrisome. As a reminder, net speculative positions are now at a lower low than the February 2018 level when the VIX snapped to over 50 and caused a massive tremor in the equity market (net speculative positions shown inverted, Chart 8). Table 5Historical/Current/Future Earnings Growth Rates
10 Most FAQs From The Road
10 Most FAQs From The Road
Chart 7Bad Breadth
Bad Breadth
Bad Breadth
Chart 8Too Complacent
Too Complacent
Too Complacent
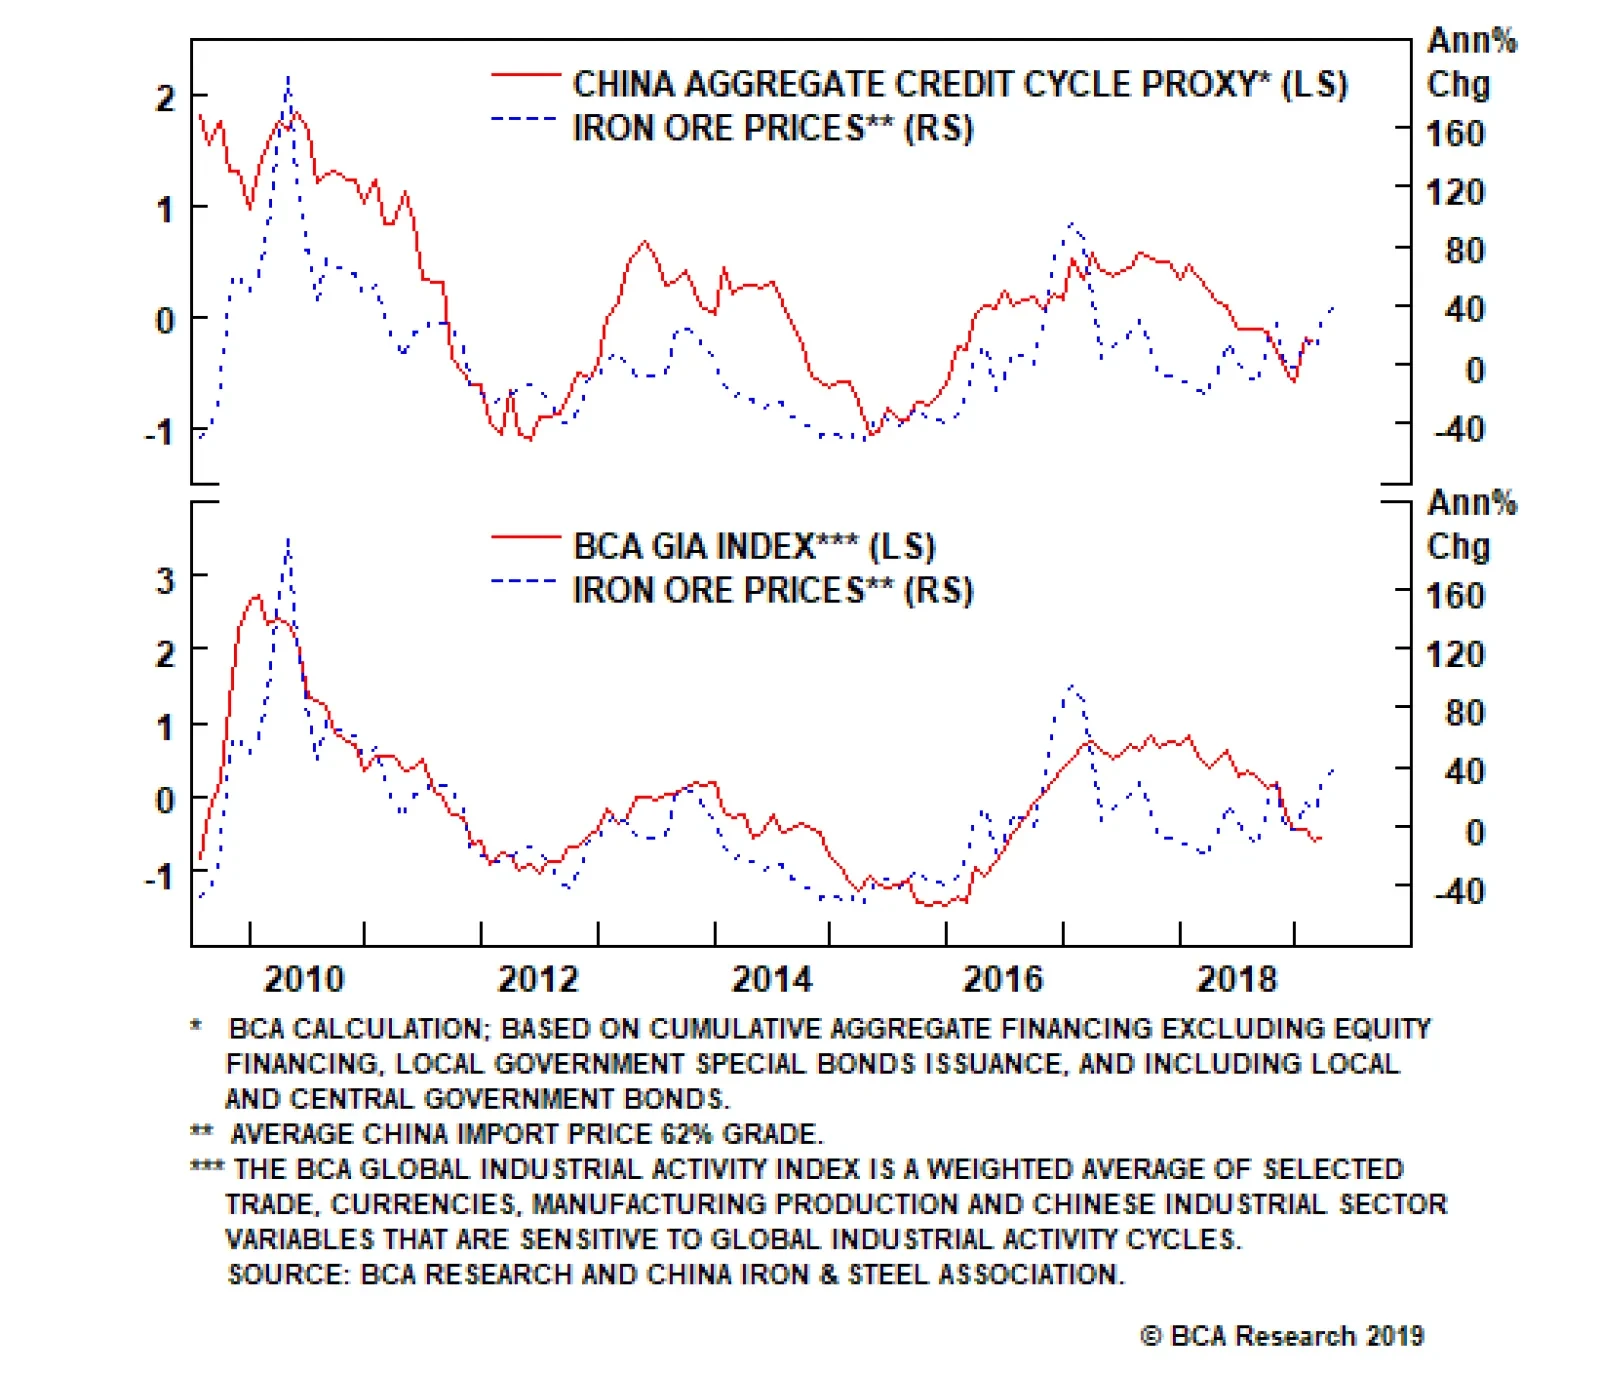
But, before getting overly bearish there are some growth green shoots that suggest that Q2-to-Q3 will likely mark the trough in EPS/EBITDA growth and margins (Chart 9). Beyond these positive leading profit indicators, a resolution to the U.S./China trade tussle and China’s trifecta of policy easing measures will also aid in turning profit growth around and really power up U.S. cyclicals’ EPS growth rates. Following up from the January Fed meeting, on February 4 we penned a report titled “Don’t Fight The PBoC” and it is now clear with the recent manufacturing PMI release that China’s easing on all three fronts – credit (Chart 10), monetary (Chart 11) and fiscal (Chart 12) – is starting to pay some dividends. In that light, the U.S. cyclicals vs. U.S. defensives recent outperformance has more room to run. Chart 9Growth Green Shoots
Growth Green Shoots
Growth Green Shoots
Chart 10Chineasing…
Chineasing…
Chineasing…
Chart 11...On All…
...On All…
...On All…
Chart 12…Fronts
…Fronts
…Fronts
Deep cyclicals have another major advantage this cycle compared with defensives. While at this stage of the business cycle one would expect capital intensive businesses to become debt saddled, cyclicals are still de-levering from the depths of the late-2015/early-2016 manufacturing recession, i.e. paying down debt and increasing cash flow. Defensives, however, are doing the exact opposite with relative cash flow growth problems and piling on debt. Thus, on a relative basis Chart 13 shows that the indebtedness profile clearly favors deep cyclicals vs. defensives. From a bigger picture perspective, while the U.S. has not really purged any debt and it has just shifted it around from the financial and household sectors to the non-financial business and government sectors (Chart 14), the near all-time high in non-financial business sector credit as a share of GDP is disconcerting (top panel, Chart 14). Clearly the excesses are in this segment of U.S. debt and it is unsurprising that debt saddled stocks have been underperforming equities with pristine balance sheets since the 2016 presidential elections (top panel, Chart 15). Such outperformance has staying power, especially given that we are late in the cycle and the Fed has raised interest rates to the point where parts of the yield curve are inverted and a default cycle looms large (bottom panel, Chart 15). Chart 13Cyclicals Have The Upper Hand
Cyclicals Have The Upper Hand
Cyclicals Have The Upper Hand
Chart 14U.S. Debt Profile Breakdown
U.S. Debt Profile Breakdown
U.S. Debt Profile Breakdown
One sub-sector that epitomizes the current cycle’s excesses is commercial real estate (CRE). CRE prices have overshot the historical time trend by almost two standard deviations and it has already been three and a half years since they surpassed the previous all-time high (Chart 16). The recent pullback in the 10-year Treasury yield has pushed cap rates even lower and the bubble in CRE is further inflated. Looking back at the late-1980s pricking of that CRE bubble is instructive and when this cycle ends a big deflationary impulse will likely deal a blow to the CRE market. Chart 15Hide In Pristine Balance Sheets
Hide In Pristine Balance Sheets
Hide In Pristine Balance Sheets
Chart 16CRE Excesses Are A Yellow Flag
CRE Excesses Are A Yellow Flag
CRE Excesses Are A Yellow Flag
Speaking of bubbles, the biggest bubble we currently see is not in equities, but in bonds. Table 6 shows that red is taking over and is reminiscent of mid-year 2016 when the 10-year U.S. Treasury yield troughed a hair above 1.3%. Globally, negative yielding debt is near all-time highs (Chart 17) and the excesses are even larger in the EM sovereign space and in select DM corporates. Mexico raising century debt in U.S. dollars, in cable and in euros is perplexing, as Mexico was at the epicenter of the 1982 LatAm crisis and again in 1994 with the Tequila crisis. Argentina also raising century debt recently in hard currency speaks to the magnitude of the current bond bubble. On the corporate side, Sanofi and LVMH placing negative yielding debt is beyond our understanding, or Total issuing a perpetual bond with a 1.75% coupon. Table 6Red Takes Over
10 Most FAQs From The Road
10 Most FAQs From The Road
Chart 17Bonds Are In A Bubble
Bonds Are In A Bubble
Bonds Are In A Bubble
All of this is likely linked to the unintended consequences of global QE where fixed income investors are pushed out the risk spectrum and are forced into buying riskier credit. When this bond bubble gets pricked it will end in tears as it always does and the catalyst will likely be the next U.S. recession that will cause a global recession. While our cyclical 9-to-12 month equity market view is constructive and we believe the U.S. will avoid recession, our structural 1-to-3 year view is negative. Nevertheless, we constantly challenge our thesis and the biggest pushback to the negative structural view is the following: What if the Fed can engineer a soft landing in the U.S. as it did twice in the mid-1990s, and the business cycle runs hot for another 5 years (Chart 18)? What if the starting point of low interest rates with the real fed funds rates still close to zero is very stimulative for the U.S. economy as no recession has ever started with a fed funds rate perched near zero (Chart 19)? Finally, what if the late-2015/early-2016 manufacturing recession was actually an economic recession despite the fact that the NBER did not designate it as such and the business cycle got reignited, especially with President Trump’s election that lifted animal spirits? As a reminder, while S&P profits have contracted outside of an economic recession twice before, SPX sales had never achieved that feat, until late-2015/early-2016 (Chart 20). In other words, the revenue recession we had was unprecedented and felt like an economic recession. Chart 18The Fed Has Engineered A Soft Landing
The Fed Has Engineered A Soft Landing
The Fed Has Engineered A Soft Landing
Chart 19Stimulative Real Rates
Stimulative Real Rates
Stimulative Real Rates
Chart 20There Is Always A First Time
There Is Always A First Time
There Is Always A First Time
If that were the case and the cycle were to extend into the 2020s, then the risk is that SPX EPS vault to $200 and valuations overshoot, i.e. the forward P/E multiple spikes to a 20 handle and the SPX catapults to 4,000. In that case, we would leave 1,000 points on the table and our SPX 3,000 view would be way offside. While this is a risk to our negative structural view, there are two sectors we really like for the long-term as we deem them secular growth plays and should do exceptionally well on a 10-year horizon: software and defense stocks. Three key drivers underpin our bullish view on software: galloping higher private and public sector software outlays, a structurally enticing software demand backdrop and ongoing industry M&A (Chart 21). Most importantly, the move to cloud computing and SaaS, the proliferation of AI, machine learning and augmented reality are not fads but enjoy a secular growth profile, and signal that capital outlays on software are in a structural uptrend. With regard to defense stocks, the three key pillars we highlighted in our “Brothers In Arms” Special Report on October 31, 2016 remain intact: the global rearmament is still gaining steam, a space race with manned missions to the moon now includes the U.S., China and India, and cybersecurity is a real threat for governments around the world (Chart 22). On all three fronts, defense stocks stand to benefit as they have beefed up their offerings to provide governments with a one-stop shop solution covering most of these needs. Chart 21Buy The Software Breakout
Buy The Software Breakout
Buy The Software Breakout
Chart 22Defense Stocks Remain A Long-term Buy
Defense Stocks Remain A Long-term Buy
Defense Stocks Remain A Long-term Buy
Anastasios Avgeriou, U.S. Equity Strategist anastasios@bcaresearch.com
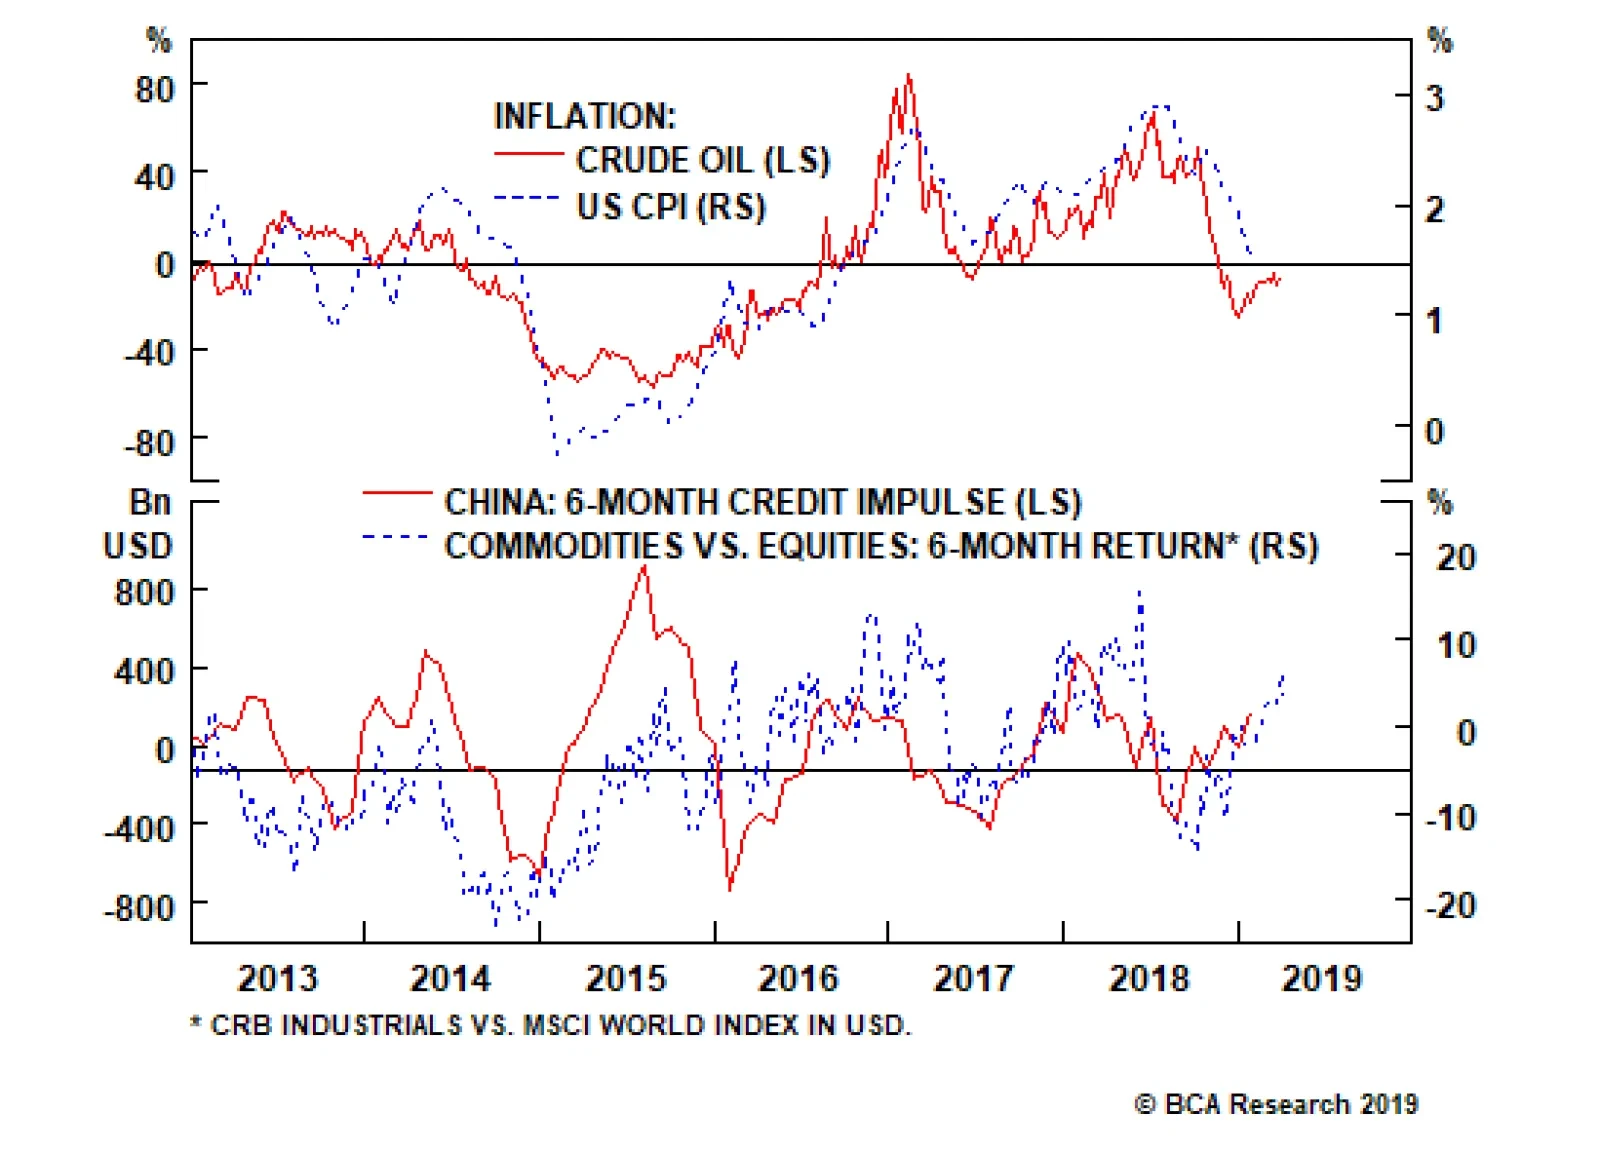
The reversal in China’s credit cycle and in the Fed’s monetary policy stance will be supportive of steel and iron ore prices going forward. In fact, our Commodity & Energy Strategy team’s credit cycle proxy suggests global industrial activity will…
Understand that the all-important impulses to an economy do not come from the level of the bond yield, oil price, net exports, inventories, and so on. The impulse always comes from the change in these metrics. And as the metrics cannot decline (or rise)…
Highlights As long as Chinese policymakers remain committed to their anti-pollution campaign, we believe high-grade iron ore prices will remain supported by demand from newer steelmaking technologies. A continuation of the much-needed consolidation in steelmaking capacity in China – wherein larger, more efficient operators force their less competitive rivals from the market – will reinforce this trend (Chart of the Week). Chart of the WeekChina's Steel Sector Will Continue Consolidating
China's Steel Sector Will Continue Consolidating
China's Steel Sector Will Continue Consolidating
Over time, the iron ore market will resemble other developed markets – e.g., crude oil – where higher- and lower-grades of the commodity are regularly traded against each other (Chart 2). As this develops, hedgers and investors will be able to fine tune exposures with greater precision, and prices from these markets will better reflect supply-demand fundamentals. The central and local governments also will have a valuable window on how policy is affecting fundamentals as they pursue their “blue skies” policies. We are initiating tactical spread, getting long spot high-grade 65% Fe vs. short spot 62% Fe at today’s Custeel Seaborne Iron Ore Price Index levels, consistent with our view.1 Chart 2Iron Ore Spread Markets Will Continue To Develop
Iron Ore Spread Markets Will Continue To Develop
Iron Ore Spread Markets Will Continue To Develop
Highlights Energy: Overweight. The Trump administration is reviving the Monroe Doctrine with its demand Russia remove its troops and advisors from Venezuela immediately, based on comments by the U.S. National Security Advisor John Bolton. In addition, a “senior administration official” said waivers for eight of Iran’s largest crude oil importers could be allowed to expire May 4, and that the administration is considering additional sanctions against Iran.2 Brian Hook, the special U.S. envoy for Iran, this week said three of eight countries granted waivers to U.S. sanctions agreed to take oil imports to zero.3 In a related development, OPEC crude oil output fell to a four-year low of 30.4mm b/d in March, according to a Reuters’s survey, as Venezuelan output falls and Saudi Arabia continues to over-deliver on its production cuts. Base Metals: Neutral. Codelco’s mined copper ore output fell to 1.8mm MT last year, down 1.6% vs. 2017 levels. This took refined output down almost 3% to 1.7mm MT, according to Metal Bulletin. The Chilean state-owned company cited reduced ore content in its mined production as a reason for the decline. MB’s copper treatment and refining charges index for the Asia Pacific region is at its lowest level since March 26, 2018, reflecting the lower concentrate supplies. We remain long spot copper on the back of low inventories, and an expected recovery in demand. Precious Metals: Neutral. Strength in equities has taken some of the luster off gold’s rally in the near term as investors move to increase stock exposures, but we continue to favor gold as a portfolio hedge and remain long. Agriculture: Underweight. USDA’s corn planting intentions report released last week came in much stronger than earlier estimates. Corn and soybeans traded lower following the release of the report, but recovered some this week on the back of positive news from Sino - U.S. trade talks. The USDA estimated farmers intended to plant 92mm acres of corn, and 85mm acres of soybeans this year. Ahead of the report, a Farm Bureau survey estimated corn and soybean acreage would average 91.3mm acres of corn and 86.2mm acres of beans. Trade Recommendations: Our 1Q19 trade recommendations were up an average of 41% at end-March (Quarterly Performance Table below). Including recommendations that were open at the beginning of 1Q19, the average was 31%. Feature China’s push to reduce pollution in its steelmaking sector will continue to support demand for Brazil’s high-grade ores – i.e., ores with iron (Fe) content higher than 65%. Transitory Brazilian iron ore supply losses notwithstanding, China’s push to reduce pollution in its steelmaking sector will continue to support demand for Brazil’s high-grade ores – i.e., ores with iron (Fe) content higher than 65%. This will allow the continued development of an active spread market, not unlike spread markets in commodities like oil, which will expand hedging and trading opportunities for producers, consumers and investors (Chart 2). Older, more polluting steelmaking technology in China will continue to be replaced by plants that favor Brazil’s high-grade ores, then Australia’s benchmark-type grades (62% Fe), then, as a last resort, the lower quality domestic ores. In a steelmaking market still suffering significant overcapacity, we expect policymakers will, at some point, discover the benefit of letting markets forces do the work of forcing older technology offline, as happened with the country’s domestically produced lower-quality iron ore, which has lower iron content and higher impurities than Brazilian and Aussie imports.4 We believe growth in China’s steel and steel products demand – hence iron ore demand – likely has peaked and is in the process of flattening or declining slightly, which will alter the composition of iron ore imports and tilt them in favor of high-grade Fe imports from Brazil over the next 3 - 5 years (Chart 3). This leveling off in steel demand growth will put a premium on more efficient technology to meet future demand, particularly with the pollution constraints that will, we believe, be an enduring feature of this market.5 Chart 3China's Steel Demand Growth Likely Has Peaked
China's Steel Demand Growth Likely Has Peaked
China's Steel Demand Growth Likely Has Peaked
Impurities found in lower-grade iron ore raise steelmaking costs by increasing unwanted mineral build-ups in blast furnaces, increase pollution and lower mills’ efficiency. With inventories re-building following the winter steelmaking hiatus in China, imports will continue to grow market share at the expense of indigenous lower-quality ores (Chart 4). Imports from Australia, which mostly price to the 62% Fe benchmark, will continue to grow, but we strongly believe that in China’s post-anti-pollution-campaign market, Brazilian imports will see growth increasing (i.e., the 2nd derivative) at a higher rate (Chart 5). Chart 4Chinese Iron Ore Inventories Fall Relative To Steel Production
Chinese Iron Ore Inventories Fall Relative To Steel Production
Chinese Iron Ore Inventories Fall Relative To Steel Production
Chart 5China's Brazil, Australia Import Growth Will Recover
China's Brazil, Australia Import Growth Will Recover
China's Brazil, Australia Import Growth Will Recover
These imports are lower in cost, and higher in quality than the domestic iron ore. This is particularly important when it comes to keeping costs under control – impurities found in lower-grade iron ore raise steelmaking costs by increasing unwanted mineral build-ups in blast furnaces, increase pollution and lower mills’ efficiency. Extended Output Cuts Favor High-Grade Ores The biggest reason supporting our view high-grade iron ores will continue to grow market share at the expense of lower-quality domestic supply and benchmark 62% Fe material is the recent behavior of the central government and local governments vis-a-vis pollution. Both have shown they are not averse to extending operating restrictions on high-polluting industrial plants, even in provinces where steelmaking is a large employer. Last year, major steel producing regions– Hebei, Jiangsu, Shandong, Liaoning – increased production during the winter months, likely driven by higher margins at the steelmakers (Chart 6). This indicates compliance with anti-pollution regulations fell significantly (Chart 7). In turn, this led to higher pollution, according to the latest available data from China’s National Environmental Monitoring Centre, which shows concentrations of particulate matter 2.5 micrometers or less in diameter (i.e., PM2.5) rose again this year (Chart 8). Chart 6Higher Margins, Higher Output
Higher Margins, Higher Output
Higher Margins, Higher Output
Chart 7
Consequently, Chinese authorities decided to tighten anti-pollution measures by extending production cuts beyond the heating season into 3Q and 4Q19.6 Furthermore, the top producing city, Tangshan, in the province of Hebei extended its most elevated level of smog alert on March 1 and deepened production cuts to 70% from 40%, with reported cases of complete operations being halted. Chart 8China's Pollution Is Increasing; Steelmaking Curbs Will Persist
China's Pollution Is Increasing; Steelmaking Curbs Will Persist
China's Pollution Is Increasing; Steelmaking Curbs Will Persist
Last month, Chinese Communist Party (CCP) officials in Hebei announced plans to cut steel production by 14mm MT this year and next. Going forward, China’s environment ministry said winter restrictions will be extended for a third year during the 2019-2020 winter period. As we argued last year, winter curbs likely will become a permanent feature of China’s steelmaking landscape. Combined with China’s steel de-capacity reforms, iron ore and steel markets will continue to evolve to a less-polluting presence in the country.7 As a consequence, IO grade and form differentials are now crucial input in our analysis.8 We believe a wider than usual premium will remain until new high-grades and pellets supplies come on line in the next few years. Credit Stimulus Vs. Battle For Blue Skies The reversal in China’s credit cycle and in the Fed’s monetary policy stance will be supportive of steel and iron ore prices going forward. In fact, our credit cycle proxy suggests global industrial activity will increase in the next few months (Chart 9).9 Additionally, our geopolitical strategists’ base case suggests a resolution of the Sino-U.S. trade war likely will occur this year. This will support EM income growth, which will stimulate commodity demand generally at the margin. Chart 9Upturn in China's Credit Cycle Will Support Iron Ore Prices
Upturn in China's Credit Cycle Will Support Iron Ore Prices
Upturn in China's Credit Cycle Will Support Iron Ore Prices
We believe China’s credit cycle bottomed in 1Q19 and that Chinese authorities will modestly increase stimulus in 2H19.10 As discussed previously, we do not expect this new round of stimulus to be as large as previous rounds; China’s economy is in better shape now than it was at the start of previous expansionary credit cycles, hence the magnitude of the stimulus needed to revive the economy is lower. Nonetheless, this stimulus will be sufficient to strengthen China’s and EM’s steel-intensive activities in the coming months. As long as China maintains its anti-pollution drive, high-grade iron ore will continue to grow market share. Historically, these sectors correlated positively with the 62% Fe content benchmark (Chart 10). However, the expected stimulus works against Beijing’s critically important battle for blue skies. A revival of China’s industrial activity would increase PM2.5 concentrations above targets. Chart 10China's Stimulus Will Stoke Iron Ore Demand
China's Stimulus Will Stoke Iron Ore Demand
China's Stimulus Will Stoke Iron Ore Demand
These constraints, we believe, mean China’s policymakers will have to incentivize steelmakers to favor lower-polluting high-grade iron ore (Fe > 65%), in order to maximize steel output subject to their emissions target. This will widen the form and grade premiums ahead of next year’s winter period. Bottom Line: As long as China maintains its anti-pollution drive, high-grade iron ore will continue to grow market share, as steelmakers upgrade their technology and inefficient mills are shuttered. This will favor Brazilian exports going forward, and we expect the rate of growth in these imports to increase. In line with our view, we are opening a long 65% Fe spot vs. a short 62% Fe spot position at tonight’s close. This is a tactical position, but could easily become a strategic recommendation. Robert P. Ryan, Senior Vice President Commodity & Energy Strategy rryan@bcaresearch.com Hugo Bélanger, Senior Analyst Commodity & Energy Strategy HugoB@bcaresearch.com Footnotes 1 This index is published by Beijing Custeel E-Commerce Co., Ltd. 2 We flagged this risk in our February 21, 2019, report entitled “The New Political Economy of Oil.” We noted the odds of a U.S. – Russia military confrontation are low, and that “the U.S. would revive the Roosevelt Corollary to the Monroe Doctrine, and that Russia and China most likely would concede Venezuela is within the U.S.’s sphere of influence, as neither intends to project the force and maintain the supply lines … a confrontation would require.” That said, there is always the risk such a confrontation could go kinetic, or that either or both sides could lunch a cyberattack to disable its adversary. The Roosevelt Corollary refers to U.S. President Theodore Roosevelt’s extension of the Monroe Doctrine at the beginning of the 20th century, which has been used by the U.S. to justify the use of military power in the Western Hemisphere. Our February 21 report is available at ces.bcaresearch.com, as is a Special Report on Venezuela published November 22, 2018, entitled “Venezuela: What Cannot Go On Forever Will Stop,” which discusses Venezuela’s debts to China and Russia, et al. See also “Exclusive: Trump eyeing stepped-up Venezuela sanctions for foreign companies – Bolton” and “Oil hits 2019 high on OPEC cuts, concerns over demand ease,” published by reuters.com March 29 and April 2, 2019, respectively. 3 Please see “Three importers cut Iran oil shipments to zero - U.S. envoy” published April 2, 2019, by reuters.com. 4 According to Platts, “at least half of China’s previous 300 million mt plus iron ore mining capacity has left the market for good.” Please see “China’s quest for cleaner skies drives change in iron ore market,” published January 30, 2019, by S&P Global Platts. CRU estimates average iron content in China’s ores is 30%, which means they must undergo costly upgrading to be useful to steelmakers. 5 Australian miners are expected to bring on significant volumes of high-grade iron ore beginning in 2022 - 23, with Fe content as high as 70%, according to the Department of Industry, Innovation and Science’s March 2019 Resources and Energy Quarterly. 6 Please see “Tangshan mulls output curbs for 2nd, 3rd quarters of 2019” published January 22, 2019, by metal.com. 7 Please see China to extend winter anti-smog measures for another year published March 6, 2019, by reuters.com. 8 Grade premium: The chemistry of iron ore supply varies widely in terms of Fe content. Higher Fe content reduces production cost and pollution per unit of steel output. The higher the quality, the higher the volume of steel produced relative to energy consumed. The current global benchmark iron ore is 62% Fe, but China’s evolution to a less-polluting steelmaking sector will raise the importance of higher-grade markets. Form premium: A steelmaker’s blast furnace typically consumes iron ore in pellets, fines or lumps combined with coking coal. Fines are the most common form of iron ore, and account for ~ 75% of total seaborn IO market. This form cannot be directly fed in the blast furnace and requires an extra sintering step. Sintering is highly polluting and coal-intensive process that compresses fines into a more useable form. This process is usually conducted on-site at steel mills. On the other hand, lumps and pellets are direct feedstock and therefore completely avoid the highly polluting sintering step. Both types of premium are primarily affected by environmental policies in consuming countries, coke prices and steelmills’ profitability. 9 Modeling historical iron ore prices remains difficult because of the short sample available for spot iron prices – i.e., the benchmark 62% Fe. Before 2009, iron ore prices were determined using a producer pricing system. Once a year, prices were negotiated by miners and steelmakers and would be fixed for the remaining of the year. Given that iron ore supply was plentiful relative to demand, prices were fairly stable and this mechanism was used for over four decades. The rapid rise of emerging economies – mainly China – during the 2000s forced the pricing system to adjust toward a spot-market pricing system. The short spot-price time series available for analysis increases the distortion of policy-driven exogenous shocks like China’s de-capacity and winter restriction policies. This makes it difficult to identify the underlying relationships between its price and potential explanatory variables, and forces us to rely on theory and analogous experience in other markets like crude oil. 10 Please see BCA Commodity and Energy Strategy Weekly Report titled “Bottoming Of China’s Credit Cycle Bullish For Copper Over Near Term,” published March 14, 2019. It is available at ces.bcaresearch.com Investment Views and Themes Recommendations Strategic Recommendations Tactical Trades Trade Recommendation Performance In 2019 Q1
Image
Commodity Prices and Plays Reference Table Trades Closed in 2019 Summary of Closed Trades
Image
Highlights Odds are that the recent improvement in Chinese manufacturing PMIs could be due to inventory re-stocking rather than a decisive turnaround in final demand. “Hard” data have not shown meaningful improvements in China’s final demand. Weighing the pros and cons, we are instituting a stop-buy on our EM strategy: We will turn tactically positive on EM risk assets if the MSCI EM equity index breaks above 1125, which is 4% above its current level. Keep Malaysia on an upgrade watch list. Downgrade Brazil to underweight. Feature The strong Chinese PMI prints released this week have challenged our negative view on EM assets and China plays. This week we take a deeper look at the underlying reasons behind the recent improvement in China’s PMI data. In addition, we elaborate on what it would take for us to alter our current strategy on EM risk assets. A Manufacturing Upturn The upturn in China’s manufacturing PMIs in March has been validated by improvement in Taiwanese PMI’s export orders (Chart I-1, top panel). The latter’s amelioration has been broad-based across all sectors: electronics and optical, electrical machinery and equipment, basic materials, and chemical/biological/medical (Chart I-1, bottom panel). China accounts for 30% of Taiwanese exports, making Taiwan’s manufacturing sector heavily exposed to China’s business cycle. Does this improvement in manufacturing PMIs reflect a final demand revival in China? Looking For Final Demand Revival China’s domestic and overseas orders remain weak, as exhibited in Chart I-2. These indicators give us the primary trajectory of the Chinese business cycle, while the PMI indexes exhibit considerable short-term volatility. Chart I-1One-Month Surge In China's And Taiwan's PMIs
One-Month Surge In China's And Taiwan's PMIs
One-Month Surge In China's And Taiwan's PMIs
Chart I-2Noise And Business Cycle Trajectory
Noise And Business Cycle Trajectory
Noise And Business Cycle Trajectory
The domestic demand and overseas orders reflect quarterly data from 5,000 enterprises. The latest datapoints are from Q1 2019 and were released on March 22. To be sure, we are not suggesting an absence of bright spots, but at the moment “hard” data do not corroborate broad-based improvement in final demand. Consumer spending: There has been no improvement in households’ propensity to spend. Our proxy for households’ marginal propensity to spend has not turned up (Chart I-3). Consistently, China’s smartphone sales and passenger car sales are contracting at double-digit rates, while the growth rate in online sales of services has not improved (Chart I-4, top three panels). Chart I-3Chinese Consumers' Propensity To Spend
Chinese Consumers' Propensity To Spend
Chinese Consumers' Propensity To Spend
Chart I-4China: No Improvement In "Hard" Data
China: No Improvement In "Hard" Data
China: No Improvement In "Hard" Data
The bottom panel of Chart I-4 demonstrates the retail sales of consumer goods during the Chinese New Year compared with the previous year’s spring festival. It is evident that as of mid-February, when this year’s spring festival took place, there was no improvement in Chinese consumer demand. Business spending / investment: Our proxy for enterprises’ propensity to spend continues to decline (Chart I-5). Companies’ propensity to spend has historically led the cyclical trajectory in industrial metals prices. Crucially, this has not corroborated the rebound in base metals prices over the past three months. Besides, China’s imports of capital goods, its total imports from Korea and its machinery and machine tool imports from Japan are all still contracting at a double-digit rate (Chart I-6). Chart I-5China: Enterprises' Propensity To Spend And Metals
China: Enterprises' Propensity To Spend And Metals
China: Enterprises' Propensity To Spend And Metals
Chart I-6Contracting At A Double Digit Rate
Contracting At A Double Digit Rate
Contracting At A Double Digit Rate
China’s fixed asset investment in infrastructure has picked up of late and will continue to improve. However, this may not be sufficient to revive the mainland’s economy. China’s growth decelerated in 2014-2015 and industrial commodities prices dwindled, despite robust growth in infrastructure investment at the time (Chart I-7). The culprit was the decline in property construction in 2014-2015. As to the property market, the People’s Bank of China’s (PBoC) Pledged Supplementary Lending (PSL) financing points to further weakness in property demand in the coming months (Chart I-8). Chart I-7China's Infrastructure Investment And Base Metals Prices
China's Infrastructure Investment And Base Metals Prices
China's Infrastructure Investment And Base Metals Prices
Chart I-8China: The Outlook For Residential Property Demand
China: The Outlook For Residential Property Demand
China: The Outlook For Residential Property Demand
Moreover, property starts have been surging, yet their completions have been tumbling. This suggests a ballooning amount of work-in-progress on real estate developers’ balance sheets. To be sure, we are not suggesting an absence of bright spots, but at the moment “hard” data do not corroborate broad-based improvement in final demand. It may well be that property developers do not have financing to complete work or that they are reluctant to bring new units to the market amid tame demand. Whatever the case, the mediocre pace of construction activity is negative for suppliers to the construction industry. Government spending: Aggregate government spending in China – including central and local government as well as government-managed funds (GMF) – has been very robust in the past year (Chart I-9). Hence, government spending has not been the reason behind the economic slowdown. Chart I-9China's Aggregate Fiscal Spending
China's Aggregate Fiscal Spending
China's Aggregate Fiscal Spending
For 2019, overall government spending is projected to expand by 11% in nominal terms from a year ago, down from 17% in 2018. The key fiscal risk is shrinking land sales, which account for 86% of GMF revenues. The latter have substantially increased in size and now makeup 27% of aggregate fiscal spending. Local and central government expenditures account for 62% and 11% of aggregate fiscal spending, respectively. If land revenues undershoot, GMF and local governments will not be able to meet their expenditure targets without Beijing altering the former’s borrowing quotas. In brief, fiscal policy may be involuntarily tightened due to a shortfall in land sales revenues before the central government permits local governments to borrow more. Exports: Chinese shipments to the U.S. will recover as China and the U.S. finalize their trade deal. The media is extremely focused on the trade negotiations, and markets have been trading off the headlines. Nevertheless, it is essential to realize that China’s exports to the U.S. make up only 3.6% of the country’s total GDP (Chart I-10). This contrasts with capital spending that accounts for 42% of the mainland’s GDP. Consequently, we believe the credit cycle that drives construction and capital spending is more important to China’s growth than its shipments to the U.S. Global ex-China Demand: The areas of global final demand that weighed on global growth last year remain depressed. Global semiconductors and auto sales have been shrinking at a rapid pace and have so far not experienced a reversal (Chart I-11). Chart I-10China Is Not Reliant On Exports To The U.S.
China Is Not Reliant On Exports To The U.S.
China Is Not Reliant On Exports To The U.S.
Chart I-11Global "Hard" Data Are Still Bad
Global "Hard" Data Are Still Bad
Global "Hard" Data Are Still Bad
Bottom Line: There is a lack of pertinent “hard” business cycle data in China that have improved. What Does It All Mean Having reviewed final demand conditions in China, it is reasonable to argue that the improvement in the Chinese and Taiwanese manufacturing PMIs could be due to inventory re-stocking. Unfortunately, in China, there is limited reliable data that quantifies inventory levels well in various industries. Having reviewed final demand conditions in China, it is reasonable to argue that the improvement in the Chinese and Taiwanese manufacturing PMIs could be due to inventory re-stocking. The consensus view in the investment community is that China’s credit stimulus has boosted the economy since the beginning of this year. Business conditions have certainly improved. The rally in Chinese stocks has in turn mirrored this improvement. Yet it is not clear that this revival in the business cycle is due to the credit stimulus. Chart I-12 plots the credit impulse, including local government general and special bonds issuance, with the three typical business cycle variables: manufacturing PMI and nominal manufacturing production growth. Chart I-12China: Credit Impulse Leads "Hard" Data
China: Credit Impulse Leads "Hard" Data
China: Credit Impulse Leads "Hard" Data
As can be seen from the chart, the manufacturing PMI is very volatile. In the short term, there is little correlation between it and the credit impulse (Chart I-12, top panel). Meanwhile, the credit impulse leads nominal manufacturing output growth by nine months (Chart I-12, bottom panel). Based on the past time lag relationships, the mainland’s business cycle should not have bottomed until the third quarter of this year. Hence, the bottom in the manufacturing PMIs in January does not fit the historical pattern of the relationship between the credit impulse and the mainland’s business cycle. Bottom Line: Presently, it is hard to make a definite conclusion on the reasons behind the pick-up in Chinese manufacturing. That said, business cycles do not always evolve in a common-sense manner that can be both rationalized and forecast by indicators. Therefore, it is essential for investors, to have confirmation signals from financial markets on the direction of the business cycle. Financial Markets As A Litmus Test We continuously monitor numerous financial markets that are sensitive to both the global and Chinese business cycles. These financial market-based indicators are often coincident with EM asset prices. Hence, they can be used to confirm or refute EM market direction. Our Risk-On-to-Safe-Haven (ROSH) currency ratio has recently softened, flashing a warning signal for EM share prices (Chart I-13). Chart I-13Currency Markets Are Flashing Amber For EM Stocks
bca.ems_wr_2019_04_04_s1_c13
bca.ems_wr_2019_04_04_s1_c13
The ROSH ratio is the relative total return (including carry) of six commodities currencies (AUD, NZD, CAD, CLP, BRL and ZAR) versus two safe-haven currencies: the yen and Swiss franc. Hence, this currency ratio is agnostic to U.S. dollar trends, making its signals especially valuable. Our Reflation Confirming Indicator has retreated, also signaling a pullback in the EM equity index (Chart I-14). This indicator is composed of an equal-weighted average of industrial metals prices (a play on Chinese growth), platinum prices (a play on global reflation) and U.S. lumber prices (a proxy play on U.S. growth). Chart I-14Commodities Markets Are Flashing Amber For EM Stocks
Commodities Markets Are Flashing Amber For EM Stocks
Commodities Markets Are Flashing Amber For EM Stocks
Within EM credit markets, corporate investment-grade spreads have begun narrowing versus high-yield spreads (Chart I-15). This typically coincides with lower EM share prices. Finally, EM share prices have been underperforming DM since late December. Relative performance of EM ex-China stocks against the global equity index has been even more underwhelming. In short, these markets are at a critical juncture. A decisive breakout will entail a lasting rally, while a failure to break out will signal imminent downside risk. Bottom Line: These financial market signals are not consistent with a durable China-led recovery in the global business cycle. Investment Strategy A number of financial markets are currently at a critical juncture. These markets will either break out or break down, with subsequently significant moves. The broad U.S. trade-weighted dollar has been flattish in the past nine months despite falling interest rate expectations in the U.S. and the risk-on market environment. We read this as a sign of underlying strength. The trade-weighted dollar is presently sitting on its 200-day moving average (Chart I-16). Consistent with a flattish trend in the greenback, the U.S. dollar volatility has dropped to very low levels. Exchange rates usually do not trade sideways much longer than that. Hence, the dollar is about to break out or break down and any move will be lasting and large. Chart I-15A Message From EM Corporate Credit Market
A Message From EM Corporate Credit Market
A Message From EM Corporate Credit Market
Chart I-16The U.S. Dollar Is About To Make A Big Move
The U.S. Dollar Is About To Make A Big Move
The U.S. Dollar Is About To Make A Big Move
The Korean won has been forming a tapering wedge pattern from both short-term and long-term perspectives (Chart I-17, top and middle panels). Its volatility has also plunged to a record low (Chart I-17, bottom panel). Chart I-17The Korean Won Is At Crossroads
The Korean Won Is At Crossroads
The Korean Won Is At Crossroads
Chart I-18A Stop-Buy On EM Stocks
A Stop-Buy On EM Stocks
A Stop-Buy On EM Stocks
Finally, emerging Asian equities’ relative performance to global stocks is facing an important technical resistance as are copper and oil prices. In short, these markets are at a critical juncture. A decisive breakout will entail a lasting rally, while a failure to break out will signal imminent downside risk. Consistently, China’s “soft” data that has improved markedly yet there is no “hard” data confirmation. Moreover, there is some evidence to suggest that the pickup in the soft data may simply reflect inventory building. Weighing the pros and cons, we are instituting a stop-buy on our EM strategy: We will turn tactically positive on EM risk assets if the MSCI EM equity index in U.S. dollar terms breaks above 1125, which is 4% above its current level (Chart I-18). Arthur Budaghyan Chief Emerging Markets Strategist arthurb@bcaresearch.com Malaysia: Keep On Upgrade Watch List Malaysian equities have been underperforming their EM counterparts since 2013 and are now resting around their 2017 lows (Chart II-1). The odds are high that this market’s underperformance is late. Chart II-1Malaysian Stocks Relative to EM
Malaysian Stocks Relative to EM
Malaysian Stocks Relative to EM
Investors should keep Malaysian equities on an upgrade watch list. We upgraded the Malaysian bourse from underweight to neutral in December 2018. In a Special Report published at that time, we argued that the structural outlook for Malaysia had improved, yet the cyclical downturn would persist. The latter did not warrant moving the bourse to overweight. This view is still at play. Economic Slowdown Is Advanced The Malaysian economy has been digesting credit and property market excesses. Property sector: Property sales have declined by 37% since 2010, and prices for some property segments are beginning to deflate (Chart II-2). Similarly, housing construction approvals have slumped severely since 2012. Consumers: Passenger vehicle sales have been falling since 2012 along with households' declining marginal propensity to consume, and retail trade has been very weak (Chart II-3). Chart II-2Property Sector Is Depressed
Property Sector Is Depressed
Property Sector Is Depressed
Chart II-3Consumer Sector Is Weak
Consumer Sector Is Weak
Consumer Sector Is Weak
An ongoing purge of excesses by companies entails lower wage growth and weaker employment, resulting in subdued household income growth. The latter could extend the consumer slump. Business sector: Capital spending growth in real terms has decelerated and may contract. Both profit margins and return-on-equity (ROE) for non-financial publicly listed companies have slumped and are currently resting below their 2008 levels (Chart II-4). This warrants cost-cutting and reduced corporate spending/capital expenditures for now. Chart II-4Corporate Restructuring On The Way?
Corporate Restructuring On The Way?
Corporate Restructuring On The Way?
Reduced employment and weak wage growth are negative dynamics for households but positive for companies’ profit margins. Commercial Banks: Malaysian banks remain unhealthy. At 1.5%, their NPLs remain low relative to the credit boom that occurred over the past decade. Moreover, Malaysian banks have been lowering their provisions levels to boost profits. This is an unsustainable strategy. Provided economic growth will remain weak, both NPLs and provisions will rise, hurting banks’ profits and share prices. Banks hold a very large market-cap weighting in this bourse, and the negative outlook for banks’ profits deters us from upgrading this equity market. Purging Excesses: Implications For The Exchange Rate Purging of economic excesses is painful in the short- and medium-term, as it instills deflation. A currency often depreciates during this phase to mitigate the deflationary forces in the economy. However, purging excesses, deleveraging and corporate restructuring are ultimately structurally bullish for a currency. First, corporate restructuring and improved capital allocation lift productivity growth in the long run. The Malaysian economy has been digesting credit and property market excesses. Second, low inflation or outright deflation allow the currency to depreciate in real terms. The Malaysian ringgit is already cheap based on the real effective exchange rate (Chart II-5). Finally, amid deflation and in the absence of widespread bailout of debtors funded by bank loans or excessive government borrowing, cash becomes “king”. Hence, deleveraging is ultimately currency positive. In contrast, pervasive bailouts funded by money creation – i.e., mushrooming money growth – usually undermine residents’ and foreigners’ willingness to hold the currency. A capital flight ensues and the currency plunges. Malaysia in 2015 was the latter case, with the ringgit plummeting as residents converted their ringgits to U.S. dollars (Chart II-6, top panel). Chart II-5The Ringgit Is Cheap
The Ringgit Is Cheap
The Ringgit Is Cheap
Chart II-6Malaysia: 2015 Vs. Now
Malaysia: 2015 Vs. Now
Malaysia: 2015 Vs. Now
Presently, the opposite dynamics are at play. The central bank is reducing commercial banks’ excess reserves, domestic private credit growth is weak and residents are not fleeing the ringgit (Chart II-6). In addition, the structural reorientation of the economy from commodities to semiconductors/technology is beginning to bear fruit. As a result, overall trade balance has significantly improved, despite weak commodities prices. This is also positive for the currency. Finally, a more stable (i.e., modestly weaker) exchange rate amid both a global and domestic downturn will allow Malaysia’s central bank to reduce interest rates and smooth the growth slump. This is in contrast to 2015 when capital outflows and the plunging currency did not allow the central bank to reduce borrowing costs. Investment Conclusions We recommend keeping Malaysian stocks on an upgrade watch list for now. We recommend upgrading Malaysian sovereign credit and local currency government bonds from underweight to neutral relative to their respective EM benchmarks A relatively stable ringgit will benefit Malaysia’s local and U.S. dollar bonds. Furthermore, foreign ownership of local bonds has fallen meaningfully, diminishing the risk of future outflows. Ayman Kawtharani, Associate Editor ayman@bcaresearch.com Arthur Budaghyan Chief Emerging Markets Strategist arthurb@bcaresearch.com Downgrading Brazil: The Honeymoon Is Over In our October 9 report, we upgraded Brazil following the outcome of the first round of presidential elections. We, like the market, gave a benefit of the doubt to the new president. However, the honeymoon is over for President Bolsonaro. The markets are becoming increasingly pessimistic because of the lack of progress on the social security reforms front. It is no secret that Brazil needs bold pension reform to make its public debt sustainable. As things stand now, the public debt dynamic in Brazil is precarious. Two prerequisites for public debt sustainability are (1) for interest rates to be below nominal GDP growth or (2) continuous robust primary fiscal surpluses. Hence, a government can stabilize its debt-to-GDP ratio by either having nominal GDP above its borrowing costs, or by running persistent and sizable primary fiscal surpluses. Neither of these two stipulations are presently satisfied in Brazil. The gap between government local currency bond yields and nominal GDP growth is still very wide (Chart III-1). Meanwhile, the primary fiscal deficit is 1.5% of GDP (Chart III-2). Chart III-1Brazil: An Unsustainable Gap
Brazil: An Unsustainable Gap
Brazil: An Unsustainable Gap
Chart III-2Brazil: Public Debt Dynamics Are Precarious
Brazil: Public Debt Dynamics Are Precarious
Brazil: Public Debt Dynamics Are Precarious
In the early 2000s, the government stabilized its public debt dynamics by running persistent primary surpluses of about 4% of GDP (Chart III-2, top panel). Will Brazil achieve primary fiscal surpluses in the coming years assuming some form of the pension reform is adopted? It is doubtful. According to the government’s own forecasts, the submitted draft of social security reforms, including the one for the army, will save only BRL190 billion in next four years or 0.7% of GDP per year. The current primary deficit is 1.5% of GDP (Chart III-2). Unless nominal GDP growth and government revenue growth shoot up, the primary deficit will not be eliminated or the primary surplus will be very small. Overall, it seems unlikely that the government’s proposed pension reforms will be sufficient to turn around Brazil’s public debt dynamics in the next several years - barring very strong economic growth that will fill in government coffers. Bottom Line: We are downgrading Brazil from overweight to underweight within EM equity, local currency bonds and sovereign credit benchmarks. Andrija Vesic, Research Analyst andrijav@bcaresearch.com Footnotes Equity Recommendations Fixed-Income, Credit And Currency Recommendations
Yet, global stocks, are only 7% shy of their 2018 high. If Chinese equities can avoid a major earnings recession, this discrepancy between the performance of Chinese equities and global stocks underscores that there is further upside for stock prices in…
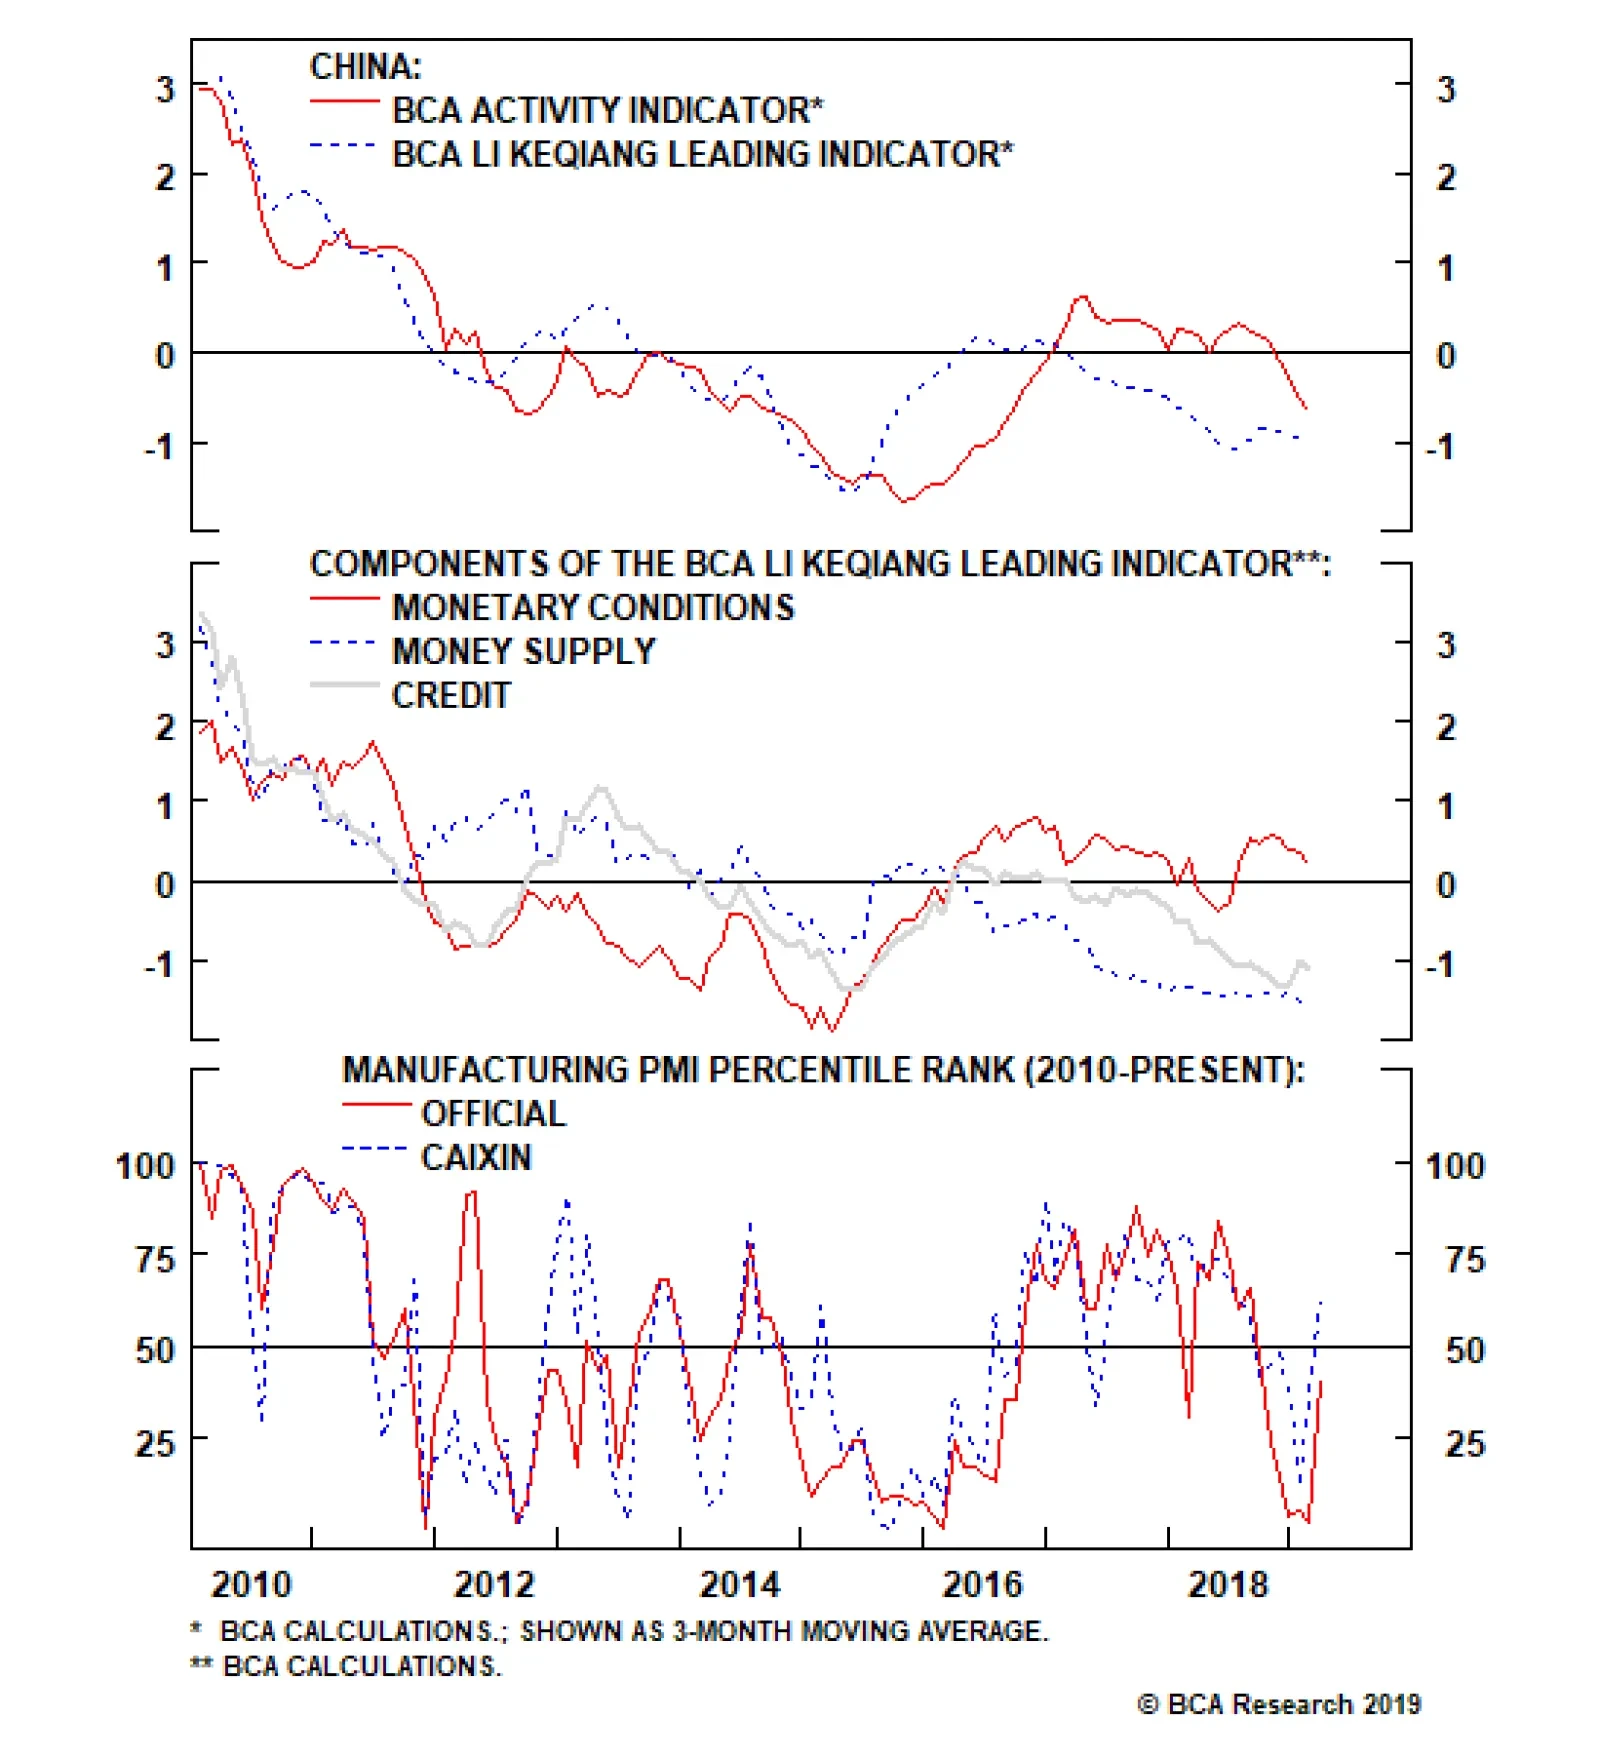
The first panel of the chart above shows that coincident economic activity sharply converged in January and February with our China Investment Strategy team’s leading indicator for China’s economy, as we had argued many times over the past several months was…
Highlights The meaningful improvement in the March manufacturing PMIs (both Caixin and official) all but confirms that a rebound in Chinese economic activity is forthcoming. The odds that investors will look through any near-term economic and/or earnings weakness are directly related to the likely magnitude of the expansion in credit over the coming year, and our research points to the need for the recent pace of credit growth to be sustained in order to stabilize the outlook for earnings. Barring a substantial breakdown in trade talks between China and the U.S., a strong March total social financing release would likely tip the scales in favor of a recommendation to increase Chinese investable stock exposure within a global equity portfolio to overweight. Feature Tables 1 and 2 highlight key developments in China’s economy and its financial markets over the past month. On the growth front, coincident economic activity has sharply converged with our leading indicator for China’s economy, which we highlighted was likely to occur. Looking forward, while we await the March total social financing release later this month for a better sense of the likely magnitude in credit growth over the coming year, the meaningful improvement in the March manufacturing PMIs (both Caixin and official) all but confirms that a rebound in Chinese economic activity is forthcoming. Table 1China Macro Data Summary
China Macro And Market Review
China Macro And Market Review
Table 2China Financial Market Performance Summary
China Macro And Market Review
China Macro And Market Review
The likely magnitude of the uptrend in credit is important from an investment strategy perspective, as we have highlighted that weak coincident activity raises the risk of a lagged but meaningful further decline in Chinese earnings per share over the coming few months. The odds that investors will look through any near-term economic and/or earnings weakness are directly related to the ultimate size of the expansion in credit, and our research points to the need for the recent pace of credit growth to be sustained in order to stabilize the outlook for earnings. But the bottom line for investors is that we recently placed Chinese investable stocks (i.e. the MSCI China Index) on upgrade watch, and the March PMI is a step in the direction of a recommendation to increase equity allocation to overweight within a global stock portfolio. Investors should closely watch the March total social financing data (due to be released in mid-April); a strong release, barring a substantial breakdown in trade talks between China and the U.S., would likely tip the scales in favor of a move to overweight. In reference to Tables 1 and 2, we provide several detailed observations concerning developments in China’s macro and financial market data below: Chart 1 shows that coincident economic activity sharply converged in January and February with our leading indicator for China’s economy, as we had argued many times over the past several months was likely to occur. In our view, most if not all of the previously beneficial tariff front-running effect has probably washed out of the data, implying that future changes in activity measures are now more likely to reflect actual changes in underlying economic circumstances. Chart 1A Convergence That We Predicted
A Convergence That We Predicted
A Convergence That We Predicted
The components of our LKI leading indicator continue to point to divergent outcomes for the Chinese economy (Chart 2). Monetary conditions have weakened somewhat over the past few months, but remain quite easy relative to history. The credit components bounced in January but are still weak relative to their history, whereas money growth is extremely weak and has shown no sign of improvement. Barring a major rise in the RMB, a continuation in the recent pace of credit growth would likely be enough to cause our leading indicator to trend higher, particularly if money growth begins to pick up. Chart 2An Uptrend In Credit Growth Will Push Our Leading Indicator Higher
An Uptrend In Credit Growth Will Push Our Leading Indicator Higher
An Uptrend In Credit Growth Will Push Our Leading Indicator Higher
We noted in our March 13 Weekly Report that growth in residential floor space started was unsustainably strong,1 and the January/February data update confirmed this view. Growth in starts has decelerated by 10 percentage points from December to February, highlighting that housing construction cannot permanently decouple from sales volume and that a further deceleration is possible unless sales growth (which is currently negative) begins to pick up. The PMI rebound in March registers as one of the most important macro developments since the release of the January total social financing data. Both the Caixin and official manufacturing PMI data came in solidly positive for March, rising relative to their February values and surprising consensus expectations to the upside. Chart 3 highlights that the March Caixin data has pushed the series above its post-2010 median, whereas the official PMI has risen to its 40th percentile from essentially its lowest point in the past decade. In our view, the PMI rebound registers as one of the most important macro developments since the release of the January total social financing data, in that it all but confirms that a rebound in (still depressed) Chinese economic activity is forthcoming. Chart 3A Very Sharp Rebound In Both Manufacturing PMIs
A Very Sharp Rebound In Both Manufacturing PMIs
A Very Sharp Rebound In Both Manufacturing PMIs
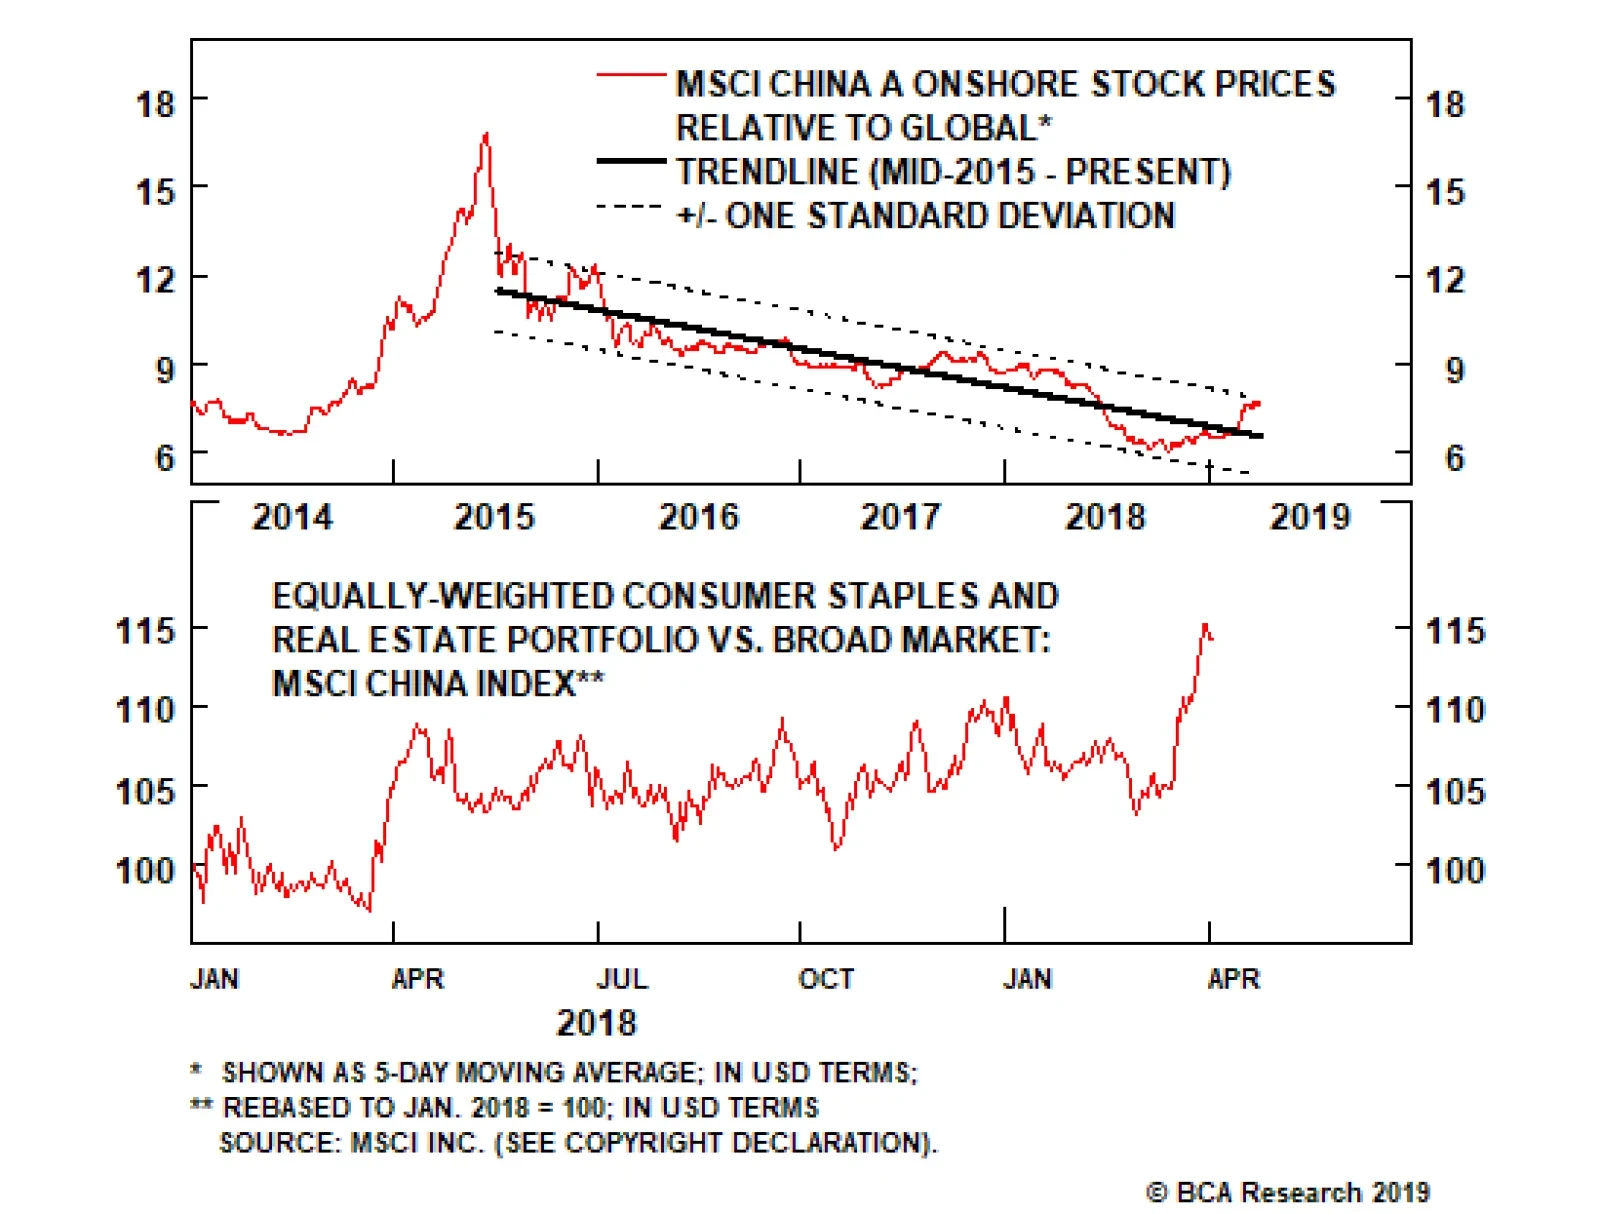
Despite having rallied significantly from their low, Chinese stocks (both investable and domestic) remain approximately 20% below their early-2018 high in US$ terms. This is in contrast to global stocks, which are only 7% shy of their 2018 high. If Chinese equities can avoid a major earnings recession, this discrepancy underscores that there is further upside for stock prices in relative terms over the coming 6-12 months. For the A-share market, however, Chart 4 highlights a potential near-term roadblock for continued outperformance versus global stocks. The chart highlights that the relative performance trend is now bumping up against the upper end of a declining trend channel that has been in place for almost 4 years, a bearish pattern that is in stark contrast to that of the investable market. Conversely, a break outside of this channel would warrant attention, as it could signal a secular change in trend for the domestic equity market. Chart 4Is The Four Year Downtrend In A-Share Relative Performance Over?
Is The Four Year Downtrend In A-Share Relative Performance Over?
Is The Four Year Downtrend In A-Share Relative Performance Over?
Chart 5 highlights that the strange combination of consumer staples and real estate stocks have been the clear sector winners over the past month, both in the investable and domestic markets. Signs of stabilization in consumer spending explains staples outperformance, but the rally in real estate stocks is more difficult to explain given the weakness in housing fundamentals referenced above. For now, our bias is to believe that real estate stocks are benefitting as a value play, given their deep discount relative to both their respective broad markets and their global peers. Chart 5A Sharp Rebound In Staples And Real Estate Stocks
A Sharp Rebound In Staples And Real Estate Stocks
A Sharp Rebound In Staples And Real Estate Stocks
China’s 7-day interbank repo rate has increased somewhat over the past month, raising speculation that the PBOC may soon proceed with a generalized cut to the reserve requirement ratio. In our view, the trend in the 3-month interbank repo rate has been more important over the past few years, as it has closely correlated since late-2016 with average interest rates in the economy and sharp declines in the rate last year preceded the pickup in credit growth observed in January. Still, additional easing from the PBOC could be significant for market participants, as it would likely be greeted positively by investors and could further stoke the belief that Chinese credit growth may overshoot to the upside over the coming 6-12 months. A stronger RMB versus the euro will be welcome news for European exporters. In contrast to a significant improvement in domestic equity prices and investor sentiment, Chinese onshore corporate bond spreads have actually inched higher over the past month. While the rise has been comparatively small (8 basis points), spreads now stand at roughly a third of their 12-month range. A rising trend in onshore corporate bond spreads is not consistent with a slower pace of defaults over the coming 6-12 months, suggesting that at least some headwinds facing the Chinese economy will remain over the coming year if the recent trend in spreads continues. While CNY-USD has been largely flat over the past month, CNY-EUR has continued to rise and is now within striking distance of its 2018 high (Chart 6). This is not likely welcome news for Chinese exporters with close ties to Europe, but it may help provide a much-needed trade boost to the European economy over the coming year, whose manufacturing PMI has recently fallen to a six-year low. Chart 6A Stronger CNY-EUR Cross Will Help Boost Chinese Imports From Europe
A Stronger CNY-EUR Cross Will Help Boost Chinese Imports From Europe
A Stronger CNY-EUR Cross Will Help Boost Chinese Imports From Europe
Jonathan LaBerge, CFA, Vice President Special Reports jonathanl@bcaresearch.com Footnotes 1 Please see China Investment Strategy Weekly Report, “China Macro And Market Review”, dated March 13, 2019, available at cis.bcaresearch.com Cyclical Investment Stance Equity Sector Recommendations
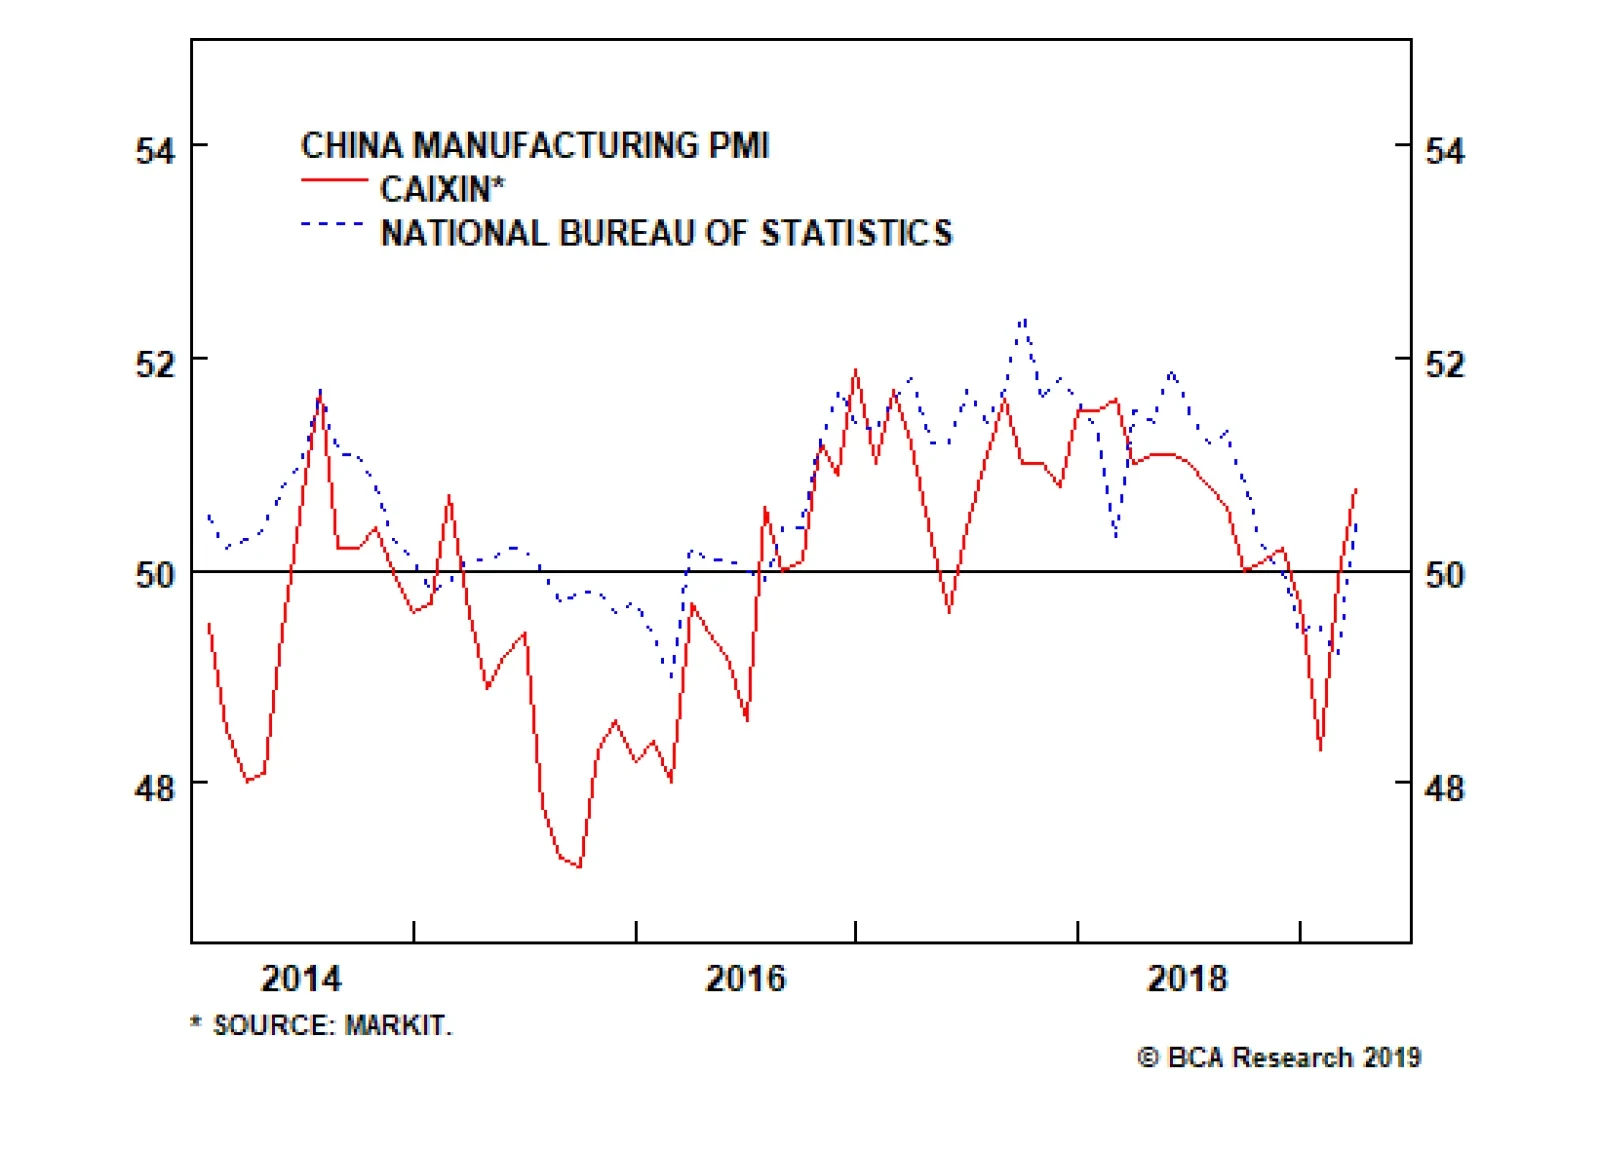
The NBS Manufacturing PMI, which carries a larger weight toward state-owned enterprises, rebounded to 50.5 from 49.2. Its new orders, new export orders, imports, and purchases quantity components all improved significantly. Meanwhile, the Caixin manufacturing…
Dear Client, Instead of our regular Weekly Report, this week we are sending you a Special Report written on February 20 by our Geopolitical Strategy service colleagues that discusses China’s recent stimulating efforts. We have only made a few minor revisions to account for the past month’s events. We trust that you will find this Special Report useful and insightful. Best regards, Anastasios Avgeriou, U.S. Equity Strategist Highlights So What? China’s January-February credit data suggest that stimulus is here. Why? China’s early-year credit and fiscal policies suggest that stimulus risks are to the upside. January-February credit was a blowout number and fiscal spending is up. Equity bourses in South Korea and Russia are the most likely to benefit from Chinese stimulus. Industrial metals such as copper will also benefit – with a delay. Feature New credit data for China in January-February improves the chances that Beijing’s stimulus measures will overshoot this year, causing China’s economy to bottom in 2019 and jumpstart global growth. In our annual outlook for this year we argued that while China was stimulating the economy, the magnitude of stimulus would be the decisive factor for the global macro environment in 2019. We argued that the type of stimulus would remain primarily fiscal – tax cuts for households and small and medium-sized enterprises – and hence that it would be modest as fiscal easing would merely offset relatively weak credit growth. This view stemmed from our assessment of the Xi Jinping administration, highlighted in April 2017, as an “elitist” (not populist) administration. Its policy priorities are to discipline the Chinese economy, and in particular to contain systemic financial risk, which President Xi has cited as a national security threat. This view is not wrong, but the latest data clearly show that Xi has decided to pause these painful efforts at limiting leverage and rebalancing China’s economy. Witness January-February’s decisive uptick in both total social financing (total private credit) and local government bond issuance (Chart 1). Chart 1Higher Risk Of An Overshoot
Higher Risk Of An Overshoot
Higher Risk Of An Overshoot
A massive spike in new credit is the single most important criterion in our “Checklist For A Stimulus Overshoot.” Thus, from a policy perspective, we are now at higher risk of an overshoot (Table 1). Not only credit as a whole but also informal lending saw a surge in January-February, implying that the government is relenting in its crackdown on the shadow banks. The approval of local government bond issuance for early in the year – and the People’s Bank of China’s announcement of a “Central Bank Bills Swap” program – reinforce this policy shift.1 Table 1Checklist For A Chinese Stimulus Overshoot In 2019
China: Stimulating Amid The Trade Talks
China: Stimulating Amid The Trade Talks
A stimulus overshoot is positive for Chinese demand in the short run but negative for potential GDP in the long run. A “traditional” credit surge of this nature cannot be surgically targeted at SMEs or households. It will go to state-owned enterprises, privileged corporations, property developers, and the like, which have always had the advantage in China’s financial system. SOEs have taken a much larger share of new loans than private companies in recent years,2 and the only silver lining of this trend was the possibility that tighter credit controls would discipline the SOEs. That silver lining is now fading, barring some new and surprising development on the reform front. China needs to create 26 trillion renminbi in new credit over the course of the year to avoid a corporate earnings contraction. These January-February numbers put China on track to do just that (Chart 2), assuming that President Xi and U.S. President Donald Trump agree to a short-term, framework trade deal this year. Chart 2On Track To Avoid An Earnings Contraction
On Track To Avoid An Earnings Contraction
On Track To Avoid An Earnings Contraction
Of course, a few caveats are in order. First, January-February’s credit number is only one data point and credit growth is always abnormally strong in the first month of the year. Early in the year, banks seek to expand their assets rapidly in a bid to get as much market share as possible before administrative credit quotas kick in. Because of Chinese New Year, it is best to combine January and February data to get a sense of the rate of credit expansion in the first part of the year. This year’s January-February numbers are very strong relative to previous years (Chart 3) and the context is more accommodative than the 2017 January-February credit surge, when authorities were beginning to tighten rather than ease macroprudential policy. Still a rapid rate of credit expansion will have to be sustained in the coming months in order to meet the 26 trillion RMB requirement highlighted above.
Image
Second, there is some risk that China’s households and private businesses will not respond as positively today as in the past. The intensification of Communist Party control over the society and economy, President Xi’s cancellation of term limits, and the strategic confrontation with the United States have created a bearish sentiment in the private sector. Our Emerging Markets Strategy would point out that if the propensity to consume, and money velocity,3 do not accelerate, then a surge in new credit may fail to ignite a reacceleration in China (Chart 4). Chart 4Chinese Are Holding On To Their Money
Chinese Are Holding On To Their Money
Chinese Are Holding On To Their Money
Still, what we now know is that Xi Jinping and his top economic adviser, Vice Premier Liu He, are not initiating the “assault phase of reform” that their predecessors initiated in the late 1990s in order to cleanse China’s economy of bad loans and zombie companies. Instead, they are likely reestablishing the “Socialist Put” in order to reverse the current deceleration, demonstrate China’s continued economic might and face down the United States’ threat of tariffs. Bottom Line: China’s stimulus measures are increasingly likely to overshoot, with positive implications for both Chinese and global growth. China is still facing a corporate earnings recession, but the odds of averting it are increasing. Trade Deadline More Likely To Be Extended What of the trade war? First, we would warn clients that China’s annual credit origination is a much bigger factor for the global economy than China’s exports to the United States (Chart 5). The trade war can escalate from here and yet, if China’s stimulus works as it has in the past, the results will be manageable for China’s economy save for Chinese companies expressly exposed to the U.S. economy through exports. In reality, both the U.S. and China are now effectively stimulating their economies and in this sense global trade as a whole will benefit regardless of bilateral tariffs. Chart 5Watch China Credit, Not So Much The Trade War
Watch China Credit, Not So Much The Trade War
Watch China Credit, Not So Much The Trade War
But it is possible that just as global equity markets ignored China’s economic slowdown and only sold off when the tariffs were levied (Chart 6), they may not continue to rally much on China’s credit data. Given the already considerable rally in global risk assets since October, markets may not be satisfied merely with one or two months of solid credit data out of China without a clear resolution to the trade conflict. After all, if a collapse in U.S.-China trade talks portends a new Cold War, then institutional investors may be justified in taking a wait-and-see approach despite China’s credit cycle upswing. Chart 6Will Equities Ignore China Data (Again)?
Will Equities Ignore China Data (Again)?
Will Equities Ignore China Data (Again)?
In the past, we have highlighted that the U.S. and China are not economically prohibited from engaging in a trade war – the export exposure is too small – and China’s new stimulus reinforces this point. However, President Trump is concerned about causing a sell-off in the tech sector and hence the broad equity market which could translate into a bear market and raise the probability of a recession occurring prior to November 2020. Meanwhile, in China, given Beijing’s reported trade concessions, there is apparently a desire to pacify the relationship and discourage U.S. unilateral tariffs and sanctions that could become seriously destabilizing for the Chinese economy and society. The need to have a happy 2021 centenary celebration for the Communist Party may factor into policymakers’ thinking. The latest news flow is mildly positive for the odds of getting a framework deal sometime this year. President Trump visited the Chinese negotiators in Washington, D.C. while President Xi reciprocated with the American negotiators in Beijing. A new round of two-week shuttle diplomacy is beginning. Trump has extended the tariff ceasefire and the two sides reportedly have arrived at an agreement on currency and are drafting written agreements on other areas of dispute. China’s National People’s Congress has passed a new Foreign Investment Law that ostensibly guarantees many of the American demands on forced tech transfer, intellectual property theft, and discriminatory treatment of U.S. companies (Table 2). Table 2New Foreign Investment Law Would Be A Positive For U.S.-China Negotiations
China: Stimulating Amid The Trade Talks
China: Stimulating Amid The Trade Talks
However, Presidents Trump and Xi have yet to schedule a new summit, which is probably necessary for a final deal. And there are murmurs from the press suggesting that China’s new law and other concessions are not going to satisfy the U.S. negotiators on the critical point of “structural changes” and a verification process. This leaves us inclined to change our trade war probabilities to increase the odds of an extension (Table 3). The improvement in U.S. financial conditions and China’s stimulus, if anything, make it more likely that negotiations will be extended, as both sides feel their economic and financial constraints less acutely. Table 3Updated Trade War Probabilities
China: Stimulating Amid The Trade Talks
China: Stimulating Amid The Trade Talks
Bottom Line: Global and Chinese risk assets should rally on China’s credit uptick, but the lack of resolution of the trade war could continue to inhibit animal spirits – and the odds of a March 1 resolution are declining. Who Are The Equity Winners Of China’s Stimulus? China’s strong January-February credit number is supportive of global equity markets. That much is obvious. But which equity markets will benefit the most? In what follows we examine the relationship between Chinese credit and MSCI equity returns of various countries. We find that Malaysian, Australian, South Korean, and Indonesian equities are the most highly correlated with Chinese credit growth and are thus most likely to benefit from the recent upturn (Chart 7). On the other hand, France and Italy stand out as countries whose bourses are more insulated.
Chart 7
Out of the markets that are positively correlated, South Korea and Russia stand out as relatively cheap (Chart 8). Thus we expect these equities to do especially well. By contrast, while Indonesia and the Philippines are highly leveraged to China, these markets are currently relatively expensive. BCA’s Emerging Markets Strategy is currently overweight Korean and Russian equities within the EM space, neutral Turkey (although recently upgraded from underweight), and underweight Indonesia and the Philippines.
Chart 8
In addition to credit stimulus, we expect Chinese household consumption to also gain support going forward. This will likely be driven by policy stimulus targeting the consumer specifically and is best exemplified by the recently announced tax cuts (Chart 9), which we expect to trickle down to greater consumer demand and growth in retail sales. Our base case calls for 8%-10% growth in household consumption over the coming 12 months, up from the current 3.5%.
Chart 9
However, consumer sentiment in China is weak. BCA’s Emerging Markets Strategy’s proxy for household marginal propensity to spend ticked up recently, after falling since early last year (see Chart 4 above). A resumption in the decline would highlight that households are increasingly unwilling to spend, which would translate into weaker retail sales despite policy efforts to boost consumption. Such a scenario – in which credit growth accelerates without a substantial uptick in consumer spending – is plausible, given that it occurred between mid-2015 and mid-2016 (Chart 10). In any case, whether Chinese stimulus comes in the form of the traditional credit channel, or instead in the form of fiscal stimulus to household consumption, the same equity markets will generally benefit the most (Chart 11). Chart 10...But Flattish Retail Sales Are Also A Possibility
...But Flattish Retail Sales Are Also A Possibility
...But Flattish Retail Sales Are Also A Possibility
Chart 11
Indeed, global equity markets react the same way regardless of the type of stimulus implemented. For instance, MSCI returns for the Philippines, Sweden, Malaysia, Indonesia, and Turkey are more closely correlated to both Chinese credit growth and retail sales growth compared to Italy, Japan, and France. The same conclusion is reached when we look at the correlations between Chinese credit growth or consumption growth and individual MSCI sectors such as industrials and consumer discretionary (Chart 12).
Chart 12
The relatively stronger correlation between Chinese credit growth and equity returns – as opposed to Chinese retail sales and equity returns – can be put down to the nature of Chinese imports. While industrial goods account for the bulk of China’s purchases of foreign goods, consumer goods excluding autos make up only 15% of China’s imports (Table 4). However, as Chart 12 illustrates, the relationship between China’s retail sales growth and global equities is much tighter in the case of the consumer discretionary sector, whether the latter is compared to global industrials sectors or the overall MSCI index. Table 4Import Composition Of Chinese Imports
China: Stimulating Amid The Trade Talks
China: Stimulating Amid The Trade Talks
Equity market exposure to China is not always in line with the extent of each country’s trade exposure to China (Chart 13).
Chart 13
There are some clear exceptions – most notably Mexico, which has the highest correlation coefficient with Chinese credit and consumption variables since 2010. However, this is likely due to idiosyncratic factors.4 Correlation does not imply causation, and we cannot conclude with certainty that Mexican equities will outperform amid China’s new round of stimulus. Nevertheless, given that Mexico is a very deeply liquid market that benefits amid EM bull markets, this may not be entirely coincidental. The correlations between global equity markets and Chinese credit peak two months after the stimulus measures are first implemented (Chart 14). This is more or less in line with adjusted total social financing’s correlation versus industrial metals. However, BCA’s Commodity & Energy Strategy has shown that copper’s correlations versus other measures of Chinese money and credit peak after roughly three quarters (Chart 15).5 This is evident in both the 2012 and 2015-16 stimulus episodes in which the bottom in copper prices lagged the bottom in China’s credit growth. Thus we may witness a rebound in equity markets on the back of China’s credit splurge before we see an improvement in annual returns on copper prices.
Chart 14
Chart 15Copper Rallies Lag China Credit Stimulus
Copper Rallies Lag China Credit Stimulus
Copper Rallies Lag China Credit Stimulus
Bottom Line: South Korean and Russian equities are best positioned to benefit from the positive surprise in China’s credit data. France and Italy are the worst positioned. Copper prices will rebound with a delay. Investment Implications BCA’s Geopolitical Strategy recommends that investors stay long Chinese equities ex-tech relative to the emerging market benchmark. This is a tactical call initiated in August 2018 that is now becoming a cyclical call on the basis of the credit upswing. We also remain long the “China Play Index,” a basket of China-sensitive assets. A rebound in China’s credit data and stronger global growth will support copper demand. Prices are still 15% below the mid-2018 peak and are poised to benefit in this environment, especially given that global inventories are already falling. BCA’s Geopolitical Strategy recommends that investors go long copper. Meanwhile, BCA’s China Investment Strategy recommends (for now) staying only tactically overweight Chinese equities relative to the global benchmark, pending higher conviction that the pace of credit growth will be strong enough to overwhelm the negative ramifications of a continued deceleration in actual activity over the coming few months on sentiment and 12-month forward earnings expectations. Over the long run, Geopolitical Strategy would look to underweight Chinese equities, as we are not optimistic about China’s productivity and potential GDP. This is because of the negative structural consequences of continuing the Socialist Put (i.e., bad loans, zombie companies, trade protectionism). We would expect CNY/USD to remain relatively buoyant in the context of both trade negotiations with the U.S. and fiscal-and-credit stimulus. The trade talks can hardly succeed if CNY/USD is falling. Depending on whether and how soon China’s stimulus results in a durable economic bottom, global growth could stabilize and the USD could see a substantial countertrend selloff. Matt Gertken, Vice President Geopolitical Strategy mattg@bcaresearch.com Roukaya Ibrahim, Editor/Strategist roukayai@bcaresearch.com Footnotes 1 Please see Emerging Markets Strategy Special Report titled “China: Prepping A Bazooka?” dated February 14, 2019 available at ems.bcaresearch.com 2 Please see Nicholas Lardy, “The State Strikes Back: The End Of Economic Reform In China?” Peterson Institute For International Economics, January 29, 2019, available at piie.com. 3 Please see Emerging Markets Strategy Weekly Report titled “Dissecting China’s Stimulus,” dated January 17, 2019 available at ems.bcaresearch.com 4 The 2012 election of President Enrique Peña Nieto caused Mexican equities to outperform their EM counterparts. Similarly in 2015-16, U.S. outperformance relative to EM also supported Mexico relative to EM because Mexico’s economy is highly leveraged to its northern neighbor. In both periods Mexico’s outperformance was not caused by – but instead coincided with – Chinese credit stimulus. These idiosyncratic events biased the correlation between Mexico’s equity markets and Chinese credit growth to the upside. 5 Please see Commodity & Energy Strategy Weekly Report titled “Trade Wars, China Credit Policy Will Roil Global Copper Markets,” dated June 21, 2018, available at ces.bcaresearch.com.