China
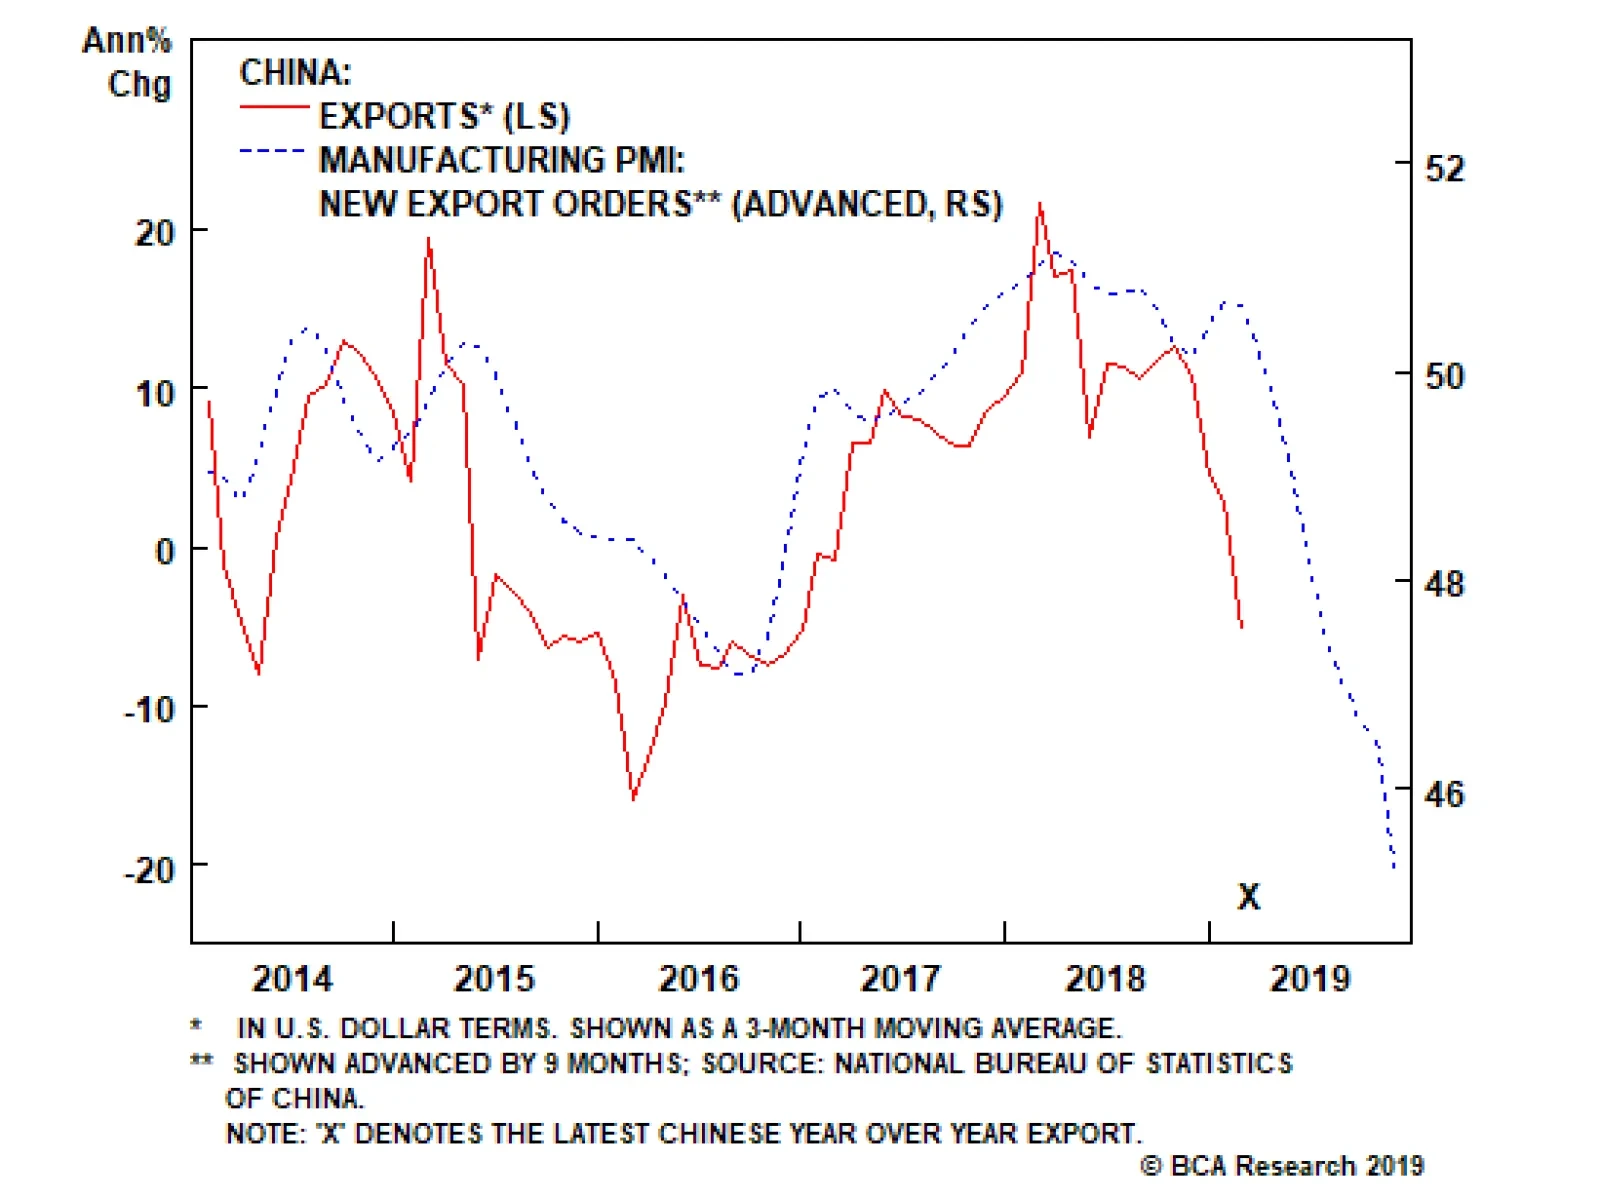
Last year, despite weak domestic activity and slowing global trade, Chinese exports remained very strong, even growing at a 19% annual rate in October. BCA’s China Investment Strategy service argues that this reflected front-running of the U.S. tariffs on…
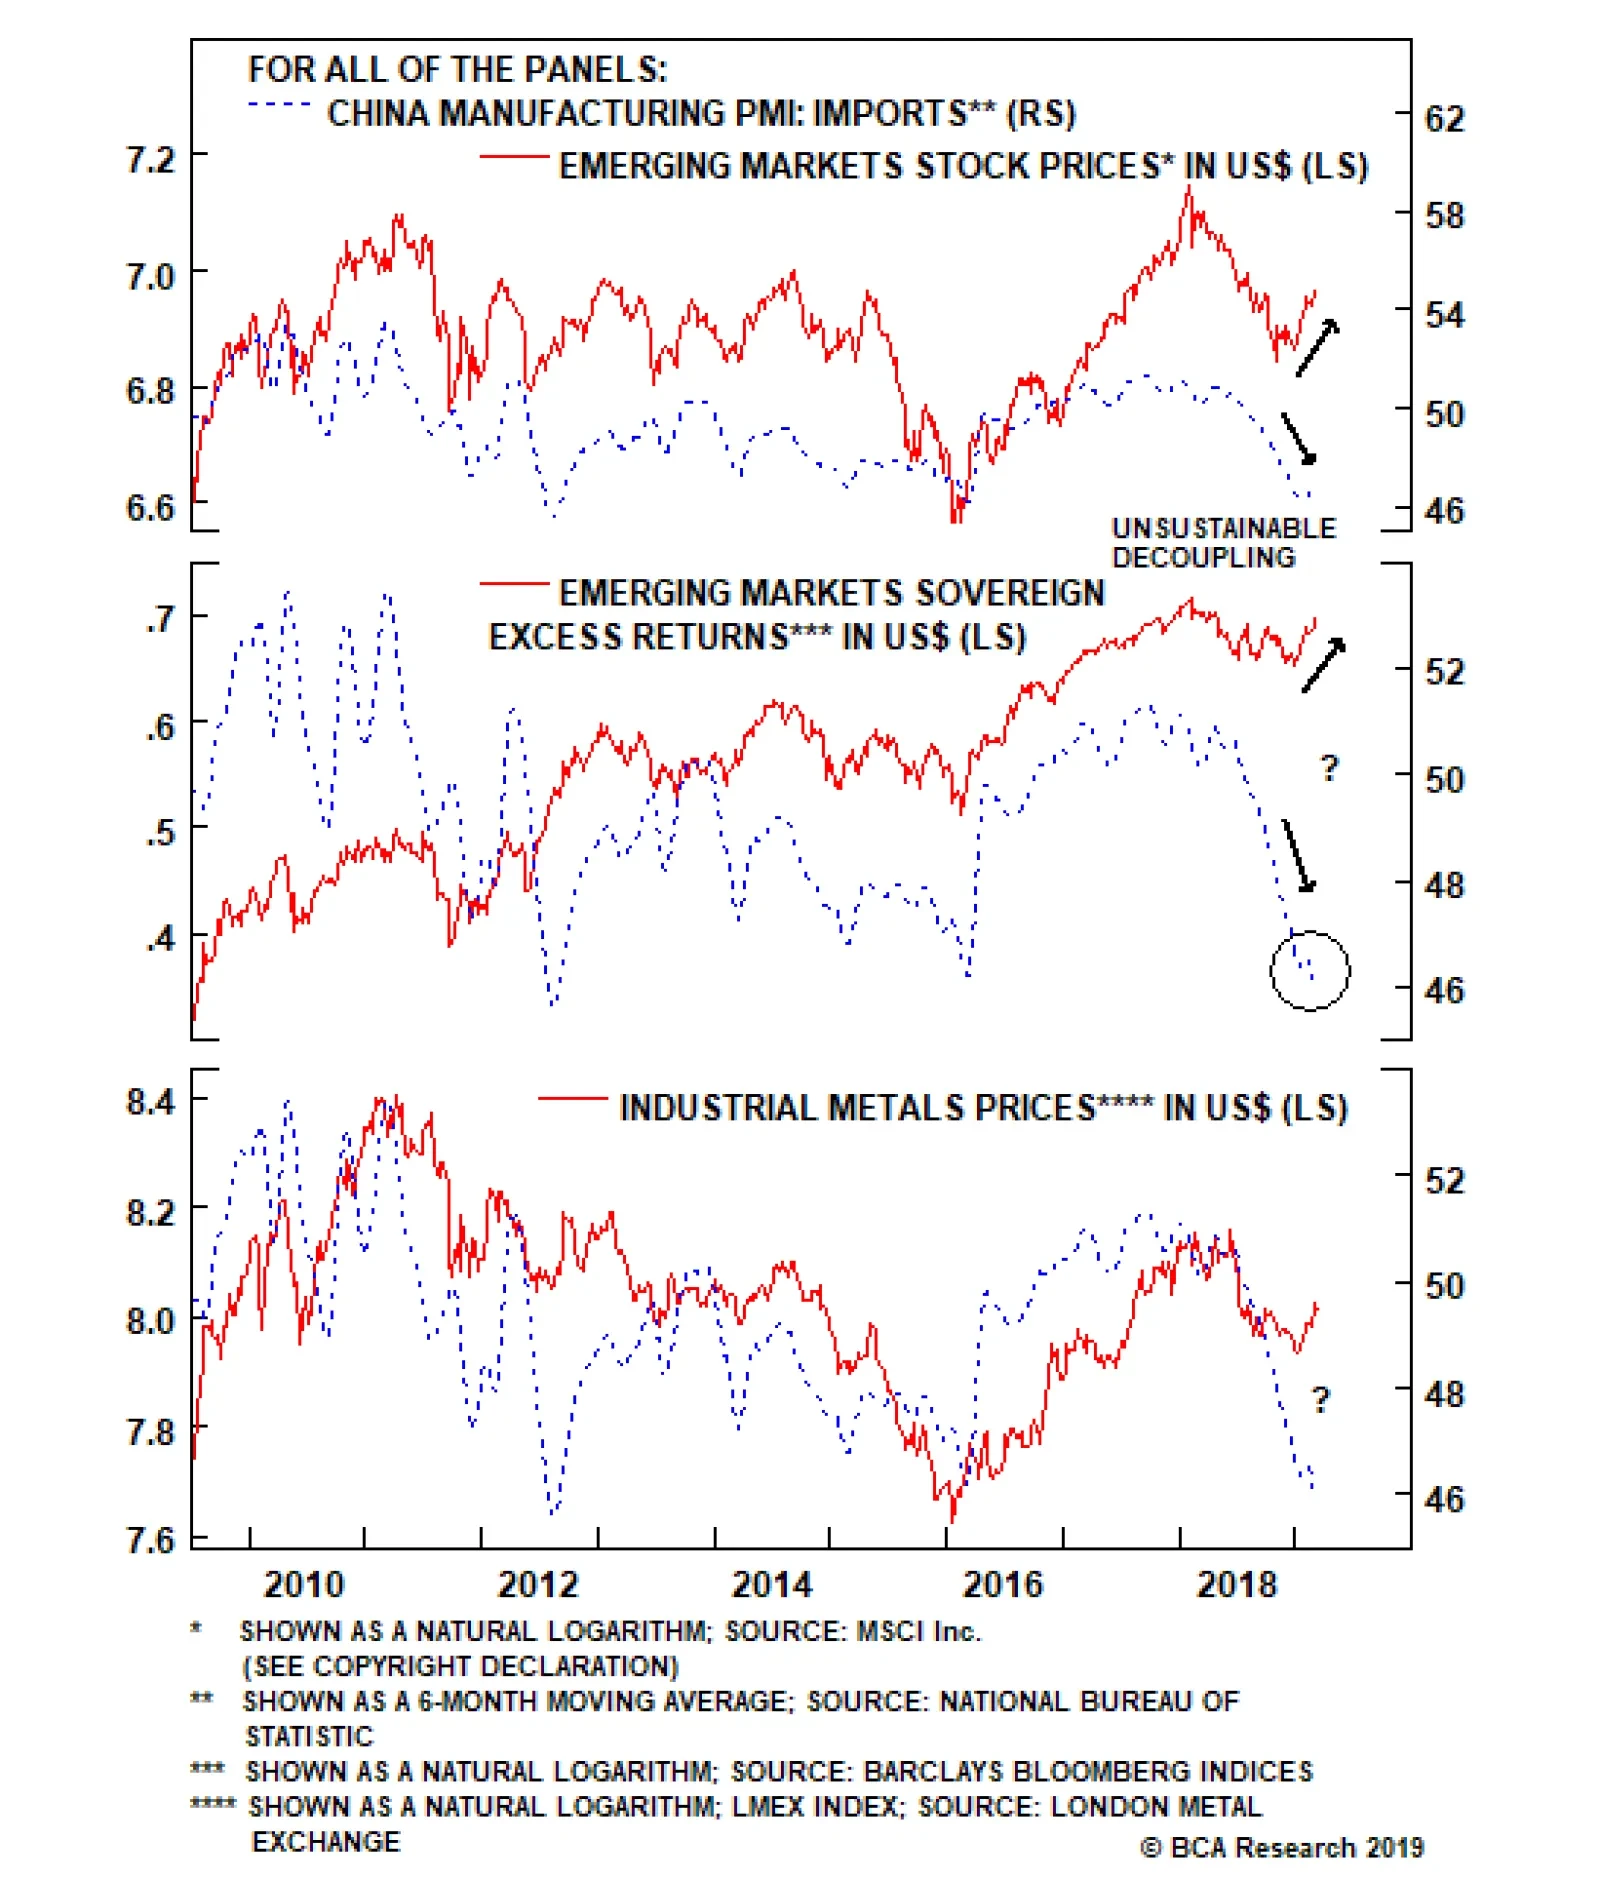
China influences the rest of the world via its imports. A closer look at the indicators that correlate with EM risk assets and commodities do not justify the recent EM rebound. In particular: The import sub-component of China’s NBS manufacturing PMI…
Even though narrow money (M1) has historically been an excellent indicator for China/EM business cycles, the most recent (January) print – M1 annual growth rate registered a record low – was distorted due to technical/seasonal factors, and should be ignored. …
Democrats as well as Republicans voiced support for Lighthizer as the top negotiator due to his strict stance on China’s trade practices. The takeaway is that Trump needs deep concessions from China – what the top Democrat on the committee called “a…
First, Trump’s extension of the tariff deadline – which he originally envisioned as a pause for a month “or less” – could just as easily lead to additional extensions rather than a quick resolution. Second, reports suggest that China, like the EU, is…
This is reflected in our subjective trade-deal probabilities, which hold that an additional extension is as likely as a final deal this month and that the risk of a relapse into trade war remains elevated at 30%. Fundamentally, our pessimism stems from our…
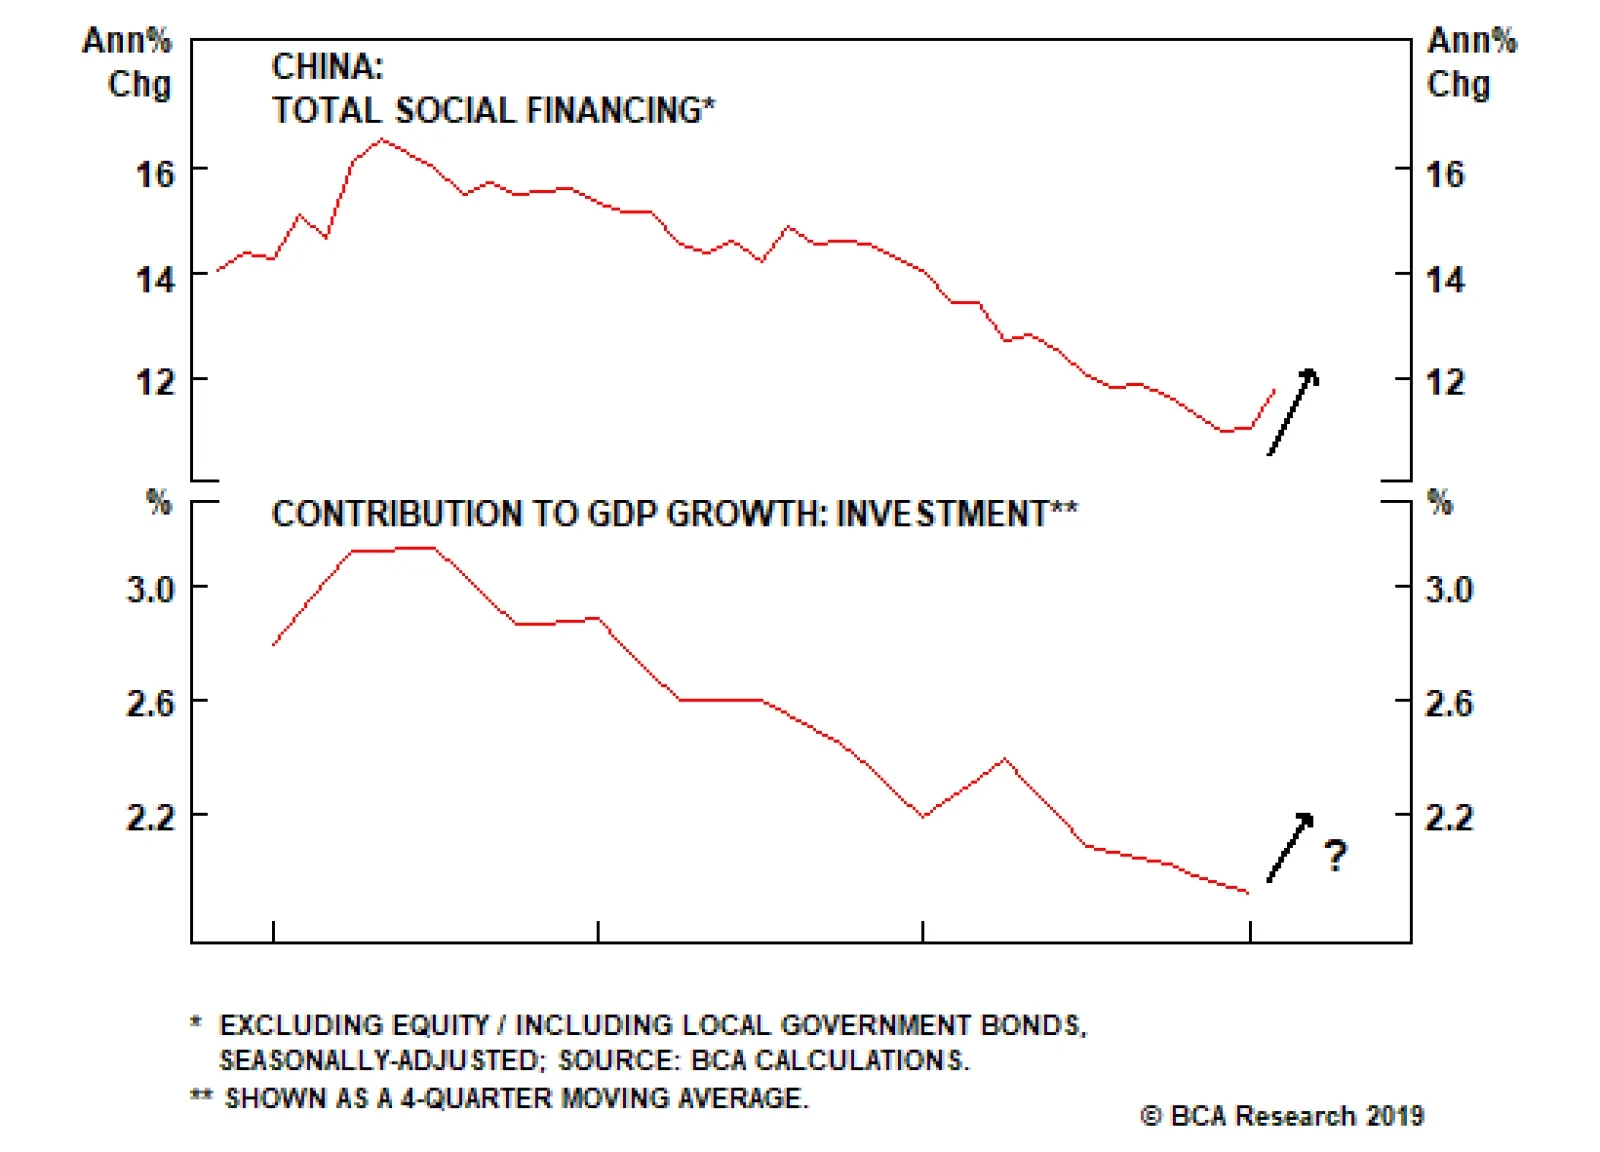
Fixed investment spending in China is generally financed through credit markets. The above chart shows that the contribution of investment spending to GDP growth has declined in tandem with decelerating credit growth. Chinese credit growth has typically…

Highlights Analysis on Indonesia is available below. EM financial markets have diverged from the global growth indicators they have historically correlated with. This raises doubts about the sustainability of this rally. In China, broad bank credit has not accelerated at all, while non-bank credit growth rose sharply in January. The lack of recovery in broad bank credit growth is corroborated by lingering sluggishness in broad money growth. This refutes widespread perception in the global investment community that Chinese banks have re-opened the credit spigots again. Feature The headline news has all been positive for emerging markets over the past two months: The Federal Reserve is going on hold, China is stimulating its economy, the U.S. and China are nearing a trade agreement and risk-on market dynamics are permeating worldwide. Nevertheless, EM stocks have failed to outperform the global equity benchmark (Chart I-1, top panel). Notably, EM relative equity performance rolled over in late December when global share prices bottomed. Chart I-1EM Stocks Have Underperformed DM Ones Since Late December
EM Stocks Have Underperformed DM Ones Since Late December
EM Stocks Have Underperformed DM Ones Since Late December
In absolute terms, EM equities have been attempting to break above their 200-day moving average, but have so far failed to do so decisively (Chart I-1, bottom panel). When a market struggles to break out or outperform amid favorable news flows and buoyant investor sentiment, the odds are that it is facing formidable headwinds under the surface, and is at risk of relapsing. We sense EM currently fits this profile. Needless to say, investor consensus is very bullish on EM, and dominated by the above-mentioned narrative, specifically the Fed turning dovish and China stimulating, which is reminiscent of 2016 when EM staged a cyclical rally. Consequently, investors have rushed to pile into EM stocks and fixed-income. Chart I-2 illustrates that asset managers’ net holdings of EM ETF (EEM) futures have doubled since October 2018. Chart I-2Investor Consensus Is Very Bullish On EM
Investor Consensus Is Very Bullish On EM
Investor Consensus Is Very Bullish On EM
As of mid-February, EMs were by far the most overweight region within global equity portfolios, according to the most recent Bank of America/Merrill Lynch survey. The survey states that net 37% of global equity investors - who participated in the survey - were overweight EM. One of our clients that we met with on the road last week summed it up like this: “Investors have ‘recency bias’.” In other words, investors believe that 2019 will resemble 2016, and in turn have no appetite to bet against Chinese stimulus. We are in accord with this interpretation of investor behavior and the EM/China rally. Yet there are some noteworthy differences between today and 2016. First, in 2016, there was massive stimulus for China’s property market. At the time, the People’s Bank of China (PBoC) monetized the unsold housing stock in Tier-3 and -4 cities via its Pledged Supplementary Lending facility. At present, there is no stimulus for real estate. Second, by early 2016 EM profits had already contracted substantially. EM profits have yet to shrink in the current downtrend. Our thesis is that EM profits will contract this year for reasons we elaborated on in depth in our previous report, Mind The Time Gap. China’s credit and fiscal impulse leads EM/Chinese profits by about 12 months, and the recent improvement in this indicator, if sustained, suggests that a trough in EM/Chinese corporate earnings will only be reached in late 2019 (Chart I-3). Therefore, as EM profits shrink, investors will likely sell EM risk assets. Chart I-3EM Corporate Earnings Are Beginning To Contract
EM Corporate Earnings Are Beginning To Contract
EM Corporate Earnings Are Beginning To Contract
Altogether, these differences with 2016 make us reluctant to chase the current EM rally, and we continue to expect a meaningful reversal in EM risk assets in the months ahead. Monitoring Global Growth We maintain that EM is much more leveraged to global trade and China’s growth than to Fed policy. For a detailed discussion on this matter, please refer to EM: A Replay of 2016 or 2001? report from February 7, 2019. Therefore, the Fed’s dovish turn is not a sufficient reason to buy EM risk assets. To buy EM cyclically, we would need to change our outlook on global trade and Chinese imports. China influences the rest of the world via its imports. A closer look at the indicators that correlate with EM risk assets and commodities do not justify the recent EM rebound. In particular: The import sub-component of China’s NBS manufacturing PMI strongly correlates with EM share prices, excess returns in EM sovereign credit, and industrial metals prices and suggest that investors should fade this rebound (Chart I-4). Chart I-4EM Stocks, EM Credit Markets, As Well As Commodities Prices Are Driven By Chinese Imports
EM Stocks, EM Credit Markets, As Well As Commodities Prices Are Driven By Chinese Imports
EM Stocks, EM Credit Markets, As Well As Commodities Prices Are Driven By Chinese Imports
The Caixin manufacturing PMI for China was up in February, but the NBS manufacturing PMI fell. In turn, manufacturing PMI indexes in Korea, Taiwan, Japan and Singapore are all plunging, with several of them dropping well below the 50 boom-bust mark (Chart I-5). Chart I-5Asian Manufacturing Is Contracting
Asian Manufacturing Is Contracting
Asian Manufacturing Is Contracting
Korean, Taiwanese, Japanese and Singaporean shipments to China were shrinking in January, while their exports to the U.S. were resilient (Chart I-6). This confirms that global trade has been weak due to China, and that there are no signs of its reversal. Chart I-6Asian Exports To China And U.S.
Asian Exports To China And U.S
Asian Exports To China And U.S
Moreover, Korea released its February export data, and its aggregate outbound shipments are contracting (Chart I-7). Chart I-7Korean Exports: Deepening Contraction
Korean Exports: Deepening Contraction
Korean Exports: Deepening Contraction
Further, China’s container freight index – the price to ship containers – has rolled over again after picking-up late last year due to front-loading of shipments to the U.S. which were induced by the U.S. import tariffs. This signals ongoing weakness in global demand, and does not justify the latest rebound in EM financial markets in general and currencies in particular (Chart I-8). Chart I-8Global Trade Is A Risk To EM Currencies
Global Trade Is A Risk To EM Currencies
Global Trade Is A Risk To EM Currencies
Finally, even in the U.S. where manufacturing has been the most resilient globally, the odds point to notable weakness in this sector. Specifically, the continuous underperformance of U.S. high-beta industrial stocks to U.S. overall industrials beckons a further slowdown in American manufacturing (Chart I-9). Chart I-9U.S. Manufacturing Is In A Soft Spot
U.S. Manufacturing Is In A Soft Spot
U.S. Manufacturing Is In A Soft Spot
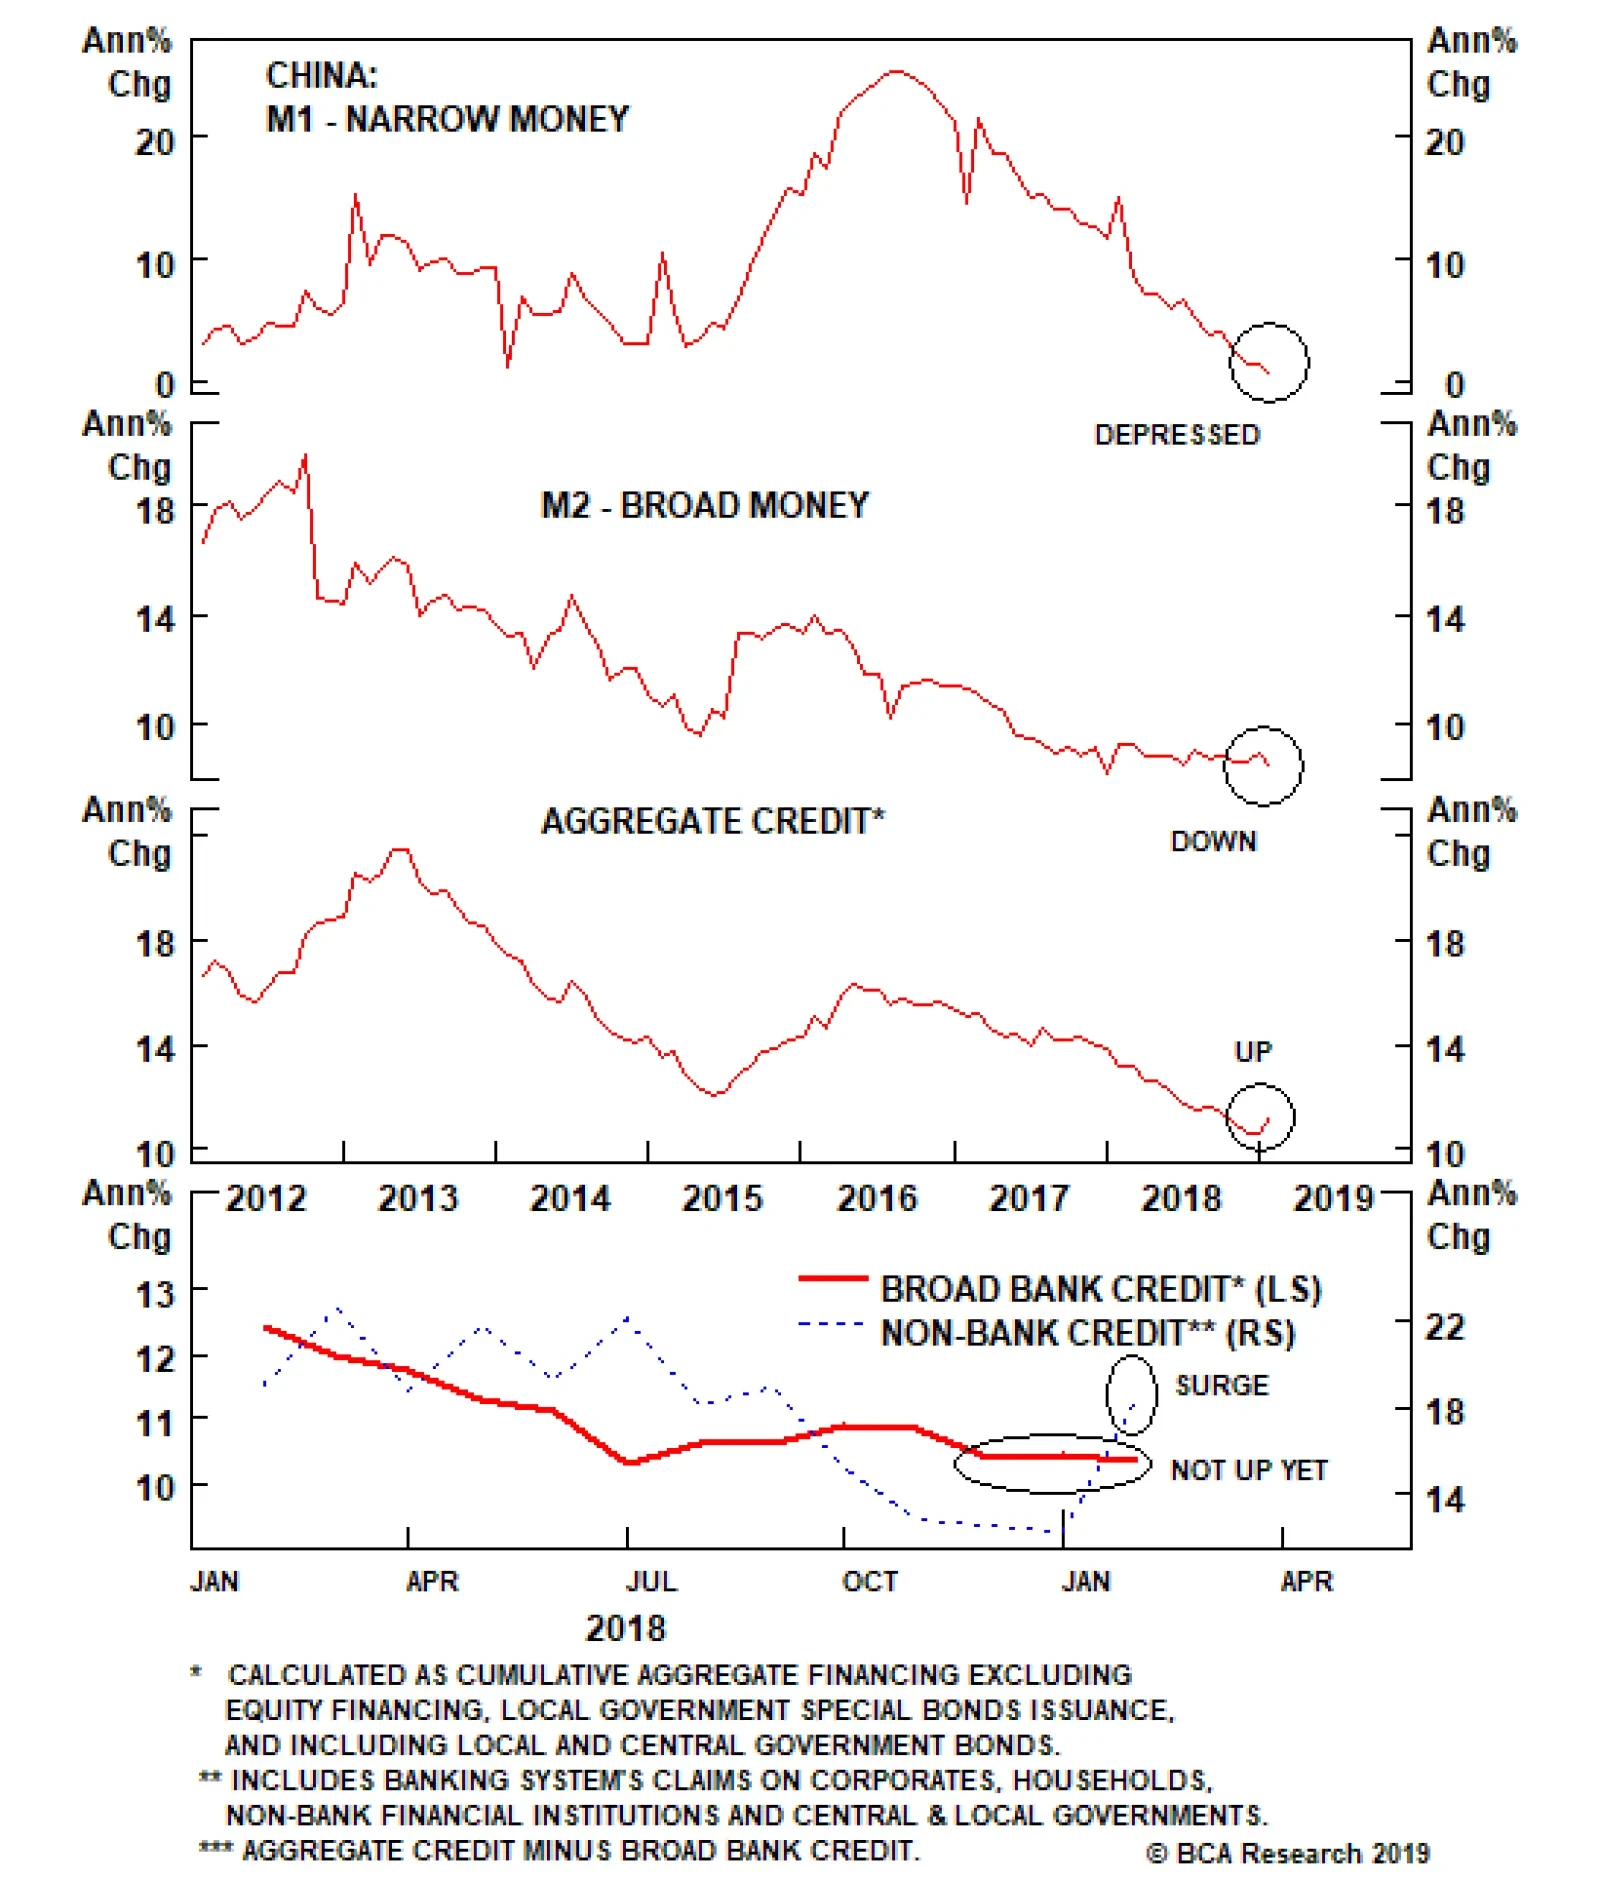
Bottom Line: Although financial markets are forward-looking, the recent rally has been too fast and has already gone too far. This has created conditions for a material setback as global/China growth will continue to disappoint in the months ahead. China: Credit Versus Money Growth We have been receiving questions from clients as to whether investors should heed to the message from China’s money or credit data, given they are presently sending contradictory messages (Chart I-10). Chart I-10China: Narrow, Broad Money, And Aggregate Credit
China: Narrow, Broad Money, And Aggregate Credit
China: Narrow, Broad Money, And Aggregate Credit
Even though narrow money (M1) has historically been an excellent indicator for China/EM business cycles, the most recent (January) print – M1 annual growth rate registered a record low – was distorted due to technical/seasonal factors, and should be ignored. Specifically, deposits by enterprises plunged in January and household deposits surged as companies paid out bonuses to employees in late January ahead of the Chinese New Year that began on February 5 (Chart I-11). Provided enterprise demand deposits are in M1 but household demand deposits are a part of M2, M1 was artificially depressed in January. It will rebound in February. Chart I-11China: Technical Reasons For M1 Plunge In January
China: Technical Reasons For M1 Plunge In January
China: Technical Reasons For M1 Plunge In January
Broad money provides a more comprehensive picture of money creation in China. As such, it is more relevant to compare broad money with aggregate credit. To compute aggregate credit, we add outstanding central and local government bonds to Total Social Financing (TSF). Chart I-12 illustrates the latest improvement in aggregate credit is not confirmed by either the PBoC’s broad money measure, M2, or our measure, M3 (M3 = M2 plus other deposits plus banks’ other liabilities excluding bonds). We created this M3 measure of broad money supply because in our opinion, M2 has been underestimating the extent of money creation in China in recent years due to financial engineering. Chart I-12The Recent Uptick In Aggregate Credit Is Not Confirmed By Broad Money
The Recent Uptick In Aggregate Credit Is Not Confirmed By Broad Money
The Recent Uptick In Aggregate Credit Is Not Confirmed By Broad Money
As discussed in Box I-1 on pages 12-13, lending or purchasing of securities by banks simultaneously creates money. Therefore, bank broad credit acceleration should be mirrored in a broad money upturn. Does the lack of revival in broad money mean the latest uptick in aggregate credit data has been driven by non-bank credit? Our analysis suggests yes – non-bank credit is responsible for the strong rise in the aggregate credit numbers in January. We deconstructed aggregate credit into broad bank credit and non-bank credit (Diagram I-1). Chart I-13 illustrates that broad bank credit has not accelerated at all, while non-bank credit growth rose in January.
Chart I-
Chart I-13China: Recent Credit Acceleration Is Due To Non-Bank Credit
China: Recent Credit Acceleration Is Due To Non-Bank Credit
China: Recent Credit Acceleration Is Due To Non-Bank Credit
The lack of recovery in broad bank credit growth is corroborated by lingering sluggishness in broad money (both M2 and M3) growth (Chart I-14). Chart I-14Broad Bank Credit Is Consistent With Broad Money (As It Should Be)
Broad Bank Credit Is Consistent With Broad Money (As It Should Be)
Broad Bank Credit Is Consistent With Broad Money (As It Should Be)
Consequently, this refutes the widespread perception in the global investment community that Chinese banks have re-opened the credit spigots. Chart I-15demonstrates the annual growth rate of each component of broad bank credit. While mainland banks’ loan growth to enterprises has accelerated, their lending to non-bank financial institutions has continued to shrink. Chart I-15Broad Bank Credit And Its Components
Broad Bank Credit And Its Components
Broad Bank Credit And Its Components
In sum, broad bank credit and broad money have not revived, and their impulses are rolling over, having failed to break above zero (Chart I-14, bottom panel). Bottom Line: The improvement in aggregate credit growth in January was due to credit provided/bonds purchased by non-banks rather than by banks. This does not tell us whether the credit growth acceleration is sustainable. For a more detailed discussion on the differences between money and credit, please refer to Box I-1 on page 12-13. Investors prefer simple narratives, and have readily embraced the story that China has opened up the credit faucets. Broad bank credit data and broad money supply data do not corroborate this thesis. It may change in the months ahead, but our point is that for the moment there is not yet a simple narrative about China’s credit cycle. Investment Implications Even though China’s aggregate credit impulse ticked up in January, the 2011-‘12 and 2015-‘16 episodes signify that its bottoming can last many months. Critically, EM financial markets have historically lagged turning points in the aggregate credit impulse. These time lags have been anywhere between three to 18 months over the past 10 years. Furthermore, in 2012 there was only a minor rebound in EM share prices – not a cyclical rally – in response to the significant rise in China’s aggregate credit impulse (Chart I-16, top panel). Chart I-16Beware Of The Time Lag
Beware Of The Time Lag
Beware Of The Time Lag
Hence, even if January marked the bottom in the aggregate credit impulse – which is plausible in our opinion – EM risk assets will remain at risk based on historical time lags between the aggregate credit impulse and China-related financial markets.1 BOX 1 Why And When Money Supply Differs From Credit The following elaborates on the key differences between broad money supply and aggregate credit. 1. Why and when do broad money and credit diverge? When commercial banks provide loans to or buy bonds (or any other asset) from non-banks, they simultaneously create new money supply/deposits. Broad money supply is the sum of all deposits in the banking system, which is why we use the terms money and deposits interchangeably. When non-bank financial institutions – in China's case financial trust and investment corporations, financial leasing companies, auto-financing companies and loan companies – as well as enterprises and households make loans or buy bonds, they do not create money. Hence, money supply/deposits is mostly equal to net cumulative broad bank credit creation. The difference between aggregate credit and money supply is due to lending activities of non-bank entities (see Diagram I-1 on page 9). Lending, purchasing of bonds, or any other forms of financing by non-bank entities does not change money supply. Thus, aggregate credit is more relevant than money supply to forecast business cycle fluctuations. Apart from the fact that banks still play a very large role in aggregate financing in China, there are a few other reasons why one should not ignore broad money and rely solely on aggregate credit: Banks can extend credit, but might choose not to classify it as loans on their balance sheet for regulatory reasons. Chinese banks did this in the past by booking loans as non-standard credit assets. In any case, when a bank lends to a non-bank it creates new deposits/money, and it is hard to conceal deposits/liabilities. In these cases, broad money supply gives a better signal about the true extent of credit growth than statistics on loans. If under regulatory pressures banks reclassify their non-standard credit assets as loans, the amount of loans will expand, even though no new lending occurs. Yet, money supply/deposits will not change. In this case, loan numbers will give a false signal and money supply will be a better indicator for new credit origination by banks and, thereby, for economic activity. The true measure of Chinese bank loans and credit data were probably disguised over the past several years because banks and non-bank financial institutions were involved in financial engineering. However, in the past two years, the regulatory clampdown forced Chinese commercial banks to unwind some of these structures and properly reclassify items on their balance sheets. Both the masking of credit assets and the ensuing reclassification could have distorted loan and credit data. This is why we use broad money supply as a litmus test to gauge banks’ broad credit origination. Given TSF includes bank loans but does not include banks’ non-standard credit assets, we believe TSF understates the amount of credit in the economy. As a result, we have not been able to calculate an accurate aggregate level of non-bank credit. Only since mid-2017, when under the regulatory clampdown, banks have stopped classifying loans as non-standard credit assets, can the annual growth rate of TSF serve as a meaningful statistic. Hence, we estimate the annual growth rate of non-bank credit only starting in 2018 (please refer to Chart I-13 on page 9). 2. Does the central bank (PBoC) create money by injecting liquidity into the system? Barring lending to or buying assets from non-banks – which does not typically occur outside of quantitative easing (QE) programs – central banks do not create broad money or deposits. Central banks create banking system reserves, which are not part of the broad money supply in any country. Money supply/deposits, the ultimate purchasing power for economic agents, is created solely by commercial banks “out of thin air,” as we have discussed and illustrated in our series of reports on money, credit and savings. 3. Why do we use impulses (second derivatives of money/credit) rather than growth rates? Our goal is to forecast a change in economic activity/capital spending/imports/enterprise revenues – i.e., a change in flow variables. Money and credit are stock variables. Therefore, a change (the first derivative) in outstanding money and credit produces flow variables. The latter measures new credit and money origination in a given period. These are comparable with flow variables like spending, income and profits. To gauge changes in flow variables, i.e., the growth rate of spending, one needs to calculate a change in new money and credit origination – i.e., change in their net flow. In brief, to do an apples-to-apples comparison, one needs to use the second derivative (a change in change) in money and credit – i.e., changes in their flows – to predict changes in flow variables such as GDP/capital spending/imports/enterprise revenues. Arthur Budaghyan, Senior Vice President Emerging Markets Strategy arthurb@bcaresearch.com Lin Xiang, Research Analyst linx@bcaresearch.com Indonesia: It Is Not All About The Fed Indonesian stocks have outperformed their emerging market peers significantly in the past few months as the Federal Reserve has turned dovish and U.S. rate expectations have declined. Although U.S. bond yields do strongly and inversely correlate with Indonesian stocks’ relative performance versus the EM equity benchmark (Chart II-1, top panel), we believe there are other factors – such as Chinese growth and commodities prices – that are also important to this market (Chart II-1, bottom panel). Chart II-1Indonesian Stocks: The Fed Versus Commodities
Indonesian Stocks: The Fed Versus Commodities
Indonesian Stocks: The Fed Versus Commodities
In the next several months, slowing Chinese growth, lower commodities prices, and a renewed sell-off in EM markets will take a toll on Indonesian financial markets. Indonesian exports are contracting which will intensify as commodities prices fall and China’s purchases of coal and base metals drop (Chart II-2, top panel). Chart II-2Indonesia: Exports Are Shrinking
Indonesia: Exports Are Plunging
Indonesia: Exports Are Plunging
Indonesia’s current account deficit is already large and will continue widening as the export contraction deepens (Chart II-2, bottom panel). Remarkably, the nation’s commercial banks have been encouraged to keep the credit taps open as the central bank – Bank Indonesia (BI) – has been injecting enormous amounts of liquidity (excess reserves) into the banking system (Chart II-3, top panel). Given these liquidity injections, bank credit and domestic demand growth have remained more resilient than would otherwise have been the case. Chart II-3The Central Bank Is Injecting Liquidity
Indonesia's Central Bank Is Injecting Liquidity
Indonesia's Central Bank Is Injecting Liquidity
Yet, by injecting such enormous amounts of excess reserves into the system, the central bank has more than negated its previous liquidity tightening, resulting from the sales of its foreign exchange reserves in order to defend the rupiah (Chart II-3, bottom panel). The implications of such policy are that these excess reserves could encourage speculation against the rupiah, especially amid weakening global growth and falling commodities prices. Provided foreigners own large portions of Indonesian stocks and local-currency government bonds, a depreciation in the rupiah will produce a renewed selloff in the nation’s financial markets. A final point on Indonesian commercial banks: their net interest margins have been narrowing sharply (Chart II-4, top panel). Chart II-4Commercial Banks' Profits Will Weaken
Commercial Banks' Profits Will Weaken
Commercial Banks' Profits Will Weaken
Moreover, as global growth slows, non-performing loans (NPLs) on the balance sheets of Indonesian banks will rise. In turn, provisioning for bad loans will also increase, and bank earnings will decline (Chart II-4, bottom panel). These dynamics will be bearish for Indonesian commercial banks, which account for 44% of the overall MSCI Indonesia index. Bottom Line: Continue avoiding/underweighting Indonesian stocks and fixed-income markets. We continue shorting the IDR versus the U.S. dollar. Ayman Kawtharani, Associate Editor ayman@bcaresearch.com Footnotes 1 Please note that this represents the Emerging Markets Strategy team’s view and is different from BCA’s house view on global risk assets and global growth. The key point of contention is the outlook for China’s growth. Equity Recommendations Fixed-Income, Credit And Currency Recommendations
Highlights So What? Optimism over a U.S.-China trade deal is becoming excessive. Why? Presidents Trump and Xi appear to want a deal but their late March summit is not yet finalized. Several news reports supporting the bullish consensus are overrated. The odds of a “grand compromise” that entails China implementing U.S. structural demands are 10%. The odds of trade war escalation are 30%. China’s policy stimulus is a better reason than trade talks to become more constructive on Chinese and China-sensitive risk assets. Feature The Chinese equity market is rallying enthusiastically as the annual “Two Sessions” legislative meeting convenes (Chart 1). The basis for the rally is evidence of greater policy support for the economy along with a general belief that the U.S. and China are close to concluding a trade deal, possibly at a fourth summit between President Donald Trump and Xi Jinping that may be held in late March. The NPC session will build on the optimism with Premier Li Keqiang’s promise of more “forceful” policy support and the passage of a new foreign investment law that promises fair treatment to foreign companies. Chart 1Positive Trade Signals, But Market Getting Ahead Of Itself
Positive Trade Signals, But Market Getting Ahead Of Itself
Positive Trade Signals, But Market Getting Ahead Of Itself
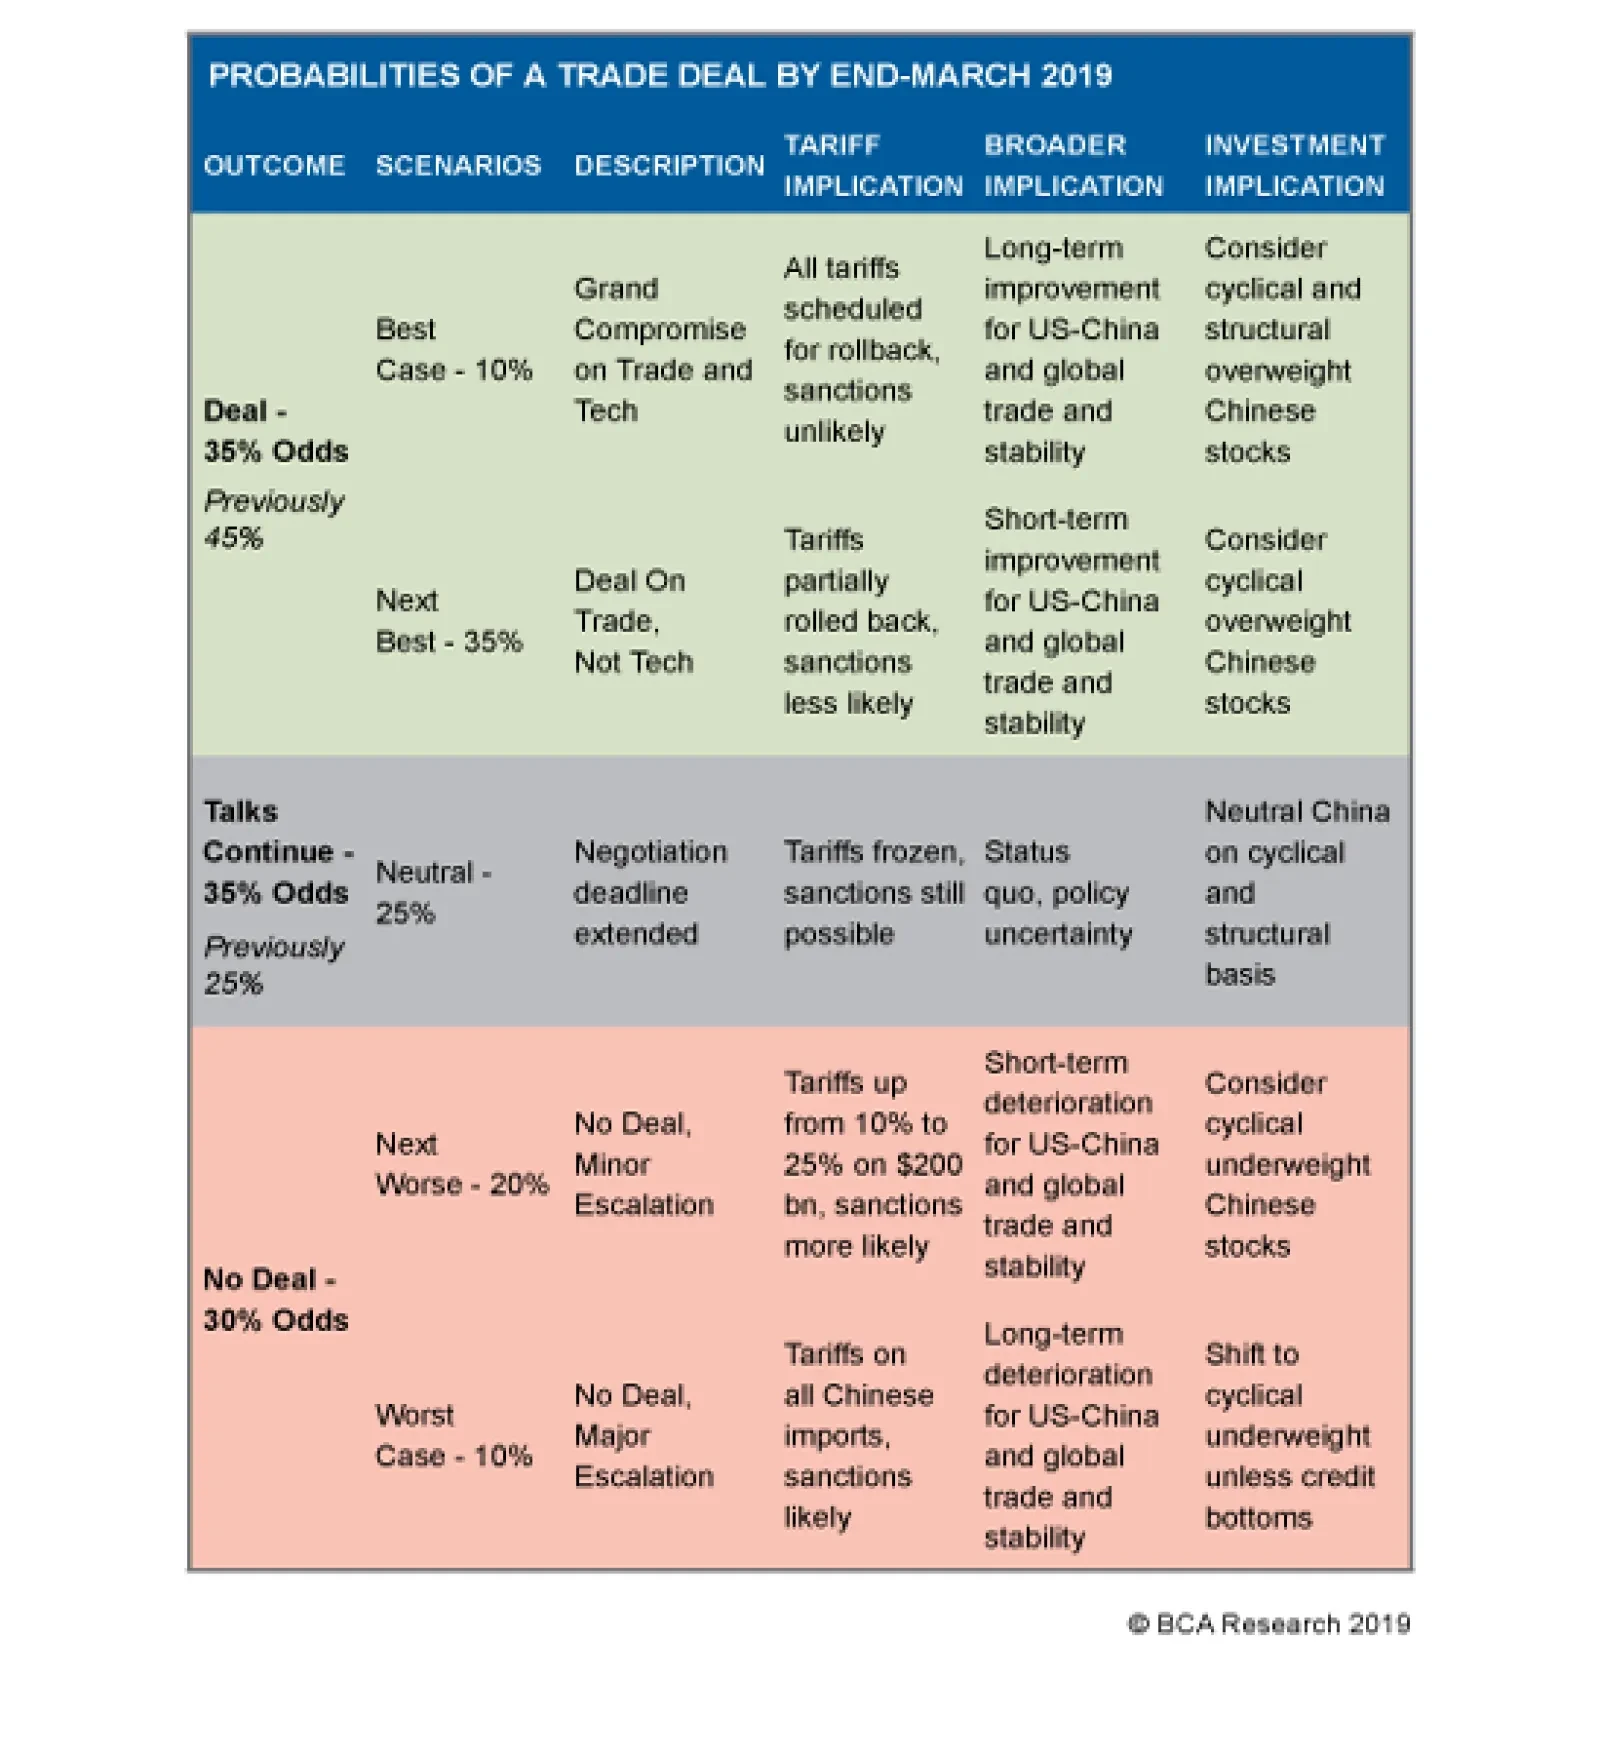
Our view is that the trade signals are broadly positive – implying a 70% chance that tariffs will either remain frozen or decrease in the scenario analysis below – but that the market is getting ahead of itself both in terms of the likelihood of a “structural deal” and in terms of the positive market impact from any deal. The market impact will depend on the depth of the concessions that China offers the United States. If the concessions are significant, President Donald Trump will be able to roll back tariffs to a considerable extent – trade policy uncertainty will fall, China’s economic outlook will improve, and Trump’s reelection odds (and hence U.S. economic policy continuity) could increase marginally. If China’s concessions are slight, tariff rollbacks will be limited or non-existent and the deal will stand on shaky ground, ensuring elevated policy uncertainty in the aftermath of the agreement and raising the probability of a relapse into trade war ahead of the 2020 election. Trump may feel he has to prove his protectionist credentials anew against a trade critic in the general election. Will the outcome be positive enough to surprise Chinese and global markets that have already discounted a lot of positive news? From where we sit, this is unlikely. More likely, investors will be underwhelmed by a lack of resolution or the shallowness of a deal. The risk to this view is the aforementioned structural deal that involves substantial Chinese concessions combined with a major reduction in U.S. tariffs and sanctions. But even in this case investors will face additional trade uncertainty relating to the U.S. Section 232 investigation into auto imports, on which Trump must decide by May 18, underscoring the point that trade alone is not a firm basis for bullish investment recommendations over the course of H1 2019. The continued strength of the U.S. economy and China’s policy stimulus provide a more realistic basis for global risk assets to rally over the 6-12 month horizon. Presidential Momentum For A Trade Deal We remain pessimistic about U.S.-China relations in general and the prospects for a structural trade deal in particular. This is reflected in our subjective trade-deal probabilities, which hold that an additional extension is as likely as a final deal this month and that the risk of a relapse into trade war remains elevated at 30% (Table 1). Table 1Updated Trade War Probabilities
China-U.S. Trade: A Structural Deal?
China-U.S. Trade: A Structural Deal?
Fundamentally, our pessimism stems from our view that the U.S. and China are locked in the early chapters of an epic struggle for supremacy in Asia Pacific that will reduce their ability to engage cooperatively (Chart 2). Chart 2China, U.S. In Geopolitical Power Struggle
China, U.S. In Geopolitical Power Struggle
China, U.S. In Geopolitical Power Struggle
Critically, the economic impact of a trade war is not prohibitive for either country. China is not as reliant on exports as it once was. In addition, neither the U.S. nor China is too reliant on trade with the other to make a trade war unthinkable, as was the case with Canada and Mexico (Chart 3). Chart 3Economic Impact Of A Trade War Is Not Prohibitive
Economic Impact Of A Trade War Is Not Prohibitive
Economic Impact Of A Trade War Is Not Prohibitive
China is economically vulnerable but is politically centralized, as symbolized by Xi Jinping’s aggressive purge of the Communist Party on the basis of corruption (Chart 4). The ruling party can and will accept the worst international economic outcomes since 1989-91, if it believes this is necessary for regime survival. Chart 4Regime Survival is Paramount
Regime Survival is Paramount
Regime Survival is Paramount
Meanwhile the U.S. is economically insulated and performing relatively well (Chart 5), and is not politically divided on the question of China. A bipartisan, hawkish consensus has developed that will be discussed below. Just as we argued correctly that this trade war would occur, so too we believe it has a fair chance of reigniting. This could be due to policy miscalculation, unforeseen events, or the likelihood that Trump will face heat from the left-wing ahead of the election if he gives China as easy of a deal as he gave to Canada. Chart 5The U.S. Economy Is Strong But Softening...
The U.S. Economy Is Strong But Softening...
The U.S. Economy Is Strong But Softening...
Nevertheless we accept that there is top-level momentum in favor of a deal for the time being, and this comes from both Presidents Trump and Xi. In China, delaying tactics are the standard way of coping with an angry Washington, as the perception in Beijing is that economic and technological advancement give it greater leverage over time. Moreover, the economy is weakening on several fronts, private sector sentiment is bearish, and the easing of fiscal and monetary policy is of unclear effectiveness (Chart 6). These are all reasons for Xi to seek at least a temporary reprieve. Chart 6...While the Chinese Economy Is Weak But Stimulating
...While the Chinese Economy Is Weak But Stimulating
...While the Chinese Economy Is Weak But Stimulating
In the United States, Trump faces a difficult election campaign due to his relatively low job approval with voters (Chart 7). His polling has recently improved with the settlement of the FY2019 budget and avoidance of a second government shutdown, and this is despite his controversial decision to press forward unilaterally on southern border security. But he will be running for office late in the business cycle and is vulnerable to an equity bear market and recession. This explains why he has shown risk aversion since October on market-relevant issues ranging from NAFTA, Iran, and China. A trade deal with China offers the possibility not only of satisfying a campaign promise (renegotiating the terrible trade deals of the past) but also of a substantial boost to investor sentiment and key parts of the U.S. economy via Chinese cash.
Chart 7
Thus it is reasonable to assess that Trump and Xi can satisfy their political preference for a deal in the short run. If Xi does not gratify Trump’s campaign platform as a great deal-maker, he will give impetus to Trump to form a grand protectionist coalition. Such a coalition could eventually succeed in constricting China’s technological development, as exemplified by the U.S.’s campaign against Chinese telecoms equipment maker Huawei. Fundamentally, China still depends on the West for the computer chips that are essential building blocks for its manufacturing sector (Chart 8).
Chart 8
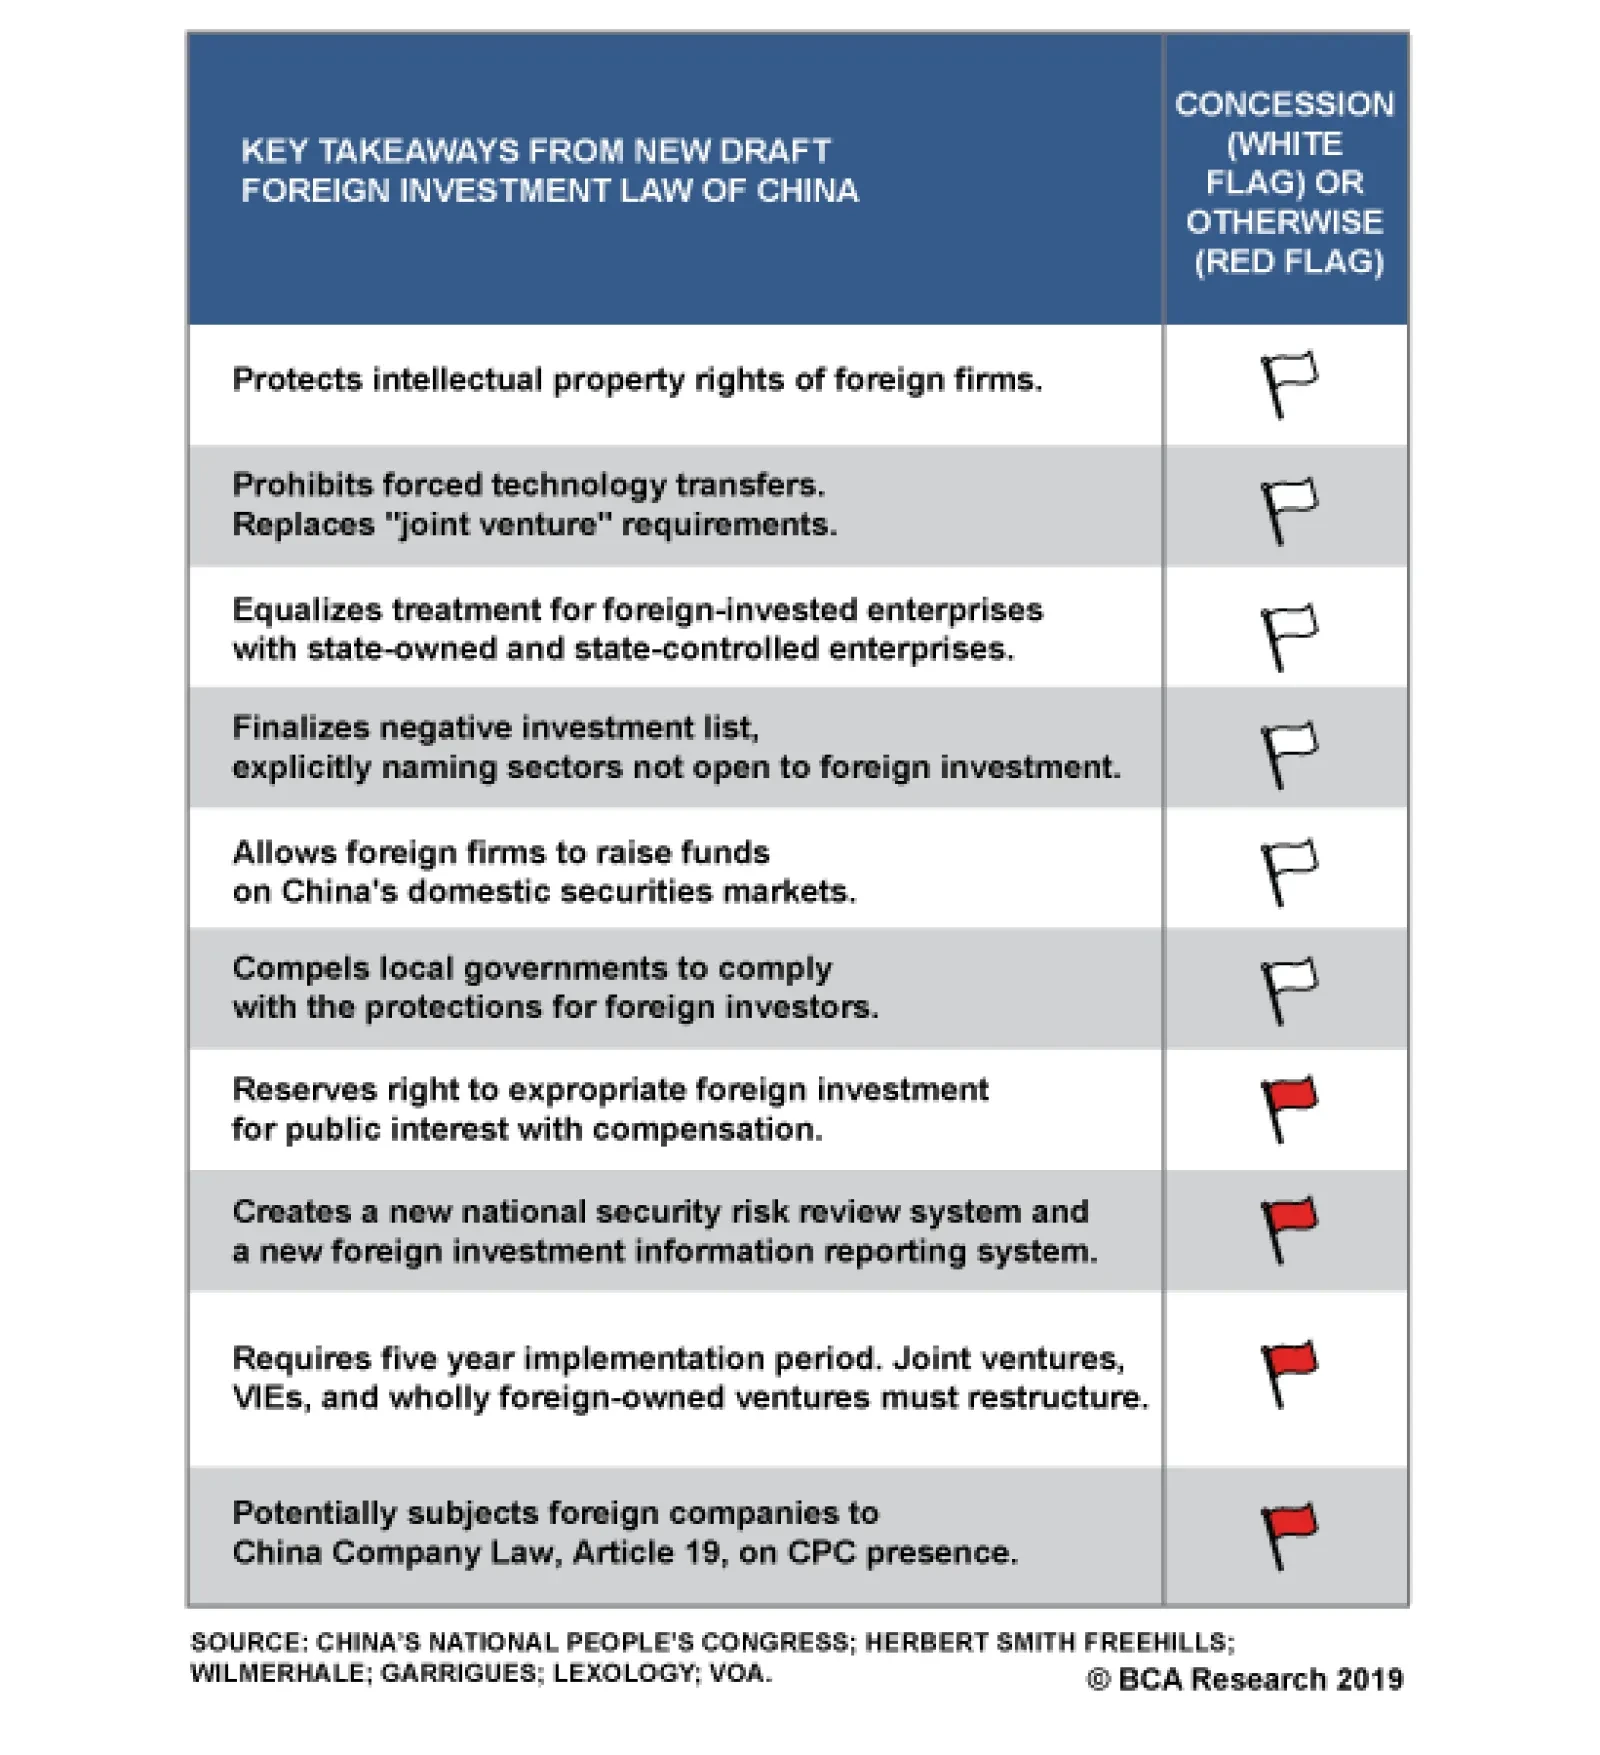
However, while this is a reason for Xi to play ball, it is far from clear that Xi will rapidly implement deep structural changes demanded by the United States. Xi has good reason to fear that Trump will continue the tech war on national security grounds despite any trade deal. Plus, either Trump or a Democratic president could take new punitive trade measures after 2020, given the underlying strategic struggle. For these reasons China is likely to slow-walk any structural concessions. We recognize that our 35% probability that trade talks will be extended cannot last forever. Assuming that Trump and Xi confirm the time and place of a fourth summit, the probability of some kind of deal will rise toward 70%. We doubt very much that Trump and Xi will attend such a summit without a high degree of confidence in the outcome, unlike the Trump-Kim summit in Hanoi, which suffered from inadequate preparation. Yet even if the probability of a deal rises to 70%, we still think there would remain a 30% chance of either an unexpected extension or a disastrous breakdown in negotiations – and we are not yet at that 70% mark. Bottom Line: Until a Trump-Xi summit is finalized in the context of continued progress in trade negotiations, we maintain our pessimistic probabilities for the trade negotiations, with a 30% chance of total collapse and a 35% chance of a further extension of talks beyond March. Remain Vigilant On The Trade Talks It is debatable whether momentum in favor of a U.S.-China trade deal has increased over the past two weeks as much as the news flow suggests. First, Trump’s extension of the tariff deadline – which he originally envisioned as a pause for a month “or less” – could just as easily lead to additional extensions rather than a quick resolution. This will be clear if a Trump-Xi summit does not materialize in late March. A logical time for the two to meet would be at the G20 summit in Osaka, Japan on June 28-29, which would prolong the trade policy uncertainty for nearly four months from today. Second, reports suggest that China, like the EU, is demanding that all Trump’s tariffs be removed as part of any trade deal. If true, this demand is more likely to result in a failure to make a deal than a total tariff rollback. The reason is that the U.S. needs to retain the ability to adjust Section 301 tariffs based on China’s actual degree of implementation of any commitments it makes to reduce forced technology transfers, economic espionage, and intellectual property theft. Several of these commitments are enshrined in the new foreign investment law that would pass through China’s legislature over the next two weeks (Table 2), but the U.S. will want to ensure that the law is actually implemented. Table 2New Foreign Investment Law Would Be A Positive For U.S.-China Negotiations
China-U.S. Trade: A Structural Deal?
China-U.S. Trade: A Structural Deal?
If the U.S. rolls back all Section 301 tariffs it will lose a convenient legal standing from which to dial the tariffs back up if necessary. It is more likely that part or all of the 10% tariff on $200 billion worth of goods will be rolled back (our short-term trade deal scenario with 25% odds) than that the entire Section 301 tariffs will be rolled back (our best-case trade deal scenario with a 10% probability). The degree of rollback will be a critical indicator of the durability of any deal, as it will make a material difference for China’s export-manufacturing outlook (Chart 9). Thus far, China’s economy has counterintuitively benefited from the trade war due to tariff front-running. Chart 9The Degree Of Tariff Rollback Matters
The Degree Of Tariff Rollback Matters
The Degree Of Tariff Rollback Matters
Third, the disagreements between President Trump and his hawkish lead negotiator, U.S. Trade Representative Robert Lighthizer, are likely overstated in their ability to increase the odds of finalizing a deal. There are two arguments for the view that Trump is losing faith in Lighthizer. The first is that he blames Lighthizer’s tough tactics for the equity market selloff. This may not be valid given that stocks continued to sell off after Trump sided with the trade doves and agreed to a trade truce with Xi Jinping. In December the S&P 500 suffered the worst monthly performance since February 2009 and the worst December performance since 1931. The second argument is more substantial and comes from Trump’s public interchange with Lighthizer over the use and value of memorandums of understanding (MOUs). The interchange was awkward and suggests that tensions exist between Trump and his top negotiator.1 However, the episode may have an important implication. Whatever the reason for the disagreement, Lighthizer gained the assent of two Chinese negotiators – Vice Premier Liu He and U.S. ambassador Cui Tiankai – in his declaration, on camera, that the term MOU would be dropped in preference for the term “trade agreement.” The result is that while the deal is still not going to be a “Free Trade Agreement” that requires legislative ratification, the language of the final document will be if anything more, not less, binding. This episode cannot possibly accelerate a final deal. It is hard to believe that Lighthizer is not secretly happy with the result of his dust-up with the president. It is well known – and frequently complained about by Lighthizer and other Trump administration officials – that China has very active diplomacy and makes many international agreements that are more nominal than real in their results. As a simple example, China typically agrees to a larger value of outbound investment than is ultimately realized (Chart 10). In fact, Lighthizer is at the forefront of the administration’s repeated and explicit aim to pin China down to better implementation and enforcement of any agreement. Indeed, in both of Lighthizer’s reports on the Section 301 investigation that motivate the tariffs, he refers to a well-known September 2015 commitment, between President Xi and former U.S. President Barack Obama, not to conduct cyber-espionage against each other’s countries. Lighthizer shares the view of the broader U.S. political establishment that China only temporarily enforced this commitment and later ramped up its hacking to steal trade secrets.2 Chart 10China Known For Overpromising
China Known For Overpromising
China Known For Overpromising
Fourth, Trump’s failure to conclude a peace and denuclearization deal with North Korean leader Kim Jong Un in Hanoi, Vietnam does not increase the odds of a U.S.-China deal – it is either neutral or negative for U.S.-China talks. Whether intentional or not, the summit reminded the Chinese that Trump’s “art of the deal” requires the willingness to walk away from a bad deal. As mentioned, we view the odds of Trump walking away from a China deal at 30%. But the deeper problem is that Trump expects China’s assistance with North Korea as a condition of the trade deal. Whenever Trump thinks that China is not providing enough assistance, he threatens to walk away from talks with Kim. This occurred in May 2018 and has apparently occurred again. The failure of the summit is a failure of U.S.-China diplomacy in the sense that China could not or would not convince Kim Jong Un to offer more concrete steps toward denuclearization. This reflects negatively on the trade talks if it reflects anything at all. Bottom Line: Aside from the presidential momentum behind a trade deal, none of the recent news reports or leaks form a basis for upgrading the probability of a final agreement in late March. Will It Be A “Structural Deal”? Lighthizer is not isolated in driving a hard bargain with China: he enjoys the support of both parties in the U.S. Congress. At his recent testimony on U.S.-China trade to the House Ways and Means Committee, bipartisanship was a key theme. Democrats as well as Republicans voiced support for Lighthizer as the top negotiator due to his strict stance on China’s trade practices, while Lighthizer himself praised both Trump and Democrats such as House Speaker Nancy Pelosi for being skeptical about China’s trade practices as far back as 2001. The takeaway is that Trump needs deep concessions from China – what the top Democrat on the committee called “a structural deal” – in order to defend any trade deal against domestic critics and skeptical voters on the campaign trail in 2020. In other words, there is unanimity in Congress, as there was in May 2018, that Trump should not sacrifice his leverage for a deal limited to Boeings and soybeans but should instead obtain victories on core disagreements: national security, foreign exchange rates, market access, and intellectual property. The MOUs – now “agreements” – that are reportedly being drafted address these core disagreements. Therefore signs of progress in producing final drafts should be seen as evidence that the odds of a final deal are improving: Forced tech transfers: Raising equity caps for foreign investment in key sectors is a headline way to reduce the leverage that Chinese companies have used to extract technology (Table 3). There are other arbitrary licensing and permitting practices that could also be curtailed. Table 3Foreign Investment Equity Caps
China-U.S. Trade: A Structural Deal?
China-U.S. Trade: A Structural Deal?
Intellectual property: China’s purchases of U.S. intellectual property are conspicuously small, especially when considering that China is not yet an innovation giant in terms of international IP licensing receipts relative to the amount that it pays out.3 If the U.S.’s IP trade balance with China were equivalent to its balance with South Korea, it would result in a $36.7 billion improvement in the U.S. balance (Chart 11).
Chart 11
Services: China is a major growing market for U.S. service exports but Washington frequently complains about denial of market access, for instance in financial and legal services. Services exports also underscore the above point about intellectual property (Chart 12).
Chart 12
Foreign exchange: The U.S. is asking China not to maintain a more market-oriented currency but rather to promote a stronger currency relative to the dollar, perhaps referring to the yuan’s undervaluation according to purchasing power parity (Chart 13). It is impossible for Trump to accept a deal that does not include some text on the currency since he has hammered the issue of Chinese currency manipulation on the campaign trail and is trying to talk down the greenback. South Korea agreed to a currency annex and Japan is likely to do the same, and that makes it even less feasible for China to get off the hook. Non-tariff barriers: The U.S. has a long roster of complaints about China’s trade practices, including subsidies to state-owned companies, dumping, and inadequate health, environmental, and labor standards. Changing these practices will raise the costs of production in China. Changes to non-tariff barriers can also increase American market access in a way that goes beyond the simultaneous demands for lower tariffs on U.S. imports (Chart 14). Chart 13China Not Off The Hook On Currency Manipulation
China Not Off The Hook On Currency Manipulation
China Not Off The Hook On Currency Manipulation
Chart 14
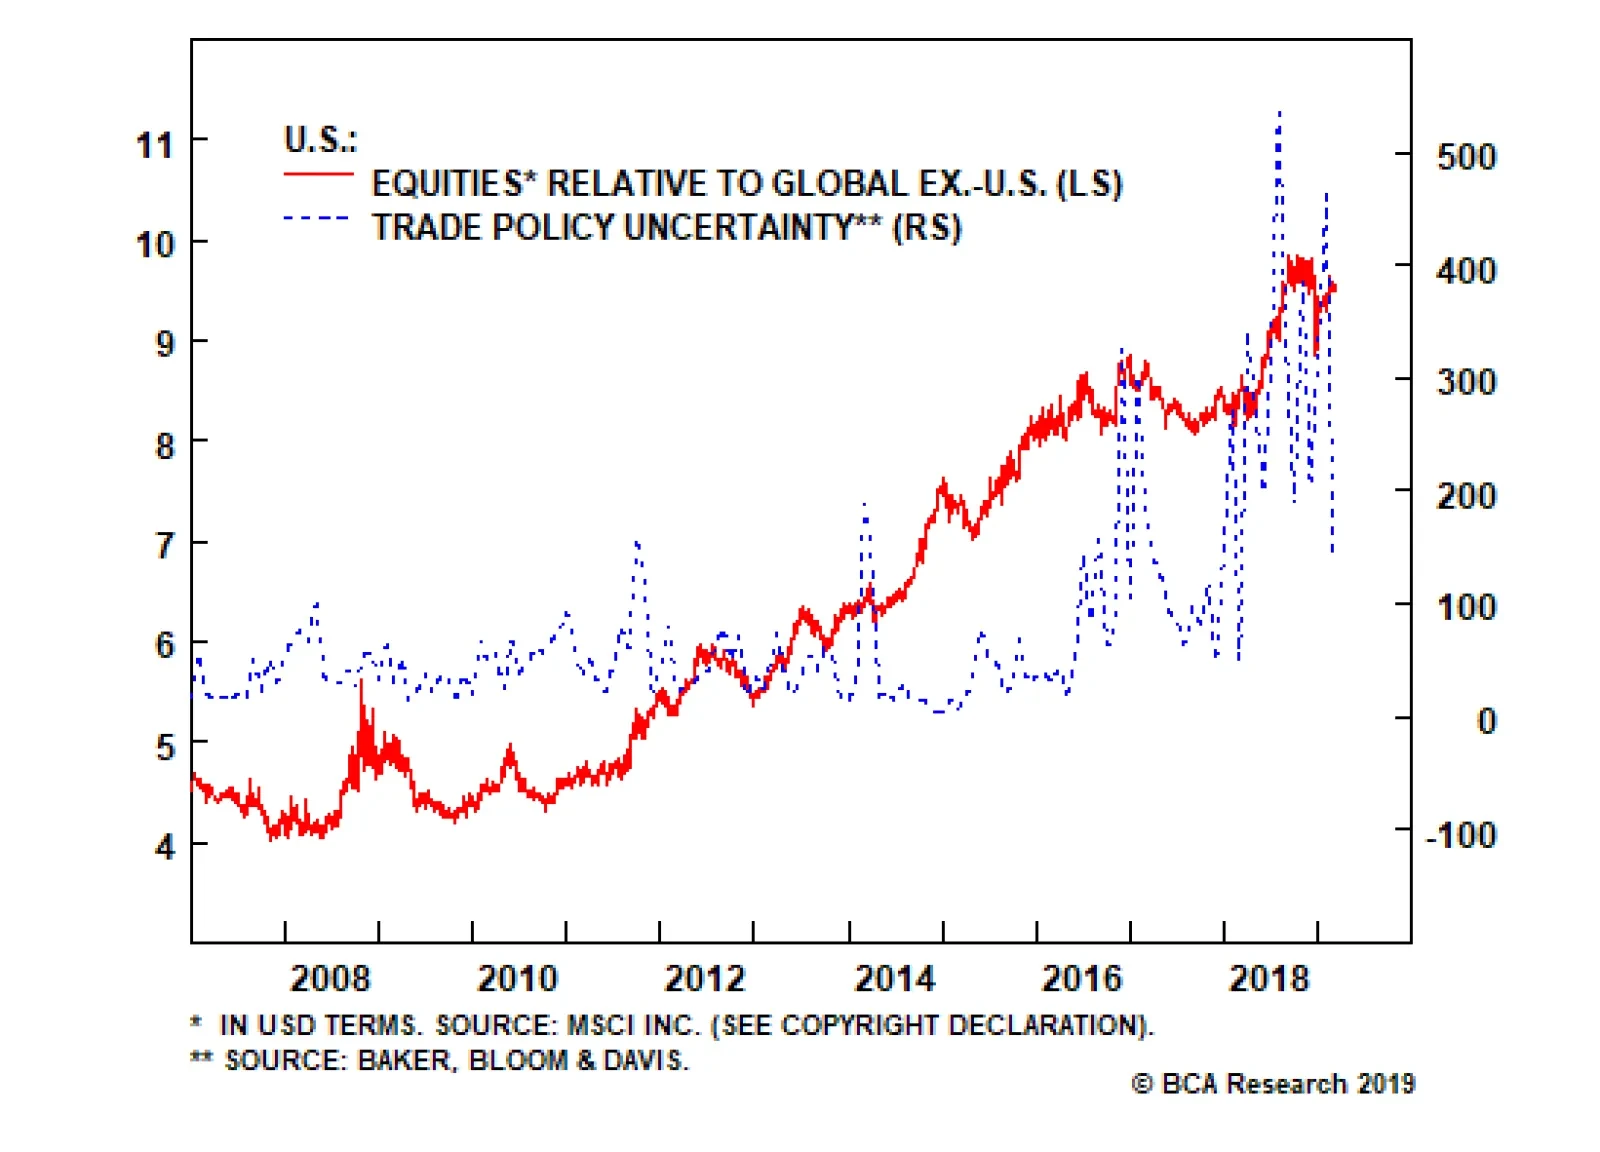
If China pledges improvements on these issues then it could justify substantial tariff rollback, perhaps the entire 10% tariff on $200 billion. This scenario, the best version of our 25% trade deal scenario, would comprise a positive surprise for markets in the current environment. It still could fall short of a grand bargain justifying a total tariff rollback, unless implementation is swift and decisive, which is highly improbable. A lesser but still market-positive surprise would be an American agreement to reduce pressure on Huawei (comparable to the deal reached in May 2018 on that other besieged Chinese tech company, ZTE). Still less positive outcomes would be a partial reduction in the tariff rate or an American agreement to expand or expedite exemptions to existing tariffs. The last would indicate relatively low expectations about the depth of China’s concessions. Bottom Line: Until the actual details of any Chinese structural concessions and American tariff relief are known, the durability of any U.S.-China trade deal cannot be assessed. This warrants at best cautious optimism regarding the trade talks: the two sides are working on draft texts about the right things. Investors will not be positively surprised by an agreement that does not include structural concessions of the nature above as well as substantial American tariff rollback, which is needed to verify American confidence in China’s commitments. Investment Implications The outcomes that are currently available to investors leave substantial room for prolonged trade policy uncertainty (Chart 15). Any further extension of trade talks means that uncertainty will persist at current levels. A deal that includes limited structural concessions means that uncertainty will ease but remain elevated relative to pre-2018 levels, due to the persistent threat of Section 301 tariffs that the U.S. will wield in order to secure Chinese concessions. A failure of negotiations means a dramatic escalation in uncertainty; this is our 30% risk due to the geopolitical and technological struggle underway. We allot only a 10% chance to a grand bargain that includes deep structural reforms and full tariff rollback. Chart 15Trade Uncertainty Will Persist
Trade Uncertainty Will Persist
Trade Uncertainty Will Persist
As a final consideration, investors should be aware that the better the U.S.-China trade deal, the higher the probability that Trump imposes tariffs on auto and auto part imports pursuant to the Section 232 investigation into the impact of these imports on national security, which concluded February 17. The Commerce Department’s recommendations are still unknown but it is not a stretch to imagine that the administration has discovered a national security threat. However, this determination alone does not require Trump to impose tariffs. If he is to impose, he has until May 18 to do so. The full value of U.S. auto and auto parts imports is larger than the value of Chinese imports that currently fall under Trump’s tariffs. It is very unlikely that the U.S. will match this size of tariffs against the EU (Chart 16). Certainly it will not do so if the U.S.-China conflict remains unresolved, since it seems a stretch to believe the equity market can sustain both trade wars at the same time. The Trump administration has already found that the China tariffs without negotiations were disruptive to the U.S. equity market and economy, and the U.S. has told the European Union and Japan that it will not impose tariffs as long as negotiations are underway. To do so would be practically to foreclose the possibility of a trade agreement prior to the 2020 election, at least in the case of the EU.
Chart 16
Thus it is only after any U.S.-China deal that the risk of EU impositions rises. We take the view that Japan is likely to conclude an agreement with the Trump administration quickly, possibly even before the China deal but almost certainly shortly afterwards. Trump administration officials will also likely intervene on behalf of South Korea due to the strategic need to stay on the same page regarding North Korea, which itself led to the successful renegotiation of the two countries’ existing trade agreement last year (which included autos but did not explicitly exempt Korea from Section 232 auto tariffs). This leaves the EU, which is quarreling with the U.S. over a range of issues: trade, Iran, Russia, China, Brexit, Syria, etc. Our base case is that the U.S. will not impose sweeping Section 232 tariffs on the EU due to the negative impact this would have on the U.S. auto industry, which is rooted in the electorally critical Midwest; the aforementioned risk to the equity market and economy; and the fact that neither the U.S. public, nor Congress, nor the corporate lobby are supportive of a trade war with Europe. Tariffs would also harm the Trump administration’s broader attempt to galvanize Western countries against the strategic challenge of China, Russia, and Iran. Nevertheless, the risk of such sweeping tariffs is non-trivial because Trump does not face legal constraints in imposing them – he can act unilaterally, just as he did with the early Section 232 tariffs on steel and aluminum, which broadly remain in force. A negative trade shock to the EU at a time of economic weakness may not overwhelm the positive trade impact of a U.S.-China deal in the context of China’s policy stimulus, but it would take the shine off of any risk-on exuberance following a China deal. In the end, China’s risk assets are likely to continue benefiting from domestic policy stimulus plus the 70% likelihood that tariffs will not go up. BCA’s Geopolitical Strategy remains cyclically positive Chinese stocks relative to emerging market stocks over a 12-month horizon given China’s more robust stimulus measures and the above trade view. We are shifting our long China Play Index to a trade as opposed to a portfolio hedge. We are also long copper. We would anticipate that the trend for CNY-USD will be flat to up as long as negotiations proceed in a positive manner. BCA’s China Investment Strategy is tactically positive Chinese stocks relative to the global MSCI benchmark on the same basis, but is awaiting more evidence of a stabilization in the earnings outlook before recommending that investors shift to an outright overweight over the cyclical horizon. Still, our China team placed Chinese stocks on upgrade watch in their February 27 Weekly Report, signaling that the next change in recommended allocation is likely to be higher rather than lower.4 Matt Gertken, Vice President Geopolitical Strategy mattg@bcaresearch.com Footnote 1 News reports had indicated that Lighthizer and his Chinese counterparts were negotiating six MOUs – on forced tech transfer and cyber theft, intellectual property rights, services, currency, agriculture, and non-tariff barriers to trade – in pursuit of the March 1 deadline. When asked about the time horizon of the MOUs at a public press conference with the Chinese trade delegation in the White House, President Trump said that MOUs were not the same as a “final, binding contract” that he wanted as an outcome of the talks. Lighthizer spoke up in defense of MOUs, leading the president to publicly disagree with him. Lighthizer then declared that the term “MOU” would no longer be used and instead the two sides would use the term “trade agreement.” 2 This was the same summit at which Xi Jinping declared in the Rose Garden that China had no intention to militarize the South China Sea – an even more frequently cited example of divergence between China’s official rhetoric and policy actions on matters of strategic consequence. 3 Please see Scott Kennedy, “The Fat Tech Dragon: Benchmarking China’s Innovation Drive,” CSIS, August 2017, available at www.csis.org. 4 Please see China Investment Strategy Weekly Report “Dealing With A (Largely) False Narrative,” dated February 27, 2019, available at cis.bcaresearch.com.
Feature Recommendations
Monthly Portfolio Update
Monthly Portfolio Update
Two Key Questions For Asset Allocators Stocks have rallied this year – MSCI ACWI is up 17% from its late December low – despite the fact that economic growth outside the U.S. has continued to deteriorate. The PMI in Germany has fallen to 47.6, in Japan to 48.5, and the average in Emerging Markets to 49.5 (Chart 1). Chart 1PMIs Ex-U.S. Still Falling
PMIs Ex-U.S. Still Falling
PMIs Ex-U.S. Still Falling
U.S. growth remains robust, though recent data have showed some signs of weakness. The Citigroup Economic Surprise Index has fallen sharply, capex indicators have slipped, and December retail sales were terrible (Chart 2). The New York Fed NowCast for Q1 is now pointing at only 1.2% real GDP growth. Most of the slippage, however, was caused by the six-week government shutdown, and should be reversed in Q2. And the retail sales number appears “rogue”, perhaps caused by irregular data-collection methods during the shutdown, since other retail data do not support it (Chart 2, panel 3). The tightening of financial conditions in the last months of 2018 – which has now partly reversed – may have added to the slowdown (Chart 3). BCA’s view is that U.S. GDP growth is likely to come in well above 2% in 2019, slower than last year’s 2.9% but still above trend. Chart 2Should We Worry About U.S. Growth Too?
Should We Worry About U.S. Growth Too?
Should We Worry About U.S. Growth Too?
Chart 3Financial Conditions Now Easing
Financial Conditions Now Easing
Financial Conditions Now Easing
Our recommendation, therefore, is to continue to overweight equities (particularly U.S. equities), which should be supported by decent earnings growth (our top-down model points to 12% EPS growth for the S&P500 this year, compared to a bottom-up consensus forecast of only 5%), reasonable valuations, and sentiment that appears still to be damaged by the Q4 sell-off (Chart 4). Chart 4Environment Still Positive For U.S. Equities
Environment Still Positive For U.S. Equities
Environment Still Positive For U.S. Equities
Two key questions will determine which asset allocation will be optimal this year. First, how long will the Fed stay “patient” and keep rates on hold? The futures market has almost completely priced out the possibility of any rate hikes in 2019, and even assigns a 15% probability of a cut (Chart 5). We still see upside risk to inflation, with core PCE likely to print above the Fed’s target of 2% by mid-year, partly because of the year-on-year base effect (in January 2018, monthly inflation was especially high), but also because underlying inflation pressures remain (Chart 6). Chart 5Is The Fed Really Going To Cut Rates?
Is The Fed Really Going To Cut Rates?
Is The Fed Really Going To Cut Rates?
Chart 6Inflation Pressures Haven't Gone Away
Inflation Pressures Haven't Gone Away
Inflation Pressures Haven't Gone Away
The market has misunderstood two of the Fed’s recent messages. Its mooted plan to end balance-sheet reduction by year-end is not intended as part of monetary policy. It is simply that bank excess reserves will have reached USD1-1.2 trillion, the level required to operate monetary policy using current tools, rather than those used before 2007 when reserves were zero (Chart 7). Second, recent discussions about changing the Fed’s inflation target from 2% a year to a price-level target will probably become effective only when the effective lower bound is hit in the next recession and, anyway, no decision will be taken until mid-2020. Chart 7Excess Reserves Will Be At Equilibrium Soon
Excess Reserves Will Be At Equilibrium Soon
Excess Reserves Will Be At Equilibrium Soon
The market has taken this talk as dovish. We read recent comments by Fed Chairman Jay Powell to mean that if, by June, the economy is robust, risk assets are still rebounding, and inflation is ticking up, the Fed will continue to hike, maybe two or three times by year-end. This implies long-term bond yields will rise too. Equities may wobble initially but, as long as the Fed is hiking because growth is solid and not because of an inflation scare, this should not undermine the 12-month case for equity outperformance. The second key question is whether China has now abandoned its focus on deleveraging and switched to a 2016-style liquidity-driven stimulus. Certainly, the January total social financing number pointed in that direction, with new credit creation of almost 5 trillion RMB ($750 billion) and the first signs of an easing of restrictions on shadow banking (Chart 8). But the jury is still out on whether this is the massive reflation the market has been waiting for. Premier Li Keqiang criticized the increase, saying, “the increase in total social financing appears rather large…it may also bring new potential risks”. A PBOC official commented that the big increase was “due to seasonal factors” and emphasized that China was not embarking on “flood irrigation-style” stimulus. The recent more positive noises on the U.S./China trade war may also alleviate the pressure on China to stimulate. Chart 8First Signs Of Chinese Reflation?
First Signs Of Chinese Reflation?
First Signs Of Chinese Reflation?
If and when Chinese growth does rebound, this will have major implications for asset allocation. It would signal a bottoming of the global cycle, which would favor stocks in Emerging Markets, Europe and Japan. It would push up commodity prices, and imply a weaker dollar. For now, we are not positioning ourselves like this, since global growth remains weak. Nonetheless, the first signs of a bottoming are appearing with, for example, the diffusion index of the global Leading Economic Index (which often leads the LEI itself) turning up (Chart 9). We may shift in this direction mid-year, and are now making some minor changes to our recommendations (see below) to hedge against this risk. But for the moment we prefer U.S. equities, expect further USD appreciation, and remain cautious on EM. Chart 9Is The LEI Close To Bottoming?
Is The LEI Close To Bottoming?
Is The LEI Close To Bottoming?
Equities: We prefer U.S. equities given their better growth, reasonable valuations, and depressed sentiment (despite their outperformance year-to-date). But we are watching for an opportunity to increase our weighting in Europe, where growth still looks poor but may rebound in H2 due to fiscal stimulus, improving wage growth, a dovish turn by the ECB, and an eventual recovery in exports to China (Chart 10). We still see problems in EM, since earnings growth expectations need to be revised down further and stock prices have risen prematurely on expectations of a Chinese recovery (Chart 11). But we reduce the size of our underweight bet, to hedge against Chinese credit growth continuing to accelerate. We are also raising our recommendation for the industrials sector (with its large weight in capital goods companies dependent on exports to China) to overweight for the same reason. We fund this by cutting consumer staples to underweight. We also raise our weighting on the energy sector, given our positive view on oil prices (see below). This gives our sector weightings a slightly more cyclical tilt, in line with our macro view. Chart 10Some Good News In Europe Too
Some Good News In Europe Too
Some Good News In Europe Too
Chart 11EM Has Further Downside
EM Has Further Downside
EM Has Further Downside
Fixed Income: It has been a conundrum this year why equities have risen and credit spreads tightened significantly, but the 10-year Treasury yield remains stuck below 2.7%. One explanation is that inflation expectations have been dampened by the crude oil price and if, as we forecast, oil continues to recover, the inflation component of the yield will rise (Chart 12). U.S. yields have also been dragged down by weak growth in other developed markets, where bond yields have therefore fallen. The spread between U.S. and German and Japanese yields reached record high levels in late 2018 (Chart 13). The term premium also is deeply into negative territory because many investors remain highly bearish and have hedged this view by buying Treasuries. If our view of robust U.S. growth, rising inflation, and more Fed hikes is correct, we would see 10-year Treasury yields rising towards 3.5% over the next 12 months. Accordingly, we are underweight global government bonds. We raised credit to neutral last month, but continue to have some qualms about this asset class, and prefer equities as a way of taking exposure to further upside for risk assets. Besides high leverage among U.S. corporates, we are worried about the deterioration in the quality of the credit market, since duration has been extended, covenants weakened, and the average credit rating fallen (Chart 14). Chart 12Inflation Expectations Driven By Oil
Inflation Expectations Driven By Oil
Inflation Expectations Driven By Oil
Chart 13U.S. Yields Pulled Down By Europe And Japan
U.S. Yields Pulled Down By Europe And Japan
U.S. Yields Pulled Down By Europe And Japan
Chart 14Deterioration In Credit Market Fundamentals
Deterioration In Credit Market Fundamentals
Deterioration In Credit Market Fundamentals
Currencies: We see some more upside in the U.S. dollar over the next few months, given U.S. growth and monetary policy relative to the euro area and Japan (Chart 15). This may reverse, however, if global cyclical growth rebounds in the second half. The dollar is particularly vulnerable if macro conditions change, since it looks around 10% overvalued relative to other major DM currencies, and speculative positions are predominantly long dollar (Chart 16). Chart 15Relative Rates Support USD
Relative Rates Support USD
Relative Rates Support USD
Chart 16But Dollar Vulnerable To Macro Shifts
But Dollar Vulnerable To Macro Shifts
But Dollar Vulnerable To Macro Shifts
Commodities: With demand likely to grow steadily this year, but supply under pressure because of production cuts by OPEC and Canada, lower U.S. shale oil output, and disruptions in Venezuela and elsewhere, our energy strategists see drawdowns in inventories throughout the year (Chart 17). They forecast Brent to average $75 a barrel during 2019 (compared to $66 now), with WTI $5 a barrel lower. Industrial commodities continue to be driven by China which means, given our view expressed above, that we may see further weakness short-term, with a possible rebound in H2 (Chart 18). Chart 17Oil Supply/Demand Is Tight
Oil Supply/Demand Is Tight
Oil Supply/Demand Is Tight
Chart 18When Will Metal Prices Bottom?
Chinese Slowdown Will Weigh On Metal Prices
Chinese Slowdown Will Weigh On Metal Prices
Garry Evans Chief Global Asset Allocation Strategist garry@bcaresearch.com GAA Asset Allocation