China

Highlights Global growth is still slowing. Having rallied since the start of the year, global stocks will likely enter a “dead zone” over the next six-to-eight weeks as investors nervously await the proverbial green shoots to sprout. We think they will appear in the second quarter, setting the scene for a reacceleration in global growth in the second half of the year, and an accompanying rally in global risk assets. Investors should overweight stocks and spread product while underweighting safe government bonds over a 12-month horizon. The U.S. dollar will strengthen a bit over the next few months, but should start to weaken in the summer as the global economy catches fire. Stronger global growth and a weaker dollar in the back half of the year will benefit EM assets and European stocks. Feature I skate to where the puck is going to be, not to where it has been. — Wayne Gretzky How To Be A Good Macro Strategist To paraphrase Gretzky, a mediocre macro strategist draws conclusions based solely on incoming data. A good macro strategist, in contrast, tries to figure out where the data is heading. How can one predict how the economic data will evolve? Examining forward-looking indicators is helpful, but it is not enough. One also has to understand why the data is evolving the way it is. If one knows this, one can then assess whether the forces either hurting or helping growth will diminish, intensify, or remain the same. What Accounts For the Growth Slowdown? There is little mystery as to why global growth slowed in 2018. Chinese credit growth fell steadily over the course of the year, which generated a negative credit impulse. Unlike in the past, China is now the most important driver of global credit flows (Chart 1). Chart 1Global Credit Flows Are Increasingly Driven By China
Global Credit Flows Are Increasingly Driven By China
Global Credit Flows Are Increasingly Driven By China
Meanwhile, the global economy was rocked by rising oil prices. Brent rose from $55/bbl on October 5, 2017 to $85/bbl on October 4, 2018. Government bond yields also increased, with the 10-year U.S. Treasury yield rising from 2.05% on September 7, 2017 to 3.23% on October 5, 2018 (Chart 2). Chart 2Rising Oil Prices And Bond Yields Contributed To Slower Global Growth Last Year
Rising Oil Prices And Bond Yields Contributed To Slower Global Growth Last Year
Rising Oil Prices And Bond Yields Contributed To Slower Global Growth Last Year
A mediocre macro strategist draws conclusions based solely on incoming data. A good macro strategist, in contrast, tries to figure out where the data is heading. In an ironic twist, Jay Powell’s ill-timed comment that rates were “a long way” from neutral marked the peak in bond yields. Unfortunately, the subsequent decline in yields was accompanied by a vicious stock market correction and a widening in credit spreads. This led to an overall tightening in financial conditions, which further hurt growth (Chart 3). Chart 3Financial Conditions Tightened In 2018, Especially After Powell's Hawkish Comments
Financial Conditions Tightened In 2018, Especially After Powell's Hawkish Comments
Financial Conditions Tightened In 2018, Especially After Powell's Hawkish Comments
The critical point is that all of these negative forces are behind us: Financial conditions have eased significantly over the past two months; oil prices have rebounded, but are still well below their 2018 highs; and as we explain later on, Chinese growth is likely to bottom by the middle of this year. This means that global growth should start to improve over the coming months. The United States: Better News Ahead The latest U.S. economic data has been weak, with this morning’s disappointing ISM manufacturing print being the latest example. The New York Fed’s GDP Nowcast is pointing to annualized growth of 0.9% in the first quarter. While there is no doubt that underlying growth has decelerated, data distortions have probably also contributed to the perceived slowdown. For instance, the dismal December retail sales report reduced the base for consumer spending going into 2019, thus shaving about 0.4 percentage points off Q1 growth. The drop in real personal consumption expenditures (PCE) cut the New York Fed’s Q1 growth estimate by a further 0.15 percentage points. We suspect that much of the weakness in December retail sales and PCE was linked to the government shutdown. The closure caused some of the surveys used to compile these reports to be postponed until January, which is historically the weakest month for retail sales. The Johnson Redbook Index – which covers 80% of the retail sales surveyed by the Department of Commerce – as well as the sales figures from Amazon and Walmart all point to strong spending during the holiday season (Chart 4). Chart 4The December U.S. Retail Sales Report Was Probably A Fluke
The December U.S. Retail Sales Report Was Probably A Fluke
The December U.S. Retail Sales Report Was Probably A Fluke
Fundamentally, U.S. consumers are in good shape (Chart 5). As a share of disposable income, household debt is over 30 percentage points lower than it was in 2007. The savings rate stands at an elevated level, which gives households the wherewithal to increase spending. Job openings hit another record high, while wage growth continues to trend upwards. Fundamentally, U.S. consumers are in good shape. Chart 5U.S. Consumer Fundamentals Are Solid
U.S. Consumer Fundamentals Are Solid
U.S. Consumer Fundamentals Are Solid
The housing market should improve. Rising mortgage rates weighed on housing last year. However, rates have been declining for several months now, which augurs well for home sales and construction over the next six months (Chart 6). Chart 6Mortgage Rates Will Not Be A Headwind For U.S. Housing Activity Over The Next 6 Months
Mortgage Rates Will Not Be A Headwind For U.S. Housing Activity Over The Next 6 Months
Mortgage Rates Will Not Be A Headwind For U.S. Housing Activity Over The Next 6 Months
While capex intention surveys have come off their highs, they still point to reasonably solid expansion plans (Chart 7). Rising labor costs and high levels of capacity utilization will induce firms to invest in more capital equipment, which should support business spending. Chart 7U.S. Capex Plans Have Come Off Their Highs, But Remain Solid
U.S. Capex Plans Have Come Off Their Highs, But Remain Solid
U.S. Capex Plans Have Come Off Their Highs, But Remain Solid
Government expenditures should also recover. By most estimates, the shutdown shaved one percentage point from Q1 growth. This is likely to be completely reversed in the second quarter. The End Of The Chinese Deleveraging Campaign? The popular narrative about weaker Chinese growth has focused on the trade war. While trade uncertainty undoubtedly hurt growth last year – and has continued to weigh on growth so far this year – most of the weakness in the Chinese economy can be traced to the deleveraging campaign which started in 2017, long before the surge in trade flow angst. Fixed investment spending in China is generally financed through credit markets. Chart 8 shows that the contribution of investment spending to GDP growth has declined in tandem with decelerating credit growth. Most of the weakness in the Chinese economy can be traced to the deleveraging campaign which started in 2017, long before the surge in trade flow angst. Chart 8China: Deleveraging Means Less Investment-Led Growth
China: Deleveraging Means Less Investment-Led Growth
China: Deleveraging Means Less Investment-Led Growth
Chinese credit growth has typically reaccelerated whenever it has dipped towards trend nominal GDP growth. We may have already reached this point (Chart 9). New credit formation came in well above expectations in January. Given possible distortions caused by the timing of the Chinese lunar new year, investors should wait until the February data is released in mid-March before drawing any firm conclusions. Nevertheless, it is starting to look increasingly likely that credit growth has bottomed. The 6-month credit impulse has already surged (Chart 10). The 12-month impulse should also begin moving up provided that month-over-month credit growth simply maintains its recent trend (Chart 11). Chart 9Historically, China Has Scaled Back On Deleveraging When Credit Growth Has Fallen Close To Nominal GDP Growth
Historically, China Has Scaled Back On Deleveraging When Credit Growth Has Fallen Close To Nominal GDP Growth
Historically, China Has Scaled Back On Deleveraging When Credit Growth Has Fallen Close To Nominal GDP Growth
Chart 10A Rebound In The Chinese 6-Month Credit Impulse
A Rebound In The Chinese 6-Month Credit Impulse
A Rebound In The Chinese 6-Month Credit Impulse
Chart 11The 12-Month Impulse Is Set To Turn Up
The 12-Month Impulse Is Set To Turn Up
The 12-Month Impulse Is Set To Turn Up
On the trade front, President Trump’s decision to delay the implementation of tariffs on $200 billion in Chinese imports is a step in the right direction. Nevertheless, gauging whether the trade war will continue to de-escalate is extraordinarily difficult. There is no major constituency within the Republican Party campaigning for protectionism. It ultimately boils down to what one man – Trump – wants. Our best guess is that President Trump will try to score a few political points by “declaring victory” – deservedly or not – in his battle with China in order to pivot to more pressing domestic issues such as immigration. However, there can be no assurance of this, which is why China’s leaders are likely to prioritize growth over deleveraging, at least for the time being. They know full well that the only way they can credibly threaten to walk away from the negotiating table is if their economy is humming along. Europe: From Headwinds To Tailwinds? Slower global growth, higher oil prices, and a spike in Italian bonds yields all contributed to the poor performance of the European economy last year. Economic activity was further hampered by a decline in German automobile production following the introduction of more stringent emission standards. The good news is that these headwinds are set to reverse course. Italian bond yields are well off their highs, as are oil prices (Chart 12). German automobile production is recovering (Chart 13). In addition, the European Commission expects the euro area fiscal thrust to reach 0.40% of GDP this year, up from 0.05% of GDP last year (Chart 14). This should add about half a percentage point to growth. Finally, if our expectation that Chinese growth will bottom out by mid-year proves correct, European exports should benefit. If neither the political establishment nor the general public favor Brexit, it will not happen. Chart 12Headwind No More (I): Italian Bond Yields
Headwind No More (I): Italian Bond Yields
Headwind No More (I): Italian Bond Yields
Chart 13Headwind No More (II): German Auto Sector
Headwind No More (II): German Auto Sector
Headwind No More (II): German Auto Sector
Chart 14The Euro Area Will Benefit From A Modest Amount Of Fiscal Easing This Year
The Euro Area Will Benefit From A Modest Amount Of Fiscal Easing This Year
The Euro Area Will Benefit From A Modest Amount Of Fiscal Easing This Year
Brexit still remains a risk, but a receding one. We have consistently argued that the political establishment on both sides of the British channel will not accept anything resembling a hard Brexit. As was the case with the EU treaty referendums involving Denmark and Ireland in the 1990s, the European political elites will insist on a “No fair! Let’s play again! Best two-out-of-three?” do-overs until they get the result they want. Theresa May’s efforts to cobble together a parliamentary majority that precludes a hard Brexit, along with the Labor Party’s increasing willingness to pursue a second vote, is consistent with our thesis. Fortunately for the “remain” side, public opinion is shifting in favor of staying in the EU (Chart 15). Focusing on the minutiae of various timetables, rules, and regulations is largely a waste of time. If neither the political establishment nor the general public favor Brexit, it will not happen. We are short EUR/GBP, a trade recommendation that has gained 5.2% since we initiated it. We continue to see upside for the pound. Chart 15The ''Remain'' Side Would Likely Win Another Referendum
The ''Remain'' Side Would Likely Win Another Referendum
The ''Remain'' Side Would Likely Win Another Referendum
Investment Conclusions Global growth is still slowing. Having rallied since the start of the year, global stocks will likely enter a “dead zone” for the next six-to-eight weeks as investors nervously await the proverbial green shoots to sprout. We think they will appear in the second quarter, setting the scene for a reacceleration in global growth in the second half of the year, and an accompanying rally in global risk assets. The dollar is a countercyclical currency, meaning that it moves in the opposite direction of the global business cycle (Chart 16). The greenback will strengthen a bit over the next few months, but should start to weaken in the summer as the global economy catches fire. Chart 16The Dollar Is A Countercyclical Currency
The Dollar Is A Countercyclical Currency
The Dollar Is A Countercyclical Currency
We sold our put on the EEM ETF for a gain of 104% on Jan 3rd, and are now outright long EM equities. We do not have a strong view on EM versus DM equities at the moment, but expect to shift EM to overweight once we see more confirmatory evidence that Chinese growth is stabilizing. Having rallied since the start of the year, global stocks will likely enter a “dead zone” for the next six-to-eight weeks as investors nervously await the proverbial green shoots to sprout. In conjunction with our expected upgrade on EM assets, we will move European equities to overweight. Stronger global growth will benefit European multinational exporters, while brisker domestic growth should allow the market to price in a few more ECB rate hikes starting in 2020. The latter will lead to a somewhat steeper yield curve which, along with rising demand for credit, should boost financial sector earnings (Chart 17). This will give European bank stocks a welcome boost. Chart 17Stronger Euro Area Credit Growth Will Boost Bank Earnings
Stronger Euro Area Credit Growth Will Boost Bank Earnings
Stronger Euro Area Credit Growth Will Boost Bank Earnings
Japanese equities will also benefit from faster global growth, but domestic demand will suffer from the government’s ill-advised plan to raise the sales tax in October. As such, we do not anticipate upgrading Japanese stocks. We also expect the yen to come under some pressure as the BoJ is forced to maintain its ultra-accommodative monetary policy stance, while bond yields elsewhere move modestly higher. Peter Berezin Chief Global Investment Strategist peterb@bcaresearch.com Strategy & Market Trends* MacroQuant Model And Current Subjective Scores
Chart 18
Tactical Trades Strategic Recommendations Closed Trades
Highlights Global growth is still slowing. Having rallied since the start of the year, global stocks will likely enter a “dead zone” over the next six-to-eight weeks as investors nervously await the proverbial green shoots to sprout. We think they will appear in the second quarter, setting the scene for a reacceleration in global growth in the second half of the year, and an accompanying rally in global risk assets. Investors should overweight stocks and spread product while underweighting safe government bonds over a 12-month horizon. The U.S. dollar will strengthen a bit over the next few months, but should start to weaken in the summer as the global economy catches fire. Stronger global growth and a weaker dollar in the back half of the year will benefit EM assets and European stocks. Feature I skate to where the puck is going to be, not to where it has been. — Wayne Gretzky Gretzky's Doctrine To paraphrase Gretzky, a mediocre macro strategist draws conclusions based solely on incoming data. A good macro strategist, in contrast, tries to figure out where the data is heading. How can one predict how the economic data will evolve? Examining forward-looking indicators is helpful, but it is not enough. One also has to understand why the data is evolving the way it is. If one knows this, one can then assess whether the forces either hurting or helping growth will diminish, intensify, or remain the same. What Accounts For The Growth Slowdown? There is little mystery as to why global growth slowed in 2018. Chinese credit growth fell steadily over the course of the year, which generated a negative credit impulse. Unlike in the past, China is now the most important driver of global credit flows (Chart I-1).
Image
Meanwhile, the global economy was rocked by rising oil prices. Brent rose from $55/bbl on October 5, 2017 to $85/bbl on October 4, 2018. Government bond yields also increased, with the 10-year U.S. Treasury yield rising from 2.05% on September 7, 2017 to 3.23% on October 5, 2018 (Chart I-2).
Image
In an ironic twist, Jay Powell’s ill-timed comment that rates were “a long way” from neutral marked the peak in bond yields. Unfortunately, the subsequent decline in yields was accompanied by a vicious stock market correction and a widening in credit spreads. This led to an overall tightening in financial conditions, which further hurt growth (Chart I-3).
Image
The critical point is that all of these negative forces are behind us: Financial conditions have eased significantly over the past two months; oil prices have rebounded, but are still well below their 2018 highs; and as we explain later on, Chinese growth is likely to bottom by the middle of this year. This means that global growth should start to improve over the coming months. The United States: Better News Ahead The latest U.S. economic data has been weak, with this morning’s disappointing ISM manufacturing print being the latest example. The New York Fed’s GDP Nowcast is pointing to annualized growth of 0.9% in the first quarter. While there is no doubt that underlying growth has decelerated, data distortions have probably also contributed to the perceived slowdown. For instance, the dismal December retail sales report reduced the base for consumer spending going into 2019, thus shaving about 0.4 percentage points off Q1 growth. The drop in real personal consumption expenditures (PCE) cut the New York Fed’s Q1 growth estimate by a further 0.15 percentage points. We suspect that much of the weakness in December retail sales and PCE was linked to the government shutdown. The closure caused some of the surveys used to compile these reports to be postponed until January, which is historically the weakest month for retail sales. The Johnson Redbook Index – which covers 80% of the retail sales surveyed by the Department of Commerce – as well as the sales figures from Amazon and Walmart all point to strong spending during the holiday season (Chart I-4).
Image
Fundamentally, U.S. consumers are in good shape (Chart I-5). As a share of disposable income, household debt is over 30 percentage points lower than it was in 2007. The savings rate stands at an elevated level, which gives households the wherewithal to increase spending. Job openings hit another record high, while wage growth continues to trend upwards.
Image
The housing market should improve. Rising mortgage rates weighed on housing last year. However, rates have been declining for several months now, which augurs well for home sales and construction over the next six months (Chart I-6).
Image
While capex intention surveys have come off their highs, they still point to reasonably solid expansion plans (Chart I-7). Rising labor costs and high levels of capacity utilization will induce firms to invest in more capital equipment, which should support business spending.
Image
Government expenditures should also recover. By most estimates, the shutdown shaved one percentage point from Q1 growth. This is likely to be completely reversed in the second quarter. The End Of The Chinese Deleveraging Campaign? The popular narrative about weaker Chinese growth has focused on the trade war. While trade uncertainty undoubtedly hurt growth last year – and has continued to weigh on growth so far this year – most of the weakness in the Chinese economy can be traced to the deleveraging campaign which started in 2017, long before the surge in trade flow angst. Fixed investment spending in China is generally financed through credit markets. Chart I-8 shows that the contribution of investment spending to GDP growth has declined in tandem with decelerating credit growth.
Image
Chinese credit growth has typically reaccelerated whenever it has dipped towards trend nominal GDP growth. We may have already reached this point (Chart I-9). New credit formation came in well above expectations in January. Given possible distortions caused by the timing of the Chinese lunar new year, investors should wait until the February data is released in mid-March before drawing any firm conclusions. Nevertheless, it is starting to look increasingly likely that credit growth has bottomed. The 6-month credit impulse has already surged (Chart I-10). The 12-month impulse should also begin moving up provided that month-over-month credit growth simply maintains its recent trend (Chart I-11).
Image
Image
Image
On the trade front, President Trump’s decision to delay the implementation of tariffs on $200 billion in Chinese imports is a step in the right direction. Nevertheless, gauging whether the trade war will continue to de-escalate is extraordinarily difficult. There is no major constituency within the Republican Party campaigning for protectionism. It ultimately boils down to what one man – Trump – wants. Our best guess is that President Trump will try to score a few political points by “declaring victory” – deservedly or not – in his battle with China in order to pivot to more pressing domestic issues such as immigration. However, there can be no assurance of this, which is why China’s leaders are likely to prioritize growth over deleveraging, at least for the time being. They know full well that the only way they can credibly threaten to walk away from the negotiating table is if their economy is humming along. Europe: From Headwinds To Tailwinds? Slower global growth, higher oil prices, and a spike in Italian bonds yields all contributed to the poor performance of the European economy last year. Economic activity was further hampered by a decline in German automobile production following the introduction of more stringent emission standards. The good news is that these headwinds are set to reverse course. Italian bond yields are well off their highs, as are oil prices (Chart I-12). German automobile production is recovering (Chart I-13). In addition, the European Commission expects the euro area fiscal thrust to reach 0.40% of GDP this year, up from 0.05% of GDP last year (Chart I-14). This should add about half a percentage point to growth. Finally, if our expectation that Chinese growth will bottom out by mid-year proves correct, European exports should benefit.
Image
Image
Image
Brexit still remains a risk, but a receding one. The political establishment on both sides of the British channel will not accept anything resembling a hard Brexit. As was the case with the EU treaty referendums involving Denmark and Ireland in the 1990s, the European political elites will insist on a “No fair! Let’s play again! Best two-out-of-three?” do-overs until they get the result they want. Theresa May’s efforts to cobble together a parliamentary majority that precludes a hard Brexit, along with the Labor Party’s increasing willingness to pursue a second vote, is consistent with our thesis. Fortunately for the “remain” side, public opinion is shifting in favor of staying in the EU (Chart I-15). Focusing on the minutiae of various timetables, rules, and regulations is largely a waste of time. If neither the political establishment nor the general public favor Brexit, it will not happen.
Image
Investment Conclusions Global growth is still slowing. Having rallied since the start of the year, global stocks will likely enter a “dead zone” for the next six-to-eight weeks as investors nervously await the proverbial green shoots to sprout. We think they will appear in the second quarter, setting the scene for a reacceleration in global growth in the second half of the year, and an accompanying rally in global risk assets. The dollar is a countercyclical currency, meaning that it moves in the opposite direction of the global business cycle (Chart I-16). The greenback will strengthen a bit over the next few months, but should start to weaken in the summer as the global economy catches fire.
Image
We do not have a strong view on EM versus DM equities at the moment, but expect to shift EM to overweight once we see more confirmatory evidence that Chinese growth is stabilizing. In conjunction with our expected upgrade on EM assets, we will move European equities to overweight. Stronger global growth will benefit European multinational exporters, while brisker domestic growth should allow the market to price in a few more ECB rate hikes starting in 2020. The latter will lead to a somewhat steeper yield curve which, along with rising demand for credit, should boost financial sector earnings (Chart I-17). This will give European bank stocks a welcome boost.
Image
Japanese equities will also benefit from faster global growth, but domestic demand will suffer from the government’s ill-advised plan to raise the sales tax in October. As such, we do not anticipate upgrading Japanese stocks. We also expect the yen to come under some pressure as the BoJ is forced to maintain its ultra-accommodative monetary policy stance, while bond yields elsewhere move modestly higher. Peter Berezin Chief Global Investment Strategist March 1, 2019 Next Report: March 28, 2019 II. Troubling Implications Of Global Demographic Trends Developed economies are challenged by two powerful and related demographic trends: declining growth in working-age populations, and a rapidly-aging population structure. Working-age populations are in absolute decline in Japan and much of Europe and growth is slowing sharply in the U.S. An offsetting acceleration in productivity growth is unlikely, implying a marked deceleration in economic growth potential. The combination of slower growth in the number of taxpayers and rising numbers of retirees is toxic for government finances. Future generations face sharply rising debt burdens and increased taxes to pay for entitlements. The correlation between aging and asset prices is inconclusive but common sense suggests it is more likely to be bearish than bullish. Population growth remains rapid throughout most of the developing world, China being a notable exception. It is especially strong in Africa, a region that has historically faced economic mismanagement and thus poor economic prospects for most of its inhabitants. Migration from the emerging to developed world is a logical solution to global demographic trends, but faces a backlash in many countries for both economic and cultural reasons. These tensions are likely to increase. Making accurate economic and market forecasts is daunting because there are so many moving parts and unanticipated events are inevitable. Quantitative models are destined to fail because of the unpredictability of human behavior and random shocks. Demographic forecasts are a lot easier, at least over the short-to-medium term. If you want to know how many 70-year olds there will be in 10 years’ time, then count how many 60-year olds there are today and adjust by the mortality rate for that age group. Demographic trends are very incremental from year to year and their impact is swamped by economic, political and financial events. Thus, it rarely makes sense to blame demographics for cyclical swings in the economy or markets. In some respects, demographics can be likened to glaciers. You will quickly get bored standing by a glacier to watch it move. But, over long time periods, glaciers cover enormous distances and can completely reshape the landscape. Similarly, over the timespan of one or more generations, demographics can have powerful effects on economies and societies. Some important demographic trends have been going on for long enough that their effects are visible. The most common concern about global demographics has tended to be overpopulation and pressure on resources and the environment. And this is hardly new. In 1798, Thomas Malthus published his “Essay on The Principles of Population” in which he argued that population growth would outstrip food supply, leading to a very miserable outcome. Of course, what he missed was the revolution in agricultural techniques that meant food supply kept up with population growth. In 1972, a group of experts calling themselves The Club of Rome published a report titled “The Limits to Growth” which argued that a rising world population would outstrip the supply of natural resources, putting a limit to economic growth. Again, that report underestimated the ability of technology to solve the problem of scarcity, although many still believe the essence of the report has yet to be proved wrong. Phenomena such as climate change and rising numbers of animal species facing extinction are seen as supporting the thesis that the world’s population is putting unsustainable demands on the planet. Rather than get into that debate, this report will focus on three particular big-picture problems associated with demographic trends: Declining working-age populations in most major industrialized economies during the next several decades. Population aging throughout the developed world. Continued rapid population growth in many of the world’s poorest and most troubled countries. According to the UN’s latest projections, the world’s population will increase from around 7.5 billion today to almost 10 billion by 2050.1 The population growth rate peaked in the 1970s and is expected to slow sharply over the next several decades (Chart II-1). Despite slower percentage growth rates, the population keeps going up steadily because one percent of the 1970 global population was about 3.7 million, while one percent of the current population is about 7.5 million.
Image
But here is an important point: virtually all future growth in the global population will come from the developing world (Chart II-2). The population of the developed world is expected to be broadly flat over the period to 2050, and this has some significant economic implications.
Image
Let’s first look at why population growth has stagnated in the developed world. Population growth is a function of three things: the birth rate, the death rate and net migration. Obviously, if there are more births than deaths then there will be a natural increase in the population and net migration will either add or subtract to that. Over time, there have been major changes in some of these drivers. In the developed world, a stable population requires that, on average, there are 2.1 children born for every woman. The fact that it is not exactly 2 accounts for infant mortality and because there are slightly more males than females born. The replacement-level fertility rate needs to be higher than 2.1 in the developing world because of higher infant mortality rates. After WWII, the fertility rate throughout most of the developed world was well above 2.1 as soldiers returned home and the baby boom generation was born. But, by the end of the 1970s, the rate had dropped below the replacement level in most countries and currently is a lowly 1.5 in Japan, Germany and Italy (Table II-1). It has stayed higher in the U.S. but even there it has dipped below the critical 2.1 level. This trend has reflected lot of factors including more widespread use of birth control and more women entering the labor force.
Image
In the developed world, the birth rate is expected to drop below the death rate in the next ten years (Chart II-3). That means there will be a natural decrease in the population. In the case of Japan, Germany, Italy and Portugal that change already occurred between 2005 and 2010. In the U.S., the UN expects birth rates to stay just above death rates in the period to 2050, but the gap narrows sharply. Births exceed deaths throughout most of the developing world meaning that populations continue to grow. Notable exceptions to this are Eastern Europe where populations are already in sharp decline and China, where deaths begin to exceed births in the 2030s.
Image
Although life expectancy is rising, death rates in the developed world will rise simply because the rapidly growing number of old people more than offsets the impact of longer lifespans. Of course, the population of a country can also be boosted by immigration, and that has been true for much of the developed world. In Canada and most of Europe, net migration already is the dominant source of overall population growth and it will become so in the U.S. in the coming decades, based on current trends (Chart II-4).
Image
This is the background to the first key issue addressed in this report: the declining trend in the growth of the working-age population in the developed world. Slowing Growth In Working-Age Populations An economy’s growth potential depends on only two things: the number of people working and their productivity. If the labor force grows at 1% a year and productivity also increases by 1%, then the economy’s trend growth rate is 2%. In the short-run, the economy may grow faster or slower than that, depending on issues like fiscal and monetary policy, oil prices etc. Over the long run, growth is constrained by people and productivity. The potential labor force is generally regarded to be the people aged 15 to 64. The growth trend in this age segment has slowed sharply in recent years in the major economies and is set to weaken further in the years ahead (Chart II-5). The problem is most severe in Japan and Europe where the working-age population is already declining. In the case of the U.S., growth in this age cohort slows from an average 1.5% a year in the 1960s and 1970s to a projected pace of less than 0.5% in the coming decades.
Image
While this generally is not a problem faced by the developing world, a notable exception is China, now reaping the consequences of its one-child policy. Its working-age population is set to decline steadily in the years ahead. Thus, it is inevitable that Chinese growth also will slow in the absence of an acceleration of productivity growth The slowing trend in the working-age population could be offset if we could get more 15-64 year olds to join the labor force, or get more older people to stay working. In the U.S., almost 85% of male 15-64 year olds were either employed or were wanting a job in the mid-1990s. This has since dropped to below 80% - a marked divergence from the trend in most other countries (Chart II-6). And the female participation rate in the U.S. also is below that of other countries.
Image
The reason for the decline in U.S. labor participation rates for prime-aged adults is unclear. Explanations include increased levels of people in full-time education, in prison, or claiming disability. A breakdown of male participation rates by age shows particularly sharp drops in the 15-19 and 20-24 age groups, though the key 20-54 age category also is far below earlier peaks (Chart II-7). The U.S. participation rate has recently picked up but it seems doubtful that it will return to earlier highs.
Image
Other solutions to the problem would be getting more people aged 65 and above to stay in the labor force, and/or faster growth in productivity. The former probably will require changes to the retirement age and we will return to that issue shortly. There always are hopes for faster productivity growth, but recent data have remained disappointing for most developed economies (Chart II-8). New technologies hold out some hope but this is a contentious topic.
Image
On a positive note, the shrinking growth of the working-age population may be easier to live with in a world of robotization and artificial intelligence where machines are expected to take over many jobs. That would support a more optimistic view of productivity but it remains to be seen how powerful the impact will be. Another important problem related to the slowing growth of the working-age population relates to fiscal burdens. In 1980, the level of government debt per taxpayer (ages 20-64) was around $58,000 in the U.S. in today’s money and this is on track for $104,000 by 2020 (Chart II-9). But this pales in comparison to Japan where it rises from $9,000 to $170,000 over the same period. Canada looks more favorable, rising from $23,000 in 1980 to $68,000 in 2020. These burdens will keep rising beyond 2020 until governments start running budget surpluses. Our children and grandchildren will bear the burden of this and won’t thank us for allowing the debt to build up in the first place.
Image
There will be a large transfer of privately-held assets from the baby boomers to the next generation, but the ownership of this wealth is heavily skewed. According to one study, the top 1% owned 40% of U.S. wealth in 2016, while the bottom 90% owned 20%.2 And it seems likely that this pool of wealth will erode over time, providing a smaller cushion to the following generation. This leads in to the next topic – aging populations. Aging Populations In The Developed World The inevitable result of the combination of increased life expectancy and declining birth rates has been a marked aging of populations throughout the developed world. Between 2000 and 2050, the developed world will see the number of those aged 65 and over more than double while the numbers in other age groups are projected to show little change (Chart II-10).
Image
As long as the growing numbers of those aged 65 and above are in decent health, then life is quite good. Fifty years ago in the U.S., poverty rates were very high for those of retirement age compared to the young (i.e. under 18). But that has changed as the baby boomer generation made sure that they voted for increased entitlement programs. Now poverty rates for the 65+ group are far below those of the young (Chart II-11). At the same time, real incomes for those 65 and older have significantly outperformed those of younger age groups.
Image
A major problem is that aging baby boomers are expensive because of the cost of pensions and medical care. As would be expected, health care costs rise dramatically with age. For those aged 44 and under, health care costs in the U.S. averaged around $2,000 per person in 2015. For those 65 and over, it was more than $11,000 per person. And per capita spending doubles between the ages of 70 and 90. So here we have the problem: a growing number of expensive older people supported by a shrinking number of taxpayers. This is illustrated by the ratio of the number of people between 20 and 64 divided by those 65 and older. In other words, the number of taxpayers supporting each retiree (Chart II-12).
Image
In 1980, there were five taxpayers for every retiree in the U.S., four in W. Europe and seven in Japan. These ratios have since dropped sharply, and in the next few decades will be down to 2.5 in the U.S., 1.8 in Europe and 1.3 in Japan. For each young Japanese taxpayer, it will be like having the cost of a retiree deducted from their paycheck. Throughout the developed world, the baby boomers’ children and grandchildren face a growing burden of entitlements. Some of the statistics related to Japan’s demographics are dramatic. In the first half of the 1980s there were more than twice as many births as deaths (Chart II-13). They become equal around ten years ago and in another ten years deaths are projected to exceed births by around three million a year. In 1990, the number of people aged four and under was more than double the number aged 80 and above. Now the situation is reversed with those aged 80 years and above more than double those four and under. That is why sales of adult diapers reportedly exceed those of baby diapers – very depressing!3
Image
What’s the solution to aging populations? An obvious one is for people to retire later. When pension systems were set up, life expectancy at birth was below the age pensions were granted - typically around 65. In other words, not many people were expected to live long enough to get a government pension. And the lucky ones who did live long enough were not expected to be around to receive a pension for more than a few years. By 1950, those males who had reached the age of 65 were expected, on average, to live another 11 to 13 years in the major developed countries (Table II-2). This rose to 16-18 years by 2000 and is expected to reach 22-23 years by 2050. Governments have made a huge error in failing to raise the retirement age as life expectancy increased. Pension systems were never designed to allow people to receive government pensions for more than 20 years.
Image
Some countries have raised the retirement age for pensions, but progress on this front is painfully slow. Other solutions would be to raise pension contributions or to means-test benefits. Not surprisingly, governments are reluctant to take such unpopular actions. At some point, they will have no choice, but that awaits pressures from the financial markets. Currently, not many people aged over 65 remain in the workforce. The participation rate for men is less than 10% in Europe and less than 25% in the U.S. And it is a lot lower for women (Chart II-14). The rate in Japan is much higher reflecting the fact that it is at the leading edge of aging. Participation rates are moving higher in Europe and the U.S. and further increases are likely in the years ahead if Japan’s experience is anything to go by.
Image
Having people staying in the workforce for longer will help offset the decline in prime-age workers, but there is a downside. While it is a contentious topic, many studies point to a negative correlation between age and productivity after the age of 50. As we age, there is some decline in cognitive abilities and older people may be less willing or able to adapt to new technologies and working practices. These would only be partly offset by the benefits of experience that comes with age. Therefore, an aging workforce is not one where one would expect productivity growth to accelerate, other things being equal. An IMF study concluded that a 1% increase in the labor force share of the 55-64 age cohort in Europe could reduce the growth in total factor productivity by 0.2% a year over the next 20 years.4 Another study published by the NBER paper estimated that aging will reduce the U.S. economic growth rate by 1.2% a year this decade and 0.6% a year next decade.5 Other studies are less gloomy but it would be hard to argue that aging is actually good for productivity. Another aging-related issue is the implications for asset prices. It is generally believed that aging will be bad for asset prices as people move from their high-saving years to a period where they will be liquidating assets to supplement their incomes. This is supported by a loose correlation between the percentage of the labor force between 35 and 64 (the higher-saving years) and stock market capitalization as a percent of GDP (Chart II-15). However, other studies cast doubts on this relationship.6
Image
One might think real estate is even more vulnerable than stocks to aging. However, in late 1988, two high-profile economists (Greg Mankiw and David Weil) published a report arguing that real house prices would fall substantially over the next two decades as the baby boom generation aged.7 That forecast was catastrophically wrong. Of course, that does not mean that the more dramatic aging occurring over the next couple of decades will not have a major negative impact on home prices. Numerous studies have been carried out on the relationship between demographics and asset prices and the conclusions are all over the place.8 Time and space constraints prevent a more in-depth discussion of this topic. Nonetheless, common sense would suggest that aging is more likely to be bearish than bullish for asset prices. Thus far, we have addressed two demographic challenges facing the developed world: slowing growth in the number of working-age people and a marked aging of the population. Much of the developing world has the opposite issue: continued rapid population growth and large numbers of young people. This is my third topic. Rapid Population Growth In The Developing World We already noted that nearly all future growth in global population will occur in the developing world, China being a notable exception. With birth rates remaining far above death rates, emerging countries will not have the aging problem of the developed world and this has some positives and negatives. On the positive side, a rapidly-growing young population creates the potential for strong economic growth – the opposite of the situation in advanced economies. But this assumes that the institutional and political framework is conducive to growth. Unfortunately, the history of many developing countries is that corrupt and incompetent governments prevent economies from ever reaching their potential. This means there will be a growing pool of young people likely facing a dim economic future. In some cases, these young people could be an excellent recruiting ground for extremist groups. It is unfortunate that there is particularly rapid population growth in some of the most troubled countries in the world. The Institute for Economics and Peace ranks countries by whether they are safe or dangerous.9 According to their ranking, the eight most dangerous countries in the world will see their population grow at a much faster pace than the developing world as a whole (Chart II-16).
Image
Some individual country comparisons are striking. The UN’s projections show that Nigeria’s population will exceed that of the U.S. by 2050, The Democratic Republic of Congo’s population will match that of Japan by 2030 and by 2050 will be 80% larger (Chart II-17A and B). Similarly, Afghanistan will overtake Italy in the 2040s. Most incredibly, Africa’s overall population surpassed that of the whole of Europe in the second half of the 1990s and is projected to be 3.5 times larger by 2050. That suggests that the numbers seeking to migrate from Africa to Europe will increase dramatically in the next couple of decades. Controlling these flows will become an increasing challenge for countries in Southern Europe.
Image
Image
Migration is the logical solution to declining working-age populations in the developed world and expanding young populations in the developing world. However, there currently is a backlash against immigration in many developed countries. Anti-immigration political parties are gaining strength in many European countries and immigration was a major factor influencing the Brexit vote in the U.K. And it is a hot-button political issue in the U.S. Concerns about immigration are twofold: competition for employment and potential cultural change. Employment fears have coincided with a long period of severely depressed wages for low-skill workers in many developed economies and immigration is an easy target for blame. Meanwhile, the cultural challenge of absorbing large numbers of immigrants clearly has fueled increased nationalist sentiment in a number of countries. In the U.S., projections by the Bureau of the Census show that the non-Hispanic white population will fall below 50% of the total by 2045. That has implications for voting patterns and lies behind some of the concerns about high levels of immigration. There is no simple solution to this controversial issue and an in-depth discussion is beyond the scope of this article. Conclusions We have only touched on some aspects of demographic trends. It is a huge topic and has many other implications. For example, the political and cultural views of each generation are shaped by the environment they grow up in and this changes over time. This year, the number of millennials (those born from the early 1980s to the mid-1990s) in the U.S. is expected to surpass those of baby boomers and that will have important political and social implications. Again, that is beyond the scope of this report. The demographic trends we have discussed will pose serious challenges to policymakers. In the developed world, the baby boom generation has accumulated huge amounts of government debt, partly to fund generous entitlement programs and did not have enough children to ease the burdens on future generations. The young have good reason to feel frustrated by the actions of their elders (see cartoon).
Image
In the developing world, the challenge will be to provide economic opportunities for a growing pool of young people. The biggest problems will be in Africa, a continent where economic success stories have been few and far between in the past. Failure to deal with this will have troubling implications for geopolitical stability. Martin H. Barnes Senior Vice President Economic Advisor III. Indicators And Reference Charts Our tactical equity upgrade is beginning to pay off, and an increasing proportion of our proprietary indicators is confirming that stocks have more upside over the next few quarters. Our Willingness-to-Pay (WTP) indicator for the U.S. has stopped falling. This pattern is also evident in both Europe and Japan. The WTP indicators track flows, and thus provide information on what investors are actually doing, as opposed to sentiment indexes that track how investors are feeling. After clearly pulling funds out of the equity markets, investors are beginning to tip their toes back in. Our Revealed Preference Indicator (RPI) has clearly shifted back into stocks. The RPI combines the idea of market momentum with valuation and policy measures. It provides a powerful bullish signal if positive market momentum lines up with constructive signals from the policy and valuation measures. Conversely, if constructive market momentum is not supported by valuation and policy, investors should lean against the market trend. According to BCA’s composite valuation indicator, the U.S. stock market remains overvalued from a long-term perspective, despite the dip in multiples since last fall. It is a composite of 11 different valuation measures. Moreover, our Monetary Indicator has shifted out of negative territory for stocks, and is now decisively in stimulative territory. The Fed pause, along with some dovish-sounding commentaries have improved the monetary backdrop by removing expected rate hikes from the money market curve. Our Composite Technical indicator for stocks broke down in December, providing a clear ‘sell’ signal, and has not yet delivered a ‘buy’. However, if the recent improvement in this indicator can continue, the S&P 500 will likely be able to punch above the 2800 level. The 10-year Treasury yield is in the neutral range according to our valuation model. Bonds are not overbought, but they have now fully worked out their previously deeply-oversold conditions. The Adrian, Crump & Moench formulation of the 10-year term premium remains close to its 2016 nadir, suggesting that yields are unsustainably low. Our bond-bearish bias is consistent with the view that the Fed rate hike cycle is not over. The U.S. dollar is still very expensive on a PPP basis. Our Composite Technical Indicator is not as overbought as it once was, but it is far from having reached oversold levels either. This combination suggests that the greenback could experience further downside over the coming month. It remains to be seen if this wave of depreciation will mark the beginning of the cyclical bear market required to correct the dollar’s overvaluation. EQUITIES:
Image
Image
Image
Image
Image
Image
Image
Image
FIXED INCOME:
Image
Image
Image
Image
Image
Image
Image
CURRENCIES:
Image
Image
Image
Image
Image
Image
Image
COMMODITIES:
Image
Image
Image
Image
Image
ECONOMY:
Image
Image
Image
Image
Image
Image
Image
Image
Image
Image
Image
Mark McClellan Senior Vice President The Bank Credit Analyst Footnotes 1 Most of the data referred to in this report comes from the medium variant projections from the United Nation’s World Population Prospects report, 2017 revision. There is an excellent online database tool that allows users to access numerous demographic series for every country and region in the world. This can be found at https://population.un.org/wpp/DataQuery/ 2 Edward N. Wolff, Household Wealth Trends in the United States, 1962 to 2016. NBER Working Paper 24085, November 2017. Available at: https://www.nber.org/papers/w24085. 3 This is not a joke: https://www.businessinsider.com/signs-japan-demographic-time-bomb-2017-3 4 The Impact of Workforce Aging on European Productivity. IMF Working Paper, December 2016. Available at: https://www.imf.org/en/Publications/WP/Issues/2016/12/31/The-Impact-of-Workforce-Aging-on-European-Productivity-44450 5 The Effect of Population Aging on Economic Growth, the Labor Force and Productivity. NBER Working Paper 22452, July 2016. Available at https://www.nber.org/papers/w22452.pdf 6 For example, see “Will Grandpa Sink The Stock Market?”, The Bank Credit Analyst, September 2014. 7 The Baby Boom, The Bay Bust, and the Housing Market. NBER Working Paper 2794. Available at: https://www.nber.org/papers/w2794 8 For those interested in this topic, we recommend the following paper: Demographics and Asset Markets: A Survey of the Literature. Available at: https://pdfs.semanticscholar.org/912a/5d6d196c3405e37b3a50d797cbf65a27ba44.pdf 9 Global Peace Index, 2018. Available at: http://visionofhumanity.org/app/uploads/2018/06/Global-Peace-Index-2018-2.pdf. According to this index, the eight least-safe countries are (starting with the most dangerous): Syria, Afghanistan, South Sudan, Iraq, Somalia, Yemen, Libya, and Democratic Republic of the Congo. EQUITIES:FIXED INCOME:CURRENCIES:COMMODITIES:ECONOMY:
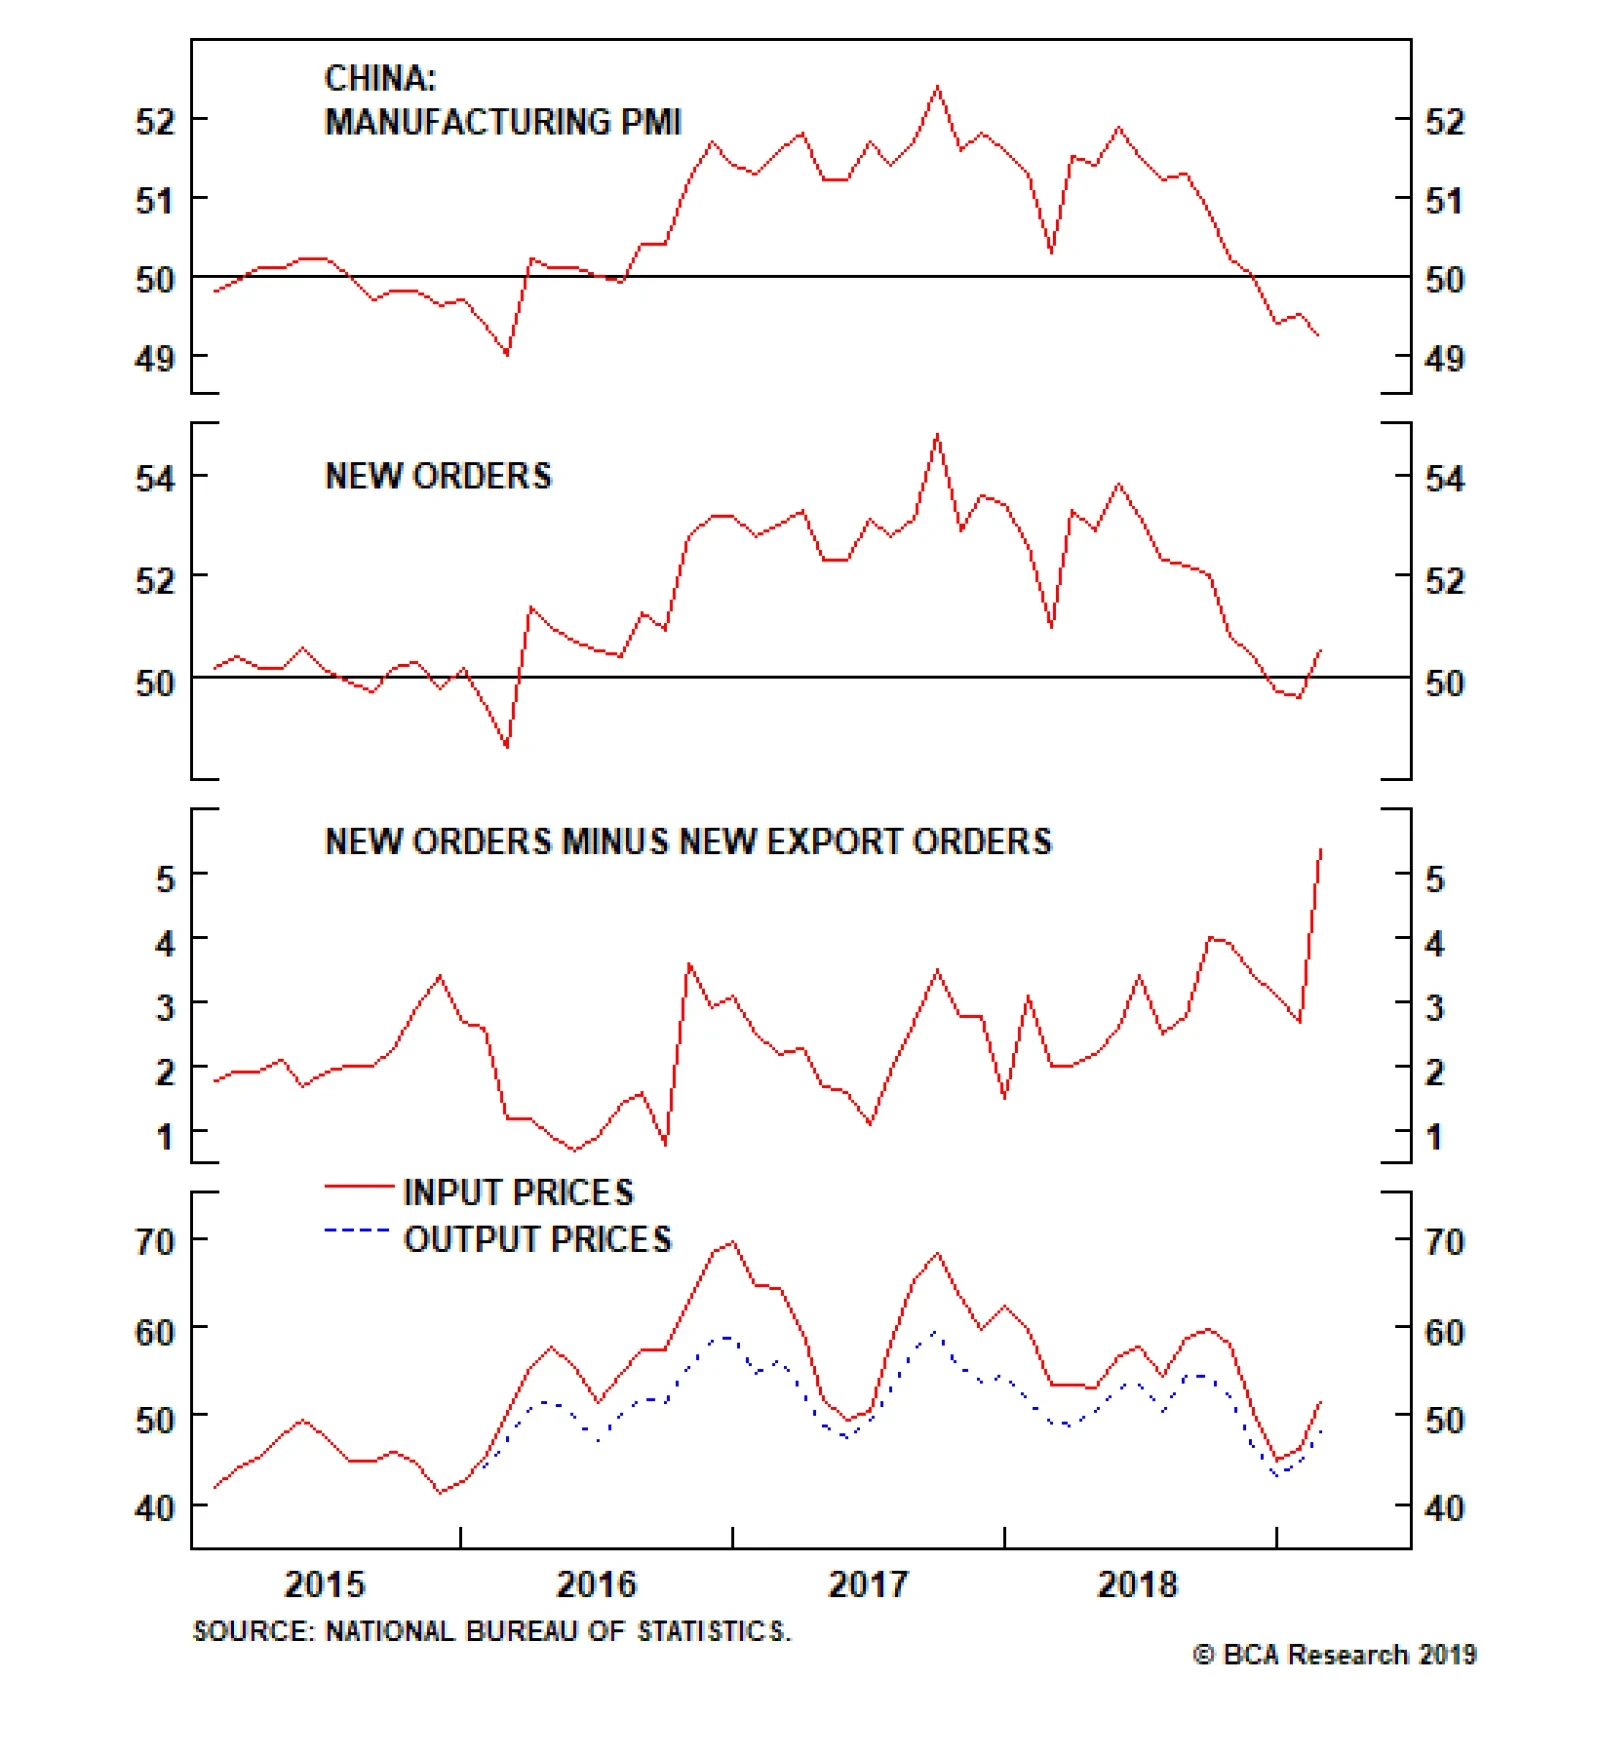
The Chinese Manufacturing PMI remains in contractionary territory, declining from 49.5 to 49.2. This was also marginally worse than expectations. This suggests that the Chinese economy has not yet responded to the growing reflationary push implemented by…
Despite putting Chinese investible stocks on an upgrade watch there are three factors that continue to argue against the shift. The first factor is investors have bid up Chinese stocks assuming not only that a trade deal with the U.S will occur, but that…
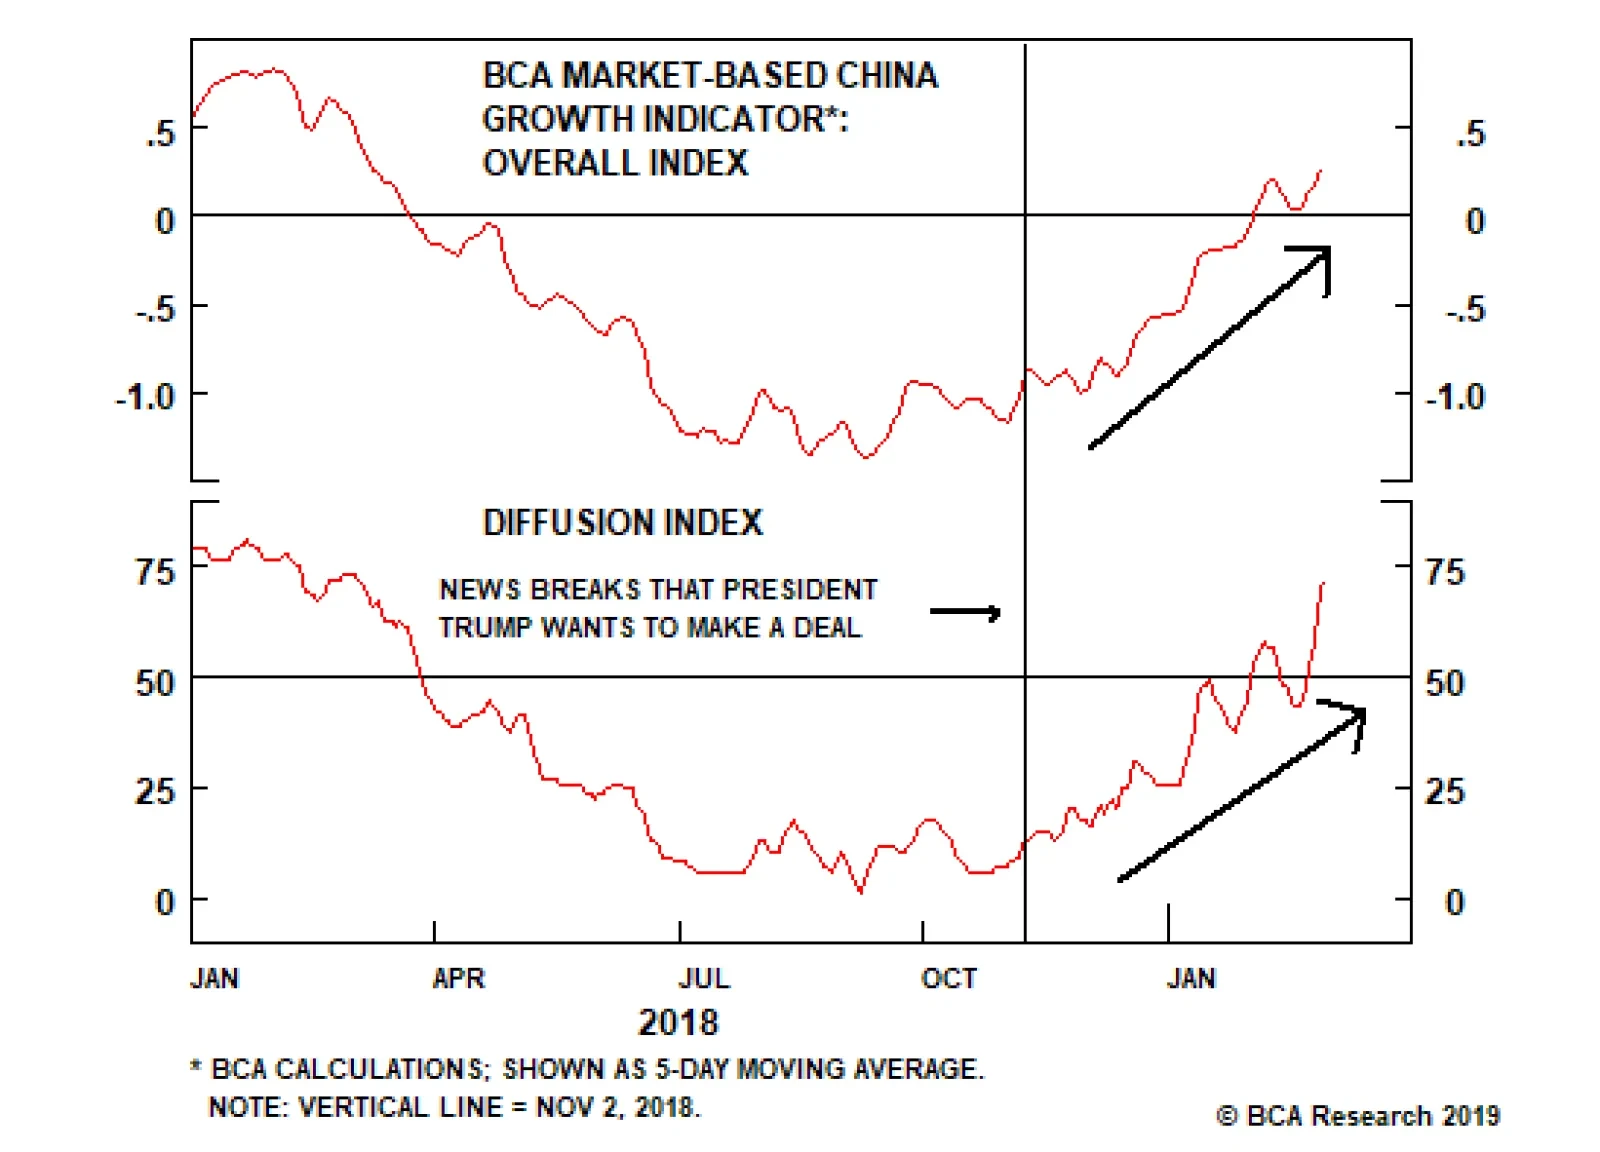
The chart above provides confirmation that trade talks have been the primary driver behind the rally in China-related assets. Both the BCA Market-Based China Growth Indicator and the diffusion index of its 17 components began to improve when the prospect of a…
Highlights Trade talks have been the primary driver of the rally in Chinese stocks and China-related assets over the past five months. While trade is important to China’s economy, Chinese domestic demand is the primary driver of China-related asset fundamentals, meaning that the recent equity rally has occurred on the back of a largely false narrative. The January surge in credit has brought the first concrete sign that Chinese domestic demand will eventually bottom, but the current pace of money & credit growth suggests that investable earnings are facing a “catch up” period of potentially material weakness. The need for a stabilization in the outlook for earnings argues against an immediate shift to overweight, but we agree that investors should put Chinese investable stocks on upgrade watch for the coming few months. Feature Chart 1 reviews the recent performance of the Chinese investable equity market, and highlights two important facts: Chinese equity performance bottomed in both absolute and relative terms at the end of October, and The relative performance trend versus global stocks has now retraced roughly 40% of the decline that occurred in 2018 Chart 1A Sizeable Retracement, Based On A (Largely) False Narrative
A Sizeable Retracement, Based On A (Largely) False Narrative
A Sizeable Retracement, Based On A (Largely) False Narrative
For investors looking for an appropriate allocation to Chinese stocks and China-related assets more generally over the coming 6-12 months, it is important to understand what has driven this post-October outperformance. In our view, it is only the January surge in credit growth that has brought the first concrete sign that Chinese domestic demand will eventually bottom, meaning that China plays have been rallying for the past five months on a largely false narrative. This significantly complicates the cyclical investment outlook, even under the assumption of an imminent trade deal with the U.S. As we will detail below, several factors argue against an immediate shift to overweight, but we agree that investors should put Chinese investable stocks on upgrade watch. We will be watching closely over the next few months for confirmation that above-average credit growth will be sustained, and that the outlook for Chinese earnings is stabilizing. Dissecting The Rally: Mostly Driven By Trade Optimism, Not Easing During the week of October 29th, the equity market was buoyed somewhat by a statement emerging from the late-October politburo meeting. The statement cited the need for the government to take “more timely steps” to counter increasing downward pressure on the economy, which catalyzed a 6% bounce in investable stocks (3% for the domestic market) by Thursday, November 1st. However, to most investors, news of a much more significant event came on Friday, November 2nd: President Trump was looking to make a deal with China at the late-November G20 meeting in Argentina, and had asked key officials to begin drafting potential terms.1 The investable market rallied over 3% on the day in response to the news, and continued to rise until Monday December 3rd, the day after the 3-month trade talk agreement was struck. Chart 1 shows that while investible stocks nearly hit a new 2018 low in December, this was due to a significant sell off in global stocks: relative performance was flat during this period, and resumed its uptrend once global stocks began to rise. Chart 2 provides confirmation that trade talks have been the primary driver behind the rally in China-related assets as well. The chart shows the BCA Market-Based China Growth Indicator alongside a diffusion index of its 17 components, with the vertical line denoting the point where the prospect of a deal became public. The Fed’s shift to a more dovish posture following its December rate hike has certainly helped propel the global rally in risky assets, but Chart 2 makes it clear that a shift in the outlook for trade between the U.S. and China has been the more important factor driving the prices of China-related assets over the past few months. Chart 2Trump's Desire For A Deal Was The Turning Point For The Market
Trump's Desire For A Deal Was The Turning Point For The Market
Trump's Desire For A Deal Was The Turning Point For The Market
In terms of its relative importance for the Chinese economy, the focus of investors on trade is mostly wrongheaded. Trade is important to China’s economy, but the domestic demand trend is a far more important driver for the fundamental performance of China-related assets. We have highlighted over the past year that investor attention has been focused on the wrong factor, underscoring the rally in Chinese stock prices over the past few months has been driven by a largely false narrative. From Trade, To Credit Chart 3 compares our leading indicator for the Chinese economy with a measure of coincident economic activity, and highlights that the sharp slowdown in growth that has occurred over the past few months represents a reversion to a level that would be more consistent with that of our leading indicator (which has been pointing to weaker economic activity for the better part of the past 18 months). In fact, Chart 3 implies that actual growth is still stronger than what monetary conditions, money, and credit growth would imply, meaning that a further slowdown should be expected over the coming several months. Chart 3Economic Activity Is Recoupling With Our Leading Indicator
Economic Activity Is Recoupling With Our Leading Indicator
Economic Activity Is Recoupling With Our Leading Indicator
However, judging by January’s credit release, this further slowdown in growth may occur against the backdrop of a durable uptrend in our leading indicator. Our calculation of adjusted total social financing grew by nearly 5 trillion RMB in January, a very substantial rise that has seldom occurred over the past few years (Chart 4). Legitimate questions about the seasonal effects of the Lunar New Year remain, but Chart 5 shows that the January data was large enough to cause a visible tick higher in the YoY growth rate, caused a sharp rise in our ratio of new credit to GDP, and occurred alongside an easing in the contraction of shadow credit as a percent of total credit. These are clear signs that reluctant policymakers are responding to the need to stabilize a weak economy. Chart 4A Very Strong Surge In January Credit...
A Very Strong Surge In January Credit...
A Very Strong Surge In January Credit...
Chart 5...Has Led To A Visible Uptick In Annual Growth
...Has Led To A Visible Uptick In Annual Growth
...Has Led To A Visible Uptick In Annual Growth
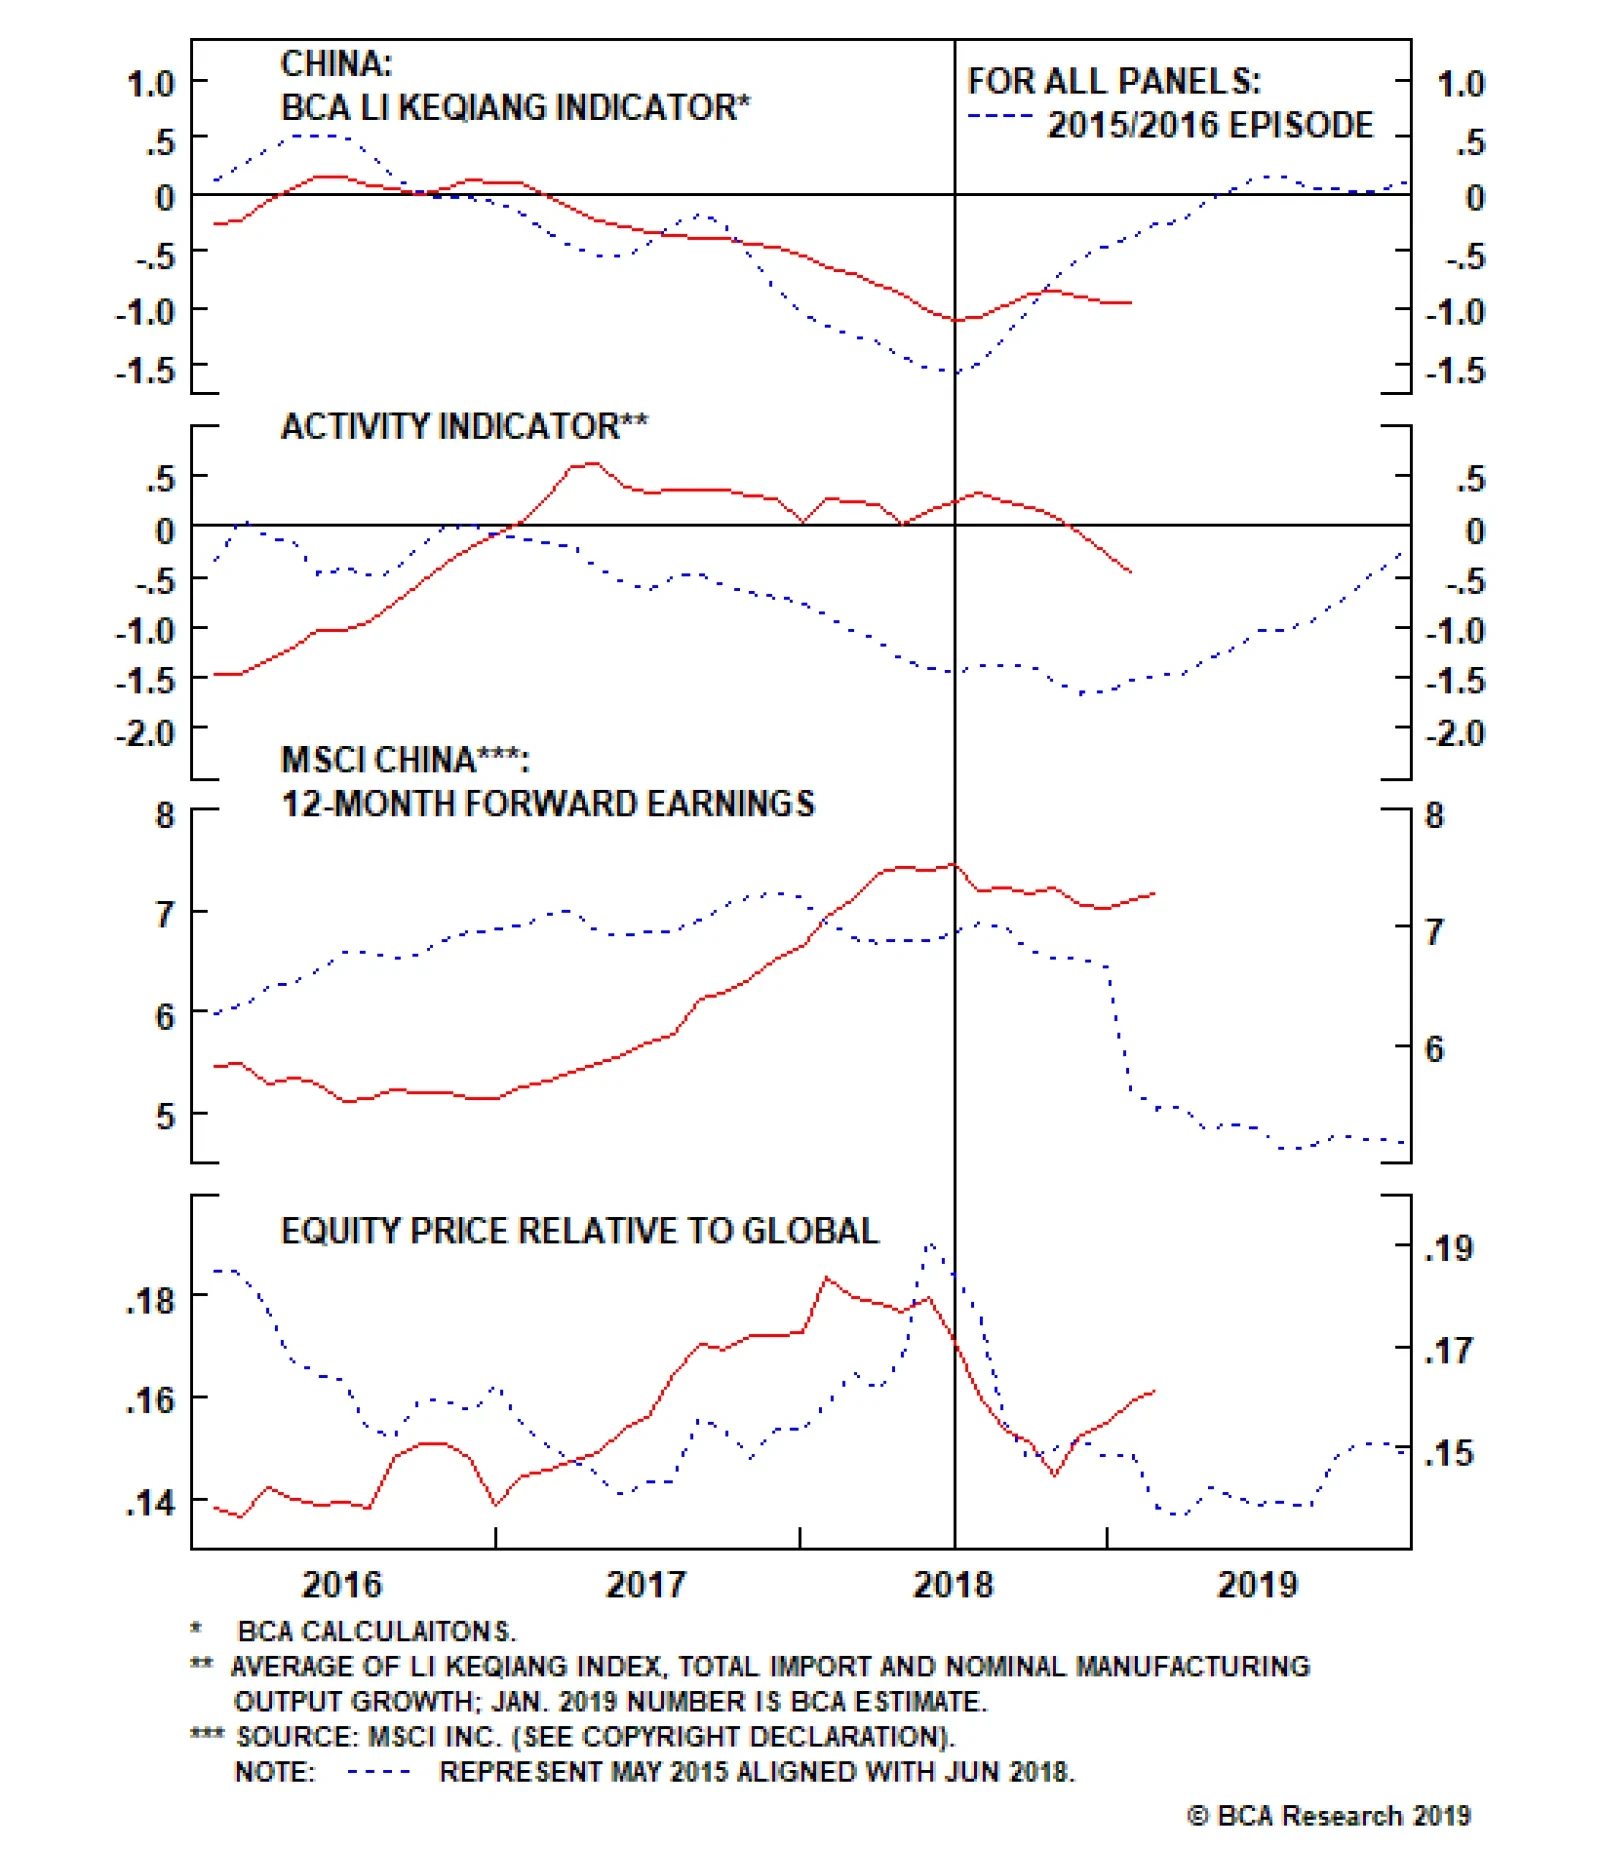
The magnitude of the January surge suggests that there is now a legitimate basis to forecast an eventual bottom in Chinese domestic demand. Our December 5 Weekly Report outlined our key views for 2019,2 and in it we noted that “our base case view is that growth will modestly firm in the second half of 2019, which would provide a somewhat stronger demand backdrop for commodities and emerging economies that sell goods to China”. The odds of a firming in growth have certainly gone up as a result of January’s data, although it remains unclear how strong the upturn in credit growth will ultimately be over the course of 2019. This, along with the desynchronizing effect of trade front-running and a truce-driven rally in Chinese stocks, significantly muddles the 6-12 month investment strategy outlook. From Credit, To Investment Strategy We noted in our December key views report that a tactical overweight stance towards Chinese stocks was probably warranted over the coming three months, in recognition of the fact that investors could bid up the market in the lead-up to a possible trade deal with the U.S. We argued that the conditions for a cyclical overweight stance (6-12 months) were not yet present but could emerge sometime this year, particularly if money & credit growth begin to pick up. Is the January surge in adjusted total social financing a sign that investors should increase their allocation to Chinese equities today? We agree that investors should put Chinese investable stocks on upgrade watch for the next few months, but three factors continue to argue against an immediate shift: Investors appear to have bid up Chinese stocks assuming not only that the trade deal with the U.S. will occur, but that it will result in a durable resolution to the dispute (including, presumably, the rolling back of all tariffs that have been imposed). Even under the assumption that a deal does occur, it may be less comprehensive than investors are assuming and could still cause some lasting negative implications for global trade. While the odds of a credit overshoot have legitimately risen,3 January’s credit number is only one data point and the month-over-month change in credit is always abnormally strong in the first month of the year. At a minimum, investors should wait until the February credit data is released in mid-March to judge whether a higher pace of credit growth will be sustained over the course of the year. The recent quarrel between Premier Li Keqiang and the PBOC over whether the January credit spike represented “flood irrigation-style” stimulus suggests that policymakers are still somewhat reluctant to significantly boost credit,4 underscoring the need to monitor whether the recent pace of growth will be sustained. As first highlighted in Chart 3 above, the inflection point in credit growth implies that economic activity will improve at some point in the months ahead, but the current pace of money & credit growth suggests that both activity and, crucially, the level of earnings are facing a “catch up” period of potentially material weakness before they durably bottom. Chart 6 illustrates this potential weakness by comparing the current circumstance of our leading economic indicator, our measure of coincident economic activity, and the level of forward earnings to the 2015/2016 episode. The chart shows that by comparison to today, the 2015/2016 episode had clearer sequencing: our leading indicator fell, coincident activity followed, and stock prices bottomed only once forward earnings had contracted materially. Chart 6In 2015/2016, Our Leading Indicator Led Activity, Earnings, And Relative Stock Performance
In 2015/2016, Our Leading Indicator Led Activity, Earnings, And Relative Stock Performance
In 2015/2016, Our Leading Indicator Led Activity, Earnings, And Relative Stock Performance
This time around, our leading indicator peaked in Q1 2017, but activity remained stronger than our indicator would have suggested even though it peaked relatively soon afterwards. Incoming data over the past three months suggest that economic activity is now catching up to the downside, and forward earnings remain elevated. Chart 7 shows that Chinese net earnings revisions remain firmly in negative territory, at levels that have been historically been associated with contracting forward earnings growth. Chart 7Earnings Weakness Looks Set To Continue
Earnings Weakness Looks Set To Continue
Earnings Weakness Looks Set To Continue
Panel 4 of Chart 6 is emblematic of the fact that the recent rally in Chinese relative performance, driven largely by a false narrative, has significantly complicated the cyclical investment outlook. If the January improvement in credit had instead come in late October when Chinese relative performance was near its low, it would have been much easier for us to recommend that investors move to an overweight stance in response to a legitimate fundamental improvement and to take the risk of being somewhat too early. Now, a razor sharp focus on the earnings outlook is necessary, and we are unlikely to recommend an increased allocation to Chinese stocks unless that outlook stabilizes. Table 1 presents one of the tools that we will be using to judge the outlook for earnings, based on a model that we presented in two recent reports.5 The table shows a series of earnings recession probabilities that are based on a variety of credit and exchange rate scenarios and conditional on a material improvement in Chinese exporter sentiment. Light colored cells represent an earnings recession probability of less than 1/3rd, and the circled cell shows roughly where we would be today if the new export order component of the NBS manufacturing PMI were to rise sharply back to its June 2018 level. Table 1Credit Needs To Rise Further And RMB Appreciation Needs To Slow For The Earnings Outlook To Stabilize
Dealing With A (Largely) False Narrative
Dealing With A (Largely) False Narrative
The table makes two key points. First, even given January’s surge, new credit will have to improve relative to GDP over the coming months in order to stabilize the earnings outlook. Second, the more that China’s currency appreciates in response to a trade deal with the U.S., the higher the hurdle rate for credit. Chart 8 shows that CNY-USD is already deviating quite significantly from the level implied by interest rate differentials, suggesting that significant further currency appreciation may not be in the cards. But the bottom line for investors is that a rising currency has the potential to negate some of the reflationary effects of stronger credit, and is a risk that must be monitored alongside the effort to gauge the sustainable rate of credit growth. Chart 8While Policymakers Or Rate Differentials Drive CNY-USD Over The Coming Year?
While Policymakers Or Rate Differentials Drive CNY-USD Over The Coming Year?
While Policymakers Or Rate Differentials Drive CNY-USD Over The Coming Year?
Stay tuned! Jonathan LaBerge, CFA, Vice President Special Reports jonathanl@bcaresearch.com Footnotes 1 Please see “Trump Said To Ask Cabinet To Draft Possible Trade Deal With Xi”, dated November 2, 2018, available at Bloomberg News 2 Please see China Investment Strategy Weekly Report “2019 Key Views: Four Themes For China In The Coming Year”, dated December 5, 2018, available at cis.bcaresearch.com. 3 Please see China Investment Strategy and Geopolitical Strategy Special Report “China: Stimulating Amid The Trade Talks”, dated February 20, 2019, available at cis.bcaresearch.com. 4 Please see “Chinese Premier In Rare Spat With Central Bank”, Financial Times. 5 Please see China Investment Strategy Special Report “Six Questions About Chinese Stocks”, dated January 16, 2019, and Weekly Report “A Gap In The Bridge”, dated January 30, 2019 available at cis.bcaresearch.com. Cyclical Investment Stance Equity Sector Recommendations
On Monday Chinese A-shares surged by nearly 6%, their best daily performance in three years. In many corners of the investment community, EM assets and China related assets have interpreted these developments as a positive omen. Nobody can deny that not…
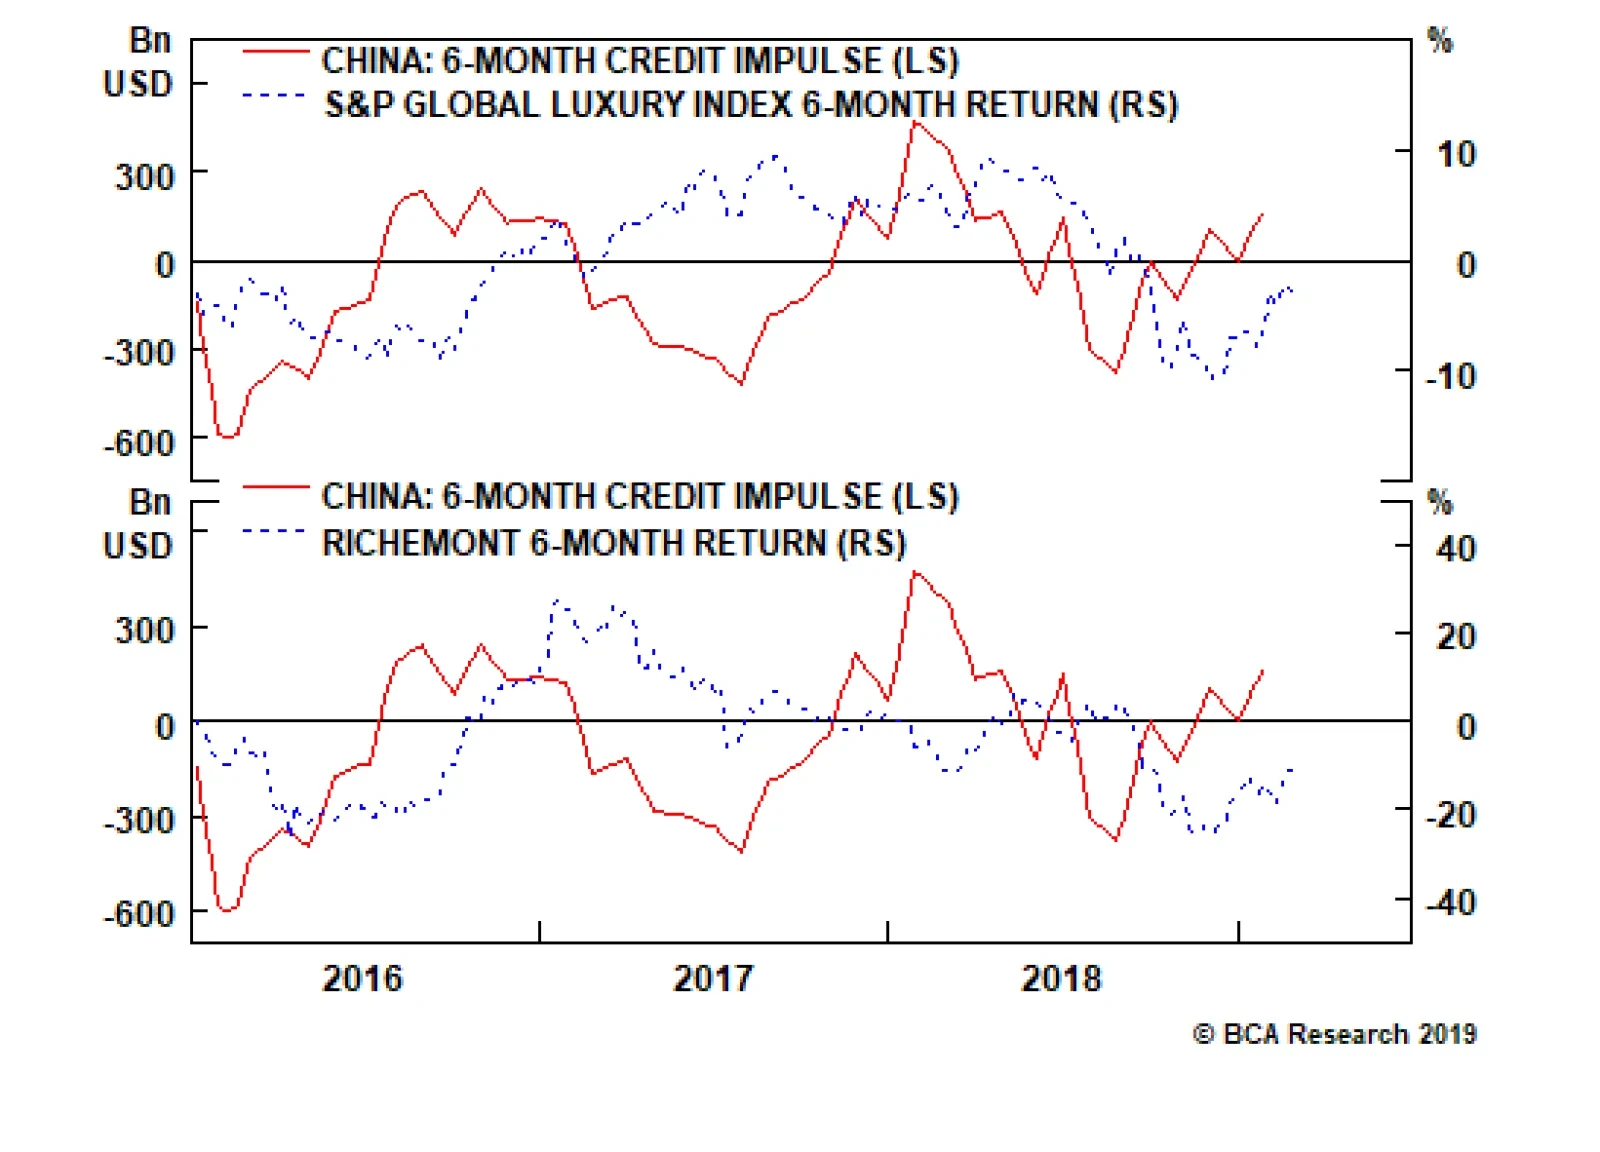
Regarding the European luxury goods sector, we often get following question: is it, just like the basic resources sector, a direct play on China’s growth cycle? The answer is no. Recently, the connection between the fortunes of ‘soft’ luxury goods brands like…
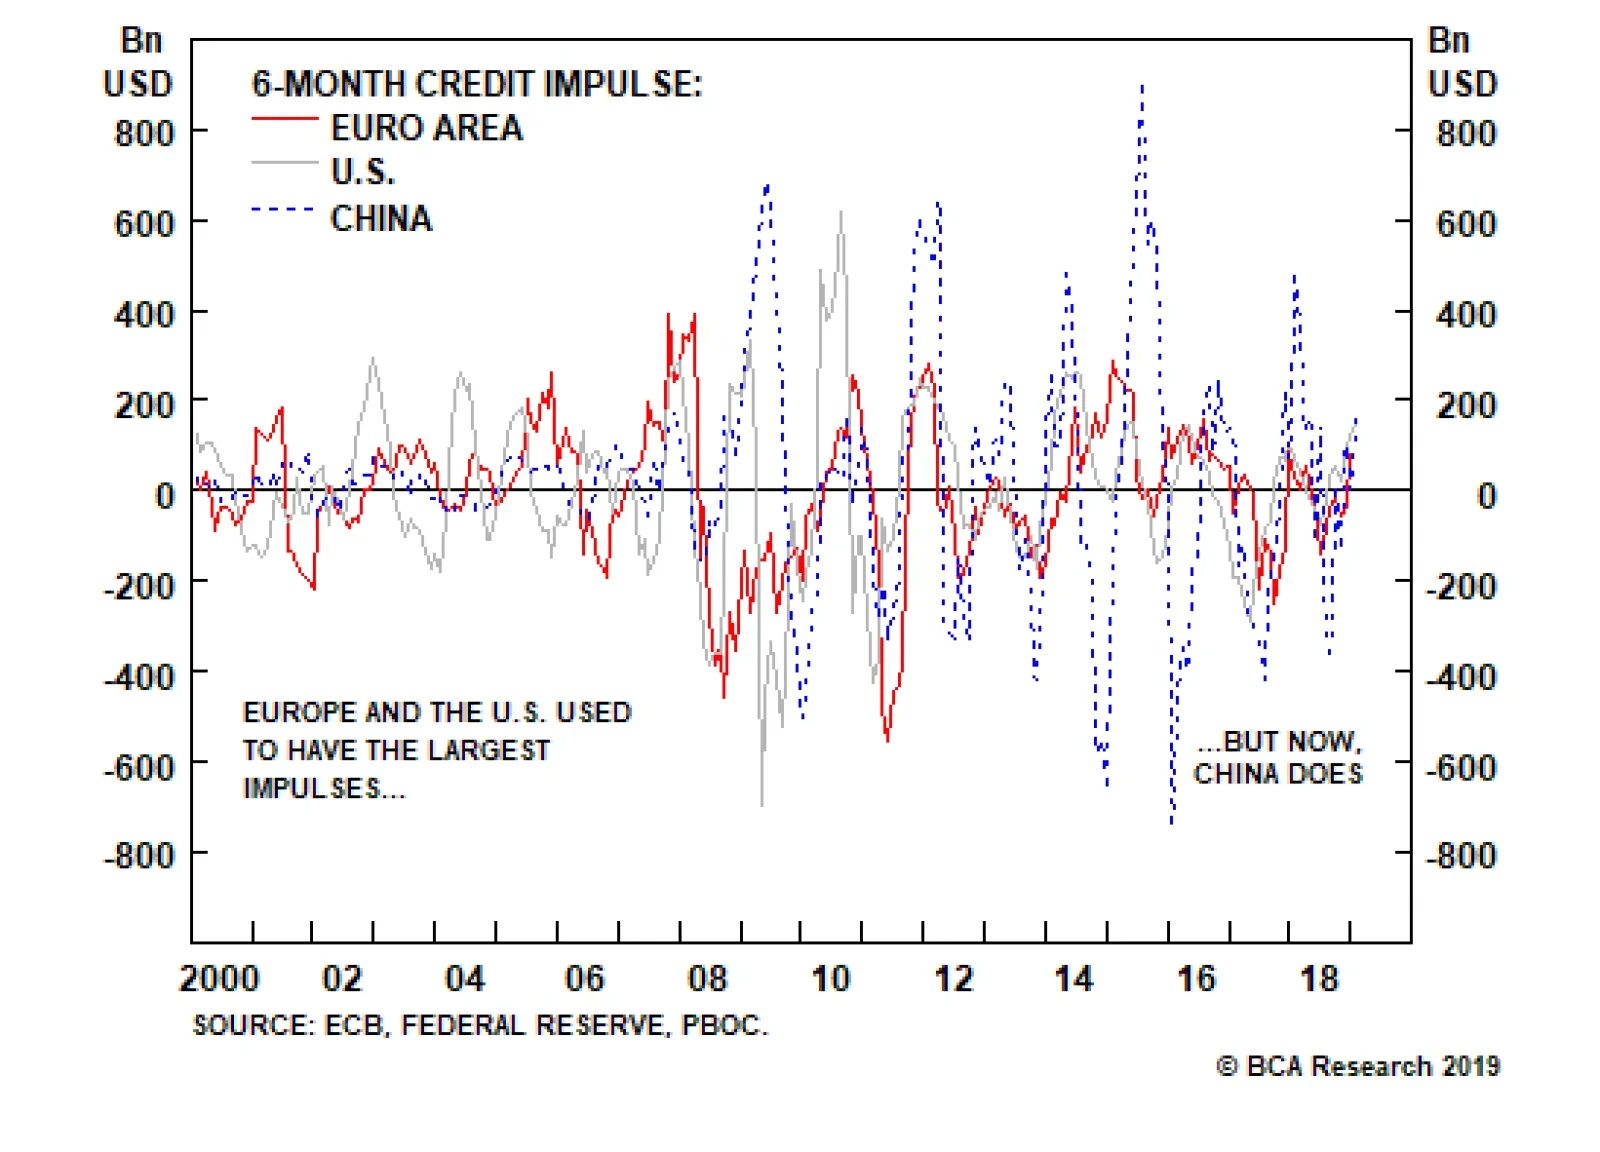
The chart above shows the short-term credit impulses, expressed in USD terms, for the euro area, U.S., and China through the past twenty years. The comparison reveals that the dominant short-term impulse – the one with the highest amplitude – illustrates the…
Highlights A sooner-than-anticipated end to the Federal Reserve’s balance-sheet runoff should give a welcome boost to international liquidity conditions. Moreover, reflationary efforts in China, cautious global central banks, and easing global financial conditions all point to a rebound in economic surprises. This will support pro-cyclical versus defensive currencies and argues against a strong USD. At this point, it is too early to tell how long a pro-cyclical FX stance will be warranted. Sell NZD/CAD. Feature Since the turn of the year, this publication has argued that a correction in the dollar was increasingly likely, and that the main beneficiaries of this move should be the more pro-cyclical currencies. Because U.S. domestic fundamentals remain much stronger than the rest of the G10’s, our preference has been to favor commodity currencies versus the yen instead of playing dollar weakness outright. This theme remains in place for now. However, we are increasingly concerned about the dollar and think the outperformance of commodity currencies could last longer than originally expected. Essentially, an end to the Federal Reserve’s balance-sheet runoff, more cautious central banks, and easier global financial conditions could set the stage for a significant rebound in commodity currencies. U.S. Excess Reserves Vs. Commodity Currencies Whether it is from Governor Lael Brainard, Cleveland Fed President Loretta Mester, or the FOMC minutes, the message is clear: The days of the Fed’s balance sheet runoff are numbered. Ryan Swift, BCA’s Chief U.S. Bond Strategist, has written at length that the Fed’s balance sheet attrition has had a limited direct impact on U.S. growth. However, Ryan and the FOMC members both agree that a smaller balance sheet impacts the ability of the Fed to control the level of the fed funds rate.1 With less excess reserves in the banking system, the New York Fed has to intervene more often to keep the policy rate below its ceiling. This might seem like a very technical point, but it is an important one for many FX markets. Prior to the financial crisis, expanding excess reserves on U.S. commercial banks would coincide with improving dollar-based liquidity. Moreover, since 2011, reserves even lead our financial liquidity index (Chart I-1). Since there is 14 trillion of USD-denominated foreign-currency debt around the world, these fluctuations in U.S. excess reserves, and thus global liquidity, can have an impact on the price of assets most levered to global growth conditions. Chart I-1U.S. Excess Reserves Contribute To The Global Liquidity Backdrop
U.S. Excess Reserves Contribute To The Global Liquidity Backdrop
U.S. Excess Reserves Contribute To The Global Liquidity Backdrop
Chart I-2 illustrates that commodity currencies are indeed very responsive to changes in U.S. excess reserves, particularly when these pro-cyclical currencies are compared to counter-cyclical ones like the JPY. Meanwhile, the trade-weighted dollar tends to move in the opposite direction of excess reserves, reflecting the dollar’s countercyclical nature (Chart I-3). This relationship, however, is not as tight as the one between commodity currencies and the reserves. Chart I-2Improving Growth In Excess Reserves Leads To Stronger Commodity Currencies...
Improving Growth In Excess Reserves Leads To Stronger Commodity Currencies...
Improving Growth In Excess Reserves Leads To Stronger Commodity Currencies...
Chart I-3...And To A Weaker Greenback
...And To A Weaker Greenback
...And To A Weaker Greenback
A corollary to the growing consensus within the FOMC to end the balance-sheet runoff sooner than later is that the contraction in excess reserves will end. A bottoming in the rate of change of the reserves is consistent with a rebound in commodity currencies, especially against the yen, and with a correction in the dollar. Gold prices are very sensitive to global liquidity conditions. Today, not only is the yellow metal moving closer to the US$1350-US$1370 zone that marked its previous highs in 2016, 2017, and 2018, but also, the gold rally is broadening, as exemplified by the advance / decline line of gold prices versus nine currencies, which is making new highs (Chart I-4, top panel). This indicates that the precious metal could punch above this resistance level. Gold is probably sniffing out an improvement in global liquidity conditions. Since rising gold prices tend to lead EM high-yield bond prices higher (Chart I-4, bottom panel), investors need to monitor this move closely. Chart I-4A Broadening Gold Rally Is Consistent With Easing Liquidity Conditions
A Broadening Gold Rally Is Consistent With Easing Liquidity Conditions
A Broadening Gold Rally Is Consistent With Easing Liquidity Conditions
Bottom Line: The growing chorus among FOMC members singing the praises of the end of the Fed’s balance-sheet runoff points toward a significant slowdown in U.S. excess reserves attrition. While this may not be a significant development for U.S. domestic economic variables, it should help liquidity conditions outside the U.S. While this could weigh on the greenback, the probability is higher that it will help commodity currencies in the short run, especially against the yen. Global Policy And Commodity Currencies In China, new total social financing hit CNY 4.6 trillion in January, well above the normal seasonal strength. Accordingly, the Chinese fiscal and credit impulse is starting to improve (Chart I-5). While this rebound is currently embryonic, our Geopolitical Strategy team has argued that a massive increase in Chinese credit this January would indicate a change in Beijing’s economic priorities.2 The Chinese government may be trying to limit the downside to growth, and reflation may expand. This would result in a further pick-up in the credit impulse. Chart I-5The Chinese Credit Impulse May Be Bottoming
The Chinese Credit Impulse May Be Bottoming
The Chinese Credit Impulse May Be Bottoming
Easing EM financial conditions – courtesy of rebounding EM high-yield bond prices – and rising Chinese credit flows should ultimately lead to improving growth conditions across EM. As a result, our diffusion index of EM economic activity – which tallies improvements across 23 EM economic variables – should bounce from currently very depressed levels. Such a recovery is normally associated with a weaker trade-weighted dollar, a stronger euro, rising commodity prices and rising commodity currencies – both against the USD and the JPY (Chart I-6). Chart I-6IF EM Growth Conditions Improve, This Will Have A Profound Impact On the FX Market
IF EM Growth Conditions Improve, This Will Have A Profound Impact On the FX Market
IF EM Growth Conditions Improve, This Will Have A Profound Impact On the FX Market
We can expand this line of thinking to the global economy. Our Leading Economic Indicator Diffusion Index, which compares the number of countries with a rising LEI versus those with a falling LEI, already rebounded five months ago. Historically, this signals an upcoming rebound in the BCA global LEI. Additionally, other major central banks are also sounding an increasingly cautious tone. This should accentuate the easing in global financial conditions that began in late December, creating another support for global growth. However, global investors remain very pessimistic on global growth, as exemplified by this week’s very poor global growth expectations computed from the German ZEW survey (Chart I-7). This dichotomy between depressed growth expectations and burgeoning green shoots suggests that risk asset prices have room to rally further in the coming quarter or two. Chart I-7Investors Remain Pessimistic About Growth, Yet Green Shoots Are Popping Up
Investors Remain Pessimistic About Growth, Yet Green Shoots Are Popping Up
Investors Remain Pessimistic About Growth, Yet Green Shoots Are Popping Up
These dynamics are positive for commodity currencies and negative for the dollar. This cycle, the pattern has been for the trade-weighted dollar to correct and hypersensitive pro-cyclical currencies like the AUD and the NZD to perk up only after our Global LEI diffusion index has trough, and around the same time as risk asset prices rebound (Chart I-8). Chart I-8Thinking About Growth, Asset Prices, The Dollar, And Commodity Currencies
Thinking About Growth, Asset Prices, The Dollar, And Commodity Currencies
Thinking About Growth, Asset Prices, The Dollar, And Commodity Currencies
Treasury yields will most likely also be forced higher by improving risk asset prices and economic activity, especially as bond market flows suggest T-notes currently are a coiled spring. The U.S. Treasury International Capital System data released at the end of last week was very revealing. The press emphasized the large-scale selling of Treasurys from the Cayman Islands – interpreted as selling by hedge funds. Missing from the picture was the enormous buying from these same players over the past 12 months, which corresponded with falling yields and a rallying trade-weighted dollar (Chart I-9). It was a sign of growing fear that pushed up the price of bonds. Chart I-9Hedge Funds Have Room To Liquidate Their Treasury Holdings
Hedge Funds Have Room To Liquidate Their Treasury Holdings
Hedge Funds Have Room To Liquidate Their Treasury Holdings
If, as we expect, global growth beats dismal expectations and risk assets rebound further, the countercyclical dollar should correct. This will further ease global financial conditions and justifying even more a wholesale liquidation of stale bond holdings by hedge funds and further pushing the Fed toward resuming its hiking campaign faster than the market is currently anticipating. This combination is highly bond bearish. Unsurprisingly, this means that the yen, which normally trades closely in line with U.S. Treasury yields, is likely to weaken. Hence, USD/JPY and EUR/JPY could experience significant upside over the coming months (Chart I-10). Chart I-10A Bond Bearish Backdrop Is Also Bad For The Yen
A Bond Bearish Backdrop Is Also Bad For The Yen
A Bond Bearish Backdrop Is Also Bad For The Yen
Bottom Line: Global growth conditions are evolving away from a dollar-bullish, commodity currency-bearish backdrop. Not only is the dollar-based liquidity set to improve, but China is also releasing the proverbial brake. Additionally, a generally more cautious tone among global central banks will contribute to easing global financial conditions. These developments are likely to result in a period of positive global economic surprises – and an environment where the greenback weakens and where pro-cyclical currencies outperform. But For How Long? It remains a question mark as to how long this pro-growth cycle will last. Parts of the dynamics described above are very self-defeating. If global growth conditions and asset prices rebound strongly, the Fed will be in a better position to increase rates once again. This could quickly curtail the improvement in global financial conditions and favor a strong dollar. Additionally, it is not clear how far Beijing will go in terms of pushing reflation through the Chinese economy. Chinese policymakers are worried about too-pronounced a slowdown but are equally worried about too much debt in their economy, and do not want to repeat the debt binge witnessed in 2010 and 2016. Therefore, they may be much quicker to lift their foot off the gas pedal. This conflicting attitude is best illustrated by recent opposing remarks made by Chinese policymakers. On the one hand, Premier Li-Keqiang expressed concerns regarding the January credit surge, suggesting that some Chinese policymakers are already trying to dampen expectations that stimulus will be substantial. On the other hand, the PBoC sounded utterly unconcerned. Moreover, as our Emerging Markets Strategy service highlights, EM earnings are likely to continue to suffer from the lagged effect of China’s previous tightening. This creates the risk that even if global growth rebounds, EM stock prices, EM FX and all related plays do not follow. This would maintain the dollar-bullish environment and hurt pro-cyclical commodity currencies while supporting the yen. Despite these risks, it is nonetheless too early to tell how short-lived this period of dollar softness and commodity currency strength will be. After all, the dollar is a momentum currency. If the dollar weakness gathers steam, a virtuous cycle could emerge: improving global growth begets a weaker dollar, a weaker dollar begets easier global financial conditions, easier global financial conditions beget stronger growth, and so on. Gold prices may hold the key to cut this Gordian knot. If gold cannot maintain its recent gains, then the pro-cyclical positioning will not be valid for more than three months. However, if gold prices can remain at elevated levels or even rally further, then this pro-cyclical positioning will stay appropriate for at least six to nine months. What is clear is that for now, buying risk in the FX space makes sense. Bottom Line: At this point, too many crosscurrents are at play to evaluate confidently the length of any rally in pro-cyclical currencies relative to defensive ones. Since easier financial conditions ultimately force the Fed to resume hiking and since it is far from clear how committed to reflation Chinese policymakers are, our base case remains that this move will last a quarter or so. However, the fact that a falling dollar further eases global financial conditions, fomenting greater global growth in the process, suggests that a virtuous circle that create additional dollar downside can also emerge. Gold may provide early signals as to when investors should once again adopt a defensive posture. Sell NZD/CAD Something exceptional happened three months ago. For the second time in 25 years, Canadian policy rates fell in line with New Zealand’s. As Chart I-11 shows, this last happened from 1998 to 1999, when NZD/CAD subsequently depreciated 26%. However, today Canada’s and New Zealand’s current accounts are roughly in line while back then New Zealand had a substantially larger deficit, such a decline is unlikely to repeat itself. Nonetheless, we posit that NZD/CAD possesses ample downside. Chart I-11Bad News For NZD/CAD
Bad News For NZD/CAD
Bad News For NZD/CAD
First, like in 1998-‘99, the real trade-weighted NZD exhibits a larger premium to its fair value than the real trade-weighted CAD (Chart I-12). In fact, the relative premium of the NZD to the CAD is roughly comparable as it was back then. Moreover, our Intermediate-Term Timing Model for NZD/CAD reinforces this message as it suggests that short-term valuations are also stretched (Chart I-13). Chart I-12NZD/CAD Is Pricey...
NZD/CAD Is Pricey...
NZD/CAD Is Pricey...
Chart I-13...And Our Short-Term Valuation Metric Agrees
...And Our Short-Term Valuation Metric Agrees
...And Our Short-Term Valuation Metric Agrees
Second, the New Zealand economy is currently weaker than that of Canada. Relative consumer confidence and business confidence have been in a downward trend for three years. Historically, while NZD/CAD can deviate from such dynamics, ultimately this cross tends to revert toward relative growth trends. The recent collapse in New Zealand’s economic surprises relative to Canada’s suggests that the timing for such a reversion is increasingly ripe, as there is currently scope for investors to discount a more hawkish Bank of Canada than Reserve Bank of New Zealand. Indeed, 1-year/1-year forward yields in Canada have fallen much more relative to the BoC overnight rate than similar forwards have fallen relative to the RBNZ policy rate. Third, New Zealand real bond yields have collapsed relative to Canada’s. As Chart I-14 illustrates, NZD/CAD tends to follow real yield differentials. So far, NZD/CAD has been less-weak than the real-yield gap would imply, but from late 2003 to early 2005 this cross also managed to defy gravity for an extended time, only to ultimately succumb to the inevitable. Chart I-14Falling Real Yield Spreads Will Weigh On NZD/CAD
Falling Real Yield Spreads Will Weigh On NZD/CAD
Falling Real Yield Spreads Will Weigh On NZD/CAD
Fourth, as the top panel of Chart I-15 illustrates, the performance of kiwi stocks relative to Canadian equities tend to lead NZD/CAD, especially at tops. While tentative, the ratio of New Zealand to Canadian stocks seems to have peaked in early 2016. Supporting this judgment, kiwi profits have fallen relative to their Canadian counterparts and relative net earnings revisions are following a similar path – a move normally associated with a weaker NZD/CAD (Chart I-15, bottom panel). Chart I-15Relative Stock Market Dynamics Look Poor
Relative Stock Market Dynamics Look Poor
Relative Stock Market Dynamics Look Poor
Fifth, terms of trades are becoming a growing headwind for NZD/CAD (Chart I-16). The price of agricultural commodities relative to energy products drives this pair, reflecting the comparative advantages of the two countries. BCA’s Commodity & Energy service is currently much more positive on the outlook for the energy complex than the agricultural complex. NZD/CAD is a perfect instrument to implement this view, especially now that the NZD suffers from a very rare negative carry against the CAD. Chart I-16A Negative Tems-Of-Trade Shock For NZD/CAD
A Negative Tems-Of-Trade Shock For NZD/CAD
A Negative Tems-Of-Trade Shock For NZD/CAD
Bottom Line: NZD/CAD is set to experience an important fall. The NZD currently suffers from a very rare negative carry against the CAD. The last time this happened, a large depreciation ensued. Moreover, valuations and economic trends argue in favor of shorting this pair. Finally, relative bond yields, equity dynamics and term-of-trade outlooks also point to a lower NZD/CAD. Sell at 0.900, with a stop at 0.927 for a target of 0.800. Mathieu Savary, Vice President Foreign Exchange Strategy mathieu@bcaresearch.com Footnotes 1 Please see U.S. Bond Strategy Weekly Report, titled “Caught Offside”, dated February 12, 2019, and the U.S. Bond Strategy Weekly Report, titled “The Great Unwind”, dated September 19, 2017, available at usbs.bcaresearch.com 2 Please see Geopolitical Strategy Special Report titled “China: Stimulating Amid The Trade Talks,” dated February 20, 2019 available at gps.bcaresearch.com Currencies U.S. Dollar Chart II-1USD Technicals 1
USD Technicals 1
USD Technicals 1
Chart II-2USD Technicals 2
USD Technicals 2
USD Technicals 2
Recent data in the U.S. has been mixed: Capacity Utilization underperformed expectations, coming in at 78.2%. However, Michigan Consumer Sentiment outperformed expectations, coming in at 95.5. Finally, the NAHB Housing Market Index also surprised to the upside, coming in at 62. The DXY has fallen by 0.2% this week. We remain bullish on the U.S. dollar on a cyclical basis, given that the Fed will end up hiking rates more than expected. However, the current easing of monetary conditions by Chinese authorities should tactically hurt the dollar and help commodity currencies. Moreover, the fact that the Fed announced that it might bring about an end to the balance sheet runoff sooner than expected will further help global liquidity conditions. The real question now is how long the coming dollar correction will last? Report Links: Balance Of Payments Across The G10 - February 15, 2019 A Simple Attractiveness Ranking For Currencies - February 8, 2019 Global Liquidity Trends Support The Dollar, But... - January 25, 2019 The Euro Chart II-3EUR Technicals 1
EUR Technicals 1
EUR Technicals 1
Chart II-4EUR Technicals 2
EUR Technicals 2
EUR Technicals 2
Recent data in the euro area has been mixed: The annual growth in construction output underperformed expectations, coming in at 0.7%. The current account balance also surprised to the downside, coming in at 33 billion euros. However, the Zew Survey – Economic sentiment, though negative, surprised to the upside, coming in at -16.6. EUR/USD has risen by 0.4% this week. We remain bearish on EUR/USD on a cyclical basis; given that, we expect real rates to rise much faster in the U.S. than in the euro area. This is because we think that the U.S. economy will remain stronger than Europe’s, a consequence of the fact that the former has experienced a significant private sector deleveraging since 2008 while the latter has not. Report Links: Balance Of Payments Across The G10 - February 15, 2019 A Simple Attractiveness Ranking For Currencies - February 8, 2019 2019 Key Views: The Xs And The Currency Market - December 7, 2018 The Yen Chart II-5JPY Technicals 1
JPY Technicals 1
JPY Technicals 1
Chart II-6JPY Technicals 2
JPY Technicals 2
JPY Technicals 2
Recent data in Japan has been mixed: Machinery orders yearly growth outperformed to the upside, coming in at 0.9%. Hurt by a very sharp contraction in shipments to China, the yearly growth of Japanese exports also surprised to the downside, coming in at -8.4%. However, imports yearly growth outperformed to the upside, coming in at -0.6%. USD/JPY has risen by 0.2% this week. We are bearish towards the yen on a tactical basis as the current upturn in liquidity conditions should hurt safe haven currencies. Moreover, reflationary efforts by Chinese Authorities should provide a boon to risk assets and make low yield currencies like the yen even less attractive. Report Links: Balance Of Payments Across The G10 - February 15, 2019 A Simple Attractiveness Ranking For Currencies - February 8, 2019 Yen Fireworks - January 4, 2019 British Pound Chart II-7GBP Technicals 1
GBP Technicals 1
GBP Technicals 1
Chart II-8GBP Technicals 2
GBP Technicals 2
GBP Technicals 2
Recent data in the U.K. has been strong: Retail sales and retail sales ex-fuel yearly growth both outperformed expectations, coming in at 4.2% and 4.1%. Moreover, the yearly growth of average hourly earnings excluding bonus also surprised positively, coming in at 3.4%. GBP/USD has risen by 0.9% this week. We expect that a soft Brexit deal remains the most probable outcome out of Westminster. Thus, this factor, along with how cheap the pound is, make us bullish on the pound on a long-term basis. Report Links: Balance Of Payments Across The G10 - February 15, 2019 A Simple Attractiveness Ranking For Currencies - February 8, 2019 Deadlock In Westminster - January 18, 2019 Australian Dollar Chart II-9AUD Technicals 1
AUD Technicals 1
AUD Technicals 1
Chart II-10AUD Technicals 2
AUD Technicals 2
AUD Technicals 2
Recent data in Australia has been mixed: The wage price index yearly growth underperformed expectations, coming in at 0.5%. However, the employment change surprised to the upside, coming in at 39.1 thousand in January. The participation rate also surprised positively, coming in at 65.7%. AUD/USD has fallen 0.7% this week. We are positive on the AUD on a tactical basis. Global monetary conditions have eased thanks to the rising Chinese credit and more cautious global central banks. Moreover, the announcement that the Fed is looking to halt its balance sheet reduction sooner than expected has provided further relief. However, the fundamentals of Australia remain poor, and thus long-term investors should continue to avoid this currency, Report Links: Balance Of Payments Across The G10 - February 15, 2019 A Simple Attractiveness Ranking For Currencies - February 8, 2019 CAD And AUD: Jumping Higher To Plunge Deeper - February 1, 2019 New Zealand Dollar Chart II-11NZD Technicals 1
NZD Technicals 1
NZD Technicals 1
Chart II-12NZD Technicals 2
NZD Technicals 2
NZD Technicals 2
The recent data in New Zealand has been mixed: The business PMI in January fell to 53.1. However, the input of the producer price index on a quarter-over-quarter basis surprised to the upside, coming in at 1.6%. NZD/USD depreciated by 0.7% this week. While NZD/USD might have some upside in the short term, we remain bearish on the NZD/USD on a cyclical basis. Both the short-term and long-term interest rates in New Zealand are lower than in the U.S., while the real trade-weighted NZD is trading at 7% premium to its fair value. Thus, the kiwi is relatively overvalued which means that any tactical upside of NZD won’t have legs. Report Links: Balance Of Payments Across The G10 - February 15, 2019 A Simple Attractiveness Ranking For Currencies - February 8, 2019 Updating Our Intermediate Timing Models - November 2, 2018 Canadian Dollar Chart II-13CAD Technicals 1
CAD Technicals 1
CAD Technicals 1
Chart II-14CAD Technicals 2
CAD Technicals 2
CAD Technicals 2
The recent data in Canada has been neutral: The December new housing price index stays unchanged at 0%, on both month-over-month and year-over-year basis. The CAD has risen by 0.2% against USD this week. As BCA anticipates oil prices to strengthen more, we also expect the CAD to outperform the AUD and the NZD over the next few months. However, we remain bearish on CAD/USD on a structural basis. The unhealthy housing market in Canada could be a potential risk to the Canadian financial industry and the economy as a whole. Report Links: Balance Of Payments Across The G10 - February 15, 2019 A Simple Attractiveness Ranking For Currencies - February 8, 2019 CAD And AUD: Jumping Higher To Plunge Deeper - February 1, 2019 Swiss Franc Chart II-15CHF Technicals 1
CHF Technicals 1
CHF Technicals 1
Chart II-16CHF Technicals 2
CHF Technicals 2
CHF Technicals 2
The recent data in Switzerland has been positive: The December exports increased to 19,682 million, while the imports increased to 16,639 million. The trade balance in December thus increased to 3,043 million, surprised to the upside. EUR/CHF has been flat this week. We are bullish on EUR/CHF on a cyclical basis. Easy global financial conditions should hurt safe haven currencies like the franc. Moreover, we believe that the SNB will continue to play a heavily dovish bias in order to counteract the fall in inflation caused by the surge in the franc last year. Report Links: Balance Of Payments Across The G10 - February 15, 2019 A Simple Attractiveness Ranking For Currencies - February 8, 2019 Waiting For A Real Deal - December 7, 2018 Norwegian Krone Chart II-17NOK Technicals 1
NOK Technicals 1
NOK Technicals 1
Chart II-18NOK Technicals 2
NOK Technicals 2
NOK Technicals 2
Recent data in Norway has been positive: January trade balance increased to 28.8 million, from previous 25 billion. USD/NOK was flat this week. In general, we are overweight the krone, since we believe the pickup in oil prices will help the Norwegian economy, ultimately boosting the performance of NOK against the EUR, the SEK, the AUD and the NZD. Moreover, the NOK is undervalued and currently trading at a large discount to its fair value, which could further lift the performance of the NOK on a cyclical basis. Report Links: Balance Of Payments Across The G10 - February 15, 2019 A Simple Attractiveness Ranking For Currencies - February 8, 2019 Global Liquidity Trends Support The Dollar, But... - January 25, 2019 Swedish Krona Chart II-19SEK Technicals 1
SEK Technicals 1
SEK Technicals 1
Chart II-20SEK Technicals 2
SEK Technicals 2
SEK Technicals 2
Recent data in Sweden has been negative: January unemployment rate has increased to 6.5%. Moreover, the monthly inflation rate comes in at -1%, surprising to the downside. USD/SEK rallied by more than 1% this week. We remain bearish on EUR/SEK since the SEK is currently trading at a discount to its long-term fair value. Moreover, there are many signs pointing to a Swedish economy rebound. The negative rate in the country and easy financial conditions could stimulate the domestic demand and if global growth perks up, the weak inflation readings will prove transitory. The Riksbank has already abandoned it pledge to suppress the krona and it will move this year to lift rates again. Report Links: Balance Of Payments Across The G10 - February 15, 2019 A Simple Attractiveness Ranking For Currencies - February 8, 2019 Global Liquidity Trends Support The Dollar, But... - January 25, 2019 Trades & Forecasts Forecast Summary Core Portfolio Tactical Trades Closed Trades