China

Highlights Please note that analysis on India is published below. Even if the recent upturn in the Chinese credit impulse is sustained, there will likely still be a six- to nine-month lag between the impulse’s trough and the bottom in the mainland’s business cycle. EM corporate earnings cycles typically lag Chinese stimulus efforts by about nine months. Therefore, EM profits will be contracting in the first three quarters of 2019. This will short-circuit the current rebound in EM share prices. EM equity valuations are not cheap enough to shield stocks from profit contraction. Feature China’s credit growth was very strong in January. We contend that even if the upturn in the credit impulse proves to be persistent, there will likely be a six- to nine-month lag between its low point and the bottom in the mainland’s business cycle. Chart I-1 demonstrates that the credit impulse leads both nominal manufacturing output growth and the manufacturing PMI’s import subcomponent by roughly nine months. Chinese imports are the most pertinent variable to gauge China’s economic impact on the rest of the world. Chart I-1China: Credit Impulse Leads Business Cycle By Nine Months
China: Credit Impulse Leads Business Cycle By Nine Months
China: Credit Impulse Leads Business Cycle By Nine Months
In the meantime, will financial markets exposed to Chinese growth look through the valley of the ongoing growth deceleration and continue to rally? Or will they experience a major relapse in the coming months? In our opinion, corporate profits will be the key to broader financial market performance. So long as corporate profits do not shrink, investors will likely look beyond weak macro data, and any weakness in stocks will be minor. However, if corporate profits contract in the next nine months, then share prices will plummet anew. EM Profits Are Heading Into Contraction Chart I-2 illustrates that China’s credit impulse leads both EM and Chinese corporate earnings per share (EPS) by at least nine months and that it currently foreshadows EPS contraction in the first three quarters of 2019. Even if the recent upturn in the credit impulse is sustained, EM and Chinese EPS growth will likely bottom only in August – while they are in negative territory. Chart I-2EM EPS Is Beginning To Contract
EM EPS Is Beginning To Contract
EM EPS Is Beginning To Contract
EM corporate earnings growth has already dropped to zero and will turn negative in 2019. Chart I-3A reveals that EPS in U.S. dollar terms are already contracting in six out of 10 sectors – industrials, consumer staples, consumer discretionary, telecom, utilities and health care. Chart I-3AEM EPS By Sector
EM EPS By Sector
EM EPS By Sector
Chart I-3BEM EPS By Sector
EM EPS By Sector
EM EPS By Sector
EPS growth has not yet turned negative for financials, technology, energy and materials (Chart I-3B). Notably, corporate earnings within these four sectors collectively account for 70% of EM total corporate earnings, as shown in Table I-1.
Chart I-
Over the course of 2019, these sectors’ EPS are also set to shrink: Technology (accounts for 20% of MSCI EM corporate earnings): NAND semiconductor prices have been plunging for some time, and DRAM prices are also beginning to drop (Chart I-4). This reflects broad-based weakness in global trade – global auto sales are shrinking for the first time since the 2008 global financial crisis, global semiconductor sales are relapsing and global mobile phones shipments are falling (Chart I-5). Chart I-4Semiconductor Prices Are Falling
Semiconductor Prices Are Falling
Semiconductor Prices Are Falling
Chart I-5Broad-Based Weakness In Global Trade
Broad-Based Weakness In Global Trade
Broad-Based Weakness In Global Trade
Semiconductors accounted for 77% of Samsung’s operating profits in the first three quarters of 2018, suggesting the potential drop in DRAM prices will be devastating for its profits. Next week we will publish a Special Report on Korea and discuss the outlook for both semiconductors and Korean profits in more detail. In addition, the ongoing contraction in Taiwanese exports of electronics parts confirms downside risks to EM tech earnings (please refer to top panel of Chart I-3B). In brief, the ongoing decline in semiconductor prices will bring about EPS contraction in the EM technology sector. Financials/Banks (financials make up 31% of EM corporate earnings): Banks’ profits often correlate with fluctuations in economic activity, because the latter drive non-performing loan (NPL) cycles (Chart I-6). NPL cycles outside Brazil, Russia and India – where the banking systems have already gone through substantial NPL recognition and provisioning – will deteriorate, and push banks to increase their provisions. The latter will be a major drag on EM banks’ profits. Chart I-6EM Banks EPS And Economic Activity
EM Banks EPS And Economic Activity
EM Banks EPS And Economic Activity
Regarding Chinese banks in particular, if the credit revival in January is sustained, it would strongly suggest that the government is resorting to its old, credit-driven growth playbook. Following 10 years of an enormous credit frenzy and a 20-year capital spending boom, it is currently difficult to find many financially viable projects. Hence, a renewed credit binge will once again be associated with further capital misallocation and more NPLs. Many of these projects will fail to generate sufficient cash flow to service debt. NPLs will thus rise considerably and the need to raise capital will dilute the banks’ existing shareholders. Of course, this will happen with a time lag. Chart I-7 shows that the gap between Chinese banks’ EPS and non-diluted profits has once again widened, and that EPS are beginning to contract. Chart I-7Chinese Banks: Earnings Dilution
Chinese Banks: Earnings Dilution
Chinese Banks: Earnings Dilution
Chinese banks could issue perpetual bonds – discussed in great detail in last week’s report – to recapitalize themselves. Nevertheless, this will be negative for existing shareholders. In a nutshell, despite low multiples, share prices of Chinese banks will drop because more credit expansion amid the lingering credit bubble is negative for existing shareholders. The basis is that it will ultimately lead to their dilution. Chinese banks make up 4.5% of the MSCI’s EM equity market cap and 10% of aggregate EM profits. Hence, their EPS contraction will have a non-trivial impact on overall EM EPS. Resource sectors (energy and materials together make 20% of EM corporate earnings): The ongoing slowdown in China will exert renewed selling pressure in commodities markets. As shown in Chart I-9 on page 8, base metals prices lag the turning points in the Chinese credit impulse by several months and are still at risk of renewed price decline. Hence, profits of firms in the materials sector are at risk. Energy companies’ trailing EPS growth is still positive because the late-2018 carnage in oil prices has not yet filtered through to corporate earnings announcements (Chart I-3B on page 3). More importantly, the recent oil price rebound can be attributed to both Saudi Arabia’s output cuts as well as stronger demand – in the form of a surge in Chinese imports of oil and petroleum products. Chart I-8 illustrates that growth rates of China’s intake of oil and related products approached zero when crude prices were rising but has dramatically accelerated following their plunge. This is consistent with China’s pattern of buying commodities on dips. The point is that the upside in oil prices will be capped by China, which will likely moderate its oil purchases going forward, as crude prices have recently rallied. Chart I-8China And Oil
bca.ems_wr_2019_02_21_s1_c8
bca.ems_wr_2019_02_21_s1_c8
Bottom Line: EM profit cycles lag Chinese’s stimulus by about nine months. EM profits will be contracting in the first three quarters of 2019. This will short-circuit the current rebound in EM share prices. China’s Credit Cycles And Financial Markets What has been the relationship between China’s credit cycle and related financial markets over the past 10 years? The time lag between turning points in China’s credit impulse and relevant financial markets can be anywhere from zero to 18 months. Chart I-9 illustrates historical time lags between the Chinese credit impulse on the one hand and EM share prices, base metals prices and the global manufacturing PMI on the other. The time lag has not been consistent over time. Chart I-9Chinese Credit Impulse And Financial Markets: Understanding Time Lags
Chinese Credit Impulse And Financial Markets: Understanding Time Lags
Chinese Credit Impulse And Financial Markets: Understanding Time Lags
In late 2015-early 2016, the rebound in China’s credit impulse led financial markets by six months. At the recent market peak in January 2018, the credit impulse led financial markets and the global manufacturing PMI by about 18 months. In the meantime, in the 2012-13 mini cycle, EM share prices and commodities markets did not rally much, despite the meaningful upturn in China’s credit impulse. Finally, at the 2010-2011 peak, the credit impulse led EM stocks and base metals prices by 12 months. In short, the credit impulse led those financial markets by a few months to as much as a year and a half. Further, not only do time lags to the stimulus vary, but the impact on both economic activity and financial markets varies as well. This is because both economic activity and financial markets are driven by human psychology and behavior; iterations in stimulus, economic activity and financial markets are chaotic and complex in nature and do not follow well-defined patterns. Given the poor state of sentiment among Chinese consumers, business managers and entrepreneurs, more stimulus and more time may be required to turn the mainland’s business cycle this time around. Besides, unlike in previous episodes, there has not been any stimulus for the property market and no tax reductions on auto sales. Finally, although China and the U.S. may strike a deal on trade, it is unlikely to be a comprehensive agreement that is sustainable in the long run. This would be consistent with our Geopolitical Strategy team’s view that China and the U.S. are in a long-term and broad geopolitical confrontation – not a trade war. The trade war and tariffs are just one dimension of this. Hence, Chinese consumers and businesses, as well as the global business community may well look through this potential deal and not significantly alter their cautious behavior, at least for some time. In other words, the genie of geopolitical confrontation is out of the bottle, and the presidents of the U.S. and China are unlikely to succeed in putting it back. Bottom Line: Turning points in China’s credit impulse generally lead financial markets exposed to Chinese growth by several months. Given that the improvement in the credit impulse is both very recent and modest, odds are that China-related plays including EM risk assets will go through a major selloff before putting in a durable bottom.1 EM Equity Valuations In terms of the ability of EM stocks to withstand profit contraction, would cheap valuations not shield share prices from a considerable drop? We do not think EM equities are cheap; their valuations are neutral. Hence, there is no real valuation cushion in EM stocks to help them endure a period of negative EPS growth. We have written frequently about valuations and will touch on the topic only briefly here. Market cap-based multiples indeed appear very low. However, some segments of the EM universe such as Chinese banks and state-owned companies in Russia, Brazil, China and India have had low multiples for years. In other words, they are a value trap and their multiples are low for a reason. We elaborated above why Chinese banks are chronically “cheap”. For many other companies, low multiples are due to structural issues such as the lack of focus on profitability and shareholder value, or the high cyclicality of profits. Many of these stocks have large market caps, which pull down the EM index’s aggregate multiple. To remove market-cap bias, we have calculated 20% trimmed-mean multiples by ranking 50 MSCI EM industry groups (sub-sectors) and cutting off the top and bottom 10%. Then, we calculate the equal-weighted average of the remaining 80% of the sub-sectors. We did this calculation for the following five ratios: trailing P/E, forward P/E, price-to-cash earnings, price-to-book value and price-to-dividend. Then, we combined them into a composite valuation indicator (Chart I-10, top panel). This indicator shows that EM equity valuations are neutral. Chart I-10EM Equity Valuations In Absolute Terms
bca.ems_wr_2019_02_21_s1_c10
bca.ems_wr_2019_02_21_s1_c10
In addition, we calculated the median and equal-weighted composite valuation indicators (Chart I-10, middle and bottom panels). They also remove market cap bias and tell the same message: EM stocks are trading close to their fair value. EM equities are also close to their historical average relative to developed markets (DM). Chart I-11 illustrates relative EM versus DM valuation indicators based on 20%-trimmed mean, median and equal-weighted metrics. Chart I-11EM Equity Valuations Versus DM
bca.ems_wr_2019_02_21_s1_c11
bca.ems_wr_2019_02_21_s1_c11
In sum, EM valuations are not cheap neither in absolute terms, nor relative to DM. According to both measures, valuations are neutral. Hence, valuations will not prevent share prices from falling as profits begin to contract. This is why we continue to recommend a defensive strategy for absolute-return investors, and we continue to underweight EM versus DM within a global equity portfolio. Arthur Budaghyan, Senior Vice President Emerging Markets Strategy arthurb@bcaresearch.com India: Beware Of Rural Growth Lapse Indian share prices are weak and are underperforming the emerging markets benchmark in U.S. dollar terms (Chart II-1, top panel). Small cap stocks are in a full-fledged bear market (Chart II-1, bottom panel). Chart II-1Indian Stocks Are Weak
Indian Stocks Are Weak
Indian Stocks Are Weak
The latest earnings season turned out to be disappointing. Many companies missed their earnings estimates. Chart II-2 shows that net profit margins of listed non-financial companies have turned down and overall EPS growth is weakening. Chart II-2Indian Corporate Profits Are Sluggish
Indian Corporate Profits Are Sluggish
Indian Corporate Profits Are Sluggish
Disappointing corporate earnings are confirmed by macro data as well. Chart II-3A shows that manufacturing production is decelerating and intermediate goods production is contracting. Further, sales of two-wheelers, three-wheelers, passenger and commercial vehicles, as well as tractors, are either slowing or contracting (Chart II-3B). Chart II-3ACyclical Spending Is Decelerating
Cyclical Spending Is Decelerating
Cyclical Spending Is Decelerating
Chart II-3BCyclical Spending Is Decelerating
Cyclical Spending Is Decelerating
Cyclical Spending Is Decelerating
This weakness emanates from rural areas. The basis is that food prices have been falling since the summer of 2018 – and are deflating for the first time since the early 2000s. This is hurting rural incomes. Several indicators confirm considerable weakness in rural income growth and the latter’s underperformance versus urban income and spending: The top panel of Chart II-4 illustrates that our proxy for spending in rural areas relative to urban areas has deteriorated massively along with the decline in Indian food prices. Chart II-4Rural Spending Is Weaker Than Urban One
Rural Spending Is Weaker Than Urban One
Rural Spending Is Weaker Than Urban One
This measure is calculated as revenue growth of four rural-exposed listed companies minus the revenue growth of four urban-exposed listed companies. In both cases, the companies largely operate in the consumer goods space. Credit growth in rural areas has lagged that of urban areas, explaining the underperformance of rural spending (Chart II-4, bottom panel). Corroborating this, stock prices of these urban-exposed companies have outperformed their rural peers substantially (Chart II-5). Chart II-5Urban-Exposed Stocks Have Outperformed Rural Ones
Urban-Exposed Stocks Have Outperformed Rural Ones
Urban-Exposed Stocks Have Outperformed Rural Ones
Such a slump in rural income is posing a challenge to Modi’s re-election in May. His government – which lost three key state elections in late 2018 – is aware of these ominous trends and is acting boldly to revive income growth in rural areas. The government announced an expansionary budget that appeases rural voters. In particular, the budget aims to strengthen farmers’ support schemes, cut taxes for low- and middle-income earners and introduce a pension scheme for social security coverage of unorganized labor. However, there is a significant risk that the authorities’ fiscal and monetary stimulus are too late to lift growth before May’s elections. According to the past relationship between fiscal spending and India’s business cycle, higher government expenditure growth will only begin to have an effect on the economy in the second half of this year – i.e. after the elections are held (Chart II-6). Hence, the BJP could lose its majority, meaning it would either rule in a minority government or be forced to turn over power to the Congress Party and its allies. Chart II-6Government Expenditures To Lift Growth In H2 2019
Government Expenditures To Lift Growth In H2 2019
Government Expenditures To Lift Growth In H2 2019
Beyond the elections, food prices might be approaching their lows. Well-below average rain will likely result in weak agricultural production and, hence, higher food prices in the second half of 2019 (Chart II-7). Chart II-7Below Trend Monsoon = Food Prices Will Likely Rise
Below Trend Monsoon = Food Prices Will Likely Rise
Below Trend Monsoon = Food Prices Will Likely Rise
Therefore, in the second half of 2019, both fiscal easing and higher food prices will revive rural incomes and spending. In the meantime, monetary easing and credit growth acceleration will support demand in urban areas. Overall, Indian financial markets will likely remain in a risk zone until the elections as economic growth and corporate profits will continue to disappoint. If the opposition Congress Party’s alliance wins the election, Indian stocks and the currency will initially sell off. After this point, Indian assets could offer a buying opportunity because growth will likely revive in the second half of 2019. Bottom Line: For now, we continue to recommend an underweight position in Indian equities relative to the EM equity benchmark. Weakening growth, the very low interest rate differential versus U.S. rates and political uncertainty ahead of the general elections, pose risks of renewed rupee depreciation. A weaker rupee will continue to benefit India’s export-oriented software companies. Therefore, we also reiterate our long Indian software / short EM stocks recommendation. Finally, fixed-income investors should stay with the yield curve steepening trade. The central bank could further cut rates in the near term. However, long-term bond yields will not fall substantially and will likely start drifting higher sooner than later. The widening fiscal deficit, expectations of growth revival in the second half of 2019, and eventually higher food prices and inflation expectations, will all lead to a continuous steepening in the local yield curve. Ayman Kawtharani, Associate Editor ayman@bcaresearch.com Footnotes 1 This is the view of BCA’s Emerging Markets Strategy team and it is different from BCA’s house view on China-related assets and the global business cycle. The primary source of the difference is the outlook for China’s growth. Equity Recommendations Fixed-Income, Credit And Currency Recommendations
Our Geopolitical Strategy service examines the relationship between Chinese credit and MSCI equity returns of various countries. We find that Malaysian, Australian, South Korean, and Indonesian equities are the most highly correlated with Chinese…
The latest news flow is mildly positive for the odds of getting a framework deal sometime this year. President Trump visited the Chinese negotiators in Washington, while President Xi reciprocated with the American negotiators in Beijing. Trump has signaled…
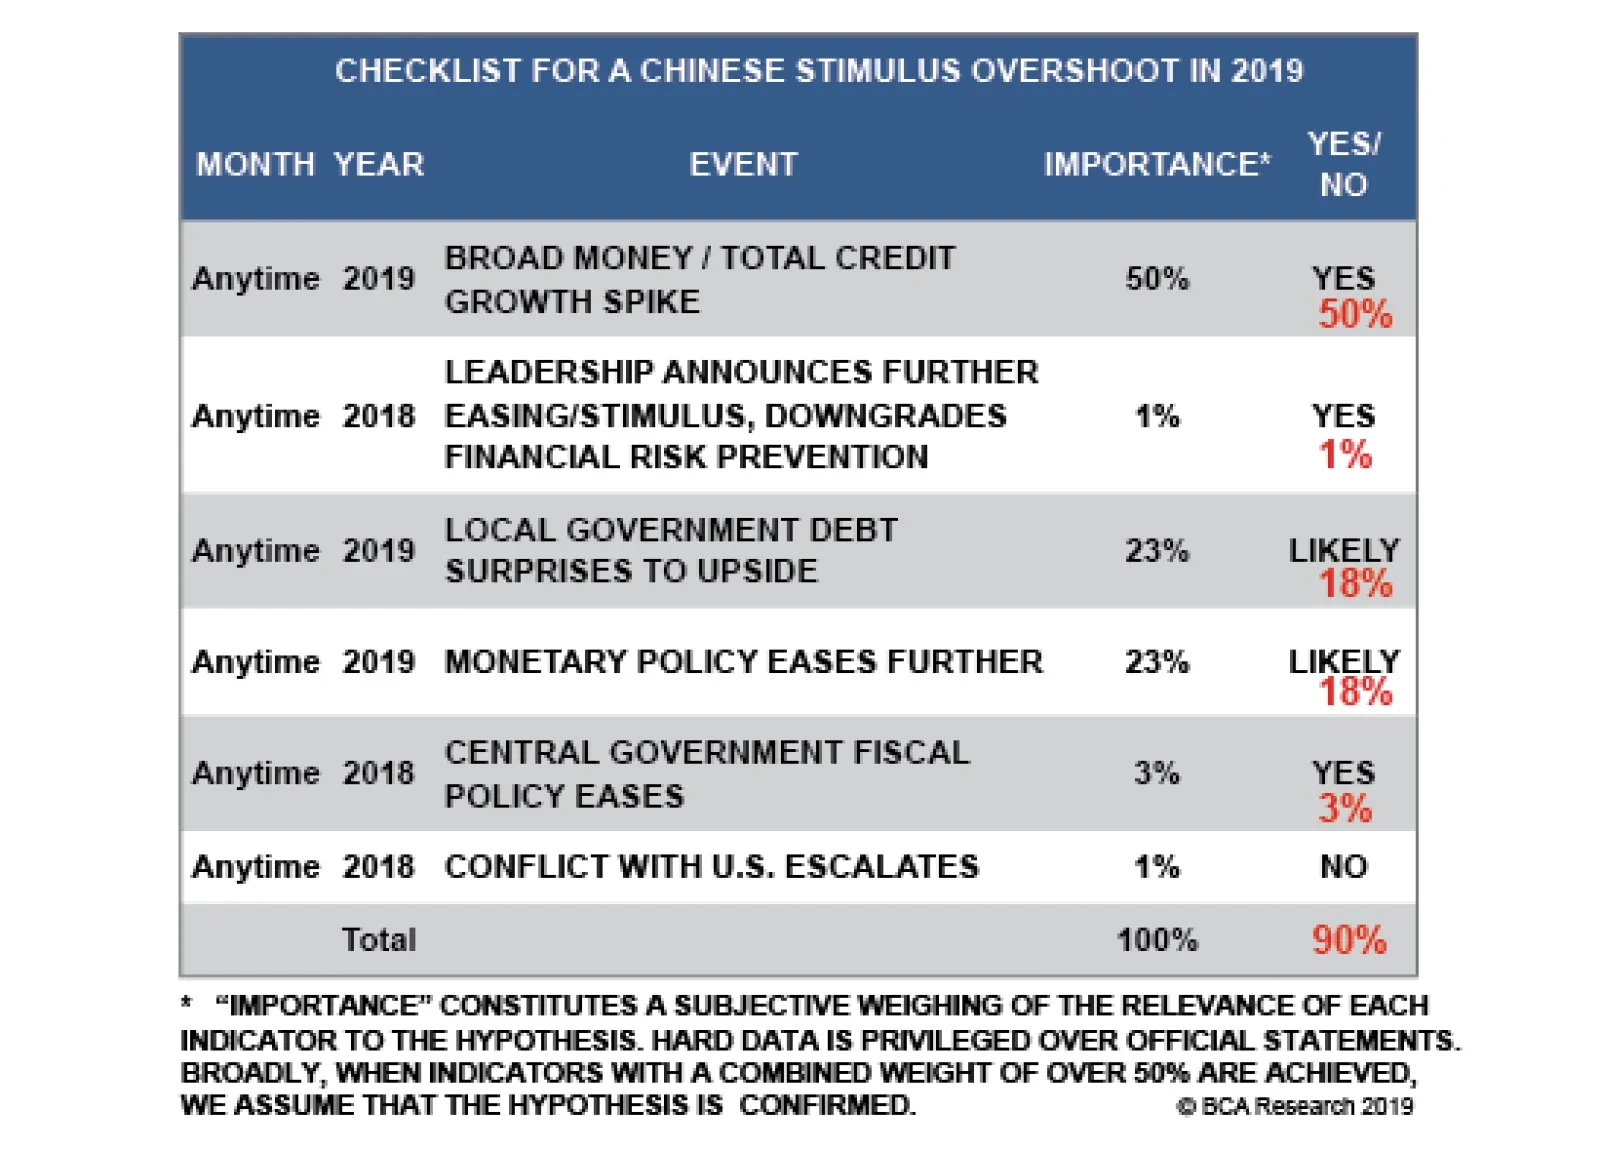
A spike in new credit is the single most important criterion in our “Checklist For A Stimulus Overshoot.” From a policy perspective, we are now at higher risk of an overshoot. Both informal lending and overall credit saw a surge in January, implying that the…
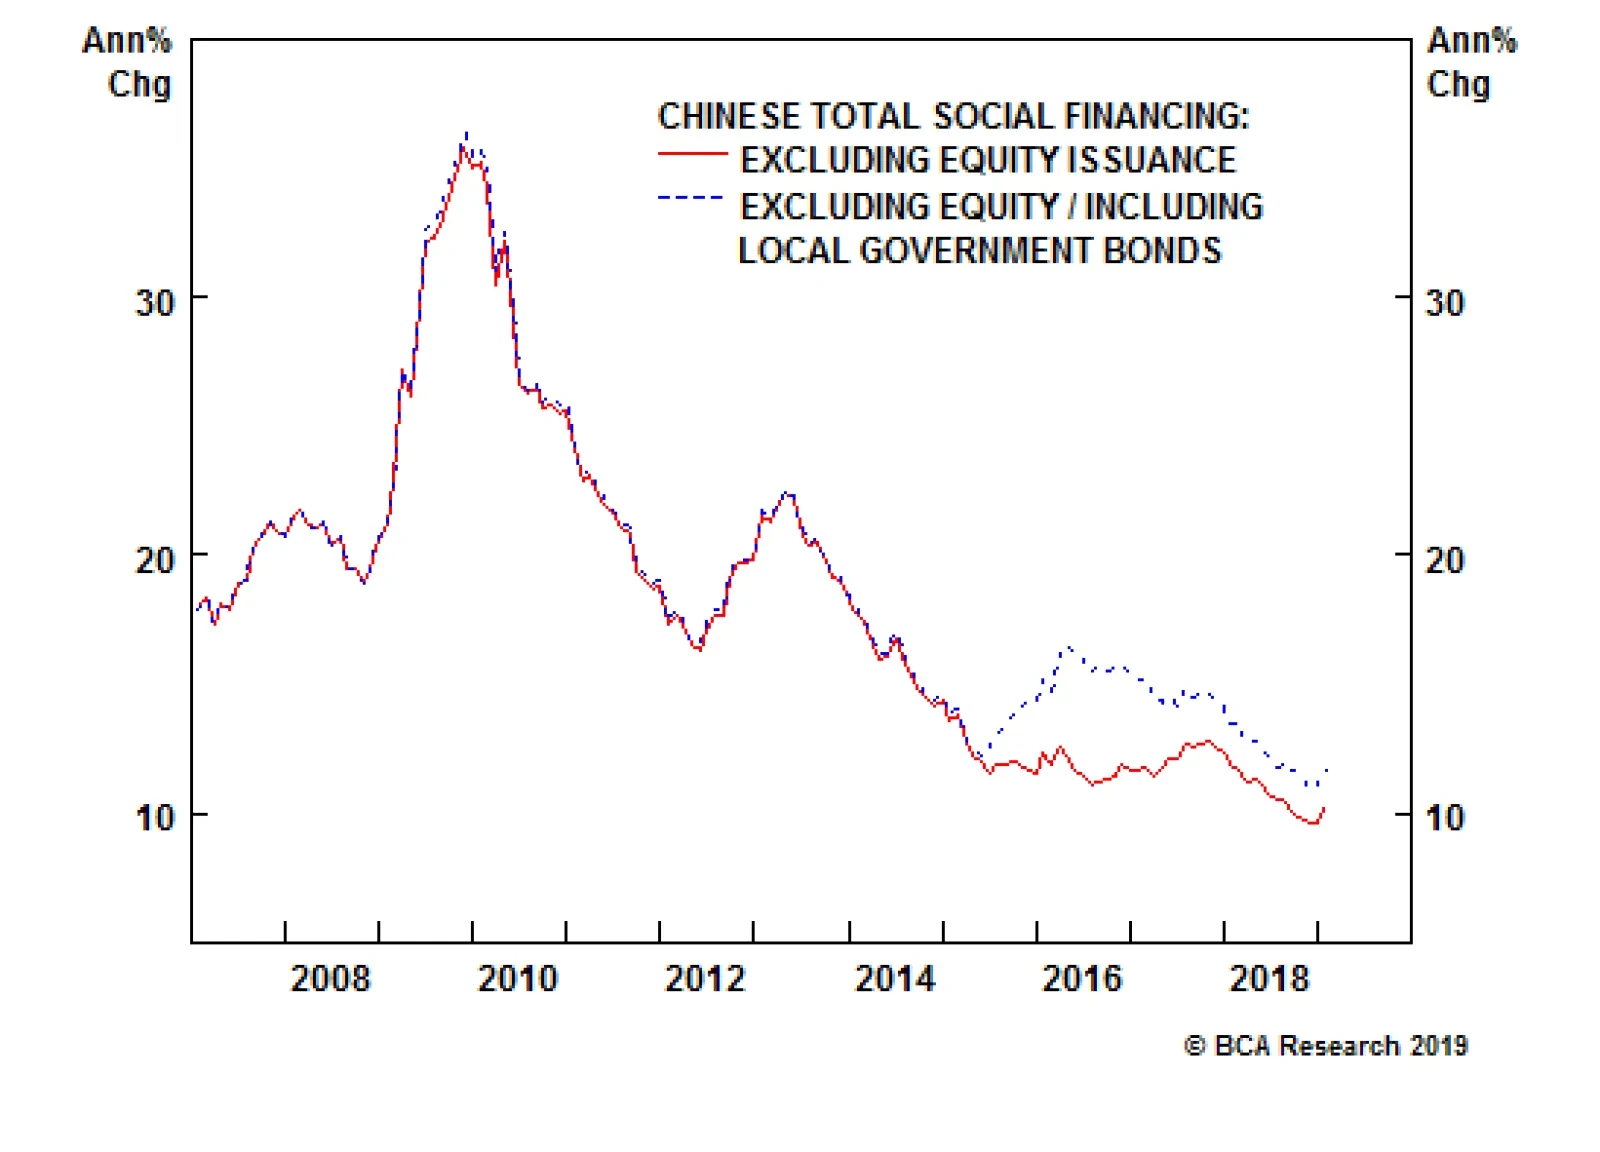
Highlights So What? China’s January credit data suggest that stimulus is here. Why? January credit growth was a blowout number. Trade uncertainty is likely to be prolonged with an extension of talks. Equity bourses in South Korea and Russia are the most likely to benefit from Chinese stimulus. Industrial metals such as copper will also benefit – with a delay. Feature New credit data for China in January improves the chances that Beijing’s stimulus measures will overshoot this year, causing China’s economy to bottom in 2019 and jumpstart global growth. In our annual outlook for this year we argued that while China was stimulating the economy, the magnitude of stimulus would be the decisive factor for the global macro environment in 2019. We argued that the type of stimulus would remain primarily fiscal – tax cuts for households and small and medium-sized enterprises – and hence that it would be modest as fiscal easing would merely offset relatively weak credit growth. This view stemmed from our assessment of the Xi Jinping administration, highlighted in April 2017, as an “elitist” (not populist) administration. Its policy priorities are to discipline the Chinese economy, and in particular to contain systemic financial risk, which President Xi has cited as a national security threat. This view is not wrong, but the latest data clearly show that Xi has decided to pause these painful efforts at limiting leverage and rebalancing China’s economy. Witness January’s decisive uptick in both total social financing (total private credit) and local government bond issuance (Chart 1). Chart 1Higher Risk Of An Overshoot
Higher Risk Of An Overshoot
Higher Risk Of An Overshoot
A massive spike in new credit is the single most important criterion in our “Checklist For A Stimulus Overshoot.” Thus, from a policy perspective, we are now at higher risk of an overshoot (Table 1). Not only credit as a whole but also informal lending saw a surge in January, implying that the government is relenting in its crackdown on the shadow banks. The approval of local government bond issuance for early in the year – and the People’s Bank of China’s announcement of a “Central Bank Bills Swap” program – reinforce this policy shift.1 Table 1Checklist For A Chinese Stimulus Overshoot In 2019
China: Stimulating Amid The Trade Talks
China: Stimulating Amid The Trade Talks
A stimulus overshoot is positive for Chinese demand in the short run but negative for potential GDP in the long run. A “traditional” credit surge of this nature cannot be surgically targeted at SMEs or households. It will go to state-owned enterprises, privileged corporations, property developers, and the like, which have always had the advantage in China’s financial system. SOEs have taken a much larger share of new loans than private companies in recent years,2 and the only silver lining of this trend was the possibility that tighter credit controls would discipline the SOEs. That silver lining is now fading, barring some new and surprising development on the reform front. China needs to create 26 trillion renminbi in new credit over the course of the year to avoid a corporate earnings contraction. These January numbers put China on track to do just that (Chart 2), assuming that President Xi and U.S. President Donald Trump agree to a short-term, framework trade deal this year. Chart 2On Track To Avoid An Earnings Contraction
On Track To Avoid An Earnings Contraction
On Track To Avoid An Earnings Contraction
Of course, a few caveats are in order. First, January’s credit number is only one data point and credit growth is always abnormally strong in the first month of the year. Early in the year, banks seek to expand their assets rapidly in a bid to get as much market share as possible before administrative credit quotas kick in. Because of Chinese New Year, it is best to combine January and February data to get a sense of the rate of credit expansion in the first part of the year. To do that, investors will have to wait for mid-March when the February data is out. This year’s January numbers are very strong relative to previous Januaries (Chart 3) and the context is more accommodative than the 2017 January credit surge, when authorities were beginning to tighten rather than ease macroprudential policy. Still a rapid rate of credit expansion will have to be sustained in the coming months in order to meet the 26 trillion RMB requirement highlighted above.
Chart 3
Second, there is some risk that China’s households and private businesses will not respond as positively today as in the past. The intensification of Communist Party control over the society and economy, President Xi’s cancellation of term limits, and the strategic confrontation with the United States have created a bearish sentiment in the private sector. Our Emerging Markets Strategy would point out that if the propensity to consume, and money velocity,3 do not accelerate, then a surge in new credit may fail to ignite a reacceleration in China (Chart 4). Chart 4Chinese Are Holding On To Their Money
Chinese Are Holding On To Their Money
Chinese Are Holding On To Their Money
Still, what we now know is that Xi Jinping and his top economic adviser, Vice Premier Liu He, are not initiating the “assault phase of reform” that their predecessors initiated in the late 1990s in order to cleanse China’s economy of bad loans and zombie companies. Instead, they are likely reestablishing the “Socialist Put” in order to reverse the current deceleration, demonstrate China’s continued economic might and face down the United States’ threat of tariffs. Bottom Line: China’s stimulus measures are increasingly likely to overshoot, with positive implications for both Chinese and global growth. China is still facing a corporate earnings recession, but the odds of averting it are increasing. Trade Deadline More Likely To Be Extended What of the trade war? First, we would warn clients that China’s annual credit origination is a much bigger factor for the global economy than China’s exports to the United States (Chart 5). The trade war can escalate from here and yet, if China’s stimulus works as it has in the past, the results will be manageable for China’s economy save for Chinese companies expressly exposed to the U.S. economy through exports. In reality, both the U.S. and China are now effectively stimulating their economies and in this sense global trade as a whole will benefit regardless of bilateral tariffs. Chart 5Watch China Credit, Not So Much The Trade War
Watch China Credit, Not So Much The Trade War
Watch China Credit, Not So Much The Trade War
But it is possible that just as global equity markets ignored China’s economic slowdown and only sold off when the tariffs were levied (Chart 6), they may not continue to rally much on China’s credit data. Given the already considerable rally in global risk assets since October, markets may not be satisfied merely with one or two months of solid credit data out of China without a clear resolution to the trade conflict. After all, if a collapse in U.S.-China trade talks portends a new Cold War, then institutional investors may be justified in taking a wait-and-see approach despite China’s credit cycle upswing. Chart 6Will Equities Ignore China Data (Again)?
Will Equities Ignore China Data (Again)?
Will Equities Ignore China Data (Again)?
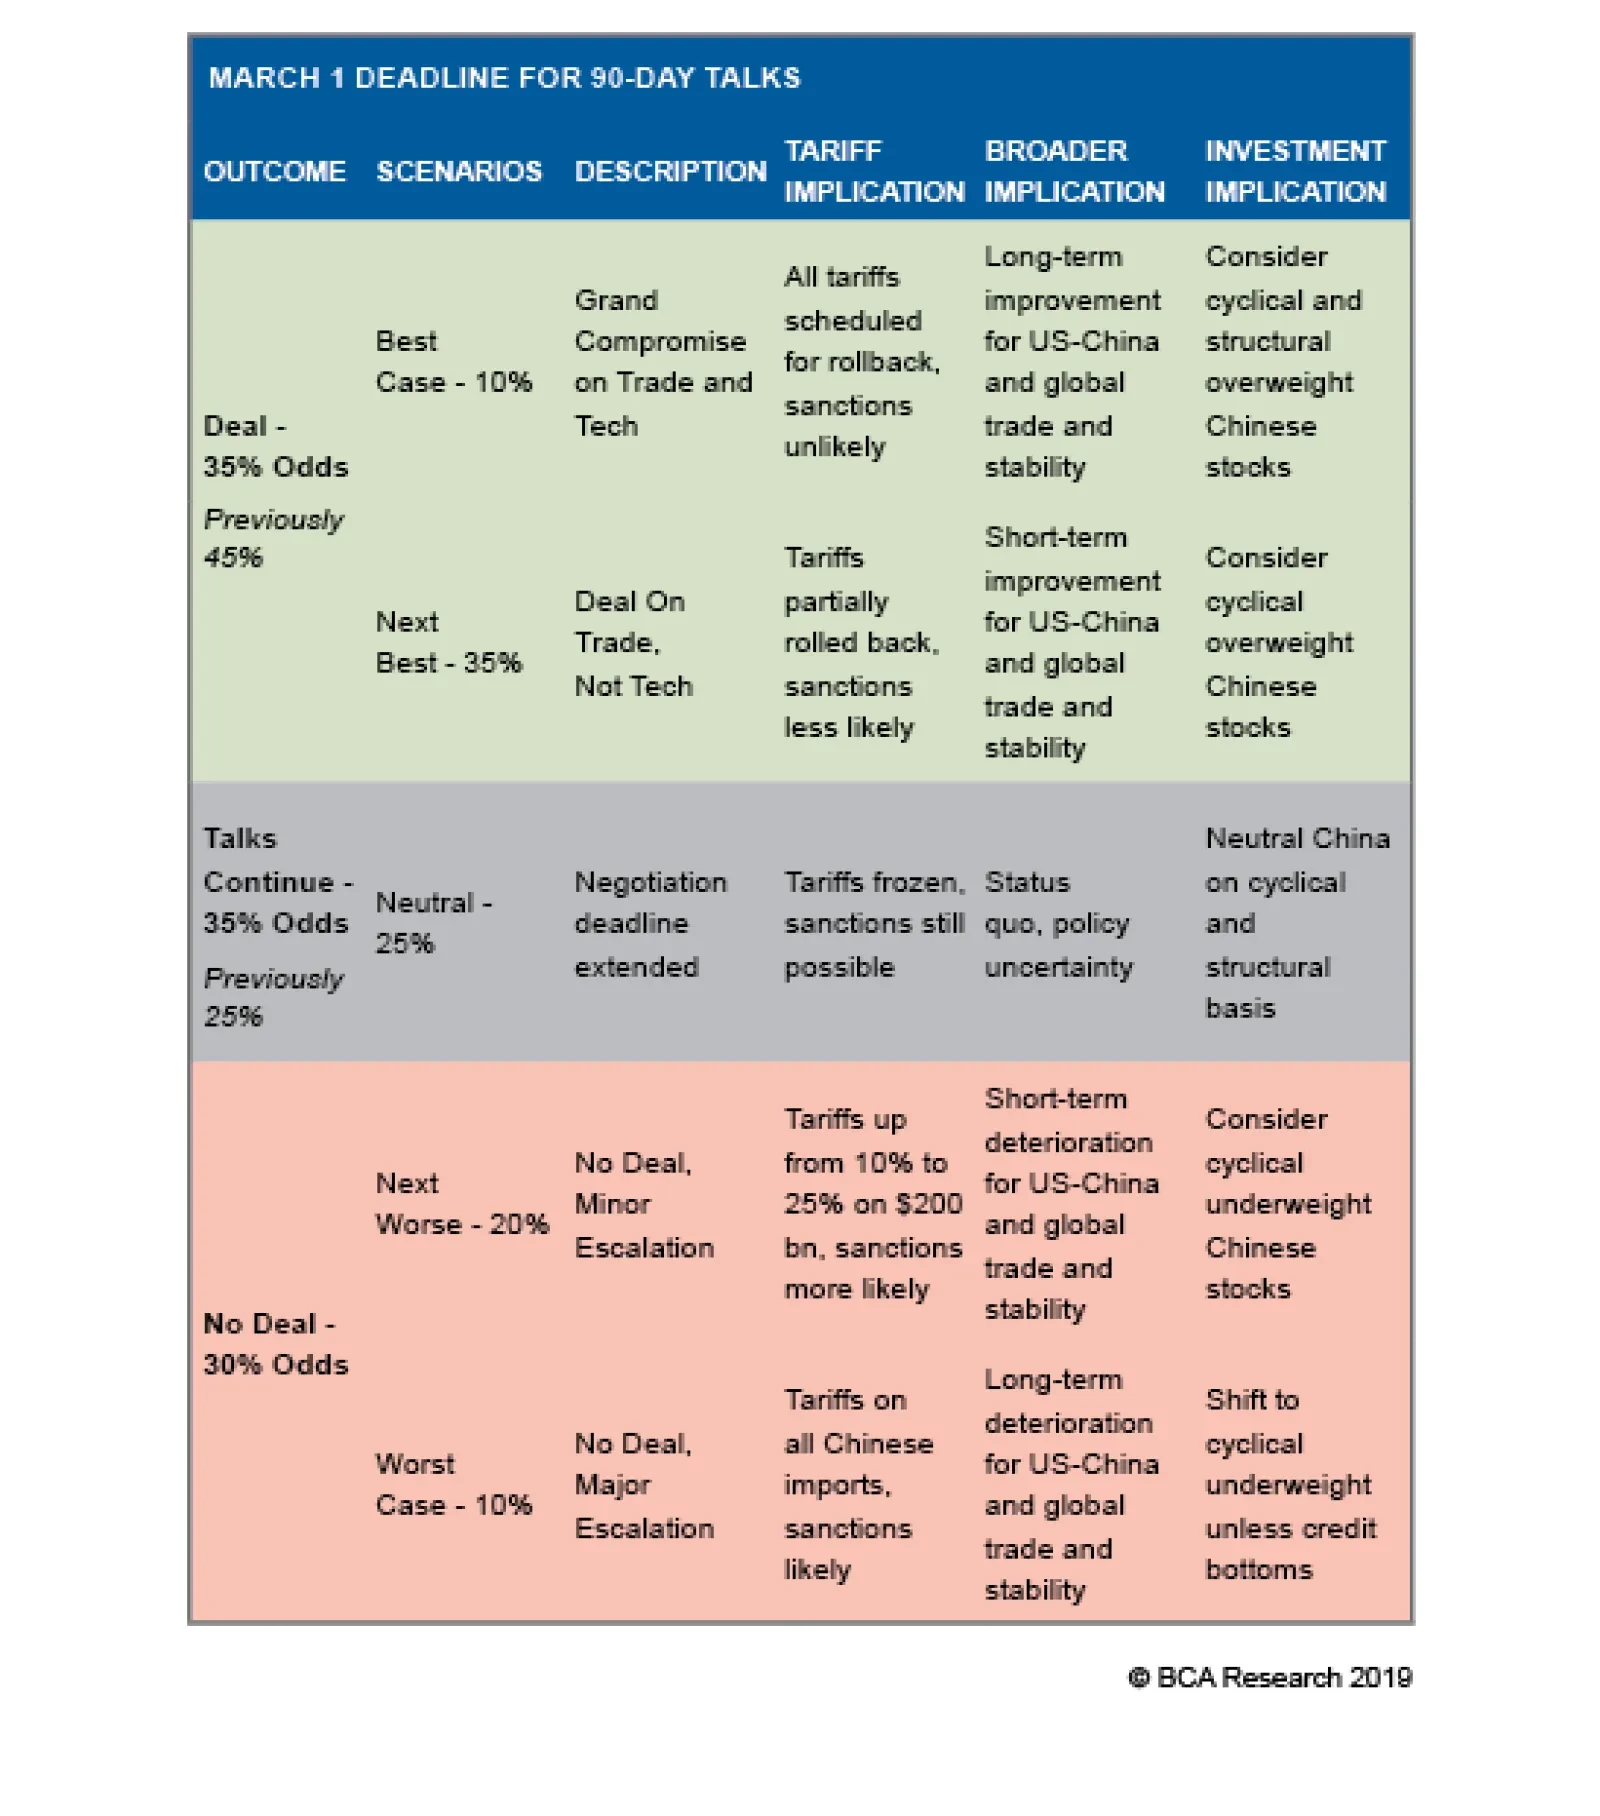
In the past, we have highlighted that the U.S. and China are not economically prohibited from engaging in a trade war – the export exposure is too small – and China’s new stimulus reinforces this point. However, President Trump is concerned about causing a sell-off in the tech sector and hence the broad equity market which could translate into a bear market and raise the probability of a recession occurring prior to November 2020. Meanwhile, in China, given Beijing’s reported trade concessions, there is apparently a desire to pacify the relationship and discourage U.S. unilateral tariffs and sanctions that could become seriously destabilizing for the Chinese economy and society. The need to have a happy 2021 centenary celebration for the Communist Party may factor into policymakers’ thinking. The latest news flow is mildly positive for the odds of getting a framework deal sometime this year. President Trump visited the Chinese negotiators in Washington, D.C. while President Xi reciprocated with the American negotiators in Beijing. Trump has signaled that an extension of the March 1 deadline is possible, and a two-month extension is being bandied about in the press. China’s National People’s Congress is likely to pass a new Foreign Investment Law that ostensibly guarantees many of the American demands on forced tech transfer, intellectual property theft, and discriminatory treatment of U.S. companies (Table 2). Even the second Trump summit with Kim Jong Un, this time in Vietnam, should be seen as a mild positive for U.S.-China negotiations. Table 2New Foreign Investment Law Would Be A Positive For U.S.-China Negotiations
China: Stimulating Amid The Trade Talks
China: Stimulating Amid The Trade Talks
However, Presidents Trump and Xi have yet to schedule a new summit, which is probably necessary for a final deal. And there are murmurs from the press suggesting that China’s new law and other concessions are not going to satisfy the U.S. negotiators on the critical point of “structural changes” and a verification process. This leaves us inclined to change our trade war probabilities to increase the odds of an extension (Table 3). The improvement in U.S. financial conditions and China’s stimulus, if anything, make it more likely that negotiations will be extended, as both sides feel their economic and financial constraints less acutely. Table 3Updated Trade War Probabilities
China: Stimulating Amid The Trade Talks
China: Stimulating Amid The Trade Talks
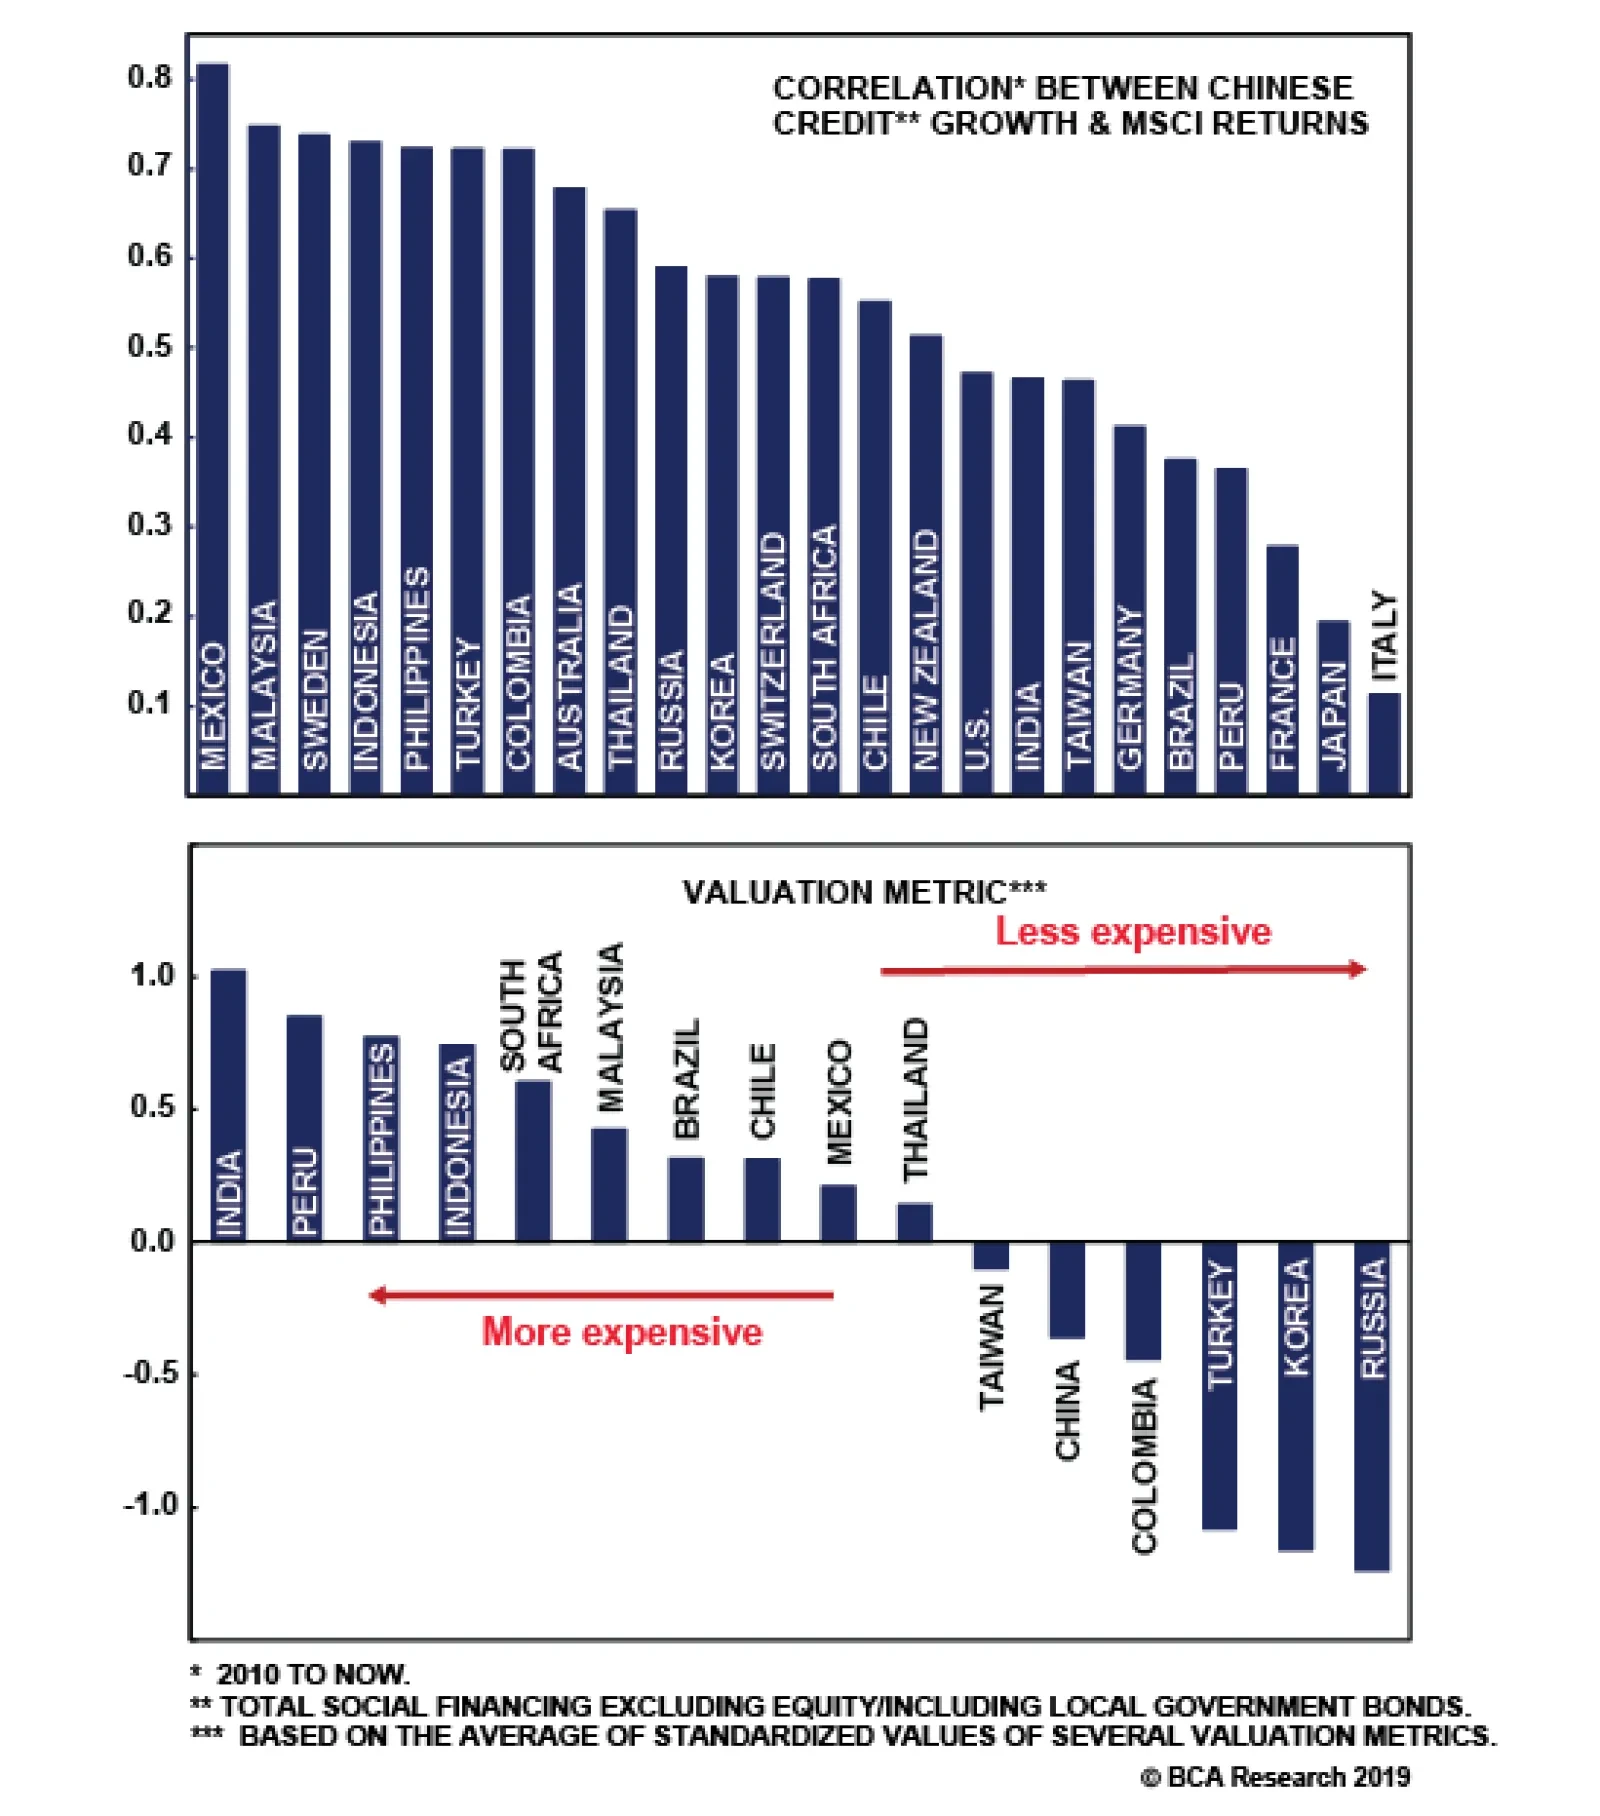
Bottom Line: Global and Chinese risk assets should rally on China’s credit uptick, but the lack of resolution of the trade war could continue to inhibit animal spirits – and the odds of a March 1 resolution are declining. Who Are The Equity Winners Of China’s Stimulus? China’s strong January credit number is supportive of global equity markets. That much is obvious. But which equity markets will benefit the most? In what follows we examine the relationship between Chinese credit and MSCI equity returns of various countries. We find that Malaysian, Australian, South Korean, and Indonesian equities are the most highly correlated with Chinese credit growth and are thus most likely to benefit from the recent upturn (Chart 7). On the other hand, France and Italy stand out as countries whose bourses are more insulated.
Chart 7
Out of the markets that are positively correlated, South Korea and Russia stand out as relatively cheap (Chart 8). Thus we expect these equities to do especially well. By contrast, while Indonesia and the Philippines are highly leveraged to China, these markets are currently relatively expensive. BCA’s Emerging Markets Strategy is currently overweight Korean and Russian equities within the EM space, neutral Turkey (although recently upgraded from underweight), and underweight Indonesia and the Philippines.
Chart 8
In addition to credit stimulus, we expect Chinese household consumption to also gain support going forward. This will likely be driven by policy stimulus targeting the consumer specifically and is best exemplified by the recently announced tax cuts (Chart 9), which we expect to trickle down to greater consumer demand and growth in retail sales. Our base case calls for 8%-10% growth in household consumption over the coming 12 months, up from the current 3.5%.
Chart 9
However, consumer sentiment in China is weak. BCA’s Emerging Markets Strategy’s proxy for household marginal propensity to spend ticked up recently, after falling since early last year (see Chart 4 above). A resumption in the decline would highlight that households are increasingly unwilling to spend, which would translate into weaker retail sales despite policy efforts to boost consumption. Such a scenario – in which credit growth accelerates without a substantial uptick in consumer spending – is plausible, given that it occurred between mid-2015 and mid-2016 (Chart 10). In any case, whether Chinese stimulus comes in the form of the traditional credit channel, or instead in the form of fiscal stimulus to household consumption, the same equity markets will generally benefit the most (Chart 11). Chart 10...But Flattish Retail Sales Are Also A Possibility
...But Flattish Retail Sales Are Also A Possibility
...But Flattish Retail Sales Are Also A Possibility
Chart 11
Indeed, global equity markets react the same way regardless of the type of stimulus implemented. For instance, MSCI returns for the Philippines, Sweden, Malaysia, Indonesia, and Turkey are more closely correlated to both Chinese credit growth and retail sales growth compared to Italy, Japan, and France. The same conclusion is reached when we look at the correlations between Chinese credit growth or consumption growth and individual MSCI sectors such as industrials and consumer discretionary (Chart 12).
Chart 12
The relatively stronger correlation between Chinese credit growth and equity returns – as opposed to Chinese retail sales and equity returns – can be put down to the nature of Chinese imports. While industrial goods account for the bulk of China’s purchases of foreign goods, consumer goods excluding autos make up only 15% of China’s imports (Table 4). However, as Chart 12 illustrates, the relationship between China’s retail sales growth and global equities is much tighter in the case of the consumer discretionary sector, whether the latter is compared to global industrials sectors or the overall MSCI index. Table 4Import Composition Of Chinese Imports
China: Stimulating Amid The Trade Talks
China: Stimulating Amid The Trade Talks
Equity market exposure to China is not always in line with the extent of each country’s trade exposure to China (Chart 13).
Chart 13
There are some clear exceptions – most notably Mexico, which has the highest correlation coefficient with Chinese credit and consumption variables since 2010. However, this is likely due to idiosyncratic factors.4 Correlation does not imply causation, and we cannot conclude with certainty that Mexican equities will outperform amid China’s new round of stimulus. Nevertheless, given that Mexico is a very deeply liquid market that benefits amid EM bull markets, this may not be entirely coincidental. The correlations between global equity markets and Chinese credit peak two months after the stimulus measures are first implemented (Chart 14). This is more or less in line with adjusted total social financing’s correlation versus industrial metals. However BCA’s Commodity & Energy Strategy has shown that copper’s correlations versus other measures of Chinese money and credit peak after roughly three quarters (Chart 15).5 This is evident in both the 2012 and 2015-16 stimulus episodes in which the bottom in copper prices lagged the bottom in China’s credit growth. Thus we may witness a rebound in equity markets on the back of China’s credit splurge before we see an improvement in annual returns on copper prices.
Chart 14
Chart 15Copper Rallies Lag China Credit Stimulus
Copper Rallies Lag China Credit Stimulus
Copper Rallies Lag China Credit Stimulus
Bottom Line: South Korean and Russian equities are best positioned to benefit from the positive surprise in China’s credit data. France and Italy are the worst positioned. Copper prices will rebound with a delay. Investment Implications BCA’s Geopolitical Strategy recommends that investors stay long Chinese equities ex-tech relative to the emerging market benchmark. This is a tactical call initiated in August 2018 that is now becoming a cyclical call on the basis of the credit upswing. We also remain long the “China Play Index,” a basket of China-sensitive assets, and long China’s “Big Five” banks relative to other banks. A rebound in China’s credit data and stronger global growth will support copper demand. Prices are still 15% below the mid-2018 peak and are poised to benefit in this environment, especially given that global inventories are already falling. BCA’s Geopolitical Strategy recommends that investors go long copper. Meanwhile, BCA’s China Investment Strategy recommends (for now) staying only tactically overweight Chinese equities relative to the global benchmark, pending higher conviction that the pace of credit growth will be strong enough to overwhelm the negative ramifications of a continued deceleration in actual activity over the coming few months on sentiment and 12-month forward earnings expectations. Over the long run, Geopolitical Strategy would look to underweight Chinese equities, as we are not optimistic about China’s productivity and potential GDP. This is because of the negative structural consequences of continuing the Socialist Put (i.e., bad loans, zombie companies, trade protectionism). We would expect CNY/USD to remain relatively buoyant in the context of both trade negotiations with the U.S. and fiscal-and-credit stimulus. The trade talks can hardly succeed if CNY/USD is falling. Depending on whether and how soon China’s stimulus results in a durable economic bottom, global growth could stabilize and the USD could see a substantial countertrend selloff. Matt Gertken, Vice President Geopolitical Strategy mattg@bcaresearch.com Roukaya Ibrahim, Editor/Strategist roukayai@bcaresearch.com Footnotes 1 Please see Emerging Markets Strategy Special Report titled “China: Prepping A Bazooka?” dated February 14, 2019 available at ems.bcaresearch.com 2 Please see Nicholas Lardy, “The State Strikes Back: The End Of Economic Reform In China?” Peterson Institute For International Economics, January 29, 2019, available at piie.com. 3 Please see Emerging Markets Strategy Weekly Report titled “Dissecting China’s Stimulus,” dated January 17, 2019 available at ems.bcaresearch.com 4 The 2012 election of President Enrique Peña Nieto caused Mexican equities to outperform their EM counterparts. Similarly in 2015-16, U.S. outperformance relative to EM also supported Mexico relative to EM because Mexico’s economy is highly leveraged to its northern neighbor. In both periods Mexico’s outperformance was not caused by – but instead coincided with – Chinese credit stimulus. These idiosyncratic events biased the correlation between Mexico’s equity markets and Chinese credit growth to the upside. 5 Please see Commodity & Energy Strategy Weekly Report titled “Trade Wars, China Credit Policy Will Roil Global Copper Markets,” dated June 21, 2018, available at ces.bcaresearch.com.
China’s total social financing numbers for January came in at CNY 4.6 trillion, a stunning number even when taking into account the seasonal strength evident every January. In fact, in a recent webcast, our geopolitical strategists argued that any number…
Under the CBS program, Chinese banks can buy each other’s perpetual bonds, then exchange these bonds for central bank bills and pledge those bills at the People Bank of China (PBoC) in order to receive funding. Insurance companies are also allowed to purchase…
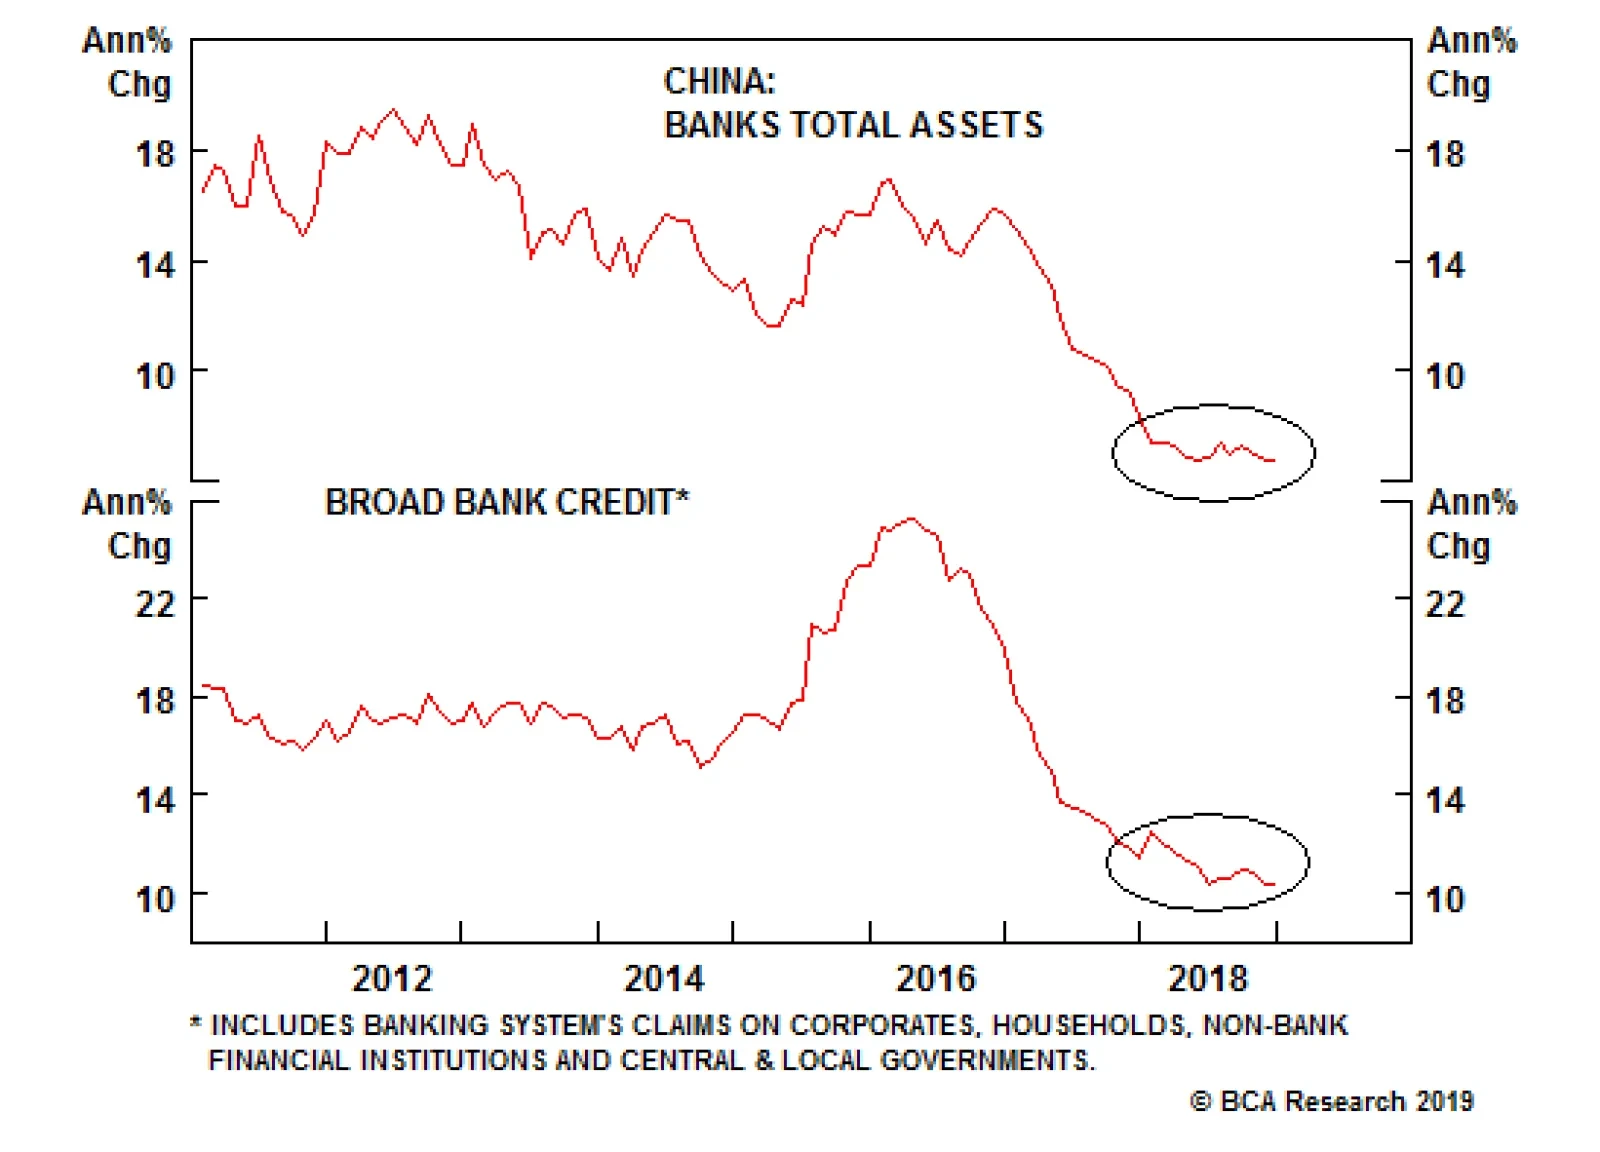
Highlights In their current form and size, perpetual bonds issuance and the central bank bills swap program are unlikely game-changers for the banking system in China. However, this mechanism constitutes monetization of banks’ capital and bad assets, i.e., recapitalization of banks, by the PBoC via quantitative easing. Hence, this scheme can be presently viewed as a bazooka that has not yet been loaded by the government. If the authorities pursue this program on a large scale without forcing banks to acknowledge and write off bad assets, banks would regain power to expand their balance sheets, fostering a cyclical economic recovery. Nevertheless, the growth model based on continuous “out of thin air” money and credit expansion inevitably leads to falling productivity growth and rising inflation. Therefore, the economic outcome over the course of several years would be stagflation, which is profoundly bearish for the currency. Feature The Chinese authorities recently launched a Central Bank Bills Swap (CBS) program to boost liquidity and facilitate issuance of commercial banks’ perpetual bonds. Box I-1 on pages 12-13 elaborates on the scheme and provides more detail about the program. Under the CBS program, Chinese banks can buy each other’s perpetual bonds, then exchange these bonds for central bank bills and pledge those bills at the People Bank of China (PBoC) to receive funding. Insurance companies are also allowed to purchase perpetual bonds, but they cannot pledge them with the central bank for funding. What are the macro implications of this program? Can the government use this scheme to recapitalize the banking system? Does the CBS program amount to quantitative easing? Will it be sufficient to boost credit growth in China in 2019? We have conditional answers to these questions – i.e., they all depend on the extent to which the scheme is actually utilized by the authorities. Chart I-1Chinese Banks: Total Assets And Broad Credit Growth
Chinese Banks: Total Assets And Broad Credit Growth
Chinese Banks: Total Assets And Broad Credit Growth
On the one hand, the CBS program could potentially become a proverbial bazooka used by the government to recapitalize the banking system via the PBoC monetizing banks’ bad assets. By doing so, the PBoC would be expanding its balance sheet by injecting excess reserves into the banking system – i.e., quantitative easing. Consequently, it could help banks accelerate credit and money growth, in turn helping the economy. The long-run collateral damage in this scenario, however, would be an RMB depreciation. On the other hand, the authorities could limit the usage of the scheme via various regulatory approvals and norms. In such a case, the impact of the program on money/credit growth and the real economy as well as on the exchange rate would be limited. In other words, it might end up being no more than a tool to help the four large banks meet BIS's TLAC requirements. At the moment, there is not enough information to determine whether the program will be a game changer for the banking system in China, leading to a surge in credit and broader economic recovery. Both total assets and broad credit growth among banks remain very weak for now (Chart I-1). In other words, it is a bazooka that has not been loaded, and may never be loaded because of the potential for seriously negative ramifications over the long term. Consequently, we maintain our view that China’s growth will continue to disappoint in the first half of 2019, and that China-related plays, including many emerging markets (EM), remain at risk of a renewed selloff. Bank Recapitalization? Chart I-2Chinese Banks Are Massively Under-Provisioned
Chinese Banks Are Massively Under-Provisioned
Chinese Banks Are Massively Under-Provisioned
In theory, the issuance of perpetual bonds along with the CBS program can be used to recapitalize the banking system. Each bank can buy perpetual bonds issued by other banks up to 10% of their core Tier-1 capital. These banks can get cheap financing from the PBoC by swapping these perpetual bonds with central bank bills, and then pledging those bills at the central bank to get funding. Hence, under this scheme, the PBoC will be financing purchases of perpetual bonds, which means the monetary authorities will indirectly be funding banks’ recapitalization. It is an “open secret” that Chinese banks would be considerably undercapitalized if they were forced to recognize non-performing assets. The non-performing loan (NPL) ratio currently stands at 1.9%, and the special-mention loans ratio is at 3.2%; and the sum of both is at 5.1% of total loans (Chart I-2, top panel). NPL provisions presently amount to 3.4% of total loans. When expressed as a share of total risk-weighted assets, the aggregate NPLs and special-mention loans are equal to 4.2% (Chart I-2, bottom panel). At 2.8% of risk-weighted assets, NPL provisions are extremely inadequate. Assuming non-performing assets turn out to be 10% of total risk-weighted assets, some 40% of banks' capital would be wiped out, according to our simulation presented in Table I-1. This is after accounting for existing provisions and assuming a 20% recovery rate of non-performing assets.
Chart I-
Provided that risk-weighting assigns a zero weight to banks’ claims on the government, a 50% risk weight to claims on households and a 100% weight to claims on companies, the assumption of 10% of non-performing assets in total risk-weighted assets is reasonable. This is especially the case when the enormous credit boom of the past 10 years is taken into consideration. As a result, in this scenario the capital adequacy ratio (CAR) will drop from its current level of 13.8% to 9.4%. This will bring the CAR below the regulatory minimum of 11%. To raise the CAR to the regulatory minimum of 11%, the banking system would require RMB 2 trillion of capital. This is greater than the maximum potential demand for perpetual bonds that we estimate to be up to RMB 1.4 trillion. To estimate this number, we assumed all banks purchase perpetual bonds in amounts equal to 5% of their core Tier-1 capital and all insurance companies buy perpetual bonds in an amount equal to 5% of assets. This is not an underestimation of potential demand for perpetual bonds since there are currently limitations on banks’ ability to issue and purchase these bonds as elaborated in Box I-1 on pages 12-13. In short, it is not clear if perpetual bond issuance and the CBS will be sufficient to undertake full recapitalization of the banking system and allow banks to accelerate their balance sheet expansion to finance an economic recovery. Bottom Line: In their current form and shape, perpetual bonds and the CBS program are unlikely to be a game-changer for the banking system in China. However, if the authorities eliminate limitations and change regulatory norms, the scheme could potentially be used to recapitalize China’s banking system. This is why this scheme can presently be viewed as a bazooka that has not yet been loaded by the government. Does CBS Represent QE? Its Impact On Liquidity And Money Supply The CBS program is a form of quantitative easing (QE). It will expand the PBoC’s balance sheet and banking system liquidity (excess reserves at the central bank), as elaborated in Box I-1 and Diagram I-1 on pages 12-14. If pursued on a large scale, this scheme would constitute monetization of banks’ capital and their bad assets by the central bank. The mechanism is already in place, but the extent to which authorities will use it to recapitalize banks remains unclear. Even though the CBS program will expand banking system liquidity – i.e., excess reserves at the central bank – it will not – however - affect broad money supply. The basis is simple: Banks’ excess reserves at the central bank are not part of the broad money supply in any country. Banks use excess reserves to settle payments between one another and with the central bank. Banks do not lend out excess reserves. Further, only a central bank can create excess reserves, and it does so “out of thin air.” In brief, excess reserves rather than corporate and individual deposits constitute genuine banking system liquidity. Barring lending to or buying assets from non-banks – which does not typically occur outside of QE programs – central banks do not create broad money or deposits.1 Money/deposits, the ultimate purchasing power for economic agents, is created by commercial banks “out of thin air,” as we have discussed and illustrated in our series of reports on money, credit and savings.2 Chart I-3China: Excess Reserves And Broad Money
China: Excess Reserves And Broad Money
China: Excess Reserves And Broad Money
Having adequate capital and liquidity as well as positive risk appetite, banks can expand their balance sheets, i.e., originate loans and buy various securities. When banks make loans or purchase assets from non-banks, they simultaneously create deposits and new purchasing power. Chart I-3 demonstrates that in recent years, excess reserves in China’s banking system have been flat, yet banks’ assets and the supply of money has expanded tremendously. The opposite can also occur: Banks’ excess reserves can mushroom, but banks may actually be reluctant to grow their balance sheets. This was the case after the Lehman crisis with U.S. banks and in the wake of the European debt crisis with euro area banks. Finally, we have elaborated at great length in our past reports that China’s money and credit excesses do not stem from its high household savings rate. Rather, like any credit bubble in any country, China’s leverage is due to the creation of credit/money “out of thin air.”2 Bottom Line: Perpetual bond issuance and the CBS program will expand the banking system’s excess reserves, but not broad money supply. Besides, it is not certain that excess reserves will accelerate loan growth. Credit origination by banks depends on many other factors such as banks’ willingness to expand their risk assets, loan demand and the regulatory regime and norms. Deleveraging Has Not Yet Started Chart I-4China: Deleveraging Has Not Even Begun
China: Deleveraging Has Not Even Begun
China: Deleveraging Has Not Even Begun
One cannot discuss the potential for a monetary bazooka in China without an update on the status of deleveraging. The fact is that deleveraging in China has not even begun: Credit is still expanding faster than nominal GDP growth. The most common way to measure leverage/debt is to compare it with the cash flow that is used to service debt. Nominal GDP is a measure of cash flow in an economy from a macro perspective. The debt-to-asset ratio is a poor measure of leverage because asset valuations are often subjective: Assets are valued by debtors themselves. Besides, apart from distressed credit investors, one does not want to be a creditor to a country or company that has to sell assets to service its debt. Stock and bond prices of debtor countries or companies tailspin when the latter have to sell assets to service debt. The top panel of Chart I-4 illustrates that China’s enterprise and household domestic credit/debt is still expanding at an annual rate of close to 10% at a time when nominal GDP growth has slowed to 8%. Consistently, the debt to GDP ratio has not declined at all (Chart I-4, bottom panel). In this context, a rhetorical question is in order: Should China ramp up money/credit growth and monetize banks’ NPLs, given that deleveraging has yet to take place? Economic Ramifications Of Deploying The Bazooka Chart I-5Symptoms Of Rising Inefficiencies
Symptoms Of Rising Inefficiencies
Symptoms Of Rising Inefficiencies
What would be the economic ramifications if the Chinese authorities once again promote and allow unrelenting money/credit expansion “out of thin air” to bail out zombie banks and companies? Cyclically: If the authorities compel banks to acknowledge NPLs and write them off as and when the PBoC finances their recapitalization, banks may not be in a position to accelerate loan growth. This scenario entails that credit growth and hence cyclical sectors in China would remain weak for a while. In contrast, if the authorities pursue recapitalization of banks without forcing them to acknowledge and write off bad assets, banks would regain their power to expand their balance sheets, fostering a cyclical economic recovery. Structurally (in the long term): The growth model based on continuous “out of thin air” money and credit expansion inevitably breeds economic inefficiencies, falling productivity growth and rising inflation. In short, the economic outcome over the course of several years would be stagflation. Chart I-5 illustrates that China’s ICOR (incremental capital-to-output ratio) is rising, or inversely that the output-to-capital ratio is falling. This entails worsening economic efficiency and slowing productivity growth. Chart I-6 shows a potential stylized roadmap for the Chinese economy in the years ahead if the credit and money bubbles are inflated further without corporate restructuring, bankruptcies, the imposition of hard budget constraints and meaningfully improved capital/credit allocation. The red line represents potential GDP growth, and the dotted red line is our projection.
Chart I-6
In any economy, the potential growth rate is equal to the sum of growth rates of the labor force and productivity. China’s labor force is no longer expanding and will begin shrinking in the coming years (Chart I-7). Hence, going forward, the sole source of potential GDP growth in China will be productivity growth. Productivity growth has been slowing and will continue to do so if structural market-oriented reforms are not implemented (Chart I-8, top panel). Besides, the industrialization ratio has already risen a lot (Chart I-8, bottom panel). Chart I-7China: No Tailwind From Labor Force
China: No Tailwind From Labor Force
China: No Tailwind From Labor Force
Chart I-8China: Productivity Is Slowing
China: Productivity Is Slowing
China: Productivity Is Slowing
With the potential GDP growth rate in China declining, future fiscal and credit stimulus may lead to higher nominal – but not real – growth. The latter will be constrained by a slowing rate of potential real GDP growth. Higher nominal but weaker potential (real) growth entails rising inflation. The combination of higher inflation along with the need to maintain very low nominal interest rates to assist debtors is bearish for the currency. In such a scenario, there will be intensifying depreciation pressure on the yuan from the tremendous overhang of RMBs in the banking system (Chart I-9). The PBoC’s foreign exchange reserves of $3 trillion will not be sufficient to backstop the enormous amount of RMB (money) supply of RMB 210 trillion – which is equivalent to US$30 trillion (Chart I-10). Chart I-9Helicopter Money In China
Helicopter Money In China
Helicopter Money In China
Chart I-10PBoC FX Reserves Are Equal To 10% Of Broad Money Supply
PBoC FX Reserves Are Equal To 10% Of Broad Money Supply
PBoC FX Reserves Are Equal To 10% Of Broad Money Supply
If broad money supply continues to expand at an annual rate of close to 9-10% or above, downward pressure on the yuan will escalate immensely, and the Chinese authorities will have no choice but to close the capital account completely and also heavily regulate current account transactions. Bottom Line: If the authorities do not restrain the PBoC’s financing of perpetual bond issuance via the CBS and in the interim do not force banks to write off bad assets, the upshot will be the monetization of banks’ bad assets by the PBoC. This will constitute the ultimate socialist put for banks and zombie debtors, as well as for the entire economy. Business cycle swings, bankruptcies and deflation are inherent features of a market-driven/capitalist economy. A socialist put via promoting unlimited money and credit creation entails long-term stagflation – lower productivity growth and rising inflation. This is very bearish for the currency. Investment Conclusions Chart I-11Dollar And EM / Commodities: Mirror Images
Dollar And EM / Commodities: Mirror Images
Dollar And EM / Commodities: Mirror Images
To be sure, the above analysis suggests that the bazooka has not been loaded and the Chinese economy is not about to stage an imminent recovery. BCA’s Emerging Markets Strategy team maintains its bearish stance on China-related plays worldwide. We are closely monitoring China’s money and credit aggregates as well as indicators from the real economy to gauge when China’s business cycle will revive. So far, these indicators continue to point south. EM risk assets and currencies have recently been boosted by the Federal Reserve’s dovish turn. But as we argued in last week’s report, this will prove short-lived. Global trade, China’s growth and commodities prices are the key drivers of EM financial markets, not the Fed. Provided our negative outlook for these three factors due to the ongoing slowdown in China, we continue to recommend a negative stance on EM in absolute terms, and underweighting EM stocks and credit versus their U.S. peers. The dollar’s weakness stemming from the downshift in U.S. interest rate expectations is running out of steam. Chart I-11 shows that the broad trade-weighted dollar is trying to find support at its 200-day moving average. Conversely, the EM stocks index and copper prices are struggling to break above their 200-day moving averages (Chart I-11, middle and bottom panels). We believe the dollar is poised for a breakout, and EM and copper are due for a breakdown. Arthur Budaghyan, Senior Vice President Emerging Markets Strategy arthurb@bcaresearch.com Lin Xiang, Research Analyst linx@bcaresearch.com Box 1 Issuance Of Perpetual Bonds And CBS Program The authorities are promoting the issuance of perpetual bonds and the CBS program as a scheme for the country’s big-four banks to raise capital to meet BIS ’s Total Loss-absorbing Capacity (TLAC) requirements for globally systemically important banks. Limitations and other details on the perpetual bonds issuance and CBS program: 24 out of 30 banks listed on the A-share market are presently qualified to issue perpetual bonds as their assets exceed RMB 200 billion, a threshold established by the PBoC. Perpetual bonds will boost the Tier-1 capital of issuing banks. Banks are allowed to purchase perpetual bonds issued by other banks in amounts up to 10% of their core Tier-1 capital. Only primary dealers (46 banks and 2 brokers) can exchange qualified perpetual bonds they hold for PBoC bills, with a maximum exchange period of three years. The incentive for banks to purchase perpetual bonds will for now be low because these bonds consume large amounts of capital. The risk weights for these perpetual bonds ranges between 150-250%. How Does It Work? As Diagram I-1 on page 14 illustrates, when Bank B purchases perpetual bonds from Bank A, the former transfers excess reserves to the latter. The amount of outstanding deposits, i.e., money supply, is not affected at all. Hence, there is no direct impact on the broad money supply.
Chart I-
Banks do not require deposits to make loans and buy securities. Banks need excess reserves at the central bank to pay for or settle payments with other banks. When Bank B transfers excess reserves to Bank A, the aggregate amount of excess reserves in the banking system does not change. Bank B can swap these perpetual bonds with central bank bills, and then pledge these bills at the PBoC to get excess reserves. As it does so, Bank B will replenish its excess reserves. Consequently, the amount of excess reserves in the banking system will expand, as will the PBoC’s balance sheet. Overall, the issuance of perpetual bonds and CBS swaps lead to both bank recapitalization and banking system liquidity (excess reserves) expansion. Why has the PBoC decided to fund the issuance of perpetual bonds? Without PBoC funding, demand for perpetual bonds might be very low, and yields on them could spike. Higher yields could lure away capital from other corporate bonds, producing higher borrowing costs in credit markets. On the positive side, the monetary authorities will not only recapitalize a number of large banks but will also do so by capping borrowing costs in the credit markets and injecting more liquidity into the banking system. On the negative side, yields of these perpetual bonds will not be determined by the market. Rather they will be artificially suppressed by potential open-ended PBoC funding. This will preserve China’s inefficient credit allocation system and misallocation of capital in general. In a market economy, the authorities will typically force banks to raise capital in securities markets or privately. More issuance, especially when it comes from many banks simultaneously, typically pushes down the prices of bank stocks and bonds. The basis is securities issuance often dilutes existing shareholders and is also negative for bondholders. This threat of dilution and losing money incentivizes existing shareholders and bondholders of a bank to impose discipline on the bank’s management. Consequently, banks would be better run and capital allocation would be more efficient than it would otherwise be in a system where such oversight and incentives are absent. In brief, the market mechanism deters banks from risky and speculative behavior and contributes to the long-term health of the banking system, as well as the efficiency of capital allocation in the real economy. By allowing banks to purchase each other’s bonds, and with the PBoC financing it, China is not imposing the much-needed market discipline on bank shareholders, bondholders and by extension, bank management. This does not promote efficient capital allocation and higher productivity growth in the long run. Footnotes 1 Money supply is the sum of all deposits in the banking system. Hence, we use terms money and deposits interchangeably. 2 Please see the Emerging Markets Strategy Special Report “Misconceptions About China's Credit Excesses”, dated October 26, 2016, Special Report “China's Money Creation Redux And The RMB?”, dated November 23, 2016, Special Report “Do Credit Bubbles Originate From HIgh National Savings?”, dated January 18, 2017, Special Report “The True Meaning Of China's Great 'Savings Wall'”, dated December 20, 2017 Special Report “Is Investment Constrained By Savings? Tales Of China and Brazil”, dated March 22, 2018, available at www.bcaresearch.com
Highlights In their current form and size, perpetual bonds issuance and the central bank bills swap program are unlikely game-changers for the banking system in China. However, this mechanism constitutes monetization of banks’ capital and bad assets, i.e., recapitalization of banks, by the PBoC via quantitative easing. Hence, this scheme can be presently viewed as a bazooka that has not yet been loaded by the government. If the authorities pursue this program on a large scale without forcing banks to acknowledge and write off bad assets, banks would regain power to expand their balance sheets, fostering a cyclical economic recovery. Nevertheless, the growth model based on continuous “out of thin air” money and credit expansion inevitably leads to falling productivity growth and rising inflation. Therefore, the economic outcome over the course of several years would be stagflation, which is profoundly bearish for the currency. Feature The Chinese authorities recently launched a Central Bank Bills Swap (CBS) program to boost liquidity and facilitate issuance of commercial banks’ perpetual bonds. Box I-1 on pages 12-13 elaborates on the scheme and provides more detail about the program. Under the CBS program, Chinese banks can buy each other’s perpetual bonds, then exchange these bonds for central bank bills and pledge those bills at the People Bank of China (PBoC) to receive funding. Insurance companies are also allowed to purchase perpetual bonds, but they cannot pledge them with the central bank for funding. What are the macro implications of this program? Can the government use this scheme to recapitalize the banking system? Does the CBS program amount to quantitative easing? Will it be sufficient to boost credit growth in China in 2019? We have conditional answers to these questions – i.e., they all depend on the extent to which the scheme is actually utilized by the authorities. On the one hand, the CBS program could potentially become a proverbial bazooka used by the government to recapitalize the banking system via the PBoC monetizing banks’ bad assets. By doing so, the PBoC would be expanding its balance sheet by injecting excess reserves into the banking system – i.e., quantitative easing. Consequently, it could help banks accelerate credit and money growth, in turn helping the economy. The long-run collateral damage in this scenario, however, would be an RMB depreciation. On the other hand, the authorities could limit the usage of the scheme via various regulatory approvals and norms. In such a case, the impact of the program on money/credit growth and the real economy as well as on the exchange rate would be limited. In other words, it might end up being no more than a tool to help the four large banks meet BIS's TLAC requirements. At the moment, there is not enough information to determine whether the program will be a game changer for the banking system in China, leading to a surge in credit and broader economic recovery. Both total assets and broad credit growth among banks remain very weak for now (Chart I-1). In other words, it is a bazooka that has not been loaded, and may never be loaded because of the potential for seriously negative ramifications over the long term. Chart I-1Chinese Banks: Total Assets And Broad Credit Growth
Chinese Banks: Total Assets And Broad Credit Growth
Chinese Banks: Total Assets And Broad Credit Growth
Consequently, we maintain our view that China’s growth will continue to disappoint in the first half of 2019, and that China-related plays, including many emerging markets (EM), remain at risk of a renewed selloff. Bank Recapitalization? In theory, the issuance of perpetual bonds along with the CBS program can be used to recapitalize the banking system. Each bank can buy perpetual bonds issued by other banks up to 10% of their core Tier-1 capital. These banks can get cheap financing from the PBoC by swapping these perpetual bonds with central bank bills, and then pledging those bills at the central bank to get funding. Hence, under this scheme, the PBoC will be financing purchases of perpetual bonds, which means the monetary authorities will indirectly be funding banks’ recapitalization. It is an “open secret” that Chinese banks would be considerably undercapitalized if they were forced to recognize non-performing assets. The non-performing loan (NPL) ratio currently stands at 1.9%, and the special-mention loans ratio is at 3.2%; and the sum of both is at 5.1% of total loans (Chart I-2, top panel). NPL provisions presently amount to 3.4% of total loans. Chart I-2Chinese Banks Are Massively Under-Provisioned
Chinese Banks Are Massively Under-Provisioned
Chinese Banks Are Massively Under-Provisioned
When expressed as a share of total risk-weighted assets, the aggregate NPLs and special-mention loans are equal to 4.2% (Chart I-2, bottom panel). At 2.8% of risk-weighted assets, NPL provisions are extremely inadequate. Assuming non-performing assets turn out to be 10% of total risk-weighted assets, some 40% of banks' capital would be wiped out, according to our simulation presented in Table I-1. This is after accounting for existing provisions and assuming a 20% recovery rate of non-performing assets.
Chart I-
Provided that risk-weighting assigns a zero weight to banks’ claims on the government, a 50% risk weight to claims on households and a 100% weight to claims on companies, the assumption of 10% of non-performing assets in total risk-weighted assets is reasonable. This is especially the case when the enormous credit boom of the past 10 years is taken into consideration. As a result, in this scenario the capital adequacy ratio (CAR) will drop from its current level of 13.8% to 9.4%. This will bring the CAR below the regulatory minimum of 11%. To raise the CAR to the regulatory minimum of 11%, the banking system would require RMB 2 trillion of capital. This is greater than the maximum potential demand for perpetual bonds that we estimate to be up to RMB 1.4 trillion. To estimate this number, we assumed all banks purchase perpetual bonds in amounts equal to 5% of their core Tier-1 capital and all insurance companies buy perpetual bonds in an amount equal to 5% of assets. This is not an underestimation of potential demand for perpetual bonds since there are currently limitations on banks’ ability to issue and purchase these bonds as elaborated in Box I-1 on pages 12-13. In short, it is not clear if perpetual bond issuance and the CBS will be sufficient to undertake full recapitalization of the banking system and allow banks to accelerate their balance sheet expansion to finance an economic recovery. Bottom Line: In their current form and shape, perpetual bonds and the CBS program are unlikely to be a game-changer for the banking system in China. However, if the authorities eliminate limitations and change regulatory norms, the scheme could potentially be used to recapitalize China’s banking system. This is why this scheme can presently be viewed as a bazooka that has not yet been loaded by the government. Does CBS Represent QE? Its Impact On Liquidity And Money Supply The CBS program is a form of quantitative easing (QE). It will expand the PBoC’s balance sheet and banking system liquidity (excess reserves at the central bank), as elaborated in Box I-1 and Diagram I-1 on pages 12-14. If pursued on a large scale, this scheme would constitute monetization of banks’ capital and their bad assets by the central bank. The mechanism is already in place, but the extent to which authorities will use it to recapitalize banks remains unclear. Even though the CBS program will expand banking system liquidity – i.e., excess reserves at the central bank – it will not – however - affect broad money supply. The basis is simple: Banks’ excess reserves at the central bank are not part of the broad money supply in any country. Banks use excess reserves to settle payments between one another and with the central bank. Banks do not lend out excess reserves. Further, only a central bank can create excess reserves, and it does so “out of thin air.” In brief, excess reserves rather than corporate and individual deposits constitute genuine banking system liquidity. Barring lending to or buying assets from non-banks – which does not typically occur outside of QE programs – central banks do not create broad money or deposits.1 Money/deposits, the ultimate purchasing power for economic agents, is created by commercial banks “out of thin air,” as we have discussed and illustrated in our series of reports on money, credit and savings.2 Having adequate capital and liquidity as well as positive risk appetite, banks can expand their balance sheets, i.e., originate loans and buy various securities. When banks make loans or purchase assets from non-banks, they simultaneously create deposits and new purchasing power. Chart I-3 demonstrates that in recent years, excess reserves in China’s banking system have been flat, yet banks’ assets and the supply of money has expanded tremendously. The opposite can also occur: Banks’ excess reserves can mushroom, but banks may actually be reluctant to grow their balance sheets. This was the case after the Lehman crisis with U.S. banks and in the wake of the European debt crisis with euro area banks. Chart I-3China: Excess Reserves And Broad Money
China: Excess Reserves And Broad Money
China: Excess Reserves And Broad Money
Finally, we have elaborated at great length in our past reports that China’s money and credit excesses do not stem from its high household savings rate. Rather, like any credit bubble in any country, China’s leverage is due to the creation of credit/money “out of thin air.”2 Bottom Line: Perpetual bond issuance and the CBS program will expand the banking system’s excess reserves, but not broad money supply. Besides, it is not certain that excess reserves will accelerate loan growth. Credit origination by banks depends on many other factors such as banks’ willingness to expand their risk assets, loan demand and the regulatory regime and norms. Deleveraging Has Not Yet Started One cannot discuss the potential for a monetary bazooka in China without an update on the status of deleveraging. The fact is that deleveraging in China has not even begun: Credit is still expanding faster than nominal GDP growth. The most common way to measure leverage/debt is to compare it with the cash flow that is used to service debt. Nominal GDP is a measure of cash flow in an economy from a macro perspective. The debt-to-asset ratio is a poor measure of leverage because asset valuations are often subjective: Assets are valued by debtors themselves. Besides, apart from distressed credit investors, one does not want to be a creditor to a country or company that has to sell assets to service its debt. Stock and bond prices of debtor countries or companies tailspin when the latter have to sell assets to service debt. The top panel of Chart I-4 illustrates that China’s enterprise and household domestic credit/debt is still expanding at an annual rate of close to 10% at a time when nominal GDP growth has slowed to 8%. Chart I-4China: Deleveraging Has Not Even Begun
China: Deleveraging Has Not Even Begun
China: Deleveraging Has Not Even Begun
Consistently, the debt to GDP ratio has not declined at all (Chart I-4, bottom panel). In this context, a rhetorical question is in order: Should China ramp up money/credit growth and monetize banks’ NPLs, given that deleveraging has yet to take place? Economic Ramifications Of Deploying The Bazooka What would be the economic ramifications if the Chinese authorities once again promote and allow unrelenting money/credit expansion “out of thin air” to bail out zombie banks and companies? Cyclically: If the authorities compel banks to acknowledge NPLs and write them off as and when the PBoC finances their recapitalization, banks may not be in a position to accelerate loan growth. This scenario entails that credit growth and hence cyclical sectors in China would remain weak for a while. In contrast, if the authorities pursue recapitalization of banks without forcing them to acknowledge and write off bad assets, banks would regain their power to expand their balance sheets, fostering a cyclical economic recovery. Structurally (in the long term): The growth model based on continuous “out of thin air” money and credit expansion inevitably breeds economic inefficiencies, falling productivity growth and rising inflation. In short, the economic outcome over the course of several years would be stagflation. Chart I-5 illustrates that China’s ICOR (incremental capital-to-output ratio) is rising, or inversely that the output-to-capital ratio is falling. This entails worsening economic efficiency and slowing productivity growth. Chart I-5Symptoms Of Rising Inefficiencies
Symptoms Of Rising Inefficiencies
Symptoms Of Rising Inefficiencies
Chart I-6 shows a potential stylized roadmap for the Chinese economy in the years ahead if the credit and money bubbles are inflated further without corporate restructuring, bankruptcies, the imposition of hard budget constraints and meaningfully improved capital/credit allocation. The red line represents potential GDP growth, and the dotted red line is our projection.
Chart I-6
In any economy, the potential growth rate is equal to the sum of growth rates of the labor force and productivity. China’s labor force is no longer expanding and will begin shrinking in the coming years (Chart I-7). Hence, going forward, the sole source of potential GDP growth in China will be productivity growth. Productivity growth has been slowing and will continue to do so if structural market-oriented reforms are not implemented (Chart I-8, top panel). Besides, the industrialization ratio has already risen a lot (Chart I-8, bottom panel). Chart I-7China: No Tailwind From Labor Force
China: No Tailwind From Labor Force
China: No Tailwind From Labor Force
Chart I-8China: Productivity Is Slowing
China: Productivity Is Slowing
China: Productivity Is Slowing
With the potential GDP growth rate in China declining, future fiscal and credit stimulus may lead to higher nominal – but not real – growth. The latter will be constrained by a slowing rate of potential real GDP growth. Higher nominal but weaker potential (real) growth entails rising inflation. The combination of higher inflation along with the need to maintain very low nominal interest rates to assist debtors is bearish for the currency. In such a scenario, there will be intensifying depreciation pressure on the yuan from the tremendous overhang of RMBs in the banking system (Chart I-9). The PBoC’s foreign exchange reserves of $3 trillion will not be sufficient to backstop the enormous amount of RMB (money) supply of RMB 210 trillion – which is equivalent to US$30 trillion (Chart I-10). Chart I-9Helicopter Money In China
Helicopter Money In China
Helicopter Money In China
Chart I-10PBoC FX Reserves Are Equal To 10% Of Broad Money Supply
PBoC FX Reserves Are Equal To 10% Of Broad Money Supply
PBoC FX Reserves Are Equal To 10% Of Broad Money Supply
If broad money supply continues to expand at an annual rate of close to 9-10% or above, downward pressure on the yuan will escalate immensely, and the Chinese authorities will have no choice but to close the capital account completely and also heavily regulate current account transactions. Bottom Line: If the authorities do not restrain the PBoC’s financing of perpetual bond issuance via the CBS and in the interim do not force banks to write off bad assets, the upshot will be the monetization of banks’ bad assets by the PBoC. This will constitute the ultimate socialist put for banks and zombie debtors, as well as for the entire economy. Business cycle swings, bankruptcies and deflation are inherent features of a market-driven/capitalist economy. A socialist put via promoting unlimited money and credit creation entails long-term stagflation – lower productivity growth and rising inflation. This is very bearish for the currency. Investment Conclusions To be sure, the above analysis suggests that the bazooka has not been loaded and the Chinese economy is not about to stage an imminent recovery. BCA’s Emerging Markets Strategy team maintains its bearish stance on China-related plays worldwide. We are closely monitoring China’s money and credit aggregates as well as indicators from the real economy to gauge when China’s business cycle will revive. So far, these indicators continue to point south. EM risk assets and currencies have recently been boosted by the Federal Reserve’s dovish turn. But as we argued in last week’s report, this will prove short-lived. Global trade, China’s growth and commodities prices are the key drivers of EM financial markets, not the Fed. Provided our negative outlook for these three factors due to the ongoing slowdown in China, we continue to recommend a negative stance on EM in absolute terms, and underweighting EM stocks and credit versus their U.S. peers. The dollar’s weakness stemming from the downshift in U.S. interest rate expectations is running out of steam. Chart I-11 shows that the broad trade-weighted dollar is trying to find support at its 200-day moving average. Conversely, the EM stocks index and copper prices are struggling to break above their 200-day moving averages (Chart I-11, middle and bottom panels). Chart I-11Dollar And EM / Commodities: Mirror Images
Dollar And EM / Commodities: Mirror Images
Dollar And EM / Commodities: Mirror Images
We believe the dollar is poised for a breakout, and EM and copper are due for a breakdown. Arthur Budaghyan, Senior Vice President Emerging Markets Strategy arthurb@bcaresearch.com Lin Xiang, Research Analyst linx@bcaresearch.com Box 1 Issuance Of Perpetual Bonds And CBS Program The authorities are promoting the issuance of perpetual bonds and the CBS program as a scheme for the country’s big-four banks to raise capital to meet BIS ’s Total Loss-absorbing Capacity (TLAC) requirements for globally systemically important banks. Limitations and other details on the perpetual bonds issuance and CBS program: 24 out of 30 banks listed on the A-share market are presently qualified to issue perpetual bonds as their assets exceed RMB 200 billion, a threshold established by the PBoC. Perpetual bonds will boost the Tier-1 capital of issuing banks. Banks are allowed to purchase perpetual bonds issued by other banks in amounts up to 10% of their core Tier-1 capital. Only primary dealers (46 banks and 2 brokers) can exchange qualified perpetual bonds they hold for PBoC bills, with a maximum exchange period of three years. The incentive for banks to purchase perpetual bonds will for now be low because these bonds consume large amounts of capital. The risk weights for these perpetual bonds ranges between 150-250%. How Does It Work? As Diagram I-1 on page 14 illustrates, when Bank B purchases perpetual bonds from Bank A, the former transfers excess reserves to the latter. The amount of outstanding deposits, i.e., money supply, is not affected at all. Hence, there is no direct impact on the broad money supply.
Chart I-
Banks do not require deposits to make loans and buy securities. Banks need excess reserves at the central bank to pay for or settle payments with other banks. When Bank B transfers excess reserves to Bank A, the aggregate amount of excess reserves in the banking system does not change. Bank B can swap these perpetual bonds with central bank bills, and then pledge these bills at the PBoC to get excess reserves. As it does so, Bank B will replenish its excess reserves. Consequently, the amount of excess reserves in the banking system will expand, as will the PBoC’s balance sheet. Overall, the issuance of perpetual bonds and CBS swaps lead to both bank recapitalization and banking system liquidity (excess reserves) expansion. Why has the PBoC decided to fund the issuance of perpetual bonds? Without PBoC funding, demand for perpetual bonds might be very low, and yields on them could spike. Higher yields could lure away capital from other corporate bonds, producing higher borrowing costs in credit markets. On the positive side, the monetary authorities will not only recapitalize a number of large banks but will also do so by capping borrowing costs in the credit markets and injecting more liquidity into the banking system. On the negative side, yields of these perpetual bonds will not be determined by the market. Rather they will be artificially suppressed by potential open-ended PBoC funding. This will preserve China’s inefficient credit allocation system and misallocation of capital in general. In a market economy, the authorities will typically force banks to raise capital in securities markets or privately. More issuance, especially when it comes from many banks simultaneously, typically pushes down the prices of bank stocks and bonds. The basis is securities issuance often dilutes existing shareholders and is also negative for bondholders. This threat of dilution and losing money incentivizes existing shareholders and bondholders of a bank to impose discipline on the bank’s management. Consequently, banks would be better run and capital allocation would be more efficient than it would otherwise be in a system where such oversight and incentives are absent. In brief, the market mechanism deters banks from risky and speculative behavior and contributes to the long-term health of the banking system, as well as the efficiency of capital allocation in the real economy. By allowing banks to purchase each other’s bonds, and with the PBoC financing it, China is not imposing the much-needed market discipline on bank shareholders, bondholders and by extension, bank management. This does not promote efficient capital allocation and higher productivity growth in the long run. Footnotes 1 Money supply is the sum of all deposits in the banking system. Hence, we use terms money and deposits interchangeably. 2 Please see the Emerging Markets Strategy Special Report “Misconceptions About China's Credit Excesses”, dated October 26, 2016, Special Report “China's Money Creation Redux And The RMB?”, dated November 23, 2016, Special Report “Do Credit Bubbles Originate From HIgh National Savings?”, dated January 18, 2017, Special Report “The True Meaning Of China's Great 'Savings Wall'”, dated December 20, 2017 Special Report “Is Investment Constrained By Savings? Tales Of China and Brazil”, dated March 22, 2018, available at www.bcaresearch.com Equity Recommendations Fixed-Income, Credit And Currency Recommendations
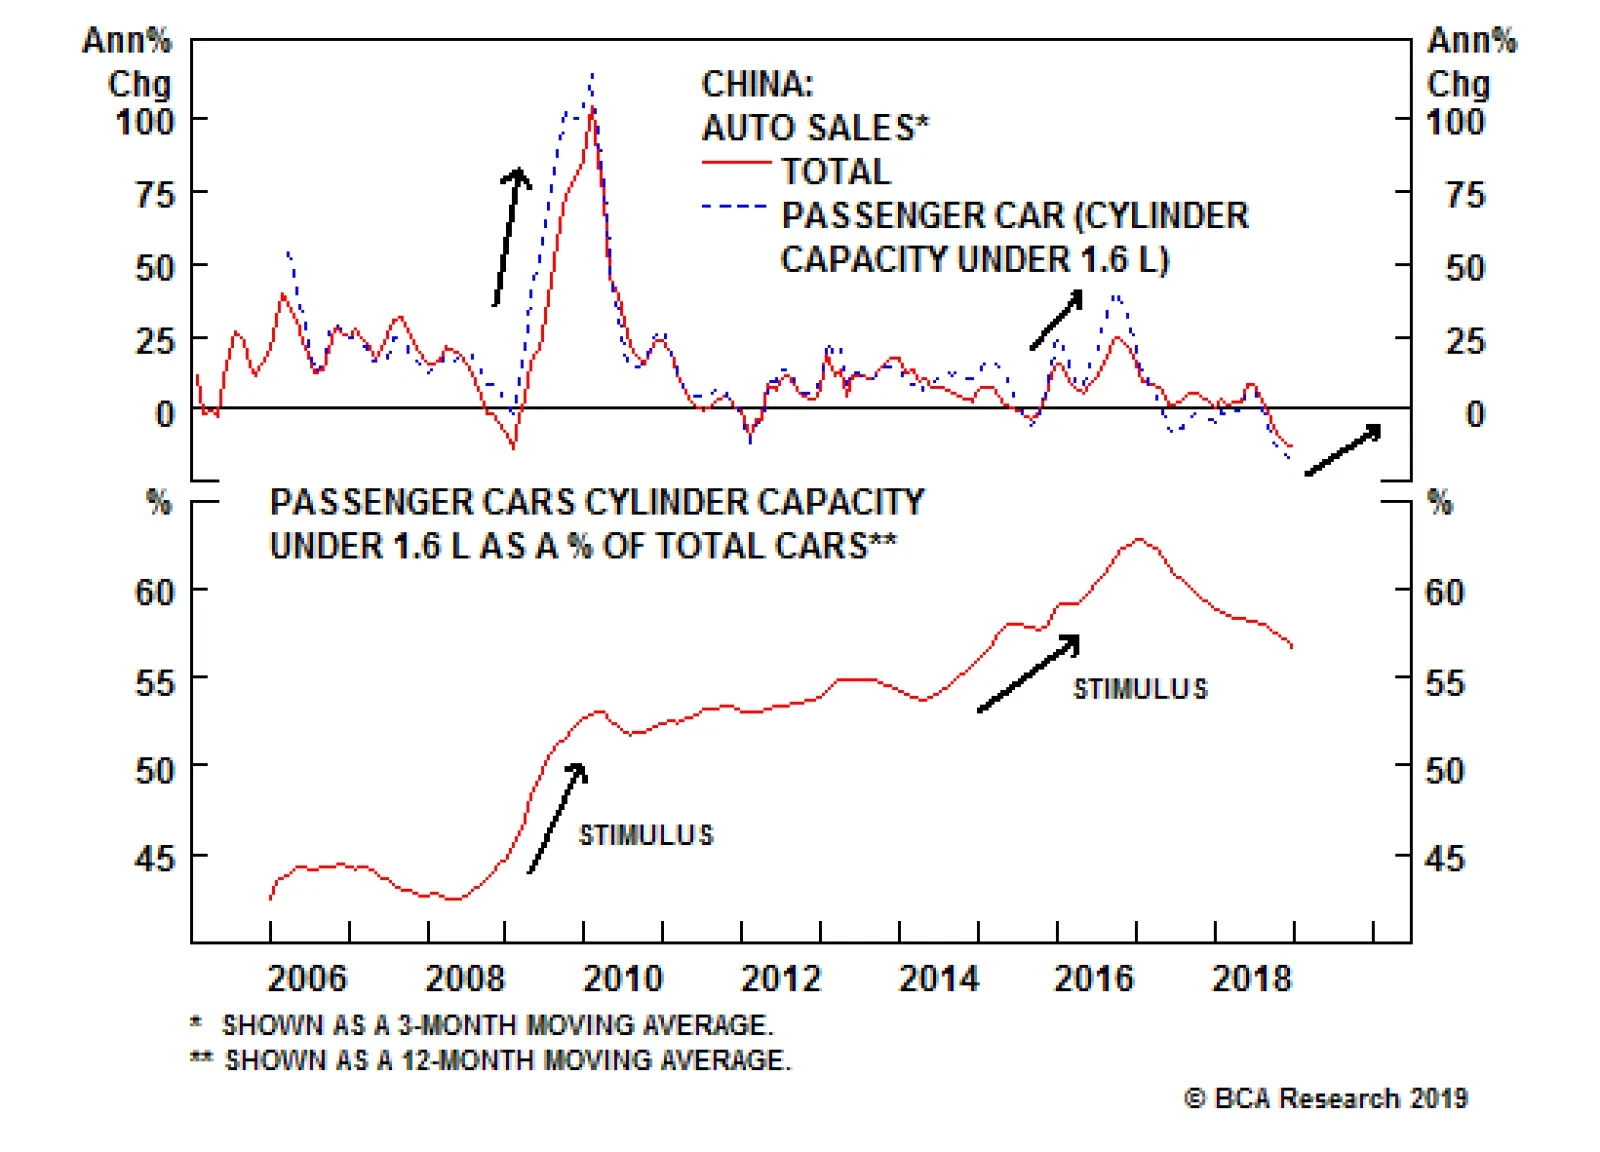
First, there is no sales tax reduction measure in this round of stimulus. The most important driver for the auto market recovery in 2009 and 2016 was a sales tax reduction from 10% to 5% for passenger cars with cylinder capacity equal to or less than 1.6L. …