Currencies

Dear Client, Thank you for your continued readership and support this year. This is the last European Investment Strategy report for 2021. In this piece, we review ten charts covering important aspects of the European economy and capital markets. We will resume our regular publishing schedule on January 10th, 2022. The European Investment Strategy team wishes you and your loved ones a wonderful holiday season, and a healthy, happy, and prosperous new year. Best regards, Mathieu Savary Highlights European growth continues to face headwinds as it enters 2022. The ECB will be slow to remove more accommodation than what is implied by the end of the PEPP. Value stocks and Italian equities will enjoy a modest tailwind from rising Bund yields. The lower quality of European stocks creates a long-term headwind versus US benchmarks. The outperformance of European cyclicals relative to defensives will resume and financials will have greater upside. The relative performance of small-cap stocks will soon stabilize, but a weak euro will create a near-term risk. President Emmanuel Macron’s real contender is the center-right candidate Valerie Pécresse, not populists. Feature Chart 1: Wave Dynamics The current wave of COVID-19 infections continues to surge in Europe. As Chart 1 highlights, Austria and the Netherlands just witnessed intense waves that eclipsed those experienced earlier this year. However, these waves are already ebbing because of the containment measures implemented in recent weeks. In these two severely hit nations, hospitalization rates also increased significantly; however, they did not reach the degree experienced in France or the UK in the first half of 2021 (Chart 1, right panel). Chart 1Wave Dynamics
Wave Dynamics I
Wave Dynamics I
Chart 1Wave Dynamics
Wave Dynamics II
Wave Dynamics II
Europe will experience another test in the coming weeks as the highly contagious Omicron variant becomes the dominant COVID-19 strain. However, data from South Africa continues to suggest that this mutation is much less pathogenic than previous variants and will not place as much strain on the healthcare system as potential case counts would indicate. Nonetheless, it is too early to make this prognosis with great confidence. Importantly, even if a small proportion of infected people is hospitalized, a large enough a pool of infections could cause a rupture in the healthcare system. As a result, politicians will likely remain cautious until a larger share of the population receives its booster dose. Hence, Omicron still represents a near-term risk to economic activity, albeit one that will prove ephemeral. Chart 2: The Economy Is Not Out Of The Woods Yet European growth remains highly dependent on the fluctuations of the global economy because exports and capex account for a large share of the continent’s output. Consequently, global economic trends remain paramount when considering the European economic outlook. In the near-term, Europe continues to face headwinds beyond the uncertainty caused by the potential effects of the Omicron variant. Global economic activity, for instance, is likely to face some further near-term headwinds caused by the supply shock typified by elevated commodity prices and bottlenecks (Chart 2). Not only does this shock limit the ability of producers to procure important inputs, but it also increases the costs of production. Historically, this combination results in downward pressure on global manufacturing activity. Chart 2The Economy Is Not Out Of The Woods Yet
The Economy Is Not Out Of The Woods Yet I
The Economy Is Not Out Of The Woods Yet I
Chart 2The Economy Is Not Out Of The Woods Yet
The Economy Is Not Out Of The Woods Yet II
The Economy Is Not Out Of The Woods Yet II
The second problem remains the deceleration in the Chinese economy. Declining credit growth in China results in slower European exports, which also hurts the region’s PMI. The recent Central Economic Work Conference suggests that China is ready to inject more stimulus in its economy, which will help Europe. However, the beginning of 2022 will still witness the lagged impact of previous tightening in credit conditions on European economic indicators. Moreover, BCA’s China Investment Strategy team expects the stimulus to be modest at first and only grow in intensity later. It is unlikely to be as credit-heavy as in the past, which also means it will be less beneficial to Europe. Chart 3: A Careful ECB Last week, the European Central Bank aggressively upgraded its inflation forecast for 2022 and announced the end of the PEPP for March, however, it will increase temporarily the APP program to EUR40bn. Moreover, President Christine Lagarde remains steadfast that the Governing Council will not raise rates in 2022. Our Central Bank Monitor points to the need for tighter policy, yet the ECB continues to adopt a cautious tone, even if the Eurozone HICP inflation has reached 4%—the highest reading in thirteen years. First, the ECB still runs the risk of dislocation in the periphery, where Italian and Spanish spreads may easily explode if monetary accommodation is removed too quickly. Second, European inflationary pressures remain significantly narrower than they are in the US (Chart 3, left panel). Our Eurozone trimmed-mean CPI continues to linger well below core CPI readings, while in the US both measures track each other closely. Third, the decline in energy prices and the ebbing transportation bottlenecks mean that odds are growing that sequential inflation will soon experience an interim peak (Chart 3, right panel). Chart 3A Careful ECB
A Careful ECB I
A Careful ECB I
Chart 3A Careful ECB
A Careful ECB II
A Careful ECB II
This view of the ECB implies that German yields will not rise as much as US yields next year, which BCA’s US Bond Strategy team expects to reach 2.25% by the end of 2022. Moreover, the more tepid pace of the removal of accommodation and the implicit targeting of peripheral bond markets also warrant an overweight position in Italian bonds. Spreads will be volatile, but any move upward will be self-limiting because of their role in the ECB’s reaction function. As a result, investors should continue to pocket the additional income over German paper. Chart 4: A Murky Outlook For The Euro The market continues to test EUR/USD. Any breakdown below 1.1175 is likely to prompt a pronounced down leg toward 1.07-1.08, near the pandemic lows. The euro suffers from three handicaps. First, Europe’s economic links with China are greater than those of the US with China. Consequently, the Chinese economic deceleration hurts European rates of returns more than it hurts those in the US. Second, the acceleration of US inflation is inviting investors to reprice the path of the Fed’s policy rate, which accentuates the upside pressure on the dollar. Finally, the energy crisis is ramping up anew following Germany’s suspension of the approval of the Nord Stream 2 pipeline and the buildup of Russian troops on Ukraine’s borders. Surging European natural gas prices act as a powerful headwind for EUR/USD because they accentuate stagflation risks in the Eurozone (Chart 4, left panel). While these create downside pressures on the euro, the picture is more complex. Our Intermediate-Term Timing Model shows that EUR/USD is one-sigma oversold (Chart 4, right panel). Over the past 20 years, it was more depressed only in 2010 and in early 2015. Such a reading indicates that most of the bad news is already embedded in EUR/USD and that sentiment has become massively negative. Thus, we are not chasing the euro lower, even though we will respect our stop-loss at 1.1175 if it were triggered. Instead, we will look to buy the euro at lower levels in the first quarter of 2021. Chart 4A Murky Outlook For The Euro
A Murky Outlook For The Euro I
A Murky Outlook For The Euro I
Chart 4A Murky Outlook For The Euro
A Murky Outlook For The Euro II
A Murky Outlook For The Euro II
Chart 5: German Yields Are Key To Value Stocks And Italian Equities The performance of European value stocks relative to that of growth stocks continues to exhibit a close relationship with the evolution of German Bund yields (Chart 5, left panel). Value stocks are less sensitive than growth stocks to higher yields because they derive a smaller proportion of their intrinsic value from long-term deferred cash flows; which suffer more from rising discount factors than near-term cash flows. Moreover, value stocks overweight financials, whose profitability increases when yields rise. The same relationship exists between the performance of Italian equities relative to the Eurozone benchmark (Chart 5, right panel). This correlation holds because of Italy’s significant value bias and its large exposure to financials. Chart 5German Yields Are Key To Value Stocks And Italian Equities
German Yields Are Key To Value Stocks And Italian Equities I
German Yields Are Key To Value Stocks And Italian Equities I
Chart 5German Yields Are Key To Value Stocks And Italian Equities
German Yields Are Key To Value Stocks And Italian Equities II
German Yields Are Key To Value Stocks And Italian Equities II
Based on these observations, BCA’s view that German Bund yields will rise toward 0.25% is consistent with a modest outperformance of value and Italian equities in 2022. For a more robust outperformance by value and Italian stocks, the Chinese economy will have to re-accelerate clearly and the dollar will have to fall significantly. However, these two outcomes could take more time to materialize than our bond view. Chart 6: Europe’s Quality Deficit The gyrations in the performance of European equities relative to US stocks continue to be influenced by China’s economic fluctuations. The deterioration in various measures of China’s credit impulse remains consistent with further near-term underperformance of European equities (Chart 6, left panel). Moreover, if Omicron has a significant impact on consumer behavior (via personal choices or government measures), it will once again hurt spending on services and boost the appeal of growth stocks, which Europe underrepresents. These headwinds will not be long lasting. Europe has an opportunity to outperform next year if global yields rise. However, European equity markets continue to suffer from a potent long-term disadvantage relative to those of the US. American benchmarks are composed of higher quality stocks than European ones. As a result of greater market concentration, more innovative applications of research, and the development of greater moats, US stocks generate wider profits margins than European companies and have a higher utilization of their asset base. Consequently, US shares sport significantly higher RoEs and earnings growth than European large-cap names (Chart 6, right panel). Historically, the quality factor has been one of the top performers and is an important contributor to the current strength of growth equities. Thus, even if Europe’s day in the sun arrives before the middle of 2022, it will again be a temporary phenomenon. Chart 6Europe’s Quality Deficit
Europe's Quality Deficit I
Europe's Quality Deficit I
Chart 6Europe’s Quality Deficit
Europe's Quality Deficit II
Europe's Quality Deficit II
Chart 7: Will the Cyclicals Outperformance Resume? For most of 2021, European cyclicals equities have not performed as well against defensive stocks as many investors hoped. In fact, the relative performance of cyclicals is broadly flat since March. Going forward, cyclicals will resume their uptrend against defensive equities and even break out of their range of the past twenty years. From a technical perspective, cyclicals have expunged many of their excesses. By the spring, European cyclicals had become prohibitively expensive compared to their defensive counterparts (Chart 7, left panel). However, their overvaluation has now passed and medium-term momentum measures are not overbought anymore, which creates a much better entry point for cyclical equities. From a fundamental perspective, cyclicals will also enjoy rising yields after being hamstrung by Treasury yields that have moved sideways for more than nine months (Chart 7, right panel). Moreover, the eventual stabilization of the Chinese economy will create an additional tailwind for these stocks. Chart 7Will The Cyclicals Outperformance Resume?
Will the Cyclicals Outperformance Resume? I
Will the Cyclicals Outperformance Resume? I
Chart 7Will The Cyclicals Outperformance Resume?
Will the Cyclicals Outperformance Resume? II
Will the Cyclicals Outperformance Resume? II
The biggest risk to cyclical stocks lies in inflation expectations. Ten-year CPI swaps have stopped increasing despite rising inflation. As the yield curve flattens and long-term segments of the OIS curve invert, markets register their fears that the Fed might tighten too much over the next two years. In other words, markets continue to agonize over the effect of a very low perceived terminal rate. These worries may cause the CPI swaps to decline significantly as the Fed hikes rates next year, creating a headwind for cyclicals. Chart 8: Favor Financials Financials in general and banks in particular have outperformed the European benchmark this year. This trend will persist in 2020. More than the positive impact of higher yields on the profitability of financials justifies this view. One of the key drivers supporting our optimism toward this sector is the continued improvement in the balance-sheet health of the European banking sector (Chart 8, left panel). Capital adequacy ratios remain in an uptrend and NPLs continue to be well-behaved. Meanwhile, both the governments’ liquidity support during the pandemic and the nonfinancial sector’s cash buildup over the past 18 months limit the risk that a brisk rise in insolvencies would threaten the viability of the banking system. European bank lending is also likely to remain superior to that of the post-GFC years. Consumer confidence is still sturdy, despite the recent increase in COVID cases and the tax hike created by rapidly climbing energy prices (Chart 8, right panel). Companies also benefit from an environment of low real rates and limited fiscal austerity. Unsurprisingly, capex intentions are elevated, which should support credit demand from businesses going forward. Chart 8Favor Financials
Favor Financials I
Favor Financials I
Chart 8Favor Financials
Favor Financials II
Favor Financials II
These factors imply that the current large discount embedded in European financials’ valuations remains excessive (even if a smaller discount is still warranted). As long as peripheral spreads do not blow out durably, financials will have scope to outperform further. Banks should also beat insurance companies. Chart 9: Small-Caps Are Nearly There Despite a sideways move followed by a 4% dip, the performance of European small-cap stocks remains in a pronounced uptrend relative to large-cap equities. The recent bout of underperformance is likely to end soon, unless a recession is around the corner. Small-cap stocks are becoming oversold (Chart 9, left panel) and will benefit from their pronounced procyclicality, especially if the recent improvement in global economic surprises continues next year. Moreover, above-trend European growth as well as an ECB that will maintain accommodative monetary conditions will combine to prevent a significant widening in European high-yield spreads, particularly once natural gas prices are turned down after the winter. This process will also help small-cap equities. The biggest risk for the European small-caps’ relative performance is the currency market. The relative performance of small-cap names is still closely correlated to the euro (Chart 9, right panel). As a result, if EUR/USD were to falter in the coming weeks, the underperformance of small-cap stocks could deepen. At the very least, small-cap stocks would languish before resuming their uptrend later in the year. Chart 9Small-Caps Are Nearly There
Small-Caps Are Nearly There I
Small-Caps Are Nearly There I
Chart 9Small-Caps Are Nearly There
Small-Caps Are Nearly There II
Small-Caps Are Nearly There II
Chart 10: A Risk to Macron’s Second Term The emergence of the new populist candidate Éric Zemmour has galvanized the media in recent weeks. However, he is very unlikely to pose a credible threat to French President Emmanuel Macron, unlike center-right candidate Valerie Pécresse, who just won the Les Républicains (LR) primary. In a Special Report published conjointly with our geopolitical strategists last summer, we identified the emergence of a single candidate able to unite the center-right as one of the biggest risks to Macron. As Chart 10 shows, Pécresse has made a comeback in the polls and is now expected to face Macron in the second round. According to an Elabe poll conducted after her victory in the primary, if the second round of the elections were held now, she would beat Macron.
Chart 10
Chart 10
Will Pécresse manage to keep her momentum going until April 2022? First, she has to ensure the center-right remains united behind her. Up until the primaries, the center-right was divided. While she won the primary by a wide margin, her main opponent Éric Ciotti won the first round (25.6%), and Michel Barnier as well as Xavier Bertrand came close behind, with 23.9% and 22.7% respectively. Second, Pécresse must work hard to prevent voters from succumbing to the siren songs of Zemmour and Marine Le Pen, or to lean toward former Prime Minister Phillippe Edouard, a declared supporter of Macron. Investors should ignore Le Pen and Eric Zemmour. The real threat to Macron lies in Valerie Pécresse’s ability to keep the center-right united under her banner. Considering that the center-left does not represent an option and that the far-right is entangled in a tug-of-war, there is a high probability that Pécresse will reach the second round. Footnotes Tactical Recommendations
Europe In Charts
Europe In Charts
Cyclical Recommendations
Europe In Charts
Europe In Charts
Structural Recommendations
Europe In Charts
Europe In Charts
Closed Trades Currency Performance Fixed Income Performance Equity Performance
Dear client, This is our final report for this year. Clients who missed our FX key views report last week can access the link here. We thank you for your continued readership, and wish you happy and healthy holidays. Kind regards, Chester Highlights We were offside on the dollar this year. Our 94-95 ceiling for the DXY was punched in November (currently 96). More importantly, the dollar is the strongest performing G10 currency this year, which we did not anticipate. That said, both the Norges Bank and the Bank of England hiked rates today. This reinforces our conviction that the Fed will stay behind the curve. Our trades still managed to deliver alpha. Our batting average (percentage of wins) was 64%. Our worst performing trade was to go long silver in July this year and go short USD/JPY in May. This proved premature as the dollar extended its rally, following a hawkish shift by the Federal Reserve. Our best trades were being opportunistically long the Scandinavian currencies, short the gold/silver ratio and short EUR/GBP. More importantly, swimming against the tide, we benefited from respecting our stop losses, and not overstaying our welcome in profitable trades. Our current view is that the dollar has some more near-term upside. Our target for the DXY is 98 over the next few months or so, but we expect a reversal after. For the moment, we are playing three themes in the FX market – policy convergence between central banks (long EUR/GBP, AUD/NZD and short USD/JPY), a rise in FX volatility (long CHF/NZD), and forthcoming green shoots in China (long AUD/USD). That said, we will maintain tight stops on all these trades, given the landscape remains fraught with uncertainty. Feature The dollar is in a perfect storm, characterized by rising inflation that is prompting the Federal Reserve to turn more hawkish, but also raising the possibility that it kills the US recovery. The US 10/2 Treasury curve slope has flattened to 79 bps, and the 30/2 Treasury slope has collapsed to 120 bps (Chart 1A). Historically, this pattern of curve flattening has been symptomatic of a brewing recession and further gains in the dollar (Chart 1B). Chart 1AThe Dollar And The Yield Curve
The Dollar And The Yield Curve
The Dollar And The Yield Curve
Chart 1BThe Dollar And The Yield Curve
The Dollar And The Yield Curve
The Dollar And The Yield Curve
Two-year yields have shot up in the US, relative to other G10 countries. This is a phenomenon that has been pretty consistent throughout the year with sub-zero interest rate countries (euro area, Japan, Switzerland, Chart 2A) but is becoming even more broad based. Two-year yields are accelerating in the US versus countries such as Canada, New Zealand and Norway, where their central banks have already ended QE and/or are raising interest rates. It is also interesting that their currencies have depreciated more this year than what will be implied by nominal yield differentials (Chart 2B). Chart 2ARising Short-Term Rates In The US
Rising Short-Term Rates In The US
Rising Short-Term Rates In The US
Chart 2BRising Short-Term Rates In The US
Rising Short-Term Rates In The US
Rising Short-Term Rates In The US
The Federal Reserve’s own estimates suggest that a 10% increase in the dollar will shave US real growth by 50 bps the following year, an additional 20 bps the year after. This is occurring when China is easing monetary policy, which will likely support growth outside the US. Commodity currencies such as the AUD, NZD and NOK are very sensitive to subtle shifts in Chinese growth (Chart 3). If financial conditions tighten in the US while easing elsewhere, it pretty much ensures that growth will rotate next year from the US to other countries that have seen their currencies weaken (Chart 4). Chart 3Commodity Currencies Weighed Down By The China Slowdown
Commodity Currencies Weighed Down By The China Slowdown
Commodity Currencies Weighed Down By The China Slowdown
Chart 4The US Dollar And Relative ##br##Growth
The US Dollar And Relative Growth
The US Dollar And Relative Growth
This year, our bias was that the Fed will lag the inflation curve, relative to other central banks, and this will weaken the dollar. This thesis hinged on two critical observations. First, real rates in the US remained very low as the Fed was lagging other central banks in tightening policy. Almost all central banks, with the exception of the Bank of Japan and the European Central Bank, have already ended QE. Many have also hiked interest rates (Chart 5). Second, and related, inflation overshot in the US relative to other countries (Chart 6). Where we went wrong was not anticipating that the market would price in a more credible Fed, especially against other G10 central banks. Chart 5Worldwide Monetary Normalization Weighs On The Dollar
Worldwide Monetary Normalization Weighs On The Dollar
Worldwide Monetary Normalization Weighs On The Dollar
Chart 6Surging US Inflation Also Bearish For The Dollar
Surging US Inflation Also Bearish For The Dollar
Surging US Inflation Also Bearish For The Dollar
In the near term, we think the dollar continues to do well, but we are not betting on an overshoot. Longer term, the themes suggested in our outlook should play out, including a weaker dollar. In the next few sections, we review some of our big losses this year, as well as our winners. Finally, in April 2020, we designed a rules-based trading model to see if, over time, currencies could be traded purely mechanically. That model was also offside this year, shorting the dollar 9 out of 12 months. That said, over time, a model grounded in the fundamental basis that has defined the BCA approach provided alpha (Chart 7). According to the model, investors should be long most G10 currencies versus the dollar, except the Japanese yen and the New Zealand dollar (Chart 8A and 8B). Chart 7Our USD Model Takes A Long-Term Approach
Our USD Model Takes A Long-Term Approach
Our USD Model Takes A Long-Term Approach
Chart 8AOur Model Is USD Bearish
Our Model Is USD Bearish
Our Model Is USD Bearish
Chart 8BOur Model Is USD Bearish
Our Model Is USD Bearish
Our Model Is USD Bearish
Overall Trade Performance For 2021 Chart 9 highlights the timeline of closed trades in 2021, alongside performance. Our trades still managed to deliver alpha. Our batting average (percentage of wins) was 64%. The cumulative return this year was 37%, the mean return was 1.1%, and the median return was 1.3%.
Chart 9
Our worst performing trade was to go long silver in July this year and go short USD/JPY in May. Our long silver trade was by far the worst decision. Excluding this trade, our cumulative returns this year would have been 50.6%, with a mean return of 1.6%, and a median return of 1.4%. We implemented this trade after the hawkish shift by the Federal Reserve, but it proved premature as the dollar extended its rally. Short USD/JPY
Chart 10
We were long the yen against the dollar for the entire second half of 2020, and opportunistically long in the spring and summer of 2021. Real rate differentials versus the US supported the yen. Equally important was the yen’s hedging benefit among our other trades at the time, most of which were pro-growth. Finally, the yen was also cheap. Going long in June was particularly interesting. First, we believed that the dollar rally would be short lived, a view that was offside for 2021. We also observed that a nation’s currency tended to outperform as it hosted the Olympic Games, leading to our belief that the yen would benefit from the Tokyo Summer Games (Chart 10). In the end, the two-year yield differential between the US and Japan was the most important driver for the yen. We remain long, but with a stop loss at our latest entry point of 114.40. Long Petrocurrencies (CAD, NOK, MXN, RUB And COP) Versus The Euro Chart 11Commodity Currencies Still Have Upside
Commodity Currencies Still Have Upside
Commodity Currencies Still Have Upside
Our Commodity Strategists have been bullish oil since the bottom in 2020, a call that has been prescient. As a derivative, we went long a petrocurrency basket against the euro for most of the second half of 2020. We took profits on that trade when our trailing stop was triggered, but the returns were mostly from the carry. Towards the end of October 2021, we once again went long the basket, given the divergence between currency performance and surging oil prices (Chart 11). However, we were stopped out a month later as the dollar started to rally on the back of an increasingly hawkish Fed. Overall, our rational for the trade played out, but the meagre gains were because we were swimming against the tide of a strong dollar. Short EUR/GBP We sold this pair in September of 2020 mainly based on the belief that stalled UK/EU trade talks instilled too much pessimism in the market, leading to an undervalued pound against the euro. The UK data that came out during that time were also relatively strong compared to both the US and the euro area. We closed the trade for a sizeable profit. Short CAD/NOK Chart 12The CAD/NOK Still Has Downside
The CAD/NOK Still Has Downside
The CAD/NOK Still Has Downside
Our main rationale for this trade rested on the differences in geographies for these oil sources, amidst a bullish oil environment. While both of these petrocurrencies strengthened, Canadian oil’s lower grade and higher cost of transportation would subject the loonie to underperformance against the NOK. CAD/NOK is also correlated to EUR/USD because of economic ties, and so a bet on a stronger euro (driven by stronger economic performance outside the US) was also a bet on a lower CAD/NOK (Chart 12). Our view turned out to be right. Long EUR/CHF Chart 13EUR/CHF And The German Bund Yield
EUR/CHF And The German Bund Yield
EUR/CHF And The German Bund Yield
We went long EUR/CHF in November 2020 and took profits in May 2021. At the time, CHF had appreciated by 1.2% in a week, opening an interesting gap between EUR/CHF and USD/CHF. This suggested that either the franc was too high versus the euro, or the euro was too high versus the dollar. The overall rationale behind the trade was right. The SNB maintained a dovish stance with a close focus on the exchange rate. Going forward, rising yields on the back of an economic recovery will support EUR/CHF (Chart 13). EUR/CHF is also underpinned by cheap valuations. We remain long the cross. Long CAD/NZD And AUD/NZD Our bias on NZD for most of the 2021 has been negative at the crosses. This was based on two driving factors. First, according to our models, the kiwi is the most expensive G10 currency after the dollar. Second, we did not believe the Reserve Bank of New Zealand could credibly hike interest rates ahead of other G10 countries. New Zealand is an island geographically but not economically. As such, we have been short NZD at the crosses. Other factors add to this high-conviction view. First, the New Zealand stock market is the most defensive in the G10, while Canadian and Australian bourses are heavy in cyclical stocks. Should value start to outperform growth, this will favor the CAD/NZD and AUD/NZD cross. Second, in the commodity space, our bias is that energy and metals will fare better than agriculture, boosting loonie/aussie relative terms of trade. We remain long AUD/NZD, and made modest gains when we got stopped out of our previous position in April. Long Silver Relative To Gold Chart 14Gold/Silver Tracks The Dollar
Gold/Silver Tracks The Dollar
Gold/Silver Tracks The Dollar
We shorted the the gold/silver ratio four times throughout the year based on the view that global ex-US growth was poised to recover amid very accommodative policy. As such, industrial precious metals would be well supported. The gold/silver ratio is also a play on the dollar (Chart 14). Our first two attempts earlier in the spring to catch the drawdown in the gold/silver ratio both profited handsomely, registering 6.25% and 8.45% returns respectively. However, since June, the dollar has strenghthend, which has eroded the anti-fiat appeal of silver. Long Scandinavian Currencies We were long NOK and SEK for most of 2021. We were bullish on the NOK as the Norges Bank is leading the pack in raising interest rates, as we witnessed today. Indeed, for the first half of the year, the return on our Scandinavian basket was driven primarily by the NOK against both the dollar and the euro. We respected our trailing stop loss on this trade, and will reinitiate in the near future. Short AUD/MXN Chart 15AUD/MXN Still Richly Valued
AUD/MXN Still Richly Valued
AUD/MXN Still Richly Valued
Short AUD/MXN was a play on a slowdown in China. A falling credit impulse in China, and a short-term recovery in the US economy relative to the rest of the world, argued for an AUD/MXN short. Further, on a real effective exchange rate basis, AUD/MXN was richly valued (Chart 15). Our first attempt to trade the pair was unsuccessful. Once our stop loss was triggered, we reinitiated the trade and made a net profit. Long CHF/NZD We went long this pair as both a bet on rising currency volatility, but also as a hedge to our portfolio of trades, which were pivoted towards growth and recovery. Our view was right. The pair did strengthen for much of the early part of the year leading up to the end of August. We exited for a minscule profit, but reinitiated, and are now sitting on 3.98% gains. Long EUR/USD The euro has been the toughest call this year, because the ECB has been surprisingly steady on its path to keep interest rates low. In July, our limit buy on EUR/USD was triggered at 1.18. Even though a dollar rally was a major risk, we argued adjustment in the weight of the shelter component in the euro area CPI basket will boost the European CPI relative to the US. This proved premature and we obeyed our stop loss. Chester Ntonifor Foreign Exchange Strategist chestern@bcaresearch.com Kate Sun Research Analyst kate.sun@bcaresearch.com Trades & Forecasts Strategic View Tactical Holdings (0-6 months) Forecast Summary
Highlights Our three strategic themes over the long run: (1) great power rivalry (2) hypo-globalization (3) populism and nationalism. The implications are inflationary over the long run. Nations that gear up for potential conflict and expand the social safety net to appease popular discontent will consume a lot of resources. Our three key views for 2022: (1) China’s reversion to autocracy (2) America’s policy insularity (3) petro-state leverage. The implications are mostly but not entirely inflationary: China will ease policy, the US will pass more stimulus, and energy supply may suffer major disruptions. Stay long gold, neutral US dollar, short renminbi, and short Taiwanese dollar. Stay tactically long global large caps and defensives. Buy aerospace/defense and cyber-security stocks. Go long Japanese and Mexican equities – both are tied to the US in an era of great power rivalry. Feature Chart 1US Resilience
US Resilience
US Resilience
Global investors have not yet found a substitute for the United States. Despite a bout of exuberance around cyclical non-US assets at the beginning of 2021, the year draws to a close with King Dollar rallying, US equities rising to 61% of global equity capitalization, and the US 30-year Treasury yield unfazed by inflation fears (Chart 1). American outperformance is only partly explained by its handling of the lingering Covid-19 pandemic. The US population was clearly less restricted by the virus (Chart 2). But more to the point, the US stimulated its economy by 25% of GDP over the course of the crisis, while the average across major countries was 13% of GDP. Americans are still more eager to go outdoors and the government has been less stringent in preventing them (Chart 3).
Chart 2
Chart 3Social Restrictions Short Of Lockdown
Social Restrictions Short Of Lockdown
Social Restrictions Short Of Lockdown
Going forward, the pandemic should decline in relevance, though it is still possible that a vaccine-resistant mutation will arise that is deadlier for younger people, causing a new round of the crisis. The rotation into assets outside the US will be cautious. Across the world, monetary and credit growth peaked and rolled over this year, after the extraordinary effusion of stimulus to offset the social lockdowns of 2020 (Chart 4). Government budget deficits started to normalize while central banks began winding down emergency lending and bond-buying. More widespread and significant policy normalization will get under way in 2022 in the face of high core inflation. Tightening will favor the US dollar, especially if global growth disappoints expectations. Chart 4Waning Monetary And Credit Stimulus
Waning Monetary And Credit Stimulus
Waning Monetary And Credit Stimulus
Chart 5Global Growth Stabilization
Global Growth Stabilization
Global Growth Stabilization
Global manufacturing activity fell off its peak, especially in China, where authorities tightened monetary, fiscal, and regulatory policy aggressively to prevent asset bubbles from blowing up (Chart 5). Now China is easing policy on the margin, which should shore up activity ahead of an important Communist Party reshuffle in fall 2022. The rest of the world’s manufacturing activity is expected to continue expanding in 2022, albeit less rapidly. This trend cuts against US outperformance but still faces a range of hurdles, beginning with China. In this context, we outline three geopolitical themes for the long run as well as three key views for the coming 12 months. Our title, “The Gathering Storm,” refers to the strategic challenge that China and Russia pose to the United States, which is attempting to form a balance-of-power coalition to contain these autocratic rivals. This is the central global geopolitical dynamic in 2022 and it is ultimately inflationary. Three Strategic Themes For The Long Run The international system will remain unstable in the coming years. Global multipolarity – or the existence of multiple, competing poles of political power – is the chief destabilizing factor. This is the first of our three strategic themes that will persist next year and beyond (Table 1). Our key views for 2022, discussed below, flow from these three strategic themes. Table 1Strategic Themes For 2022 And Beyond
2022 Key Views: The Gathering Storm
2022 Key Views: The Gathering Storm
1. Great Power Rivalry Multipolarity – or great power rivalry – can be illustrated by the falling share of US economic clout relative to the rest of the world, including but not limited to strategic rivals like China. The US’s decline is often exaggerated but the picture is clear if one looks at the combined geopolitical influence of the US and its closest allies to that of the EU, China, and Russia (Chart 6).
Chart 6
China’s rise is the most destabilizing factor because it comes with economic, military, and technological prowess that could someday rival the US for global supremacy. China’s GDP has surpassed that of the US in purchasing power terms and will do so in nominal terms in around five years (Chart 7).
Chart 7
True, China’s potential growth is slowing and Chinese financial instability will be a recurring theme. But that very fact is driving Beijing to try to convert the past 40 years of economic success into broader strategic security. Chart 8America's Global Role Persists (If Lessened)
America's Global Role Persists (If Lessened)
America's Global Role Persists (If Lessened)
Since China is capable of creating an alternative political order in Asia Pacific, and ultimately globally, the United States is reacting. It is penalizing China’s economy and seeking to refurbish alliances in pursuit of a containment policy. The American reaction to the loss of influence has been unpredictable, contradictory, and occasionally belligerent. New isolationist impulses have emerged among an angry populace in reaction to gratuitous wars abroad and de-industrialization. These impulses appeared in both the Obama and Trump administrations. The Biden administration is attempting to manage these impulses while also reinforcing America’s global role. The pandemic-era stimulus has enabled the US to maintain its massive trade deficit and aggressive defense spending. But US defense spending is declining relative to the US and global economy over time, encouraging rival nations to carve out spheres of influence in their own neighborhoods (Chart 8). Russia’s overall geopolitical power has declined but it punches above its weight in military affairs and energy markets, a fact which is vividly on display in Ukraine as we go to press. The result is to exacerbate differences in the trans-Atlantic alliance between the US and the European Union, particularly Germany. The EU’s attempt to act as an independent great power is another sign of multipolarity, as well as the UK’s decision to distance itself from the continent and strengthen the Anglo-American alliance. If the US and EU do not manage their differences over how to handle Russia, China, and Iran then the trans-Atlantic relationship will weaken and great power rivalry will become even more dangerous. 2. Hypo-Globalization The second strategic theme is hypo-globalization, in which the ancient process of globalization continues but falls short of its twenty-first century potential, given advances in technology and governance that should erode geographic and national boundaries. Hypo-globalization is the opposite of the “hyper-globalization” of the 1990s-2000s, when historic barriers to the free movement of people, goods, and capital seemed to collapse overnight. Chart 9From 'Hyper-Globalization' To Hypo-Globalization
From 'Hyper-Globalization' To Hypo-Globalization
From 'Hyper-Globalization' To Hypo-Globalization
The volume of global trade relative to industrial production peaked with the Great Recession in 2008-10 and has declined slowly but surely ever since (Chart 9). Many developed markets suffered the unwinding of private debt bubbles, while emerging economies suffered the unwinding of trade manufacturing. Periods of declining trade intensity – trade relative to global growth – suggest that nations are turning inward, distrustful of interdependency, and that the frictions and costs of trade are rising due to protectionism and mercantilism. Over the past two hundred years globalization intensified when a broad international peace was agreed (such as in 1815) and a leading imperial nation was capable of enforcing law and order on the seas (such as the British empire). Globalization fell back during times of “hegemonic instability,” when the peace settlement decayed while strategic and naval competition eroded the global trading system. Today a similar process is unfolding, with the 1945 peace decaying and the US facing the revival of Russia and China as regional empires capable of denying others access to their coastlines and strategic approaches (Chart 10).1 Chart 10Hypo-Globalization And Hegemonic Instability
Hypo-Globalization And Hegemonic Instability
Hypo-Globalization And Hegemonic Instability
Chart 11Hypo-Globalization: Temporary Trade Rebound
Hypo-Globalization: Temporary Trade Rebound
Hypo-Globalization: Temporary Trade Rebound
No doubt global trade is rebounding amid the stimulus-fueled recovery from Covid-19. But the upside for globalization will be limited by the negative geopolitical environment (Chart 11). Today governments are not behaving as if they will embark on a new era of ever-freer movement and ever-deepening international linkages. They are increasingly fearful of each other’s strategic intentions and using fiscal resources to increase economic self-sufficiency. The result is regionalization rather than globalization. Chinese and Russian attempts to revise the world order, and the US’s attempt to contain them, encourages regionalization. For example, the trade war between the US and China is morphing into a broader competition that limits cooperation to a few select areas, despite a change of administration in the United States. The further consolidation of President Xi Jinping’s strongman rule will exacerbate this dynamic of distrust and economic divorce. Emerging Asia and emerging Europe live on the fault lines of this shift from globalization to regionalism, with various risks and opportunities. Generally we are bullish EM Asia and bearish EM Europe. 3. Populism And Nationalism A third strategic theme consists of populism and nationalism, or anti-establishment political sentiment in general. These forces will flare up in various forms across the world in 2022 and beyond. Even as unemployment declines, the rise in food and fuel inflation will make it difficult for low wage earners to make ends meet. The “misery index,” which combines unemployment and inflation, spiked during the pandemic and today stands at 10.8% in the US and 11.4% in the EMU, up from 5.2% and 8.1% before the pandemic, respectively (Chart 12). Large budget deficits and trade deficits, especially in the US and UK, feed into this inflationary environment. Most of the major developed markets have elected new governments since the pandemic, with the notable exception of France and Spain. Thus they have recapitalized their political systems and allowed voters to vent some frustration. These governments now have some time to try to mitigate inflation before the next election. Hence policy continuity is not immediately in jeopardy, which reduces uncertainty for investors. By contrast, many of the emerging economies face higher inflation, weak growth, and are either coming upon elections or have undemocratic political systems. Either way the result will be a failure to address household grievances promptly. The misery index is trending upward and governments are continually forced to provide larger budget deficits to shore up growth, fanning inflation (Chart 13). Chart 12DM: Political Risk High But New Governments In Place
DM: Political Risk High But New Governments In Place
DM: Political Risk High But New Governments In Place
Chart 13EM: Political Risk High But Governments Not Recapitalized
EM: Political Risk High But Governments Not Recapitalized
EM: Political Risk High But Governments Not Recapitalized
Chart 14EM Populism/Nationalism Threatens Negative Surprises In 2022
EM Populism/Nationalism Threatens Negative Surprises In 2022
EM Populism/Nationalism Threatens Negative Surprises In 2022
Just as social and political unrest erupted after the Great Recession, notably in the so-called “Arab Spring,” so will new movements destabilize various emerging markets in the wake of Covid-19. Regime instability and failure can lead to big changes in policies, large waves of emigration, wars, and other risks that impact markets. The risks are especially high unless and until Chinese imports revive. Investors should be on the lookout for buying opportunities in emerging markets once the bad news is fully priced. National and local elections in Brazil, India, South Korea, the Philippines, and Turkey will serve as market catalysts, with bad news likely to precede good news (Chart 14). Bottom Line: These three themes – great power rivalry, hypo-globalization, and populism/nationalism – are inflationary in theory, though their impact will vary based on specific events. Multipolarity means that governments will boost industrial and defense spending to gear up for international competition. Hypo-globalization means countries will attempt to put growth on a more reliable domestic foundation rather than accept dependency on an unreliable international scene, thus constraining supplies from abroad. Populism and nationalism will lead to a range of unorthodox policies, such as belligerence abroad or extravagant social spending at home. Of course, the inflationary bias of these themes can be upset if they manifest in ways that harm growth and/or inflation expectations, which is possible. But the general drift will be an inflationary policy setting. Inflation may subside in 2022 only to reemerge as a risk later. Three Key Views For 2022 Within this broader context, our three key views for 2022 are as follows: 1. China’s Reversion To Autocracy As President Xi Jinping leads China further down the road of strongman rule and centralization, the country faces a historic confluence of internal and external risks. This was our top view in 2021 and the same dynamic continues in 2022. The difference is that in 2021 the risk was excessive policy tightening whereas this coming year the risk is insufficient policy easing. Chart 15China Eases Fiscal Policy To Secure Recovery In 2022
China Eases Fiscal Policy To Secure Recovery In 2022
China Eases Fiscal Policy To Secure Recovery In 2022
China’s economy is witnessing a secular slowdown, a deterioration in governance, property market turmoil, and a rise in protectionism abroad. The long decline in corporate debt growth points to the structural slowdown. Animal spirits will not improve in 2022 so government spending will be necessary to try to shore up overall growth. The Politburo signaled that it will ease fiscal policy at the Central Economic Work Conference in early December, a vindication of our 2021 view. Neither the combined fiscal-and-credit impulse nor overall activity, indicated by the Li Keqiang Index, have shown the slightest uptick yet (Chart 15). Typically it takes six-to-nine months for policy easing to translate to an improvement in real economic activity. The first half of the year may still bring economic disappointments. But policymakers are adjusting to avoid a crash. Policy will grow increasingly accommodative as necessary in the first half of 2022. The key political constraint is the Communist Party’s all-important political reshuffle, the twentieth national party congress, to be held in fall 2022 (usually October). While Xi may not want the economy to surge in 2022, he cannot afford to let it go bust. The experience of previous party congresses shows that there is often a policy-driven increase in bank loans and fixed investment. Current conditions are so negative as to ensure that the government will provide at least some support, for instance by taking a “moderately proactive approach” to infrastructure investment (Chart 16). Otherwise a collapse of confidence would weaken Xi’s faction and give the opposition faction a chance to shore up its position within the Communist Party. Chart 16China Aims For Stability, Not Rapid Growth, Ahead Of 20th National Party Congress
China Aims For Stability, Not Rapid Growth, Ahead Of 20th National Party Congress
China Aims For Stability, Not Rapid Growth, Ahead Of 20th National Party Congress
Party congresses happen every five years but the ten-year congresses, such as in 2022, are the most important for the country’s overall political leadership. The party congresses in 1992, 2002, and 2012 were instrumental in transferring power from one leader to the next, even though the transfer of power was never formalized. Back in 2017 Xi arranged to stay in power indefinitely but now he needs to clinch the deal, lest any unforeseen threat emerge from at home or abroad. Xi’s success in converting the Communist Party from “consensus rule” to his own “personal rule” will be measurable by his success in stacking the Politburo and Politburo Standing Committee with factional allies. He will also promote his faction across the Central Committee so as to shape the next generations of party leaders and leave his imprint on policy long after his departure. The government will be extremely sensitive to any hint of dissent or resistance and will move aggressively to quash it. Investors should not be surprised to see high-level sackings of public officials or private magnates and a steady stream of scandals and revelations that gain prominence in western media. The environment is also ripe for strange and unexpected incidents that reveal political differences beneath the veneer of unity in China: defections, protests, riots, terrorist acts, or foreign interference. Most incidents will be snuffed out quickly but investors should be wary of “black swans” from China in 2022. Chinese government policies will not be business friendly in 2022 aside from piecemeal fiscal easing. Everything Beijing does will be bent around securing Xi’s supremacy at all levels. Domestic politics will take precedence over economic concerns, especially over the interests of private businesses and foreign investors, as is clear when it comes to managing financial distress in the property sector. Negative regulatory surprises and arbitrary crackdowns on various industrial sectors will continue, though Beijing will do everything in its power to prevent the property bust from triggering contagion across the economic system. This will probably work, though the dam may burst after the party congress. Relations with the US and the West will remain poor, as the democracies cannot afford to endorse what they see as Xi’s power grab, the resurrection of a Maoist cult of personality, and the betrayal of past promises of cooperation and engagement. America’s midterm election politics will not be conducive to any broad thaw in US-China relations. While China will focus on domestic politics, its foreign policy actions will still prove relatively hawkish. Clashes with neighbors may be instigated by China to warn away any interference or by neighbors to try to embarrass Xi Jinping. The South and East China Seas are still ripe for territorial disputes to flare. Border conflicts with India are also possible. Taiwan remains the epicenter of global geopolitical risk. A fourth Taiwan Strait Crisis looms as China increases its military warnings to Taiwan not to attempt anything resembling independence (Chart 17A). China may use saber-rattling, economic sanctions, cyber war, disinformation, and other “gray zone” tactics to undermine the ruling party ahead of Taiwan’s midterm elections in November 2022 and presidential elections in January 2024. A full-scale invasion cannot be ruled out but is unlikely in the short run, as China still has non-military options to try to arrange a change of policy in Taiwan.
Chart 17
Chart 17BMarket-Based Risk Indicators Say China/Taiwan Risk Has Not Peaked
Market-Based Risk Indicators Say China/Taiwan Risk Has Not Peaked
Market-Based Risk Indicators Say China/Taiwan Risk Has Not Peaked
China has not yet responded to the US’s deployment of a small number of troops in Taiwan or to recent diplomatic overtures or arms sales. It could stage a major show of force against Taiwan to help consolidate power at home. China also has an interest in demonstrating to US allies and partners that their populations and economies will suffer if they side with Washington in any contingency. Given China’s historic confluence of risks, it is too soon for global investors to load up on cheap Chinese equities. Volatility will remain high. Weak animal spirits, limited policy easing, high levels of policy uncertainty, regulatory risk, ongoing trade tensions, and geopolitical risks suggest that investors should remain on the sidelines, and that a large risk premium can persist throughout 2022. Our market-based geopolitical risk indicators for both China and Taiwan are still trending upwards (Chart 17B). Global investors should capitalize on China’s policy easing indirectly by investing in commodities, cyclical equity sectors, and select emerging markets. 2. America’s Policy Insularity Our second view for 2022 centers on the United States, which will focus on domestic politics and will thus react or overreact to the many global challenges it faces. The US faces the first midterm election after the chaotic and contested 2020 presidential election. Political polarization remains at historically high levels, meaning that social unrest could flare up again and major domestic terrorist incidents cannot be ruled out. So far the Biden administration has focused on the domestic scene: mitigating the pandemic and rebooting the economy. Biden’s signature “Build Back Better” bill, $1.75 trillion investment in social programs, has passed the House of Representatives but not the Senate. The spike in inflation has shaken moderate Democratic senators who are now delaying the bill. We expect it to pass, since tax hikes were dropped, but our conviction is low (65% subjective odds), as a single defection would derail the bill. The implication would be inflationary since it would mark a sizable increase in government spending at a time when the output gap is already virtually closed. Spending would likely be much larger than the Congressional Budget Office estimate, shown in Chart 18, because the bill contains various gimmicks and hard-to-implement expiration clauses. Equity markets may not sell if the bill fails, since more fiscal stimulus would put pressure on the Federal Reserve to hike rates faster.
Chart 18
Chart 19
Whether the bill passes or fails, Biden’s legislative agenda will be frozen thereafter. He will have to resort to executive powers and foreign policy to lift his approval rating and court the median voter ahead of the midterm elections. Currently Democrats are lined up to lose the House and probably also the Senate, where a single seat would cost them their majority (Chart 19). The Senate is still in play so Biden will be averse to taking big risks. For the same reason, Biden’s foreign policy goal will be to stave off various bubbling crises. Restoring the Iranian nuclear deal was his priority but Russia has now forced its way to the top of the agenda by threatening a partial reinvasion of Ukraine. In this context Biden will not have room for maneuver with China. Congress will be hawkish on China ahead of the midterms, and Xi Jinping will be reviving autocracy, so Biden will not be able to improve relations much. Biden’s domestic policy could fuel inflation, while his domestic-focused foreign policy will embolden strategic rivals, which increases geopolitical risks. 3. Petro-State Leverage A surge in gasoline prices at the pump ahead of the election would be disastrous for a Democratic Party that is already in disarray over inflation (Chart 20). Biden has already demonstrated that he can coordinate an international release of strategic oil reserves this year. Oil and natural gas producers gain leverage when the global economy rebounds, commodity prices rise, and supply/demand balances tighten. The frequency of global conflicts, especially those involving petro-states, tend to rise and fall in line with oil prices (Chart 21). Chart 20Inflation Constrains Biden Ahead Of Midterms
Inflation Constrains Biden Ahead Of Midterms
Inflation Constrains Biden Ahead Of Midterms
Chart 21
Both Russia and Iran are vulnerable to social unrest at home and foreign strategic pressure abroad. Both have long-running conflicts with the US and West that are heating up for fundamental reasons, such as Russia’s fear of western influence in the former Soviet Union and Iran’s nuclear program. Both countries are demanding that the US make strategic concessions to atone for the Trump administration’s aggressive policies: selling lethal weapons to Ukraine and imposing “maximum pressure” sanctions on Iran. Biden is not capable of making credible long-term agreements since he could lose office as soon as 2025 and the next president could reverse whatever he agrees. But he must try to de-escalate these conflicts or else he faces energy shortages or price shocks, which would raise the odds of stagflation ahead of the election. The path of least resistance for Biden is to lift the sanctions on Iran to prevent an escalation of the secret war in the Middle East. If this unilateral concession should convince Iran to pause its nuclear activities before achieving breakout uranium enrichment capability, then Biden would reduce the odds of a military showdown erupting across the region. Opposition Republicans would accuse him of weakness but public opinion polls show that few Americans consider Iran a major threat. The problem is that this logic held throughout 2021 and yet Biden did not ease the sanctions. Given Iran’s nuclear progress and the US’s reliance on sanctions, we see a 40% chance of a military confrontation with Iran over the coming years. With regard to Ukraine, an American failure to give concessions to Russia will probably result in a partial reinvasion of Ukraine (50% subjective odds). This in turn will force the US and EU to impose sanctions on Russia, leading to a squeeze of natural gas prices in Europe and eventually price pressures in global energy markets. If Biden grants Russia’s main demands, he will avoid a larger war or energy shock but will make the US vulnerable to future blackmail. He will also demoralize Taiwan and other US partners who lack mutual defense treaties. But he may gain Russian cooperation on Iran. If Biden gives concessions to both Russia and Iran, his party will face criticism in the midterms but it will be far less vulnerable than if an energy shock occurs. This is the path of least resistance for Biden in 2022. It means that the petro-states may lose their leverage after using it, given that risk premiums would fall on Biden’s concessions. Of course, if energy shocks happen, Europe and China will suffer more than the US, which is relatively energy independent. For this reason Brussels and Beijing will try to keep diplomacy alive as long as possible. Enforcement of US sanctions on Iran may weaken, reducing Iran’s urgency to come into compliance. Germany may prevent a hardline threat of sanctions against Russia, reducing Russia’s fear of consequences. Again, petro-states have the leverage. Therefore investors should guard against geopolitically induced energy price spikes or shocks in 2022. What if other commodity producers, such as Saudi Arabia, crank up production and sink oil prices? This could happen. Yet the Saudis prefer elevated oil prices due to the host of national challenges they face in reforming their economy. If the US eases sanctions on Iran then the Saudis may make this decision. Thus downside energy price shocks are possible too. The takeaway is energy price volatility but for the most part we see the risk as lying to the upside. Investment Takeaways Traditional geopolitical risk, which focuses on war and conflict, is measurable and has slipped since 2015, although it has not broken down from the general uptrend since 2000. We expect the secular trend to be reaffirmed and for geopolitical risk to resume its rise due to the strategic themes and key views outlined above. The correlation of geopolitical risk with financial assets is debatable – namely because some geopolitical risks push up oil and commodity prices at the expense of the dollar, while others cause a safe-haven rally into the dollar (Chart 22). Global economic policy uncertainty is also measurable. It is in a secular uptrend since the 2008 financial crisis. Here the correlation with the US dollar and relative equity performance is stronger, which makes sense. This trend should also pick up going forward, which is at least not negative for the dollar and relative US equity performance (Chart 23). Chart 22Geopolitical Risk Will Rise, Market Impacts Variable
Geopolitical Risk Will Rise, Market Impacts Variable
Geopolitical Risk Will Rise, Market Impacts Variable
Chart 23Economic Policy Uncertainty Will Rise, Not Bad For US Assets
Economic Policy Uncertainty Will Rise, Not Bad For US Assets
Economic Policy Uncertainty Will Rise, Not Bad For US Assets
We are neutral on the US dollar versus the euro and recommend holding either versus the Chinese renminbi. We are short the currencies of emerging markets that suffer from great power rivalry, namely the Taiwanese dollar versus the US dollar, the Korean won versus the Japanese yen, the Russian ruble versus the Canadian dollar, and the Czech koruna versus the British pound. We remain long gold as a hedge against both geopolitical risk and inflation. We recommend staying long global equities. Tactically we prefer large caps and defensives. Within developed markets, we favor the UK and Japan. Japan in particular will benefit from Chinese policy easing yet remains more secure from China-centered geopolitical risks than emerging Asian economies. Within emerging markets, Mexico stands to benefit from US economic strength and divorce from China. We would buy Indian equities on weakness and sell Chinese and Russian equities on strength. We remain long aerospace and defense stocks and cyber-security stocks. -The GPS Team We Read (And Liked) … Conspiracy U: A Case Study “Crazy, worthless, stupid, made-up tales bring out the demons in susceptible, unthinking people.” Thus the author’s father, a Holocaust survivor translated from Yiddish, on conspiracy theories and the real danger they present in the world. Scott A. Shay, author and chairman of Signature Bank, whose first book was a finalist for the National Jewish Book Award, has written an intriguing new book on the topic and graciously sent it our way.2 Shay is a regular reader of BCA Research’s Geopolitical Strategy and an astute observer of international affairs. He is also a controversialist who has written essays for several of America’s most prominent newspapers. Shay’s latest, Conspiracy U, is a bracing read that we think investors will benefit from. We say this not because of its topical focus, which is too confined, but because of its broader commentary on history, epistemology, the US higher education system – and the very timely and relevant problem of conspiracy theories, which have become a prevalent concern in twenty-first century politics and society. The author and the particular angle of the book will be controversial to some readers but this very quality makes the book well-suited to the problem of the conspiracy theory, since it is not the controversial nature of conspiracy theories but their non-falsifiability that makes them specious. As the title suggests, the book is a polemical broadside. The polemic arises from Shay’s unique set of moral, intellectual, and sociopolitical commitments. This is true of all political books but this one wears its topicality on its sleeve. The term “conspiracy” in the title refers to antisemitic, anti-Israel, and anti-Zionist conspiracy theories, particularly the denial of the Holocaust, coming from tenured academics on both the right and the left wings of American politics. The “U” in the title refers to universities, namely American universities, with a particular focus on the author’s beloved alma mater, Northwestern University in Chicago, Illinois. Clearly the book is a “case study” – one could even say the prosecution of a direct and extended public criticism of Northwestern University – and the polemical perspective is grounded in Shay’s Jewish identity and personal beliefs. Equally clearly Shay makes a series of verifiable observations and arguments about conspiracy theories as a contemporary phenomenon and their presence, as well as the presence of other weak and lazy modes of thought, in “academia writ large.” This generalization of the problem is where most readers will find the value of the book. The book does not expect one to share Shay’s identity, to be a Zionist or support Zionism, or to agree with Israel’s national policies on any issue, least of all Israeli relations with Arabs and Palestinians. Shay’s approach is rigorous and clinical. He is a genuine intellectual in that he considers the gravest matters of concern from various viewpoints, including viewpoints radically different from his own, and relies on close readings of the evidence. In other words, Shay did not write the book merely to convince people that two tenured professors at Northwestern are promoting conspiracy theories. That kind of aberration is sadly to be expected and at least partially the result of the tenure system, which has advantages as well, not within the scope of the book. Rather Shay wrote it to provide a case study for how it is that conspiracy theories can manage to be adopted by those who do not realize what they are and to proliferate even in areas that should be the least hospitable – namely, public universities, which are supposed to be beacons of knowledge, science, openness, and critical thinking, but also other public institutions, including the fourth estate. Shay is meticulous with his sources and terminology. He draws on existing academic literature to set the parameters of his subject, defining conspiracy theories as “improbable hypotheses [or] intentional lies … about powerful and sinister groups conspiring to harm good people, often via a secret cabal.” The definition excludes “unwarranted criticism” and “unfair/prejudiced perspectives,” which are harmful but unavoidable. Many prejudices and false beliefs are “still falsifiable in the minds of their adherents,” which is not the case with conspiracy theories, although deep prejudices can obviously be helpful in spreading such theories. Conspiracy theories often depend on “a stunning amount of uniformity of belief and coordination of action without contingencies.” They also rely excessively on pathos, or emotion, in making their arguments, as opposed to logos (reason) and ethos (credibility, authority). Unfortunately there is no absolute, infallible distinction between conspiracy theories and other improbable theories – say, yet-to-be-confirmed theories about conspiracies that actually occurred. Conspiracy theories differ from other theories “in their relationship to facts, evidence, and logic,” which may sound obvious but is very much to the point. Again, “the key difference is the evidence and how it is evaluated.” There is no ready way to refute the fabrications, myths, and political propaganda that people believe without taking the time to assess the claims and their foundations. This requires an open mind and a grim determination to get to the bottom of rival claims about events even when they are extremely morally or politically sensitive, as is often the case with wars, political conflicts, atrocities, and genocides: Reliable historians, journalists, lawyers, and citizens must first approach the question of the cause or the identity of perpetrators and victims of an event or process with an open mind, not prejudiced to either party, and then evaluate the evidence. The diagnosis may be easy but the treatment is not – it takes time, study, and debate, and one’s interlocutors must be willing to be convinced. This problem of convincing others is critical because it is the part that is so often left out of modern political discourse. Conspiracy theories are often hateful and militant, so there is a powerful urge to censor or repress them. Openly debating with conspiracy theorists runs the risk of legitimizing or appearing to legitimize their views, providing them with a public forum, which seems to grant ethos or authority to arguments that are otherwise conspicuously lacking in it. In some countries censorship is legal, almost everywhere when violence is incited. The problem is that the act of suppression can feed the same conspiracy theories, so there is a need, in the appropriate context, to engage with and refute lies and specious arguments. Clients frequently email us to ask our view of the rise of conspiracy theories and what they entail for the global policy backdrop. We associate them with the broader breakdown in authority and decline of public trust in institutions. Shay’s book is an intervention into this topic that clients will find informative and thought-provoking, even if they disagree with the author’s staunchly pro-Israel viewpoint. It is precisely Shay’s ability to discuss and debate extremely contentious matters in a lucid and empirical manner – antisemitism, the history of Zionism, Holocaust denialism, Arab-Israeli relations, the Rwandan genocide, QAnon, the George Floyd protests, various other controversies – that enables him to defend a controversial position he holds passionately, while also demonstrating that passion alone can produce the most false and malicious arguments. As is often the case, the best parts of the book are the most personal – when Shay tells about his father’s sufferings during the Holocaust, and journey from the German concentration camps to New York City, and about Shay’s own experiences scraping enough money together to go to college at Northwestern. These sequences explain why the author felt moved to stage a public intervention against fringe ideological currents, which he shows to have gained more prominence in the university system than one might think. The book is timely, as American voters are increasingly concerned about the handling of identity, inter-group relations, history, education, and ideology in the classroom, resulting in what looks likely to become a new and ugly episode of the culture and education wars. Let us hope that Shay’s standards of intellectual freedom and moral decency prevail. Matt Gertken, PhD Vice President Geopolitical Strategy mattg@bcaresearch.com Footnotes 1 The downshift in globalization today is even worse than it appears in Chart 10 because several countries have not yet produced the necessary post-pandemic data, artificially reducing the denominator and making the post-pandemic trade rebound appear more prominent than it is in reality. 2 Scott A. Shay, Conspiracy U: A Case Study (New York: Post Hill Press, 2021), 279 pages. Strategic Themes Open Tactical Positions (0-6 Months) Open Cyclical Recommendations (6-18 Months) Appendix: GeoRisk Indicator China
China: GeoRisk Indicator
China: GeoRisk Indicator
Russia
Russia: GeoRisk Indicator
Russia: GeoRisk Indicator
United Kingdom
UK: GeoRisk Indicator
UK: GeoRisk Indicator
Germany
Germany: GeoRisk Indicator
Germany: GeoRisk Indicator
France
France: GeoRisk Indicator
France: GeoRisk Indicator
Italy
Italy: GeoRisk Indicator
Italy: GeoRisk Indicator
Canada
Canada: GeoRisk Indicator
Canada: GeoRisk Indicator
Spain
Spain: GeoRisk Indicator
Spain: GeoRisk Indicator
Taiwan
Taiwan Territory: GeoRisk Indicator
Taiwan Territory: GeoRisk Indicator
Korea
Korea: GeoRisk Indicator
Korea: GeoRisk Indicator
Turkey
Turkey: GeoRisk Indicator
Turkey: GeoRisk Indicator
Brazil
Brazil: GeoRisk Indicator
Brazil: GeoRisk Indicator
Australia
Australia: GeoRisk Indicator
Australia: GeoRisk Indicator
South Africa
South Africa: GeoRisk Indicator
South Africa: GeoRisk Indicator
Section III: Geopolitical Calendar
Dear Clients, This is the final publication for the year, in which we recap some of the key economic developments this month. Our publishing schedule will resume on January 6, 2022. The China Investment Strategy team wishes you a very happy and safe holiday season and a prosperous New Year! Best regards, Jing Sima China Strategist Feature Recently released data show China’s economy is weakening despite easing monetary policy and power-supply constraints. Our credit impulse – measured by the year-on-year change in total social financing as a share of GDP – inched up in November (Chart 1, top panel). Given that the indicator leads economic activity by about six to nine months, we maintain the view that China’s economy will not bottom until Q2 next year. Chinese stocks, driven by business cycle, will remain under downward pressures in the next three to six months (Chart 1, middle and bottom panels). On the policy front, the PBoC announced a 50bps cut in the reserve requirement ratio (RRR) rate taking effect in mid-December. Last week’s Central Economic Work Conference (CEWC) signaled that stabilizing the economy will be the government’s core policy objective for 2022. However, we believe that policymakers will be data dependent and will only allow an overshoot in credit growth when the slowdown in the economy gathers pace in early 2022. Thus, investors should maintain an underweight allocation to Chinese equities relative to global stocks, at least for the next three to six months, until credit growth significantly improves. Chart 1Downside Risks Remain High For Chinese Stocks Until The Econmomy Troughs
Downside Risks Remain High For Chinese Stocks Until The Econmomy Troughs
Downside Risks Remain High For Chinese Stocks Until The Econmomy Troughs
Chart 2Chinese Internet Stocks Are Not Cheap
Chinese Internet Stocks Are Not Cheap
Chinese Internet Stocks Are Not Cheap
Chinese investable stocks, particularly internet companies, will continue to face geopolitical and regulatory headwinds in the next 12 months. Chinese tech stocks sold off this year, but they are not cheap (Chart 2). Economic weakness in the onshore market in the next three to six months may trigger more selloffs and further multiples compressions in Chinese investable stocks. Qingyun Xu, CFA Associate Editor qingyunx@bcaresearch.com Cuts To The RRR And Relending Rates: Not Game Changers Chart 3RRR Cut Is Not A Game Changer
RRR Cut Is Not A Game Changer
RRR Cut Is Not A Game Changer
Following the RRR cut announcement in early December, the PBoC announced a 25bps decrease in the relending rate targeting agriculture and small businesses (Chart 3). The measures sent an easing signal in response to mounting downside risks in the economy. However, their impact on credit growth will likely be limited for the following reasons: First, the PBoC indicated that the RRR cut will release around RMB1.2 trillion in liquidity to the banks. From that amount, RMB950 billion will be used to replace maturing Medium-term Lending Facility (MLF) this month, which leaves only RMB250 billion for new liquidity injection. Chart 4Business Conditions For SMEs Deteriorated Faster Than For Larger Businesses
Business Conditions For SMEs Deteriorated Faster Than For Larger Businesses
Business Conditions For SMEs Deteriorated Faster Than For Larger Businesses
Secondly, the PBoC is trying to prevent a jump in market-based rates in the next two quarters. Demand for liquidity is usually high due to tax season by year-end plus a front-loading of local government bond (LGB) issuance. Moreover, the Chinese New Year in Q1 2022 will further boost demand for liquidity. Thirdly, the targeted relending rate drop is intended to lower the borrowing costs of small-medium enterprises (SMEs) whose profitability has been challenged by rising input costs and sluggish consumer demand (Chart 4). Loan demand from small enterprises, as shown in the PBoC survey, peaked much earlier and tumbled more rapidly than their larger peers (Chart 4, bottom panel). The rate cut has decreased the possibility of a broadly based decline in interest rates in the near-term. China’s Credit Growth May Have Bottomed, But The Rebound Is Moderate Chart 5Below-Expectation Credit Growth In November
Below-Expectation Credit Growth In November
Below-Expectation Credit Growth In November
China’s aggregate credit growth ticked up slightly in November. The modest advance mainly reflects an acceleration in LGB issuance. Chart 5 highlights that excluding LGB financing, China’s credit impulse remains on a downward trend. LGBs will be frontloaded in Q1 2022 before the March National People’s Congress sets the full-year quota for LGBs. However, without a meaningful rebound in bank loan growth, the effects of LGB issuance on infrastructure investment will be limited and short-lived, as occurred in Q1 2019 (Chart 6). Shadow banking, which historically has had a tight correlation with infrastructure investment, continued to slide in November to an all-time low. Infrastructure project approval also does not show any signs of strengthening (Chart 7). Chart 6Improvement In Infrastructure Investment Will Be Limited Without An Acceleration In Loan Growth
Improvement In Infrastructure Investment Will Be Limited Without An Acceleration In Loan Growth
Improvement In Infrastructure Investment Will Be Limited Without An Acceleration In Loan Growth
Chart 7Key Indicators Show Weak Signs Of Revival In Infrastructure Spending
Key Indicators Show Weak Signs Of Revival In Infrastructure Spending
Key Indicators Show Weak Signs Of Revival In Infrastructure Spending
Weak demand for bank loans from corporations dragged down credit growth in November as evidenced by softening growth in medium- and long-term corporate loans (Chart 8). Both corporate financing needs and investment willingness continued to wane, implying that corporate demand for bank lending may not turn around soon despite recent monetary easing (Chart 8, bottom panel). In addition, marginal easing measures in the property market have not worked their way into the sector. Bank loans to real estate developers plummeted to all-time lows last month, while trust loans contracted significantly in November, which indicates that financing conditions for real estate developers have not improved (Chart 9). Chart 8Loan Demand Remains Weak And Unlikely To Turn Around Imminently
Loan Demand Remains Weak And Unlikely To Turn Around Imminently
Loan Demand Remains Weak And Unlikely To Turn Around Imminently
Chart 9Deepening Contraction In Trust Loans Indicates Deteriorating Financing Conditions For Real Estate Developers
Deepening Contraction In Trust Loans Indicates Deteriorating Financing Conditions For Real Estate Developers
Deepening Contraction In Trust Loans Indicates Deteriorating Financing Conditions For Real Estate Developers
Easing Of Property Restrictions Will Marginally Benefit The Housing Market Last week’s Politburo meeting and the CEWC both proposed to promote affordable rental housing and support reasonable housing demand. Loan growth to government-subsidized social welfare housing has been decelerating since 2018 and started to contract this year (Chart 10). It will likely strengthen next year amid policy support, but from a very low level and at a modest rate. In addition, although social welfare housing loans account for around 40% of bank loans to real estate developers, they are only about 6% of developers’ total source of funding as of 2020. We expect more policy finetuning in the coming months, which may help slow the pace of deterioration in real estate developers’ financing conditions. Real estate developers’ financing from banks may bottom on the back of government’s intervention, but the improvement in total funds to developers will be gradual without mortgage rate cuts and a pickup in home sales (Chart 11). Meanwhile, the downward trend in housing completion will be sustained in the coming months (Chart 11, top panel). Chart 10Bank Loans To Social Welfare Housing Will Likely Improve Modestly Amid Policy Support
Bank Loans To Social Welfare Housing Will Likely Improve Modestly Amid Policy Support
Bank Loans To Social Welfare Housing Will Likely Improve Modestly Amid Policy Support
Chart 11Less Funding = Reduced Completions And Investments
Less Funding = Reduced Completions And Investments
Less Funding = Reduced Completions And Investments
Housing prices in most Tier-one and Tier-two cities continued to move down through November. Data for high-frequency floor space sold show that housing demand continued to abate last month despite a modest uptick in household mortgage loans (Chart 12). Home sales will remain depressed as buyers expect more discounts in housing prices and real estate tax reforms loom. Falling prices and constraints in developers’ financing will continue to weigh on housing starts, given the strong positive correlation between property starts and housing prices (Chart 13). Chart 12Demand For Housing In November Showed Little Signs Of Revival
Demand For Housing In November Showed Little Signs Of Revival
Demand For Housing In November Showed Little Signs Of Revival
Chart 13Housing Starts Are Highly Correlated With Prices
Housing Starts Are Highly Correlated With Prices
Housing Starts Are Highly Correlated With Prices
The Rebound In November’s PMI Does Not Signal A Bottom In China’s Economy Chart 14China's PMI Rebounds Amid Supply-Side Improvement
China's PMI Rebounds Amid Supply-Side Improvement
China's PMI Rebounds Amid Supply-Side Improvement
The NBS manufacturing PMI returned to above the 50-expansionary threshold in November, but the rise reflects a near-term supply-side improvement related to the power shortage rather than a demand-driven recovery (Chart 14). China’s overall business conditions and domestic demand are still worsening, indicating that the rebound in the manufacturing PMI may be short-lived. The production subindex jumped by three and half percentage points in November from October, reflecting re-started operation of heavy-industry enterprises that were halted amid electricity shortages in September and October. Robust global demand for China’s manufactured goods supported a strong reading in November’s new export orders subindex. However, domestic demand remains lackluster. A proxy for the new domestic orders derived from the PMI reached its lowest level since February 2020 (Chart 14, bottom panel). In addition, service PMI weakened last month. A sharp resurgence in domestic COVID cases curbed service sector activity last month. Given uncertainties surrounding the Omicron variant and China’s zero-tolerance policy towards COVID, the service sector’s recovery will likely remain below-trend into 1H 2022 (Chart 15 and 16). Chart 15Lingering COVID Effects Will Continue To Impede Service Sector Activity In 1H22
Lingering COVID Effects Will Continue To Impede Service Sector Activity In 1H22
Lingering COVID Effects Will Continue To Impede Service Sector Activity In 1H22
Chart 16Service Sector Recovery In China Has Lagged
Service Sector Recovery In China Has Lagged
Service Sector Recovery In China Has Lagged
Inflation Passthroughs Ongoing Producer price index (PPI) inflation may have peaked. Meanwhile, the consumer price index (CPI) shows another upturn in November. Despite the peak in PPI inflation, it will likely remain above trend through at least 1H22, supported by elevated commodity and energy prices (Chart 17). Chart 17PPI May Have Peaked, But Will Remain Elevated In The Near Term
PPI May Have Peaked, But Will Remain Elevated In The Near Term
PPI May Have Peaked, But Will Remain Elevated In The Near Term
Chart 18Ongoing Inflation Passthroughs
Ongoing Inflation Passthroughs
Ongoing Inflation Passthroughs
A synchronized rise between PPI consumer goods and non-food CPI, and a narrower gap between PPI and CPI inflation, suggest an ongoing inflation passthrough from producers to consumers (Chart 18). Price increases in some key sectors of manufactured consumer goods sped up in November (Chart 19). However, we do not think China’s consumer price inflation will prevent policymakers from further policy easing. Consumer goods prices are lightly weighted in China’s CPI. An acceleration in inflation passthroughs in this component is unlikely to significantly push up the CPI aggregates. Headline CPI may gather steam next year if food prices rise while energy prices remain at current levels. Nonetheless, in recent years China’s monetary policymaking has been more tightly correlated with the PPI and core CPI, and not headline CPI (Chart 20). Chart 19Manufactured Consumer Goods Prices On The Rise
Manufactured Consumer Goods Prices On The Rise
Manufactured Consumer Goods Prices On The Rise
Chart 20Monetary Policy Is Tightly Correlated With Core CPI And Not Headline CPI
Monetary Policy Is Tightly Correlated With Core CPI And Not Headline CPI
Monetary Policy Is Tightly Correlated With Core CPI And Not Headline CPI
Surging Prices Underpin China’s Exports, While The Rebound In Imports Is Unsustainable Chart 21Surging Export Prices Underpinned Strong Growth In The Value Of China's Exports
Surging Export Prices Underpinned Strong Growth In The Value Of China's Exports
Surging Export Prices Underpinned Strong Growth In The Value Of China's Exports
Chinese exports in volume tumbled in November, however, surging export prices underpinned the strong growth in the value of exports (Chart 21). Demand from the US drove Chinese exports this year and the moderation in volume growth was more than offset by escalating prices (Chart 22). China’s export prices have caught up with the global average (Chart 23). Chart 22Strong Demand From US Has Driven Up China's Exports
Strong Demand From US Has Driven Up China's Exports
Strong Demand From US Has Driven Up China's Exports
Chart 23Chinese Export Prices Have Caught Up With The Global Average
Chinese Export Prices Have Caught Up With The Global Average
Chinese Export Prices Have Caught Up With The Global Average
We expect China’s export growth to slow in the new year on the back of softer global growth and a rotation in US household consumption from goods to services (Chart 24). However, while slowing, global economic growth is projected to remain above trend. The low level of industrial inventories will also provide support to the demand for goods, which will help to sustain strong growth in Chinese exports (Chart 25). China’s imports surprised to the upside in November, boosted by imports of commodities such as coal and crude oil. November’s acceleration in imports reflects a higher demand for primary commodities from Chinese producers, who recovered some production capacity from the power shortages in the previous few months. Chart 24US Household Spending Will Shift From Goods To Services
US Household Spending Will Shift From Goods To Services
US Household Spending Will Shift From Goods To Services
Chart 25Inventory Restocking In The US Will Support Chinese Exports Next Year
Inventory Restocking In The US Will Support Chinese Exports Next Year
Inventory Restocking In The US Will Support Chinese Exports Next Year
Furthermore, the increase in import prices in November outpaced the very modest uptick in the volume of imports, indicating that domestic demand remains sluggish (Chart 26). Credit growth, which normally leads import growth by about six months, only climbed moderately in November and will provide limited support to imports in the coming months (Chart 27). Chart 26Rising Import Prices Masked Weakness In China's Domestic Demand
Rising Import Prices Masked Weakness In China's Domestic Demand
Rising Import Prices Masked Weakness In China's Domestic Demand
Chart 27Modest Rebound In Credit Impulse Will Provide Little Support To Chinese Imports
Modest Rebound In Credit Impulse Will Provide Little Support To Chinese Imports
Modest Rebound In Credit Impulse Will Provide Little Support To Chinese Imports
Chart 28Chinese Demand For Industrial Metals Remains In Deep Contraction
Chinese Demand For Industrial Metals Remains In Deep Contraction
Chinese Demand For Industrial Metals Remains In Deep Contraction
China’s imports of industrial metals, such as copper and steel, improved a little in November, but their year-on-year growth remains in deep contraction (Chart 28). Weakening construction activity amid a continued downtrend in China’s property market will likely reduce the demand for industrial metals. Therefore, the rebound in November’s import growth may be short-lived. The RMB Faces Headwinds In 2022 Regardless Of A Rise In FX Deposit RRR The RMB has climbed about 2% against the dollar since late July despite broad-based dollar strength. In trade-weighted terms, the RMB is at its strongest level since late 2015 (Chart 29). A rapidly appreciating RMB does not bode well for China’s industrial sector profits, and thus not at the PBoC’s best interests (Chart 30). Under this backdrop, last week the PBoC announced that it will raise the banks’ foreign exchange (FX) deposit reserve requirement ratio (RRR) to 9% from 7%, effective December 15. This is the second increase this year aimed at easing the RMB’s pace of appreciation. The RMB fell slightly against the US dollar following the announcement last week. Chart 29The RMB Has Strengthened Despite A Strong USD
The RMB Has Strengthened Despite A Strong USD
The RMB Has Strengthened Despite A Strong USD
Chart 30Strengthening RMB Does Not Bode Well For Corporate Profit Growth
Strengthening RMB Does Not Bode Well For Corporate Profit Growth
Strengthening RMB Does Not Bode Well For Corporate Profit Growth
The RMB appreciation against dollar this year was mainly enhanced by China’s record current account surplus and favorable interest rate differentials between China and the US (Chart 31 and 32). Although the increase in the deposit RRR rate will force banks to hold more foreign currencies and lift the cost of RMB speculation, the RRR hike itself has little impact on altering the existing path in RMB exchange rate. Moreover, the balance of FX deposits stands at US$1 trillion as of November this year. The 200bps increase in the FX deposit reserve ratio will only freeze about US$20 billion in FX liquidity, which is negligible compared with the US$580 billion in China’s trade surplus so far this year. Chart 31Current Account Surplus Will Likely Shrink Next Year
Current Account Surplus Will Likely Shrink Next Year
Current Account Surplus Will Likely Shrink Next Year
Chart 32Interest Rate Differentials Will Narrow Further
Interest Rate Differentials Will Narrow Further
Interest Rate Differentials Will Narrow Further
However, looking forward the conditions favored RMB this year are at risk of reversing in 2022. China’s weaker economic fundamentals and a slower pace in trade surplus next year, as well as narrowed interest rate differentials between the US and China due to falling long-duration bond yields in China, will provide headwinds to RMB. Therefore, investors should closely follow these key factors and to be cautious to bet on continued RMB appreciation. Table 1China Macro Data Summary
More Slowdown To Come Before More Easing
More Slowdown To Come Before More Easing
Table 2China Financial Market Performance Summary
More Slowdown To Come Before More Easing
More Slowdown To Come Before More Easing
Footnotes Market/Sector Recommendations Cyclical Investment Stance
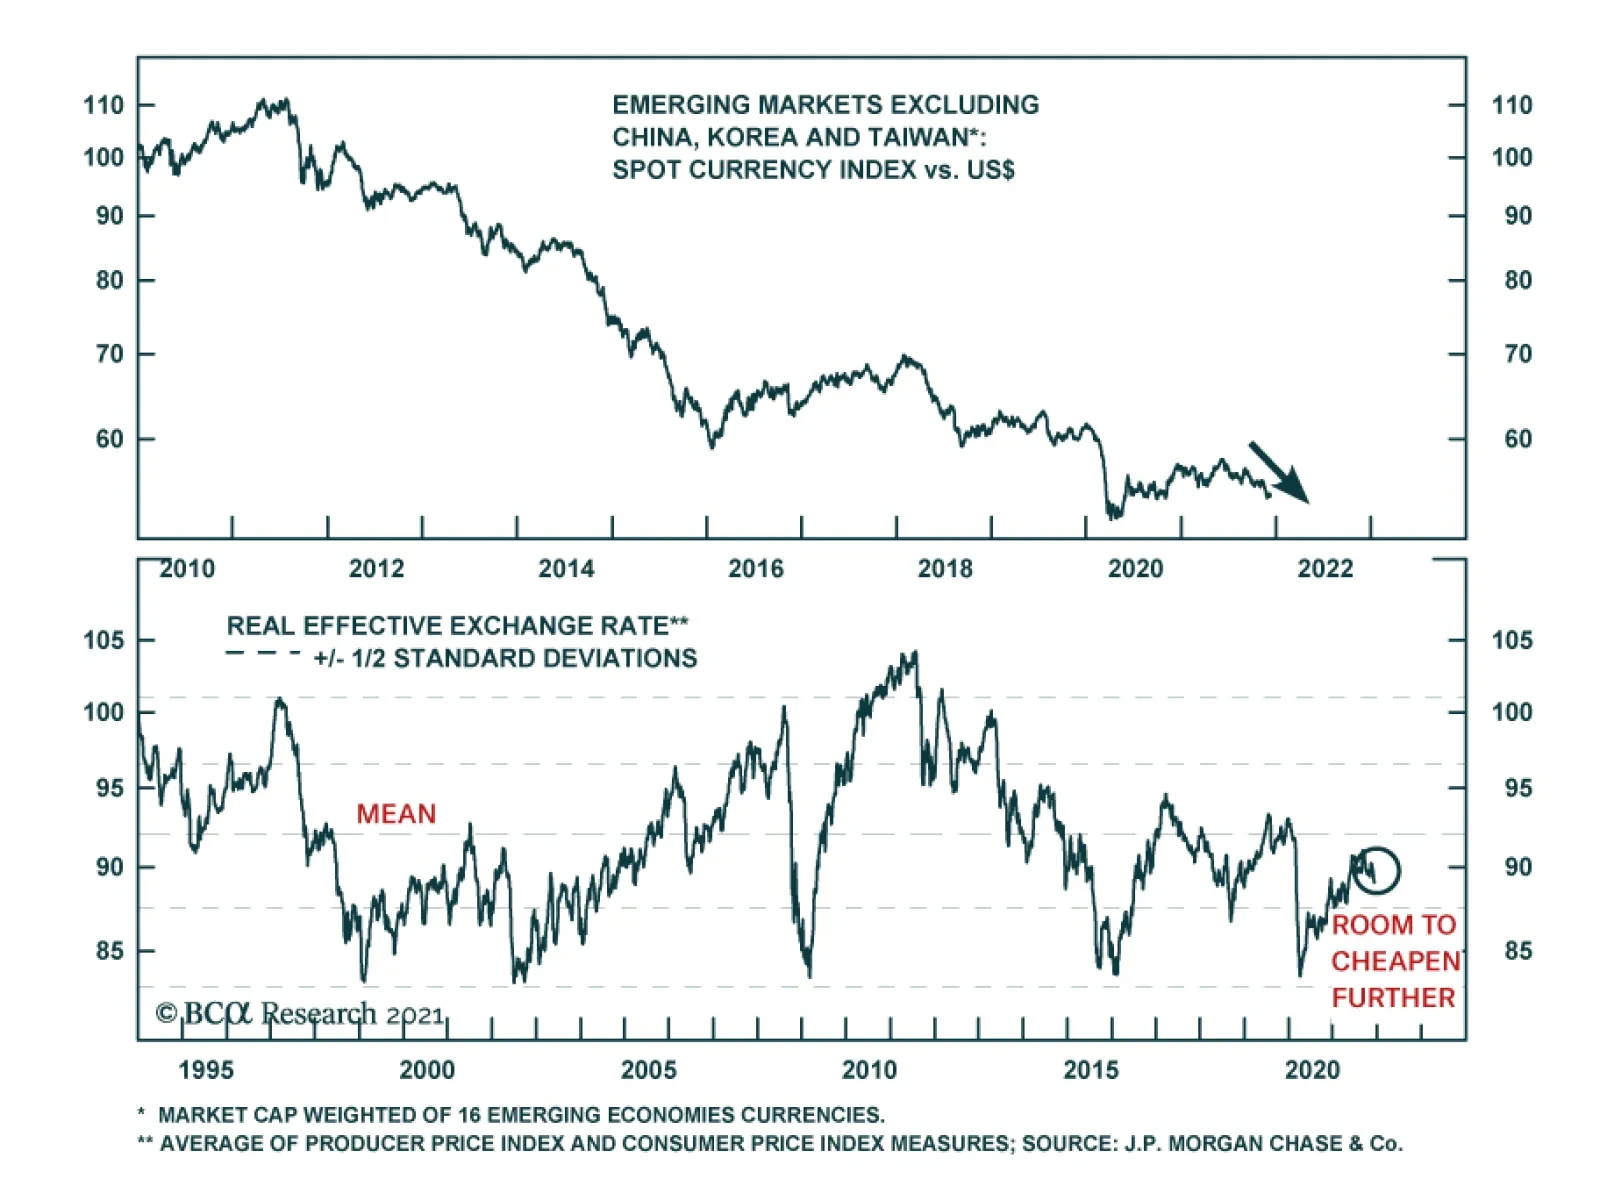
The JP Morgan Emerging Markets Currency Index has fallen sharply over the past month and is now at lows last seen during the initial phase of the COVID-19 crisis in the spring of 2020. The currency index that excludes China, Korea, and Taiwan is nearing…
Highlights The last two years have taught us to live with Covid-19. This means global growth will remain strong in 2022. That is not reflected in a strong dollar. The RMB will be a key arbiter between a bullish and bearish dollar view. This is because a weak RMB will be deflationary for many commodity currencies, especially if it reflects weak Chinese demand. Inflation in the US will remain stronger than in other countries. The key question is what the Federal Reserve does next year. In our view, they will stay patient which will keep real interest rates in the US very low. Upside in the DXY is nearing exhaustion according to most of our technical indicators. We upgraded our near-term target to 98. Over a longer horizon, we believe the DXY will break below 90, towards 85 in the next 12-18 months. A key theme for 2022 will be central bank convergence. Either inflation proves sticky and dovish central banks turn a tad more hawkish, or inflation subsides and aggressive rate hikes priced in some G10 OIS curves are revised a tad lower. The path for bond yields will naturally be critical. Lower bond yields will initially favor defensive currencies such as the DXY, CHF and JPY. This is appropriate positioning in the near-term. Further out in 2022, as bond yields rise, the Scandinavian currencies will be winners. Portfolio flows into US equities have been a key driver of the dollar rally. This has been because of the outperformance of technology. Should this change, equity flows could switch from friend to foe for the dollar. A green technology revolution is underway and this will benefit the currencies of countries that will supply these raw materials. The AUD could be a star in 2022 and beyond. The rise in cryptocurrencies will continue to face a natural gravitational pull from policy makers. Gold and silver will rise in 2022, but silver will outperform gold. Feature 2022 has spooky echoes of 2020. In December 2019, we were optimistic about the global growth outlook, positive on risk assets, and bearish the US dollar. That view was torpedoed in March 2020, when it became widely apparent that COVID-19 was a truly global epidemic. More specifically, the dollar DXY index (a proxy for safe-haven demand) rose to a high of 103. US Treasury yields fell to a low of 0.5%. Chart 1Covid-19 And The Dollar
Covid-19 And The Dollar
Covid-19 And The Dollar
Today, the DXY index is sitting at 96, exactly the midpoint of the March 2020 highs and the January 2021 lows. Once again, the dollar is discounting that the new Omicron strain will be malignant – worse than the Delta variant, but not as catastrophic as the original outbreak (Chart 1). Going into 2022, we are cautiously optimistic. First, we have two years of data on the virus and are learning to live with it. This suggests the panic of March 2020 will not be repeated. Second, policymakers are likely to stay very accommodative in the face of another exogenous shock. This will especially be the case for the Fed. Our near-term target for the DXY index is 98, given that the macro landscape remains fraught with risks. This is a speculative level based on exhaustion from our technical indicators (the dollar is overbought) and valuation models (the dollar is expensive). Beyond this level, if our scenario analysis plays out as expected, we believe the DXY index will break below 90 in 2022. Omicron And The Global Growth Picture Chart 2Global Growth And The Dollar
Global Growth And The Dollar
Global Growth And The Dollar
Our golden rule for trading the dollar is simple – sell the dollar if global growth will remain robust, and US growth will underperform its G10 counterparts. Historically, this rule has worked like clockwork. Using Bloomberg consensus growth estimates for 2022, US growth is slated to stay strong, but give way to other economies (Chart 2). News on the Omicron variant continues to be fluid. As we go to press, Pfizer suggests a third booster dose of its vaccine results in a 25-fold increase in the antibodies that attack the virus. Additionally, a new vaccine to combat the Omicron variant will be available by March. If this proves accurate, it suggests the world population essentially has protection against this new strain. The good news is that vaccinations are ramping up around the world, especially in emerging markets. Countries like the US and the UK were the first countries to see a majority of their population vaccinated. Now many developed and emerging market countries have a higher share of their population vaccinated compared to the US (Chart 3). Chart 3ARising Vaccinations Outside The US
Rising Vaccinations Outside The US
Rising Vaccinations Outside The US
Chart 3BRising Vaccinations Outside The US
Rising Vaccinations Outside The US
Rising Vaccinations Outside The US
This has resulted in a subtle shift – growth estimates for 2022 are increasingly favoring other countries relative to the US (Chart 4). Let us consider the case of Japan - just in June this year, ahead of the Olympics, only 25% of the population was vaccinated. Today, Japan has vaccinated 77% of its population and new daily infections are near record lows. While Omicron is a viable risk, the starting point for Japan is very encouraging and should open a window for a recovery in pent-up demand and a pickup in animal spirits. Chart 4ARising Growth Momentum Outside The US
Rising Growth Momentum Outside The US
Rising Growth Momentum Outside The US
Chart I-4
This template could very much apply to other countries as well. This view is not embedded in the dollar, which continues to price in an outperformance of US growth (Chart 5). The Risks From A China Slowdown China sits at the epicenter of a bullish and bearish dollar view. If Chinese growth is bottoming, then the historical relationship between the credit impulse and pro-cyclical currencies will hold (Chart 6). This will benefit the EUR, the AUD, the CAD and even the SEK which that track the Chinese credit impulse in real time. As an expression of this view, we went long the AUD at 70 cents. Chart 5Economic Surprises Outside The US
Economic Surprises Outside The Us
Economic Surprises Outside The Us
Chart 6Chinese Credit Demand And Currencies
Chinese Credit Demand And Currencies
Chinese Credit Demand And Currencies
Just as global policy makers are calibrating the risk from the Omicron variant, the Chinese authorities are also acknowledging the risk of an avalanche from a property slowdown. They have already eased monetary policy on this basis. Specific to the dollar, a key arbiter of a bullish or bearish view will be the Chinese RMB. So far, markets have judiciously separated the risk, judging that the Chinese authorities can surgically diffuse the real estate market, without broad-based repercussions in other parts of the economy (such as the export sector). Equities and corporate credit prices have collapsed in specific segments of the Chinese market but the RMB remains strong (Chart 7). Correspondingly, inflows into China remain very robust, a testament to the fact that Chinese growth (while slowing) remains well above that of many other countries (Chart 8). Chart 7The RMB Has Diverged From The Carnage In China
The RMB Has Diverged From The Carnage In China
The RMB Has Diverged From The Carnage In China
Chart 8Strong Portfolio Inflows Into China
Strong Portfolio Inflows Into China
Strong Portfolio Inflows Into China
China contributed 20% to global GDP in 2021 and will likely contribute a bigger share in 2022, according to the IMF (Chart 9). This suggests that foreign direct investment in China will remain strong . This will occur at a time when the authorities could have diffused the risk from a property market slowdown.
Chart I-9
The commodity-side of the equation will also be important to monitor, especially as it correlates strongly with developed-market commodity currencies. It is remarkable that despite the slowdown in Chinese real estate, commodity prices remain resilient (Chart 10). This has been due to adjustment on the supply side, as our colleagues in the Commodity & Energy Strategy team have been writing. Finally, China offers one of the best real rates in major economies. It also runs a current account surplus. This suggests there is natural demand and support for the RMB (Chart 11). A strong RMB limits how low developed-market commodity currencies can fall. Chart 10Commodity Prices Remain Well Bid
Commodity Prices Remain Well Bid
Commodity Prices Remain Well Bid
Chart 11Real Interest Rates Favor The RMB
Real Interest Rates Favour The RMB
Real Interest Rates Favour The RMB
Inflation And The Policy Response Output gaps are closing around the world as fiscal stimulus has helped plug the gap in aggregate demand. This suggests that while inflation has been boosted by idiosyncratic factors (supply bottlenecks) that could soon be resolved, rising aggregate demand will start to pose a serious problem to the inflation mandate of many central banks. Chart 12A Key Driver Of The Dollar Rally
A Key Driver Of The Dollar Rally
A Key Driver Of The Dollar Rally
As we wrote a few weeks ago, there have been consistencies and contradictions with the market response to higher inflation. The market is now pricing in that the Fed will raise interest rates much faster, compared to earlier this year. According to the overnight index swap (OIS) curve, the Fed is now expected to lift rates at least twice by December 2022, compared to earlier this year. Meanwhile, market pricing is even more aggressive when looking at the December 2022 Eurodollar contract, relative to either the Euribor contract (European equivalent) or Tibor (Japanese equivalent) (Chart 12). The reality is that outside the ECB and the BoJ, other central banks have actually been more proactive compared to the Federal Reserve. The Bank Of Canada has ended QE and will likely raise interest rates early next year, the Reserve Bank of New Zealand has ended QE and raised rates twice, and the Reserve Bank of Australia has already been tapering asset purchases. The Bank of England will also be ahead of the Fed in raising interest rates, according to our Global Fixed Income Strategy colleagues. This suggests that the pricing of a policy divergence between the Fed and other G10 central banks could be a miscalculation and a potential source of weakness for the dollar. Chart 13The US Is Generating Genuine Inflation
The US Is Generating Genuine Inflation
The US Is Generating Genuine Inflation
Rising inflation is a global phenomenon and not specific to the US (Chart 13). So either inflation subsides and the Fed turns a tad more accommodative, or inflation proves sticky and other central banks turn a tad more hawkish to defend their policy mandates. We have two key short-term trades penned on this view – long EUR/GBP and long AUD/NZD. While the European Central Bank will lag the Bank of England (and the Fed) in raising interest rates, expectations for the path of policy are too hawkish in the UK, with 4 rate hikes priced in by the end of 2022. Similarly, hawkish expectations for the Reserve Bank of New Zealand are likely to be revised lower, relative to the Reserve Bank of Australia. As for the US, the Fed is likely to hike interest rates next year but real rates will remain very low relative to history (Chart 14A and 14B). Low real rates will curb the appeal of US Treasuries. Chart 14AReal Interest Rates In The US Are Very Negative
Real Interest Rates In The US Are Very Negative
Real Interest Rates In The US Are Very Negative
Chart I-14
The Dollar And The Equity Market Chart 15The US Stock Market And The Dollar
The US Stock Market And The Dollar
The US Stock Market And The Dollar
One of the biggest drivers of a strong dollar this year (aside from rising interest rate expectations), has been equity inflows. The greenback tends to do well when US bourses are outperforming their overseas peers (Chart 15). It is also the case that value tends to underperform growth in an environment where the dollar is rising. We discussed this topic in depth in our special report last summer. Flows tend to gravitate to capital markets with the highest expected returns. So if investors expect the pandemic winners (technology and healthcare) to keep driving the market in an Omicron setting, the US bourses that are overweight these sectors will do well. We will err on the other side of this trade for 2022. Part of that is based on our analysis of the global growth picture in the first section of this report. If growth rotates from the US to other economies, their bourses should do well as profits in these economies recover. Earnings revisions in the US have been sharply revised lower compared to other countries (Chart 16). This has usually led to a lower dollar eventually. In the case of the euro area, there has been a strong and consistent relationship between relative earnings revisions vis-à-vis the US, and the performance of the euro (Chart 17). Chart 16Earnings Revisions Are Moving Against US Companies
Earnings Revisions Are Moving Against US Companies
Earnings Revisions Are Moving Against US Companies
Chart 17Earnings Revisions Are Moving In Favor Of Euro Area Companies
Earnings Revisions Are Moving In Favor Of Euro Area Companies
Earnings Revisions Are Moving In Favor Of Euro Area Companies
In a nutshell, should profits in cyclical sectors recover on the back of rising bond yields, strong commodity prices and a tentative bottoming in the Chinese economy, value sectors that are heavily concentrated in countries with more cyclical currencies such as Australia, Norway, Sweden, and Canada, will benefit. Ditto for their currencies. The Outlook For Petrocurrencies
Chart I-18
When the pandemic first hit in 2020, oil prices (specifically the Western Texas Intermediate blend) went negative. This drop pushed the Canadian dollar towards 68 cents and USD/NOK punched above 12. This time around, the drop in oil prices (20% from the peak for the Brent blend) has been more muted. We think this sanguine market reaction is more appropiate in our view for two key reasons. First, as our colleagues in the Commodity & Energy Stategy team have highlighted, investment in the resource sector, specifically oil and gas, has been anemic in recent years. In Canada, investment in the oil and gas sector has dropped 68% since 2014 at the same time as energy companies are becoming more and more compliant vis-à-vis climate change (Chart 18). Second, if we are right, and Omicron proves to be a red herring, then transportation demand (the biggest source of oil demand) will keep recovering. In terms of currencies, our preference is to be long a petrocurrency basket relative to oil consumers. As the US is the biggest oil producer in the world (Chart 19), being long petrocurriences versus the dollar has diverged from its historical positive relationship with oil prices. Chart 20 shows that a currency basket of oil producers versus consumers has had both a strong positive correlation with oil prices and has outperformed a traditional petrocurrency basket. Chart 19The US Is Now A Major Oil Producer
The US Is Now A Major Oil Producer
The US Is Now A Major Oil Producer
Chart 20Hold A Basket Of Oil Consumers Versus Producers
Hold A Basket Of Oil Consumers Versus Producers
Hold A Basket Of Oil Consumers Versus Producers
Technical And Valuation Indicators The dollar tends to be a momentum-driven currency. Past strength begets further strength. We modelled this when we published our FX Trading Model, which showed that a momentum strategy outperformed over time (Chart 21). The problem with momentum is that it works until it does not. Net speculative long positions in the dollar are approaching levels that have historically signaled exhaustion (Chart 22). There is a dearth of dollar bears in today’s environment. That is positive from a contrarian standpoint. Meanwhile, our capitulation index (a measure of how overbought or oversold the dollar is) is approaching peak levels. Chart 21The Dollar Is A Momentum Currency
The Dollar Is A Momentum Currency
The Dollar Is A Momentum Currency
Chart 22Long Dollar Is A Consensus Trade
Long Dollar Is A Consensus Trade
Long Dollar Is A Consensus Trade
Valuation is another headwind for the dollar. According to all of our in-house models, the dollar is expensive. That is the case according to both our in-house curated PPP model (Chart 23) and a simple one based on headline consumer prices (Chart 24).
Chart I-23
Chart 24The Dollar is Expensive
The Dollar is Expensive
The Dollar is Expensive
In a broader sense, we have built an attractiveness ranking for currencies (Chart 25). This ranks G10 currencies on a swathe of measures, including their basic balances, our internal valuation models, sentiment measures, economic divergences, and external vulnerability. The ranking is in order of preference, with a lower score suggesting the currency is sitting in the top/most attractive quartile of the measures. The Norwegian krone and Swedish krona are especially attractive as 2022 plays.
Chart I-25
More specifically, the Scandinavian currencies have been one of the hardest hit this year. The Norwegian krone will benefit from the reopening of economies, particularly through the rising terms-of-trade. The Swedish krona will benefit from a pickup in the industrial sector, and continued strength in global trade. The least attractive G10 currencies are the New Zealand dollar and the greenback. This is mostly due to valuation. As we have highlighted in previous reports, valuation is a poor timing tool in the short term but over a longer-term horizon, currencies tend to revert towards fair value. Where Next For EUR/USD? Our bias is that the euro has bottomed. The ECB will lag the Fed in raising interest rates, but the spread between German bund yields and US Treasuries does not justify the current level of the euro. More importantly, if European growth recovers next year, this will sustain portfolio flows into the eurozone, which are cratering (Chart 26). Our 2022 target for EUR/USD is 1.25, a level that will unwind 10.6% of the undervaluation versus the dollar. Beyond valuation,s a few key factors support the euro: As a pioneer in green energy and a pro-cyclical currency, the euro will benefit from portfolio flows into renewable energy companies, as well as foreign direct investment. A close proxy for these flows are copper prices, that have positively diverged from the performance of the euro (Chart 27). Chart 26The Euro And Portfolio Flows
The Euro And Portfolio Flows
The Euro And Portfolio Flows
Chart 27EUR/USD And Copper
EUR/USD And Copper
EUR/USD And Copper
Inflation in the euro area is lagging the US, but is undeniably strong. As such, while the ECB will lag the Fed in tightening monetary policy, the divergence in monetary policy will not widen. Earnings revisions are moving in favor of European companies, as we have shown earlier. Historically, this has put a floor under the euro. Safe-Haven Demand: Long JPY Safe-haven currencies will perform well in the near term. We are long the yen, which is the cheapest currency according to our models and also one of the most shorted. CHF will also do well in the near term, though as we have argued, will induce more intervention from the Swiss National Bank.
Chart I-28
We are long both the yen and CHF/NZD as short-term trades, but our preference is for the yen. First, Japan has one of the highest real rates in the developed world. So, outflows from JGBs are going to be curtailed. Second, the DXY and USD/JPY have a strong positive correlation, and this places the yen in a very enviable position as the dollar weakens in 2022 (Chart 28). A Final Word On Gold, Silver, And Precious Metals Chart 29Hold Some Gold
Hold Some Gold
Hold Some Gold
Along with our commodity strategists, we remain bullish precious metals. In our view, inflation could prove stickier than most investors expect. This will depress real rates and support precious metals. Within the precious metals sphere, we particularly like silver and platinum. Almost every major economy now has negative real interest rates. Gold (and silver) have a long-standing relationship with negative interest rates (Chart 29). Central banks are also becoming net purchasers of gold, which is bullish for demand. The true precious metals winner in 2022 could be silver. The Gold/Silver ratio (GSR) tends to track the US dollar quite closely, so a bearish view on the dollar can be expressed by being short the GSR (Chart 30). Second, gold is very expensive compared to silver (Chart 31). In general, when gold tends to make new highs (as it did in 2020), silver tends to follow suit. This means silver prices could double from current levels over the next few years, to reclaim their 2011 highs. Finally, the bullish case for platinum is the same as for silver. It has lagged both gold and palladium prices. Meanwhile, breakthroughs are being made in substituting palladium for platinum in gasoline catalytic converters. Chart 30Hold Some Silver
Hold Some Silver
Hold Some Silver
Chart 31Stay Short The GSR
Stay Short The GSR
Stay Short The GSR
Concluding Thoughts Our currency positions, as we enter 2022, are biased towards a lower dollar, but we also acknowledge that there are key risks to the view. Our recommendations are as follows: The DXY will could touch 98 in the near term, but will break below 90 over the next 12-18 months. An attractiveness ranking reveals the most appealing currencies are JPY, SEK, and NOK, while the least attractive are USD and NZD. Chart 32Hold Some AUD
Hold Some AUD
Hold Some AUD
Policy convergence will be a key theme at the onset of 2022. Stay long EUR/GBP and AUD/NZD as a play on this theme. Look to buy a basket of oil producers versus consumers once volatility subsides. We went long the AUD at 70 cents. Terms of trade are likely to remain a tailwind for the Australian dollar (Chart 32). The AUD will benefit specifically in a green revolution. Chester Ntonifor Foreign Exchange Strategist chestern@bcaresearch.com Trades & Forecasts Strategic View Cyclical Holdings (6-18 months) Tactical Holdings (0-6 months) Limit Orders Forecast Summary
Highlights 1. How will the pandemic resolve? 2. Will services spending recover to its pre-pandemic trend? 3. Will we spend our excess savings? 4. How will central banks react to inflation? 5. Will cryptocurrencies continue to eat gold’s lunch? 6. How fragile is Chinese real estate? 7. Will there be another shock? Fractal analysis: Personal goods versus consumer services. Feature Chart of the WeekWill Services Spending Recover To Its Pre-Pandemic Trend?
Will Services Spending Recover To Its Pre-Pandemic Trend?
Will Services Spending Recover To Its Pre-Pandemic Trend?
“Judge a man by his questions, not by his answers” The quotation above is often misattributed to Voltaire instead of its true author, Pierre-Marc-Gaston de Lévis. Irrespective of the misattribution, we agree with the maxim. Asking the right questions is more important than finding answers to the wrong questions. In this vein, this report takes the form of the seven crucial questions for 2022 (and our answers). 1. How Will The Pandemic Resolve? As new variants of SARS-CoV-2 have arrived like clockwork, the number of new global cases of infection and the virus reproduction rate have formed a near-perfect mathematical ‘sine wave’. This near-perfect sine wave will propagate into 2022 (Chart I-2). Chart I-2The Pandemic's Sine-Wave Will Propagate Into 2022
The Pandemic's Sine-Wave Will Propagate Into 2022
The Pandemic's Sine-Wave Will Propagate Into 2022
But how will this sine wave of infections translate into mortality, morbidity, and stress on our healthcare systems? As we explained in RNA Viruses: Time To Tell The Truth, the answer depends on the specific combination of contagiousness, immuno-evasion, and pathogenicity of each variant. Yet none of this should come as any surprise. Flus and colds also come in waves, which is why we call them flu and cold seasons. And the morbidity of a given flu and cold season depends on the aggressiveness of that season’s flu and cold variant. So, just like the flu and the cold, Covid will become an endemic respiratory disease which comes in waves. The trouble is that our under-resourced health care systems can barely cope with a bad flu season, let alone with an additional novel disease that can be worse than the flu. Hence, until we add enough capacity to our healthcare systems, expect more disruptions to economic activity from periodic non-pharmaceutical interventions such as travel bans, vaccine passports, and face-mask mandates. 2. Will Services Spending Recover To Its Pre-Pandemic Trend? The pandemic has given us a crash course in virology and epidemiology. We now understand antigens, antibodies, and ‘reproduction rates.’ We understand that a virus transmits as an aerosol in enclosed unventilated spaces, and that singing, and yelling eject this viral aerosol. We understand that vaccinations for RNA viruses have limited longevity, do not prevent reinfections, and that certain environments create ‘super-spreader’ events. Armed with this new-found awareness, a significant minority of people have changed their behaviour. Services which require close contact with strangers – going to the dentist or in-person doctors’ appointments, going to the cinema or to amusement parks, or using public transport – are suffering severe shortfalls in demand. Given that this change in behaviour is likely long-lasting, demand for these services is unlikely to regain its pre-pandemic trend in 2022 (Charts I-3 - I-6). Chart I-3Dental Services Are Far Below The Pre-Pandemic Trend
Dental Services Are Far Below The Pre-Pandemic Trend
Dental Services Are Far Below The Pre-Pandemic Trend
Chart I-4Physician Services Are Far Below The Pre-Pandemic Trend
Physician Services Are Far Below The Pre-Pandemic Trend
Physician Services Are Far Below The Pre-Pandemic Trend
Chart I-5Recreation Services Are Far Below The Pre-Pandemic Trend
Recreation Services Are Far Below The Pre-Pandemic Trend
Recreation Services Are Far Below The Pre-Pandemic Trend
Chart I-6Public Transportation Is Far Below The Pre-Pandemic Trend
Public Transportation Is Far Below The Pre-Pandemic Trend
Public Transportation Is Far Below The Pre-Pandemic Trend
Therefore, to keep overall demand on trend, spending on goods will have to stay above its pre-pandemic trend. This will be a tough ask. Durables, by their very definition, last a long time. Even clothes and shoes, though classified as nondurables, are in fact quite durable. Meaning that are only so many cars, iPhone 13s, gadgets, clothes and shoes that any person can own before reaching saturation. If, as we expect, spending on goods falls back to its pre-pandemic trend, but spending on services does not recover to its pre-pandemic trend, then there will be a demand shortfall in 2022 (Chart of the Week). 3. Will We Spend Our Excess Savings? If spending falls short of income – as it did through the pandemic – then, by definition, our savings have gone up. Many people claimed that this war chest of savings would unleash a tsunami of spending. Well, it didn’t. And, it won’t. Previous episodes of excess savings in 2004, 2008, and 2012 had no impact on the trend in spending (Chart I-7).
Image
The explanation comes from a theory known as Mental Accounting Bias. The theory states that we segment our money into different accounts, which are sometimes physical, sometimes only mental, and that our willingness to spend money depends on which mental account it occupies. This contrasts with standard economic theory which assumes that money is perfectly fungible, meaning that a dollar in a current (checking) account is no different to a dollar in a savings or investment account. In practice, money is not fungible, because we attach different emotions to our different mental accounts. A dollar in our current account we will gladly spend, but a dollar in our savings account we will not spend. Hence, the moment we move the dollar from our current account into our savings account, our willingness to spend it collapses. This explains why consumption trends have no connection with windfall income receipts once those income receipts end up in our savings mental or physical account. Pulling all of this together, the war chest of savings accumulated during the pandemic is unlikely to change the overall trend in spending. 4. How Will Central Banks React To Inflation? The real story of the current ‘inflation crisis’ is that while goods and commodity prices have surged exactly as expected in a positive demand shock, services prices have not declined as would be expected in the mirror-image negative demand shock. The result is that aggregate inflation has surged even though aggregate demand has not (Chart I-8 and Chart I-9). Chart I-8Goods Prices Have Reacted To A Positive Demand Shock...
Goods Prices Have Reacted To A Positive Demand Shock...
Goods Prices Have Reacted To A Positive Demand Shock...
Chart I-9...But Service Prices Have Not Reacted To A Negative Demand Shock
...But Service Prices Have Not Reacted To A Negative Demand Shock
...But Service Prices Have Not Reacted To A Negative Demand Shock
Why have services prices remained resilient despite a massive negative demand shock? One answer, as explained in question 2, is that much of the shortfall in services demand is due to behavioural changes, which cannot be alleviated by lower prices. If somebody doesn’t go to the dentist or use public transport because he is worried about catching Covid, then lowering the price will not lure that person back. In fact, the person might interpret the lower price as a signal of greater risk, and might become more averse. In technical terms, the price elasticity of demand for certain services has flipped from its usual negative to positive. This creates a major problem for central banks, because if the price elasticity of services demand has changed, then surging aggregate inflation is no longer a reliable indicator of surging aggregate demand. To repeat, inflation is surging even though aggregate demand is barely on its pre-pandemic trend. Hence in 2022, central banks face a Hobson’s choice. Choke demand that does not need to be choked, or turn a blind eye to inflation and risk losing credibility. 5. Will Cryptocurrencies Continue To Eat Gold’s Lunch? Most of the value of gold comes not from its economic utility as a beautiful, wearable, and electrically conductive metal, but from its investment value as a hedge against the debasement of fiat money. The multi-year investment case for cryptocurrencies is that they are set to displace much of gold’s investment value. Still, to displace gold’s investment value, cryptocurrencies need to match its other qualities: an economic utility, and limited supply. A cryptocurrency’s economic utility comes from its means of exchange for the intermediation services that its blockchain provides. For example, if you issue a bond or smart-contract using the Ethereum blockchain, then you must pay in its cryptocurrency ETH. Which gives ETH an economic utility. Furthermore, the number of blockchains that will succeed as go-to places for intermediation services will be limited, and each cryptocurrency has a limited supply. Thereby, the supply of cryptocurrencies that have a utility is also limited. With an economic utility, a limited supply, and drawdowns that are becoming smaller, cryptocurrencies can continue to displace gold’s dominance of the $12 trillion anti-fiat investment market. Therefore, the cryptocurrency asset-class can continue its strong structural uptrend, albeit punctuated by short sharp corrections (Chart I-10). Chart I-10Cryptocurrencies Will Continue To Displace Gold's Investment Value
Cryptocurrencies Will Continue To Displace Gold's Investment Value
Cryptocurrencies Will Continue To Displace Gold's Investment Value
The corollary is that the structural outlook for gold is poor. 6. How Fragile Is Chinese Real Estate? A decade-long surge in Chinese property prices has lifted Chinese valuations to nosebleed levels. According to global real estate specialist Savills, prime real estate yields in China’s major cities are now barely above 1 percent, and the world’s five most expensive cities are all in China: Hangzhou, Shenzhen, Guangzhou, Beijing, and Shanghai (Chart I-11).
Chart I-11
Without a social safety net and with limited places to park their money, Chinese savers have for years been encouraged to buy homes, in the widespread belief that property is the safest investment, whose price only goes up. With the bulk of people’s wealth in property acting as a perceived economic safety net, even a modest decline in house prices would constitute a major shock to the household sector’s hopes and expectations of what property is. Therefore, in contrast to the US housing debacle in 2008, the Chinese government will ensure that its property market adjustment does not come from a collapse in home prices. Rather, it will come from a collapse in property development and construction activity. This will have negative implications for commodities, emerging Asia, developing countries that produce raw materials, and machinery stocks worldwide. 7. Will There Be Another Shock? Most strategists claim that shocks, such as the pandemic, are unpredictable. We disagree. Yes, the timing and source of an individual shock is unpredictable, but the statistical distribution of shocks is highly predictable. We define a shock as any event that causes the long-duration bond price in a major economy to rally or slump by at least 20 percent.1 Using this definition through the last 60 years, the statistical distribution of the number of shocks in any ten-year period is Poisson (3.33) and the time between shocks is Exponential (3.33). This means that in any ten-year period, the likelihood of suffering a shock is a near-certain 95 percent; in any five-year period, it is an extremely high 80 percent; in a two-year period it is a coin toss at 50 percent; and even in one year it is a significant 30 percent (Chart I-12).
Chart I-12
Therefore, on a multi-year horizon, another shock is a near-certainty even if we do not know its source or precise timing. The question is, will it be net deflationary, or net inflationary? Our high-conviction view is that it will be net deflationary. Meaning that even if it starts as inflationary, it will quickly morph into deflationary. The simple reason is that it is not just Chinese real estate that is fragile. Through the past ten years, world prime residential prices are up by 70 percent while rents are up by just 25 percent2 (Chart I-13). Meaning that the bulk of the increase in global real estate prices is due to skyrocketing valuations. The culprit is the structural collapse in global bond yields – which, in turn, is due to persistently ultra-low policy interest rates combined with trillions of dollars of quantitative easing. Chart I-13Property Price Inflation Has Far Exceeded Rent Inflation
Property Price Inflation Has Far Exceeded Rent Inflation
Property Price Inflation Has Far Exceeded Rent Inflation
This means that bond yields have very limited scope to rise before pulling the bottom out of the $300 trillion global real estate market. Given that this dwarfs the $90 trillion global economy, it would constitute a massive deflationary backlash to the initial inflationary shock. Some people counter that in an inflationary shock, property – as the ultimate real asset – ought to perform well even as bond yields rise. However, when valuations start off in nosebleed territory as now, the initial intense headwind from deflating valuations would obliterate the tailwind from inflating incomes. Investment Conclusions To summarise, 2022 will be a year in which: Covid waves continue to disrupt the economy; a persistent shortfall in spending on services is not fully countered by excess spending on goods; China’s construction boom comes to an end; inflation takes time to cool, pressuring central banks to raise rates despite fragile demand; and the probability of another shock is an underestimated 30 percent. We reach the following investment conclusions: Overweight the China 30-year bond and the US 30-year T-bond. There will be no sustained rise in long-duration bond yields, and the risk to yields is to the downside. Long-duration equity sectors and stock markets that are least sensitive to cyclical demand will continue to rally (Chart I-14). Chart I-14The US Stock Market = The 30-Year T-Bond Multiplied By Profits
The US Stock Market = The 30-Year T-Bond Multiplied By Profits
The US Stock Market = The 30-Year T-Bond Multiplied By Profits
Overweight the US versus non-US. Underweight Emerging Markets. Underweight old-economy cyclical sectors such as banks, materials, and industrials. Commodities will struggle. Underweight commodities that haven’t corrected versus those that have (Chart I-15). Chart I-15Underweight Commodities That Haven't Yet Corrected
Underweight Commodities That Haven't Yet Corrected
Underweight Commodities That Haven't Yet Corrected
Overweight the US dollar versus commodity currencies. Cryptocurrencies will continue their structural uptrend at the expense of gold. Goods Versus Services Is Technically Stretched Finally, this week’s fractal analysis corroborates the massive displacement from services spending into goods spending, highlighted by the spectacular outperformance of personal goods versus consumer services. This outperformance is now at the point of fragility on its 260-day fractal structure that has signalled previous reversals (Chart I-16). Therefore, a good trade would be to short personal goods versus consumer services, setting a profit target and symmetrical stop-loss at 12.5 percent. Chart I-16Underweight Personal Goods Versus Consumer Services
Underweight Personal Goods Versus Consumer Services
Underweight Personal Goods Versus Consumer Services
Dhaval Joshi Chief Strategist dhaval@bcaresearch.com Footnotes 1 As bond yields approach their lower limit, this definition of a shock will need to change as it will become impossible for long-duration bond prices to rally by 20 percent. 2 Based on Savills Prime Index: World Cities – Capital Values, and World Cities – Rents and Yields, June 2011 through June 2021. Fractal Trading System Fractal Trades 6-Month Recommendations Structural Recommendations Closed Fractal Trades Indicators To Watch - Bond Yields Chart II-1Indicators To Watch - Bond Yields - Euro Area
Indicators To Watch - Bond Yields - Euro Area
Indicators To Watch - Bond Yields - Euro Area
Chart II-2Indicators To Watch - Bond Yields - Europe Ex Euro Area
Indicators To Watch - Bond Yields - Europe Ex Euro Area
Indicators To Watch - Bond Yields - Europe Ex Euro Area
Chart II-3Indicators To Watch - Bond Yields - Asia
Indicators To Watch - Bond Yields - Asia
Indicators To Watch - Bond Yields - Asia
Chart II-4Indicators To Watch - Bond Yields - Other Developed
Indicators To Watch - Bond Yields - Other Developed
Indicators To Watch - Bond Yields - Other Developed
Indicators To Watch - Interest Rate Expectations Chart II-5Indicators To Watch - Interest Rate Expectations
Indicators To Watch - Interest Rate Expectations
Indicators To Watch - Interest Rate Expectations
Chart II-6Indicators To Watch - Interest Rate Expectations
Indicators To Watch - Interest Rate Expectations
Indicators To Watch - Interest Rate Expectations
Chart II-7Indicators To Watch - Interest Rate Expectations
Indicators To Watch - Interest Rate Expectations
Indicators To Watch - Interest Rate Expectations
Chart II-8Indicators To Watch - Interest Rate Expectations
Indicators To Watch - Interest Rate Expectations
Indicators To Watch - Interest Rate Expectations
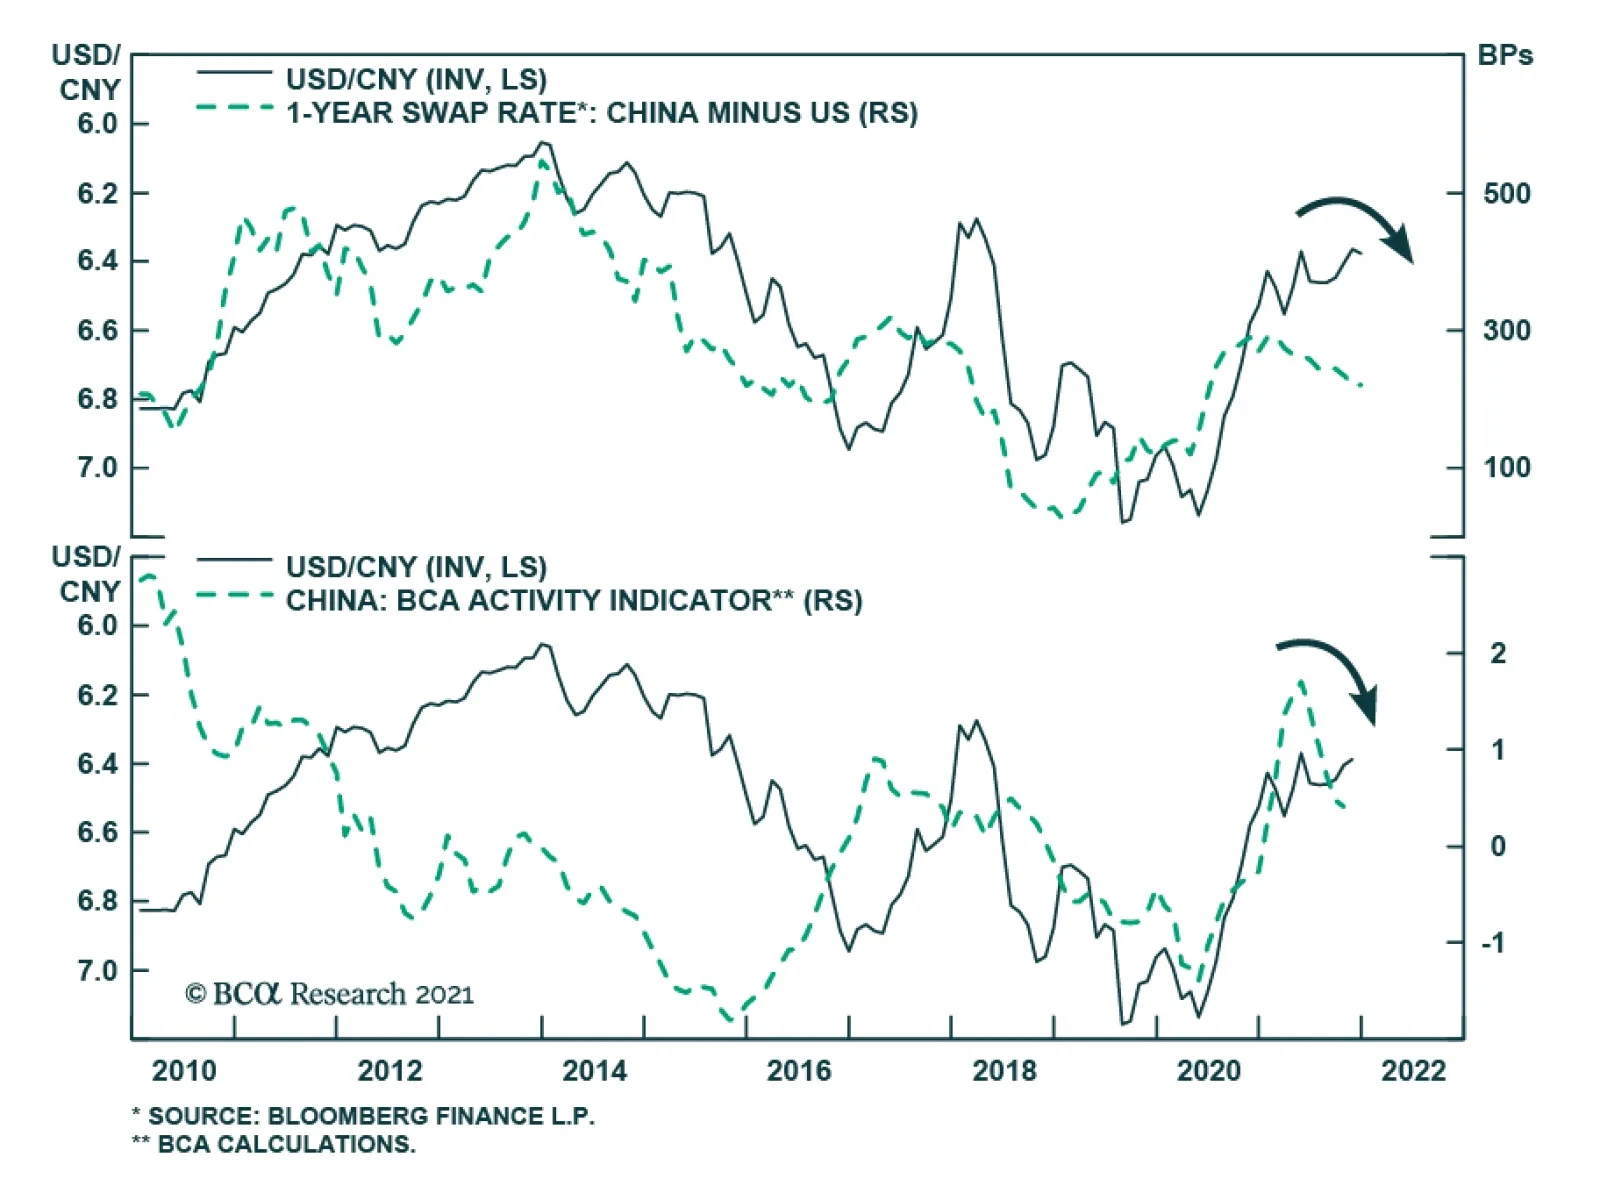
The world’s two largest economies are diverging on monetary policy. The Fed is starting to normalize policy by tapering its asset purchases and preparing to hike interest rates next year. Meanwhile, the PBoC is easing monetary policy – announcing the second…
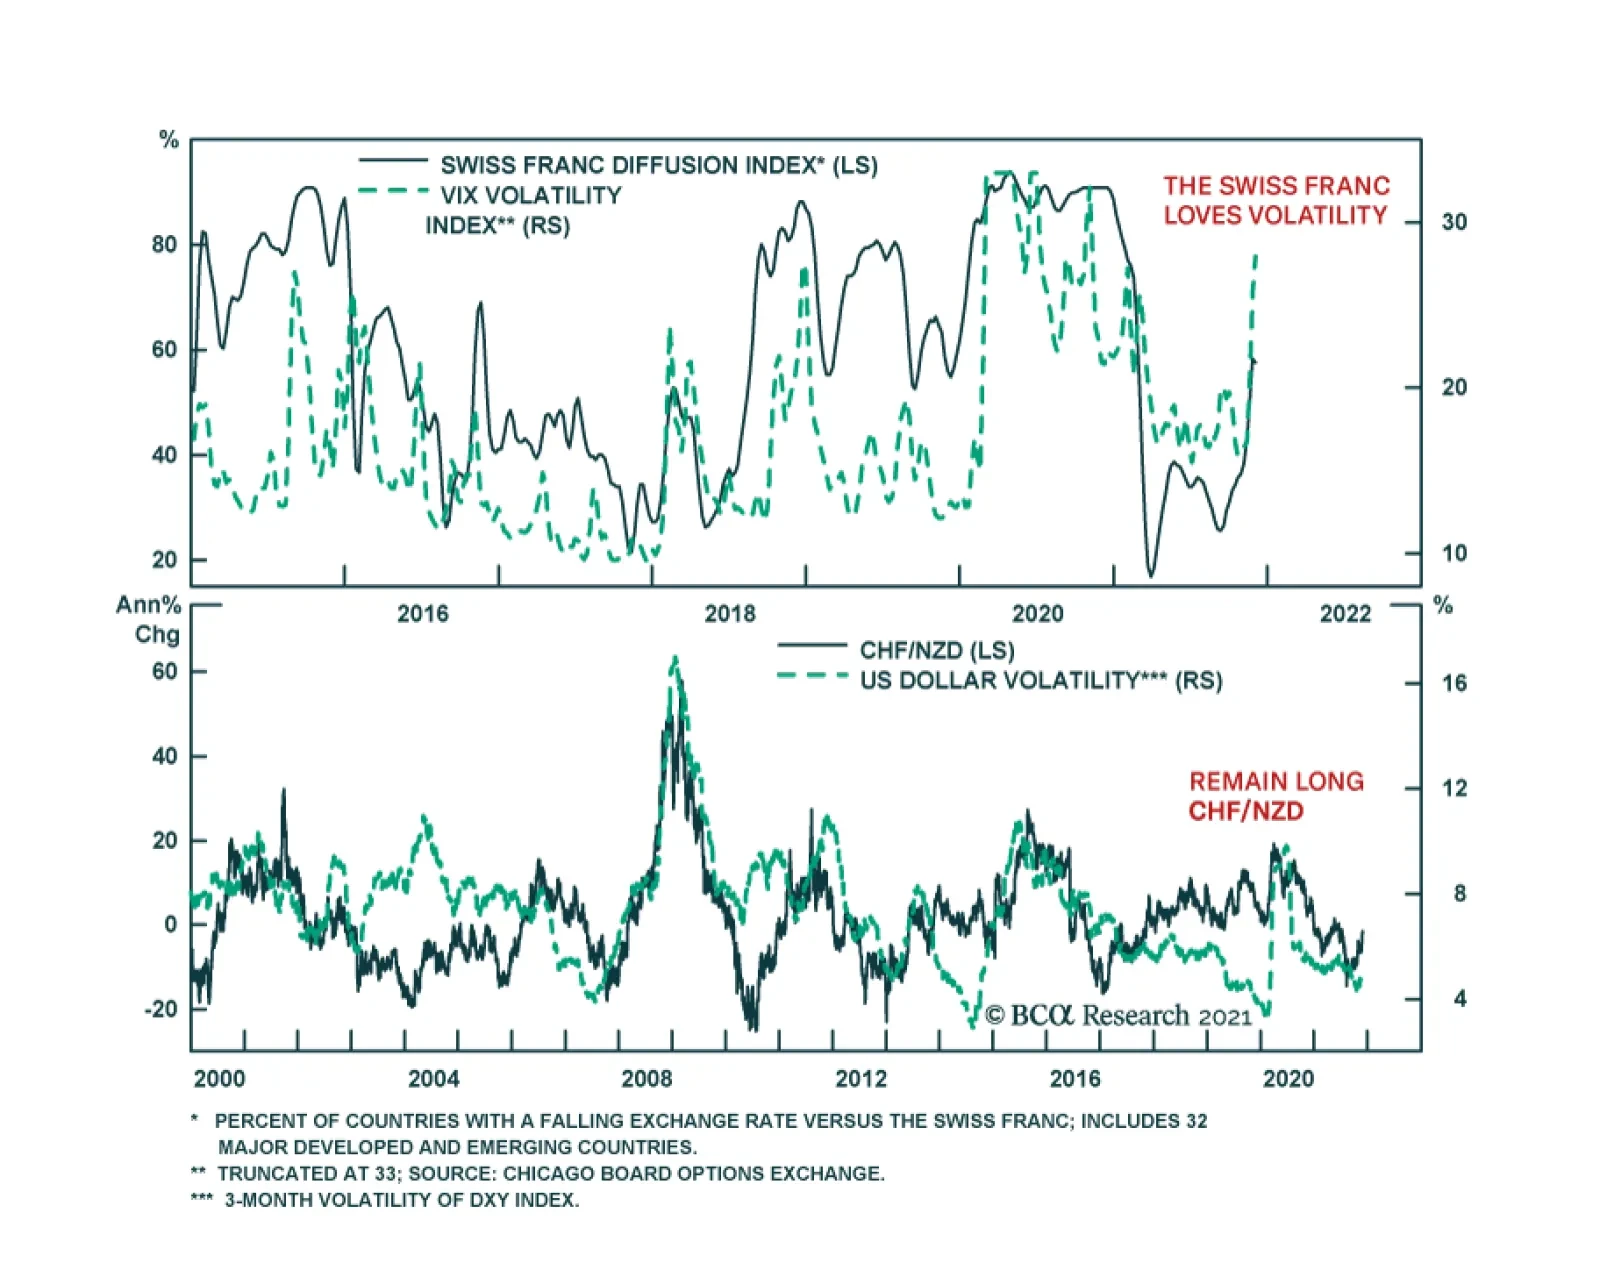
BCA Research’s Foreign Exchange Strategy service expects the Swiss franc to benefit in the very near term as volatility stays elevated. The CHF is as much driven by global dynamics as domestic actions by the SNB. With global uncertainty likely to remain…
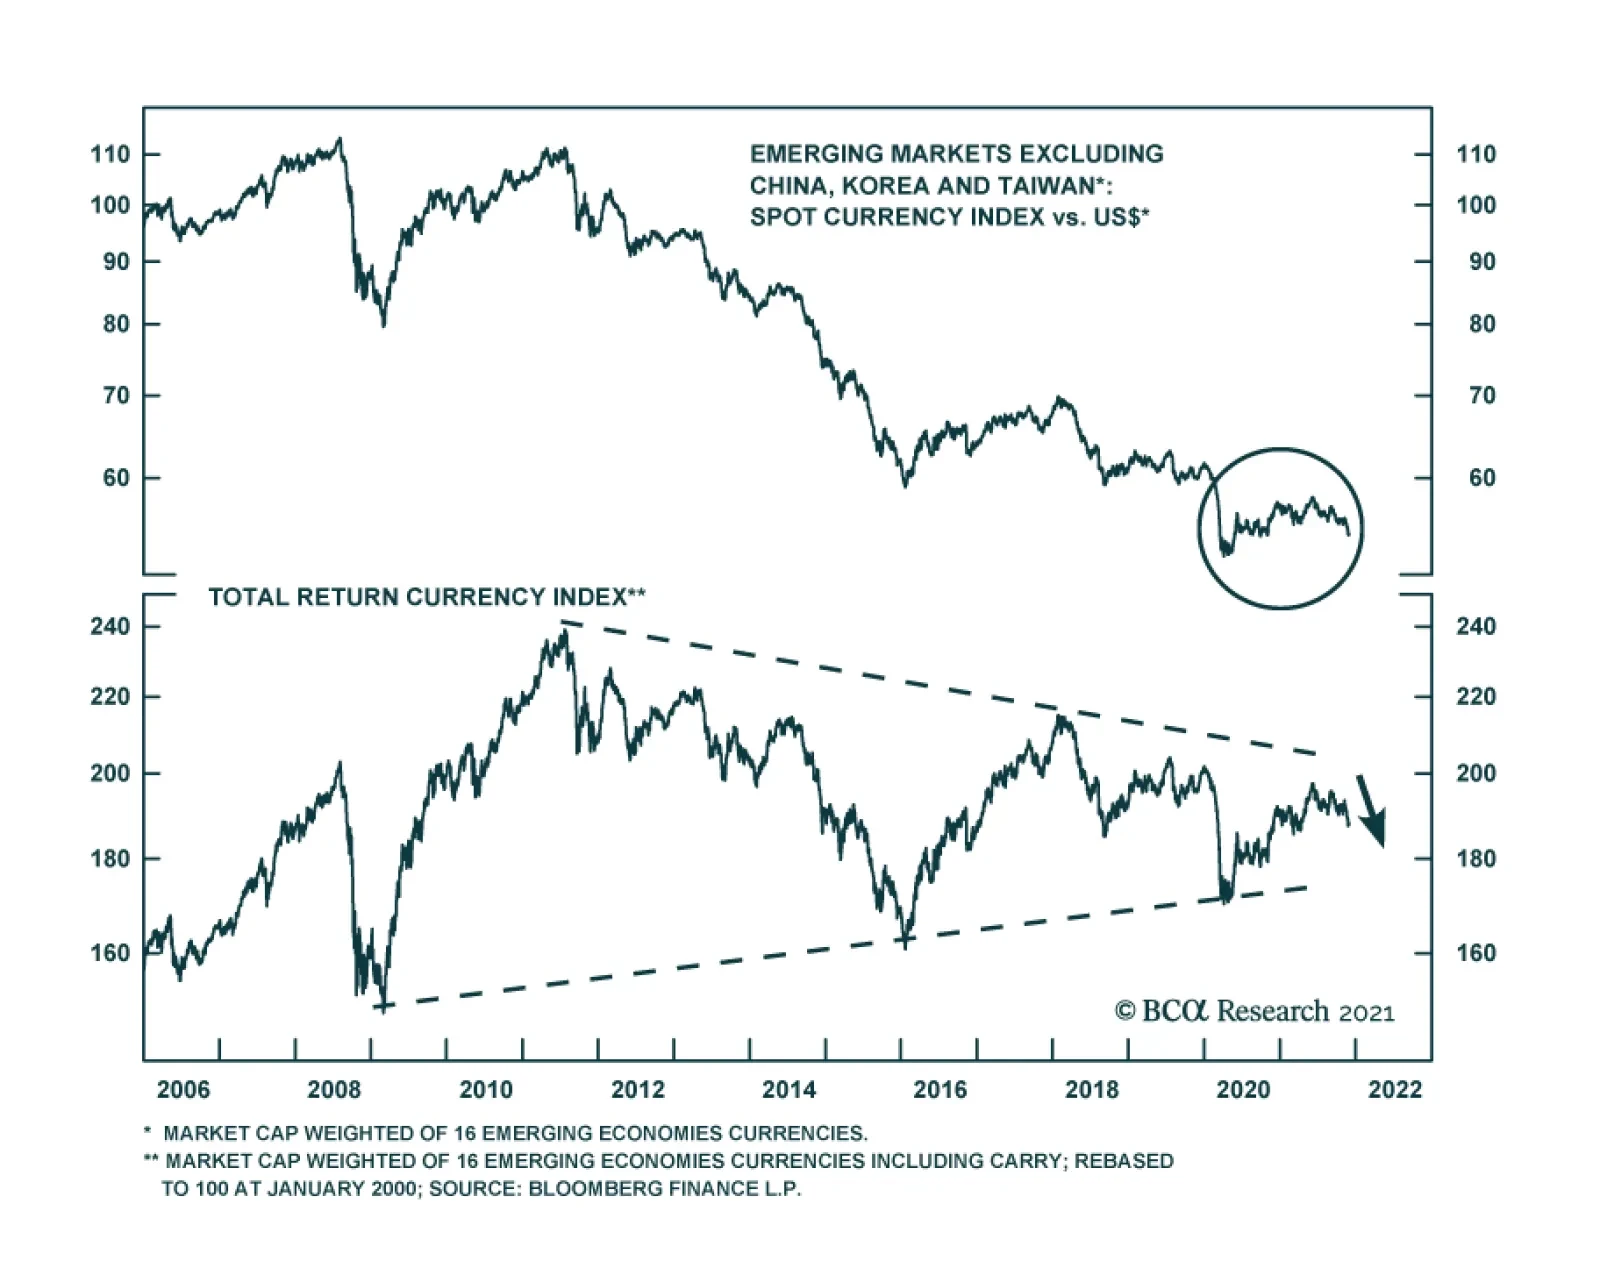
The mainstream EM (EM economies excluding China, Korea and Taiwan) equity market cap-weighted currency spot rate versus the US dollar is not far from its 2020 spring lows. On a total return basis – when carry is taken into account – mainstream…