Currencies

Highlights Indonesian domestic demand is struggling to recover in the face of a very tight policy settings. Exceptionally high real borrowing costs continue to hurt non-financial sectors. This will hurt banks too as credit is stymied and NPLs rise. Equity investors should fade the rebound and stay underweight Indonesia in an EM equity portfolio. Indonesia’s external accounts will deteriorate, as the Chinese slowdown weighs on resource prices. Softening commodity prices will herald a weakness in the rupiah. Currency investors should consider going short the rupiah versus the US dollar. Domestic bond investors should tactically downgrade Indonesia from neutral to underweight within an EM bond portfolio. Sovereign EM credit investors, however, should stay overweight Indonesia. Feature Chart 1Indonesian Stock Rebound Will Be Short-Lived
Indonesian Stock Rebound Will Be Short-Lived
Indonesian Stock Rebound Will Be Short-Lived
After years of underperformance, Indonesian stocks have rebounded in absolute terms and inched up relative to the EM benchmark (Chart 1). Could this be the beginning of a sustainable outperformance? Our research indicates that the answer is no. The Indonesian economy is still struggling. Domestic demand remains lackluster, hamstrung as it is by very high real interest rates and a tight fiscal stance. A flexing export sector, the sole source of strength so far, is set to dissipate as well. Weaker exports will weigh on the nation's financial markets. A budding softness in EM financial markets – emanating from a slowing China and rising US bond yields – will be yet another headwind for Indonesian assets over the next several months. Investors therefore should fade the current rebound and remain underweight this bourse in EM equity portfolios. EM domestic bond portfolios should consider downgrading this market from neutral to underweight relative to its EM peers. Currency investors may consider shorting the rupiah versus the US dollar. Sovereign EM credit investors, however, should stay overweight Indonesia in an EM US dollar bond portfolio. Straightjacketed The main drag to Indonesia’s economic recovery is coming from prohibitively high interest rates in the country. Real borrowing costs for the private sector, of the order of 10% (Chart 2, top panel), are extremely restrictive for any economy to handle, let alone one trying to recover from a debilitating recession. The real rates in Indonesia are also much higher than anywhere else in Asia – for both the private sector as well as for the government (Chart 2, bottom panel). Chart 2The Economy Is Struggling In the Face Of Very High Real Interest Rates
The Economy Is Struggling In the Face Of Very High Real Interest Rates
The Economy Is Struggling In the Face Of Very High Real Interest Rates
Chart 3Absence Of Fiscal Support Is Making The Recovery Harder
Absence Of Fiscal Support Is Making The Recovery Harder
Absence Of Fiscal Support Is Making The Recovery Harder
The fiscal stance does not appear to be very supportive either. The government is planning to rein in the fiscal deficit next year to 4.8% of GDP from an expected 5.7% this year. The IMF projects that the cyclically- adjusted fiscal thrust in 2022 will be a negative 0.8% of potential GDP, and a further negative 1.5% in 2023 (Chart 3). The consequence of such restrictive settings is that domestic consumption and consumer confidence are languishing well below pre-pandemic levels (Chart 4). Consistently, loan demand is also very weak. Bank credit for both consumption and production purposes (both working capital and term loans) have barely risen after having shrunk outright last year (Chart 5). Chart 4Domestic Demand Is Soft As Consumer Confidence Remains Low
Domestic Demand Is Soft As Consumer Confidence Remains Low
Domestic Demand Is Soft As Consumer Confidence Remains Low
Chart 5All Types Of Bank Credit Are Weak
All Types Of Bank Credit Are Weak
All Types Of Bank Credit Are Weak
Chart 6Disinflationary Pressures Are Entrenched In The Economy
Disinflationary Pressures Are Entrenched In The Economy
Disinflationary Pressures Are Entrenched In The Economy
Weak domestic demand is reinforcing deflationary forces. Inflation has been undershooting the lower band of the central bank target for almost two years now. Core and trimmed mean CPI measures have been averaging below 1% over the past year. Headline CPI is below the lower target band despite high oil and food prices (Chart 6, top panel). At the same time, nominal wages are barely rising (Chart 6, bottom panel). Hence, household income growth is subdued, which is sapping consumer demand. Notably, the very high real interest rates in Indonesia today are an outcome of monetary policy falling behind the disinflation curve. In the 2000s, the country’s consumer price inflation would often flare up to double digits, and the central bank used to keep interest rates consistently high. Over the past 10 years or so, however, inflationary pressures have gradually given way to deflationary forces. Even though the central bank has reduced its policy rate, it has not reduced it sufficiently enough to offset the drop in inflation. As a result, real interest rates have risen. Banks, on their part, also refused to fully pass along the rate cuts accorded by the central bank. As such, banks’ lending rates to the private sector, in both nominal and real terms, remained much higher compared to their peers elsewhere in Asia (Chart 2, above). Part of the reason why the central bank has fallen behind the disinflation curve has to do with the exchange rate stability and Indonesia’s dependence on foreign debt capital inflows. The country needs to offer high real rates to continue to attract enough foreign capital so that it can finance the current account deficit. As long as the central bank has rupiah stability (as a means for price stability) as its mandate, it will not reduce real interest rates. Incidentally, a bill to include economic growth and employment within the central bank’s mandate was submitted to Parliament earlier this year. Discussion over the bill, however, has been delayed. This means that elevated real interest rates will prevail for now in Indonesia, hampering economic growth. Fading Bright Spot Chart 7The Surge In Exports Has Been All About Commodity Prices, Not Increasing Volumes
The Surge In Exports Has Been All About Commodity Prices, Not Increasing Volumes
The Surge In Exports Has Been All About Commodity Prices, Not Increasing Volumes
In contrast to domestic demand, Indonesia’s exports did phenomenally well over the past few quarters. That said, there are signs that those heady days are coming to an end: The main reason exports did so well is that commodity prices went vertically up. Export volumes, on the other hand, stayed quite low. This is also evident in the case of coal and palm oil – Indonesia’s two main export items (Chart 7). Since it’s not the volume that drove up the export revenues, the latter is vulnerable to the whims of global commodity prices – of which Indonesia is a price-taker. And commodity prices, in general, have already begun to soften. China is by far the largest destination for Indonesian exports (22% of total), and demand in the Middle Kingdom has been among main reasons behind the recent surge in Indonesian exports. Yet, the fact that China’s credit and money impulses have turned negative is a major concern for Indonesian exports going forward. If history is of any guide, negative impulses will cause a contraction in Indonesian exports over the next year or so (Chart 8). Odds are therefore that the country’s trade surplus will roll over and the current account balance will slip back to a deficit (Chart 9, top panel). Chart 8Negative Chinese Credit And Money Impulses Will Cause Indonesian Exports To Shrink
Negative Chinese Credit And Money Impulses Will Cause Indonesian Exports To Shrink
Negative Chinese Credit And Money Impulses Will Cause Indonesian Exports To Shrink
Chart 9Indonesia's Trade And Current Account Balances Have Peaked
Indonesia's Trade And Current Account Balances Have Peaked
Indonesia's Trade And Current Account Balances Have Peaked
Chart 10A Slowing Chinese Credit & Fiscal Impulse Is Always A Bad Omen For The Rupiah
A Slowing Chinese Credit & Fiscal Impulse Is Always A Bad Omen For The Rupiah
A Slowing Chinese Credit & Fiscal Impulse Is Always A Bad Omen For The Rupiah
Meanwhile, Indonesia’s financial account is struggling to stay in surplus as capital inflows have dwindled significantly over the past couple of years (Chart 9, middle panel). FDI inflows are also showing few signs of revival (Chart 9, bottom panel). This indicates that Indonesia’s envisioned reforms, under the ‘Omnibus bill’, are yet to gain much traction and produce meaningful improvements in the economy’s structural backdrop. All in all, the outlook for the country’s external accounts is much less sanguine in the months ahead. That will not bode well for the rupiah, which has benefitted from robust external accounts so far. A material drop in Chinese credit and fiscal impulse has never been positive for the Indonesian currency. In the months ahead, therefore, the path of least resistance for the rupiah appears to be down (Chart 10, top panel). The link is via commodity prices (Chart 10, bottom panel). Notably, most capital inflows into Indonesia are in the form of debt capital inflows. Equity inflows are paltry. The reason is straightforward: foreign bond investors like the extremely high real rates that the country has been offering, whereas the equity investors do not. Yet, in the past couple of years, even debt capital inflows have subsided (Chart 9, middle panel). Should foreign investors turn nervous about the rupiah outlook due to falling commodity prices and/or rising US interest rates, those debt inflows would further subside. Deteriorating capital inflows would cause further weakness in the rupiah in a self-fulfilling prophecy. Domestic Bonds Chart 11Indonesian Domestic Bonds' Outperformance Is Late
Indonesian Domestic Bonds' Outperformance Is Late
Indonesian Domestic Bonds' Outperformance Is Late
Indonesian local currency bonds have significantly outperformed their EM counterparts over the past several months (Chart 11, top panel). We have been positive on Indonesian domestic bonds. Going forward, however, the nation’s local bonds will find it difficult to rally in absolute terms and will likely underperform their EM peers. One reason for this is that, given Indonesian yields are already close to post-pandemic lows, it will be harder for them to fall much more. The relative performance of domestic bonds versus their EM peers will also be beset by a vulnerable rupiah – as explained above. The bottom panel of Chart 11 shows that periods of a weaker rupiah are usually associated with Indonesia underperforming overall EM domestic bonds. This is because foreign investors (who hold 21% of Indonesian local bonds) usually head for the exit once the rupiah begins to depreciate. Finally, as was explained in our report last week, various EM assets classes are in for a period of volatility – prompted by a deepening slowdown in China and rising US bond yields. Periods of EM stress do not augur well for Indonesian local bonds’ relative performance vis-à-vis their EM brethren. This is because the relative yield differential of Indonesia with that of EM widens in such periods – as occurred during the 2013 taper tantrum, the 2015 EM slowdown, and the 2020 pandemic (Chart 11, bottom panel). Since another EM risk-off period is around the corner, investors will be well advised to book profits on Indonesian domestic bonds’ recent outperformance and tactically downgrade this market to underweight in an EM domestic bond portfolio. Sovereign Credit Unlike the case of local currency bonds, Indonesia's sovereign credit has metamorphosed into a defensive market over the past several years. Investors now consider Indonesian sovereign credit to be among the safest within EM. This is an upshot of low public debt, including very low foreign currency public indebtedness, and years of orthodox fiscal and monetary policies. Chart 12Indonesian Sovereign Bonds Now Outperform During Risk-Off Periods
Indonesian Sovereign Bonds Now Outperform During Risk-Off Periods
Indonesian Sovereign Bonds Now Outperform During Risk-Off Periods
In previous risk-off periods (such as the GFC in 2008 and the taper tantrum in 2013), Indonesian sovereign credit would typically underperform their EM counterparts. Yet, in more recent episodes (such as the EM slowdown in 2015 and the COVID-19 pandemic in 2020), Indonesian sovereign credit massively outperformed the EM benchmark. These recent instances suggest that during the oncoming risk-off period investors should stay overweight Indonesian sovereign credit in an EM basket. Notably, the regime change in Indonesia’s sovereign credit characteristics has led to its relative performance (versus overall EM) being decoupled from the rupiah (Chart 12). While the rupiah remains a cyclical currency, the significant improvement in sovereign creditworthiness has turned Indonesian credit markets into a defensive play within EM. Therefore, a weakness in the rupiah in the months ahead will not jeopardize its relative performance. Share Prices Chart 13Indonesian Bank Stocks Failed To Break Out, While Non-Banks Keep Falling
Indonesian Bank Stocks Failed To Break Out, While Non-Banks Keep Falling
Indonesian Bank Stocks Failed To Break Out, While Non-Banks Keep Falling
The Indonesian equity market is structurally beset by an uneven playing field, where the country’s banking sector has benefitted at the expense of all others. This is a consequence of banks maintaining high real lending rates as well as very wide net interest rate margins for far too long. The outcome is evident in financial and non-financial sectors’ diverging performance over the past decade (Chart 13). Given that the bull market in bank stocks has been contingent on banks’ net interest margins (NIM), any reduction therein will hurt bank stocks (Chart 14). At the same time, maintaining current lending rates and net interest margins will continue to hurt non-financial sectors (i.e., borrowers). In other words, for non-financial sectors to benefit, it will have to come at the expense of banking sector. Since banks and the rest of the stock market have very similar weights in this bourse, this dynamic will make it hard for this market to rally overall in a sustainable manner. Notably, bank stocks have failed to breach their pre-pandemic highs. This is despite net interest margins being quite elevated. The reason is that high real borrowing costs in a weak economy not only discourage credit off-take, but also threaten to raise NPLs further. Indonesian bank stocks are quite expensive as well: their ‘price/book value’ ratio is 2.6 while that of their EM counterparts is 1.1. As such, they will be hard pressed to have another sustainable rally. The other half of Indonesian equity markets, non-financials, are expectedly doing worse in the face of persistently high borrowing costs. So are the small cap stocks – where non-financial firms make up 85% of the market cap (Chart 13, bottom two panels). Notably, since Indonesia is a commodity producer, Indonesian stock prices usually do well during periods of rising commodity prices. Yet, headwinds emanating from weak domestic demand prevented Indonesia from benefitting much from high commodity prices this past year (Chart 15). Going forward, with the dissipating commodity tailwind, the Indonesian market will likely falter anew. Chart 14Any Fall In The Elevated Net Interest Margins Will Hurt Bank Stocks
Any Fall In The Elevated Net Interest Margins Will Hurt Bank Stocks
Any Fall In The Elevated Net Interest Margins Will Hurt Bank Stocks
Chart 15Extremely Restrictive Real Rates Prevented Indonesia From Benefitting From High Commodity Prices
Extremely Restrictive Real Rates Prevented Indonesia From Benefitting From High Commodity Prices
Extremely Restrictive Real Rates Prevented Indonesia From Benefitting From High Commodity Prices
Furthermore, a period of overall EM volatility is also a negative for Indonesian stocks’ absolute and relative performances. Investment Conclusions An impending relapse in commodity prices will herald a weakness in the rupiah. Currency investors should consider going short the rupiah versus the US dollar. In view of the likely weakness in the rupiah, dedicated EM local currency bond portfolios should pare back their exposure to Indonesia and tactically downgrade this market from neutral to underweight. Expected softness in domestic demand in the face of high real rates, faltering commodity prices and an impending volatility in EM assets - all entail that investors should stay underweight this bourse in an EM equity portfolio. Finally, given the new defensive stature of Indonesian sovereign credit, asset allocators should stay overweight Indonesia in dedicated EM US dollar bond portfolios. Rajeeb Pramanik Senior EM Strategist rajeeb.pramanik@bcaresearch.com Footnotes
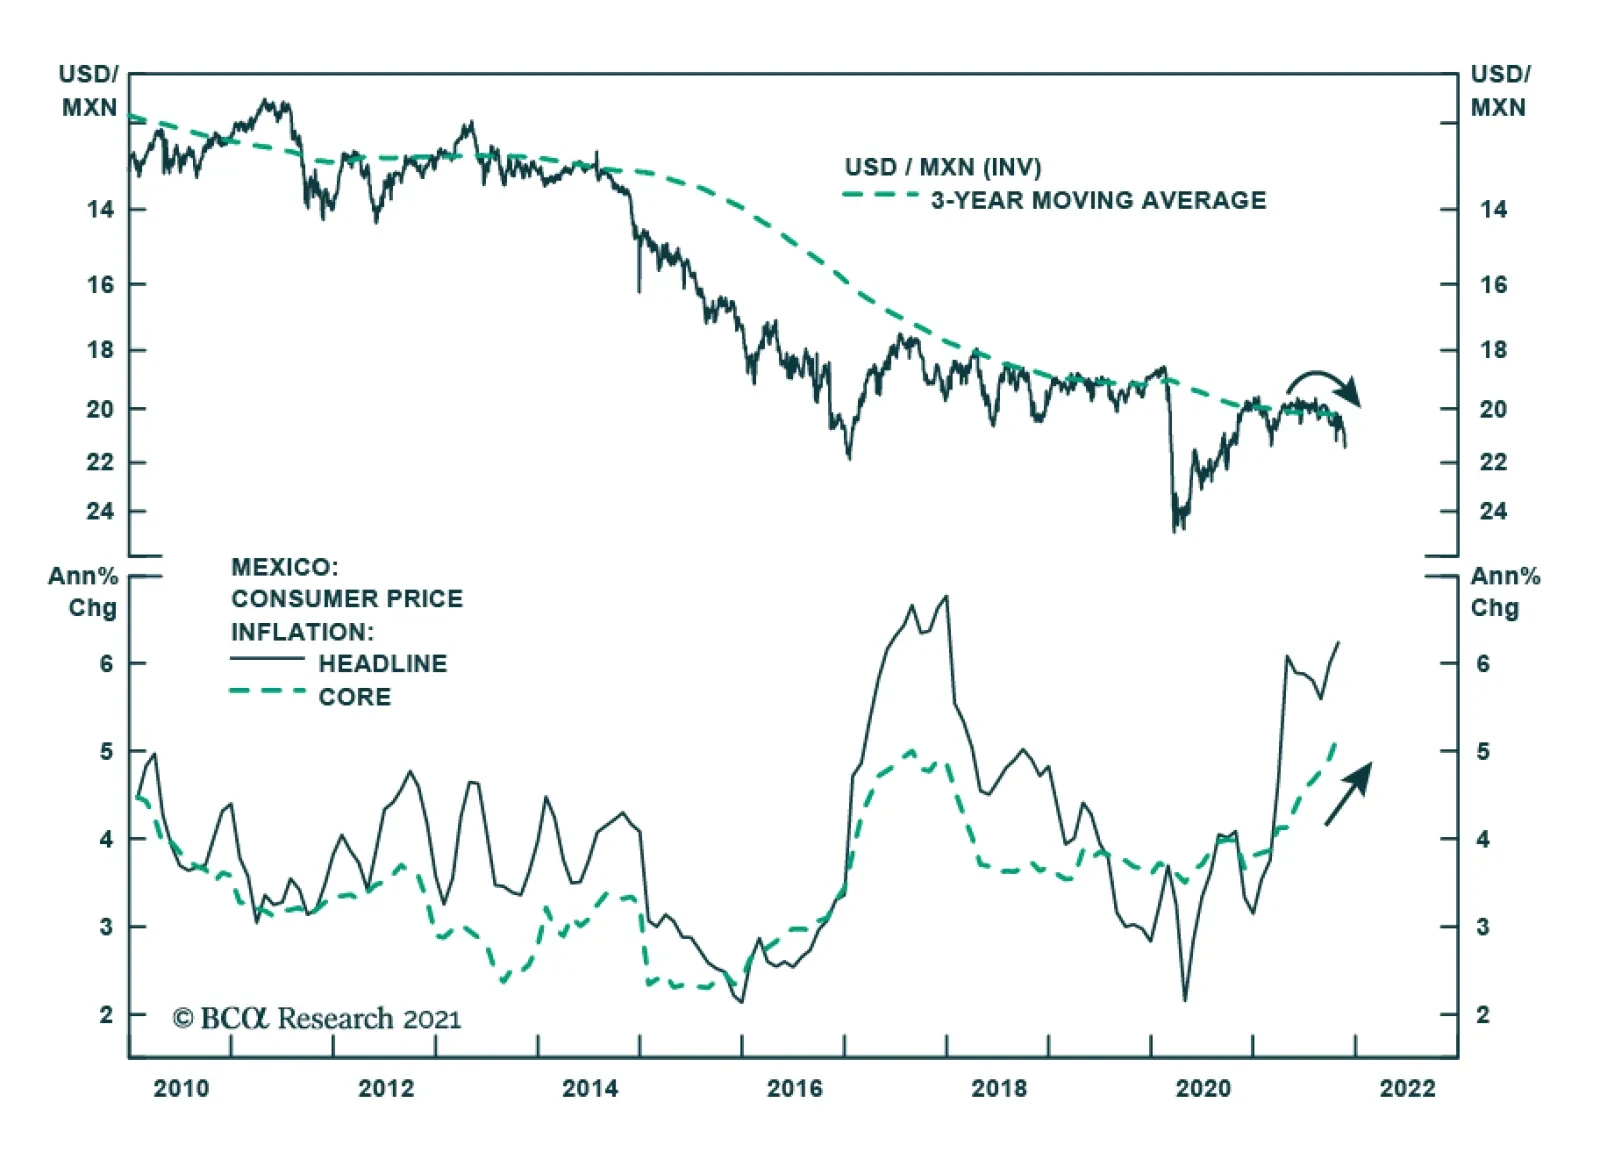
The Mexican peso has weakened sharply vis-à-vis the USD over the past three weeks, dropping to its lowest level since early March. It was the second worst performing emerging market currency on Wednesday, falling nearly 1% on the day. Three forces are…
Dear Client, We will be working on our 2022 Outlook for China, which will be published on December 8. Next week we will be sending you BCA Research’s Annual Outlook, featuring long-time BCA client Mr. X, who visits towards the end of each year to discuss the economic and financial market outlook for the year ahead. Best regards, Jing Sima China Strategist Feature In meetings with our North American clients this past week, we expressed the view that China’s economic growth is on a downward trend and easing measures have been gradual and modest in scope. Most clients agreed that China’s economy faces tremendous headwinds, however, some investors were more optimistic about the outlook for Chinese stocks in the next 6 to 12 months. Valuations in both China’s onshore and offshore equity markets have dropped to multi-year lows and macro policies have started to ease. Cheaply valued Chinese stocks should have more upside in the wake of policy support. Policy tone recently pivoted to a more growth supporting bias, but the existing easing measures will not offset the deceleration in both credit growth and domestic demand. China’s economic activity may worsen before it stabilizes in mid-2022. Moreover, China’s financial markets do not seem to have priced in the economic weakness. Therefore, in the next one to two quarters, risks to Chinese stocks are tilted toward the downside. Chart 1Chinese Stocks Will Truly Bottom When The Economy Troughs
Chinese Stocks Will Truly Bottom When The Economy Troughs
Chinese Stocks Will Truly Bottom When The Economy Troughs
Below are some of the main questions from our meetings and our answers. Q: Policies have started to be more pro-growth. Why do you still underweight Chinese stocks? A: There are two reasons that we maintain a cautious view on Chinese stocks for at least the next six months, in both absolute terms and relative to global equities. First, we do not think that the magnitude of existing easing measures is sufficient to offset the economy’s downward momentum. Secondly, China’s business cycle lags credit growth by about six to nine months. The timing of a turnaround in the economy and stock prices may be later than investors have priced in. In short, we need to see more reflationary measures and a rebound in credit growth to have a legitimate macro fundamental basis to overweight Chinese stocks (Chart 1). Credit growth on a year-on-year basis stopped falling in October. The underlying data in credit creation, however, points to a weakening in demand for corporate loans (Chart 2). Loans to the housing sector are well below a year ago (Chart 3). Chart 2Weakening Loan Demand
Weakening Loan Demand
Weakening Loan Demand
Chart 3Bank Loans To The Housing Sector Have Not Turned Around
Bank Loans To The Housing Sector Have Not Turned Around
Bank Loans To The Housing Sector Have Not Turned Around
Chart 4It Will Take Time For Policy Easing To Restore Confidence In The Corporate Sector
It Will Take Time For Policy Easing To Restore Confidence In The Corporate Sector
It Will Take Time For Policy Easing To Restore Confidence In The Corporate Sector
Despite an acceleration in local government bond issuance in October and RMB300 billion in additional bank loans to support small and medium enterprises, growth in medium- to long-term corporate loans peaked (Chart 4). In previous cycles, a rollover in corporate demand for longer-term bank lending on average lasted more than nine months, suggesting that any policy adjustments will take a while to restore confidence in the corporate sector. Without a decisive pickup in credit growth, corporate earnings growth will be at risk of deteriorating. Moreover, policy tightening since earlier this year is still working its way through the economy and major economic indicators in China continue to decline (Chart 5). We think that China’s economy is set to decelerate even more in the next several months, suggesting that earnings uncertainty will likely rise. This, combined with reactive policymakers, already slowing earnings momentum, and a downward adjustment in 12-month forward earnings, suggests that investors have not yet reached the maximum bearishness for Chinese stock prices (Chart 6). Chart 5No Signs Of Improvement In The Economy
No Signs Of Improvement In The Economy
No Signs Of Improvement In The Economy
Chart 6The Earnings Adjustement Process Is Only Beginning
The Earnings Adjustement Process Is Only Beginning
The Earnings Adjustement Process Is Only Beginning
Q: What is the impact of China’s property market slowdown on the economy? Will recent policy easing stop deterioration in the real estate sector? A: Policy has been recalibrated by relaxing restrictions on mortgage lending and rules for land sales.1 However, the negative financing loop among developers, households and local governments may take longer to improve. Meanwhile, the market may underestimate the downside risks in housing-related activity in the next 6 to 12 months. Chart 7Households' Home Buying Intentions Have Plummeted
Households' Home Buying Intentions Have Plummeted
Households' Home Buying Intentions Have Plummeted
Our view is based on the following: Home sales will likely remain in contraction in the next two quarters. Aggressive crackdowns on property market speculation in the past 12 months have fundamentally shifted consumers’ expectations for future home prices. The impending pilot property tax reform2 (details yet to be disclosed) will only encourage the wait-and-see sentiment of potential buyers. Home sales contracted by 24% in October from a year ago. In previous cycles, contractions in home sales normally lasted for more than 12 months. Moreover, the proportion of households planning to buy a house dropped to only 7.7% in Q3 2021 from 11.6% in Q4 2020 (Chart 7). Real estate developers have slashed new projects and land purchases to preserve liquidity for debt servicing (Chart 8, first and second panels). Policymakers may succeed in prompting banks to resume lending to developers in order to alleviate the escalating risk of widespread defaults. However, so far the marginal easing has failed to reverse the downward trend in bank credit to developers along with home sales (Chart 8, third and bottom panels). Funding constraints for real estate developers will probably be sustained for another six months, despite the recent easing measures. Construction activity, housing starts, and real estate investment will likely remain in doldrum at least through 1H22 (Chart 9). Chart 8Housing Activities Are Still Falling
Housing Activities Are Still Falling
Housing Activities Are Still Falling
Chart 9Less Funding = Less Investment And Completions
Less Funding = Less Investment And Completions
Less Funding = Less Investment And Completions
The marked reduction in land sales will impede local governments’ revenues and weigh on infrastructure investment (Chart 10). Real estate and infrastructure financing contributed 50% of the increase in total Chart 10Local Government Revenues Largely Depend On The Housing Sector
Local Government Revenues Largely Depend On The Housing Sector
Local Government Revenues Largely Depend On The Housing Sector
social financing in 2020. Given that local governments face funding constraints from a slump in land sale incomes, policies on leverage from local government financing vehicles (LGFVs) will have to meaningfully loosen up to allow a rise in bank lending to support infrastructure investment. As discussed in previous reports, an acceleration in local government special-purpose bond issuance can only partially offset weak credit growth. Furthermore, shadow banking activity, which comprises LGFV borrowing and is highly correlated with China’s infrastructure investment growth, remains in contraction and indicates that growth in infrastructure investment is unlikely to rebound strongly (Chart 11). The sharp weakening of real estate construction activities will drag down the demand for building materials, machinery, home appliances and automobiles. Real estate accounts for about 60% of Chinese households’ wealth, thus any substantial drop in home prices will further weaken households’ propensity to consume (Chart 12). Chart 11More Easing Needed For A Meaningful Pickup In Infrastructure Investment
More Easing Needed For A Meaningful Pickup In Infrastructure Investment
More Easing Needed For A Meaningful Pickup In Infrastructure Investment
Chart 12Falling Demand For Commodities And Consumer Goods
Falling Demand For Commodities And Consumer Goods
Falling Demand For Commodities And Consumer Goods
Chart 13AOn The Surface Housing Inventories Are Lower Than Six Years Ago...
On The Surface Housing Inventories Are Lower Than Six Years Ago...
On The Surface Housing Inventories Are Lower Than Six Years Ago...
There are nontrivial risks that the real estate slowdown will evolve into a downturn similar to that of 2014-15. Although the existing housing inventory is more modest than the start of the 2014/15 property downturn, developers have accumulated more debt and unfinished projects in this cycle than in the past (Charts 13A & 13B). Policymakers will have to relax property sector policies much more forcefully to prevent the downturn from intensifying. In the interim, we will likely witness more deterioration in the sector. Chart 13B...But Developers Have Built Up Massive Leverages And Hidden Inventories In The Past Three Years
...But Developers Have Built Up Massive Leverages And Hidden Inventories In the Past Three Years
...But Developers Have Built Up Massive Leverages And Hidden Inventories In the Past Three Years
Q: If the property market accounts for such a big portion of local governments’ revenues, why hasn’t the waning housing market forced policymakers to loosen restrictions? A: We think regulators have been slow to backtrack property market reforms because this year China’s fiscal deficit has narrowed from last year due to lower government spending and improved income from corporate taxes. In previous property market downturns, such as 2011/12, 2015/16 and 2019, property policy restrictions were lightened following major declines in government revenues (Chart 14). However, in 2021 China’s fiscal balance sheet has been stronger than in previous cycles; central and local governments have collected much more taxes, particularly corporate taxes, than in 2020 (Chart 15). Meanwhile, government expenditures so far this year have been lower, resulting in a large improvement in the country’s fiscal deficit (Chart 16). Chart 14Falling Gov Revenues Forced Policymakers To Backtrack Reforms In The Past...
Falling Gov Revenues Forced Policymakers To Backtrack Reforms In The Past...
Falling Gov Revenues Forced Policymakers To Backtrack Reforms In The Past...
Chart 15...But This Year Gov Tax Revenues Have Been Strong
...But This Year Gov Tax Revenues Have Been Strong
...But This Year Gov Tax Revenues Have Been Strong
Chart 16Fiscal Deficit Improved This Year Despite Falling evenues From Land Sales
Fiscal Deficit Improved This Year Despite Falling evenues From Land Sales
Fiscal Deficit Improved This Year Despite Falling evenues From Land Sales
As discussed above, slightly loosened restrictions on land purchases by some regional governments will not restore developers’ confidence and boost the demand for land. The sharp increase in government's corporate tax collection will also start to ebb as economic growth slows and corporate profits decline. As such, even if government expenditures remain the same next year, the fiscal deficit will grow because revenues will be under substantial downward pressure. We expect that Chinese policymakers will have to take more actions to stabilize fiscal conditions. Forecasting exactly when this will occur is difficult, but a benign government balance sheet in much of this year is delaying policymakers’ response to the flagging housing market. Meantime, both policymakers and investors may be complacent about the state of the economy until the full scale of the property sector spillover risk becomes clear. Q: Rates are low and industrial profit growth has been strong this year. Why has capex been so sluggish? A: Investment growth in the manufacturing sector has been lackluster because their profit margins have been squeezed by rising input costs. On the other hand, investment in the mining industry has been constrained by policy restrictions. An acceleration in China’s de-carbonization efforts this year has likely constrained investment in the mining sector. Even though industrial profit growth has been concentrated among the upstream industries such as mining which profits grew by a stunning 100% this year, investment in the sector was mostly flat from a year ago (Chart 17). During the first half of the year, mid- to downstream firms were caught between rising input prices and a weak recovery in domestic consumption. Manufacturing investment grew faster than the mining sector, but manufacturing profit growth only increased by about 30% year to date (Chart 18). However, we think manufacturing investment growth may improve slightly into 2022 as the sector continues to gain pricing power. Chart 17Mining Sector's Profit Growth Way Outpaced Investment
Mining Sector's Profit Growth Way Outpaced Investment
Mining Sector's Profit Growth Way Outpaced Investment
Chart 18Manufacturing Sector Profit Growth Has Been Much More Muted Than Upstream Industries
Manufacturing Sector Profit Growth Has Been Much More Muted Than Upstream Industries
Manufacturing Sector Profit Growth Has Been Much More Muted Than Upstream Industries
Q: The RMB has been strong against the dollar, despite China’s maturing business cycle. What is your outlook for the RMB next year? A: The RMB exchange rate has been boosted by China’s record current account surplus, wide interest rate differentials and speculation that tension between the US and China will abate. However, all three favorable conditions supporting the RMB are in danger of reversing next year. Chart 19The RMB Has Been Appreciating Despite A Strong USD
The RMB Has Been Appreciating Despite A Strong USD
The RMB Has Been Appreciating Despite A Strong USD
Chart 20The RMB's Appreciation Deviates From Economic Fundamentals
The RMB's Appreciation Deviates From Economic Fundamentals
The RMB's Appreciation Deviates From Economic Fundamentals
Despite broad-based dollar strength, the CNY/USD has appreciated by 4.5% year to date (Chart 19). The RMB’s appreciation deviates from China’s economic fundamentals (Chart 20). Strong global demand for goods has boosted Chinese exports while travel restrictions curbed foreign exchange outflows by domestic households (Chart 21). China-US real interest rate differentials have been in favor of the CNY versus USD, bringing net foreign inflows to China’s onshore bond market (Chart 22). Additionally, the recent meeting between President Joe Biden and President Xi Jinping has prompted speculation that the US will lessen tariffs on Chinese imports. Chart 21Large Current Account Surplus
Large Current Account Surplus
Large Current Account Surplus
Chart 22Favorable Interest Rate Differentials And Strong Fund Inflows
Favorable Interest Rate Differentials And Strong Fund Inflows
Favorable Interest Rate Differentials And Strong Fund Inflows
Chart 23China's Extremely Robust Export Growth Unlikely To Sustain In 2022
China's Extremely Robust Export Growth Unlikely To Sustain In 2022
China's Extremely Robust Export Growth Unlikely To Sustain In 2022
Chart 24A Strong RMB Does Not Bode Well For Chinese Exporters' Profits
A Strong RMB Does Not Bode Well For Chinese Exporters' Profits
A Strong RMB Does Not Bode Well For Chinese Exporters' Profits
These factors will likely turn against the CNY next year. First, export growth will moderate as the composition of US consumption rotates from goods to services (Chart 23). Secondly, it would not be in the PBoC’s best interests to let the RMB strengthen too rapidly because an appreciating currency would be a deflationary force on China’s export and manufacturing sectors (Chart 24). While we expect policymakers to maintain their preference for a gradual approach to stimulus, we assign a high probability to a reserve requirement ratio (RRR) cut in early 2022. In this environment, Chinese bond yields will decline, which would narrow the China-US interest rate differential. Finally, while there may be some changes to US tariffs on China, it is doubtful that there would be a broad-based removal of tariffs. Chart 25The CNY/USD Will Likely Fall And Converge To Chinese Stocks' (Under)performance
The CNY/USD Will Likely Fall And Converge To Chinese Stocks' (Under)performance
The CNY/USD Will Likely Fall And Converge To Chinese Stocks' (Under)performance
The CNY’s outperformance stands out as it marks a break from its correlation with China’s relative equity performance vis-à-vis the US (Chart 25). The signal from the currency suggests that either global equity investors are overly pessimistic about economic and regulatory risks in China, or overly optimistic about the value of China’s currency. The latter option is more likely at the moment, and the CNY/USD exchange rate is at the risk of converging to the underperformance of Chinese investable stocks next year. Jing Sima China Strategist jings@bcaresearch.com Footnotes 1 China Cities Ease Land Bidding Rules as Property Stress Spreads - Bloomberg 2 China’s Pilot Property Tax Reforms Benefit Markets Despite Short-Term Pain, Analysts Say - Caixin Global Market/Sector Recommendations Cyclical Investment Stance
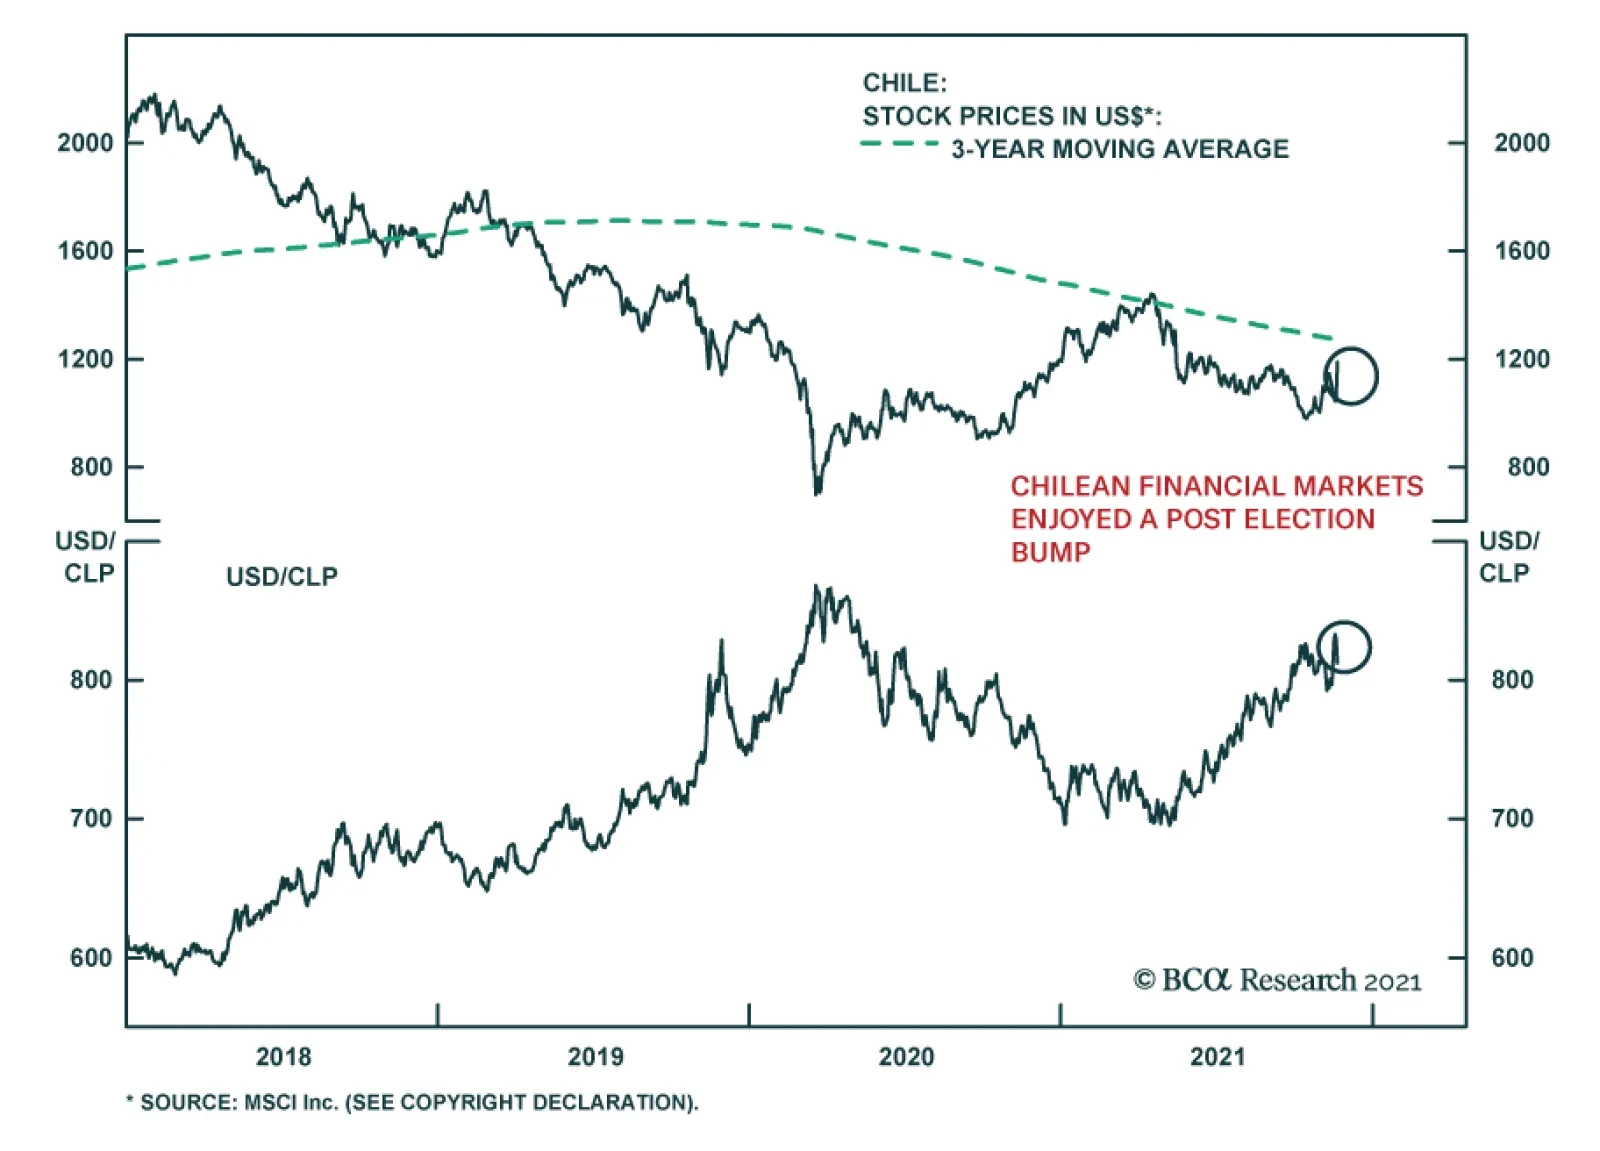
Chilean financial markets rallied following the first round of the presidential elections which ended in favor of conservative candidate José Antonio Kast. Kast secured 27.9% of the votes and came in slightly ahead of his leftwing rival Gabriel Boric who…
According to BCA Research’s European Investment Strategy service, EUR/USD weakness reflects more than USD strength. First, investors are increasingly differentiating between the Eurozone and the US inflation picture. Moreover, recent ECB communications…
Highlights The euro has entered a period of acute stress. Some of the EUR/USD’s plunge reflects the dollar’s broad-based strength. The dollar is supported by the market’s pricing of the Fed and China’s economic weakness. The euro also suffers from idiosyncratic forces. Investors appreciate better now that the Eurozone’s inflation is much narrower than that of the US. They are adjusting their ECB pricing accordingly. Europe’s growth prospects are also hurt by a renewed wave of lockdowns and China’s property woes. The revival of the European natural gas surge is the coup de grâce that is hurting the Euro. Nonetheless, euro sentiment is extremely depressed, which suggests that the euro already discounts many of these negatives. Consequently, we are adhering to our long EUR/USD trade implemented four weeks ago, but we will not re-open it if the stop-loss is triggered. Feature Four weeks ago, we tentatively recommended buying the euro, acknowledging that this view was fraught with near-term risks. However, the recent collapse in the euro forces us to revisit this stance. 2022 will be a better year for EUR/USD; nevertheless, the next three months could result in pronounced weakness in the currency, and the odds have increased that this pair might retest the pandemic lows. We are sticking with our long EUR/USD bet for now, as we have a floor under the position, the result of our stop at 1.1175. If this stop is reached, we will wait before reinstating a long euro position. What’s Going Well With The USD? The first element of the euro’s weakness is the generalized strength in the USD. The dollar is rallying against all the components of the DXY, which is pushing the USD’s Advanced/Decline line up (Chart 1). Moreover, as BCA’s Emerging Market Strategy team recently highlighted, the dollar is breaking out above its three-year moving average, which constitutes an important technical signal. The dollar strength is multi-faceted and reflects both domestic and international factors. On the domestic front, markets are responding to growing inflationary forces and signs of economic vigor to price in a more aggressive Fed outlook than two months ago (Chart 2), especially following the implementation of the Fed’s tapering program this month. Chart 1The Dollar Is Strong
The Dollar Is Strong
The Dollar Is Strong
Chart 2More Hikes Prices In
More Hikes Prices In
More Hikes Prices In
The inflation picture is of prime concern to investors. As Chart 3highlights, US core CPI is at a 30-year high and median inflation measures are also strengthening. Most concerning, inflationary pressures are broadening beyond energy and goods, with shelter prices accelerating anew (Chart 3, bottom panel). The labor market is also gearing up to move toward full employment conditions. The quits rate is near a record high, which corroborates the impression among households that jobs are easy to secure (Chart 4). Moreover, wages among low-skill employees are strengthening, which indicates that the labor market is tight (Chart 4, bottom panel). Granted, this is happening in a context in which the labor force participation rate is low, especially for women, and could rise anew, which would alleviate the labor market’s tightness. However, this process will likely entail higher wages first. Chart 3Broadening US Inflation
Broadening US Inflation
Broadening US Inflation
Chart 4Getting To Maximum Employment?
Getting To Maximum Employment?
Getting To Maximum Employment?
Economic data is also firming up, despite rises in COVID cases in many states. For example, nominal retail sales were robust in October, even if inflation contributed to their strength. Moreover, both the New York Fed’s Empire State Manufacturing Survey and the Philly Fed’s Manufacturing Business Outlook Survey highlighted an acceleration in activity (Chart 5). As a result, the Atlanta Fed’s Q4 GDPNow Forecast has rebounded to 8.2%, which would represent a marked improvement from the 2.2% quarterly annualized rate recorded in Q3. Whether or not this is an error, market participants may continue to use this economic backdrop to price in additional hikes by the Fed and feed the dollar rally. The international backdrop also helps the USD. The main positive comes from China. BCA’s emerging market strategists highlight that the weakness in the Chinese credit impulse is often a harbinger of dollar strength (Chart 6). The US economy is less exposed to manufacturing and trade than the economies of Europe, Australia, and EM, which means that it is less impacted by Chinese growth slowdowns than other parts of the world. This explains why the dollar loves a slowing Chinese economy. Chart 5A Pick Up In US Growth
A Pick Up In US Growth
A Pick Up In US Growth
Chart 6The Dollar Loves A Weaker China
The Dollar Loves A Weaker China
The Dollar Loves A Weaker China
China’s economic problems have once again become more relevant to market participants, as recent prints have been weak. Following the fall of Chinese GDP growth to 4.9% in the third quarter, new releases have shown that house prices are contracting and property investment is decelerating. These data sets are feeding the dollar rally. The dollar’s strength will beget further dollar appreciation. We have often highlighted that the dollar is the premier momentum currency within the G-10, along with the yen (Chart 7). Today, the most reliable momentum indicator for the greenback, the crossover of the 20-day MA above the 200-day one, continues to send a very supportive signal, which the economic backdrop reinforces (Chart 8). Moreover, historically, the dollar’s trading in the first few weeks of January often echoes the trend of the previous year. Hence, we may witness a continued blow off until February 2022.
Chart 7
Chart 8Positive Momentum Signal For The Dollar
Positive Momentum Signal For The Dollar
Positive Momentum Signal For The Dollar
Bottom Line: The dollar is breaking out on a broad basis. Not only is the US economy inviting investors to reprice the Fed’s expected policy path, but the economic weakness in China is also contributing to the rally. Technically, the dollar’s pro-momentum attribute accentuates the risk that this breakout morphs into a melt-up until February 2022, especially if US equities continue to outperform the rest of world and attract flows into the USD. The Euro’s Specific Problems Chart 9Europe Doesn't Have The US Inflation Problem
Europe Doesn't Have The US Inflation Problem
Europe Doesn't Have The US Inflation Problem
The spectacular collapse in EUR/USD goes beyond the strength in the dollar, because crucial catalysts are also pushing the euro lower. First, investors are increasingly differentiating between the Eurozone and the US inflation picture. We have often made the case that European inflation is much more limited than that of the US. For example, the dynamics in the trimmed-mean inflation and the CPI adjusted for VAT highlights that lack of broad inflation in Europe (Chart 9). Moreover, recent ECB’s communications have made it eminently clear that it is in no rush to raise rates. As a result, investors have been curtailing the number of ECB hikes priced in for 2022 compared to early November. Second, European economic activity is unable to catch a break. The recent uptick of COVID-19 cases in Germany, the Netherlands, and Austria is prompting local governments to impose renewed lockdowns of various scales, as worries emerge that hospital capacity will suffer as it did last winter (Chart 10). We doubt these lockdowns will last as long or will be as severe from a pan-European perspective, but, for now, they are weighing on investor sentiment and contributing to the euro-bearish widening in US-German 2-year yield differentials (Chart 11). Chart 10A New Wave
A New Wave
A New Wave
Chart 11Rate Differentials Hurt The Euro
Rate Differentials Hurt The Euro
Rate Differentials Hurt The Euro
Third, the Chinese economy continues to act as a drag on Europe. China’s real estate activity is slowing, as credit spreads and share prices of property developers remain distressed (Chart 12). It is of concern that the Chinese and EM credit market stresses are broadening beyond this sector, which indicates a tightening in financial conditions for a large swath of the Eurozone’s important trading partners. Moreover, Europe’s machinery exports are particularly exposed to the Chinese construction sector. Under these circumstances, the wave of weakness in Chinese construction activity could herald additional problems for EUR/USD, since they amount to a weakening in Euro Area growth relative to the US (Chart 13). Chart 12Downside To Chinese Construction Activity
Downside To Chinese Construction Activity
Downside To Chinese Construction Activity
Chart 13Slowing Chinese Construction Is A Threat to EUR/USD
Slowing Chinese Construction Is A Threat to EUR/USD
Slowing Chinese Construction Is A Threat to EUR/USD
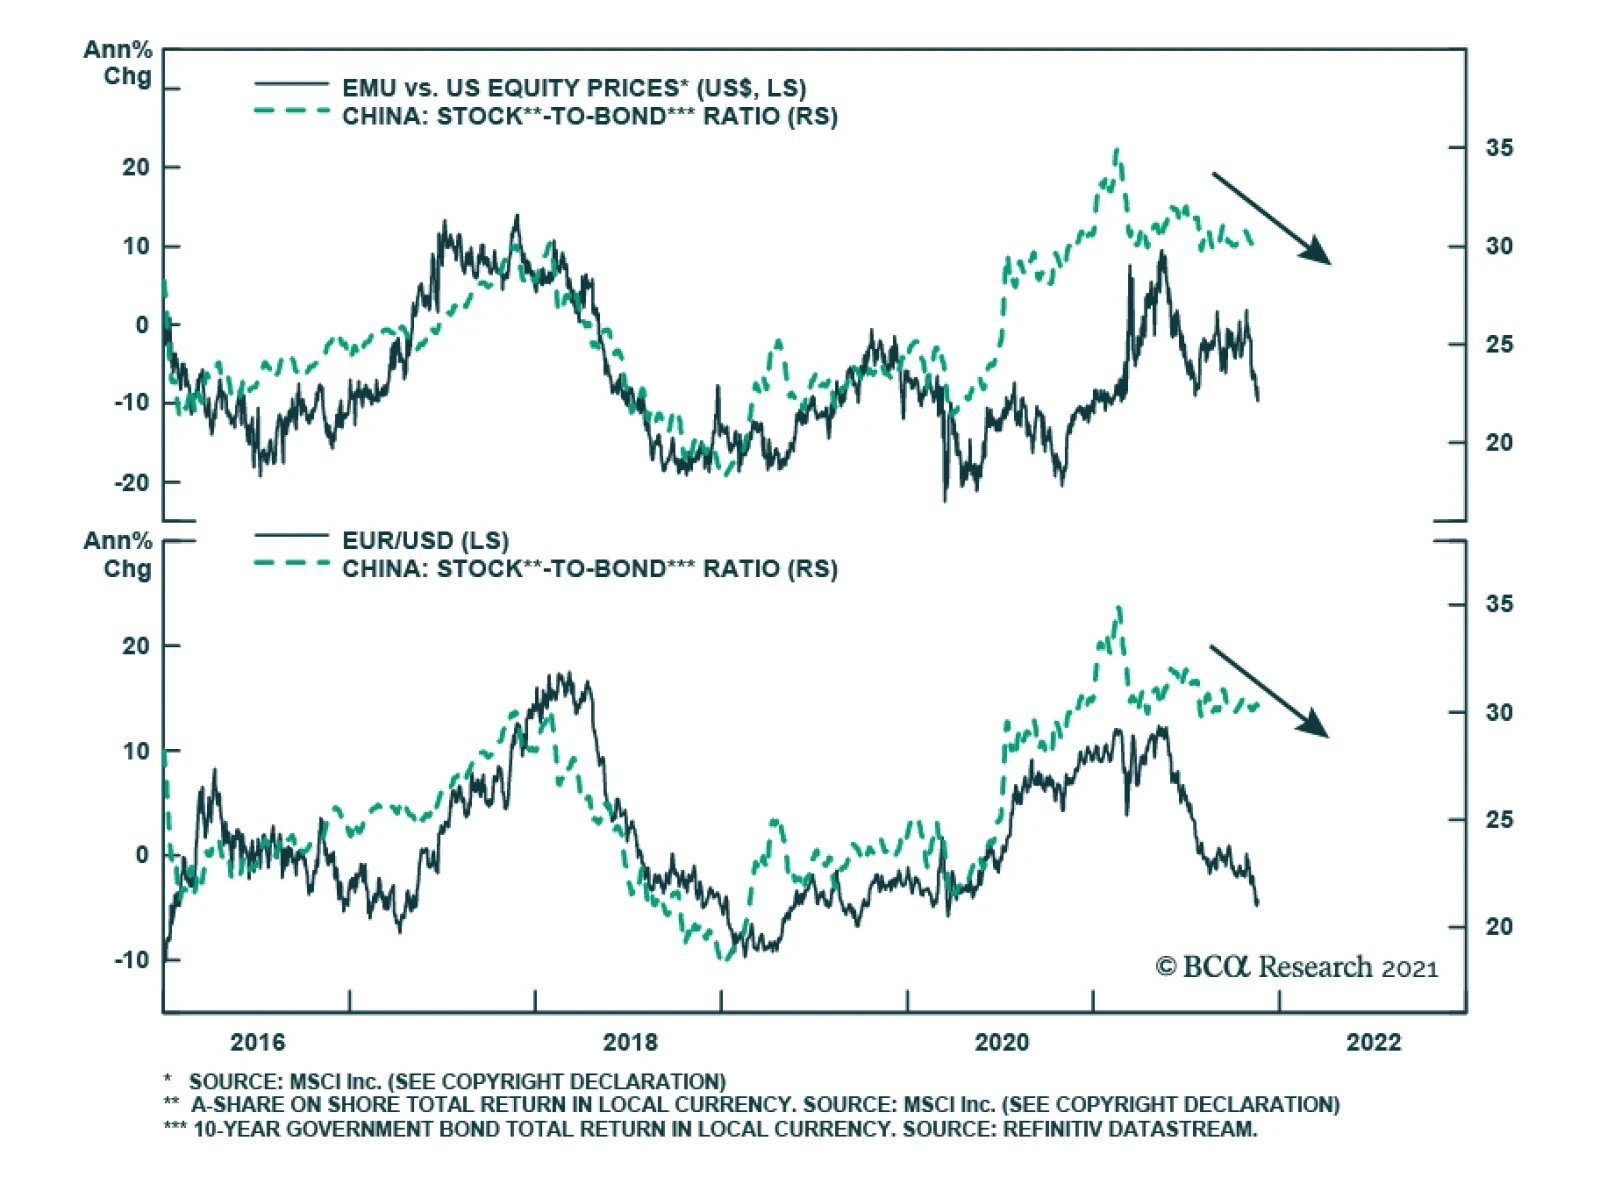
Fourth, equity outflows out of the Eurozone into the US are likely to continue as long as China suffers. BCA’s Emerging Market strategists anticipate the deterioration in China’s stock-to-bond ratio (SBR) to last, because this economy is weakening. Over the past five years, a deteriorating Chinese SBR has coexisted with a deepening underperformance of European equities relative to those of the US (Chart 14). Over this timeframe, equity flows have played a significant role in the EUR/USD exchange rate determination; thus, the weaker Chinese SBR also correlates well with a softer euro (Chart 14, bottom panel). Finally, the renewed energy crisis is particularly painful for the euro. German regulators indicated that they will temporarily suspend the approval of the Nord Stream 2 pipeline, which prompted European natural gas prices to surge anew. As Chart 15 shows, this proved to be the coup de grâce for the euro. The response of the euro to higher natural gas prices is rational. Surging natural gas prices are a growth shock for the region, yet they are unlikely to prompt a tightening in policy by the ECB, because they only push headline inflation, not the core measure. In fact, they could widen the dichotomy between underlying and headline inflation, because rising energy costs sap other spending categories. In other words, rising energy prices point to a stagflationary outcome this winter in Europe, which is poison for the euro. Chart 14More European Equity Outflows?
More European Equity Outflows?
More European Equity Outflows?
Chart 15The Nat-Gas Coup De Grace
The Nat-Gas Coup De Grace
The Nat-Gas Coup De Grace
Bottom Line: The weakness of the euro reflects more than the strength in the USD. The narrower nature of European inflation prevents a hawkish repricing of the ECB to take place, while renewed lockdowns are hurting growth sentiment. Moreover, the travails of China’s property sector are harming European economic activity, while also inviting equity outflows. Finally, the recent revival of the natural gas price surge is once again raising the specter of stagflation this winter in Europe, which is a dreadful scenario for the euro. What To Do? Our long EUR/USD bet initiated four weeks ago has a stop loss at 1.1175. Due to the bullish dollar forces and bearish euro factors described in this report, we will not re-open the trade if the stop-loss is triggered. Its activation would indicate that the bear-trend in the euro is gathering steam. When coupled with the momentum nature of the dollar and the euro’s anti-dollar behavior imparted by EUR/USD’s great market liquidity, this combination could easily push EUR/USD to 1.08 or lower by January 2022. We are not closing the trade either. While the list of euro-negative forces is long, sentiment toward EUR/USD is now quite lopsided, which suggests that a significant proportion of the euro bearish factors are already discounted. One-month, three-month, and six-month risk reversals in EUR/USD have fallen close to their Q2 2020 levels. Moreover, investors now hold large short positions in EUR/USD, especially compared to their large long bets on the DXY (Chart 16); meanwhile, the Euro Capitulation Index is now depressed relative to that of the dollar (Chart 16, bottom panel). Finally, the most important signal comes from our Intermediate-Term Timing Model (ITTM), which is an augmented interest-rate parity model that accounts for global risk aversion and the currency’s trend. The ITTM is now trading at 1 sigma, a level that has historically been followed by a positive return six months later 75% of the time since 2002 (Chart 17). Chart 16Negative Euro Sentiment
Negative Euro Sentiment
Negative Euro Sentiment
Chart 17Much Pessimism Is In The Price
Much Pessimism Is In The Price
Much Pessimism Is In The Price
Chart 18Peak US Inflation?
Peak US Inflation?
Peak US Inflation?
Finally, the US is likely experiencing peak inflationary pressures right now. If inflation rolls over in the near future, investors will breathe a collective sigh of relief, and they will not price in more rate hikes. The decline in DRAM prices and the recent ebb in shipping costs, with the Baltic Dry down 57% from its peak and the WCI Composite Container Freight Benchmark 12% below its September apex, suggest that the most severe supply bottlenecks are passing while energy indexes are also softening (Chart 18). In this context, the best strategy remains to keep the trade open and to follow the discipline imposed by the stop loss. Mathieu Savary, Chief European Strategist Mathieu@bcaresearch.com Tactical Recommendations
What’s Going Wrong With The Euro?
What’s Going Wrong With The Euro?
Cyclical Recommendations
What’s Going Wrong With The Euro?
What’s Going Wrong With The Euro?
Structural Recommendations
What’s Going Wrong With The Euro?
What’s Going Wrong With The Euro?
Closed Trades
Image
Currency Performance Fixed Income Performance Equity Performance
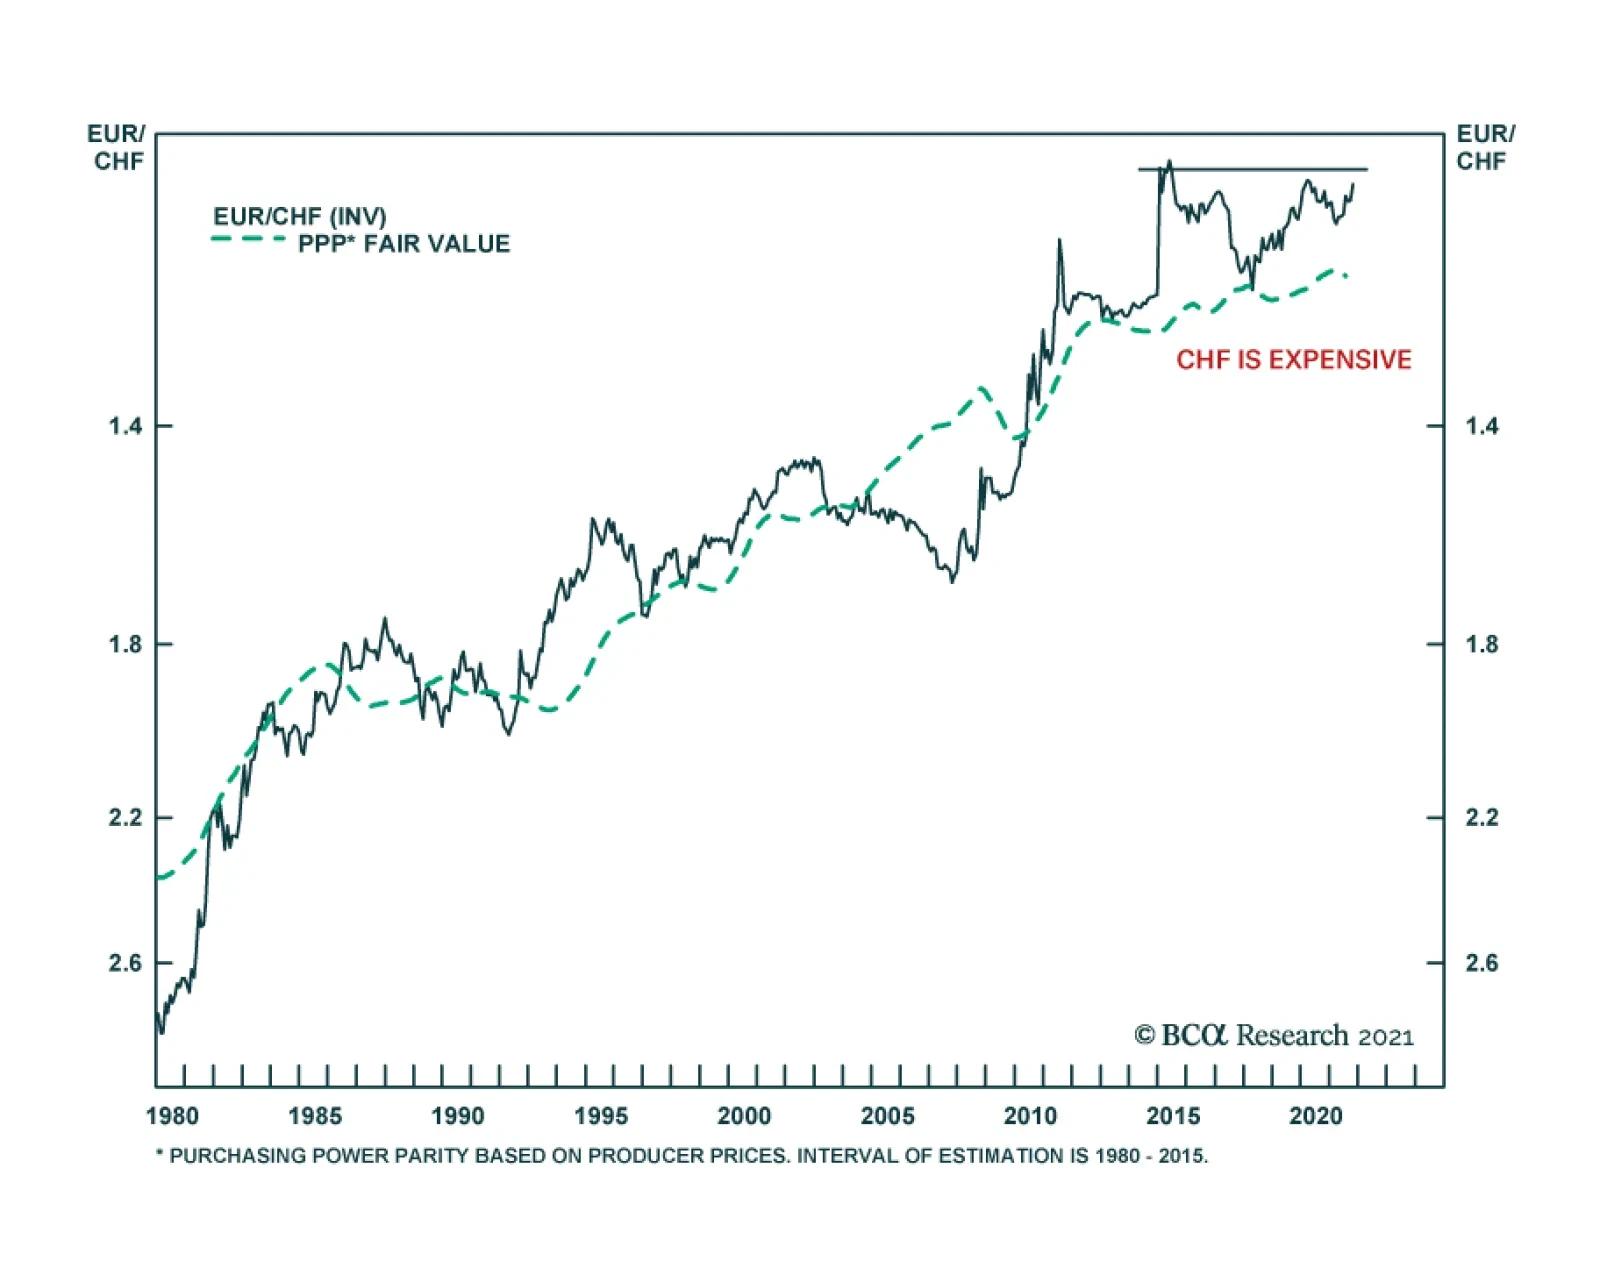
On Friday, EUR/CHF fell below 1.05 – an important technical resistance level. This move occurred in the context of a general risk off environment in financial markets which was triggered by news that more European countries are imposing restrictions amid…
Highlights Expectations for monetary policy in Australia have turned aggressively hawkish over the past month, with markets now discounting multiple rate hikes next year. This pricing defies guidance from the Reserve Bank of Australia (RBA), which calls for no rate hikes until 2024. An update of our RBA Checklist shows that while there is a growing case for the RBA to tighten, there are still enough lingering uncertainties about the trajectory for growth (specifically, Chinese import demand) and inflation (specifically, wage growth) for the RBA to credibly remain on the sidelines next year. Fade the aggressive 2022 rate hike profile discounted in Australian interest rate markets by staying overweight Australian government bonds in global bond portfolios. Also position for a steeper yield curve (that should also benefit Australian bank stocks) and wider breakevens on Australian inflation-linked bonds. The Australian dollar offers compelling medium-term value, but play that through positions on the crosses (long AUD/NZD & AUD/CHF) with the RBA/Fed policy gap keeping a lid on AUD/USD in the near term. Feature With inflation surging across the world, investors have become hyper-sensitive to any potentially hawkish turn by central banks that have used ultra-accommodative monetary policy to fight the economic shock of the COVID-19 pandemic. Rapidly shifting interest rate expectations have triggered bouts of bond and currency volatility in countries like the UK, Canada and New Zealand over the past several months – with perhaps the biggest shock seen in Australia. Australian government bonds had enjoyed an impressive period of outperformance versus developed market peers between March and September of 2021. All that changed in late October (Chart 1), when the RBA effectively abandoned its yield curve control policy that anchored shorter-maturity bond yields with asset purchases, triggering a spike in Australian yields (the yield on the April 2024 government bond that was targeted by the RBA jumped +80bps in a single week). Interest rate expectations have rapidly been repriced higher to the point where there are now nearly four rate hikes in 2022 discounted in the Australian overnight index swap (OIS) curve – even with the RBA still formally saying that it does not expect to lift rates until 2024 (Chart 2). Chart 1The RBA Will Likely Disappoint Market Expectations
The RBA Will Likely Disappoint Market Expectations
The RBA Will Likely Disappoint Market Expectations
Chart 2A Very Aggressive Term Structure For Aussie Interest Rates
A Very Aggressive Term Structure For Aussie Interest Rates
A Very Aggressive Term Structure For Aussie Interest Rates
In this Special Report, we revisit our RBA Checklist, originally introduced in January of this year, to determine if the time is indeed right to expect tighter monetary policy in Australia next year, which has implications for not only the Australian bond market but also the Australian dollar. While much of the checklist is flashing a need for the RBA to begin lifting rates, there are still enough lingering uncertainties on the outlook for inflation, the labor market and export demand to keep the central bank on hold in 2022. Checking In On Our RBA Checklist Chart 3Tentative Signs Of A Rebound In Aussie Economic Activity
Tentative Signs Of A Rebound In Aussie Economic Activity
Tentative Signs Of A Rebound In Aussie Economic Activity
Before the recent Australian bond market turbulence, the potent policy mix from the RBA since the start of the pandemic – cutting the Cash Rate to 0.1%, with aggressive quantitative easing (QE) and yield curve control, all reinforced with very dovish forward guidance – helped cap market pricing for interest rate hikes. A sharp outbreak of the Delta Variant earlier this year, leading to severe economic restrictions in Australia’s major cities, also helped anchor bond yields Down Under on a relative basis compared with other countries. As RBA Governor Philip Lowe noted in his speech following the November 2 RBA policy meeting, “At the outset of the pandemic, economic policy, including monetary policy, set out to build a bridge to the other side. That other side is now clearly in sight. As [pandemic] restrictions are eased, spending is expected to pick up relatively quickly as people seek a return to a more normal way of life.” At the same time, Lowe stated that “the latest data and forecasts do not warrant an increase in the Cash Rate in 2022.” Thus, any attempt to begin unwinding RBA policy accommodation would require clear evidence that the impacts of the pandemic on economic growth, and also on inflation and financial stability, were evolving such that emergency policy settings were no longer required. On the growth front, there are already signs of recovery looking at reliable cyclical indicators like the manufacturing and services PMIs, which have rebounded by 6.2 points and 8.9 points, respectively, from the August lows (Chart 3). Yet while inflation expectations have remained fairly stable – the 5-year/5-year Australia CPI swap rate has stayed in a 2.2-2.5% range throughout 2021, despite the Delta outbreak – our RBA Monitor has rolled over, led by the economic growth components. This suggests there may be some diminished pressure for tighter monetary policy in Australia. To get a clearer picture on the outlook for Australian monetary policy over the next year, it is a good time to revisit our RBA Checklist - the most important things to monitor to determine when the RBA could be expected to turn more hawkish. We compiled the Checklist back in January, and the elements are still relevant today. 1. The COVID-19 vaccination process goes quickly and smoothly (✓) We are placing a checkmark next to this part of our RBA Checklist. After a very slow start earlier in 2021, Australia has executed a successful vaccination campaign with 71% of the population now fully vaccinated (Chart 4). More importantly, the number of daily new infections is rolling over rapidly, and hospitalization rates remain low. This is allowing economic restrictions to be lifted quickly. Chart 4The Beginning Of The End Of Australia's 2021 COVID Crisis
The Beginning Of The End Of Australia's 2021 COVID Crisis
The Beginning Of The End Of Australia's 2021 COVID Crisis
2. Private sector demand accelerates as the impulse from COVID fiscal stimulus fades (✓?) We are tentatively giving a checkmark for this component of the Checklist, but with a question mark given some of the cross-currents visible on the consumer spending side. Real consumer spending rebounded sharply in the first half of 2021 (Chart 5). However, the Delta lockdowns weighed on consumer confidence and demand in Q3, with retail sales contracting on a year-over-year basis (both in nominal and inflation-adjusted terms). Furthermore, much of the spending boom was fueled by Australian households running down the high savings accumulated during the 2020 COVID lockdowns. The household savings rate fell from a peak of 22% in Q2 2020 to 10% in Q2 2021, the last data point available, while real disposable income growth actually fell by -2.6% on a year-over-year basis in Q2. We expect the next few consumer confidence prints to improve sharply as economic restrictions are lifted, with consumer spending following suit. This would lead us to remove the question mark next to this item of the RBA Checklist. Already, business confidence is rebounding with the NAB survey bouncing 6 points in October (Chart 6), which should translate into increased capital spending and hiring activity by Australian companies that have maintained profitability during the pandemic (top panel). Chart 5Australia's Economy Holding Up Well Despite COVID Wave
Australia's Economy Holding Up Well Despite COVID Wave
Australia's Economy Holding Up Well Despite COVID Wave
Chart 6Resilient Business Confidence Will Support Employment
Resilient Business Confidence Will Support Employment
Resilient Business Confidence Will Support Employment
3. Inflation, both realized and expected, returns to the RBA’s 2-3% target (✓?)
Chart 7
We are giving another tentative checkmark with a question mark for this entry in the RBA Checklist, given that wage growth remains modest despite high realized inflation. Australian headline CPI inflation, on a year-over-year basis, was 3.8% in Q2/2021 and 3.0% in Q3/2021, above the top of the 2-3% RBA target. Much of that inflation has come from the Transport sector, which includes the prices of both car fuel and new car prices, which contributed 1.1% to inflation in Q3 (Chart 7). The former is impacted by high oil prices and the latter is influenced by the global supply chain disruption and shortage of semiconductors used in cars. Beyond those sectors, there was a modest pickup in inflation across much of the consumption basket. Underlying inflation was more subdued but did pick up over the same Q2/Q3 period. Annual growth in the trimmed mean CPI accelerated from 1.6% in Q2 to 2.1% in Q3 - returning to the bottom half of the RBA’s target range for the first time since Q4/2015 (Chart 8). The latest RBA projections call for underlying inflation to stay in the lower half of the inflation target range in 2022 (2.25%) and 2023 (2.5%), although this is conditional on a steady tightening of the Australian labor market. The RBA is forecasting the unemployment rate, which was at 5.2% in October, to fall to 4.25% by the end of 2022 and 4% by the end of 2023. The RBA expects a tighter labor market to eventually boost wage growth to a pace consistent with underlying inflation staying within the RBA target band – which would then augur for tighter monetary policy. The central bank has repeatedly stated that annual growth in the Wage Cost Index, its most preferred measure of Australian wages, has historically been in the 3-4% range when underlying inflation was consistently between 2-3%. The Wage Cost Index grew by only 2.2% on a year-over-year basis in Q3, so still well below the pace that would convince the RBA that underlying inflation would stay within the target. This argues for a wait-and-see approach. Chart 8Wage Uncertainty Preventing A Hawkish RBA Turn
Wage Uncertainty Preventing A Hawkish RBA Turn
Wage Uncertainty Preventing A Hawkish RBA Turn
Chart 9A Rising Participation Rate Will Cushion Tightening In The Labor Market
A Rising Participation Rate Will Cushion Tightening In The Labor Market
A Rising Participation Rate Will Cushion Tightening In The Labor Market
RBA Governor Lowe has noted that there is still ample spare capacity in labor markets that opened up because of COVID lockdowns, which will prevent a more rapid decline in the unemployment rate even with labor demand still quite strong. On that note – the Australian labor force participation rate fell from a 2021 high of 66.3% in March of this year to 64.7% in October, a 1.6 percentage point decline that provides a buffer to absorb the strong labor demand in Australia (Chart 9). Given that Australian inflation and wages are reported less frequently (quarterly) than employment data (monthly), it is a challenge for the RBA to quickly assess to true state of inflationary pressure in the Australian economy. We see the inflation data as being far more important than labor market developments in assessing the RBA’s next move. The RBA will likely want to a few more Wage Cost Index and CPI prints before signaling any move to hike rates sooner than currently projected. The RBA will not have a complete reading on wages for the first half of 2022 until August, when the Q2/2022 Wage Cost Index is released. Thus, it would not be until well into the latter half of 2022 before any shift in hawkish messaging could plausibly occur, at the earliest, even if CPI inflation were to surprise to the upside over the same period. The RBA will need to see price inflation confirmed by wage inflation before changing its stance. In a nutshell, robust inflation prints out of Australia will need to be reinforced by strong wage data, for the RBA to move the dial closer to market expectations for interest rate hikes. 4. House price inflation is accelerating (✓) We are placing a checkmark next to this piece of our Checklist. Given Australia’s past history with periods of surging home values, signs that housing markets are overheating could prompt the RBA to consider tightening monetary policy sooner than expected. On that front, there is plenty of evidence to give the RBA anxiety. Median house prices grew at a 16.8% year-over-year rate in Q2, the fastest pace since 2003, and now appear very expensive relative to median incomes (Chart 10). Chart 10House Price Appreciation Could Moderate
House Price Appreciation Could Moderate
House Price Appreciation Could Moderate
High prices may eventually begin to turn away buyers, as the “good time to buy a home” component of the Melbourne/Westpac consumer confidence survey has fallen sharply (bottom panel). Some of that decline may also be due to the Delta wave, as the growth rate of new building approvals has also slowed alongside rising COVID cases (top panel). The RBA will likely want to see a few post-Delta prints on Australian house prices and housing demand to determine the true underlying trends. But given the extreme readings on overall house prices, the housing market is a legitimate reason for the RBA to turn more hawkish. 5. Export demand, particularly from China, is strong (x) We are NOT placing a checkmark next to this item of our RBA Checklist. A booming external environment could lead the RBA to feel more comfortable signaling rate hikes. So far, that has been the case via a rising terms of trade, which has positive implications for the valuation of the Australian dollar, as we discuss below. But on the volume front - which is critical for the growth outlook, and RBA policy decisions, given the importance of the export sector to the Australian economy - there is reason for caution. First, the Chinese economy continues to slow down. The Chinese credit impulse, one of the key gauges of momentum in domestic activity peaked in October last year and has been rolling over since. Historically, this has been a bad omen for Aussie exports in general, as well as the performance of the AUD (Chart 11). Almost 40% of Australian exports go to China. This suggests that exports of both coal and iron ore are particularly susceptible to a further slowdown in Chinese construction activity. That said, the slowdown in China has probably passed the “maximum deceleration” phase and the odds are that, going forward, both monetary and fiscal policy will be marginally eased. This will help cushion the Australian dollar and bond yields from undershooting below current levels. Chinese bond yields have already declined, reflecting an easing in domestic financial conditions. With the Chinese bond market becoming more and more liberalized, it has become a good proxy for monetary conditions. As such, the trend in Chinese bond yields has tended to lead Chinese imports. As Chinese going concerns finance working capital requirements at lower rates, this could help stabilize import volumes (Chart 12). Chart 11A Slowdown In China Is A Risk For The AUD
A Slowdown In China Is A Risk For The AUD
A Slowdown In China Is A Risk For The AUD
Chart 12Easing Financial Conditions In China
Easing Financial Conditions In China
Easing Financial Conditions In China
Political tensions between Australia and China remain a key point of contention for higher Aussie terms of trade and an improving basic balance. However, many Australian exports are fungible and have been redirected to other countries. For example, despite China’s ban on Australian coal imports, Aussie export volumes and terms of trade remain robust, leading to a sharp improvement in Australia’s external accounts (Chart 13). This is because Australian exports to Japan, India, and South Korea have picked up as China has redirected imports of coal from Australia to other countries. Commodity prices remain resilient, but could face downside in the coming months. This is especially the case for Australian export prices, which have outperformed that of other commodity-producing nations, leading to the sharp improvement in the terms of trade (Chart 14). Part of the story has been a supply-side shock. But Australia is also relatively competitive in supplying the types of raw materials that China needs and wants such as higher-grade iron ore, which is more expensive, pollutes less, and is in high demand. Similarly, Australia is one of the largest exporters of liquefied natural gas, of which prices have been soaring in recent months amidst a global push to clean the planet. Chart 13An Improving Basic Balance Supports The AUD
An Improving Basic Balance Supports The AUD
An Improving Basic Balance Supports The AUD
Chart 14Australian Terms Of Trade Are Robust
Australian Terms Of Trade Are Robust
Australian Terms Of Trade Are Robust
Historically, the terms of trade has been one of the best explanatory variables for the AUD. That said, our model suggests that even a 15%-20% decline in forward prices will still keep the AUD undervalued relative to levels implied by terms of trade (Chart 15). While Australian export prices have overtaken their 2011 highs, the AUD remains around 35% below 2011 levels. On a longer-term basis, Australia’s terms-of-trade improvement is likely to continue. First, a boom in global infrastructure spending is likely to keep the prices of the commodities Australia exports well bid. This includes both copper and iron ore. Second, China’s clean energy policy shift away from coal and towards natural gas will buffet LNG export volumes (Chart 16). Given that reducing - if not outright eliminating - pollution is a long-term strategic goal in China, this will provide a multi-year tailwind for both cleaner ore and LNG import volumes. Chart 15A Drop In Commodities Is Well Discounted By The AUD
A Drop In Commodities Is Well Discounted By The AUD
A Drop In Commodities Is Well Discounted By The AUD
Chart 16
In a nutshell, Australia sports the best improvement in both trade and current account balances in the G10 over the last few years (Chart 17). Significant investment in resource projects over the last decade are now bearing fruit, easing the external funding requirement. This has ended the 35-year-long deficit in the current account. A rising current account naturally increases the demand for the Australian dollar, even in the absence of RBA rate hikes. This argues for short-term caution, but a longer-term bullish view on the Aussie. Chart 17External Funding Will Face Competition From Domestic Savings
External Funding Will Face Competition From Domestic Savings
External Funding Will Face Competition From Domestic Savings
Investment Implications A check of our RBA Checklist shows that the argument in favor of tighter monetary policy is becoming more compelling. However, the uncertainties over Australian wages and Chinese growth – both critical for the RBA’s next move - will not be resolved until the second half of 2022, so RBA tightening is not likely until the first half of 2023 at the earliest. There are a number of ways that investors can position for continued RBA dovishness in 2022. Fixed Income Bond investors should overweight Australian government bonds in global portfolios, as the RBA will not match the policy tightening expected in the US, Canada or the UK. Those overweights should be concentrated versus the US, given the lower yield beta of Australian government bonds versus US Treasuries (Chart 18). For dedicated Australian bond investors, maintain a below-benchmark duration stance as longer-maturity yields have more room to rise as the economy continues to recover from the Delta wave. In addition, favor inflation-linked debt over nominal bonds, as both survey-based inflation expectations and the fair value from our 10-year breakeven spread model are rising. Wider breakevens pushing up longer-term yields, and a dovish RBA capping shorter-maturity bond yields, both point to a bearish steepening of the government bond yield curve over the next 6-12 months (Chart 19). Chart 18Remain Overweight Aussie Bonds...
Remain Overweight Aussie Bonds...
Remain Overweight Aussie Bonds...
Chart 19...And Position For A Steeper Yield Curve
...And Position For A Steeper Yield Curve
...And Position For A Steeper Yield Curve
Currency A lot of pessimism is already embedded in the Aussie dollar, making it a potent candidate for a powerful mean-reversion rally. One catalyst will be a continued reversal in COVID-19 infection rates. The second is valuation. The Aussie is at fair value on a PPP basis, but remains very cheap on a terms-of-trade basis. Historically, terms of trade have had much better explanatory power for the direction of the Aussie, compared to relative real interest rates or fluctuations from purchasing power parity. Even accounting for falling commodity prices, the valuation margin of safety makes the AUD a good bet over a cyclical horizon, though in the very near-term, it is fraught with risks. We have a limit-buy on AUD/USD at 70 cents, which could be a capitulation level. On the upside, if the Aussie closes its undervaluation gap vis-à-vis terms of trade as it has done historically, this will lift AUD/USD towards 85 cents and beyond. Finally, sentiment on the Aussie is very depressed. Extreme short positioning suggests a dearth of buyers and the potential for a short covering rally (Chart 20). On the crosses, we are already long AUD/NZD, but AUD/CHF and AUD/CAD should also be winners in any Aussie short squeeze. Chart 20Lots Of Shorts In The Aussie
Lots Of Shorts In The Aussie
Lots Of Shorts In The Aussie
Equities 37% of the MSCI Australia index is financials, while 16% is materials. Therefore, a call on the Australian equity market is a call on banks and resources. On the resource front, Australian producers will benefit from a pickup in natural gas exports and a shift away from coal. Therefore, the strategy will be to overweight Australian LNG producers in a resource portfolio. On banks, a relatively dovish RBA will keep the Australian yield curve steep. Meanwhile, banks have still underperformed the improvement in the interest rate term structure. A bottoming economy will also benefit banks, as investors start to price in the prospect for interest rate hikes beyond 2023 (Chart 21). Chart 21A Steeper Yield Curve Will Benefit Banks
A Steeper Yield Curve Will Benefit Banks
A Steeper Yield Curve Will Benefit Banks
Robert Robis, CFA Chief Fixed Income Strategist rrobis@bcaresearch.com Chester Ntonifor Foreign Exchange Strategist chestern@bcaresearch.com Trades & Forecasts Strategic View Cyclical Holdings (6-18 months) Tactical Holdings (0-6 months) Limit Orders Forecast Summary
Highlights Expectations for monetary policy in Australia have turned aggressively hawkish over the past month, with markets now discounting multiple rate hikes next year. This pricing defies guidance from the Reserve Bank of Australia (RBA), which calls for no rate hikes until 2024. An update of our RBA Checklist shows that while there is a growing case for the RBA to tighten, there are still enough lingering uncertainties about the trajectory for growth (specifically, Chinese import demand) and inflation (specifically, wage growth) for the RBA to credibly remain on the sidelines next year. Fade the aggressive 2022 rate hike profile discounted in Australian interest rate markets by staying overweight Australian government bonds in global bond portfolios. Also position for a steeper yield curve (that should also benefit Australian bank stocks) and wider breakevens on Australian inflation-linked bonds. The Australian dollar offers compelling medium-term value, but play that through positions on the crosses (long AUD/NZD & AUD/CHF) with the RBA/Fed policy gap keeping a lid on AUD/USD in the near term. Feature With inflation surging across the world, investors have become hyper-sensitive to any potentially hawkish turn by central banks that have used ultra-accommodative monetary policy to fight the economic shock of the COVID-19 pandemic. Rapidly shifting interest rate expectations have triggered bouts of bond and currency volatility in countries like the UK, Canada and New Zealand over the past several months – with perhaps the biggest shock seen in Australia. Australian government bonds had enjoyed an impressive period of outperformance versus developed market peers between March and September of 2021. All that changed in late October (Chart 1), when the RBA effectively abandoned its yield curve control policy that anchored shorter-maturity bond yields with asset purchases, triggering a spike in Australian yields (the yield on the April 2024 government bond that was targeted by the RBA jumped +80bps in a single week). Interest rate expectations have rapidly been repriced higher to the point where there are now nearly four rate hikes in 2022 discounted in the Australian overnight index swap (OIS) curve – even with the RBA still formally saying that it does not expect to lift rates until 2024 (Chart 2). Chart 1The RBA Will Likely Disappoint Market Expectations
The RBA Will Likely Disappoint Market Expectations
The RBA Will Likely Disappoint Market Expectations
Chart 2A Very Aggressive Term Structure For Aussie Interest Rates
A Very Aggressive Term Structure For Aussie Interest Rates
A Very Aggressive Term Structure For Aussie Interest Rates
In this Special Report, we revisit our RBA Checklist, originally introduced in January of this year, to determine if the time is indeed right to expect tighter monetary policy in Australia next year, which has implications for not only the Australian bond market but also the Australian dollar. While much of the checklist is flashing a need for the RBA to begin lifting rates, there are still enough lingering uncertainties on the outlook for inflation, the labor market and export demand to keep the central bank on hold in 2022. Checking In On Our RBA Checklist Chart 3Tentative Signs Of A Rebound In Aussie Economic Activity
Tentative Signs Of A Rebound In Aussie Economic Activity
Tentative Signs Of A Rebound In Aussie Economic Activity
Before the recent Australian bond market turbulence, the potent policy mix from the RBA since the start of the pandemic – cutting the Cash Rate to 0.1%, with aggressive quantitative easing (QE) and yield curve control, all reinforced with very dovish forward guidance – helped cap market pricing for interest rate hikes. A sharp outbreak of the Delta Variant earlier this year, leading to severe economic restrictions in Australia’s major cities, also helped anchor bond yields Down Under on a relative basis compared with other countries. As RBA Governor Philip Lowe noted in his speech following the November 2 RBA policy meeting, “At the outset of the pandemic, economic policy, including monetary policy, set out to build a bridge to the other side. That other side is now clearly in sight. As [pandemic] restrictions are eased, spending is expected to pick up relatively quickly as people seek a return to a more normal way of life.” At the same time, Lowe stated that “the latest data and forecasts do not warrant an increase in the Cash Rate in 2022.” Thus, any attempt to begin unwinding RBA policy accommodation would require clear evidence that the impacts of the pandemic on economic growth, and also on inflation and financial stability, were evolving such that emergency policy settings were no longer required. On the growth front, there are already signs of recovery looking at reliable cyclical indicators like the manufacturing and services PMIs, which have rebounded by 6.2 points and 8.9 points, respectively, from the August lows (Chart 3). Yet while inflation expectations have remained fairly stable – the 5-year/5-year Australia CPI swap rate has stayed in a 2.2-2.5% range throughout 2021, despite the Delta outbreak – our RBA Monitor has rolled over, led by the economic growth components. This suggests there may be some diminished pressure for tighter monetary policy in Australia. To get a clearer picture on the outlook for Australian monetary policy over the next year, it is a good time to revisit our RBA Checklist - the most important things to monitor to determine when the RBA could be expected to turn more hawkish. We compiled the Checklist back in January, and the elements are still relevant today. 1. The COVID-19 vaccination process goes quickly and smoothly (✓) We are placing a checkmark next to this part of our RBA Checklist. After a very slow start earlier in 2021, Australia has executed a successful vaccination campaign with 71% of the population now fully vaccinated (Chart 4). More importantly, the number of daily new infections is rolling over rapidly, and hospitalization rates remain low. This is allowing economic restrictions to be lifted quickly. Chart 4The Beginning Of The End Of Australia's 2021 COVID Crisis
The Beginning Of The End Of Australia's 2021 COVID Crisis
The Beginning Of The End Of Australia's 2021 COVID Crisis
2. Private sector demand accelerates as the impulse from COVID fiscal stimulus fades (✓?) We are tentatively giving a checkmark for this component of the Checklist, but with a question mark given some of the cross-currents visible on the consumer spending side. Real consumer spending rebounded sharply in the first half of 2021 (Chart 5). However, the Delta lockdowns weighed on consumer confidence and demand in Q3, with retail sales contracting on a year-over-year basis (both in nominal and inflation-adjusted terms). Furthermore, much of the spending boom was fueled by Australian households running down the high savings accumulated during the 2020 COVID lockdowns. The household savings rate fell from a peak of 22% in Q2 2020 to 10% in Q2 2021, the last data point available, while real disposable income growth actually fell by -2.6% on a year-over-year basis in Q2. We expect the next few consumer confidence prints to improve sharply as economic restrictions are lifted, with consumer spending following suit. This would lead us to remove the question mark next to this item of the RBA Checklist. Already, business confidence is rebounding with the NAB survey bouncing 6 points in October (Chart 6), which should translate into increased capital spending and hiring activity by Australian companies that have maintained profitability during the pandemic (top panel). Chart 5Australia's Economy Holding Up Well Despite COVID Wave
Australia's Economy Holding Up Well Despite COVID Wave
Australia's Economy Holding Up Well Despite COVID Wave
Chart 6Resilient Business Confidence Will Support Employment
Resilient Business Confidence Will Support Employment
Resilient Business Confidence Will Support Employment
3. Inflation, both realized and expected, returns to the RBA’s 2-3% target (✓?)
Chart 7
We are giving another tentative checkmark with a question mark for this entry in the RBA Checklist, given that wage growth remains modest despite high realized inflation. Australian headline CPI inflation, on a year-over-year basis, was 3.8% in Q2/2021 and 3.0% in Q3/2021, above the top of the 2-3% RBA target. Much of that inflation has come from the Transport sector, which includes the prices of both car fuel and new car prices, which contributed 1.1% to inflation in Q3 (Chart 7). The former is impacted by high oil prices and the latter is influenced by the global supply chain disruption and shortage of semiconductors used in cars. Beyond those sectors, there was a modest pickup in inflation across much of the consumption basket. Underlying inflation was more subdued but did pick up over the same Q2/Q3 period. Annual growth in the trimmed mean CPI accelerated from 1.6% in Q2 to 2.1% in Q3 - returning to the bottom half of the RBA’s target range for the first time since Q4/2015 (Chart 8). The latest RBA projections call for underlying inflation to stay in the lower half of the inflation target range in 2022 (2.25%) and 2023 (2.5%), although this is conditional on a steady tightening of the Australian labor market. The RBA is forecasting the unemployment rate, which was at 5.2% in October, to fall to 4.25% by the end of 2022 and 4% by the end of 2023. The RBA expects a tighter labor market to eventually boost wage growth to a pace consistent with underlying inflation staying within the RBA target band – which would then augur for tighter monetary policy. The central bank has repeatedly stated that annual growth in the Wage Cost Index, its most preferred measure of Australian wages, has historically been in the 3-4% range when underlying inflation was consistently between 2-3%. The Wage Cost Index grew by only 2.2% on a year-over-year basis in Q3, so still well below the pace that would convince the RBA that underlying inflation would stay within the target. This argues for a wait-and-see approach. Chart 8Wage Uncertainty Preventing A Hawkish RBA Turn
Wage Uncertainty Preventing A Hawkish RBA Turn
Wage Uncertainty Preventing A Hawkish RBA Turn
Chart 9A Rising Participation Rate Will Cushion Tightening In The Labor Market
A Rising Participation Rate Will Cushion Tightening In The Labor Market
A Rising Participation Rate Will Cushion Tightening In The Labor Market
RBA Governor Lowe has noted that there is still ample spare capacity in labor markets that opened up because of COVID lockdowns, which will prevent a more rapid decline in the unemployment rate even with labor demand still quite strong. On that note – the Australian labor force participation rate fell from a 2021 high of 66.3% in March of this year to 64.7% in October, a 1.6 percentage point decline that provides a buffer to absorb the strong labor demand in Australia (Chart 9). Given that Australian inflation and wages are reported less frequently (quarterly) than employment data (monthly), it is a challenge for the RBA to quickly assess to true state of inflationary pressure in the Australian economy. We see the inflation data as being far more important than labor market developments in assessing the RBA’s next move. The RBA will likely want to a few more Wage Cost Index and CPI prints before signaling any move to hike rates sooner than currently projected. The RBA will not have a complete reading on wages for the first half of 2022 until August, when the Q2/2022 Wage Cost Index is released. Thus, it would not be until well into the latter half of 2022 before any shift in hawkish messaging could plausibly occur, at the earliest, even if CPI inflation were to surprise to the upside over the same period. The RBA will need to see price inflation confirmed by wage inflation before changing its stance. In a nutshell, robust inflation prints out of Australia will need to be reinforced by strong wage data, for the RBA to move the dial closer to market expectations for interest rate hikes. 4. House price inflation is accelerating (✓) We are placing a checkmark next to this piece of our Checklist. Given Australia’s past history with periods of surging home values, signs that housing markets are overheating could prompt the RBA to consider tightening monetary policy sooner than expected. On that front, there is plenty of evidence to give the RBA anxiety. Median house prices grew at a 16.8% year-over-year rate in Q2, the fastest pace since 2003, and now appear very expensive relative to median incomes (Chart 10). Chart 10House Price Appreciation Could Moderate
House Price Appreciation Could Moderate
House Price Appreciation Could Moderate
High prices may eventually begin to turn away buyers, as the “good time to buy a home” component of the Melbourne/Westpac consumer confidence survey has fallen sharply (bottom panel). Some of that decline may also be due to the Delta wave, as the growth rate of new building approvals has also slowed alongside rising COVID cases (top panel). The RBA will likely want to see a few post-Delta prints on Australian house prices and housing demand to determine the true underlying trends. But given the extreme readings on overall house prices, the housing market is a legitimate reason for the RBA to turn more hawkish. 5. Export demand, particularly from China, is strong (x) We are NOT placing a checkmark next to this item of our RBA Checklist. A booming external environment could lead the RBA to feel more comfortable signaling rate hikes. So far, that has been the case via a rising terms of trade, which has positive implications for the valuation of the Australian dollar, as we discuss below. But on the volume front - which is critical for the growth outlook, and RBA policy decisions, given the importance of the export sector to the Australian economy - there is reason for caution. First, the Chinese economy continues to slow down. The Chinese credit impulse, one of the key gauges of momentum in domestic activity peaked in October last year and has been rolling over since. Historically, this has been a bad omen for Aussie exports in general, as well as the performance of the AUD (Chart 11). Almost 40% of Australian exports go to China. This suggests that exports of both coal and iron ore are particularly susceptible to a further slowdown in Chinese construction activity. That said, the slowdown in China has probably passed the “maximum deceleration” phase and the odds are that, going forward, both monetary and fiscal policy will be marginally eased. This will help cushion the Australian dollar and bond yields from undershooting below current levels. Chinese bond yields have already declined, reflecting an easing in domestic financial conditions. With the Chinese bond market becoming more and more liberalized, it has become a good proxy for monetary conditions. As such, the trend in Chinese bond yields has tended to lead Chinese imports. As Chinese going concerns finance working capital requirements at lower rates, this could help stabilize import volumes (Chart 12). Chart 11A Slowdown In China Is A Risk For The AUD
A Slowdown In China Is A Risk For The AUD
A Slowdown In China Is A Risk For The AUD
Chart 12Easing Financial Conditions In China
Easing Financial Conditions In China
Easing Financial Conditions In China
Political tensions between Australia and China remain a key point of contention for higher Aussie terms of trade and an improving basic balance. However, many Australian exports are fungible and have been redirected to other countries. For example, despite China’s ban on Australian coal imports, Aussie export volumes and terms of trade remain robust, leading to a sharp improvement in Australia’s external accounts (Chart 13). This is because Australian exports to Japan, India, and South Korea have picked up as China has redirected imports of coal from Australia to other countries. Commodity prices remain resilient, but could face downside in the coming months. This is especially the case for Australian export prices, which have outperformed that of other commodity-producing nations, leading to the sharp improvement in the terms of trade (Chart 14). Part of the story has been a supply-side shock. But Australia is also relatively competitive in supplying the types of raw materials that China needs and wants such as higher-grade iron ore, which is more expensive, pollutes less, and is in high demand. Similarly, Australia is one of the largest exporters of liquefied natural gas, of which prices have been soaring in recent months amidst a global push to clean the planet. Chart 13An Improving Basic Balance Supports The AUD
An Improving Basic Balance Supports The AUD
An Improving Basic Balance Supports The AUD
Chart 14Australian Terms Of Trade Are Robust
Australian Terms Of Trade Are Robust
Australian Terms Of Trade Are Robust
Historically, the terms of trade has been one of the best explanatory variables for the AUD. That said, our model suggests that even a 15%-20% decline in forward prices will still keep the AUD undervalued relative to levels implied by terms of trade (Chart 15). While Australian export prices have overtaken their 2011 highs, the AUD remains around 35% below 2011 levels. On a longer-term basis, Australia’s terms-of-trade improvement is likely to continue. First, a boom in global infrastructure spending is likely to keep the prices of the commodities Australia exports well bid. This includes both copper and iron ore. Second, China’s clean energy policy shift away from coal and towards natural gas will buffet LNG export volumes (Chart 16). Given that reducing - if not outright eliminating - pollution is a long-term strategic goal in China, this will provide a multi-year tailwind for both cleaner ore and LNG import volumes. Chart 15A Drop In Commodities Is Well Discounted By The AUD
A Drop In Commodities Is Well Discounted By The AUD
A Drop In Commodities Is Well Discounted By The AUD
Chart 16
In a nutshell, Australia sports the best improvement in both trade and current account balances in the G10 over the last few years (Chart 17). Significant investment in resource projects over the last decade are now bearing fruit, easing the external funding requirement. This has ended the 35-year-long deficit in the current account. A rising current account naturally increases the demand for the Australian dollar, even in the absence of RBA rate hikes. This argues for short-term caution, but a longer-term bullish view on the Aussie. Chart 17External Funding Will Face Competition From Domestic Savings
External Funding Will Face Competition From Domestic Savings
External Funding Will Face Competition From Domestic Savings
Investment Implications A check of our RBA Checklist shows that the argument in favor of tighter monetary policy is becoming more compelling. However, the uncertainties over Australian wages and Chinese growth – both critical for the RBA’s next move - will not be resolved until the second half of 2022, so RBA tightening is not likely until the first half of 2023 at the earliest. There are a number of ways that investors can position for continued RBA dovishness in 2022. Fixed Income Bond investors should overweight Australian government bonds in global portfolios, as the RBA will not match the policy tightening expected in the US, Canada or the UK. Those overweights should be concentrated versus the US, given the lower yield beta of Australian government bonds versus US Treasuries (Chart 18). For dedicated Australian bond investors, maintain a below-benchmark duration stance as longer-maturity yields have more room to rise as the economy continues to recover from the Delta wave. In addition, favor inflation-linked debt over nominal bonds, as both survey-based inflation expectations and the fair value from our 10-year breakeven spread model are rising. Wider breakevens pushing up longer-term yields, and a dovish RBA capping shorter-maturity bond yields, both point to a bearish steepening of the government bond yield curve over the next 6-12 months (Chart 19). Chart 18Remain Overweight Aussie Bonds...
Remain Overweight Aussie Bonds...
Remain Overweight Aussie Bonds...
Chart 19...And Position For A Steeper Yield Curve
...And Position For A Steeper Yield Curve
...And Position For A Steeper Yield Curve
Currency A lot of pessimism is already embedded in the Aussie dollar, making it a potent candidate for a powerful mean-reversion rally. One catalyst will be a continued reversal in COVID-19 infection rates. The second is valuation. The Aussie is at fair value on a PPP basis, but remains very cheap on a terms-of-trade basis. Historically, terms of trade have had much better explanatory power for the direction of the Aussie, compared to relative real interest rates or fluctuations from purchasing power parity. Even accounting for falling commodity prices, the valuation margin of safety makes the AUD a good bet over a cyclical horizon, though in the very near-term, it is fraught with risks. We have a limit-buy on AUD/USD at 70 cents, which could be a capitulation level. On the upside, if the Aussie closes its undervaluation gap vis-à-vis terms of trade as it has done historically, this will lift AUD/USD towards 85 cents and beyond. Finally, sentiment on the Aussie is very depressed. Extreme short positioning suggests a dearth of buyers and the potential for a short covering rally (Chart 20). On the crosses, we are already long AUD/NZD, but AUD/CHF and AUD/CAD should also be winners in any Aussie short squeeze. Chart 20Lots Of Shorts In The Aussie
Lots Of Shorts In The Aussie
Lots Of Shorts In The Aussie
Equities 37% of the MSCI Australia index is financials, while 16% is materials. Therefore, a call on the Australian equity market is a call on banks and resources. On the resource front, Australian producers will benefit from a pickup in natural gas exports and a shift away from coal. Therefore, the strategy will be to overweight Australian LNG producers in a resource portfolio. On banks, a relatively dovish RBA will keep the Australian yield curve steep. Meanwhile, banks have still underperformed the improvement in the interest rate term structure. A bottoming economy will also benefit banks, as investors start to price in the prospect for interest rate hikes beyond 2023 (Chart 21). Chart 21A Steeper Yield Curve Will Benefit Banks
A Steeper Yield Curve Will Benefit Banks
A Steeper Yield Curve Will Benefit Banks
Robert Robis, CFA Chief Fixed Income Strategist rrobis@bcaresearch.com Chester Ntonifor Foreign Exchange Strategist chestern@bcaresearch.com Recommendations Duration Regional Allocation Spread Product Tactical Trades GFIS Model Bond Portfolio Recommended Positioning Active Duration Contribution: GFIS Recommended Portfolio Vs. Custom Performance Benchmark
Image
The GFIS Recommended Portfolio Vs. The Custom Benchmark Index
Dear Client, There will be no report next week as we will be working on our Quarterly Strategy Outlook, which will be published the following week. In the meantime, please keep an eye out for BCA Research’s Annual Outlook, featuring long-time BCA client Mr. X, who visits towards the end of each year to discuss the economic and financial market outlook for the year ahead. Best regards, Peter Berezin Chief Global Strategist Highlights Inflation in the US, and to a lesser extent, in other major economies, will follow a “two steps up, one step down” trajectory of higher highs and higher lows. While inflation will fall in the first half of next year as goods prices stabilize, an overheated labor market will cause inflation to re-accelerate into 2023. The Fed will be slow to respond to high inflation, implying that monetary policy will remain accommodative next year. This should help propel stocks to new highs. Chinese stimulus will offset much of the drag from a weaker domestic property market. The dollar is a high momentum currency, so we wouldn’t bet against the greenback in the near term. Nevertheless, with “long dollar” now a consensus trade, we would position for a weaker dollar over a 12-month horizon. A depreciating dollar next year should help non-US equities, especially beleaguered emerging market stocks. The dollar will strengthen anew in 2023, as the Fed is forced to turn more hawkish, and global equities begin to buckle. From Ice To Fire In past reports, we have contended that inflation in the US, and to a lesser extent, in other major economies, would follow a “two steps up, one step down” trajectory of higher highs and higher lows. We are currently near the top of those two steps. The pandemic ushered in a major re-allocation of spending from services to goods (Chart 1). US inflation should dip over the next 6-to-9 months as the demand for goods decelerates and supply-chain disruptions abate. Chart 1The Pandemic Caused A Major Shift In Spending From Services To Goods
The Pandemic Caused A Major Shift In Spending From Services To Goods
The Pandemic Caused A Major Shift In Spending From Services To Goods
CHart 2Those With Low Paid Jobs Are Enjoying Stronger Wage Gains
Those With Low Paid Jobs Are Enjoying Stronger Wage Gains
Those With Low Paid Jobs Are Enjoying Stronger Wage Gains
The respite from inflation will not last long, however. The labor market is heating up. So far, most of the wage growth has been at the bottom end of the income distribution (Chart 2). Wage growth will broaden over the course of 2022, setting the scene for a price-wage spiral in 2023. We doubt that either fiscal or monetary policy will tighten fast enough to prevent such a spiral from emerging. As a result, US inflation will surprise meaningfully on the upside. Our view has no shortage of detractors. In this week’s report, we address the main counterarguments in a Q&A format: Q: What makes you think that service spending will rebound fast enough to offset the drag from weaker goods consumption? Chart 3Inventory Restocking Could Be A Source Of Growth Next Year
Inventory Restocking Could Be A Source Of Growth Next Year
Inventory Restocking Could Be A Source Of Growth Next Year
A: There is still a lot of pent-up demand for goods. Try calling any auto dealership. You will hear the same thing: “We have nothing in stock now, but if you put in an order today, you might get a vehicle in 3-to-6 months.” Thus, durable goods sales are unlikely to weaken quickly. And with inventories near record low levels, firms will need to produce more than they sell (Chart 3). Inventory restocking will support GDP growth. As for services, real spending in the US grew by 7.9% in the third quarter, an impressive feat considering that this coincided with the Delta-variant wave. Service growth will stay strong in the fourth quarter. The ISM non-manufacturing index jumped to a record high of 66.7 in October, up from 61.9 in September. The Atlanta Fed’s GDPNow model is tracking real PCE growth of 9.2% in Q4. Goldman’s Current Activity Indicator has hooked up (Chart 4).
Chart 4
Q: Aren’t you worried that spending on services might stall next year? A: Not really. Chart 5 shows the percentage change in real spending for various types of services from January 2020 to September 2021, the last month of available data.
Chart 5
Chart 6
The greatest decline in spending occurred in those sectors that were most directly affected by the pandemic. Notably, spending on movie theaters, amusement parks, and live entertainment in September was still down 46% on a seasonally-adjusted basis compared to last January. Hotel spending was down 22%. Spending on public transport was down 26%. Only spending on restaurants was back to normal. The number of Covid cases has once again started to trend higher in the US, so that path to normalization will take time (Chart 6). Nevertheless, with vaccination rates still edging up and new antiviral drugs set to hit the market, it is reasonable to assume that many of the hardest-hit service categories will recover next year. Q: What about medical services? Some have speculated that the shift to telemedicine will require much lower spending down the road. A: It is true that spending on outpatient services in September was $43 billon below pre-pandemic levels. However, over two-fifths of that shortfall was in dental services, which are not amenable to telemedicine. Spending on dental services was down 16% from its January 2020 levels, compared to 6% for physician services. A more plausible theory is that many people are still worried about venturing to the doctor’s or dentist’s office. In addition, a lot of elective procedures were canceled or postponed due to the pandemic. Clearing that backlog will lift medical spending next year. Chart 7The Flow Of Savings Has Fallen Back To Pre-Pandemic Levels But The Stock Of Accumulated Savings Remains High
The Flow Of Savings Has Fallen Back To Pre-Pandemic Levels But The Stock Of Accumulated Savings Remains High
The Flow Of Savings Has Fallen Back To Pre-Pandemic Levels But The Stock Of Accumulated Savings Remains High
In any case, the cost of a telemedicine appointment is typically no different from an in-person one. And, to the extent that telemedicine does become more widespread, this could encourage more people to seek medical assistance. Lastly, even if spending on certain services does not fully recover after the pandemic, this will probably simply result in a permanent increase in spending on goods. The only way that overall consumer spending will falter is if the savings rate rises, which seems unlikely to us. Q: Why do you say that? The savings rate has been very high throughout the pandemic. A: The savings rate did spike during the pandemic, but that was mainly because fewer services were available, and because households were getting transfer payments from the government. Now that these payments have ended, the savings rate has dropped to 7.5%, roughly where it was prior to the pandemic. There is good reason to think the savings rate will keep falling next year. Households are sitting on $2.3 trillion in excess savings, most of which reside in bank deposits (Chart 7). As they run down those savings, consumption will rise in relation to income. The household deleveraging cycle is over. After initially plunging during the pandemic, credit card balances are rising (Chart 8). Banks are eager to make consumer loans (Chart 9). Household net worth has risen by over 100% of GDP since the start of the pandemic (Chart 10). As we discussed three weeks ago, the wealth effect alone could boost annual consumer spending by up to 4% of GDP. Chart 8APost-GFC Deleveraging Has Ended And People Are Swiping Credit Cards Again Following The Pandemic Scare
Post-GFC Deleveraging Has Ended And People Are Swiping Credit Cards Again Following The Pandemic Scare
Post-GFC Deleveraging Has Ended And People Are Swiping Credit Cards Again Following The Pandemic Scare
Chart 8BPost-GFC Deleveraging Has Ended And People Are Swiping Credit Cards Again Following The Pandemic Scare
Post-GFC Deleveraging Has Ended And People Are Swiping Credit Cards Again Following The Pandemic Scare
Post-GFC Deleveraging Has Ended And People Are Swiping Credit Cards Again Following The Pandemic Scare
Chart 9Banks Are Easing Credit Standards For Consumer Loans
Banks Are Easing Credit Standards For Consumer Loans
Banks Are Easing Credit Standards For Consumer Loans
Chart 10A Record Rise In Household Net Worth
A Record Rise In Household Net Worth
A Record Rise In Household Net Worth
Q: Household wealth could fall as the Fed starts tapering and eventually raising rates. Wouldn’t that cool the economy? A: The taper is a fait accompli, and markets are already pricing in rate hikes starting in the second half of next year. If the Fed were to signal its intention to raise rates more quickly than what has been priced in, then home prices and stocks could certainly weaken. We do not think the Fed will pivot in a more hawkish direction before the end of next year, however. The Fed’s estimate of the neutral rate is only 2.5%, a big step down from its estimate of 4.25% in 2012. The market’s view is broadly in line with the Fed’s (Chart 11). Despite the upward move in realized inflation, long-term inflation expectations remain in check – expected inflation 5-to-10 years out in the University of Michigan survey has increased from 2.3% in late 2019 to 2.9%, bringing it back to where it was between 2010 and 2015. The 5-year/ 5-year forward TIPS breakeven inflation rate is near the bottom end of the Fed’s comfort zone (Chart 12). Chart 11The Fed And Investors Still Believe In Secular Stagnation
The Fed And Investors Still Believe In Secular Stagnation
The Fed And Investors Still Believe In Secular Stagnation
Chart 12Long-Term Inflation Expectations Are Not Yet A Concern For The Fed
Long-Term Inflation Expectations Are Not Yet A Concern For The Fed
Long-Term Inflation Expectations Are Not Yet A Concern For The Fed
Q: What about fiscal policy? Isn’t it set to tighten sharply next year? A: The US budget deficit will decline next year. However, this will happen against the backdrop of strong private demand growth. Moreover, budget deficits are likely to remain elevated in the post-pandemic period. This week, President Biden signed a $1.2 trillion infrastructure bill into law, containing $550 billion in new spending. BCA’s geopolitical strategists expect Congress to pass a $1.5-to-$2 trillion social spending bill using the reconciliation process. All in all, the IMF foresees the US cyclically-adjusted primary budget deficit averaging 4.9% of GDP between 2022 and 2026, compared to 2.0% of GDP between 2014 and 2019 (Chart 13).
Chart 13
Chart 14While Overall Consumption Has Recovered, Business Spending and Direct Government Expenditures Remain Below Trend
While Overall Consumption Has Recovered, Business Spending and Direct Government Expenditures Remain Below Trend
While Overall Consumption Has Recovered, Business Spending and Direct Government Expenditures Remain Below Trend
It should also be noted that government spending on goods and services has been quite weak over the past two years (Chart 14). The budget deficit surged because transfer payments exploded. Unlike direct government spending, which is set to accelerate over the next few years, households saved a large share of transfer payments. Thus, the fiscal multiplier will increase next year, even as the budget deficit shrinks. Q: We have focused a lot on demand, but what about supply? There are over 4 million fewer Americans employed today than before the pandemic and yet the job openings rate is near a record high. Chart 15Despite A Notable Decline, There Are Still A Lot Of People Avoiding Work Because Of Worries About Contracting Or Transmitting Covid
Despite A Notable Decline, There Are Still A Lot Of People Avoiding Work Because Of Worries About Contracting Or Transmitting Covid
Despite A Notable Decline, There Are Still A Lot Of People Avoiding Work Because Of Worries About Contracting Or Transmitting Covid
A: Some people who left the workforce will regain employment. According to the Census Bureau’s Household Pulse Survey, there are still 2.5 million people not working because they are afraid of catching or transmitting the virus (Chart 15). That said, some workers may remain sidelined for a while longer. The very same survey also revealed that about 8 million of the 100 million workers currently subject to vaccine mandates say that “they will definitely not get the vaccine.” In addition, about 3.6 million workers have retired since the start of the pandemic, about 1.2 million more than one would have expected based on pre-existing demographic trends. Most of these retirees will not work again. Lifestyle choices may keep others from seeking employment. Female labor participation has declined much more during the pandemic and than it did during the Great Recession (Chart 16). While many mothers will re-enter the labor force now that schools have reopened, some may simply choose to stay at home.
Chart 16
The bottom line is that the pandemic has reduced labor supply at a time when labor demand remains very strong. This is likely to exacerbate the labor shortage. Q: Any chance that higher productivity will offset some of the damage to the supply side of the economy from decreased labor participation? A: US labor productivity did increase sharply during the initial stages of the pandemic. However, that appears to have been largely driven by composition effects in which low-skilled, poorly-paid service workers lost their jobs. As these low-skilled workers have returned to the labor force, productivity growth has dropped. The absolute level of productivity declined by 5.0% at an annualized rate in the third quarter, leading to an 8.3% increase in labor costs. It is telling that productivity growth has been extremely weak outside the US (Chart 17). This gives weight to the view that the pandemic-induced changes in business practices have not contributed to higher productivity, at least so far. It is also noteworthy that a recent study of 10,000 skilled professionals at a major IT company revealed that work-from-home policies decreased productivity by 8%-to-19%, mainly because people ended up working longer. Increased investment spending should eventually boost productivity. Core capital goods orders, which lead corporate capex, are up 18% since the start of the pandemic (Chart 18). However, the near-term impact of increased investment spending will be to boost aggregate demand, stoking inflation in the process.
Chart 17
Chart 18US Capex Should Pick Up
US Capex Should Pick Up
US Capex Should Pick Up
Q: We have spoken a lot about the US, but the world’s second biggest economy, China, is facing a massive deflationary shock from the implosion of its real estate market. Could that deflationary impulse potentially cancel out the inflationary impulse from an overheated US economy? A: You are quite correct that inflation has risen the most in the US. While inflation has picked up in Europe, this mainly reflects base effects (Chart 19). Inflation in China has fallen since the start of the pandemic despite booming exports. There are striking demographic parallels between China today and Japan in the early 1990s. The bursting of Japan’s property bubble corresponded with a peak in the country’s working-age population (Chart 20). China’s working-age population has also peaked and is set to decline by more than 40% over the remainder of the century. Chart 19The US Stands Out As The Inflation Leader
The US Stands Out As The Inflation Leader
The US Stands Out As The Inflation Leader
Chart 20Demographic Parallels Between China And Japan
Demographic Parallels Between China And Japan
Demographic Parallels Between China And Japan
That said, there are important differences between the two nations. In 1990, Japan was a rich economy; output-per-hour was nearly 70% of US levels. China is still a middle-income economy; output-per-hour is only 20% of US levels (Chart 21). China has the ability to outgrow some of its problems in a way that Japan did not. In addition, Chinese policymakers have learned from some of Japan’s mistakes. They have been trying to curb the economy’s dependence on property development; real estate development investment has fallen from 12% of GDP in 2014 to less than 10% of GDP (Chart 22). China is still building too many new homes, but unlike Japan in the 1990s, the government is likely to pursue stimulus measures to compensate for a shrinking property sector. This should keep the economy from entering a deflationary slump.
Chart 21
Chart 22Real Estate Investment Has Peaked In China
Real Estate Investment Has Peaked In China
Real Estate Investment Has Peaked In China
Q: Let’s bring this back to markets. What is the main investment takeaway from your view? A: The main takeaway is that investors should remain bullish on stocks and other risk assets for the next 12 months but be prepared to turn more cautious in 2023. The neutral rate of interest in the US is higher than generally assumed. This means that monetary policy is currently more accommodative than widely believed, which is good for stocks. Unfortunately, it also means that a policy error is likely: The Fed will keep rates too low for too long, causing the economy to overheat. Chart 23Bank Stocks Tend To Outperform When Yields Rise
Bank Stocks Tend To Outperform When Yields Rise
Bank Stocks Tend To Outperform When Yields Rise
This overheating will not be evident over the next six months. As we noted at the outset of this report, the US economy is currently at the top of the proverbial two steps in our projected “two steps up, one step down” trajectory for inflation. The cresting in durable goods inflation will provide a temporary respite from inflationary worries, even as the underlying long-term driver of higher inflation – an increasingly tight labor market – gains traction. Strong consumer demand and persistent labor shortages will incentivize companies to invest in new capacity and automate production. This will benefit industrial stocks and select tech names. Rising bond yields will also boost bank shares (Chart 23). A country’s current account balance is simply the difference between what it saves and what it invests. With savings on the downswing and investment on the upswing, the US will find it increasingly difficult to finance its burgeoning trade deficit. The US dollar is a high momentum currency, so we wouldn’t necessarily bet against the greenback in the near term (Chart 24). Nevertheless, with “long dollar” now a consensus trade, we would position for a weaker dollar over a 12-month horizon (Chart 25).
Chart 24
Chart 25Long Dollar Is A Crowded Trade
Long Dollar Is A Crowded Trade
Long Dollar Is A Crowded Trade
Chart 26A Depreciating Dollar Next Year Should Help Non-US Equities
A Depreciating Dollar Next Year Should Help Non-US Equities
A Depreciating Dollar Next Year Should Help Non-US Equities
A depreciating dollar next year should help non-US equities, especially beleaguered emerging markets (Chart 26). The dollar will strengthen anew in 2023, as the Fed is forced to turn more hawkish, and global equities begin to buckle. Peter Berezin Chief Global Strategist pberezin@bcaresearch.com Global Investment Strategy View Matrix
Image
Special Trade Recommendations
Image
Current MacroQuant Model Scores
Image