Currencies

Highlights Remain neutral on the US dollar. A breakout of the dollar would cause a shift in strategy. Russia’s conflict with the West is heating up now that Germany has delayed the certification of the Nord Stream II pipeline. As long as the focus remains on the pipeline, the crisis will dissipate sometime in the middle of next year. But there is an equal chance of a massive escalation of strategic tensions. Our GeoRisk Indicators will keep rising in Europe, negatively affecting investor risk appetite. Stick with DM Europe over EM Europe stocks. If the dollar does not break out, South Korea and Australia offer cyclical opportunities. Turkish and Brazilian equities will not be able to bounce back sustainably in the midst of chaotic election cycles and deep structural problems. Rallies are to be faded. Feature We were struck this week by JP Morgan CEO Jamie Dimon’s claim that his business will “not swayed by geopolitical winds.”1 If he had said “political winds” we might have agreed. It is often the case that business executives need to turn up their collars against the ever-changing, noisy, and acrimonious political environment. However, we take issue with his specific formulation. Geopolitical winds cannot shrugged off so easily – or they are not truly geopolitical. Geopolitics is not primarily about individual world leaders or topical issues. It is primarily about things that are very hard and slow to change: geography, demography, economic structure, military and technological capabilities, and national interests. This is the importance of having a geopolitically informed approach to macroeconomics and financial markets: investment is about preserving and growing wealth over the long run despite the whirlwind of changes affecting politicians, parties, and local political tactics. In this month’s GeoRisk Update we update our market-based, quantitative geopolitical risk indicators with a special focus on how financial markets are responding to the interplay of near-term and cyclical political risks with structural and tectonic pressures underlying a select group of economies and political systems. Is King Dollar Breaking Out? Chart 1King Dollar Breaking Out?
King Dollar Breaking Out?
King Dollar Breaking Out?
Our first observation is that the US dollar is on the verge of breaking out and rallying (Chart 1). This potential rally is observable in trade-weighted terms and especially relative to the euro, which has slumped sharply since November 5th. Our view on the dollar remains neutral but we are watching this rally closely. This year was supposed to be a year in which global growth recovered from the pandemic on the back of vaccination campaigns, leading the counter-cyclical dollar to drop off. The DXY bounce early in the year peaked on April 2nd but then began anew after hitting a major resistance level at 90. The United States is still the preponderant power within the international system. The USD remains the world’s leading currency by transactions and reserves. The pandemic, social unrest, and contested election of 2020 served as a “stress test” that the American system survived, whether judging by the innovation of vaccines, the restoration of order, or the preservation of the constitutional transfer of power. Meanwhile Europe faces several new hurdles that have weighed on the euro. These include the negative ramifications of the slowdown in Asia, energy supply shortages, a new wave of COVID-19 cases, and the partial reimposition of social restrictions. Moreover the Federal Reserve is likely to hike interest rates faster and higher than the European Central Bank over the coming years. Potential growth is higher in the US than Europe and the US growth is supercharged by fiscal stimulus whereas Europe’s stimulus is more limited. Of course, the US’s orgy of monetary and fiscal stimulus and ballooning trade deficits raise risks for the dollar. Global growth is expected to rotate to other parts of the world over the coming 12 months as vaccination spreads. There is still a chance that the dollar’s bounce is a counter-trend bounce and that the dollar will relapse next year. Hence our neutral view. Yet from a geopolitical perspective, the US population and economy are larger, more dynamic, more innovative, safer, and more secure than those of the European Union. The US still exhibits an ability to avoid the reckoning that is overdue from a macroeconomic perspective. Russia-West Conflict Resumes In our third quarter outlook we argued that European geopolitical risk had hit a bottom, after coming off the sovereign debt crisis of 2010-15, and that geopolitical risk would begin to rise over the long term for this region. Our reasoning was that the markets had fully priced the Europeans’ decision to band together in the face of risks to the EU’s and EMU’s integrity. What markets would need to price going forward would be greater risks to Europe’s stability from a chaotic external environment that Europe lacked the willingness or ability to control: conflict with Russia, immigration, terrorism, and the slowdown in Asia. In particular we argued that Russia’s secular conflict with the West would resume. US-Russia relations would not improve despite presidential summits. The Nord Stream II pipeline would become a lightning rod for conflict, as its operation was more likely to be halted than the consensus held. (German regulators paused the approval process this week, raising the potential for certification to be delayed past the expected March-May months of 2022.) Most importantly we argued that the Russian strategy of political and military aggression in its near-abroad would continue since Russia would continue to feel threatened by domestic instability at home and Western attempts to improve economic integration and security coordination with former Soviet Union countries. Chart 2Putin Showdown With West To Escalate Further
Putin Showdown With West To Escalate Further
Putin Showdown With West To Escalate Further
For this reason we recommended that investors eschew Russian equities despite a major rally in commodity prices. Any rally would be undercut by the slowing economy in Asia or geopolitical conflicts that frightened investors away from Russian companies, or both. Today the market is in the process of pricing the impact on Russian equities from commodity prices coming off the boil. But politics may also have something to do with the selloff in Russian equities (Chart 2). The selloff can continue given still-negative hard economic data from Asia and the escalation of tensions around Russia’s strategically sensitive borders: Ukraine, Belarus, Poland, Lithuania, Moldova, and the Black Sea. The equity risk premium will remain elevated for eastern European markets as a result of the latest materialization of country risk and geopolitical risk – the long running trend of outperformance by developed Europe has been confirmed on a technical resistance level (Chart 3). Our mistake was closing our recommendation to buy European natural gas prices too early this year. Chart 3Favor DM Europe Amid Russia Showdown
Favor DM Europe Amid Russia Showdown
Favor DM Europe Amid Russia Showdown
In early 2021, our market-based geopolitical risk indicator for Russia slumped, implying that global investors expected a positive diplomatic “reset” between the US and Russia. We advised clients to ignore this signal and argued that Russian geopolitical risk would take back off again. We said the same thing when the indicator slumped again in the second half of the year and now it is clear the indicator will move sharply higher (Chart 4). The point is that geopolitics keeps interfering with investors’ desire to resuscitate Russian equities based on macro and fundamental factors: cheap valuations, commodity price rises, some local improvements in competitiveness, and the search for yield. Chart 4Russian GeoRisk Indicator - Risks Not Yet Priced
Russian GeoRisk Indicator - Risks Not Yet Priced
Russian GeoRisk Indicator - Risks Not Yet Priced
Russia may or may not stage a new military incursion into Ukraine – the odds are 50/50, given that Russia has invaded already and has the raw capability in place on Ukraine’s borders. The intention of an incursion would be to push Russian control across the entire southern border of Ukraine to Odessa, bringing a larger swathe of the Black Sea coast under Moscow’s control in pursuit of Russia’s historic quest for warm water ports. The limitations on Russia are obvious. It would undertake new military and fiscal burdens of occupation, push the US and EU closer together, provoke a stronger NATO defense alliance, and invite further economic sanctions. Yet similar tradeoffs did not prevent Russia from taking surprise military action in Georgia in 2008 or Ukraine in 2014. After the past 13 years the US and EU are still uncoordinated and indecisive. The US is still internally divided. With energy prices high, domestic political support low, and Russia’s long-term strategic situation bleak, Moscow may believe that the time is right to expand its buffer territory further into Ukraine. We cannot rule out such an outcome, now or over the next few years. If Russia attacks, global risk assets will suffer a meaningful pullback. It will not be a bear market unless the conflict spills out beyond Ukraine to affect major economies. We have not taken a second Ukraine invasion as our base case because Russia is focused primarily on getting the Nord Stream pipeline certified. A broader war would prevent that from happening. Military threats after Nord Stream is certified will be more worrisome. A less belligerent but still aggressive move would be for Russia to militarize the Belarussian border amid the conflict with the EU over Belarus’s funneling of Middle Eastern migrants into the EU via Poland and Lithuania. A closer integration of Russia’s and Belarus’s economies and militaries would fit with Russia’s grand strategy, improve Russia’s military posture in eastern Europe, and escalate fears of eventual war in Poland and the Baltic states. The West would wring its hands and announce more sanctions but may not have a higher caliber response as such a move would not involve hostilities or the violation of mutual defense treaties. This outcome would be negative but also digested fairly quickly by financial markets. Our European GeoRisk Indicators (see Appendix) are likely to respond to the new Russia crisis, in keeping with our view that European geopolitical risk will rise in the 2020s: German risk has dropped off since the election but will now revive at least until Nord Stream II is certified. If Russia re-invades Ukraine it will rise, as it did in 2014. French risk was already heating up due to the presidential election beginning April 10 (first round) but now may heat up more. Not that Russia poses a direct threat to France but more that broader regional insecurities would hurt sentiment. The election itself is not a major risk to investors, though terrorist attacks could tick up. President Macron has an incentive to be hawkish on a range of issues over the next half year. The UK is in the midst of the Russia conflict. Its defense cooperation with Ukraine and naval activity in the Black Sea, such as port calls in Georgia, have prompted Russia’s military threats – including a threat to bomb a Royal Navy vessel earlier this year. Not to mention ongoing complications around Brexit. The Russian situation is by far the most significant factor. Spain is at a further remove from Russia but its risks are rising due to domestic political polarization and the rising likelihood of a breakdown in the ruling government. Bottom Line: We still favor these countries’ equities to those of eastern Europe but our risk indicators will rise, suggesting that geopolitical incidents could cause a setback for some or all of these markets in absolute terms. A pickup in Asian growth would be beneficial for developed European assets so we are cyclically constructive. We remain neutral on the USD-EUR though a buying opportunity may present itself if and when the Nord Stream II pipeline is certified. Korea: Nobody’s Heard From Kim In A While Chart 5Korea GeoRisk Indicator Still Elevated
Korea GeoRisk Indicator Still Elevated
Korea GeoRisk Indicator Still Elevated
Geopolitical risk has risen in South Korea due to COVID-19 and its aftershocks, including supply kinks, shortages, and policy tightening by the giant to the West (Chart 5). South Korea’s geopolitical risk indicator is still very high but not because of North Korea. Our Dear Leader Kim Jong Un has not been overly provocative, although he has restarted the cycle of provocations during the Biden administration. Yet South Korean geopolitical risk has skyrocketed. The problem is that investors have lost a lot of appetite for South Korea in a global environment in which demographics are languishing, globalization is retreating, a regional cold war is developing, and debt levels are high. Domestic politics have become more redistributive without accompanying reforms to improve competitiveness or reform corporate conglomerates. The revival of the South Korean conservatives ahead of elections in 2022 suggests political risk will remain elevated. Of course, North Korea could still move the dial. A massive provocation, say something on the scale of the surprise naval attack on the Chonan in the wake of the global financial crisis in spring of 2010, could push up the risk indicator higher and increase volatility for the Korean won and equities. Kim could take such an action to insist that President Biden pay heed to him, like President Trump did, or at least not ignore him, in a context in which Biden is doing just that due to far more pressing concerns. Biden would be forced to reestablish a credible threat. Still, North Korea is not the major factor today. Not compared to the economic and financial instability in the region. At the same time, if global growth surprises pick up and the dollar does not break out, Korea will be a beneficiary. We have taken a constructive cyclical view, although our specific long Korea trade has not worked out this year. Korean equities depreciated by 11.2% in USD terms year-to-date, compared to 0.3% for the rest of EM. Structurally, Korea cannot overcome the negative demographic and economic factors mentioned above. Geopolitically it remains a “shrimp between two whales” and will fail to reconcile its economic interests with its defense alliance with the United States. Australia: Wait On The Dollar Chart 6Australian GeoRisk Indicator Still Elevated
Australian GeoRisk Indicator Still Elevated
Australian GeoRisk Indicator Still Elevated
Australian geopolitical risk has not fallen back much from this year’s highs, according to our quant indicator (Chart 6). Global shortages and a miniature trade war were the culprits of this year’s spike. The advantage for Australia is that commodity prices and metals look to remain in high demand as the world economy fully mends. Various nations are implementing large public investment programs, especially re-gearing their energy sectors to focus more on renewables. The reassertion of the US security alliance is positive for Australia but geopolitical risk is rising on a secular basis regardless. Cyclically we would look positively toward Australian stocks. Yet they have risen by 4.3% in common currency terms this year so far, compared to the developed market-ex-US average of 11.0%. Moreover the Aussie’s latest moves confirm that the US dollar is on the verge of breaking out which would be negative for this bourse. Structurally Australia will go through a painful economic transition but it will be motivated to do so by the new regional cold war and threats to national security. The US alliance is a geopolitical positive. Turkey And Brazil The greenback’s rally could be sustainable not only because of the divergence of US from Asian and global growth but also because of the humiliating domestic political environment of most prominent emerging markets. Chart 7Emerging Market Bull Trap
Emerging Market Bull Trap
Emerging Market Bull Trap
We booked gains our “short” trade of the currencies of EM “strongmen,” such as Brazil’s Jair Bolsonaro and Turkey’s Recep Erdogan, earlier this year. But we noted that we still hold a negative view on these economies and currencies. This is especially true today as contentious elections approach in both countries in 2022 and 2023 respectively (Chart 7). Turkey is trapped into an inflation spiral of its own design, which enervates the economy, as our Emerging Markets Strategy has shown. It is also trapped in a geopolitical stance in which it has repeatedly raised the stakes in simultaneous clashes with Russia, the US, Europe, Israel, the Arab states, Libya, and Iran. Russia’s maneuvers in the Black Sea are fundamentally threatening to Turkey, so while Erdogan has maintained a balance with Russia for several years, Russian aggression could upset that balance. Turkey has backed off from some recent confrontations with the West lately but there is not yet a trend of improvement. The COVID-19 crisis gave Erdogan a badly needed bump in polls, unlike other EM peers. But this simply reinforces the market’s overrating of his odds of being re-elected. In reality the odds of a contested election or an election upset are fairly high. New lows in the lira show that the market is reacting to the whole negative complex of issues around Turkey. But the full weight of the government’s mismanaging of economic policy to stay in power and stay geopolitically relevant has not yet been felt. The election is still 19 months away. A narrow outcome, for or against Erdogan and his party, would make things worse, not better. Brazil’s domestic political and geopolitical risks are more manageable than Turkey’s. But it faces a tumultuous election in which institutional flaws and failures will be on full display. Investors will try to front-run the election believing that former President Luiz Inácio Lula da Silva will restore the good old days. But we discourage that approach. We see at least two massive hurdles for the market: first, Brazil has to pass its constitutional stress test; second, the next administration needs to be forced into difficult decisions to preserve growth and debt management. These will come at the expense of either growth or the currency, according to our Emerging Markets Strategy. We still prefer Mexican stocks. Geopolitically, Turkey will struggle with Russia’s insecurity and aggression, Europe’s use of economic coercion, and Middle Eastern instability. Brazil does not have these external problems, although social stability will always be fragile. Investment Takeaways The dollar is acting as if it may break out in a major rally. Our view has been neutral but our generally reflationary perspective on the global economy is being challenged. Russia’s conflict with the West will escalate, not de-escalate, in the wake of Germany’s decision to delay the certification of the Nord Stream II pipeline. Russia has greater leverage now than usual because of energy shortages. A re-invasion of Ukraine cannot be ruled out. But the pipeline is Russia’s immediate focus. Investors have seen conflict in Ukraine so they will be desensitized quickly unless the conflict spreads into new geographies or spills out to affect major economies. The same goes for trouble on Belarus’s borders. Stick with long DM Europe / short EM Europe. Opportunities may emerge to become more bullish on the euro and European equities if and when the Nord Stream II situation looks to be resolved and Asian risks to global growth are allayed. If the dollar does not break out, South Korea and Australia are cyclical beneficiaries. Whereas “strongman” regimes will remain volatile and the source of bull traps, especially Turkey. Matt Gertken Vice President Geopolitical Strategy mattg@bcaresearch.com Footnotes 1 “JP Morgan chief becomes first Wall Street boss to visit during pandemic,” Financial Times, November 15, 2021, ft.com. Strategic View Open Tactical Positions (0-6 Months) Open Cyclical Recommendations (6-18 Months) Open Trades & Positions
Image
Section II: Appendix: GeoRisk Indicator Russia
Russia: GeoRisk Indicator
Russia: GeoRisk Indicator
United Kingdom
UK: GeoRisk Indicator
UK: GeoRisk Indicator
Germany
Germany: GeoRisk Indicator
Germany: GeoRisk Indicator
France
France: GeoRisk Indicator
France: GeoRisk Indicator
Italy
Italy: GeoRisk Indicator
Italy: GeoRisk Indicator
Canada
Canada: GeoRisk Indicator
Canada: GeoRisk Indicator
Spain
Spain: GeoRisk Indicator
Spain: GeoRisk Indicator
Korea
Korea: GeoRisk Indicator
Korea: GeoRisk Indicator
Turkey
Turkey: GeoRisk Indicator
Turkey: GeoRisk Indicator
Brazil
Brazil: GeoRisk Indicator
Brazil: GeoRisk Indicator
Australia
Australia: GeoRisk Indicator
Australia: GeoRisk Indicator
South Africa
South Africa: GeoRisk Indicator
South Africa: GeoRisk Indicator
Section III: Geopolitical Calendar
Highlights China’s slowdown will deepen, and US bond yields will likely rise. This augurs well for the US dollar but will produce a toxic cocktail for EM. The recent weakness in the commodity complex will continue. EM markets are at risk in absolute terms and will continue to underperform their DM counterparts. From a global macro perspective, the US dollar’s appreciation will be a re-balancing act. In a world where China is exporting economic weakness/deflation and the US is experiencing genuine inflation, a strong US dollar is desirable. The latter will redistribute inflation away from the US to the rest of the world and will redirect disinflationary pressures from the rest of the world to the US. Feature Chart 1DXY Breakout, EM FX Breakdown
DXY Breakout, EM FX Breakdown
DXY Breakout, EM FX Breakdown
The US dollar is breaking out and EM currencies are breaking down (Chart 1). This will set in motion a number of responses in global financial markets. These include but are not limited to selloffs in EM equities, domestic bonds and EM credit markets and a setback in the commodity complex. Hence, we reiterate our negative stance on EM stocks and fixed-income markets. We continue to recommend shorting a basket of EM currencies versus the US dollar. Please refer to the end of this report for detailed investment recommendations. Why The Greenback Is Set To Strengthen Since early in the year, our investment strategy has been based on two macro themes: China’s slowdown and rising US inflation. We concluded early on that these dynamics are positive for the US dollar. Both macro themes have played out fairly well, yet until recently the broad trade-weighted US dollar’s advance has been hesitant. Odds are that the rally in the greenback is about to accelerate. Chart 2China's Slowdown = US Dollar Rally
China's Slowdown = US Dollar Rally
China's Slowdown = US Dollar Rally
The fundamental case for the US dollar rally remains as follows: China’s slowdown will weigh more on emerging Asia, Japan, Europe, and/or commodity producing, developing and developed economies than it will on the US. The basis is that US exports to China make up only 0.7% of its GDP. The same ratio is much higher for the rest of the world. Hence, the US economy will outperform many advanced and emerging economies. Chart 2 illustrates that, historically, whenever China has slowed down, the US dollar has rallied. The mainland’s property construction is shrinking, and traditional infrastructure investment is also extremely weak (Chart 3). Beijing is easing its regulatory and macro policies but only by degrees. For now, policy support will be insufficient to reverse the business cycle downturn. In the meantime, the US economy is overheating. Specifically, all core type inflation measures have surged to well above 2% (Chart 4). Critically, nominal wages are rising at the fastest rate seen in the past 35 years (Chart 5). Chart 3China: Infrastructure Investment Is Very Weak
China: Infrastructure Investment Is Very Weak
China: Infrastructure Investment Is Very Weak
Chart 4US Core Inflation Is Broad-Based And High
US Core Inflation Is Broad-Based And High
US Core Inflation Is Broad-Based And High
Given that the employee quit rate is very high, employers will have to grant notable wage increases to both new and current employees. Thus, wage growth will accelerate further. Recent wage gains have not been offset by productivity growth. As a result, unit labor costs are rising (Chart 6). This will push businesses to raise their selling prices. So long as household income and consumption remain robust, businesses will likely succeed in raising their prices. In short, US inflation is acute and genuine, and, hence, it will persist unless the economy slows considerably. Chart 5US Nominal Wage Growth Is At Its Fastest In 35 Years
US Nominal Wage Growth Is At Its Fastest In 35 Years
US Nominal Wage Growth Is At Its Fastest In 35 Years
Chart 6US Unit Labor Costs Are Rising Fast
US Unit Labor Costs Are Rising Fast
US Unit Labor Costs Are Rising Fast
The rise in US inflation will initially be bullish for the US dollar. The reason is that fixed-income markets will move to price in higher Fed funds rates and the Fed will also acknowledge the need to hike rates given that core inflation is well above its target range. At some point in future, however, high inflation will start hurting the US dollar. This will happen when the Fed eschews rate hikes and falls behind the inflation curve. We believe we are still in a window where US bond yields could rise further. Rising US interest rates will support the dollar. Finally, the US economy, but not necessarily its equity and credit markets, is better positioned to handle central bank tightening than are other DM and EM economies. American consumers have substantially deleveraged and there are shortages in US housing and cars. Even as US borrowing costs rise, interest rate sensitive sectors like housing and autos will still do well because of pent-up demand. In particular, the US housing market is sensitive to long-term (30-year) mortgage rates and not the front end of curve. On the contrary, many EM and other DM economies and their housing sectors are sensitive to domestic short-term rates. In percentage terms, the rise in US mortgage rates will likely be smaller than those in DM and EM economies. In short, the US economy will not slow sharply in the response to rates while EM and other DM economies will. This augurs well for the dollar. The key US vulnerability from higher interest rates stems from its equity and credit markets, not the real economy. US equities and credit markets are very richly priced, so the rising cost of capital could trigger a major selloff. In turn, wealth effects and tightening financial conditions will pose a risk to the real economy. However, even in this case, the US dollar will initially appreciate because it always rallies during risk-off phases. The greenback’s depreciation will resume when the Fed turns dovish again. From a big picture macro perspective, the US dollar’s appreciation will be a re-balancing act. In a world where China is exporting economic weakness/deflation and the US is experiencing genuine inflation, a strong US dollar is desirable. The latter will redistribute inflation away from the US to the rest of the world and will redirect disinflationary pressures from the rest of the world to the US. In this period of US dollar strength, EM financial markets will be hurt because foreign investors always flee EM when their currencies depreciate. Bottom Line: China’s slowdown will deepen, and US bond yields will likely rise. This will produce a toxic cocktail for EM. Watch Out Commodity Prices Chart 7Reduced Financing For Property Developers = Less Construction
Reduced Financing For Property Developers = Less Construction
Reduced Financing For Property Developers = Less Construction
The downturns in China’s property construction and traditional infrastructure spending are bad for raw material prices. The following points offer an explanation as to why commodity prices will relapse in spite of the fact that they have thus far resisted China’s slowdown. Although Chinese property sales and starts have been shrinking, floor area completed (construction work) has been very strong. However, the liquidity crunch that many real estate developers are experiencing will lead them to halt or cut back on their construction work (Chart 7, top panel). The latter will weigh on raw material prices (Chart 7, bottom panel). Taiwan’s new export orders PMI for the basic materials sector has dropped below 50, indicating plunging regional demand for raw materials (Chart 8). Ongoing weakness in Chinese demand is the culprit behind this drop. Due to electricity shortages, mainland production of industrial metals has plunged (Chart 9, top panel). Yet, the prices of these metals have recently corrected (Chart 9, bottom panel). Falling prices amid shrinking supply are a sign of major demand relapse. Chart 8Greater China: Orders For Basic Materials Are Already Shrinking
Greater China: Orders For Basic Materials Are Already Shrinking
Greater China: Orders For Basic Materials Are Already Shrinking
Chart 9Base Metal Price Falling Despite Production Shutdowns In China
Base Metal Price Falling Despite Production Shutdowns In China
Base Metal Price Falling Despite Production Shutdowns In China
The Baltic Dry index – the price of shipping bulk commodities – has rolled over decisively. It has reasonable correlation with industrial metal prices. Oil is much less exposed than base metals to China’s property and infrastructure contraction. In the case of crude, the key risks are the US and China releasing their strategic reserves and the US dollar strength. Bottom Line: The recent weakness in the commodity complex will continue. Other Considerations Chart 10China's Onshore Stock-to_Bond Ratio Is Breaking Down
China's Onshore Stock-to_Bond Ratio Is Breaking Down
China's Onshore Stock-to_Bond Ratio Is Breaking Down
There are a number of other considerations and indicators that lead us to maintain a negative stance on EM financial markets: China’s onshore stock-to-bond ratio has broken below its 200-day moving average (Chart 10). This signifies a deepening growth slump in China. EM equity underperformance has been broad-based. Both the market cap-weighted and equal-weighted EM equity indexes have been underperforming their respective DM indexes. Further, not only have TMT (technology, media and telecom) stocks been underperforming their DM peers, but non-TMT stocks have also lagged their counterparts substantially (Chart 11). Last but not least, EM TMT stocks remain at risk. First, share prices of Chinese internet companies will continue derating due to structurally lower profitability going forward as the government exercises more control over them. We have discussed this in previous reports. In addition, consumer spending online has slowed sharply while smartphone sales are plunging (Chart 12). Chart 11EM Equity Underperformance Is Broad-Based
EM Equity Underperformance Is Broad-Based
EM Equity Underperformance Is Broad-Based
Chart 12China: Online Spending Is Very Weak
China: Online Spending Is Very Weak
China: Online Spending Is Very Weak
Second, DRAM (memory chip) prices are deflating and the value of DRAM sales is shrinking (Chart 13). This is weighing on Korean semiconductor share prices like Samsung and SK Hynix. These stocks have a large market cap in the KOSPI index. Finally, demand for semiconductors produced by Taiwanese companies has been booming but it is presently showing signs of moderation (Chart 14). Chart 13Falling DRAM Prices Are Weighing On Korean Semi Stocks
Falling DRAM Prices Are Weighing On Korean Semi Stocks
Falling DRAM Prices Are Weighing On Korean Semi Stocks
Chart 14Taiwanese Semiconductor Industry: Moderating Orders
Taiwanese Semiconductor Industry: Moderating Orders
Taiwanese Semiconductor Industry: Moderating Orders
Importantly, geopolitical risks around Taiwan in general and TSMC in particularly are enormous. The latter is literally at the center of the US-China confrontation. The timing of a diplomatic or even military crisis is uncertain but our Geopolitical Strategy team expects geopolitical risks over Taiwan to escalate substantially. The recent summit between Presidents Joe Biden and Xi Jinping does not change this assessment. Investment Recommendations Chart 15EM Credit Markets: Prepare For A Broad Selloff
EM Credit Markets: Prepare For A Broad Selloff
EM Credit Markets: Prepare For A Broad Selloff
Continue underweighting EM equities in a global equity portfolio. Within the EM space, our overweights are Korea, Singapore, China (favoring A shares over investable stocks), Vietnam, Russia, central Europe and Mexico. Concerning EM equity sectors, we reiterate the short EM banks / long DM banks and short EM banks / long EM consumer staples positions. In line with our US dollar breakout thesis, we continue to recommend a short position in a basket of the following EM currencies versus the US dollar: BRL, CLP, COP, PEN, ZAR, TRY, THB, PHP and KRW. EM exchange rate depreciation is bad for EM domestic bonds. Currency weakness could lead central banks in Latin America to hike rates further. In brief, the risk-reward of EM local currency bonds is still unattractive. In this space, we recommend the following positions: bet on yield curve flattening in Mexico and Russia (pay 1-year/receive 10-year swap rates); pay Czech 10-year swap rates; receive Chinese and Malaysian 10-year swap rates. We reiterate our underweight in EM credit (both sovereign and corporate) markets versus US corporate credit, quality adjusted. As EM exchange rates depreciate, EM credit spreads will widen (Chart 15). Chinese high-yield corporate US dollar bonds are not yet a buy because the mainland property market’s travails are far from over, as was discussed in our recent Special Report. For a complete list of our recommendations across all asset classes and country strategy within each asset class, please see below or visit our web site. Arthur Budaghyan Chief Emerging Markets Strategist arthurb@bcaresearch.com Footnotes Equities Recommendations Currencies, Credit And Fixed-Income Recommendations
Highlights On a 2-3 year horizon, stay overweight the US stock market, in absolute terms and relative to the non-US stock market… …and stay overweight the US dollar. A good model for the US stock market is the 30-year T-bond price multiplied by US profits. A good model for the non-US stock market is the 2-year T-bond price multiplied by non-US profits. A major long-term risk to the US stock market comes from the blockchain, which is set to return the ownership and control of our data and digital content back to us – from Facebook, Google, and the other tech behemoths that currently control, manipulate, and monetise it… …but this risk is only likely to manifest itself on a 5-10 year horizon. Fractal analysis: The Israeli shekel is overbought. Feature Chart of the WeekThe US Stock Market = The 30-Year T-Bond Multiplied By US Profits
The US Stock Market = The 30-Year T-Bond Multiplied By US Profits
The US Stock Market = The 30-Year T-Bond Multiplied By US Profits
Fears that inflation will stay stubbornly high have lit a fuse under short-dated bond yields. But further along the curve, longer-dated bonds have remained an oasis of relative calm. Indeed, the 30-year T-bond yield stands 50 bps lower today than it stood in March. Given that long-duration bonds underpin the valuation of long-duration stocks, the relative calm of the 30-year bond yield explains the relative calm of the stock market in the face of higher short-term bond yields. The corollary is that substantially higher 30-year yields would threaten that calm. Inflation Will Crash Back To Earth In 2022 The relative calm of the 30-year bond yield is telling central banks: go ahead and hike rates if you want. You’ll just have to slash them again and, on average, keep them lower than you would if you didn’t hike them so soon. Rate hikes work by choking aggregate demand, but aggregate demand doesn’t need choking. Aggregate demand is barely on its pre-pandemic trend in the US, and remains far below its pre-pandemic trend in other major economies, such as the UK, Germany, and France. The pre-pandemic trend is important because it is our best estimate of potential supply. On this best estimate, aggregate demand is still below potential supply (Chart I-2). Chart I-2The 30-Year T-Bond Yield Sees That Aggregate Demand Is Fragile
The 30-Year T-Bond Yield Sees That Aggregate Demand Is Fragile
The 30-Year T-Bond Yield Sees That Aggregate Demand Is Fragile
If aggregate demand is below potential supply, then what can explain the recent surge in inflation? The answer is the massive and unprecedented displacement of demand from services to goods, combined with modern manufacturing processes unable to meet even a 5 percent excess demand, let alone the 26 percent excess demand for durables recently experienced in the US (Chart I-3). Chart I-3The Booming Demand For Goods Is Crashing Back To Earth While Services Remain In Shortfall
The Booming Demand For Goods Is Crashing Back To Earth While Services Remain In Shortfall
The Booming Demand For Goods Is Crashing Back To Earth While Services Remain In Shortfall
Yet as we highlighted last week in The Global Demand Shortfall Of 2022, the recent booming demand for goods is crashing back to earth while the demand for some services will remain structurally below the pre-pandemic trend. Combined with a tsunami of supply that will hit the global economy with a lag, inflation is also likely to crash back to earth by late 2022. The US Stock Market = The 30-Year T-Bond Multiplied By US Profits An important characteristic of any investment is its duration. If all an investment’s cashflows were converted into one ‘lump-sum’ cashflow, then the duration of the investment quantifies how far into the future that lump-sum cashflow would be. For a bond, the duration also equals the percentage change in its price for every 1 percent change in its yield.1 Interestingly, the durations of the US stock market and the 30-year T-bond are very similar, at around 25 years. Therefore, all else being equal, the US stock market should track the 30-year T-bond price. Of course, all else is not equal. The 30-year T-bond has fixed cashflows, whereas the stock market has cashflows that track profits. Allowing for this key difference, the US stock market should track: (The 30-year T-bond price) multiplied by (US profits) multiplied by (a constant) In which the constant connects current profits to the theoretical lump-sum payment 25 years ahead, thereby quantifying the structural growth of profits. But to the extent that the constant does not change, we can ignore it. Simplistic as this model appears, it does provide an excellent explanation for the US stock market’s evolution through the past 40 years (Chart of the Week and Chart I-4) – with deviations from the ‘fair-value’ giving a good gauge of the market’s over- or under-valuation. Chart I-4The US Stock Market = The 30-Year T-Bond Multiplied By US Profits
The US Stock Market = The 30-Year T-Bond Multiplied By US Profits
The US Stock Market = The 30-Year T-Bond Multiplied By US Profits
Looking ahead, there are three ways in which the structural bull market could end: If the overvaluation (deviation from fair-value) became so extreme that a substantial decline in price was required to re-converge with the 30-year T-bond price multiplied by profits. If the 30-year T-bond price could no longer rise to counter a substantial decline in profits. If the constant that links current profits to future profits phase-shifted down, implying that the growth rate of US stock market profits had phase-shifted down – as happened for non-US stock market profits after the dot com bust (Chart I-5). Going through each of these, the US stock market’s current overvaluation of around 10 percent is not so extreme as to be a structural impediment. Chart I-5The Valuation Of The Non-US Stock Market Phase-Shifted Down
The Valuation Of The Non-US Stock Market Phase-Shifted Down
The Valuation Of The Non-US Stock Market Phase-Shifted Down
Meanwhile, the 30-year T-bond yield has scope to decline by at least 150 bps, equating to a 40 percent counterweight to a decline in profits. Hence, this is not a structural impediment either, but will become one once the 30-year T-bond yield reaches 0.5 percent in the next deflationary shock. As for a phase-shift down in profit growth, this is a genuine long-term risk. The main risk comes from the blockchain and its threat to the pseudo-monopoly status that the US tech behemoths have in owning, controlling, manipulating, and monetising our data and the digital content that we create. The blockchain is set to return that ownership and control back to us, to the detriment of Facebook, Google, and the other behemoths of the US stock market. However, this is a long-term risk, likely to manifest itself on a 5-10 year horizon. We conclude that on a 2-3 year horizon, investors should own the US stock market. The Non-US Stock Market = The 2-Year T-Bond Multiplied By Non-US Profits We can extend the preceding analysis to the non-US stock market, with two differences. First, the non-US stock market has a much shorter duration given its much lower exposure to growing cashflows. A higher weighting to financials – which underperform when long yields are falling – further lowers the effective duration to just 2 years (empirically). Second, and obviously, the non-US stock market depends on non-US profits (Chart I-6). Chart I-6The Non-US Stock Market = The 2-Year T-Bond Multiplied By Non-US Profits
The Non-US Stock Market = The 2-Year T-Bond Multiplied By Non-US Profits
The Non-US Stock Market = The 2-Year T-Bond Multiplied By Non-US Profits
It follows that the non-US stock market tracks: (The 2-year T-bond price) multiplied by (non-US profits) We can now decompose the post dot com performance of the US and non-US stock markets into their underlying structural components. The US stock market has received a massive tailwind: a 60 percent increase in the 30-year T-bond price plus a 200 percent increase in profits (Chart I-7). While the non-US stock market has received a lesser tailwind: a 10 percent increase in the 2-year T-bond price plus a 60 percent increase in profits (Chart I-8).2 Chart I-7The US Stock Market Has A Powerful Tailwind...
The US Stock Market Has A Powerful Tailwind...
The US Stock Market Has A Powerful Tailwind...
Chart I-8...The Non-US Stock Market Has A Weak Tailwind
...The Non-US Stock Market Has A Weak Tailwind
...The Non-US Stock Market Has A Weak Tailwind
Therefore, over the past two decades, the non-US stock market has been hampered by its low duration and by its profits that are fossilised, both metaphorically and literally. Metaphorically fossilised, because the non-US stock market is over-exposed to industries that are in structural decline such as financials and basic resources. And literally fossilised, because it is also over-exposed to the dying fossil fuel industry. Looking ahead, there are three ways that non-US stocks could outperform US stocks: If the relative valuation (deviation from respective fair-values) became extreme in favour of non-US stocks. If the 2-year T-bond price outperformed the 30-year T-bond price – effectively meaning that the 30-year T-bond price would have to fall far given that the 2-year T-bond is like cash. If non-US profits outperformed US profits. Going through each of these: both the US and non-US stock markets appear similarly overvalued versus their respective fair-values; the 30-year T-bond is unlikely to fall far given that it would destabilise the global financial system; and fossilised non-US profits are unlikely to outperform those in the US in the next few years. We conclude that on a 2-3 year horizon, investors should stay overweight the US stock market relative to the non-US stock market. One final consideration is the US dollar. Successive deflationary shocks – the 2008 GFC, the 2015 EM recession, and the 2020 pandemic – have taken the greenback to new highs as capital flows have flooded into US T-bonds (Chart I-9). It follows that the ultimate high in the dollar will coincide with the ultimate low in the 30-year T-bond yield. Chart I-9Successive Deflationary Shocks Take The Dollar To New Highs
Successive Deflationary Shocks Take The Dollar To New Highs
Successive Deflationary Shocks Take The Dollar To New Highs
Stay structurally overweight the US dollar. The Israeli Shekel Is Overbought In this week’s fractal analysis, we note that the strong recent rally in ILS/GBP has reached the point of maximum fragility on its 130-day fractal structure that has signalled several previous reversals (Chart I-10). Chart I-10The Israeli Shekel Is Overbought
The Israeli Shekel Is Overbought
The Israeli Shekel Is Overbought
On this basis, a recommended trade would be short ILS/GBP, setting a profit target and symmetrical stop-loss at 4.2 percent. Dhaval Joshi Chief Strategist dhaval@bcaresearch.com Footnotes 1 Defined fully, the duration of an investment is the weighted average of the times of its cashflows, in which the weights are the present values of the cashflows. 2 From January 1, 2005. Fractal Trading System Fractal Trades 6-Month Recommendations Structural Recommendations Closed Fractal Trades Indicators To Watch - Bond Yields Chart II-1Indicators To Watch - Bond Yields ##br##- Euro Area
Indicators To Watch - Bond Yields - Euro Area
Indicators To Watch - Bond Yields - Euro Area
Chart II-2Indicators To Watch - Bond Yields ##br##- Europe Ex Euro Area
Indicators To Watch - Bond Yields - Europe Ex Euro Area
Indicators To Watch - Bond Yields - Europe Ex Euro Area
Chart II-3Indicators To Watch - Bond Yields ##br##- Asia
Indicators To Watch - Bond Yields - Asia
Indicators To Watch - Bond Yields - Asia
Chart II-4Indicators To Watch - Bond Yields ##br##- Other Developed
Indicators To Watch - Bond Yields - Other Developed
Indicators To Watch - Bond Yields - Other Developed
Indicators To Watch - Interest Rate Expectations Chart II-5Indicators To Watch - Interest Rate Expectations
Indicators To Watch - Interest Rate Expectations
Indicators To Watch - Interest Rate Expectations
Chart II-6Indicators To Watch - Interest Rate Expectations
Indicators To Watch - Interest Rate Expectations
Indicators To Watch - Interest Rate Expectations
Chart II-7Indicators To Watch - Interest Rate Expectations
Indicators To Watch - Interest Rate Expectations
Indicators To Watch - Interest Rate Expectations
Chart II-8Indicators To Watch - Interest Rate Expectations
Indicators To Watch - Interest Rate Expectations
Indicators To Watch - Interest Rate Expectations
Highlights Despite strong economic activity throughout most of 2021, economic surprises have decreased considerably. This helped the US equity market outperform Europe. It also significantly contributed to the euro’s depreciation versus the dollar. Even though growth will slow in 2022, economic surprises should increase. Growth expectations are much lower than they were entering 2021, and some key headwinds will fade. This picture is not without risks. China’s credit slowdown and the US’s elevated inflation represent the greatest threats. Based on the outlook for economic surprises, the euro will stage a rebound next year and small-cap stocks are attractive. Feature Global economic activity has been exceptionally robust this year, boosted by the re-opening of the world economy, as well as by the considerable fiscal and monetary stimuli injected globally over the past 20 months. However, market participants also anticipated such a rebound; as a result, global economic surprises peaked in September 2020, and they are now in negative territory. Unanticipated developments have a substantial effect on market prices. Under this lens, the deterioration in economic surprises has had a strong impact on financial markets. It helps explain why the defensive US market has outperformed, why the dollar has been strong, and why bond yields have been flat since March 2021, even though inflation has risen, growth has been high by historical standards, and many major central banks have been eschewing their accommodative biases. Going forward, the evolution of economic surprises will remain crucial to market trends. While we anticipate global economic activity will decelerate in 2022, it will likely remain above trend and surprise to the upside, which will allow global economic surprises to recover. There are significant risks to this view, with large unanswered questions about the Chinese economy and the outlook for inflation in the US. In this context, despite near-term risks, we continue to expect EUR/USD to appreciate in 2022 and European small-cap stocks to outperform large-cap equities. Deteriorating Surprises Matter This year, the underperformance of global equities (both EM and Europe) relative to the US, the weakness in the euro, and the limited increase in yields have all caught investors off guard. At the beginning of 2021, investors were massively short the greenback and duration, while surveys showed a large preference for non-US equities. These views grew out of the expectation that global growth would be strong. Global growth turned out to be strong but began to disappoint expectations by the middle of the year. Expectations had become extremely lofty, suggesting that the bar had been set too high. Additionally, the tightening credit conditions in China and the growing supply constraints around the world caused growth to decelerate somewhat. The deterioration in short-term economic momentum and in surprises harmed European equities relative to the US. As Chart 1 highlights, the relative performance of European stocks is greatly affected by the earnings revision ratio of cyclicals stocks vis-à-vis defensive ones. This relationship reflects the greater pro-cyclicality of European equities compared to those of the US. Moreover, the earnings revision ratio of cyclical stocks relative to that of defensive equities mimics the fluctuations in economic surprises (Chart 1, bottom panel), as weaker-than-expected growth invites analysts to lower their relative earning expectations. The dynamics in the economic surprise index also weighed heavily on the FX market. The dollar is a highly counter-cyclical currency; therefore, it performs poorly when growth is not only increasing, but also doing so at a rate faster than anticipated. However, economic surprises did the exact opposite this year, which boosted the dollar’s appeal and pushed EUR/USD lower (Chart 2). While the strength in the dollar was accentuated by the increasingly aggressive pricing of Fed hikes in the OIS curve, relative interest rate expectations between the US and the Euro Area are also influenced by global economic activity because of the European economy’s greater cyclicality than that of the US. Chart 1Where Surprises Go, European Stocks Follow
Where Surprises Go, European Stocks Follow
Where Surprises Go, European Stocks Follow
Chart 2Surprises Matter For The Dollar And The Euro
Surprises Matter For The Dollar And The Euro
Surprises Matter For The Dollar And The Euro
Bottom Line: Global growth has been very strong in 2021, but it has begun to decelerate. Moreover, economic surprises are now in negative territory. The evolution of economic surprises this year was a key component of the strength in the dollar, the weakness of the euro, and the underperformance of European equities. Improving Surprises In 2022? We anticipate economic surprises to pick up in 2022. First, investors and analysts around the world rightfully expect a slowdown in global growth next year. This means that the bar for the economy to generate positive surprises is lower than it was in 2021. Second, we are already seeing signs that global economic surprises are trying to stabilize. A GDP-weighted aggregate of 48 countries is forming a trough at a low level, which historically precedes a pick-up in broader aggregate measures (Chart 3). Third, economic surprises move closely with the global PMI diffusion index. The diffusion index has fallen to levels historically associated with a rebound (Chart 4). Moreover, the share of countries whose Leading Economic Indicator is rising is still very depressed for a mid-cycle slowdown (Chart 4, bottom panel). As vaccination rates are improving around the world, including those in emerging markets, and as the global economy continues to re-open, we anticipate both the PMI and LEI diffusion indexes to improve next year, which will boost economic surprises. Chart 3A Budding Rebound?
A Budding Rebound?
A Budding Rebound?
Chart 4The dispersion Of Growth Matters or Surprises
The dispersion Of Growth Matters or Surprises
The dispersion Of Growth Matters or Surprises
Fourth, the global capex outlook remains very positive. Capex intentions in the US and in the Euro Area are highly elevated and cash flows are strengthening. Moreover, US and European credit standards are very loose (Chart 5). This combination suggests that companies have the desire and the wherewithal to increase their investments next year, especially as capacity constraints limit their ability to meet final demand. Additionally, companies around the world need to rebuild inventory levels, which are depressed relative to sales, while customer inventories are still woefully low (Chart 6). Chart 5Capex Tailwinds
Capex Tailwinds
Capex Tailwinds
Chart 6Not Enough Inventories
Not Enough Inventories
Not Enough Inventories
Chart 7Households Are Rich
Households Are Rich
Households Are Rich
Fifth, households globally also have ample firepower to support their spending, despite some weakness in real income caused by rising inflation. As Chart 7 shows, household net worth in the US is up by 128% of GDP since December 2019. Additionally, the accumulated stocks of household excess savings have reached USD2.4 trillion in the US, EUR150 billion in German, EUR130 billion in France and GBP180 billion in the UK. With respect to the Eurozone specifically, fiscal and monetary policy will remain very accommodative. The fiscal thrust in 2022 will be negative 2.1%, which is significantly less onerous than the US’s -5.9% of GDP. Moreover, economies like Italy and Spain may have a negligible fiscal thrust because of the NGEU program’s disbursements. In addition, while the fiscal thrust will be slightly negative next year, government deficits will remain wide, which indicates that fiscal policy in Europe continues to support demand. Meanwhile, monetary policy still generates deeply negative interest rates on the continent, which sustains demand further. This view is not without risks. The first threat stems from the Chinese credit slowdown. BCA’s China strategists expect credit flows to bottom out by the second quarter of 2022, which implies that Chinese domestic activity should accelerate meaningfully in the second half of the year. Already, we are seeing tentative signs that authorities in China are trying to curb the credit slowdown. For example, Beijing cut the reserve requirement ratio last summer and excess reserves in the banking system are moving back up as liquidity injections grow (Chart 8). The problem is that, so far, Chinese credit demand is not responding to these small measures designed to ease policy. More will be needed as the tightening in financial conditions for real estate developers points to significant downside ahead in construction activity (Chart 9). For now, it is difficult for Beijing to ease policy much more than it has done so far: PPI has reached a 25-year high at 13.5%. Chart 8Not Enough...
Not Enough...
Not Enough...
Chart 9... Especially With Such A Drag
... Especially With Such A Drag
... Especially With Such A Drag
These Chinese inflationary pressures are likely to decline in the first months of 2022, which will allow Beijing to become more aggressive in its support to economic activity. First, Chinese demand is weak, unlike demand in the US. Second, the surge in the PPI is mostly driven by a 17% increase in the energy PPI and a 66% surge in the mining component. These jumps are unlikely to repeat themselves, which will reduce overall inflationary numbers in that economy. The second major risk is global inflation, which is hurting real wages. As a case in point, US real wages are contracting at a 3.2% annual rate, or their deepest cut in six decades. In Europe too, real wages are weak because of the increase in inflation. While these inflationary pressures have had limited effect on European consumer confidence so far, US consumer confidence is breaking down (Chart 10), driven by a collapse in the willingness to buy. If this trend continues, we might see a significant deceleration in global real consumer spending. Chart 10Not All Is Dark On The Inflation Front
Not All Is Dark On The Inflation Front
Not All Is Dark On The Inflation Front
We still expect the European inflationary risk to start dissipating in the first half of 2022. Unlike in the US, the spike in core CPI mostly reflects an increase in VAT and remains narrow, with trimmed-mean CPI lingering near record lows. Moreover, the 24-month rate of change of core CPI remains within the historical norm, which is not the case in the US. The US situation is more tenuous. Last week’s inflation data showed a broadening of inflationary pressures across major sectors of the economy unaffected by the pandemic, with shelter inflation being of particular concern. However, there are positives. Long-term inflation expectations, as approximated by the 5-year/5-year forward inflation breakeven rate, are still below the levels that prevailed before the oil price crash of 2014 (Chart 11, top panel). Additionally, shipping costs have started to ebb, with global container freight rates losing steam and the Baltic Dry index collapsing by 50% since beginning of October (Chart 11, bottom panel). Moreover, as health restrictions are being relaxed in Asia, Asian PMI’s are improving, while the production of semiconductors is rising again in the region (Chart 12). As a result, although there is still significant inflation risk over the next five years, 2022 is likely to witness a temporary pullback in CPI growth. Chart 11Not All Is Dark On The Inflation Front
Not All Is Dark On The Inflation Front
Not All Is Dark On The Inflation Front
Chart 12Semiconductor Production Is Picking Up
Semiconductor Production Is Picking Up
Semiconductor Production Is Picking Up
Bottom Line: Global investors are right to anticipate a decline in global growth next year. However, even if growth slows, it will remain above trend. Moreover, the considerable stimuli in the global economy and the decreased expectations of investors improve the odds that global economic surprises will increase in 2022. China’s domestic weakness and the rise in US inflation constitute the two greatest risks to this view. Investment Implications The level of the global economic surprise index as well as its evolution have important implications for many key European assets. Table 1 highlights the performance of various financial markets at three months, six months, and a year following various ranges of readings of the surprise index (the categories are based on one standard-deviation intervals from the mean). We highlight this methodology, because there remains significant uncertainty about the near-term outlook of the surprise index. Table 1Level Of Surprises And Subsequent Returns
Surprise, Surprise
Surprise, Surprise
Currently, the global economic surprise index stands at -20, or between its -1-sigma and its historical average. This level offers limited clear results for investors when it comes to the performance of the Eurozone benchmark relative to the MSCI All Country World Index (ACWI), and no clear results in terms of the performance of value stocks relative to growth. However, the current reading of the surprise index is consistent with an outperformance of growth stocks relative to momentum over both the three- and six-month horizons. It is also showing a 74% probability of small-cap equities beating large-cap ones over a 12-month basis. Table 2 shows the performance of the same assets over the same windows, following three consecutive months or more of an improving global economic surprise index. This is consistent with our main hypothesis that global economic surprises are set to increase by early next year. Table 2Surprise Upticks And Subsequent Returns
Surprise, Surprise
Surprise, Surprise
Using this method again shows no strong call for the Euro Area equity benchmark relative to the ACWI. There is a small improvement in performance, but Europe on average still underperforms, which reflects the thirteen years of a relative bear market in European equities. Similarly, results for European value stocks compared to growth equities are limited, as the sample is dominated by the structurally poor performance of value equities. However, this method highlights that the euro is likely to appreciate against the USD on both the three- and six-month investment horizon. This message is consistent with that of our Intermediate-Term Timing Model. Finally, this approach once again underscores the attractiveness of European small-cap equities on a three-, six-, and twelve-month investment horizon. Consequently, we maintain our buy recommendation on the euro. As we wrote three weeks ago, the near-term outlook for the common currency is fraught with risks and the low readings of the global economic surprise index confirm this reality. Moreover, markets might enter a phase when they aggressively discount Fed rates hikes next year, which would further hurt the euro. However, the outlook for global growth will ultimately put a floor under EUR/USD. Chart 13Small-Caps: Almost There
Small-Caps: Almost There
Small-Caps: Almost There
We also view European small-cap stocks as the premier equity vehicle in Europe over the coming 18 months because of their heightened pro-cyclicality. However, the timing around shifting toward overweighing small-cap remains risky in the near-term, as they have not fully worked out the overbought conditions we flagged four weeks ago (Chart 13). Thus, we maintain small-cap equities on an upgrade alert, and we are looking to pull the trigger very soon. Mathieu Savary, Chief European Strategist Mathieu@bcaresearch.com Tactical Recommendations
Surprise, Surprise
Surprise, Surprise
Cyclical Recommendations
Surprise, Surprise
Surprise, Surprise
Structural Recommendations
Surprise, Surprise
Surprise, Surprise
Closed Trades
Image
Currency Performance Fixed Income Performance Equity Performance
Highlights US growth will slow next year, not because demand will falter, but because supply-side constraints will prevent the economy from producing as much output as households and businesses want to buy. If aggregate demand exceeds aggregate supply, the price level will rise. We argue that the US aggregate demand curve is currently quite steep. This implies that the price level may need to rise a lot to restore balance to the economy. In fact, if the aggregate demand curve is not just steep but upward-sloping, which is quite possible, there may be no price level that brings aggregate demand in line with supply; the US economy could go supernova. When supply is the binding constraint to growth, investors need to throw the old playbook for dealing with growth slowdowns out the window. Rather than positioning for lower bond yields, investors should position for higher yields. Rather than expecting a stronger dollar, investors should expect a weaker one. Rather than favoring growth stocks, large caps, and defensives, investors should favor value stocks, small caps, and cyclicals. The Binding Constraint To Growth Is Now Supply After a post-Delta wave rebound in Q4, the US economy is expected to slow over the course of 2022. The Bloomberg consensus is for US growth to decelerate from 4.9% in 2021Q4 to 4.1% in 2022Q1, 3.9% in 2022Q2, 3.0% in 2022Q3, and 2.5% in 2022Q4. Growth in the first quarter of 2023 is expected to dip further to 2.3%. We agree that US growth will slow next year but think the market narrative around this slowdown is misguided. Chart 1Plenty Of Pent-Up Demand
Plenty Of Pent-Up Demand
Plenty Of Pent-Up Demand
The standard market playbook for dealing with an economic slowdown is to position for lower bond yields, a stronger US dollar, and a decline in commodity prices. On the equity side, the playbook calls for shifting equity exposure from cyclicals to defensives, favoring large caps over small caps, and growth stocks over value stocks. There are two major problems with this narrative. First, growth is peaking at much higher levels than before and is unlikely to return to trend at least until the second half of 2023. Second, and more importantly, US growth will slow due to supply-side constraints rather than inadequate demand. US final demand will remain robust for the foreseeable future. Households are sitting on $2.3 trillion in excess savings, equivalent to 15% of annual consumption (Chart 1). The household deleveraging cycle is over. After initially plunging during the pandemic, credit card balances are rising (Chart 2). Banks are falling over themselves to make consumer loans (Chart 3). Chart 2Revolving Credit On The Rise Again
Revolving Credit On The Rise Again
Revolving Credit On The Rise Again
Chart 3Banks Are Easing Credit Standards For Consumers
Banks Are Easing Credit Standards For Consumers
Banks Are Easing Credit Standards For Consumers
Chart 4A Record Rise In Household Net Worth
A Record Rise In Household Net Worth
A Record Rise In Household Net Worth
Household net worth has risen by over 100% of GDP since the start of the pandemic (Chart 4). As we discussed two weeks ago, the wealth effect alone could boost annual consumer spending by up to 4% of GDP. Investment demand should remain strong. Business inventories are near record low levels (Chart 5). Core capital goods orders, a leading indicator for corporate capex, have soared (Chart 6). Chart 5Business Inventories Are Near Record Low Levels
Business Inventories Are Near Record Low Levels
Business Inventories Are Near Record Low Levels
Chart 6Rise In Durable Goods Orders Bodes Well For Capex
Rise In Durable Goods Orders Bodes Well For Capex
Rise In Durable Goods Orders Bodes Well For Capex
Chart 7The Homeowner Vacancy Rate Is Signaling The Need For More Homebuilding
The Homeowner Vacancy Rate Is Signaling The Need For More Homebuilding
The Homeowner Vacancy Rate Is Signaling The Need For More Homebuilding
The Dodge Momentum Index, which tracks planned nonresidential construction, rose to a 13-year high in October. The homeowner vacancy rate is at multi-decade lows, signifying the need for more homebuilding (Chart 7). While increased investment will augment the nation’s capital stock down the road, the short-to-medium term effect will be to inflate demand. Policy Won’t Tighten Enough To Cool The Economy What is the mechanism that will push down aggregate demand growth towards potential GDP growth? It is unlikely to be policy. While budget deficits will narrow over the next few years, the IMF still expects the US cyclically-adjusted primary budget deficit to be nearly 3% of GDP larger between 2022 and 2026 than it was between 2014 and 2019 (Chart 8).
Chart 8
Chart 9The Fed And Investors Still Believe In Secular Stagnation
The Fed And Investors Still Believe In Secular Stagnation
The Fed And Investors Still Believe In Secular Stagnation
As Matt Gertken, BCA’s Chief Geopolitical Strategist, writes in this week’s US Political Strategy report, the passage of the $550 billion infrastructure bill has increased, not decreased, the odds of President Biden and the Democrats passing their social spending bill via the partisan budget reconciliation process. On the monetary side, the Federal Reserve will finish tapering asset purchases next June and begin raising rates shortly thereafter. However, the Fed has no intention of raising rates aggressively. Most FOMC members see the Fed funds rate rising to only 2.5% this cycle (Chart 9). The “dots” call for only one rate hike in 2022 and three rate hikes in both 2023 and 2024. Investors expect rates to rise even less by end-2024 than the Fed foresees (Chart 10).
Chart 10
The Inflation Outlook Hinges On The Slope Of The Aggregate Demand Curve If policy tightening will not suffice in cooling demand, the economy will overheat and inflation will rise. But by how much will inflation increase? The answer is of great importance to investors. It also hinges on a seemingly technical question: What is the slope of the aggregate demand curve? As Chart 11 illustrates, prices will rise more if the aggregate demand curve is steep than if it is flat.
Chart 11
Chart 12Wages Rose Faster Than Prices During The Inflationary Late-60s and 70s
Wages Rose Faster Than Prices During The Inflationary Late-60s and 70s
Wages Rose Faster Than Prices During The Inflationary Late-60s and 70s
It is tempting to think of the aggregate demand curve in the same way one might think of the demand curve for, say, apples. When the price of apples rises, there is both a substitution and an income effect. An increase in the price of apples will cause shoppers to substitute away from apples towards oranges. In addition, if apples are so-called “normal goods,” shoppers will buy fewer apples in response to lower real incomes. This chain of reasoning breaks down at the aggregate level. When economists say the price level has risen, they are referring to all prices; hence, there is no substitution effect. Moreover, since one person’s spending is another’s income, rising prices do not necessarily translate into lower overall real incomes. Granted, if nominal wages are sticky, as they usually are in the short run, an unanticipated increase in prices will reduce real wage income. However, this will be offset by higher business income. Over time, wages tend to catch up with prices. In fact, wage growth usually outstrips price growth during inflationary periods. For example, real wages rose during the late-1960s and 70s but fell during the disinflationary 1980s (Chart 12). Textbook Reasons For A Downward-Sloping Aggregate Demand Curve According to standard economic theory, there are three main reasons why aggregate demand curves are downward-sloping: The Pigou Effect: Higher prices erode the purchasing power of money, resulting in a negative wealth effect. The Keynes Effect: Higher prices reduce the real money supply. This pushes up real interest rates, leading to lower investment spending. The Mundell-Fleming Effect: Higher real rates push up the value of the currency, causing net exports to decline. None of these three factors are particularly important for the US these days. Chart 13Base Money Has Swollen Since The Subprime Crisis
Base Money Has Swollen Since The Subprime Crisis
Base Money Has Swollen Since The Subprime Crisis
Strictly speaking, the Pigou wealth effect applies only to “base money,” also known as “outside money.” Outside money includes cash notes, coins, and bank reserves. Inside money such as bank deposits are not included in the Pigou effect because while an increase in consumer prices decreases the real value of bank deposits, it also decreases the real value of commercial bank liabilities.1 In the US, the monetary base has swollen from 6% of GDP in 2008 to 28% of GDP as a result of the Fed’s QE programs (Chart 13). Nevertheless, even if one were to generously assume a wealth effect of 10% from changes in monetary holdings, this would still imply that a 1% increase in consumer prices would reduce spending by only 0.03% of GDP. Simply put, the Pigou effect is just not all that big.
Chart 14
In contrast to the Pigou effect, the Keynes effect has historically had a significant impact on the business cycle. However, the importance of the Keynes effect faded following the Global Financial Crisis as the Fed found itself up against the zero lower bound on interest rates. When interest rates are very low, there is little to distinguish money from bonds. Rather than holding money as a medium of exchange (i.e., for financing transactions), households and businesses end up holding money mainly as a store of wealth. In the presence of the zero bound, the demand for money becomes perfectly elastic with respect to the interest rate (Chart 14). As a result, changes in the real money supply have no effect on interest rates, and by extension, interest-rate sensitive spending. And if a decline in the real money supply does not push up interest rates, this undermines the Mundell-Fleming effect as well. Could The Aggregate Demand Curve Be Upward-Sloping? The discussion above, though rather theoretical in nature, highlights an important practical point: The aggregate demand curve may be quite steep. This means that the price level might need to rise a lot to equalize aggregate demand with aggregate supply. Chart 15US Real Bond Yields Hitting Record Lows
US Real Bond Yields Hitting Record Lows
US Real Bond Yields Hitting Record Lows
In fact, one can easily envision a scenario where a rising price level boosts spending; that is, where the demand curve is not just steep but upward-sloping. One normally assumes that higher inflation will prompt central banks to raise rates by more than inflation has risen, leading to higher real rates. However, if the Fed drags its feet in hiking rates, as it is wont to do given its concerns about the zero bound, rising inflation will translate into a decline in real rates. Lower rates will boost demand, leading to higher inflation, and even lower real rates. In addition, lower real rates will benefit debtors, who tend to have a higher marginal propensity to spend than creditors. This, too, will also boost aggregate demand. It is striking in this regard that real bond yields hit a record low this week, with the 10-year TIPS yield falling to -1.17% and the 30-year yield drooping to -0.57% (Chart 15). Black Holes Vs. Supernovas
Chart 16
In the case where the aggregate demand curve is upward-sloping, there is no stable equilibrium (Chart 16). If demand falls short of supply, demand will continue to shrink as the price level declines, leading to ever-rising unemployment. Unless policymakers intervene with stimulus, the economy will sink into a deflationary black hole. In contrast, if demand exceeds supply, demand will continue to rise as the price level increases exponentially. The economy will go supernova. Tick Tock Young stars fuse hydrogen into helium, releasing excess energy in the process. After the star has run out of hydrogen, if it is big enough, it will start fusing helium into heavier elements such as carbon and oxygen. The process of nucleosynthesis continues until it reaches iron. That is the end of the line. Fusing elements heavier than iron requires a net input of energy. Unable to generate enough external pressure through fusion, the star loses its battle to gravity. The core collapses, spewing material deep into interstellar space (a good thing since your body is mainly made from this stardust). Observing the star from afar, one would be hard-pressed to see anything abnormal until it explodes. The path to becoming a supernova is highly non-linear. The same is true for inflation. Just like a star with an ample supply of hydrogen, the Fed can burn through its credibility for a while longer. During the 1960s, it took four years for inflation to take off after the economy had reached full employment (Chart 17). By that time, the unemployment rate was two percentage points below NAIRU. Most of today’s inflation is confined to durable goods. This is not a sustainable source of inflation. The durable goods sector is the only part of the CPI where prices usually fall over time (Chart 18). Chart 17Inflation Spiked In The 1960s Only Once The Unemployment Rate Had Fallen Far Below Equilibrium
Inflation Spiked In The 1960s Only Once The Unemployment Rate Had Fallen Far Below Equilibrium
Inflation Spiked In The 1960s Only Once The Unemployment Rate Had Fallen Far Below Equilibrium
Chart 18Inflation Has Been Concentrated In Durable Goods, A Sector Where Prices Usually Fall Over Time
Inflation Has Been Concentrated In Durable Goods, A Sector Where Prices Usually Fall Over Time
Inflation Has Been Concentrated In Durable Goods, A Sector Where Prices Usually Fall Over Time
To get inflation to go up and stay up in modern service-based economies, wages need to rise briskly. While US wage growth has picked up, the bulk of the increase has been among low-wage workers, particularly in the services and hospitality sector (Chart 19). Chart 19Wage Growth Has Picked Up, But Mainly At The Bottom Of The Income Distribution
Wage Growth Has Picked Up, But Mainly At The Bottom Of The Income Distribution
Wage Growth Has Picked Up, But Mainly At The Bottom Of The Income Distribution
The most likely scenario for next year is that firms will simply ration output, fearful that raising prices too quickly will hurt brand loyalty and trigger accusations of price gouging. Shortages will persist, but this time they will be increasingly concentrated in the service sector. Such a state of affairs will not last, however. Competition for workers will cause wages to rise much more than they have so far. Keen to protect profit margins, firms will start jacking up prices. A wage-price spiral will develop. The US economy could go supernova. Investment Conclusions Chart 20Long-Term Inflation Expectations Are Near The Bottom End Of The Fed's Comfort Zone
Long-Term Inflation Expectations Are Near The Bottom End Of The Fed's Comfort Zone
Long-Term Inflation Expectations Are Near The Bottom End Of The Fed's Comfort Zone
US growth will slow next year, not because demand will falter, but because supply-side constraints will prevent the economy from producing as much output as households and businesses want to buy. This means that the old playbook for dealing with growth slowdowns needs to be thrown out the window. Rather than positioning for lower bond yields, investors should position for higher yields. Rather than expecting a stronger dollar, investors should expect a weaker one. Rather than favoring growth stocks, large caps, and defensives, investors should favor value stocks, small caps, and cyclicals. While inflation expectations have recovered from their pandemic lows, the 5-year/5-year forward TIPS breakeven inflation rate is still near the bottom end of the Fed’s comfort zone (Chart 20). Rising inflation expectations will lift long-term bond yields, justifying a short duration stance in fixed-income portfolios. Higher bond yields will benefit value stocks. Chart 21 shows that there has been a strong correlation between the relative performance of growth and value stocks and the 30-year bond yield this year. Rising input prices will make the US export sector less competitive, leading to a weaker dollar. Historically, non-US stocks have done well when the dollar has been weakening (Chart 22). Chart 21The Relative Performance of Value Stocks Has Closely Tracked Bond Yields This Year
The Relative Performance of Value Stocks Has Closely Tracked Bond Yields This Year
The Relative Performance of Value Stocks Has Closely Tracked Bond Yields This Year
Chart 22Non-US Stocks Tend To Do Best When The US Dollar Is Weakening
Non-US Stocks Tend To Do Best When The US Dollar Is Weakening
Non-US Stocks Tend To Do Best When The US Dollar Is Weakening
As for the overall stock market, with the Fed still in the dovish camp, it is too early to turn negative on equities. An equity bear market is coming, but not until rising inflation forces the Fed to step up the pace of rate hikes. That will probably not happen until mid-2023. Short Gilt Trade Activated We noted last week that we would go short the 10-year UK Gilt if the yield broke below 0.85%. Our limit order was activated on November 5th and we are now short this security. Peter Berezin Chief Global Strategist pberezin@bcaresearch.com Footnotes 1 To distinguish between inside and outside money, one should ask where the liability resides. If the liability resides within the private sector, it is inside money. By convention, central bank reserves are classified as outside money. However, one could argue that since taxpayers ultimately own the central bank, an increase in the price level will benefit taxpayers by eroding the real value of the central bank’s liability. If one were to take this view, the Pigou effect would be even weaker. Global Investment Strategy View Matrix
Image
Special Trade Recommendations
Image
Current MacroQuant Model Scores
Image
Dear client, This week, we are introducing our new “Currency Month-In-Review” report. The new format should dovetail nicely with the historical back sections you have become accustomed to, but with a more holistic approach to interpreting data releases, along with actionable investment advice. We would appreciate any comments, criticisms, and feedback to help us better serve you. Kind regards, The Foreign Exchange Strategy team Highlights The DXY index has broken above our 95-threshold level. As a momentum currency, the prospect for further gains in the near term are high. That said, we are sticking with our longer-term (12-18 month) bearish view. Most of the catalysts propping the dollar in the near-term should reverse. The Fed will continue to lag the inflation curve, and economic growth will rotate from the US to other economies that are getting their populations vaccinated. Both are dollar bearish. Speculative positioning in the dollar is now approaching extremes. This warns against establishing fresh long positions. Amidst the volatility in currency markets, trading opportunities are emerging. This week, we are initiating a limit-buy on EUR/CHF trade at 1.05. Feature The latest CPI report from the US was strong, taking markets much by surprise. In the currency world, the spread between the 3-month Eurodollar and Euribor interest rate shot up, pushing up the dollar (Chart 1). December 2022 Eurodollar futures are now pricing in a much faster pace of rate hikes than they did earlier this year. This helped cement the dollar as king this year (Chart 2). Chart 1The Dollar And Interest Rates
The Dollar And Interest Rates
The Dollar And Interest Rates
Chart 2AThe Strength In The DXY Is Not Fully Justified By The Economic Picture
The Strength In The DXY Is Justified By The Economic Picture
The Strength In The DXY Is Justified By The Economic Picture
Chart 2BThe Strength In The DXY Is Not Fully Justified By The Economic Picture
The Strength In The DXY Is Justified By The Economic Picture
The Strength In The DXY Is Justified By The Economic Picture
Chart 2CThe Strength In The DXY Is Not Fully Justified By The Economic Picture
The Strength In The DXY Is Justified By The Economic Picture
The Strength In The DXY Is Justified By The Economic Picture
Chart 2DThe Strength In The DXY Is Not Fully Justified By The Economic Picture
The Strength In The DXY Is Justified By The Economic Picture
The Strength In The DXY Is Justified By The Economic Picture
Economic data has also been moving in favor of the US of late. The economic surprise index in the US is at 19, while in the eurozone and Japan, it is at -50 and -73.9, respectively. From a broader perspective, the recovery in the services PMI in the US had been more robust than most other developed economies. That said, there are also signs that US economic momentum is giving way to other countries. The US is likely to be the first country to close its output gap, and commensurately, inflation is surprising to the upside (Chart 3). Wage growth has also inflected higher. This is raising the prospect that inflation might be more of a genuine concern. For many other countries, surging house prices are threatening financial stability. In New Zealand, the central bank now has a mandate to consider house prices when calibrating policy. Chart 3AThe US Is Generating Genuine Inflation. This Is Depressing Real Rates
The US Is Generating Genuine Inflation. This Is Depressing Real Rates
The US Is Generating Genuine Inflation. This Is Depressing Real Rates
Chart 3BThe US Is Generating Genuine Inflation. This Is Depressing Real Rates
The US Is Generating Genuine Inflation. This Is Depressing Real Rates
The US Is Generating Genuine Inflation. This Is Depressing Real Rates
Chart 3CThe US Is Generating Genuine Inflation. This Is Depressing Real Rates
The US Is Generating Genuine Inflation. This Is Depressing Real Rates
The US Is Generating Genuine Inflation. This Is Depressing Real Rates
Chart 3DThe US Is Generating Genuine Inflation. This Is Depressing Real Rates
The US Is Generating Genuine Inflation. This Is Depressing Real Rates
The US Is Generating Genuine Inflation. This Is Depressing Real Rates
The key point is that many central banks have already withdrawn accommodation ahead of the Fed, which puts the recent dollar rally into question. QE has ended in Canada and New Zealand. Norway and New Zealand have hiked interest rates. Forward curves suggest that most central banks should continue to withdraw accommodation. The key question is whether the Fed turns more hawkish that what is already priced in, or disappoints market expectations. We side with the latter. In the meantime, real rates continue to remain deeply negative in the US. With negative real rates and a deteriorating trade balance, the US will need to significantly raise interest rates to attract portfolio investment. For the US, portfolio investment has mostly been in the form of equity purchases rather than bond flows (Chart 4) and Chart 5). But even an increase in the US 10-year yield to 2.25% will keep real interest rates low. In the following sections, we look at the latest economic releases and provide our assessment of the impact going forward on various currencies. Chart 4AThe Fed Could Disappoint Market Expectations
The Fed Could Disappoint Market Expectations
The Fed Could Disappoint Market Expectations
Chart 4BThe Fed Could Disappoint Market Expectations
The Fed Could Disappoint Market Expectations
The Fed Could Disappoint Market Expectations
Chart 4CThe Fed Could Disappoint Market Expectations
The Fed Could Disappoint Market Expectations
The Fed Could Disappoint Market Expectations
Chart 4
Chart 5AThe US Trade Deficit Needs To Be Financed Externally
The US Trade Deficit Needs To Be Financed Externally
The US Trade Deficit Needs To Be Financed Externally
Chart 5BThe US Trade Deficit Needs To Be Financed Externally
The US Trade Deficit Needs To Be Financed Externally
The US Trade Deficit Needs To Be Financed Externally
Chart 5CThe US Trade Deficit Needs To Be Financed Externally
The US Trade Deficit Needs To Be Financed Externally
The US Trade Deficit Needs To Be Financed Externally
Chart 5DThe US Trade Deficit Needs To Be Financed Externally
The US Trade Deficit Needs To Be Financed Externally
The US Trade Deficit Needs To Be Financed Externally
US Dollar The last month has seen US economic data outperform that of its peers. Within the G10, the Citigroup economic surprise index is much higher in the US (+19), than say, the euro area (-50) or Japan (-74). This has supported the DXY, which is up almost 1% over the last month. For risk-management purposes, we are turning neutral on the DXY in the near term, even though our longer-term view remains bearish. The two most important releases in the US over the last month were the jobs report and this week’s CPI report. Nonfarm payrolls increased by 531,000 jobs and unemployment fell to 4.6% in October. This is inching closer to NAIRU. Meanwhile, headline CPI came in at 6.2% year-on-year in September while core inflation came in at 4.9%, the highest for several decades. This is occurring within the context of accelerating wage growth (unit labor costs in the nonfarm business sector surged 8.3% in Q3), higher house prices, and an ebullient stock market, reinforcing the wealth effect. That said, strong domestic demand in the US will have to trigger a much more hawkish Fed for the dollar to reach escape velocity. This is because it will push real interest rates lower as it inflates the US current account deficit. The trade deficit grew 11.2% in September, the sharpest monthly increase since July of 2020. Equity portfolio flows, which have been sustaining the trade deficit, are softening of late. Bond portfolio flows will need a much weaker dollar, or higher Treasury yields, to accelerate. Against such a backdrop, the Fed recently announced a “dovish taper” by reducing the monthly pace of its asset purchases by $15 billion, with the tapering expected to be completed by mid-2022. No imminent rate hike was signaled. The market is likely to continue to challenge such a dovish stance, which will put near-term upward pressure on the dollar, until inflation eventually rolls over. From a relative standpoint, the Fed is lagging many other major developed market central banks in normalizing monetary policy. We are sticking to our long-term bearish view on the dollar index, but a more proactive Fed is a risk to this view. We are upgrading our near-term outlook on the dollar to neutral. Chart 6AUS Dollar
US Dollar
US Dollar
Chart 6BUS Dollar
US Dollar
US Dollar
Euro The euro has been breaking down in recent sessions and is the main cause of the surge in the DXY index. The euro is down 0.7% over the last month and is currently at 1.145. The key catalyst for the weakness in the euro is the perception that the ECB will severely lag the Fed in normalizing policy settings. This is occurring within the context of surging inflation in the euro area. Headline CPI came in at 4.1% in October, above expectations of 3.7% and well above September’s 3.4% print. The is dampening real rates in the entire eurozone. On the flip side, there is credence to the ECB’s dovish stance given that unemployment is still above NAIRU and eurozone wage growth remains very tepid. On the economy, the recent improvement in both the Sentix and ZEW expectations bode well for euro area activity. Lower real rates have been the proximate driver of a soft euro in recent trading sessions. That said, real rates could improve if inflation proves transitory. The energy component of the CPI was up 23% year-on-year, by far the biggest contributor to the headline print. Any sign that the ECB is tilting towards a more hawkish direction will initially materialize in the form of reduced asset purchases. This would curtail the significant portfolio outflows from the eurozone this year. From a positioning standpoint, speculative long positions in the euro have also been liquidated, which provides some footing for the currency. We are maintaining a neutral stance on the euro in the very near term, with a bias to buy on weakness. Chart 7AEuro
Euro
Euro
Chart 7BEuro
Euro
Euro
Japanese Yen JPY is the worst-performing currency this year and it is also one of the most shorted. Over the last month, the yen is down 0.4%. Japan is just now emerging from the pandemic, having vaccinated most of its population. Ergo, the economic surprise index, which currently sits at -74, could stage a powerful rebound. While both the inflation print and employment data were in line with expectations (the unemployment rate came in at 2.8% in September), there were other encouraging signs. In October, the Eco Watcher’s Survey rose from 42.1 to 55.5, the manufacturing PMI rose from 51.5 to 53.2, and machine tool orders accelerated 81.5% year-on-year. The Bank of Japan kept monetary policy unchanged at its latest meeting. The policy stance of the BoJ remains dovish, with little prospect of any interest rate increase until 2025. Therefore, in an environment where interest rates rise, that will hurt the yen at the margin. That said, the underperformance of Japanese assets is attracting portfolio inflows, especially from equity investors. As we wrote last week, the underperformance of certain Japanese equity sectors has not been fully justified by the improving earnings picture. From a valuation standpoint, the yen is the cheapest G10 currency according to our PPP models, and it is also quite cheap according to our intermediate-term timing model. Therefore, even given the breakout in the DXY index, we are maintaining our near-term positive for the yen. Chart 8AJapanese Yen
Japanese Yen
Japanese Yen
Chart 8BJapanese Yen
Japanese Yen
Japanese Yen
British Pound As a high-beta currency, sterling has been one of the victims of dollar strength. GBP is down 1.6% over the last month. The biggest driver was the volte-face from the BoE. The BoE kept rates on hold despite their seemingly hawkish messaging weeks ahead of the MPC meeting. Gilt yields fell along with the pound. Following the expiry of the furlough scheme in September, the central bank is waiting to the see the potential impact on the labor market before curtailing accommodation. Hence, a hike in December is still on the table. Incoming data continues to strengthen the case for the BoE to tighten policy. CPI is at 3.5%, with the transport and housing sectors continuing to see surging prices. At 4.5%, the unemployment rate is at NAIRU. Wages are also inflecting higher. The latest GDP report (Q3 GDP rose 6.6% year-on-year) continues to suggest the UK economy maintains upward momentum. The October manufacturing PMI rose from 57.1 to 57.8. Near term, the pound could continue to face weakness as speculators liquidate positions and capital inflows soften. This is especially the case as the post-Brexit environment remains quite volatile. As a play on this trend, we are tactically long EUR/GBP. However, we remain bullish sterling on a cyclical horizon as real rates should continue to normalize. Chart 9ABritish Pound
British Pound
British Pound
Chart 9BBritish Pound
British Pound
British Pound
Australian Dollar The Australian dollar is down 0.8% over the last month, as both a stronger dollar and lower iron ore prices exert downward pressure on the exchange rate. The biggest developments over the last few weeks in Australia were the CPI report and the RBA policy meeting. The Q3 print for CPI was 3%, the upper bound of the central bank’s target range, with the trimmed-mean and weighted-median figure coming in at 2.1%. This helped justify the RBA’s decision to abandon the 0.1% yield target on the April 2024 bond. That said, the central bank maintained its cash rate target of 0.1% until earliest 2023 and left the pace of asset purchases unchanged. The RBA trimmed its forecast for GDP for this year to 3% from 4% and said more than 50% of jobs were currently experiencing little to no wage growth. Wages grew just 1.7% in the year to June, far below the 3%-plus levels the RBA believes is necessary to keep inflation sustainably within the 2%-3% band and trigger a rate hike. Hence, the release of the Q3 wage price index, on November 17, will be closely watched. Any upward surprise can challenge the RBA’s measured projections. The bearish case for the Aussie is well known, with speculative positioning near a record short. That said, real yields in Australia have been improving and portfolio flows are accelerating, especially into the mining and energy sectors, which are benefiting from a terms-of-trade tailwind. This sets the stage for a coil-spring rebound in the Aussie. Meanwhile, the AUD is cheap, especially on a terms-of-trade basis. At the crosses, we are long AUD/NZD as a play on these trends. From a tactical standpoint, we are neutral the Aussie, but will buy outright at 70 cents. Chart 10AAustralian Dollar
Australian Dollar
Australian Dollar
Chart 10BAustralian Dollar
Australia Dollar
Australia Dollar
New Zealand Dollar The New Zealand dollar is up 1.3% over the last month. New Zealand’s economy is firing on all cylinders. CPI accelerated sharply from 3.3% to 4.9% in Q3, well above the RBNZ’s target band of 1%-3%, and behind only that of the US. The unemployment rate fell to 3.4% in Q3, far lower than the 3.9% forecasted by economists polled by Reuters. Wage growth was strong in the quarter with the private sector labor cost index registering a 0.7% lift. The seasonally adjusted employment number jumped 2.0% on the quarter, beating expectations of a 0.4% increase. The participation rate also rose to 71.2%, higher than the 70.6% forecast. Meanwhile, house prices continue to move higher, especially in Wellington. As a result, the RBNZ has been one of the most hawkish G10 central banks, hiking rates last month for the first time in seven years to 0.5%. Another 0.25% hike is likely at the November 24 meeting. Meanwhile, at 2.6%, New Zealand currently has the highest G10 10-year bond yield. This is bullish for the kiwi. The one caveat is that the Covid-19 situation in New Zealand continues to deteriorate, which could be a catalyst for a pause. Portfolio flows into New Zealand have turned negative in recent quarters. The equity market, which is quite expensive, has underperformed and the currency is overvalued according to our models, which has dampened the appeal of higher yields. We continue to believe the NZD will fare well cyclically, but hawkish expectations from the RBNZ are already priced in. This provides room for disappointment. Chart 11ANew Zealand Dollar
New Zealand Dollar
New Zealand Dollar
Chart 11BNew Zealand Dollar
New Zealand Dollar
New Zealand Dollar
Canadian Dollar The CAD is the best-performing currency this year, even though it is down 1% over the last month. The key driver of the CAD in recent weeks remains the outlook for monetary policy, and the path of energy prices. CPI inflation came in at 4.4% year-on-year for September, beating market expectations and among the highest across the G10. The CPI-trim hit 3.4% year-on-year. With all eight major components of the CPI rising year-over-year, upward price pressures are broad-based. The housing market also appears bubbly, all providing fertile ground for tighter monetary settings. At first blush, the October employment report was disappointing, with only 31,000 jobs added. However, employment in Canada is already above pre-pandemic levels and is likely to now settle towards trend growth of around 2%. This suggests a print of 30,000 - 40,000 jobs, in line with October’s release. The unemployment rate continues to drop, hitting 6.7%. Incoming data justified the Bank of Canada’s policy response. It delivered a hawkish surprise announcing an end to its quantitative easing program and shifting to the reinvestment phase whereby its holdings of Canadian government bonds will be held constant. It also brought forward the first rate hike to Q2 2022. The BoC will marginally diverge from the US Fed, which is expected to keep rates unchanged through most of next year. This will continue to boost real rates in Canada. Meanwhile, net purchases of Canadian securities continue to inflect higher, as the commodity sector benefits from a terms-of-trade boom. That said, from a tactical standpoint, speculators are marginally long the CAD. As such, our near-term view is cautious. We however doubt the CAD will significantly break below 78 cents, given burgeoning tailwinds. Chart 12ACanadian Dollar
Canadian Dollar
Canadian Dollar
Chart 12BCanadian Dollar
Canadian Dollar
Canadian Dollar
Swiss Franc The Swiss franc is up 1% against the dollar over the last month. EUR/CHF has also been very weak in recent trading sessions, constantly testing the 1.054 level. In our view, this has been much more due to euro weakness (see euro section above) than franc strength. The Swiss franc is trading near 11-month highs versus the euro. On the economic front, the labor market is improving and inflation in Switzerland is picking up. House prices have also risen quite robustly. This is lessening the need for the central back to maintain ultra-accommodative settings. That said, the Swiss National Bank is likely to lag the rest of the G10 in lifting rates from -0.75%, currently the lowest benchmark interest rate in the world. This suggests that market pricing of a 25 basis-point rate rise by the SNB by the end of 2022 is misplaced. Inflation would have to rise substantially more - above the SNB's target range of less than 2% - before any hike is possible. The SNB has also said it remained ready to intervene to weaken a highly valued Swiss franc. The ECB’s dovish stance is one reason why the SNB will be loath to let the currency appreciate. Our guess is that the 1.05 level provides a near-term line in the sand, which will prompt the SNB to intervene. We would be buyers of EUR/CHF below 1.05. Chart 13ASwiss Franc
Swiss Franc
Swiss Franc
Chart 13BSwiss Franc
Swiss Franc
Swiss Franc
Norwegian Krone The Norwegian krone has violently sold off in recent weeks, prompting our long Scandinavian basket to be stopped out. This has been mostly due to low liquidity and the high-beta nature of the krone. Norway’s central bank kept interest rates on hold at its latest meeting but reiterated it will likely hike its key rate by 25 basis points to 0.5% in December. The central bank noted that the economic recovery pushed activity back to pre-pandemic levels, while unemployment receded further. That said, underlying inflation still runs below the bank’s target. The recent surge in oil prices has provided strong support for Norway’s trade balance and terms of trade. Oil and gas make up around 18% of Norway’s GDP. This is encouraging portfolio flows and has provided underlying support for the NOK. That said, given that much of the Norges Bank’s hawkishness has likely been priced into the NOK, the rewards of going long the currency should start shifting to its carry. Chart 14ANorwegian Krone
Norwegian Krone
Norwegian Krone
Chart 14BNorwegian Krone
Norwegian Krone
Norwegian Krone
Swedish Krona The SEK was up 0.9% over the last month. Sweden never closed its economy, yet Covid-19 still had an impact. The good news is that this is mostly behind them. GDP expanded by 1.8% on the quarter in Q3, beating forecasts and the country recently ended all pandemic curbs. The labor market is recovering, and inflation is rising. CPIF inflation, on which the Riksbank sets its 2% target, is at 2.8%. Surging energy prices should turn out to be less of a problem for Sweden than the more coal-dependent countries in Europe, suggesting any increase in prices will be more genuine. The Riksbank will complete its planned balance-sheet expansion later this year and has committed to maintaining the size of its bond holdings through 2022. The central bank, one of the most dovish amongst the G10, is slated to keep its policy rate flat at least until 2024. This could change if inflationary pressures remain persistent. The big risk for Sweden is a slowdown in Europe and China. Supply chain bottlenecks are another issue. Several Swedish car and truck makers were forced to halt production in August due to semiconductor shortages. With the recent surge in the dollar, we were stopped out of our short EUR/SEK and USD/SEK positions for a profit. We will be looking to reinstate these trades from higher levels. Chart 15ASwedish Krona
Swedish Krona
Swedish Krona
Chart 15BSwedish Krona
Swedish Krona
Swedish Krona
Chester Ntonifor Foreign Exchange Strategist chestern@bcaresearch.com Kate Sun Research Analyst kate.sun@bcaresearch.com Trades & Forecasts Strategic View Cyclical Holdings (6-18 months) Tactical Holdings (0-6 months) Limit Orders Forecast Summary
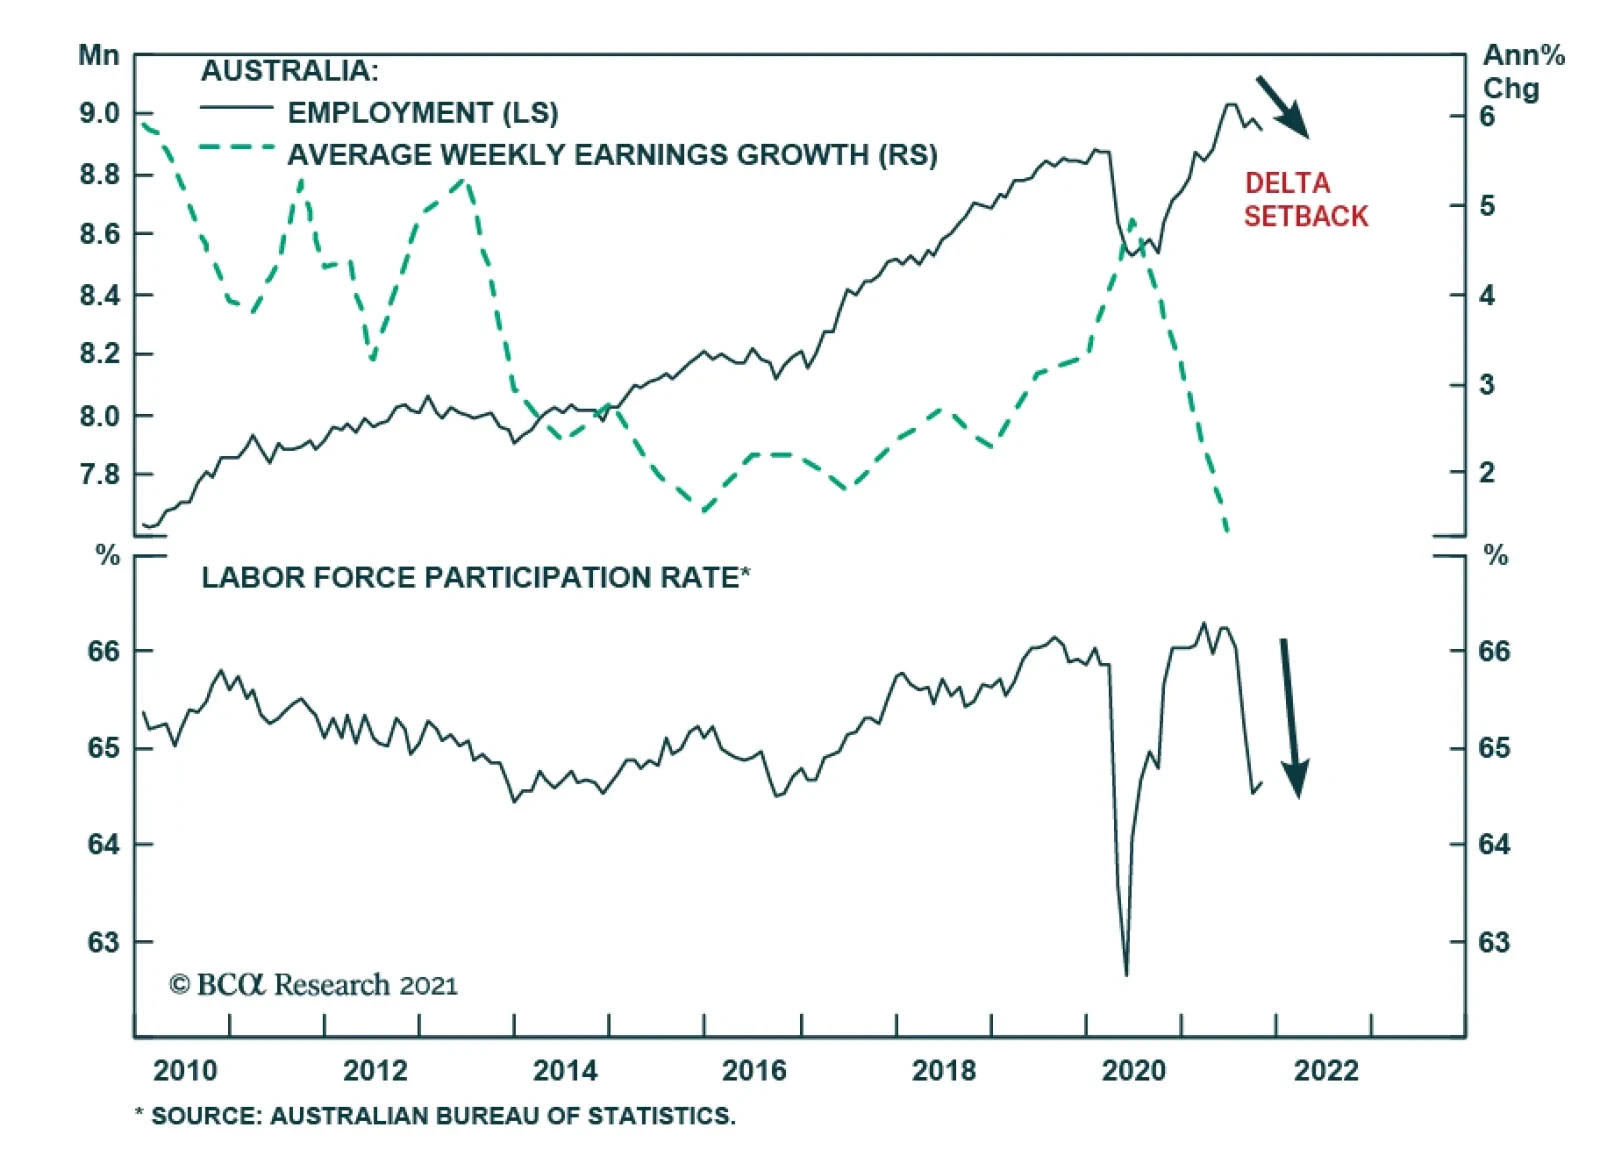
Rising inflationary pressures are seeping into Aussie inflation expectations which according to the Melbourne Institute reached 4.6% in November. Nevertheless, the RBA pushed back against market rate hike expectations at last week’s meeting. Instead, it…
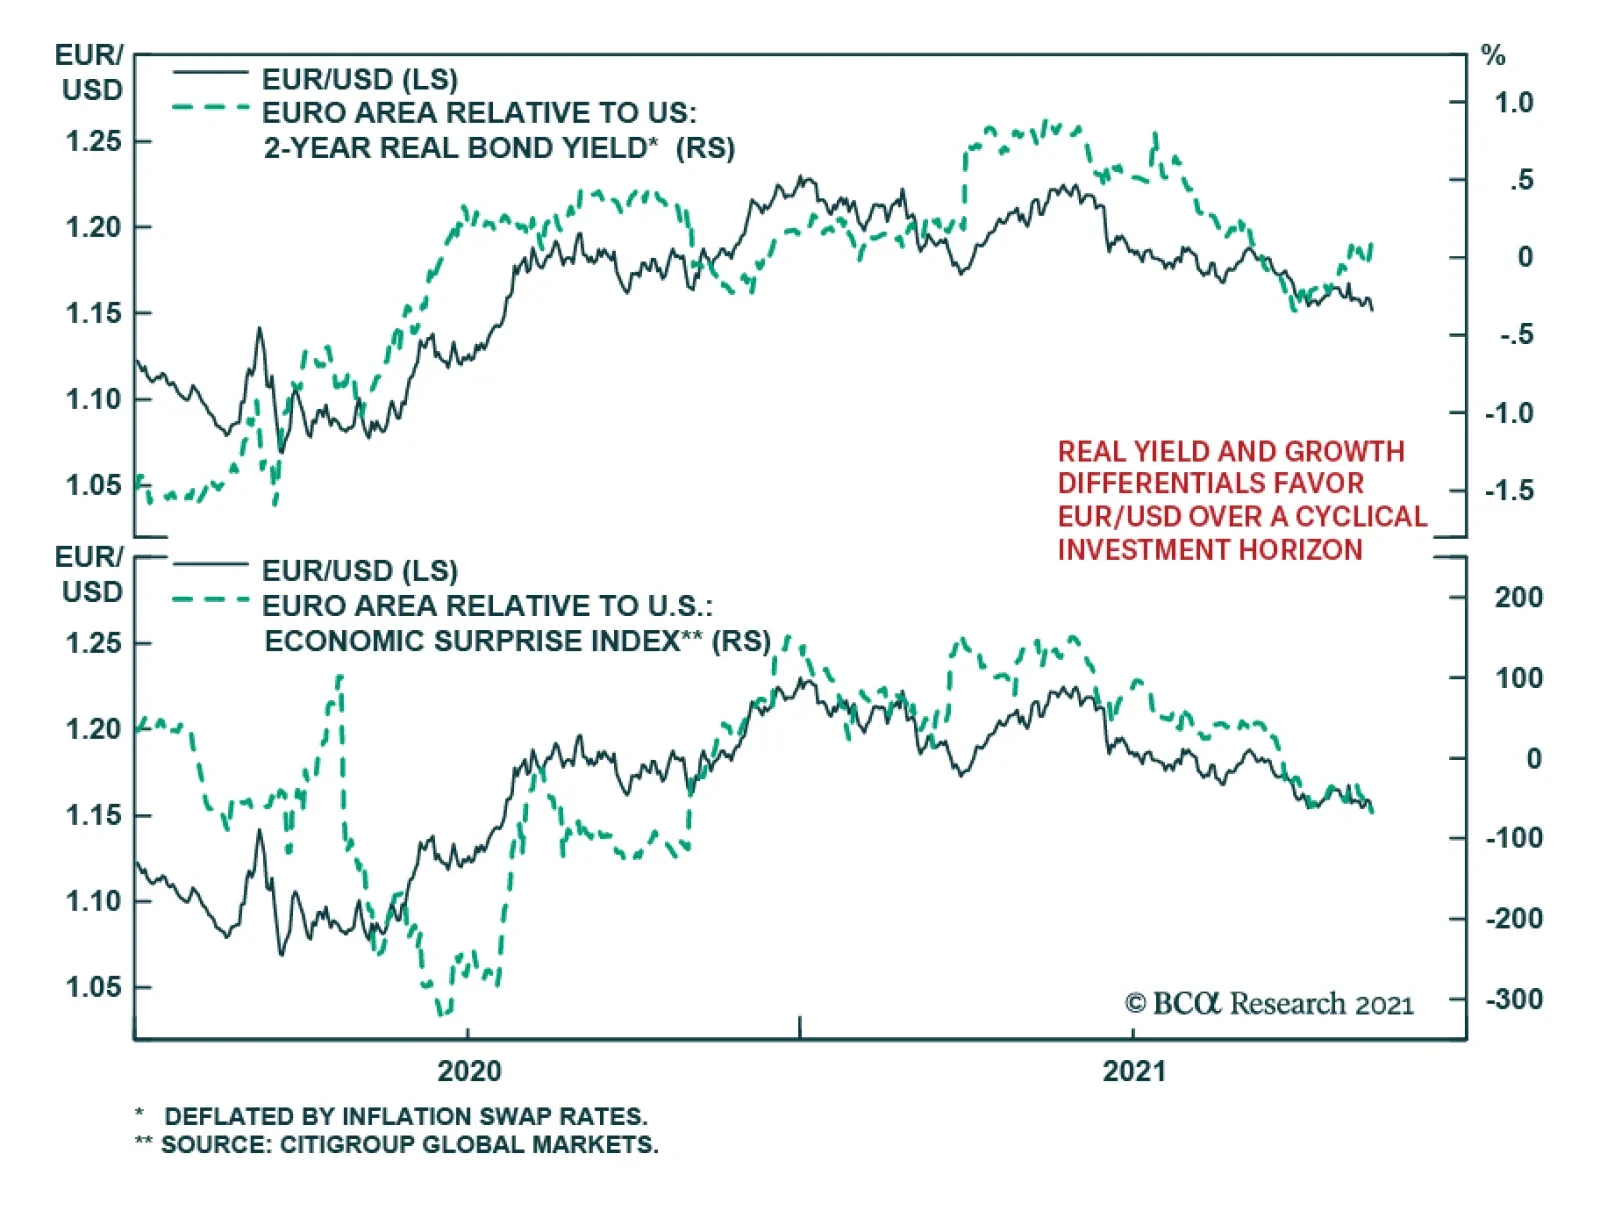
EUR/USD continued to weaken on Thursday after collapsing 0.57% to a new 2021 low in the previous day. Notably, the cross breached the 1.15 technical resistance level which raises the risk that it will continue to fall over the near term. Our foreign…
Highlights So far, both the demand and supply side of the Philippine economy have been rather weak; yet there are signs that growth is set to revive. Fiscal expenditures have bottomed. Bank lending is also reviving. Acceleration in broad money supply is usually a good omen for stronger economic activity (Chart 1). Being a defensive market within EM, Philippine stocks will benefit in an impending period of weak EM stock prices. Upgrade this bourse from underweight to neutral in an EM equity portfolio. Philippine sovereign credit is also defensive in nature relative to its EM peers. Stay overweight in an EM portfolio. A deteriorating external accounts outlook makes the peso vulnerable. The central bank will also likely tolerate a weaker currency. Stay short the peso versus the US dollar. A vulnerable peso renders Philippine domestic bonds unappealing. Stay neutral in an EM domestic bonds portfolio. Feature The steep underperformance of Philippine stocks over the past several years is due for a pause. While this bourse may not see a sustainable rally in absolute terms, a period of flattish relative performance vis-à-vis the EM benchmark is likely. We recommend upgrading this market from underweight to neutral within an EM equity portfolio (Chart 2). Chart 1Accelerating Fiscal Spending And Credit Is A Good Omen For Economic Growth
Accelerating Fiscal Spending And Credit Is A Good Omen For Economic Growth
Accelerating Fiscal Spending And Credit Is A Good Omen For Economic Growth
Chart 2Philippine Stocks' Underperformance Is Set For A Breather But It's A Risk In Absolute Terms
Philippine Stocks' Underperformance Is Set For A Breather But It's A Risk In Absolute Terms
Philippine Stocks' Underperformance Is Set For A Breather But It's A Risk In Absolute Terms
One reason why Philippine stocks are unlikely to rally in absolute US dollar terms is a vulnerable peso. Philippine external accounts will likely deteriorate further, and therefore the peso is set to continue to trade on the weaker side. Currency investors should stick with our recommended short the peso versus US dollar trade for now. Philippine domestic bonds also remain unattractive to foreign investors. Local bond yields are not high enough relative to those of safe-haven bonds (US treasuries). As a result, the country is witnessing net debt portfolio outflows. The nation’s sovereign USD bonds, however, will likely outperform the EM benchmark going forward and merit an overweight stance in an EM sovereign bond portfolio. A Feeble Economy … The Philippine economy, so far, continues to be soft. Demand has been sluggish: manufacturing sales remain well below pre-pandemic levels – both in value and volume terms. So are car sales (Chart 3). On the supply side, production volume gives a similar message: they are still below pre-pandemic levels. Manufacturing PMI is barely in the expansion territory (Chart 4). In other words, there is palpable weakness in both the demand and supply side of the domestic economy. Chart 3The Demand Side Of The Economy Has Been Weak...
The Demand Side Of The Economy Has Been Weak...
The Demand Side Of The Economy Has Been Weak...
Chart 4...So Has Been The Supply Side
...So Has Been The Supply Side
...So Has Been The Supply Side
The soft domestic demand is also evident from the import cargo throughput in the country’s ports. While exports cargo has risen well above pre-pandemic levels, import cargo has not (Chart 5). Part of the reason behind the lingering frailty is muted fiscal spending. Over the past 12 months, the latter has decelerated measurably. To be sure, Philippine fiscal outlays during the entire pandemic period have not been extraordinary; and yet this has slowed further (Chart 6, top panel). Chart 5Weak Domestic Demand Is Also Evident In Still Subdued Imports
Weak Domestic Demand Is Also Evident In Still Subdued Imports
Weak Domestic Demand Is Also Evident In Still Subdued Imports
Chart 6Govt Spending Had Decelerated, Even As QE Proceeds Remained Unspent
Govt Spending Had Decelerated, Even As QE Proceeds Remained Unspent
Govt Spending Had Decelerated, Even As QE Proceeds Remained Unspent
The sharp widening seen in the country’s fiscal deficits had more to do with dwindling fiscal revenues, rather than strong spending. In fact, central bank data shows that most of its government bond purchase proceeds (‘QE’ proceeds) are unspent – still sitting in the government’s accounts with the central bank, i.e., they have not been channeled into the economy (Chart 6, bottom panel). … But Plenty Of Dry Powder Going forward, however, that picture is likely to change. The country is heading into general elections in May 2022. Lawmakers therefore have an incentive to spend the amount currently lying in the central bank. The amelioration in the number of new Covid-19 cases has enabled a re-opening of the economy, which will make stimulus spending easier. In addition, the federal budget for 2022 passed last month1 includes an 11.5% hike in government outlays. With core CPI at 3%, this translates into a robust 8.5% government expenditure growth rate in real terms. Chart 7Credit Is Finally Reviving
Credit Is Finally Reviving
Credit Is Finally Reviving
Beyond fiscal spending, the country’s bank credit might also gain some traction: During the pandemic, banks shunned loan disbursements. Lately, however, there are signs that credit is reviving (Chart 7). Real borrowing costs (prime lending rates deflated by core CPI) from banks are low, close to only 1%. Such low cost of credit should encourage new borrowing at a time when economic activity is resuming. On their part, banks have made sizeable provisions against the rising NPLs during the pandemic, and therefore have already taken a substantial hit on their books (Chart 8, top panel). Relatively cleaner balance sheets should encourage banks to lend. Banks have also been able to materially raise their operating efficiency in the past couple of years (by way of rising net interest income). As a result, operating margins have improved measurably. This has helped absorb part of the NPL-related losses and has somewhat cushioned the blow to banks’ bottom line (Chart 8, bottom panel). Relatively better margins (than otherwise would have been the case) should prompt banks to take relatively higher risks, i.e., expand their loan books going forward. Should fiscal authorities ramp up their spending, and should banks also begin to lend again, the activity that has resumed following a lessening of Covid-19 cases will get a fillip. Higher fiscal spending and bank credit will lift money supply in the economy, usually a good omen for stronger economic activity (see Chart 1 on page 1). Incidentally, inflation in the Philippines is under control. The relatively high headline inflation print is not indicative of any genuine inflationary pressures, and is due mostly to food prices, which account for 38% of the CPI basket. Core and trimmed mean CPI are much lower at around 3% (Chart 9, top panel). Chart 8Banks Have Cleaner Books Now As They Made Sizable NPL Provisions
Banks Have Cleaner Books Now As They Made Sizable NPL Provisions
Banks Have Cleaner Books Now As They Made Sizable NPL Provisions
Chart 9There Are No Genuine Inflationary Pressures In The Philippines
There Are No Genuine Inflationary Pressures In The Philippines
There Are No Genuine Inflationary Pressures In The Philippines
The central bank expects the headline inflation rate to decelerate to within its target band of 2% to 4% by the end of this year and settle close to the midpoint in 2022 and 2023. At the same time, Philippine nominal wages are barely growing (Chart 9, bottom panel). This implies that businesses have little margin pressures to raise their selling prices. Genuine inflationary pressures, therefore, are unlikely to become acute in the foreseeable future. That, in turn, will help keep fiscal and monetary policies accommodative. Domestic Bond Yields Will Stay Flattish With the resumption of economic activity, will come higher fiscal revenues. That should help the Philippine fiscal deficit to narrow. Narrower fiscal deficit in the Philippines is usually bond bullish (i.e., bond yields go down). Yet, lower bond yields will have negative implications for Philippine capital inflows. Foreign investors are the marginal buyers of Philippine bonds. And their appetite for the latter depends on how much extra yield the Philippines offers over safe-haven bonds (US treasuries). Chart 10 shows that whenever the yield differential narrows too much (to around 200 basis points), net debt portfolio inflows into the Philippines typically stop, and often turn into outflows. This is what is happening now. On the other end, when the differential widens enough (about 400 - 500 basis points), those outflows turn into inflows again. Chart 10The Philippines Need To Offer Relatively Higher Yields To Attract Capital Inflows
The Philippines Need To Offer Relatively Higher Yields To Attract Capital Inflows
The Philippines Need To Offer Relatively Higher Yields To Attract Capital Inflows
Given that we expect US long-term bond yields to rise, if Philippine bond yields do not rise at an even faster pace, its yield differential would stay low. Thus, the country will be hard-pressed to see any debt portfolio inflows in the near future. The absence of foreign buyers, in turn, would put a floor under bond yields. This will counterbalance any yield-suppressing forces coming from improving fiscal deficits. Thus, overall, the country will likely see flattish yields over the next six to nine months. And The Peso, Shaky Chart 11Debt Dominates The Philippines' Capital Inflows
Debt Dominates The Philippines' Capital Inflows
Debt Dominates The Philippines' Capital Inflows
Low bond yields and short-term interest rates will have negative ramifications for the currency: It’s the foreign debt flows, rather than equity investments, that dominate Philippine capital inflows. This is true for all categories of inflows: FDI, portfolio and other investments (Chart 11). The fact that debt investors are the dominant group among foreign investors has some implications. Debt investors do not like lower interest rates while equity investors do. As such, debt inflows into the Philippines diminish when the interest rates (bond yields) are relatively low. Muted foreign capital inflows, in turn, are bearish for the peso. The country’s current account outlook is also not rosy. The trade deficit has widened significantly, and the robust current account surplus has given way to deficits – in line with our forecast in our previous report. With domestic demand reviving (government spending, household consumption and business investment), imports will now likely grow faster than exports, and therefore, will weigh down on both trade and current account deficits further in the months ahead. Notably, the country’s overseas workers’ remittances have also rolled over in recent months. All these will be a headwind for the peso (Chart 12). As noted, the central bank does not expect inflation to overshoot their target in the next two years. They have also been a net buyer of US dollars year-to-date, i.e., they have been leaning against their currency. This implies that they would not mind a weaker currency – especially when the economy is still not strong, and inflation is not a threat. Incidentally, the peso is also about 7% expensive vis-à-vis the US dollar in purchasing power terms (Chart 13). Chart 12Current Account Balance Will Deteriorate As Rising Domestic Demand Fuels Imports
Current Account Balance Will Deteriorate As Rising Domestic Demand Fuels Imports
Current Account Balance Will Deteriorate As Rising Domestic Demand Fuels Imports
Chart 13The Peso Is Somewhat Expensive In PPP Terms And Is Vulnerable To A Downside
The Peso Is Somewhat Expensive In PPP terms And Is Vulnerable To A Downside
The Peso Is Somewhat Expensive In PPP terms And Is Vulnerable To A Downside
Equity Underperformance Is Late An improving fiscal balance is usually bullish news for Philippine stock multiples. The connection is via bond yields/interest rates. An improving fiscal balance leads to lower bond yields, which, in turn, boost this market which is dominated by interest rate sensitive sectors (real estate, financials/banks and utilities make up 50% of market cap). Chart 14Weak EM Stock Prices Herald Outperformance by The Defensive Philippine Markets
Weak EM Stock Prices Herald Outperformance by The Defensive Philippine Markets
Weak EM Stock Prices Herald Outperformance by The Defensive Philippine Markets
Yet, in this cycle, an improving fiscal balance may not herald a material fall in the country’s bond yields due to net debt portfolio outflows (as explained above). Thus, Philippine stocks would miss the tailwind from rising multiples. A dim outlook for the peso also calls for caution on the part of absolute-return foreign investors. That said, the resumption of economic activity will lead to rising earnings, and that should provide some tailwinds for this market. Moreover, as a defensive market within EM, Philippine stocks usually outperform the overall EM benchmark during periods of weak EM stock prices. Incidentally, we have a negative outlook on EM stock prices over the coming several months (Chart 14). Weighing all the pros and cons, we infer that Philippine stocks’ relative performance will likely be rangebound over the next six to nine months. Sovereign Credit Will Outperform Chart 15The Philippines' Sovereign Credit Outperforms During EM Risk-Off Periods, Stay Overweight
The Philippines' Sovereign Credit Outperforms During EM Risk-Off Periods, Stay Overweight
The Philippines' Sovereign Credit Outperforms During EM Risk-Off Periods, Stay Overweight
A negative outlook on overall EM sovereign credit warrants overweighting Philippine sovereign credit relative to its EM brethren. The reason is the defensive nature of the Philippine sovereign bond market – just like its equity market. During periods of stress, Philippine sovereign spreads widen much less than its EM peers. Chart 15 shows that in each of the last three risk-off periods (2008-09, 2015, 2020), Philippine sovereign credit massively outperformed the EM benchmark. The basis for the defensive features of Philippine sovereign credit is that the nation’s external public debt is quite low at 18% of GDP, down from 25% ten years back. Of this, foreign bonds outstanding are 10% of GDP, down from 12% ten years back (the rest being loans and contingent liabilities). Such low debt means the defensive nature of this market is unlikely to change soon. Hence, it makes sense to overweight Philippine sovereign bonds in view of impending sovereign credit spreads widening in the broader EM universe. Investment Conclusions Stocks: The Philippine economy will likely see some traction in the months ahead as fiscal spending rises and bank credit revives. This bourse’s relative performance will also benefit in an impending risk-off period in emerging markets. Asset allocators should upgrade this market from underweight to neutral in an EM equity portfolio. Our underweight call on this market vis-à-vis an EM equity portfolio has yielded a gain of 16% since we recommended it in October 2018. The Peso: The peso remains vulnerable in the face of deteriorating external accounts. Currency investors should stay with our recommended long USD/ short PHP trade for now. This call has yielded 2.1% so far since our recommendation on March 18, 2021. Chart 16Philippine Domestic Bonds Warrants A Neutral Allocation In An EM Portfolio
Philippine Domestic Bonds Warrants A Neutral Allocation In An EM Portfolio
Philippine Domestic Bonds Warrants A Neutral Allocation In An EM Portfolio
Domestic Bonds: Local currency bond yields in the Philippines are likely to stay flattish despite the slated improvements in the country’s fiscal balance. The peso is also set to stay weak. These call for a cautious stance on Philippine domestic bonds. Yet, they tend to do well relative to their EM counterparts during periods of EM stress – as they did in 2015 and in 2020 (Chart 16). Since another such period is around the corner, we recommend that investors maintain a neutral allocation of Philippine local currency bonds in an EM portfolio. Sovereign Bonds: Philippine sovereign bonds are set to outperform their EM counterparts. Asset allocators should stay overweight the Philippines in a dedicated EM sovereign bonds portfolio. Rajeeb Pramanik Senior EM Strategist rajeeb.pramanik@bcaresearch.com Footnotes 1 Passed in the third and final reading in the lower house and sent to the Senate, the upper house.
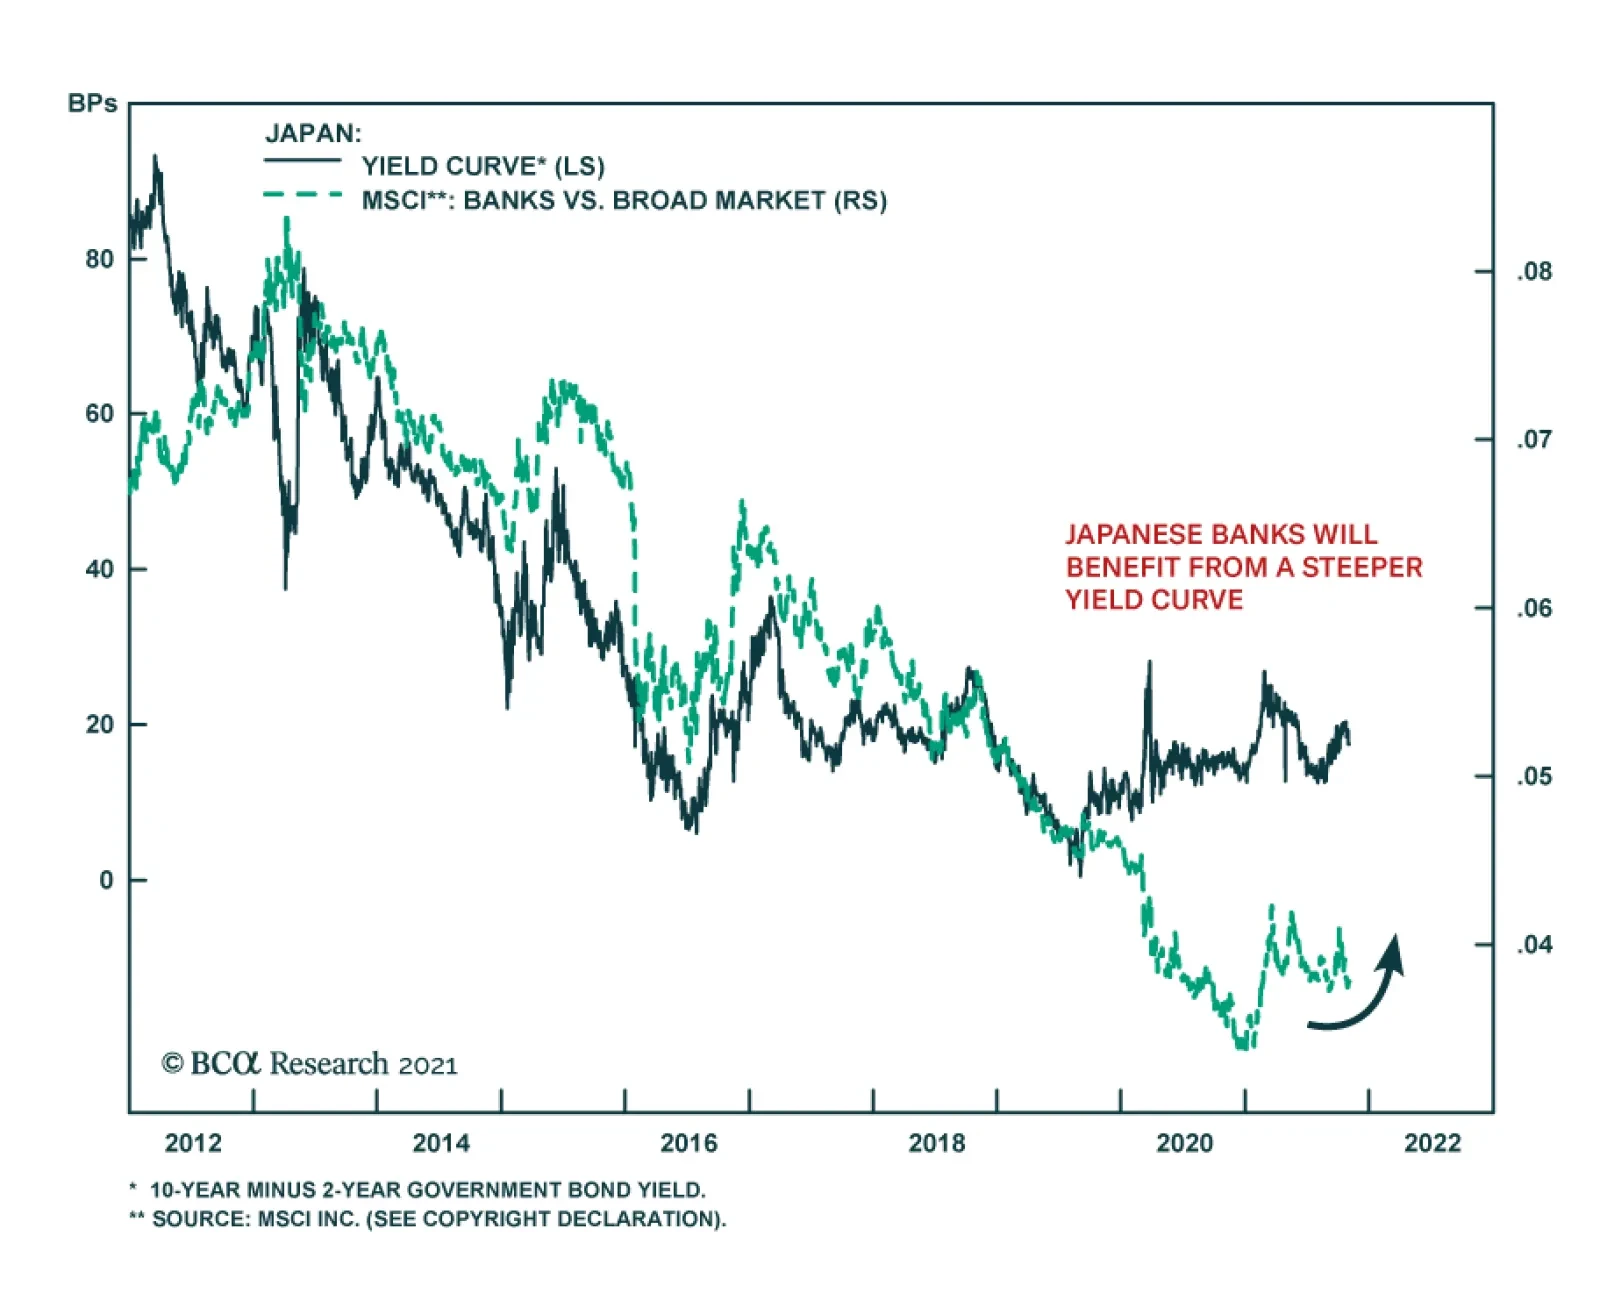
BCA Research’s Geopolitical Strategy service concludes that there is a tactical opportunity in Japanese equities. Japan’s ruling Liberal Democratic Party retained its single-party majority in the Diet in the October 31 election, putting Prime Minister…