Currencies

Highlights Geopolitical risk is rising once again after a big drop-off in risk during the pandemic and snapback. The Biden administration faces three critical foreign policy tests: China/Taiwan, Russia/Ukraine, and Israel/Iran. Russia could stage a military incursion into Ukraine that would cause a risk-off event. However, global markets would get over it relatively quickly since a total invasion of all Ukraine is unlikely. Iran is nearing the “breakout” threshold of uranium enrichment which will prompt more Israeli demonstrations of its red line against nuclear weaponization. Iran will retaliate. So far our view is on track that tensions will escalate prior to the resolution of a US-Iran deal by August. Taiwan is the most market relevant of all geopolitical risks – but the South China Sea is another scene of US-China saber-rattling. A crisis here is most important if connected to Taiwan. Go long CAD-RUB and CHF-GBP. Feature Chart 1Traffic In The World’s Most Dire Straits
Jaw-Jaw Or War-War?
Jaw-Jaw Or War-War?
British Prime Minister Harold Macmillan, quoting Sir Winston Churchill, once said, “Jaw-jaw is better than war-war.”1 President Joe Biden would undoubtedly prefer jaw-jaw as he faces three imminent foreign policy tests that raise tail-risks of war: Chinese military intimidation of Taiwan, a Russian military build-up on the Ukrainian border, and Iranian acceleration of its nuclear program. All of these areas are heating up simultaneously and a crisis incident could easily occur, causing a pullback in bond yields and equity markets. One way of illustrating the seriousness of these conflicts is to look at the volume of global trade that goes through the relevant geographic chokepoints: the Taiwan Strait, the Strait of Malacca, the Strait of Hormuz, and the Bosphorus Strait (Chart 1). Oil and petroleum products serve as a proxy for overall traffic. The recent, short-lived blockage of the Suez Canal provides an inkling of the magnitude of disruption that is possible if conflict erupts in one of these global bottlenecks. In this report we review recent developments in Biden’s foreign policy tests. Our views are mostly on track. Investors should prepare tactically for more geopolitical risk to be priced into global financial markets, motivating safe-haven flows and potentially a general equity pullback. Cyclically the bull market will continue, barring the worst-case scenarios. Biden’s Three Foreign Policy Tests Biden’s three foreign policy tests are all intensifying as we go to press: China/Taiwan: China is continuing a high-intensity pace of “combat drills” and live-fire drills around the island of Taiwan.2 The US is sending a diplomatic delegation to Taiwan against Beijing’s wishes and is set to deliver a relatively large arms sale to the island. Yet Washington has sent John Kerry, its “climate czar,” to Beijing to set up a bilateral summit between Presidents Biden and Xi Jinping for Earth Day, in a bid to find common ground. Biden’s overarching review of US China policy is due sometime in May. Russia/Ukraine: Russia has amassed more than 85,000 troops on its border with Ukraine and in Crimea, the largest build-up since it invaded Ukraine in 2014-15. Russia has withdrawn its ambassador to Washington and warned that it will retaliate if the US imposes any new sanctions. The US is doing just that, with new sanctions leveled in response to Russian cyberattacks and election interference, including a block on sales of Russian ruble-denominated sovereign bonds from June. Hence Russian retaliation is looming. Israel/Iran: Shortly after the March 23 election, Israel sabotaged the underground Natanz Fuel Enrichment Plant in Iran, prompting the Iranians to declare that they will retaliate on Israeli soil. They also claim they will now enrich uranium to a 60% level, which pushes them close to the 90%-plus levels needed to make a nuclear device. American and Israeli officials had previously signaled that Iran would reach “breakout” levels of weapons-grade uranium between April and August. Negotiations are underway but the process will be beset by attacks. We have written extensively on the Taiwan dynamic this year as it is the most relevant for global investors. In this report we will update the Russian and Iranian situations first and then proceed to China. Bottom Line: Geopolitical risk is back after a reprieve during the pandemic. The new US administration faces three serious foreign policy tests at once. Financial markets have mostly ignored the rise in tensions but we expect safe-haven assets to catch a bid in the near term. However, we have not yet altered our bullish cyclical view. So far we are still in the realm of “jaw-jaw” rather than “war-war,” as we explain in the rest of this report. Stay Short Russia And EM Europe The return of the Democratic Party to power in Washington has led to an immediate increase in US-Russian tensions. The Biden administration is eschewing a diplomatic reset and instead pursuing great power competition. The US is increasing its arms sales and NATO military drills with Ukraine. It is imposing sanctions over Russian cyberattacks and election interference, including taking a long-awaited step against the purchase of ruble bonds. Washington could also force Germany to cancel the Nord Stream II pipeline. However, there are also mitigating signs. President Biden has offered to hold a bilateral summit with President Vladimir Putin in a third country and the two may meet at his Earth Day summit. The US Navy also called back the USS Donald Cook and USS Roosevelt destroyers from going into the Black Sea, after Moscow warned that any American warships in that sea would be in danger, especially if they go near Crimea. Washington’s new volley of sanctions are not truly tantamount to Russian interference in American elections and they do not include new measures on Nord Stream II. An American move to insist that Germany cancel Nord Stream before construction ends would provoke Russia to retaliate. The purpose of Nord Stream is to bypass Ukraine and cement direct economic ties between Russia and Germany. Germany’s government continues to support the project despite Russia’s build-up on the border with Ukraine and suppression of political dissidents. If the US vetoes the pipeline then it is denying Russia access to legitimate trade and restricting Russia’s export options to the Ukrainian route. If the US simultaneously increases military cooperation with Ukraine then it is implicitly trying to control Russia’s energy access to Europe. Russia will likely retaliate by punishing Ukraine. Russia could take aggressive action in Ukraine or elsewhere regardless of what the US does on Nord Stream or in its Ukraine outreach. Russia is struggling with a weak domestic economy and social unrest. Moscow has a record of foreign adventurism when popular support wanes. Moreover legislative elections loom in September. Thus Russia may have an independent reason to stir up conflict in Ukraine, at least for the next half year, that cannot be deterred. Judging by capabilities, Russia has deployed enough troops to stage a military incursion into the breakaway Donbass region of Ukraine. The Russian army build-up on the border is the largest since 2014 – large enough to put most of Russian-speaking Ukraine at risk. A full-scale Russian invasion of all of Ukraine is unlikely but not impossible. It would be extremely costly both in blood and treasure – not only in occupying a hostile Ukraine but also in unifying the West against Russia, the opposite of what Moscow is trying to accomplish (Chart 2). Moscow will want to avoid this outcome unless the US shuts down Nord Stream or tries to bring Ukraine into NATO. Chart 2Russia’s Constraints Over Ukraine
Jaw-Jaw Or War-War?
Jaw-Jaw Or War-War?
From the market’s point of view, intensified fighting in Ukraine between the government and Russian-backed rebels is status quo. This is inevitable and will not have a major impact on global equities. The invasion of Crimea in 2014 led to a maximum 2% drawdown in the S&P 500. It was the shooting down of Malaysian Airline 17, not Russia’s invasion of Ukraine, that shook up financial markets in 2014. Global equities fell by 2.7%, Eurostoxx 500 by 6.2% and Russian equities by 10.7%. Note that the Russian military did ultimately participate in the fighting in 2014-15, it was not only Russian-backed separatists, so global financial markets can stomach that kind of conflict fairly well as long as it is limited to Ukraine, especially disputed regions, and as long as the US and NATO do not get involved. They are disinclined to fight for Ukraine, leaving it vulnerable. A larger flight to safety would occur if Russia pursued the total conquest of all of Ukraine. This is small probability but high impact. It would cause a major global risk-off because it would raise the risk of a larger war on the continent for the first time since World War II. Russia is obsessed with Ukraine from the point of view of grand strategy and national security and will take at least some military action if it deems it necessary. Investors should be prepared for escalation – though neither Washington nor Moscow has yet taken a fatal step. It is important to watch for any aggressive Ukrainian actions but Ukraine is not the main driver of action. The current situation is reminiscent of that in the Republic of Georgia in 2008, when Russia provoked President Mikhail Saakashvili into taking action against separatists that Russia then used as a pretext for intervening and breaking away Abkhazia and South Ossetia. While Ukrainian President Volodymyr Zelenskiy could be baited into a conflict, it is also true that fear of getting baited could result in hesitation that allows Russia to seize the initiative, as occurred in Ukraine in 2014. So for the Ukrainians it is “damned if you do, damned if you don’t.” Russia’s actions will largely depend on its own interests. So far Russian equities have lagged other emerging market equities and the commodity rally, which may partly reflect elevated political and geopolitical risk (Chart 3). The trend for Russian equities can easily get worse from here. Given Russia’s interest in conflict with the West ahead of the September elections, Russian-Ukrainian tensions could persist for most of this year. A major military campaign becomes more probable after mid-May when the weather improves. Russian currency and assets will remain under pressure. We recommend going long the Canadian dollar relative to the Russian ruble. The ruble will underperform commodity currencies as a whole, including the Mexican peso, if Russia intervenes militarily, judging by the Crimea conflict in 2014 (Chart 4). Meanwhile Canadian and Mexican currencies should benefit from the fact that the US economy is hyper-stimulated and rapidly vaccinating. Chart 3Russia Lagged Commodity Rally
Russia Lagged Commodity Rally
Russia Lagged Commodity Rally
Chart 4Favor Loonie And Peso Over Ruble
Favor Loonie And Peso Over Ruble
Favor Loonie And Peso Over Ruble
Chart 5Long DM Europe / Short EM Europe
Long DM Europe / Short EM Europe
Long DM Europe / Short EM Europe
We continue to overweight developed Europe and underweight emerging Europe (Chart 5). Poland, Hungary, the Czech Republic, Romania, and the Baltic states will see a risk premium due to current tensions. The Czech Republic faces considerable political uncertainty surrounding its legislative election in October, an opportunity for Russia to interfere or for anti-establishment (albeit pro-EU) parties to rise to power. What would it take for Biden and Putin to de-escalate? The US and NATO could diminish Ukraine relations, downgrade democracy promotion and psychological counter-warfare, and allow Nord Stream to be completed. Russia could reduce its troop presence on the border and lend a helping hand on the Iranian nuclear deal and Afghanistan withdrawal. This is a risk to our view. Bottom Line: Russia and emerging European markets are some of the few truly cheap markets in the emerging market equity universe (Table 1). Yet the current geopolitical context looks to keep them cheap. For now investors should be prepared for the West’s conflict with Russia to escalate in a major way. At minimum we need to know whether the US will halt Nord Stream II’s construction before taking a more bullish view on EM Europe. Table 1Geopolitical Risk Helps Keep Russia And EM Europe Cheap
Jaw-Jaw Or War-War?
Jaw-Jaw Or War-War?
The worst-case scenario of a full-blown Russian conquest of Ukraine has a small probability but cannot be ruled out. Iran Negotiations: First Explosions, Then A Nuclear Deal Israel has not put together a government after its March 23 election, although Prime Minister Benjamin Netanyahu has the opportunity to lead a government again which means no change in national policy so far. Moreover the Israeli public and political establishment are unified in their opposition to Iran’s regional and nuclear ambitions. Immediately after the Iranians inaugurated new centrifuges at the Natanz nuclear facility, on April 11, the Israelis allegedly sabotaged the facility underground facility in an attack that was supposedly not limited to cyber means and that deactivated a range of centrifuges. An Iranian scientist fell into a crater and hurt himself. The Iranians have vowed retaliation on Israeli soil. More fundamentally their politics are shifting in a hardline direction, to be confirmed with the election of a hawkish president in June, which will exacerbate the mutual antagonism. This power transition is a major reason we have identified the inauguration in August as a key deadline for the US to rejoin the 2015 nuclear deal (the Joint Comprehensive Plan of Action). If the Biden administration cannot get it done by that time then a much more dangerous, multi-year negotiation will get underway. The Israeli attack has not stopped negotiations in the short term, however. The second round of talks begins in Vienna as we go to press. The US has also confirmed it will withdraw from Afghanistan on September 11, which says to Iran that Biden is determined to reduce the US’s strategic footprint in the region, reinforcing the US desire for a deal. The Israelis will continue to underscore their red line against the Iranian nuclear and missile programs in the coming months through clandestine attacks. However, they were not able to stop the US from signing a nuclear deal with Iran in 2015 and they are not likely to stop the US today. They are still bound by a fundamental constraint. Israel needs to maintain its alliance with the United States, which ensures its long-term security against both Iran and the Middle East’s general instability (Chart 6). The Iranians will retaliate against Israel, making it likely that this summer will feature tit-for-tat attacks. These could include critical infrastructure. Iran may also continue its campaign against enemies in Iraq and Saudi Arabia, thus triggering unplanned oil outages and pushing up the oil price. A glance at Israeli, Saudi Arabian, and UAE stock markets suggests that global investors have largely ignored the geopolitical risks so far but may be starting to respond to the likely escalation in conflict prior to any US-Iran deal (Chart 7). Chart 6Israel’s Constraints Over Iran
Jaw-Jaw Or War-War?
Jaw-Jaw Or War-War?
The US, Germany, France, Russia, and China are all officially on board with getting the Iranians back into compliance with the deal. A return to compliance would need to be phased with US sanctions relief. The Iranians demand that the US ease sanctions first, since it was the US that unilaterally walked away from the deal and re-imposed sanctions in 2018. Chart 7Saudi, UAE, Israeli Stocks Signal Danger
Saudi, UAE, Israeli Stocks Signal Danger
Saudi, UAE, Israeli Stocks Signal Danger
Ultimately Biden is capable of making the first move since the American public shows very little concern about Iran. Biden himself is acting on behalf of a strong consensus in Washington that an Iranian deal is necessary to stabilize the region and enable the US to devote more strategic attention to Asia Pacific. Will Russia and China support the Iranian deal, given their simultaneous conflicts with the United States? As long as the US and Iran are satisfied with returning to the existing deal – which begins to expire in 2025 – there is little need for Russia or China to do anything. However, if Washington wants a better deal, then it will have to make major concessions to Moscow and Beijing. A new and better deal would require years to negotiate. Chart 8Russo-Chinese Cooperation Grows
Jaw-Jaw Or War-War?
Jaw-Jaw Or War-War?
Russia and China supported the original nuclear deal because they saw an opportunity to limit the proliferation of nuclear weapons, which dilutes their own power. A Middle Eastern nuclear arms race is not in their interest. Iran is also a useful strategic partner for Russia and China in the Middle East and they are not averse to seeing Iran’s economy grow stronger in order to perpetuate its regime. They are wagering that liberalization of the Iranian economy will not result in liberalization of its politics – it certainly did not in the case of Russia or China – and therefore they will still have an ally but it will be more economically sound and influential. The Russo-Chinese strategic partnership has grown dramatically over the past decade. Both countries share an interest in undermining US global leadership and stoking American internal divisions. Both share an interest in reducing the US military presence near their borders, particularly in strategic territories and seas that they consider essential to their security and political legitimacy. Russia increasingly depends on Chinese demand for its exports and Chinese investment for developing its resources. Neither country trusts the other’s currency for trade but both have a shared interest in diversifying away from the US dollar (Chart 8). Chart 9China Offers Helping Hand On Iran?
China Offers Helping Hand On Iran?
China Offers Helping Hand On Iran?
In cooperating with the US on Iran, Russia and China will expect the US to respect their demands on strategic areas much closer to their core interests. If the Biden administration continues to upgrade its trade and defense relations with Ukraine and Taiwan then Moscow and Beijing will push back aggressively and could at that point prevent or undermine any deal with Iran. China is at least officially enforce sanctions on Iran (Chart 9). Its strategic partnership with Iran is constantly in a state of negotiation – until the US clarifies its sanctions regime. Clearly China hopes to extract concessions from the Americans for cooperation on nuclear threats. This is also the case with North Korea, where a missile crisis would be useful for China’s purposes in creating the need for Chinese arbitration. China sees a chance to persuade Biden to remove restrictions imposed by President Trump. If the Biden administration’s hawkishness on China is confirmed in the coming months, then China’s willingness to cooperate will presumably change. Bottom Line: Israel is underscoring its red lines against Iranian nuclear weaponization and this will cause an increase in conflict this spring and summer. But it is not yet preventing the US and Iran from renegotiating the 2015 nuclear deal. We still expect Biden to agree to a deal by August. Taiwan And The South China Sea For global financial markets the most important test facing Biden lies in the US-China relationship and tensions over the Taiwan Strait. We will not rehash our recent research and arguments on this issue. Suffice it to say that we see a 60% chance of some kind of crisis over the next 12-24 months, including a 5% chance of full-scale war. The odds of total war can rise rapidly in the event of domestic Chinese instability, a game-changing US arms sale, or a Taiwanese declaration of independence. The greatest deterrent to a full Chinese attack on Taiwan – the reason for our current 5% odds – is that it would result in a devastating blowback against the Chinese economy. China’s trade with the developed world, in addition to Taiwan, makes up 63% of exports, or 11% of GDP (Chart 10). Beijing is ultimately willing to pay this price – or any price – to “unify” the country. But it will not do so frivolously. Each passing year gives China greater global economic leverage and greater military capability over Taiwan. Chart 10China’s Constraints Over Taiwan
Jaw-Jaw Or War-War?
Jaw-Jaw Or War-War?
China is increasing its purchases of US treasuries, which waned during the trade war (Chart 11). China often increases purchases when interest rates rise and markets have seen a rapid increase in treasury yields since the vaccine discovery in November. There is no indication from this point of view that China is preparing for outright war with the United States, although this is admittedly a limited measure that could be misleading. What about a crisis other than war? What do we mean when we say “some kind of crisis” over Taiwan? A major gray zone would be economic sanctions or an economic embargo. While China cut back on tourism after Taiwan’s nominally pro-independence party won the election in 2016, and all tourism ground to a halt with COVID-19, there is no evidence of a broader embargo so far (Chart 12). This could change overnight. While US law forbids an embargo on Taiwan, this is precisely an area where Beijing might wish to test the US’s commitment. Chart 11China Buys More US Treasuries
China Buys More US Treasuries
China Buys More US Treasuries
The current high pressure on Taiwan stems in large part from the confluence of new US export controls and the global semiconductor shortage. China cannot yet meet its domestic demand for semiconductors and it cannot develop advanced computer chips fast enough without the US and its allies (Chart 13). Chart 12No Embargo On Taiwan (Yet)
No Embargo On Taiwan (Yet)
No Embargo On Taiwan (Yet)
If the Biden administration pursues a full technological blockade then China may be forced to take tougher action on Taiwan. But if Biden pursues a more defensive strategy then a new equilibrium will develop that spares China the risks of war. Chart 13China's Demand For Semiconductors
China's Demand For Semiconductors
China's Demand For Semiconductors
The US and China are simultaneously escalating their naval confrontation in the South China Sea, particularly around the Philippines. US and Chinese aircraft carrier groups and other ships have been circling each other as Beijing attempts to intimidate the Philippines and shake its trust in the defense treaty with the US. China claims the South China Sea as its own – and its efforts to deny the US access will be met with US assertions of freedom of navigation, which could lead to sunken ships. The strategic importance of the South China Sea is similar to that of the Taiwan Strait: Chinese control of these bodies of water would threaten Taiwan’s, Japan’s, and South Korea’s supply security while weakening America’s strategic position in the region. We have long highlighted the elevated risks of proxy war for Vietnam and the Philippines but these are hardly issues of global concern compared with Northeast Asia’s security. While Taiwan is far more relevant to global investors, due to the semiconductor issue, there are ample opportunities for a crisis to erupt in the South China Sea. A crisis in this sea cannot be dismissed as marginal because it could involve direct US-China conflict or, worst case, it could be a prelude to action on Taiwan, as China would seek to control the approaches to the island. The final risk in this region is that North Korea has restarted ballistic missile tests. As stated above, a crisis would be well-timed from China’s point of view. For investors, however, North Korea is largely a distraction from the critical Taiwan Strait. It could feed into any risk-off sentiment. Bottom Line: US-China relations are still unsettled and a clash could emerge over the South China Sea and Korean peninsula just as it could emerge over the Taiwan Strait. The Taiwan Strait remains the most significant geography. A direct US-China clash in the South China Sea could cause a global selloff but the markets would recover quickly, unless it is linked to a conflict over Taiwan. Investment Takeaways Geopolitical risk is reviving after a reprieve during the COVID-19 pandemic. That does not mean that frictions will lead straight into war. Diplomacy is possible. If the US, China, Russia, and Iran choose “jaw-jaw” over “war-war” then the global equity rally will see another leg up. From a tactical point of view, however, our arguments above should demonstrate that at least one of Biden’s early foreign policy tests is likely to escalate into a geopolitical incident that prompts negative impacts either in regional or global equity markets. Markets are not prepared for these risks to materialize. Standard measures of global policy uncertainty have fallen sharply for most countries. It is notable that two of the few countries in the world seeing rising policy uncertainty are China and Russia. The latter is likely due to domestic instability – which is a major motivator for an aggressive foreign policy (Chart 14). Chart 14AGlobal Policy Uncertainty Will Revive
Global Policy Uncertainty Will Revive
Global Policy Uncertainty Will Revive
Chart 14BGlobal Policy Uncertainty Will Revive
Global Policy Uncertainty Will Revive
Global Policy Uncertainty Will Revive
Global fiscal stimulus remains exceedingly strong – it is likely to peak this year. Chart 15 shows the latest update in fiscal stimulus for select countries, comparing the COVID-19 crisis to the 2008 financial crisis. There are some notable changes to previous versions of this chart, mostly due to revisions in GDP after last year’s shock, revisions in tax revenues due to the rapid economic snapback, and revisions to the timing and size of stimulus packages. The Biden administration’s $2.3 trillion infrastructure plan is obviously not included. The second panel of Chart 15 shows the changes in the IMF’s estimates from October 2020 to April 2021. Essentially the fiscal stimulus in 2020 was overestimated, as many measures did not kick in and the economic snapback was better than expected, whereas the 2021 stimulus is larger than expected. Russia and China are notable for tightening policy sooner than others – leading to a reduction in IMF estimates of fiscal stimulus for both years. Chart 15Revising Our Global Fiscal Stimulus Chart
Jaw-Jaw Or War-War?
Jaw-Jaw Or War-War?
Commodities have been a major beneficiary of the global recovery (Chart 16). Chinese growth is likely to decelerate this year which will spark a pullback, even aside from geopolitical crises. However, from a cyclical perspective commodities, especially industrial metals, should benefit from limited supply and surging demand. Geopolitical crises and even wars would first be negative but then positive for metals. Chart 16Commodities To Benefit From Geopolitical Conflict
Commodities To Benefit From Geopolitical Conflict
Commodities To Benefit From Geopolitical Conflict
Notably the US is embracing industrial policy alongside China and the EU. In particular the US is joining the green energy race with Biden’s $2.3 trillion American Jobs Plan containing about $370 billion in green initiatives and likely to pass Congress later this year. Symbolically Biden will emphasize the US’s attempt to catch up with Chinese and European green initiatives via his hosting of a global summit on April 22-23 for Earth Day. A brief word on the British pound. We took a tactical pause on our cyclically bullish view of the pound in February in anticipation of the Scottish parliamentary election on May 6. A strong showing by the Scottish National Party could lead to a second independence referendum. This party is flagging in the polls but independence sentiment has ticked back up, reinforcing our point that a nationalist surprise could take place at the ballot box (Chart 17). Once we have clarity on the prospect of a second referendum we will have a clearer view on the pound over the medium term. Chart 17Pound Sees Short-Term Risk From Scots Election
Pound Sees Short-Term Risk From Scots Election
Pound Sees Short-Term Risk From Scots Election
Chart 18Long CHF-GBP For A Tactical Trade
Long CHF-GBP For A Tactical Trade
Long CHF-GBP For A Tactical Trade
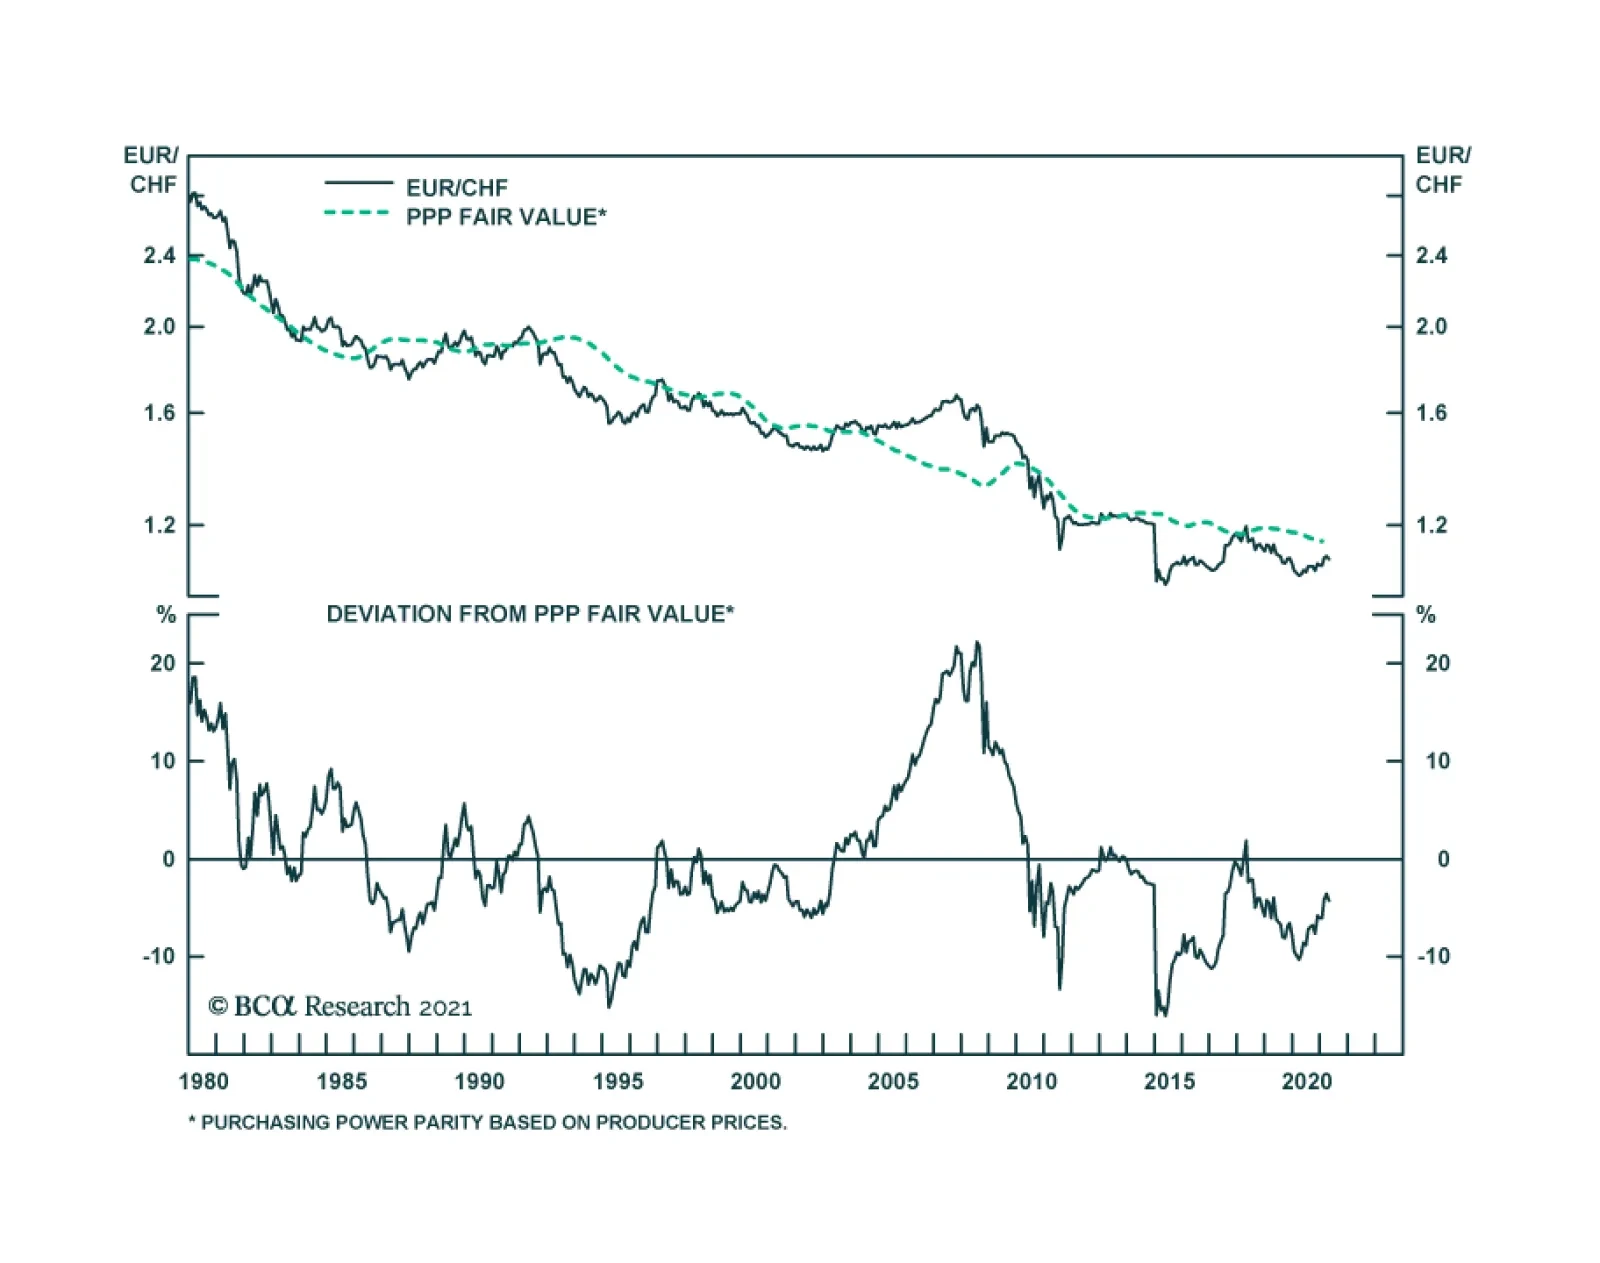
In the near term, we continue to pursue tactical safe-haven trades and hedges. Our tactical long Swiss franc trade was stopped out at 5% on March 25. But our Foreign Exchange Strategist Chester Ntonifor has since highlighted that the franc is excessively cheap (Chart 18). This time we recommend a tactical long CHF-GBP, which has an attractive profile in the context of geopolitical risk, taken together with the British political risk highlighted above. Matt Gertken Vice President Geopolitical Strategy mattg@bcaresearch.com Footnotes 1 “Jaw-Jaw Is Best, Macmillan Finds,” New York Times, January 30, 1958, nytimes.com. 2 Taiwan – Province of China.
Dear Client, Next week I will be hosting a series of Roundtable discussions with BCA’s clients in both Europe and Asia. Our next report published on April 28th will be a recap of my observations from these meetings. Best regards, Jing Sima China Strategist Highlights The sharp uptick in Chinese producer prices should be transitory, unlikely to trigger a policy response. There are two scenarios under which Chinese manufacturers’ profit margins will benefit: either Chinese exporters will raise export prices and pass input costs onto American customers, or the RMB will depreciate versus the US dollar and commodities prices will experience a setback. The second scenario is more likely in the next 3-6 months. After a pandemic-driven boost in 2020, US imports from China will likely moderate in the second half of 2021 and into 2022. President Biden’s grand infrastructure spending plan, even if approved later this year, will not be a game changer for China’s exports or economy. The strength in the USD may intensify in the near term, and Chinese policymakers will be happy to allow the RMB to depreciate mildly. Stay underweight Chinese stocks. Feature Last week’s China’s producer price index (PPI) was more elevated than the market expected. However, it does not warrant a policy response, given that the increase was mostly driven by supply constraints rather than an overheating domestic economy. Chinese manufacturers have had a tough time passing on mounting input prices to customers, which raises the question about how profit margins will be maintained. For exporters, the answer may be a combination of increasing export prices in USD terms and depreciating the RMB. The rate of growth in US demand for Chinese export goods may moderate in the second half of 2021 and into 2022 after a pandemic-driven boost in 2020. China’s economic growth and interest rate differentials with the US will continue to narrow in the rest of this year. We expect the RMB to face headwinds against the USD, at least in the next quarter or two. Meanwhile, global investors should continue to underweight Chinese stocks. The PBoC Will Not React To Supply-Side Price Pressures Chart 1Marchs Strong PPI Does Not Reflect An Overheating Domestic Economy
Marchs Strong PPI Does Not Reflect An Overheating Domestic Economy
Marchs Strong PPI Does Not Reflect An Overheating Domestic Economy
Despite above-expectation readings in China’s PPI, the domestic economy shows no signs of overheating. The upside pressure on producer prices reflects the impact of both the global rally in commodities and base effects (Chart 1). In March, strength in the PPI was also accentuated by seasonality due to a resumption in construction and real estate activity following the Chinese New Year holiday. While base effects and global supply bottlenecks will continue to buoy PPI prints throughout Q2, these effects are likely transitory and would not justify a policy response. At 0.4% year-over-year in March, core CPI remains significantly below the central bank’s 3% target and does not indicate any demand-side pressure. Instead, the inability for Chinese producers to pass on higher input prices to consumers highlights the relatively subdued state of domestic demand (Chart 1, bottom panel). Chart 2Current Macro Policy Works To Cap The Upsides In Both The Price And Quantity Of Money
Current Macro Policy Works To Cap The Upsides In Both The Price And Quantity Of Money
Current Macro Policy Works To Cap The Upsides In Both The Price And Quantity Of Money
At this point there are little signs that rising producer prices are spilling over to consumer prices. We expect Chinese authorities to continue its current policy trajectory, which intends to keep a steady interbank rate while keeping money supply growth at or below the rate of nominal GDP expansion (Chart 2). China’s Deteriorating Terms Of Trade Chinese export prices climbed slightly in USD terms, but not by enough to offset the RMB’s relentless appreciation from the second half of last year, as indicated by falling export prices in RMB terms (Chart 3). A deteriorating terms of trade (ToT), defined as export prices relative to import costs, means that Chinese producers must export a greater number of units to purchase the same number of imports (Chart 4). The declining ToT can be a powerful deflationary force for China’s manufacturing sector. Chart 3Chinese Export Prices Are Rising In USD Terms But Falling In Local Currency Terms
Chinese Export Prices Are Rising In USD Terms But Falling In Local Currency Terms
Chinese Export Prices Are Rising In USD Terms But Falling In Local Currency Terms
Chart 4Terms Of Trade Have Been Falling
Terms Of Trade Have Been Falling
Terms Of Trade Have Been Falling
Chart 5Chinese Output Prices Lead US Consumer Inflation By A Year
Chinese Output Prices Lead US Consumer Inflation By A Year
Chinese Output Prices Lead US Consumer Inflation By A Year
While there are limited choices for China to improve its ToT, manufacturers could raise export prices in USD terms and “recycle” cost-push inflation back to the US. Chinese PPI normally leads US consumer inflation by 12 to 18 months (Chart 5). Hence, it is possible that the US will see import prices from China picking up more momentum by the middle of next year. The RMB’s performance is a key macro driver for manufacturing-related output prices. A depreciation in the RMB can be a meaningful reflationary force for manufacturers. There has been a clear negative correlation between the trade-weighted RMB and Chinese manufacturers' output prices and industrial profits, as shown in Chart 6. In this scenario, the USD will continue to appreciate against the RMB and possibly emerging market currencies, a headwind to global trade (Chart 7). Chart 6A Falling RMB Can Be Reflationary To Chinese Producers
A Falling RMB Can Be Reflationary To Chinese Producers
A Falling RMB Can Be Reflationary To Chinese Producers
Chart 7A Stronger USD Will Be Headwinds For Global Trade
A Stronger USD Will Be Headwinds For Global Trade
A Stronger USD Will Be Headwinds For Global Trade
Maintaining a strong RMB can partly mitigate the pain stemming from escalating commodity import prices. However, in our view it is the least preferred option by policymakers. In previous cycles a rapidly strengthening RMB did not have a major impact on Chinese exporters' competitiveness, mainly because declines in commodities prices effectively offset a rising RMB (Chart 8 and Chart 9). Therefore, Chinese exporters did not need to boost prices in USD terms to maintain their profit margins. Chart 8RMB Appreciations Did Not Hurt Chinas Share In Global Trade
RMB Appreciations Did Not Hurt Chinas Share In Global Trade
RMB Appreciations Did Not Hurt Chinas Share In Global Trade
Chart 9...Because Declines In Commodities Prices Were Able To Offset A Rising RMB
...Because Declines In Commodities Prices Were Able To Offset A Rising RMB
...Because Declines In Commodities Prices Were Able To Offset A Rising RMB
Bottom Line: Chinese exporters can either raise prices and pass the inflation onto American customers, or the PBoC will allow further depreciation in the RMB to maintain Chinese producers’ competitiveness. Appreciating the RMB is the least preferred option. Don’t Count On A US Buying Spree Market participants in China are pricing in large windfalls from the US$1.9 trillion American Rescue Plan and proposed US$2.4 trillion American Jobs Plan.1 A positive export tailwind in Q1 this year boosted China’s economic activity beyond what measures of domestic money and credit would have predicted, as shown in Chart 10. However, given the strongly positive relationship between the export sector and real investment in China, it is concerning that any deceleration in US demand for Chinese export goods would seriously challenge the sanguine view for China’s economy this year (Chart 11). Chart 10Export Strength Appears To Be Propping Up The LKI
Export Strength Appears To Be Propping Up The LKI
Export Strength Appears To Be Propping Up The LKI
Chart 11China's Export Sector Is Highly Investment-Intensive
From Deflation To Inflation … What’s Next?
From Deflation To Inflation … What’s Next?
Moreover, US demand for Chinese export goods is subject to several countervailing forces, at least in the second half of 2021: The USD currently benefits from widening real interest differentials and stronger US growth relative to the rest of the world. For the next quarter or two, persistent strength in the USD and US Treasury yields will be headwinds to global trade and may cause a temporary setback for the global manufacturing sector (Chart 7 on Page 4). Residential and business investment in the US may not regain much vigor despite large stimulus checks. Our colleagues at BCA US Investment Strategy expect US residential investment to match the long-run trend growth, but the increase will be largely offset by below-trend growth in non-residential investment. More working-from-home options will continue to drive demand for single-family homes in the suburbs and beyond. On the other hand, demand will suffer for office space in central business districts and dwellings in urban centers. Brick-and-mortar retail construction is also going to crater. Consumption for goods in the US may also see below-trend growth in the second half of 2021 and into 2022, whereas the service sector will benefit most from the coming recovery in US business and social activities. Table 1 shows that goods spending rose in 2020 despite an overall decline in consumption, because households dramatically shifted their consumption into goods from services. As such, 2020’s pandemic-driven dividend for Chinese exporters is likely to become a drag on tradeable goods exports to the US in 2021 and/or 2022. Table 1US Consumer Spending Gap Is Almost Entirely On The Services Side
From Deflation To Inflation … What’s Next?
From Deflation To Inflation … What’s Next?
It is also important for investors to put the US$2.4 trillion infrastructure spending budget proposed in the American Jobs Plan into prospective. The US lags far behind China in infrastructure spending. In the past 10 years, US public infrastructure investment (federal and state combined) has declined to an average of about $450 billion.2 This compares with China’s US $1.9 trillion yearly spending on infrastructure (Chart 12). China currently consumes seven to eight times more industrial metals than the US (Chart 13). As such, even if the US infrastructure investment plan will be approved later this year, it is unlikely to be a game changer for global commodity prices or Chinese exports. Chart 12Infrastructure Spending, China Vs. The US
From Deflation To Inflation … What’s Next?
From Deflation To Inflation … What’s Next?
Chart 13US Consumption Of Industrial Metals Is Too Small Relative To China
From Deflation To Inflation … What’s Next?
From Deflation To Inflation … What’s Next?
The proposed US$1.2 trillion spending on the US nation’s roads, bridges, green spaces, water, electricity, and universal broadband will be spread over the next eight years. The additional $150 billion per annum to the US public infrastructure investment will only boost the US spending from 24% to about 32% of China’s annual infrastructure investment. Furthermore, the fiscal multiplier effect from the extra public spending on investment from the US private sector and overall economy may not be as positive as the market has priced in, depending on the size of corporate tax hikes in the final bill. Bottom Line: After a pandemic-driven boost in 2020, growth in US imports from China will likely moderate in the second half of 2021 and into 2022. The proposed infrastructure spending plan in the US will benefit Chinese exports, but the magnitude of the windfall may be disappointing. Investment Implications As discussed in a previous report, rising US bond yields will have a muted effect on their Chinese counterparts. Tightened regulations on the real estate industry and a new round of environmental protection laws in China will continue to suppress the domestic credit demand. As a result, interest rate differentials between China and the US will continue to narrow. The strength in the USD has not run its course and the RMB will face slight depreciation pressures in Q2 and possibly into Q3. A declining RMB will provide reflationary benefits to China’s industrial profits, but with about a six-month time lag. In the meantime, we recommend global investors to continue underweighting Chinese stocks (Chart 14A and 14B). Chart 14AContinue Underweighting Chinese Stocks
Continue Underweighting Chinese Stocks
Continue Underweighting Chinese Stocks
Chart 14BContinue Underweighting Chinese Stocks
Continue Underweighting Chinese Stocks
Continue Underweighting Chinese Stocks
Jing Sima China Strategist jings@bcaresearch.com Footnotes 1According to the OECD, recent US stimulus will boost US GDP growth by almost 3 percentage points in the first full year (from 2021Q2 to 2022Q2). The knock-on effect from the stimulus on other economies is projected to be significant, including a half percentage point addition to China’s GDP during the same period. 2The Congressional Budget Office estimated that combined federal, state and local spending on infrastructure was (in 2019 dollars) $441 billion as of 2017. Cyclical Investment Stance Equity Sector Recommendations
Highlights Global Inflation: The case for maintaining a strategic overall allocation to inflation-linked bonds (ILBs) versus nominal government debt in dedicated global fixed income portfolios remains intact. Global growth expectations are accelerating as vaccinations increase, spare capacity is increasingly being absorbed across the developed world and central banks (led by the Federal Reserve) continue to show no inclination to tighten policy anytime soon. Inflation-Linked Bond Allocations: ILB valuations, however, are no longer uniformly cheap across all countries. Real yields are now moving in a less coordinated fashion as markets try to sort out the timing and pace of eventual future central bank tightening. We recommend shifting inflation-linked bond exposure from Canada to Germany, as both markets have similar valuations but the Bank of Canada is likely to turn less dovish well ahead of the ECB. Feature Chart of the WeekMarkets Remain Unconcerned About An Inflation Overshoot
Markets Remain Unconcerned About An Inflation Overshoot
Markets Remain Unconcerned About An Inflation Overshoot
The global reflation trade over the past year has been highly rewarding to investors. Equity and credit markets worldwide have delivered outstanding returns on the back of highly stimulative monetary and fiscal policies implemented to deal with the negative economic effects of COVID-19. The global INflation trade has also paid off for investors in inflation-linked bonds (ILBs), which have outperformed nominal government debt across the developed economies dating back to last spring. The rising trend for global inflation breakevens remains intact, but is approaching some potential resistance points. A GDP-weighted average of 10-year breakeven inflation rates among the major developed economies is just shy of the 2% level that has represented a firm ceiling over the past decade (Chart of the Week). At the same time, the Bloomberg consensus forecast for headline CPI inflation for that same group of countries calls for an increase to only 1.8% by year-end before slowing to 1.7% in 2022. The latest forecasts from the IMF are similar, calling for headline inflation in the advanced economies to reach 1.6% in 2021 and 1.7% in 2022. If those modest forecasts for realized inflation come to fruition, then there is likely not much more upside in inflation breakevens, in aggregate. Country selection within the ILB universe will become more important over the next 6-12 months, as divergences in growth, realized inflation and central bank reactions will lead to a more heterogeneous path for global inflation breakevens. Underlying Inflation Backdrop Still Supports Rising Breakevens On a total return basis, ILBs enjoyed an extended run of success prior to this year. The cumulative total return of the asset class (in local currency terms) between 2012 and 2020 was a whopping 61% in the UK, 25% in Canada, 22% in the US and 21% in the euro area (aggregating the individual countries in the region with inflation-linked bonds). However, the absolute performance of ILBs has been more disperse on a country-by-country basis so far in 2021. ILBs are down year-to-date in Canada (-6.2%), the UK (-5.0%) and the US (-1.4%). On the other hand, euro area ILBs have delivered a positive total return of +0.5% so far in 2021. Real bond yields have climbed off the lows in the US, UK and, most notably, Canada where the overall index yield on the Bloomberg Barclays inflation-linked bond index is now in positive territory for the first time since before the pandemic started (Chart 2). At the same time, real bond yields have been drifting lower in the euro area. These real yield moves are related to shifting perceptions of central bank responses to the global growth upturn. For example, pricing in overnight index swap (OIS) curves have pulled forward the timing and pace of future interest rate increases in the US and Canada – i.e. real policy rates will become less negative - while there has been comparatively little change in euro zone rate expectations. While the absolute returns for ILBs have become less correlated, the relative trade between nominal and inflation-linked government bonds in all countries remains intact. 10-year breakeven inflation rates have been steadily climbing in the US and UK, while depressed Japanese breakevens have crept modestly higher (Chart 3). Even Europe, where inflation has remained subdued for years, has seen a significant shift higher in inflation breakevens. (Chart 4). The turn in breakevens has occurred alongside a major change in investor perceptions of future inflation, with surveys like the ZEW showing an overwhelming majority of financial professionals expecting higher inflation in the US, Europe and the UK. Chart 2A Fading Bull Market In Inflation-Linked Bonds
A Fading Bull Market In Inflation-Linked Bonds
A Fading Bull Market In Inflation-Linked Bonds
Chart 3A Solid Recovery In Inflation Expectations
A Solid Recovery In Inflation Expectations
A Solid Recovery In Inflation Expectations
Chart 4European Inflation Expectations Starting To Normalize
European Inflation Expectations Starting To Normalize
European Inflation Expectations Starting To Normalize
Inflation forecasts have shifted in response to faster global growth expectations on the back of vaccine optimism and aggressive US fiscal stimulus. Yet inflation forecasts remain modest compared to the huge growth figures expected for 2021 and 2022. In its latest World Economic Outlook published last week, the IMF upgraded its global real GDP forecast to 6.0% for 2021 and 4.4% for 2022. This represented an increase of 0.5 and 0.4 percentage points, respectively, from the last set of forecasts published back in January. While growth upgrades occurred across all major developed and emerging economies, the biggest upgrades came in the US and Canada, for both 2021 and 2022. As a result, the IMF projects the output gap in both countries to turn positive over 2022 and 2023, and be nearly closed in core Europe, Australia and Japan (Chart 5). The IMF is not projecting a major inflation surge on the back of those upbeat growth forecasts, though. While headline inflation in the US is expected to climb to 2.3% in 2021 and 2.4% in 2022, the same measure in Canada is only projected to rise to 1.7% and 2.0% over the same two years. European inflation is expected to remain subdued, reaching only 1.4% this year and drifting back to 1.2% in 2022 despite real GDP growth averaging 4.1% over the two-year period. The IMF attributes the benign inflation outcomes, even in the face of booming growth rates and the rapid elimination of output gaps, to the structural disinflationary backdrop for so-called “non-cyclical” inflation (Chart 6). The IMF defines this as the components of inflation indices that are less sensitive to changes in aggregate demand. The IMF estimates show that the contribution from non-cyclical components to overall inflation in the advanced economies had fallen to essentially zero at the end of 2020. Chart 5A Big Expected Narrowing Of Output Gaps
How Much More Juice Is Left In The Global Inflation Breakeven Trade?
How Much More Juice Is Left In The Global Inflation Breakeven Trade?
Chart 6Non-Cyclical Components Still Weighing On Global Inflation
Non-Cyclical Components Still Weighing On Global Inflation
Non-Cyclical Components Still Weighing On Global Inflation
There is considerable upside risk for the more cyclical components of inflation that could result in inflation overshooting the IMF projections (Chart 7). Chart 7Cyclical Backdrop Is Inflationary
Cyclical Backdrop Is Inflationary
Cyclical Backdrop Is Inflationary
For example, in the US, the Prices Paid component of the ISM Manufacturing index remains elevated at post-2008 highs, while the year-over-year change in the Producer Price Index soared to 6% in March. Across the Atlantic, the European Commission business and consumer surveys have shown a big surge in the net balance of respondents expecting higher inflation in manufacturing and retail trade. Previous weakness in the US dollar and surging commodity prices are playing a major role in this rapid pick-up in price pressures seen in many countries. Given the current backdrop of strong global growth expectations, with actual activity accelerating as vaccinations increase and more parts of the global economy reopen, inflation pressures are unlikely to fade in the near term. With realized inflation rates set to spike due to base effect comparisons to the pandemic-fueled collapse one year ago, the upward pressure on global ILB inflation breakevens will persist in the coming months – especially with breakevens still below levels that would prompt central banks to turn less dovish sooner than expected. Bottom Line: The case for maintaining a strategic overall allocation to inflation-linked bonds (ILBs) versus nominal government debt in dedicated global fixed income portfolios remains intact. Global growth expectations are accelerating as vaccinations increase, spare capacity is increasingly being absorbed across the developed world and central banks (led by the Federal Reserve) continue to show no inclination to tighten policy anytime soon. Assessing Value In Developed Market Inflation-Linked Bonds Chart 8USD Outlook Now More Mixed
USD Outlook Now More Mixed
USD Outlook Now More Mixed
Although the current backdrop remains conducive to a continuation of the rising trend in global ILB breakevens, there are factors that could begin to slow the upward momentum. The future path of the US dollar is now a bit less certain (Chart 8). While the DXY index is still down 7.4% compared to a year ago, it is up 2.4% so far in 2021. Shorter-term real interest rate differentials between the US and the other major developed markets remain dollar-bearish. At the same time, longer-term real yield differentials have risen in favor of the US (middle panel). Furthermore, US growth is outperforming other developed economies, typically a dollar-bullish factor (bottom panel). Given the usual negative correlation between the US dollar and commodity prices, a loss of downside dollar momentum could also slow the pace of commodity price appreciation. This represents a risk to additional global ILB outperformance versus government bonds. Our GDP-weighted aggregate of 10-year ILB breakevens for the major developed economies is currently just under 2% - levels more consistent with oil prices over $80/bbl than the current price closer to $60/bbl (Chart 9). Chart 9Breakevens Consistent With Much Higher Oil Prices
Breakevens Consistent With Much Higher Oil Prices
Breakevens Consistent With Much Higher Oil Prices
Given some of these uncertainties over the strength of any future inflationary push from a weaker US dollar and rising commodity prices, a broad overweight allocation to ILBs across the entire developed market universe may no longer generate the same strong returns versus nominal government bonds seen over the past year. With the “easy money” already having been made in the global breakeven widening trade, country allocation within the ILB universe has now become a more important dimension for bond investors to consider. To assess the relative attractiveness of individual ILB markets, we turn to a few valuation tools. Our regression-based valuation models for 10-year ILB breakevens in the US, UK, France, Italy, Germany, Japan, Canada and Australia are all presented in the Appendix on pages 14-17. The two inputs into the model are the annual rate of change of the Brent oil price in local currency terms (as a measure of shorter-term inflation pressure) and a five-year moving average of realized headline CPI inflation (as a longer-term trend that provides a structural “anchor” for breakevens based off actual inflation outcomes). We first presented these models in April 2020, but we have now made a change in response to some of the unprecedented developments witnessed over the past year.1 Despite the strong visual correlation between the level of oil prices and inflation breakevens in most countries, we chose to use the annual growth of oil prices, rather than the level, in our breakeven models. This is because we found it more logical to compare a rate of change concept like inflation (and breakevens) to the rate of change of oil. However, the oil input into our breakeven models could produce nonsensical results during periods of extreme oil volatility that did not generate equivalent swings in breakeven inflation rates. A good example of that occurred in 2016, when the annual rate of change of the Brent oil price briefly surged toward 100%, yet 10-year US TIPS breakevens did not rise above 2% (Chart 10). An even bigger swing in oil prices has occurred over the past year, with oil prices up over +200% compared to the collapse in prices that occurred one year ago. Putting such an extreme move into our US model would have pushed the “fair value” level of the 10-year TIPS breakeven to 4% - an implausible outcome given that the 10-year breakeven has never risen to even as high as 3% in the entire 24-year history of the TIPS market. Chart 10Pass-Through Of Extreme Oil Moves Has Limits
Pass-Through Of Extreme Oil Moves Has Limits
Pass-Through Of Extreme Oil Moves Has Limits
To deal with this problem, we have truncated the rate of change of oil prices in all our breakeven models at levels consistent with past peaks of breakevens. Going back to the US example, we have “capped” the rate of change of the Brent oil price at +40%, as past periods when oil price momentum was greater than 40% did not translate into any additional increase in TIPS breakevens. We then re-estimated the model using this truncated oil price series to generate fair value breakeven levels. Chart 11A Mixed Impact Of USD Moves On Non-US Breakevens
A Mixed Impact Of USD Moves On Non-US Breakevens
A Mixed Impact Of USD Moves On Non-US Breakevens
We did this for all eight of our individual country breakeven models and in all cases, truncating extreme oil moves improved the accuracy of the model. Interestingly, we did not truncate the downside momentum of oil prices, as there was no obvious “cut-off” point where periods of collapsing oil prices did not generate equivalent declines in breakevens. Oil prices remain the most critical short-term variable to determine ILB breakeven valuation. While it is intuitive to think that currency movements should also have a meaningful impact on inflation (both realized and expected), the effect is not consistent across countries. For example, euro area breakevens appear to be positively correlated to the euro, while Japanese breakevens rarely rise without yen weakness (Chart 11). One other factor to consider when evaluating the value of breakevens is the possible existence of an inflation risk premium component during periods of higher uncertainty over future inflation. Such uncertainty could result in increased demand for ILBs from investors driving up the price of ILBs (thus lowering the real yield) relative to nominal yielding bonds, leading to wider breakevens that do not necessarily reflect a true rise in expected inflation. A simple way to measure such an inflation risk premium is to compare market-based breakevens to survey-based measures of inflation forecasts taken from sources like the Philadelphia Fed's Survey of Professional Forecasters and the Bank of Canada’s Survey Of Consumer Expectations. The assumption here is that the survey-based measures represent a more accurate (or, at least, less biased) depiction of underlying inflation expectations in an economy. We present these simple measures of inflation risk premia, comparing 10-year breakevens to survey-based measures of inflation expectations, in Chart 12 and Chart 13. Breakevens had been trading well below survey-based measures of inflation expectations after the negative pandemic growth shock in 2020 in all countries shown. After the steady climb in global breakevens seen over the past year, those gaps have largely disappeared, with breakevens now trading slightly above survey based inflation expectations in the US, UK and Australia. Chart 12No Major Inflation Risk Premia In These Markets
No Major Inflation Risk Premia In These Markets
No Major Inflation Risk Premia In These Markets
Chart 13Canadian & Australian Breakevens In Line With Inflation Surveys
Canadian & Australian Breakevens In Line With Inflation Surveys
Canadian & Australian Breakevens In Line With Inflation Surveys
Chart 14Assessing The Value Of Breakevens
Assessing The Value Of Breakevens
Assessing The Value Of Breakevens
In Chart 14, we show the valuation residuals from our 10-year ILB breakeven models, along with two other measures of potential breakeven valuation: a) the distance between current breakeven levels and their most recent pre-pandemic peaks; and b) the difference between breakevens and the survey-based measures of inflation expectations. The model results show that breakevens are furthest below fair value in France, Japan and Germany, and the most above fair value in the UK and Australia. The message of undervaluation from our models is confirmed in the other two metrics for France, Japan, Germany, Canada and Italy. The overvaluation message for Australia is consistent across all three valuation metrics, while the signals are mixed for US and UK breakevens. In Japan, while the combined signals of all three valuation metrics indicate that breakevens are far too low, the very robust positive correlation between Japanese breakevens and the USD/JPY exchange rate implies that a bet on wider breakevens requires a much weaker yen. In Canada, while the 10-year breakeven does appear cheap, the real yield has also climbed faster than any of the other countries over the past several months as markets have rapidly repriced a more hawkish path for the Bank of Canada. Recent comments from Bank of Canada officials have leaned a bit hawkish, hinting at a possible taper of its bond-buying program, as the central bank appears unhappy with the renewed boom in Canadian housing values. An early tightening of monetary conditions would likely cap any additional upside in Canadian inflation breakevens. In Europe, the undervaluation of breakevens is more compelling. The ECB is likely to maintain its dovish policy settings into at least 2023, even if growth recovers later this year as increased vaccinations lead to the end of lockdowns. As shown earlier, European breakevens can continue to rise even if the euro is also appreciating versus the US dollar, especially if growth is recovering and oil prices are rising. Euro area breakevens are likely to continue drifting higher over at least the rest of 2021. Currently in our model bond portfolio, we have allocations to ILBs out of nominal government bonds in the US, France, Canada and Italy, with no allocations in Germany, Japan, Australia or the UK. After assessing our valuation measures, we are comfortable with the ILB exposure in France and Italy and lack of positions in the UK and Australia. We still see the upside case for US breakevens, with the economy reopening rapidly fueled further by fiscal policy, and the Fed likely to maintain its current highly dovish forward guidance until much later in 2021. We are reluctant to add exposure to Japanese ILBs, despite attractive valuations, as we are not convinced that USD/JPY has enough upside potential to help realize that undervaluation of Japanese breakevens. Thus, as a new change to our model portfolio this week that reflects our assessment of ILB breakeven valuations and risks, we are closing out the exposure to Canadian ILBs and adding a new position in German ILBs of equivalent size (see the model bond portfolio tables on pages 18-19). Bottom Line: ILB valuations are no longer uniformly cheap across all countries. Real yields are now moving in a less coordinated fashion as markets try to sort out the timing and pace of eventual future central bank tightening. We recommend shifting inflation-linked bond exposure from Canada to Germany, as both markets have similar valuations but the Bank of Canada is likely to turn less dovish well ahead of the ECB. Robert Robis, CFA Chief Fixed Income Strategist rrobis@bcaresearch.com Footnotes 1 Please see BCA Research Global Fixed Income Strategy Report, "Global Inflation Expectations Are Now Too Low", dated April 28, 2020, available at gfis.bcaresearch.com. Appendix Chart A1Our US 10-Year Inflation Breakeven Model
How Much More Juice Is Left In The Global Inflation Breakeven Trade?
How Much More Juice Is Left In The Global Inflation Breakeven Trade?
Chart A2Our UK 10-Year Inflation Breakeven Model
How Much More Juice Is Left In The Global Inflation Breakeven Trade?
How Much More Juice Is Left In The Global Inflation Breakeven Trade?
Chart A3Our France 10-Year Inflation Breakeven Model
How Much More Juice Is Left In The Global Inflation Breakeven Trade?
How Much More Juice Is Left In The Global Inflation Breakeven Trade?
Chart A4Our Italy 10-Year Inflation Breakeven Model
How Much More Juice Is Left In The Global Inflation Breakeven Trade?
How Much More Juice Is Left In The Global Inflation Breakeven Trade?
Chart A5Our Japan 10-Year Inflation Breakeven Model
How Much More Juice Is Left In The Global Inflation Breakeven Trade?
How Much More Juice Is Left In The Global Inflation Breakeven Trade?
Chart A6Our Germany 10-Year Inflation Breakeven Model
How Much More Juice Is Left In The Global Inflation Breakeven Trade?
How Much More Juice Is Left In The Global Inflation Breakeven Trade?
Chart A7Our Canada 10-Year Inflation Breakeven Model
How Much More Juice Is Left In The Global Inflation Breakeven Trade?
How Much More Juice Is Left In The Global Inflation Breakeven Trade?
Chart A8Our Australia 10-Year Inflation Breakeven Model
How Much More Juice Is Left In The Global Inflation Breakeven Trade?
How Much More Juice Is Left In The Global Inflation Breakeven Trade?
Recommendations
How Much More Juice Is Left In The Global Inflation Breakeven Trade?
How Much More Juice Is Left In The Global Inflation Breakeven Trade?
The GFIS Recommended Portfolio Vs. The Custom Benchmark Index Duration Regional Allocation Spread Product Tactical Trades Yields & Returns Global Bond Yields Historical Returns
According to BCA Research’s Foreign Exchange Strategy service, the Swiss National Bank welcomes the recent weakness in the franc , but technicals suggest a tactical rally in CHF is likely. The Swiss franc has been one of the worst-performing currencies…
Highlights The Swiss economy will benefit from the pickup in global growth. The recent weakness in the franc has been a welcome development for the Swiss National Bank, but technicals suggest a coiled spring rally in CHF is likely. However, as a low-beta currency, the Swiss franc will lag the upturn in other pro-cyclical currencies over the longer term. We remain long EUR/CHF as a tactical trade but maintain tight stops at 1.095. Long CHF/NZD and CHF/GBP positions look attractive at current levels. Similar to our short EUR/JPY position, this is an excellent portfolio hedge. Feature Chart I-1The Swiss Economy Is On The Mend
The Swiss Economy Is On The Mend
The Swiss Economy Is On The Mend
The Swiss economy has recovered smartly. As of March, the manufacturing PMI was at 66.3, the highest since 2006. If past manufacturing sentiment is prologue, the Swiss economy is about to experience its biggest rebound in decades (Chart I-1). This will quell any deflationary fears about domestic conditions in Switzerland and begin to re-anchor inflation expectations upwards. This will also be a very welcome development for the SNB. The Swiss franc has been one of the worst performing currencies this year, but that might be about to change. For one, dollar sentiment has been reset with the rise in the DXY index this year. Second, the global economy is transitioning from disinflationary to a gentle tilt towards inflation. This will lift global prices, including import prices into Switzerland. Rising import prices will ease the need for the SNB to maintain emergency monetary settings. Finally, the weakness in the currency has eased financial conditions for Swiss concerns. The Reopening Trade Most economies are entering into a third wave of the Covid-19 pandemic and the Swiss economy is no exception. However, the Swiss authorities have been able to bring the number of new infections down to levels below the euro area in general and Sweden in particular. Vaccinations are progressing smoothly with almost 20% of the population inoculated as of today. This provides a coiled springboard to lift the Swiss economy into robust growth later this year. Switzerland is one of the most open economies in the G10. Exports of goods and services account for over 65% of Swiss GDP, much higher than the euro area (Chart I-2). The constituent of Swiss exports tends to be defensive (medical goods, gold, watches, jewelry) so the franc does not necessarily outperform in a global growth upswing, but definitely does better than the dollar which anchors a more closed economy. Inflation dynamics in Switzerland will be particularly beholden to improvement in the private sector. As we show in Chart I-1, employment should remain robust in the months ahead, which will support wages. Import prices in Switzerland are also about to catapult upwards, which will help lift the consumer price basket (Chart I-3). For a small, open economy like Switzerland, the exchange rate often dictates the trend in domestic inflation, and the weakness in the franc has been a beneficial cushion for good prices. The rise in global tradeable prices is also acting as a catalyst. For the first time in many years, the pendulum might be swinging towards a worry about inflation in SNB corridors. Chart I-2Switzerland Has A Huge Exposure To Trade
Switzerland Has A Huge Exposure To Trade
Switzerland Has A Huge Exposure To Trade
Chart I-3Swiss Inflation Will Rise
Swiss Inflation Will Rise
Swiss Inflation Will Rise
Particularly, a rise in Swiss inflation will lessen the need for the SNB to keep rates at the -0.75 level in place for over half a decade. It will also lessen to need for the SNB to fight against franc strength. Global Developments In A CHF Context There are some additional tailwinds to a strong CHF in today’s context. Volatility has collapsed, with the VIX index well below 20. If one could predict with absolute certainty what will happen with global growth, equity prices, bond yields, or even Covid-19, then low volatility makes sense. However, in the current context of elevated valuations, high uncertainty and a precarious health landscape, it almost makes perfect sense that volatility should rise. The franc tends to do well in an environment where volatility is rising (Chart I-4). Chart I-4The Swiss Franc Tracks The VIX
The Swiss Franc Tracks The VIX
The Swiss Franc Tracks The VIX
Chart I-5Long-Term Support On CHF/NZD Has Held
Long-Term Support On CHF/NZD Has Held
Long-Term Support On CHF/NZD Has Held
In fact, from a broad picture perspective, a rotation from US growth outperformance to other parts of the globe that are also stimulating their domestic economies could be met with higher dollar volatility. This has historically been beneficial for the Swiss franc (Chart I-6). Ergo, being long the franc could constitute a “heads, I win; tails I do not lose too much” proposition. Rising global growth and a lower dollar will help the franc, but so will a rise in volatility. Chart I-6CHF/NZD Tracks Dollar Volatility
CHF/NZD Tracks Dollar Volatility
CHF/NZD Tracks Dollar Volatility
Our Geopolitical Strategy team has also been recommending long Swiss franc positions since February as they believe the Biden administration faces several imminent and serious foreign policy tests, namely over Russia’s military buildup on the Ukraine border, China’s military pressure tactics against Taiwan, and Middle East tensions ahead of any revived US-Iran nuclear deal. They see a 60% chance of some kind of crisis – if not war – over the Taiwan Strait and any of these other issues could also motivate safe haven demand for the rest of this year. With regard to CHF/GBP, an upside surprise for the Scottish National Party in the May 6 parliamentary election could also hurt the pound since it would herald a second Scots independence referendum in the not-too-distant future. Trading Dynamics As A Safe Haven Chart I-7CHF And The Copper/Gold Ratio
CHF AND THE COPPER/GOLD RATIO
CHF AND THE COPPER/GOLD RATIO
Switzerland ticks off all the characteristics of a safe-haven currency. Its large net international investment position of over 100% of GDP generates huge income inflows. Meanwhile, rising productivity over the years has led to a structural surplus in its trading balance and a rising fair value for the currency. Consequently, the franc has tended to have an upward bias over the years, supercharged during periods of risk aversion. This makes the franc a useful constituent of any currency portfolio. More specifically, the franc has tracked the gold-to-copper ratio in recent years. Copper is a good barometer for global economic health while gold is a good proxy for the demand for safety. If the overarching theme is that complacency reigns across markets, a nudge towards safety will benefit flows into the franc (Chart I-7). The current interest-rate regime could also affect the franc-dollar relationship. Global yields have risen. To the extent that we are due for some reprieve, the franc will benefit, given its “low beta” status. Meanwhile, net portfolio flows into Switzerland suffered from the Trump tax cuts that pushed US affiliates in Switzerland to repatriate investments. President Biden’s tax reform will halt and/or reverse this process. SNB Action And Market Implications The past weakness in the franc has been a welcome development for the SNB. In fact, since the start of this year, Swiss central bankers have not had to ramp up asset purchases. Both the dollar and the euro have been relatively strong (Chart I-8). In other words, global dynamics have eased monetary conditions for the Swiss authorities. The latest Article IV report from the IMF also justifies the SNB’s monetary stance. Currency intervention was cited as a viable tool should the SNB do a policy review, especially given the potential inefficacies from QE due to the small bond market in Switzerland. Herein lies the key takeaway for the franc – while it could appreciate in an environment where the dollar resumes its downtrend, it will likely lag other pro cyclical currencies over the longer term. This is because the SNB will be loath to see the franc unanchor inflation expectations. We are long EUR/CHF on this basis, but are keeping tight stops at 1.095. Three key factors suggest this trade could still work well in the coming 12-18 months. Rising interest rates benefit EUR/CHF (Chart I-9). With interest rates in Switzerland well below other countries, the Swiss franc rapidly becomes a funding currency for carry trades. Carry trades, especially towards peripheral bonds in Europe hurt the franc. Chart I-8A Weaker Franc Is Doing The Heavy Lifting For The SNB
A Weaker Franc Is Doing The Heavy Lifting For The SNB
A Weaker Franc Is Doing The Heavy Lifting For The SNB
Chart I-9EUR/CHF Tracks German ##br## Yields
EUR/CHF Tracks German Yields
EUR/CHF Tracks German Yields
The Swiss trade balance has suffered in the face of a global slowdown. It will also lag the European rebound (Chart I-10). In a downturn, commoditized goods prices are the first to drop and recover, while more specialized goods prices eventually gain ground later. Swiss goods are not easily substitutable which is a benefit, but prices are also slower to adjust. Our models suggest the franc is still about 5% overvalued versus the euro. Over the history of the model, this has been a modest premium, but allows the euro to outperform the Swiss franc (Chart I-11). Chart I-10Structural Appreciation In The Swiss Franc
Structural Appreciation In The Swiss Franc
Structural Appreciation In The Swiss Franc
Chart I-11EUR/CHF Is Still Cheap
EUR/CHF Is Still Cheap
EUR/CHF Is Still Cheap
Economically, the SNB has to walk a fine line between a predominantly deflationary backdrop in Switzerland and a rising debt-to-GDP ratio that pins it among the highest in the G10 (Chart I-12). Too little stimulus and the economy runs the risk of entering a debt-deflation spiral, as inflation expectations are revised downwards. Too much stimulus and the result will be a build-up of imbalances, leading to an eventual bust. Chart I-12Lots Of Private Debt In Switzerland
Lots Of Private Debt In Switzerland
Lots Of Private Debt In Switzerland
Today, the SNB is in a sweet spot. Almost every other G10 country is providing the fiscal and monetary stimulus necessary to lift Switzerland from its deflationary paradigm. Investment Conclusions Chart I-13Structural Appreciation In The Franc Still Possible
Structural Appreciation In The Franc Still Possible
Structural Appreciation In The Franc Still Possible
Our long-term fair value models suggest the Swiss franc is currently cheap versus the dollar (Chart I-13). This makes it attractive from a strategic perspective. Usually, the Swiss franc tends to be more of a dormant currency, gently appreciating towards fair value but periodically interspersed with bouts of intense volatility. Interestingly, we may be entering such a riot point. The VIX is low and countries are reintroducing lockdowns, yet overall sentiment remains unequivocally bullish. Finally, Switzerland ticks off all the characteristics of a safe-haven currency. As such, while the dollar has benefited from its reserve status, the franc remains an appropriate hedge in any currency portfolio. In a nutshell, our recommendations are as follows: USD/CHF will stay under parity. EUR/CHF can hit 1.2. NZD/CHF is a sell in the short-term. So is GBP/CHF. The Scandinavian currencies will outperform the franc on a 12-18 month horizon. Chester Ntonifor Foreign Exchange Strategist chestern@bcaresearch.com Currencies U.S. Dollar Chart II-1USD Technicals 1
USD Technicals 1
USD Technicals 1
Chart II-2USD Technicals 2
USD Technicals 2
USD Technicals 2
US economic data has been spectacular this week: Starting with the jobs report, the US added 916K jobs in March versus a consensus of 660K jobs. The unemployment rate fell from 6.2% to 6% and wages increased by 4.2% year-on-year. The boost to domestic demand dented the trade balance. The deficit widened from $68.2bn to $71.1bn in February. The FOMC minutes were a non event for markets. The DXY index is giving back some of the gains it accumulated this year, rising over 1% this week. With the US 10-year yield now facing strong resistance near the 1.7% level, the case for a stronger USD is fading. As consensus forecasts coagulate towards a stronger USD, positioning has also been reset towards USD long positions auguring for some volatility in the months ahead. Report Links: Arbitrating Between Dollar Bulls And Bears - March 19, 2021 The Dollar Bull Case Will Soon Fade - March 5, 2021 Are Rising Bond Yields Bullish For The Dollar? - February 19, 2021 The Euro Chart II-3EUR Technicals 1
EUR Technicals 1
EUR Technicals 1
Chart II-4EUR Technicals 2
EUR Technicals 2
EUR Technicals 2
Recent data from the euro area are mending: The Sentix investor index catapulted from 5 to 13.1 in April. The Eurozone remains the unsung hero in this recovery. PPI increased to 1.5% year-on-year in February from 0% last month. The euro rose by 1.2% against the dollar this week. To be clear, there are still stale euro longs among more fundamental holders of the currency. This suggests the flushing out of weak hands has more to go. However, the balance of evidence suggests euro area data could reward long positions later this year. Report Links: Portfolio And Model Review - February 5, 2021 On Japanese Inflation And The Yen - January 29, 2021 The Dollar Conundrum And Protection - November 6, 2020 Japanese Yen Chart II-5JPY Technicals 1
JPY Technicals 1
JPY Technicals 1
Chart II-6JPY Technicals 2
JPY Technicals 2
JPY Technicals 2
Recent data from Japan has been improving: PMI indices remain under 50, but reflect a possible coiled-spring rebound underway. Consumer confidence rebounded from 33.8 to 36.1 in March. The Eco Watchers survey was also encouraging. Sentiment rebounded from 41.3 to 49 in March. The Japanese yen rose by 1.24% against the US dollar this week, and remains the strongest G10 currency in recent trading days. Falling yields have seen Japanese investors retreat from overseas markets such as the UK, pushing up the yen. Speculative positioning is also net yen bearish, which is constructive from a contrarian standpoint. Report Links: The Dollar Bull Case Will Soon Fade - March 5, 2021 On Japanese Inflation And The Yen - January 29, 2021 The Dollar Conundrum And Protection - November 6, 2020 British Pound Chart II-7GBP Technicals 1
GBP Technicals 1
GBP Technicals 1
Chart II-8GBP Technicals 2
GBP Technicals 2
GBP Technicals 2
Recent data out of the UK have been positive: Car registrations are picking up smartly, suggesting durable demand might be returning to the UK. Registrations rose 11.5% year-on-year in March versus -35.5% the year before. The UK construction PMI hit a high of 61.7, the highest since 2014. The pound fell by almost 2% versus the euro this week. The violent correction in EURGBP might be a harbinger of the rotation brewing for both UK and US assets versus their global counterparts. Stay tuned. Report Links: Portfolio And Model Review - February 5, 2021 The Dollar Conundrum And Protection - November 6, 2020 Revisiting Our High-Conviction Trades - September 11, 2020 Australian Dollar Chart II-9AUD Technicals 1
AUD Technicals 1
AUD Technicals 1
Chart II-10AUD Technicals 2
AUD Technicals 2
AUD Technicals 2
Recent data in Australia was robust: The RBA kept rates unchanged at 0.1%. Both the services and manufacturing PMIs remained at an expansionary 55.5 level. The Aussie rose by 0.4% this week. We like the AUD, and are long AUD/NZD as a trade. However, the outperformance of the US economy is also handsomely rewarding AUD/MXN shorts. Mexico benefits a lot more from a pick-up in the US economy than Australia. Report Links: The Dollar Bull Case Will Soon Fade - March 5, 2021 Portfolio And Model Review - February 5, 2021 Australia: Regime Change For Bond Yields & The Currency? - January 20, 2021 New Zealand Dollar Chart II-11NZD Technicals 1
NZD Technicals 1
NZD Technicals 1
Chart II-12NZD Technicals 2
NZD Technicals 2
NZD Technicals 2
Recent data out of New Zealand have been positive: The ANZ commodity price index ticked up by 6.1% in March. ANZ Business confidence deteriorated in March. The activity outlook fell from 16.6 to 16.4 and confidence fell from -4.1 to -8.4. The New Zealand dollar rose by 60bps against the US dollar this week. New Zealand will start taking the back seat in the coming economic rotation as other economies play catch up. The improvement in kiwi terms of trade has been a boon for the currency, and will limit downside on NZD. However, shorting the NZD at the crosses remains an attractive proposition. Report Links: Portfolio And Model Review - February 5, 2021 Currencies And The Value-Versus-Growth Debate - July 10, 2020 Updating Our Balance Of Payments Monitor - November 29, 2019 Canadian Dollar Chart II-13CAD Technicals 1
CAD Technicals 1
CAD Technicals 1
Chart II-14CAD Technicals 2
CAD Technicals 2
CAD Technicals 2
There was scant data out of Canada this week: The Bloomberg Nanos confidence index continues to suggest that Canadian GDP will surprise to the upside. The index rose from 63.7 to 64.1 last week. Demand for Canadian goods remains robust. The trade surplus came in at C$1.04bn in February. The Ivey purchasing managers’ index catapulted to 72.9 from 60 in March. The Canadian dollar was flat against the US dollar this week. While this might come as a surprise, three reasons explain this performance. First, the loonie is one of the best-performing G10 currencies this year and some specter of rotation was in play this week. Second, the correction in oil prices hurt the loonie. Finally, should US economic optimism become more widespread, other currencies could benefit. Report Links: Will The Canadian Recovery Lead Or Lag The Global Cycle? - February 12, 2021 Currencies And The Value-Versus-Growth Debate - July 10, 2020 More On Competitive Devaluations, The CAD And The SEK - May 1, 2020 Swiss Franc Chart II-15CHF Technicals 1
CHF Technicals 1
CHF Technicals 1
Chart II-16CHF Technicals 2
CHF Technicals 2
CHF Technicals 2
There was scant data out of Switzerland this week: Sight deposits were relatively flat at CHF700bn last week. The Swiss Franc rose by 2% against the US dollar this week. This week’s piece is dedicated to the possibility that the franc has a coiled-spring rebound in the near term. Safe-haven currencies are now benefitting from the drop in yields, while the franc has underperformed other currencies this year. This is welcome news for the SNB. We have been long EUR/CHF on this expectation, and recommend investors stick with this trade. Report Links: Portfolio And Model Review - February 5, 2021 The Dollar Conundrum And Protection - November 6, 2020 On The DXY Breakout, Euro, And Swiss Franc - February 21, 2020 Norwegian Krone Chart II-17NOK Technicals 1
NOK Technicals 1
NOK Technicals 1
Chart II-18NOK Technicals 2
NOK Technicals 2
NOK Technicals 2
There was scant data out of Norway this week: The March DNB manufacturing PMI came in at 56.1 from 57.5. Industrial production rose by 5.9% year-on-year versus expectations of a 1.5% increase. The NOK rose by 0.75% against the dollar this week. Norway has handled the Covid-19 crisis admirably and it is an added boon that oil prices, a key export and income valve for Norway, are rising smartly. This has prompted the Norges bank to rapidly bring forward rate hike expectations. This leaves little scope for the NOK to fall durably. We are long the Norwegian krone as a high-conviction bet against both the dollar and the euro. Report Links: Portfolio And Model Review - February 5, 2021 Revisiting Our High-Conviction Trades - September 11, 2020 A New Paradigm For Petrocurrencies - April 10, 2020 Swedish Krona Chart II-19SEK Technicals 1
SEK Technicals 1
SEK Technicals 1
Chart II-20SEK Technicals 2
SEK Technicals 2
SEK Technicals 2
Swedish data releases were above expectations: The Swedbank manufacturing PMI came in at 63.7 in March versus expectations of 62.5. Industrial orders came in at 8.5% year-on-year versus expectations of 5.3% in February. The Swedish krona rose by 2% this week ranking it as the best performing G10 currency. Sweden needs to do a better job at containing the Covid-19 crisis, which will unlock tremendous value in the krona. As a positive, the global manufacturing cycle continues humming and will buffeting Swedish industrial production. Report Links: Revisiting Our High-Conviction Trades - September 11, 2020 Updating Our Balance Of Payments Monitor - November 29, 2019 Where To Next For The US Dollar? - June 7, 2019 Trades & Forecasts Forecast Summary Core Portfolio Tactical Trades Limit Orders Closed Trades
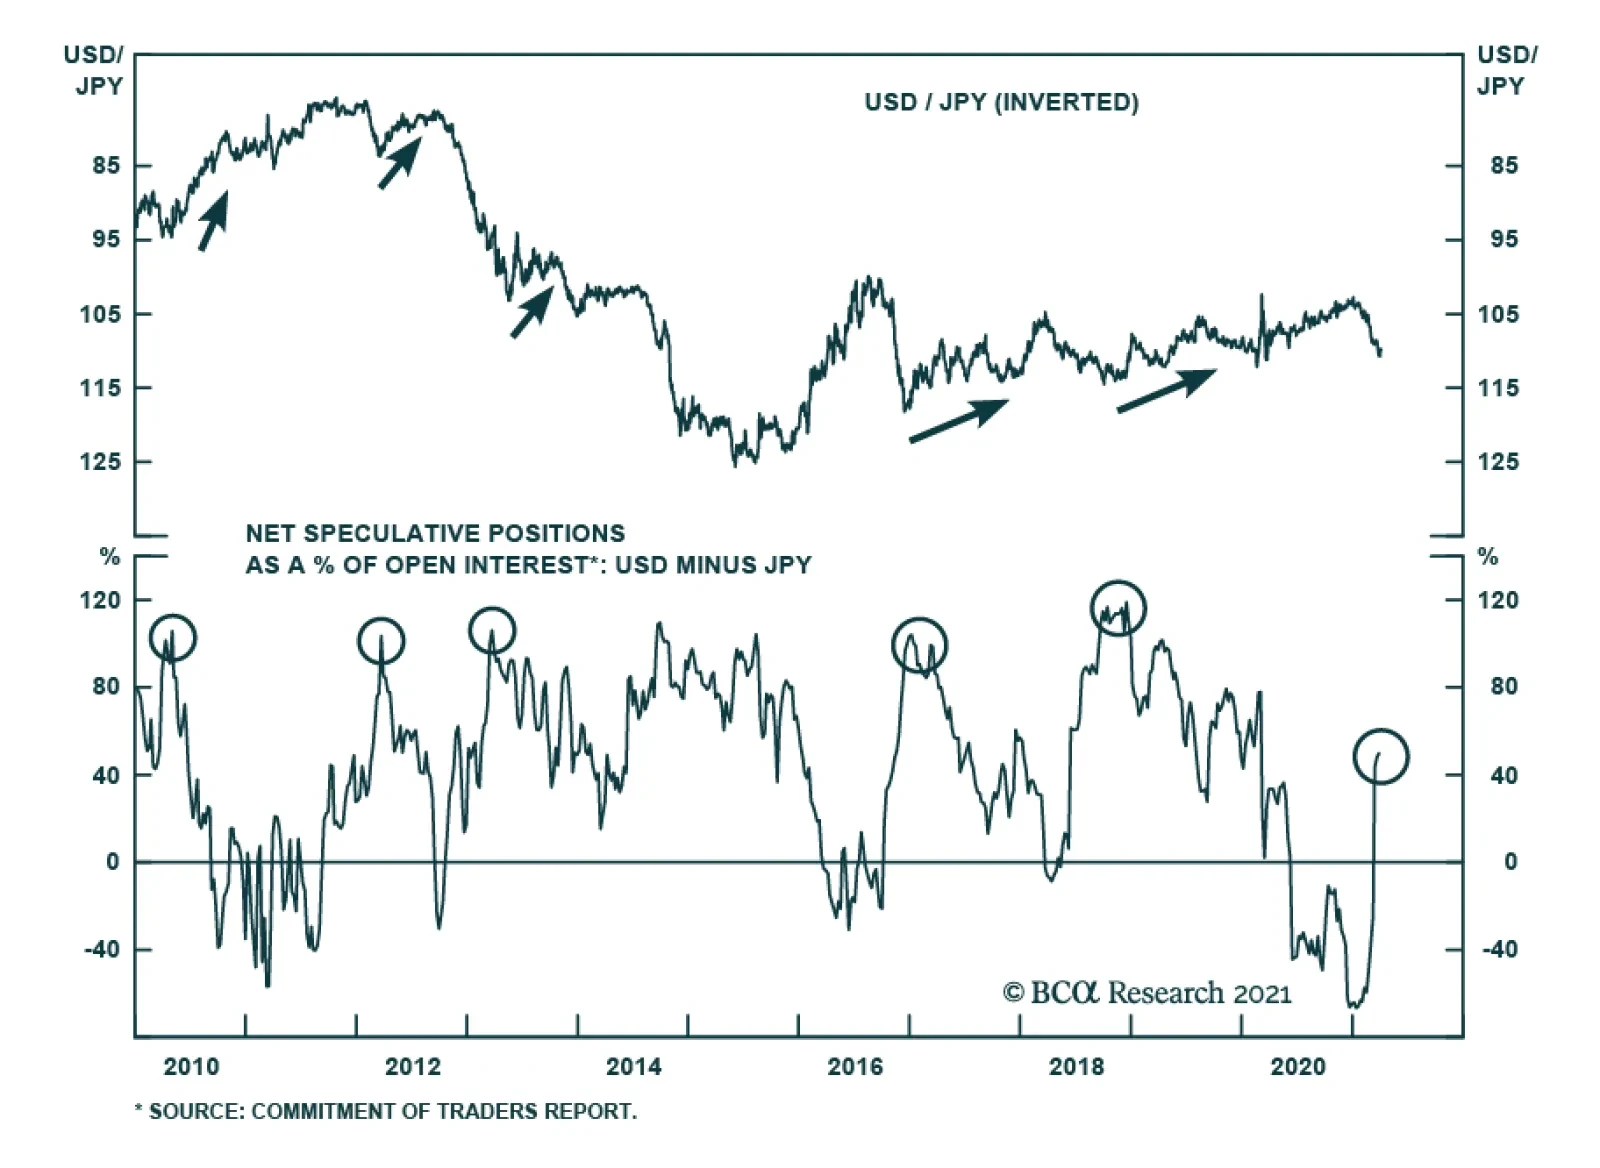
The yen has been the worst performing G10 currency this year, falling 5.4% versus the US dollar since the beginning of the year. However, it bottomed on March 31 and has since gained 1.4%, making it among the best performers in April thus far. Several factors…
Highlights Cryptocurrencies are the ‘digital gold’. Long-term investors should hold cryptocurrencies and gold in inverse proportion to their volatilities. On this basis, cryptocurrencies should take around a quarter of the $15 trillion anti-fiat asset market, taking the bitcoin price to around $120,000. Own a diversified basket of cryptocurrencies, including an eco-friendlier ‘proof of stake’ cryptocurrency such as Ethereum. As cryptocurrencies take a larger share of the anti-fiat market, gold’s massive anti-fiat premium versus silver and platinum will collapse. Structural recommendation: overweight silver and platinum versus gold. Structurally underweight gold miners, both versus other miners and versus the market. Feature Feature ChartEach Time People Thought Bitcoin Was In A Bubble, They Were Wrong
Each Time People Thought Bitcoin Was In A Bubble, They Were Wrong
Each Time People Thought Bitcoin Was In A Bubble, They Were Wrong
This Special Report presents the long-term investment case for cryptocurrencies. It is the transcript of twenty questions and answers that made up a recent conversation with a sceptical client. 1. I am sceptical of cryptocurrencies. Specifically, I think that bitcoin is dirty, slow, volatile, and impractical. Are you going to convince me otherwise? Yes, I’m going to tell you that those criticisms are misunderstandings, or, at least, irrelevant to the long-term investment case. 2. Ok, let me ask the $57,000 question. Is bitcoin in a bubble? No, bitcoin is not in a bubble. Though to be clear, its price could fall sharply from its current overbought position. Bitcoin’s price has collapsed by 80 percent on three separate occasions: in 2011, 2014, and 2018. Each time, people said the bitcoin bubble had burst, and each time they were wrong. Each time, bitcoin recouped its losses within a couple of years and went on to new highs. On a long-term horizon, I expect the same to happen again (Feature Chart). Cryptocurrencies Are The ‘Digital Gold’ 3. So, what is the long-term investment case for owning bitcoin and other cryptocurrencies? Cryptocurrencies are the ‘digital gold’. So long as we have a fiat money system, there will be demand for an ‘anti-fiat’ asset that is a hedge against a debasement of the fiat money system. For decades, the dominant anti-fiat asset has been gold. But cryptocurrencies are the new kid on the block threatening gold’s dominance. So far, cryptocurrencies account for just 10 percent of the $15 trillion anti-fiat market. As this share doubles or trebles, it arithmetically requires a doubling or trebling of cryptocurrency prices. 4. New cryptocurrencies seem to appear every day. How can the limitless number of cryptocurrencies be compared with gold, whose supply is limited? Although the number of cryptocurrencies is unlimited, the total cryptocurrency money supply is limited by the amount of energy expended to mine them. As a useful analogy, each cryptocurrency is like a separate gold miner. While there could be an unlimited number of gold miners, there could not be an unlimited supply of gold. 5. But a cryptocurrency has no intrinsic value, right? Right, but a fifty pound note has no intrinsic value either. It’s just a bit of paper. The value of a fifty pound note – or any fiat money for that matter – is the trust that you place in the government and the central bank to maintain its value. Likewise, the value of a bitcoin is the trust that you place in the blockchain to maintain its long-term value – so it’s really like an alternative trust system to the trust you place in the fiat monetary system. In fact, the blockchain is often called ‘the trust machine’. 6. Yet gold does have an intrinsic value. I can always melt it down and wear it as valuable jewellery, which makes it a superior anti-fiat asset, right? No, this is a misunderstanding. Gold does have an intrinsic value, but it is a small fraction of its $1700/oz price. Gold’s intrinsic value is a small fraction of its $1700/oz price. The proof comes from comparing the precious metal price ratios with their (inverse) mining ratios. For the other precious metals – silver and platinum – the price ratio lines up broadly with the mining ratio, as it should (Chart I-2). But gold is the outlier, trading at a massive premium to its mining ratio. For example, the gold/silver price ratio at 70 compares with a mining ratio of 7.5, a near tenfold premium (Chart I-3). So, most of gold’s value comes from its status as the dominant anti-fiat asset. Chart I-2Platinum To Silver Trades Broadly In Line With Its Mining Ratio
Platinum To Silver Trades Broadly In Line With Its Mining Ratio
Platinum To Silver Trades Broadly In Line With Its Mining Ratio
Chart I-3Gold To Silver Trades At A Massive Premium To Its Mining Ratio
Gold To Silver Trades At A Massive Premium To Its Mining Ratio
Gold To Silver Trades At A Massive Premium To Its Mining Ratio
7. Hasn’t the gold/silver price ratio always been this elevated? No, through the many centuries that gold and silver had equal monetary status, the gold/silver price ratio tracked its mining ratio of around 15. Gold’s massive premium arose only when it became the dominant anti-fiat asset – first, when the gold standard collapsed in 1931 and then, when the Bretton Woods ‘pseudo gold standard’ collapsed in 1971. Proving that most of the current value of gold is its value as the dominant anti-fiat asset (Chart I-4). Chart I-4Gold’s Massive Premium Is Due To Its Status As The Dominant Anti-Fiat Asset
Why Cryptocurrencies Are Here To Stay And Bitcoin Is Worth $120,000
Why Cryptocurrencies Are Here To Stay And Bitcoin Is Worth $120,000
8. But unlike gold, cryptocurrencies trade like extreme risk-assets, so are they suitable for a conservative investor, like me? Conservative investors like you have no qualms holding gold even though it can suffer significant drawdowns, such as a 30 percent loss in 2013 and a near 20 percent loss through the past six months (Chart I-5). Of course, cryptocurrencies can suffer even bigger drawdowns, but this can be addressed by position sizing. Specifically, holding $1 of cryptocurrency for every $3 of gold will equalise the drawdown risks from the two anti-fiat assets. Chart I-5Gold Can Suffer Significant Drawdowns
Gold Can Suffer Significant Drawdowns
Gold Can Suffer Significant Drawdowns
Countering The Counterarguments 9. Now we come to the elephant in the room. Even if I accept that cryptocurrencies are the ‘digital gold’, mining these cryptocurrencies consumes as much energy as a small country. Isn’t this a huge problem? No, this is another misunderstanding. There is nothing wrong with using energy, and it is up to the market – rather than governments or self-proclaimed experts – to decide how to allocate our energy consumption. Remember that we are becoming less energy-intensive in other parts of our lives, so if the market deems that a certain proportion of energy consumption is well served to secure a superior anti-fiat asset, then that’s fine. Thinking more broadly, intermediation functions like banking and legal services account for around two percent of world GDP, while energy production accounts for five percent. So, if the blockchain could carry out that intermediation more efficiently and securely, then society could justify the blockchain consuming two fifths of the world’s energy. 10. Ok, but what about the dirty energy that cryptocurrency mining consumes, and the damage it does to the environment? Yes, dirty energy is a problem but let’s address it by banning or taxing dirty energy! And let’s have a fair comparison. Gold mining might consume less energy than cryptocurrency mining, but it devastates the environment via the 99 percent of extracted ore that is dumped as waste, landscape destruction, acid mine drainage, and mercury production. Not to mention the tremendous energy needed to transport gold. None of these dirty issues apply to cryptocurrencies. Ultimately, the blockchain is a force for good because, unlike the internal combustion engine or mining, it can be a hundred percent environmentally friendly. Moreover, compared to the usual ‘proof of work’ protocol to secure a transaction, the emerging ‘proof of stake’ protocol removes the advantage to the most powerful computers, and thereby consumes much less energy. 11. But the fiat currency system does just fine. And gold does just fine for those who want an anti-fiat currency asset. So, isn’t bitcoin just a ‘solution in search of a problem’? Almost every innovation is a ‘solution in search of a problem!’ Before aeroplanes, weren’t we doing just fine with ships and trains? And before the internet, weren’t we doing just fine with information disseminated by governments and major media and publishing companies? Then the internet decentralised and democratised information, and transformed every aspect of our lives. In the same way, the blockchain, which decentralises and democratises trust, can also transform every aspect of our lives. The same criticisms that are being thrown at the blockchain today were being thrown at the internet in the early 1990s. The same criticisms that are being thrown at the blockchain today were being thrown at the internet in the early 1990s. That the internet was slow, impractical, used mostly by criminals for nefarious purposes, that no reputable company would use it, that nobody would put their personal data or credit card details on it, and so on. I guess this shows that most people cannot comprehend an innovation until they experience its transformative impact. 12. Ok, I’m all for innovation, but isn’t central bank digital currency a better alternative to cryptocurrency? Absolutely not! The whole point of an anti-fiat asset is that it must be completely immune to government and central bank manipulation. 13. I still have some worries. First, can’t governments just ban cryptocurrencies? It would be something that I would expect in North Korea, but not in a liberal democracy like the UK or the US. Apart from anything else, it would be counterproductive – because the act of banning the anti-fiat asset would be the very act that would cause a surge in its demand! The better course for governments is to demonstrate, in fair competition, that fiat money is as trustworthy as anti-fiat money. 14. Ok, what about governments taxing cryptocurrency transactions? Again, I think that the best course of action is for governments not to penalise anti-fiat money. But even if they did impose a transaction tax, it wouldn’t diminish cryptocurrencies’ anti-fiat status. After all, most people don’t own gold to carry out day-to-day transactions with it! 15. One last worry: could quantum computing wipe out the blockchain and cryptocurrencies? The mathematical protocols would have to become orders of magnitude more difficult, but the over-arching concept of a decentralised peer-to-peer network to validate ownership and transactions would remain. The Investment Conclusions 16. Ok, let’s get to the investment conclusions. First, how should I value bitcoin and the cryptocurrency asset-class? The immediate question is, what share of the $15 trillion anti-fiat market should cryptocurrencies take? Our answer is that, in order to equalise drawdown risk, investors should hold cryptocurrencies and gold in inverse proportion to their drawdown magnitudes (or volatility). As cryptocurrency drawdowns tend to be three times as large as gold drawdowns, this means holding $1 of cryptocurrency for every $3 of gold (Chart I-6 and Chart I-7). Chart I-6Drawdowns Suffered ##br##By Bitcoin...
Drawdowns Suffered By Bitcoin...
Drawdowns Suffered By Bitcoin...
Chart I-7...Tend To Be Three Times As Large As Drawdowns Suffered By Gold
...Tend To Be Three Times As Large As Drawdowns Suffered By Gold
...Tend To Be Three Times As Large As Drawdowns Suffered By Gold
In other words, based on current volatilities, cryptocurrencies should take around a quarter of the anti-fiat market, or around double the current market share. Assuming a constant market size, and a uniform uplift to all cryptocurrencies, this would double all cryptocurrency prices, taking bitcoin to around $120,000. Cryptocurrencies should take around a quarter of the anti-fiat market, or around double the current market share. Of course, as cryptocurrencies become more established and their volatilities diminish, their share of the anti-fiat market can rise, taking their prices even higher. 17. Will all cryptocurrencies succeed? No. Just as gold miners take market share from each other, cryptocurrencies will also take market share from one another. Hence, it is important to own a diversified basket of cryptocurrencies. At the very least, it is important to have some exposure to an eco-friendlier ‘proof of stake’ cryptocurrency such as Ethereum. Given its greener credentials, ‘proof of stake’ may take the dominant market share in the coming years. 18. Will cryptocurrencies eventually replace fiat money? Not necessarily. As previously explained, fiat money and cryptocurrencies are just competing trust systems. So long as governments and central banks maintain our trust in fiat money, there is no reason to replace fiat money. 19. Does this have any implications for inflation? Yes. With cryptocurrencies as a competing trust system, the only way for governments and central banks to maintain our trust in fiat money is not to debase its value. In other words, cryptocurrencies are the new vigilantes to prevent rampant inflation. 20. What are the structural implications for gold and other precious metals? As cryptocurrencies take a larger share of the anti-fiat market, gold’s massive anti-fiat premium versus silver and platinum will collapse. Hence, a compelling long-term position is to overweight silver and platinum versus gold (Chart I-8). Chart I-8Structurally Overweight Silver And Platinum Versus Gold
Structurally Overweight Silver And Platinum Versus Gold
Structurally Overweight Silver And Platinum Versus Gold
Long-term equity investors should underweight gold miners, both versus other miners and versus the market. Dhaval Joshi Chief Strategist dhaval@bcaresearch.com
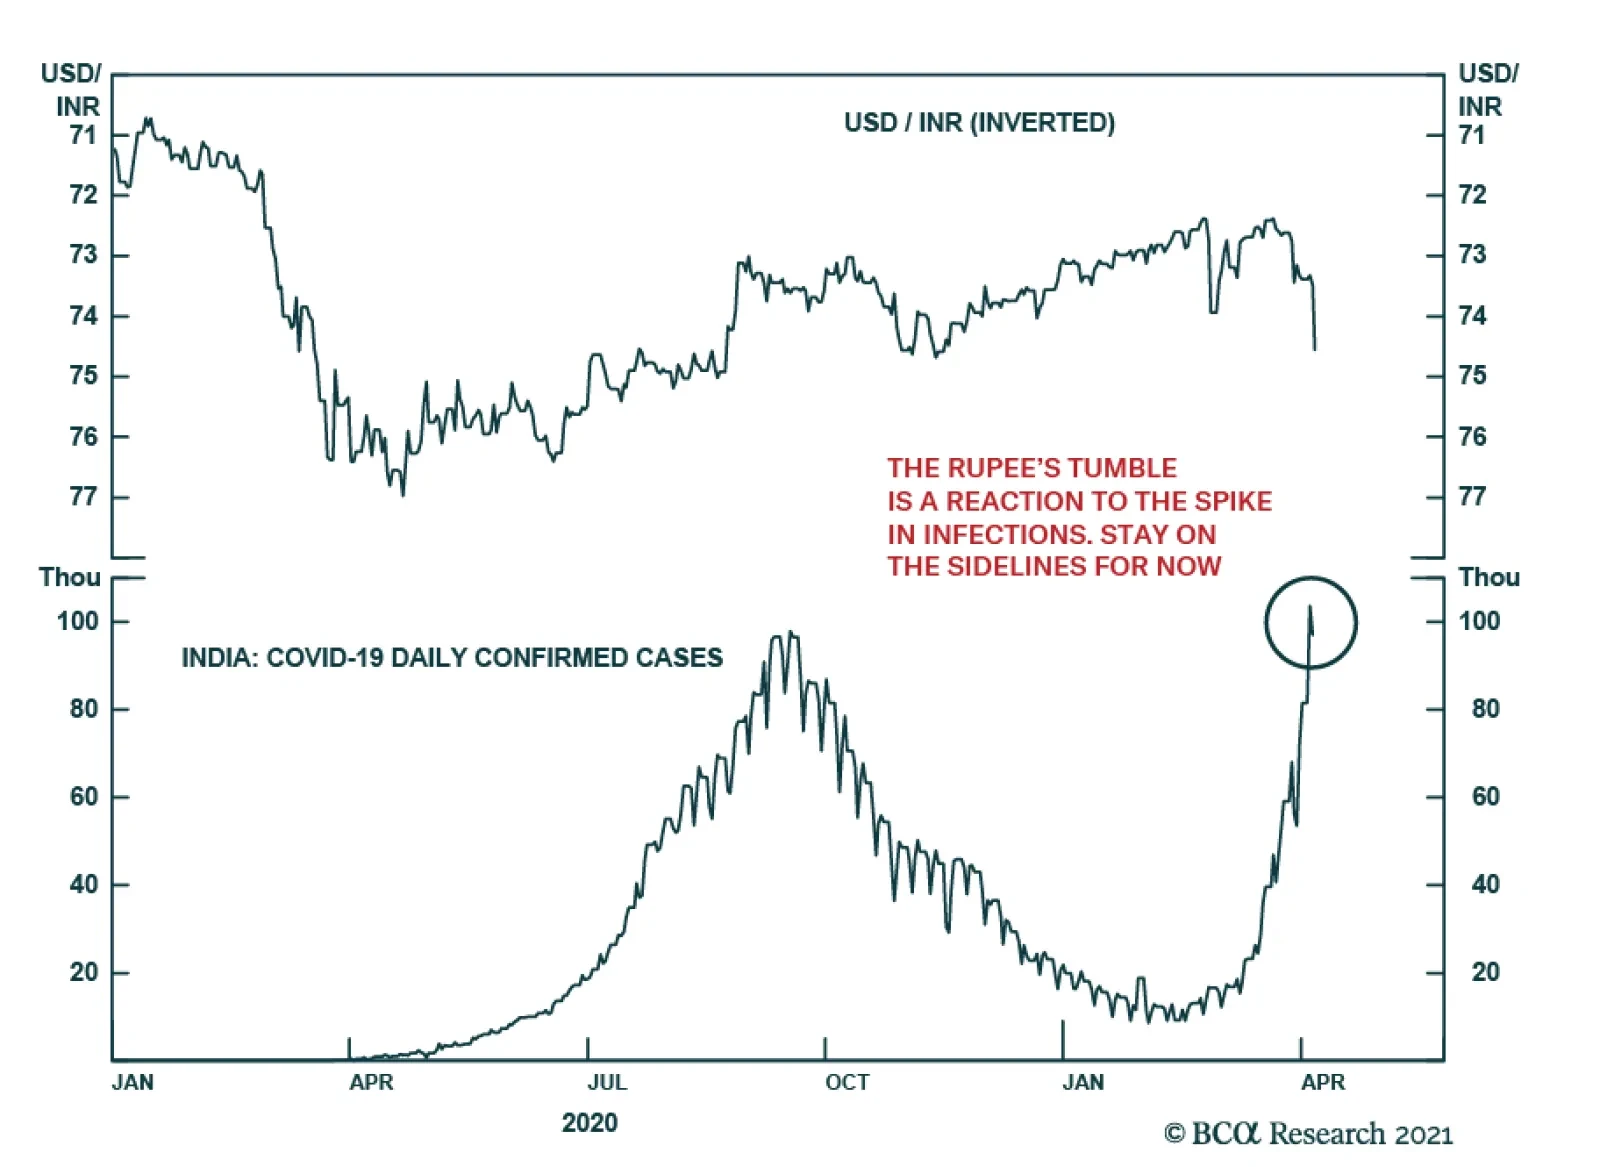
As expected, the Reserve Bank of India kept the benchmark repurchase rate unchanged at 4% at its Wednesday meeting. Nonetheless, the RBI managed to surprise investors by announcing plans to purchase up to one trillion rupees ($14 billion) of bonds this…
Feature The selloff in Chinese stocks since mid-February reflects a rollover in earnings growth and multiples. Lofty valuations in Chinese equities driven by last year’s massive stimulus means that stock prices are vulnerable to any pullback in policy supports (Chart 1A and 1B). Chart 1AGrowth In Chinese Investable Earnings And Multiple Expansions Has Rolled Over
Growth In Chinese Investable Earnings And Multiple Expansions Has Rolled Over
Growth In Chinese Investable Earnings And Multiple Expansions Has Rolled Over
Chart 1BEarnings Outlook Still Looks Promising In The Onshore Market, But May Soon Peak
Earnings Outlook Still Looks Promising In The Onshore Market, But May Soon Peak
Earnings Outlook Still Looks Promising In The Onshore Market, But May Soon Peak
After diverging in the past seven to eight months, Chinese stocks have started to gravitate towards deteriorating monetary conditions index. The market may be beginning to price in a peak in economic as well as corporate profit growth (Chart 2). Defensive stocks in China’s onshore and offshore equity markets have also outperformed cyclicals since February, which confirms that investors expect earnings growth will slow in the coming months (Chart 3). A tighter monetary policy stance, coupled with increased regulations targeting the real estate, banking, and tech sectors have further dampened investors’ appetite for Chinese stocks. Chart 2A-Share Prices Start To Gravitate Towards Tightening Monetary Conditions
A-Share Prices Start To Gravitate Towards Tightening Monetary Conditions
A-Share Prices Start To Gravitate Towards Tightening Monetary Conditions
Chart 3Defensives Have Prevailed Over Cyclicals In Both Onshore And Offshore Markets
Defensives Have Prevailed Over Cyclicals In Both Onshore And Offshore Markets
Defensives Have Prevailed Over Cyclicals In Both Onshore And Offshore Markets
The official PMIs bounced back smartly in March following three consecutive months of decline. However, the strong PMI readings do not change our view that the speed of China’s economic recovery is near its zenith. PMIs in the first two months of the year are typically lower due to the Lunar New Year (LNY), and the improvement in March’s PMI did not exceed seasonal rebounds experienced in previous years. Weakening fixed-asset investments also indicate that economic activity is moderating. We remain cautious on the 6 to 12-month outlook for Chinese stocks, in both absolute and relative terms. Qingyun Xu, CFA Associate Editor qingyunx@bcaresearch.com Jing Sima China Strategist jings@bcaresearch.com China’s NBS manufacturing and non-manufacturing PMIs in March beat market expectations with sharp rebounds after moderating in the previous three months. The improvement in the PMIs will likely provide authorities with confidence to stay the course on policy normalization. The methodology calculating PMI indexes reflects the net reported improvement in business activities relative to the previous month and there was a notable decline in PMIs in February, due to the LNY holiday and travel restrictions related to the spread of COVID-19. Additionally, the average reading of China’s official composite PMI in Q1 this year was 2.2 percentage points lower than in Q4 last year and weaker than the Q1 PMI figures in most of the pre-pandemic years. Moreover, Chinese Caixin manufacturing PMI, which focuses on smaller and private corporates, declined further in March as it continued its downward trend started in December 2020. Chart 4Q1 PMIs Slowed By More Than Seasonal Factors
Q1 PMIs Slowed By More Than Seasonal Factors
Q1 PMIs Slowed By More Than Seasonal Factors
Chart 5Caixin PMI Shows Further Deterioration Among Private-Sector Manufacturers
Caixin PMI Shows Further Deterioration Among Private-Sector Manufacturers
Caixin PMI Shows Further Deterioration Among Private-Sector Manufacturers
Growth in credit expansions in February was better than expected, supported by a substantial increase in corporates’ demand for medium- and long-term loans. Travel restrictions during this year’s LNY led to a shorter holiday, a faster resumption in manufacturing activity after the break and stronger credit demand in February. China’s Monetary Policy Committee meeting last week reiterated the authorities’ hawkish policy tone and removed dovish language prevalent in last month’s National People’s Congress, such as “maintaining the consistency, stability, and sustainability in monetary policy” and “not making a sudden turn in policymaking.” Given the strong headline economic and credit data in January and February, the authorities will be unlikely to slow normalizing monetary policy. Therefore, the risk of a policy-tightening overshoot remains high. The PBoC has continued to drain net liquidity in the interbank system since early this year, evidenced by falling excess reserves at the central bank. Excess reserves normally lead the credit impulse by about six months, signaling that the latter will continue to decelerate in the months ahead. In turn, the credit impulse normally leads the business cycle by six to nine months, meaning that China’s cyclical economic recovery will likely peak in the first half of 2021. Chart 6Corporates Demand For Longer-Term Bank Loans Resumed Their Upward Trend Early This Year
Corporates Demand For Longer-Term Bank Loans Resumed Their Upward Trend Early This Year
Corporates Demand For Longer-Term Bank Loans Resumed Their Upward Trend Early This Year
Chart 7Falling Excess Reserves Leads To A Deceleration In Credit And Economic Growth
Falling Excess Reserves Leads To A Deceleration In Credit And Economic Growth
Falling Excess Reserves Leads To A Deceleration In Credit And Economic Growth
Robust industrial activities and improving profitability helped to boost profit growth in January and February. The bounce in producer prices also drove up returns in industrial output, particularly in upstream industries loaded with commodity producers. Nevertheless, weak final demand is limiting the ability of Chinese producers to pass on higher prices to domestic consumers, highlighted in the divergence between Chinese PPI and CPI. In addition, China’s domestic demand for commodities and industrial metals may reach its cyclical peak in mid-2021, following ongoing credit tightening and reduced economic activity. Commodity inventories have surged to historical highs due to soaring imports (which far exceeded consumption) during 2H20. Inventory destocking pressures will weigh on commodity prices with China’s domestic demand reaching its cyclical peak. Disinflation/deflation pressures may re-emerge in 2H21, which will pose downside risks to China’s industrial profits. Chart 8Industrials Posted A Strong Rebound In The First Two Months of 2021
Industrials Posted A Strong Rebound In The First Two Months of 2021
Industrials Posted A Strong Rebound In The First Two Months of 2021
Chart 9Surging Commodity Prices Helped To Boost Upstream Industry Profits
Surging Commodity Prices Helped To Boost Upstream Industry Profits
Surging Commodity Prices Helped To Boost Upstream Industry Profits
Chart 10Domestic Final Demand Remains Sluggish
Domestic Final Demand Remains Sluggish
Domestic Final Demand Remains Sluggish
Chart 11Decelerating Chinese Credit Growth Poses Downside Risks To Global Commodity Prices
Decelerating Chinese Credit Growth Poses Downside Risks To Global Commodity Prices
Decelerating Chinese Credit Growth Poses Downside Risks To Global Commodity Prices
Chart 12Chinas Raw Material Inventory Restocking Cycle May Be Near A Cyclical Peak
Chinas Raw Material Inventory Restocking Cycle May Be Near A Cyclical Peak
Chinas Raw Material Inventory Restocking Cycle May Be Near A Cyclical Peak
Chart 13Real Estate And Infrastructure Investment Losing Steam In 2021
Real Estate And Infrastructure Investment Losing Steam In 2021
Real Estate And Infrastructure Investment Losing Steam In 2021
Investments in infrastructure and real estate drove China’s economic recovery in the second half of 2020. However, growth momentum in both sectors has slowed because of retreating government spending in infrastructure and tightening regulations in the property sector. Both home sales and housing prices, especially in tier-one cities, rose significantly in January-February this year, deepening authorities’ concerns over bubble risks in the property market. The share of mortgages, deposits and advanced payments as a source of funds for property developers reached an all-time high in February. Following the LNY, the authorities introduced a slew of new restrictions on the housing market to curb excessive demand. These were in addition to placing limits on bank lending to both property developers and household mortgages. All of these measures will weigh on housing supply and demand, and the impact is already evident in falling land purchases and housing starts. At the same time, property developers are rushing to complete existing projects. The tighter regulations on real estate financing will likely weaken growth in real estate investment and construction activities in the second half of this year. Chart 14Housing Prices In Top-Tier Cities Have Been On A Tear …
Housing Prices In Top-Tier Cities Have Been On A Tear
Housing Prices In Top-Tier Cities Have Been On A Tear
Chart 15… But Bank Lending To Developers And Mortgage Loans Continue Downward Trend
But Bank Lending To Developers And Mortgage Loans Continue Downward Trend
But Bank Lending To Developers And Mortgage Loans Continue Downward Trend
Chart 16Property Developers Are Rushing To Sell And Complete Existing Projects
Property Developers Are Rushing To Sell And Complete Existing Projects
Property Developers Are Rushing To Sell And Complete Existing Projects
Chart 17Forward-Looking Indicators Suggest A Slowdown In Housing And Construction Activities
Forward-Looking Indicators Suggest A Slowdown In Housing And Construction Activities
Forward-Looking Indicators Suggest A Slowdown In Housing And Construction Activities
Table 1China Macro Data Summary
China Macro And Market Review
China Macro And Market Review
Table 2China Financial Market Performance Summary
China Macro And Market Review
China Macro And Market Review
Footnotes Cyclical Investment Stance Equity Sector Recommendations
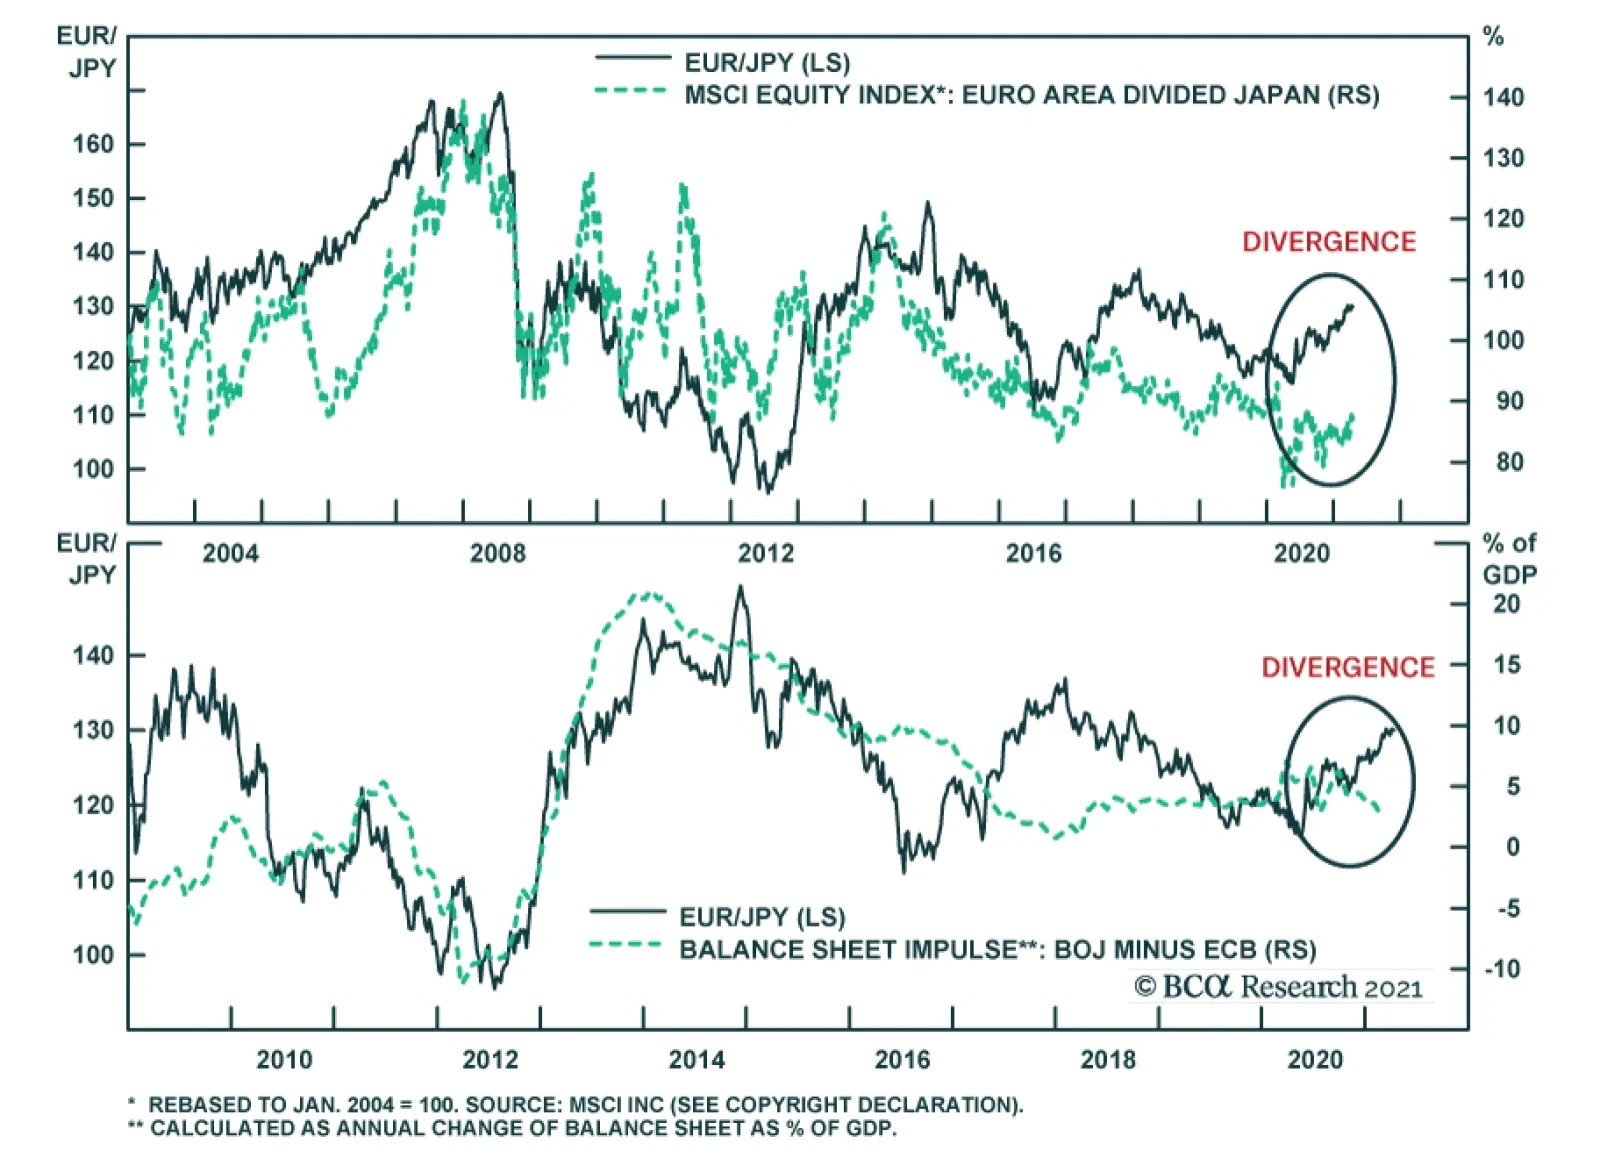
BCA Research’s Foreign Exchange Strategy service concludes that the dollar remains in a sweet spot for now, but it could nonetheless experience violent moves in the coming weeks. Thus, they are opening a short EUR/JPY position as a portfolio hedge. The…