Currencies

Highlights The lack of dollar liquidity has been a tailwind behind the dollar bull market. Going forward, an end to a contraction in the Federal Reserve’s balance sheet should help stem the global shortage of dollars. Outside of a few basket cases, there remains scant evidence that the shortage of dollars has begun to trigger widespread negative feedback loops, symptomatic of a funding crisis. If the global economy picks up steam, a deterioration in the U.S. current account and rising FX reserves will improve the dollar liquidity situation. A trade war remains the key risk to this view. For the remainder of the year, portfolio managers should focus on relative value trades on the crosses rather than outright dollar bets. The European Central Bank’s resumption of quantitative easing could be paradoxically bullish for the euro beyond the near term. For now, stay short the euro versus a basket of petro-currencies. Feature At the center of the global financial architecture is the U.S. dollar and the Federal Reserve. The process behind the creation of dollars is a simple one, which goes as follows: In order to stimulate the U.S. economy, the authorities pursue macroeconomic policies that tend to weaken the dollar, such as lowering rates and/or running a wider fiscal deficit. The central bank helps finance this fiscal deficit via expanding the monetary base (seignorage). The drop in rates causes the yield curve to steepen. This incentivizes banks to lend, which in turn boosts U.S. money supply. As the economy recovers, and demand for imports (machinery, commodities, consumer goods) rises, the current account deficit widens. As a reserve currency, the U.S. trade deficit is settled in dollars. This leads to a flow of greenbacks outside U.S. borders. Wary of losing competitiveness via a rising exchange rate, other central banks will purchase these dollars from the private sector in exchange for local currency. The rise in foreign exchange reserves can be reinvested back into Treasurys and held in custody at the Fed, meaning that the current account deficit (or capital account surplus) finances the budget deficit. Call this an exorbitant privilege. The key question is whether dollar liquidity will ease over the near term or the shortage will intensify. A few factors suggest the former. The sum of the Fed’s custody holdings together with the U.S. monetary base constitutes the root of global dollar liquidity. Each time this measure has severely contracted, the reduction in dollars has triggered a blowup somewhere, typically among other countries running twin deficits (Chart I-1). For example, since the Global Financial Crisis, a fall in the growth of this measure below the critical zero line coincided with the European debt crisis, China’s slowdown, and more recently slowing global trade and a manufacturing recession. Importantly, the slowdown in global trade preceded escalation in trade tensions between the U.S. and China, meaning other endogenous factors were also at play. Lack of dollar liquidity was perhaps a factor. Chart I-1A Liquidity Squeeze Of Dollars
A Liquidity Squeeze Of Dollars
A Liquidity Squeeze Of Dollars
Chart I-2The U.S. Budget Deficit Needs To Be Financed
The U.S. Budget Deficit Needs To Be Financed
The U.S. Budget Deficit Needs To Be Financed
In the past, the Fed was quick to correct the situation: most episodes when the U.S. current account deficit was shrinking, the domestic economy was on the cusp of a slowdown or recession. This time around, easy fiscal policy and a trade-hawkish President have allowed the Fed to ignore the liquidity crisis happening outside the U.S. Key to this is that the lines are now blurred between how much of the trade slowdown is tariff escalation, and how much is due to endogenous factors. As a result, the Fed no longer felt obliged to intervene for markets outside the U.S., especially if the U.S. domestic economy was faring well. A shrinking U.S. current account deficit is incompatible with a resolution to the dollar crisis, especially as the greenback remains the global reserve currency (Chart I-2). On the surface, this is dollar bullish. Meanwhile, our geopolitical strategists contend that the trade war is just a symptom of a much larger battle for hegemonic supremacy, which will last for many years to come. However, the key question is whether dollar liquidity will ease over the near term or the shortage will intensify. A few factors suggest the former. Balance Sheet, Current Account And Foreign Debt Chart I-3The Contraction In Custody Holdings Is Over
The Contraction In Custody Holdings Is Over
The Contraction In Custody Holdings Is Over
The Fed’s tapering of asset purchases has been a net drain on global dollar liquidity. But that is slated to change. The Fed’s balance sheet peaked a nudge above US$4.5 trillion in early 2015 and has been falling since. This has triggered a severe contraction in the U.S. monetary base, and severely curtailed commercial banks’ excess reserves. The Federal Reserve’s custody holdings argue that this was a huge drag on international dollar liquidity, even worse than during the 2008 crisis (Chart I-3). The good news is that the Fed has ended the tapering of its balance sheet and has started cutting rates. This combination will improve dollar's liquidity going forward. Meanwhile, balance-of-payment dynamics are heading in the wrong direction. Over the next five years, the U.S. Congressional Budget Office (CBO) estimates that the U.S. budget deficit will swell to 4.8% of GDP. Assuming the current account deficit widens a bit and then stabilizes, this will pin the twin deficits at around 8% of GDP. This assumes no recession, which would have the potential to swell the deficit even further. Part of these deficits will need to be funded through money printing. One difference between now and the past is that over the last several years, the dollar has become expensive. The narrowing of the U.S. current account balance might therefore be over. The U.S. saw its twin deficits swell to almost 13% of GDP following the financial crisis. However, then the dollar was cheap and commodity currencies were overvalued, following a natural resource bust. One way to solve an overvaluation problem is to increase the supply of dollars. Dollar liquidity shortages tend to be vicious because they trigger negative feedback loops. As the velocity of international U.S. dollars rises, offshore dollar rates begin to rise, lifting the cost of capital for borrowing countries. Debt repayment replaces capital spending. Yet there is little evidence that a dollar shortage has been triggering this sort of negative feedback loop. U.S. dollar funding to external entities is growing by circa 4% a year and has slowed to a crawl among both developed and emerging markets (Chart I-4). Historically, this slowdown has been symptomatic of a funding crisis in EM. Yet this time around, there have been other forces at play: The growth in euro- and yen-denominated debt is exploding, which mirrors the gradual shift in the allocation of FX reserves away from dollars into other currencies. The growth in euro- and yen-denominated debt is exploding (Chart I-5). This is much smaller in outstanding amounts than U.S.-denominated debt, but mirrors the gradual shift in the allocation of FX reserves away from dollars into other currencies. If the U.S. has started to weaponize the U.S. dollar, foreign entities may have no other choice than to rally into other currency blocs, which may eventually entail the Chinese yuan. Chart I-4Growth In The Dollar Short Position Has Eased
Growth In The Dollar Short Position Has Eased
Growth In The Dollar Short Position Has Eased
Chart I-5Lots Of Yen And Euro Debt ##br##Issuance
Lots Of Yen And Euro Debt Issuance
Lots Of Yen And Euro Debt Issuance
The fall in the use of dollars gradually redistributes the “exhorbitant priviledge” of the U.S. currency. This alleviates the need for the U.S. to run a wider current account deficit (President Trump’s goal). This means lower growth in foreign exchange reserves could become the norm rather than the exception (Chart I-6). Historically, current account imbalances have been a major source of currency crises, meaning the system could actually be more stable. Chart I-6The Drop In FX Reserves Is Not Precarious
The Drop In FX Reserves Is Not Precarious
The Drop In FX Reserves Is Not Precarious
The performance of some emerging market currency pairs will determine if the so-called funding crisis stays benign or becomes more malignant. Despite a deeper liquidity shortage than during the 2015-2016 crisis, most EM currency pairs are still trading within well-defined wedges and/or above critical thresholds (Chart I-7). Meanwhile, EM volatility remains much subdued – not symptomatic of a funding crisis (Chart I-8). Chart I-7EM Currency Pairs Remain Outside The Danger Zone
EM Currencies Pairs Remain Outside The Danger Zone
EM Currencies Pairs Remain Outside The Danger Zone
Chart I-8EM FX Volatility##br## Is Low
EM FX Volatility Is Low
EM FX Volatility Is Low
Bottom Line: One way to track if a dollar-funding crisis is becoming more acute is through the convenience yield, or cross-currency basis swap.1 This measures the difference in yield between an actual Treasury and a synthetic one trading in the offshore market. On this basis, it remains well below the panic levels observed in 2008, 2011 and 2015-2016, suggesting the dollar shortage is not as acute as back then (Chart I-9). Chart I-9The Convenience Yield For The Dollar Remains Low
The Convenience Yield For The Dollar Remains Low
The Convenience Yield For The Dollar Remains Low
The ECB Bazooka Chart I-10Relative R-Star* In The Eurozone Could Rebound
Relative R-Star* In The Eurozone Could Rebound
Relative R-Star* In The Eurozone Could Rebound
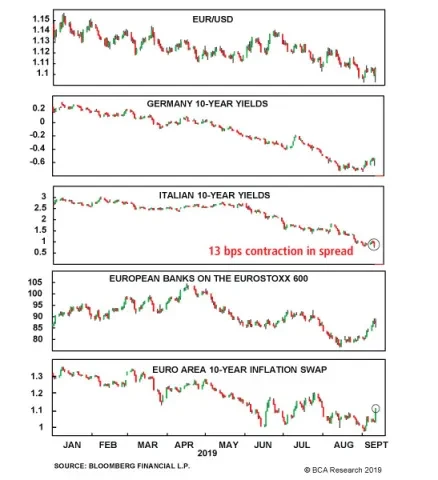
The ECB provided the stimulus the market wanted: they cut rates 10 basis points, offered a tiered system for their marginal deposit facility, and are starting an open-ended QE program at €20 billion a month in November. Yet the euro bounced. Our bias is that European rates were already well below equilibrium compared to the U.S., and the ECB’s dovish shift will help further lift the euro area’s growth potential (Chart I-10). If a central bank eases financing conditions at a time when growth is hitting a nadir, it is hardly bearish for the currency. Since the introduction of the euro, most of the economic imbalances from the region have stemmed from the standard contradiction of a common currency regime. This has been that interest rates have always been too low for one nation, while expensive for others. As such, the euro has typically been caught in a tug-of-war between a rising equilibrium rate of interest for one country, but a very low neutral rate for others.2 In the early 2000s, Spanish and Irish long-term rates were too low, and the reverse was true for Germany. The result was a massive boom in Spanish real estate, the accumulation of debt and buildup of major imbalances. Once bond vigilantes started punishing the periphery for their sins after the Great Recession, Germany found itself with rates that were too low relative to its newly reformed economy, while the periphery deflated. Capital spending in the peripheral countries has been rising faster than in core Europe, suggesting the spread between the cost of capital in these countries and the return on capital remains wide. The good news is this has not been the case for a few months now: 10-year government bond yields in France, Spain and even Portugal now sit at -24 basis points, 22 basis points and 24 basis points respectively, much below the neutral rate. This is severely easing financial conditions across the entire euro zone (Chart I-11). Chart I-11The Common-Currency Dilemma Solved
The Common-Currency Dilemma Solved
The Common-Currency Dilemma Solved
There has been a reason behind the collapse in spreads, aside from a dovish ECB. Labor market reforms in Mediterranean Europe have seen unit labor costs in Greece, Ireland, Portugal and Spain collectively contract by almost 10%. This has effectively eliminated the competitiveness gap that had accumulated over the past two decades (Chart I-12). Italy remains saddled with a rigid and less productive workforce, but overall adjustments have still come a long way to closing a key fissure plaguing the common-currency area. The result is in the numbers. Capital spending in the peripheral countries has been rising faster than in core Europe, suggesting the spread between the cost of capital in these countries and the return on capital remains wide (Chart I-13). More rapid capital spending in the periphery is a key channel to close the productivity gap between member nations and lift the neutral rate of interest for the entire euro zone. Chart I-12The Competitiveness Gap Has Closed
The Competitiveness Gap Has Closed
The Competitiveness Gap Has Closed
Chart I-13The Cost Of Capital Is Low In The Periphery
The Cost Of Capital Is Low In The Periphery
The Cost Of Capital Is Low In The Periphery
The euro tends to be largely driven by pro-cyclical flows. Fortunately for investors, European equities, especially those in the periphery, remain unloved, given they are trading at some of the cheapest cyclically adjusted price-to-earnings multiples in the developed world. Analysts began revising up their earnings estimates for euro zone equities earlier this year. If they are right, this tends to firmly lead the euro by about nine to 12 months (Chart I-14). Meanwhile, European bonds in hedged terms still remain very attractive (Table I-1). Chart I-14The Euro Might Soon Pop
The Euro Might Soon Pop
The Euro Might Soon Pop
Table I-1Bond Markets Across The Developed World
Is The World Short Of Dollars?
Is The World Short Of Dollars?
A key barometer to watch will be the performance of European banks. So far, they have avoided falling below the critical death zone (Chart I-15). We are awaiting further evidence that the global growth environment is becoming less precarious to place outright long euro bets. Stay tuned. Chart I-15Watch Eurozone Banks
Watch Eurozone Banks
Watch Eurozone Banks
Chester Ntonifor, Foreign Exchange Strategist chestern@bcaresearch.com Footnotes 1 Arvind Krishnamurthy and Hanno Lustig, “Mind the Gap in Sovereign Debt Markets: The U.S. Treasury basis and the Dollar Risk Factor,” Stanford University, August 29, 2019. 2 Please see Foreign Exchange Strategy Weekly Report, titled “EUR/USD And The Neutral Rate of Interest,” dated June 14, 2019, available at fes.bcaresearch.com. Currencies U.S. Dollar Chart II-1USD Technicals 1
USD Technicals 1
USD Technicals 1
Chart II-2USD Technicals 2
USD Technicals 2
USD Technicals 2
Recent data in U.S. have been mostly positive: Starting with labor market, nominal average hourly earnings were little changed at 3.2% year-on-year in August, however real average hourly earnings yearly growth increased from 1.3% to 1.5% year-on-year. The unemployment rate was unchanged at 3.7%. Nonfarm payrolls increased by 130,000 in August, below expectations of 158,000. NFIB small business optimism index fell from 104.7 to 103.1 in August. Both headline and core PPI increased by 1.8% and 2.3% year-on-year in August. While headline inflation somewhat slowed to 1.7% year-on-year in August, core inflation came in strong at 2.4% year-on-year. DXY index appreciated initially by 0.6% post ECB, then soon plunged, ending -0.2% this week. BLS reported a large increase in temporary positions in the federal government, reflecting the preparation for the 2020 Census. Notable job gains also occurred in health care and finance, while mining lost jobs. During a Q&A session in Zurich last Friday, Powell noted that the outlook remains a favorable one despite global trade risks. The most likely scenario for the U.S. is continued moderate growth. Report Links: Preserving Capital During Riot Points - September 6, 2019 Has The Currency Landscape Shifted? - August 16, 2019 USD/CNY And Market Turbulence - August 9, 2019 The Euro Chart II-3EUR Technicals 1
EUR Technicals 1
EUR Technicals 1
Chart II-4EUR Technicals 2
EUR Technicals 2
EUR Technicals 2
Recent data in the euro area have been mostly negative: GDP growth increased to 1.2% year-on-year in Q2, from a downwardly-revised 1.1% in the previous quarter. Sentix confidence came in at -11.1 in September, remaining in negative territory but higher than expected. Industrial production contracted by 2% year-on-year in July. EUR/USD fell by 0.9% post ECB meeting, followed by a quick rebound, gaining 0.3% in total this week. Mario Draghi’s last meeting as governor delivered another “bazooka.” The deposit facility rate was cut by 10 bps to a new low of -0.5%, and the ECB will restart QE at €20 billion monthly in November. It will also introduce a two-tiered system for interest rates. Report Links: Battle Of The Central Banks - June 21, 2019 EUR/USD And The Neutral Rate Of Interest - June 14, 2019 Take Out Some Insurance - May 3, 2019 Japanese Yen Chart II-5JPY Technicals 1
JPY Technicals 1
JPY Technicals 1
Chart II-6JPY Technicals 2
JPY Technicals 2
JPY Technicals 2
Recent data in Japan have been negative: Average cash earnings contracted by 0.3% year-on-year in July. Annualized GDP growth slowed from 1.8% to 1.3% quarter-on-quarter in Q2. The adjusted BoP current account balance narrowed to ¥1.65 trillion in July. The BoP trade balance shifted to a deficit of ¥74.5 billion. While the ECO watchers current index rebounded to 42.8 in August, the outlook component dropped to 39.1, the lowest since 2014. Preliminary machine tool orders kept contracting by 37.1% year-on-year in August. Core machinery orders yearly growth fell from 12.5% to 0.3% in July. PPI decreased by 0.9% year-on-year in August. USD/JPY increased by 1% this week. The outlook for Japan remains worrisome in anticipation of the scheduled consumption tax hike next month. Besides that, the relationship between Japan and South Korea is in the worst state in decades. Tourist arrivals between the two neighbors are both deteriorating. However, the BoJ remains out of policy bullets. This puts a floor under the safe-haven yen, until the BoJ acts. Report Links: Has The Currency Landscape Shifted? - August 16, 2019 Portfolio Tweaks Into Thin Summer Trading - July 5, 2019 Battle Of The Central Banks - June 21, 2019 British Pound Chart II-7GBP Technicals 1
GBP Technicals 1
GBP Technicals 1
Chart II-8GBP Technicals 2
GBP Technicals 2
GBP Technicals 2
Recent data in U.K. have been slightly improving: Manufacturing production grew by 0.3% month-on-month in July. On a year-on-year basis, it contracted by 0.6%, an improvement from the previous -1.4%. Industrial production contracted by 0.9% year-on-year in July, higher than the consensus of -1.1%. Total trade deficit (including EU) slightly increased to £0.22 billion in July. Trade deficit (non-EU) widened to £1.93 billion. ILO unemployment rate fell to 3.8% in July. Average earnings growth increased to 4% year-on-year in July. GBP/USD increased by 0.4% this week. We believe that the probability of a no-deal Brexit remains low, but for the time being, we are standing aside while waiting for the chaos to settle. Next week we will be publishing an update on the U.K. economy. Stay tuned. Report Links: Battle Of The Central Banks - June 21, 2019 A Contrarian View On The Australian Dollar - May 24, 2019 Take Out Some Insurance - May 3, 2019 Australian Dollar Chart II-9AUD Technicals 1
AUD Technicals 1
AUD Technicals 1
Chart II-10AUD Technicals 2
AUD Technicals 2
AUD Technicals 2
Recent data in Australia have been mixed: Home loans grew by 4.2% month-on-month in July, up from 0.4% in the previous month. Westpac consumer confidence fell by 1.7% month-on-month in September. National Australia Bank (NAB) business confidence fell from 4 to 1 in August. AUD/USD appreciated by 0.5% this week. Investor and consumer sentiment remain depressed amid global trade worries and the diminishing returns from Chinese stimulus. However, we are seeing tentative signs of recovery as the housing sector stabilizes. We maintain a positive view on the Australian dollar. Report Links: A Contrarian View On The Australian Dollar - May 24, 2019 Beware Of Diminishing Marginal Returns - April 19, 2019 Not Out Of The Woods Yet - April 5, 2019 New Zealand Dollar Chart II-11NZD Technicals 1
NZD Technicals 1
NZD Technicals 1
Chart II-12NZD Technicals 2
NZD Technicals 2
NZD Technicals 2
Recent data in New Zealand have been neutral: Net migration increased by 5100 in July. Manufacturing sales contracted by 2.7% quarter-on-quarter in Q2. The New Zealand dollar has been more or less flat against the U.S. dollar this week, but fell by 0.5% against the Australian dollar. China granted several U.S. products a one-year exemption from tariffs this week. While the good news regarding a potential U.S.-China trade deal could benefit pro-cyclical currencies, we believe the kiwi will underperform at the crosses. Report Links: USD/CNY And Market Turbulence - August 9, 2019 Where To Next For The U.S. Dollar? - June 7, 2019 Not Out Of The Woods Yet - April 5, 2019 Canadian Dollar Chart II-13CAD Technicals 1
CAD Technicals 1
CAD Technicals 1
Chart II-14CAD Technicals 2
CAD Technicals 2
CAD Technicals 2
Recent data in Canada have been solid: In August, 81,100 jobs were added, the unemployment rate was unchanged at 5.7%, and average hourly wages grew by 3.8% year-on-year. Ivey PMI increased to 60.6 in August, from the previous 54.2 in July. Bloomberg Nanos confidence was little changed at 56.5 for the past week. Housing starts increased by 226,600 in August. Building permits grew by 3% month-on-month in July. New house price index fell by 0.4% year-on-year in July. USD/CAD increased by 0.2% this week. While the oil prices and robust job numbers could benefit the Canadian dollar in the near term, a rising exchange rate, and increasing interest rate differentials might tighten financial conditions, and thus limit the upside of the loonie. Report Links: Preserving Capital During Riot Points - September 6, 2019 Portfolio Tweaks Into Thin Summer Trading - July 5, 2019 On Gold, Oil And Cryptocurrencies - June 28, 2019 Swiss Franc Chart II-15CHF Technicals 1
CHF Technicals 1
CHF Technicals 1
Chart II-16CHF Technicals 2
CHF Technicals 2
CHF Technicals 2
There is scant data from Switzerland this week: Producer and import prices contracted by 1.9% year-on-year in August. Unemployment rate was unchanged at 2.3% in August. USD/CHF has been flat this week. Last Friday, during the Q&A session in Zurich, SNB chairman Jordan emphasized that as a small open economy, Switzerland is heavily impacted by global economic developments, notably what is happening in the U.S., Europe, and China. The recent slowdown has weighed on the Swiss economy. More importantly, Jordan noted that price stability remains an important mandate for the Swiss people and the bank. Further policy adjustments, besides interest rates, might be necessary to stimulate the economy. The ECB policy meeting this week has also put more pressure on SNB to further ease monetary policy. Report Links: What To Do About The Swiss Franc? - May 17, 2019 Beware Of Diminishing Marginal Returns - April 19, 2019 Balance Of Payments Across The G10 - February 15, 2019 Norwegian Krone Chart II-17NOK Technicals 1
NOK Technicals 1
NOK Technicals 1
Chart II-18NOK Technicals 2
NOK Technicals 2
NOK Technicals 2
Recent data in Norway have been neutral: Manufacturing output grew by 1% in July. Headline and core inflation both slowed to 1.6% and 2.1% year-on-year in August. USD/NOK fell by 0.4% this week, as oil prices continued to rally. Prince Abdulaziz Bin Salman was appointed as the new Energy Minister of Kingdom of Saudi Arabia (KSA), and he is committed to oil production control. Moreover, the possible good news over a U.S.-China trade deal is likely to revive oil demand, thus lifting Norwegian krone. Report Links: Portfolio Tweaks Into Thin Summer Trading - July 5, 2019 On Gold, Oil And Cryptocurrencies - June 28, 2019 Currency Complacency Amid A Global Dovish Shift - April 26, 2019 Swedish Krona Chart II-19SEK Technicals 1
SEK Technicals 1
SEK Technicals 1
Chart II-20SEK Technicals 2
SEK Technicals 2
SEK Technicals 2
Recent data in Sweden have been mostly negative: Household consumption increased by 2.8% year-on-year in July. Headline inflation slowed from 1.7% to 1.4% year-on-year in August. Core inflation also slowed to 1.6% year-on-year, from the previous 1.7%. USD/SEK fell by 0.4% this week. Last week, the Riksbank kept interest rates on hold, and said that they are still planning to raise interest rates but at a slower pace. The slowdown in inflation this week might further delay their plan for a rate hike. Report Links: Where To Next For The U.S. Dollar? - June 7, 2019 Balance Of Payments Across The G10 - February 15, 2019 A Simple Attractiveness Ranking For Currencies - February 8, 2019 Trades & Forecasts Forecast Summary Core Portfolio Tactical Trades Limit Orders Closed Trades
Please note that this abbreviated weekly report complements today’s Special Report titled China’s Foreign Debt, And A Secret Weapon published in collaboration with BCA’s China Investment Strategy service. Feature A major rotation has commenced in recent days in global financial markets: beaten-down value companies have begun outperforming richly-priced U.S. growth stocks. This has cogently coincided with the rise in U.S. bond yields. Further, U.S. small caps have also begun outpacing U.S. large caps. Do these signals mean that EM will start outperforming DM in general and U.S. in particular? We do not think it is likely to occur on a sustainable basis. We agree that certain trends in global financial markets have become over-extended and a mean-reversion is overdue. U.S. bond yields have probably dropped much more than justified by U.S. economic strength. Although U.S. manufacturing, exports and capex have been extremely week/contracting, consumer spending is expanding at a decent clip. We believe fears of a full-blown U.S. recession are presently exaggerated. It is also critical to gauge what is the underlying cause of this financial market rotation. Is it receding fears of U.S. recession or China’s recovery or both? We believe that the rotation is caused by unwinding of recessionary fears in the U.S., not a revival in the Chinese economy or a recovery in global trade and manufacturing. Unwinding U.S. recessionary fears will not be sufficient to produce a strong and lasting rally in EM risk assets and currencies even if it leads to a breakout in DM share prices in absolute terms. EM risk assets and currencies are much more sensitive to China and global growth rather than to the U.S. economy. Watch The Dollar For Clues Chart I-1EM Relative Equity Performance Correlates With U.S. Dollar
EM Relative Equity Performance Correlates With U.S. Dollar
EM Relative Equity Performance Correlates With U.S. Dollar
Whether the sell-off in global safe-haven bonds and outperformance of global cyclical vs. defensive equity sectors is due to a genuine recovery in China or the U.S. will be revealed in the trend of the U.S. dollar (Chart I-1). If the dollar continues grinding higher, it would entail that the recent financial markets rotation is due to amelioration in U.S. growth expectations and that there is little recovery in the Chinese economy as well as global manufacturing and trade. In this scenario, EM risk assets will underperform. On the contrary, if the greenback begins exhibiting persistent and broad weakness, it would signify that the reversal in global safe-haven bond yields and global cyclical stocks is due to a revival in Chinese demand. In such a case, a lasting recovery in global manufacturing and trade are likely. This would be consistent with a durable EM rally and outperformance. Chart I-2Bullish Technicals For U.S. Dollars
Bullish Technicals For U.S. Dollars
Bullish Technicals For U.S. Dollars
So far, the greenback has remained well bid (Chart I-2). In addition, industrial commodities prices remain weak and have failed to rebound (Chart I-3). These entail that the recent spike in U.S. bond yields and outperformance of cyclical equity sectors is primarily due to unwinding of pessimism on U.S. growth rather than a reflection of growth amelioration in China. Notably, cyclical data out of China and global trade/manufacturing remain dismal. Chinese overall imports are contracting (Chart I-4). Chart I-3Breakdown Remains In Play
Breakdown Remains In Play
Breakdown Remains In Play
Chart I-4Shrinking Chinese Imports
Shrinking Chinese Imports
Shrinking Chinese Imports
Global semiconductor sales and car purchases continue shrinking at a rapid pace (Chart I-5). China’s credit and money growth and impulses appear to be rolling over, having failed to rise as much as in the previous stimulus episodes (Chart I-6). Finally, the pace of EM corporate EPS contraction is accelerating (Chart I-7). Any rally in EM share prices will be unsustainable without a bottom in EM EPS growth. Chart I-5No Improvement In Global Growth
No Improvement In Global Growth
No Improvement In Global Growth
Chart I-6Chinese Credit Impulse Is Weak
Chinese Credit Impulse Is Weak
Chinese Credit Impulse Is Weak
Chart I-7EM EPS & Share Prices
EM EPS & Share Prices
EM EPS & Share Prices
Bottom Line: The U.S. dollar has failed to sell off despite the optimism in global equity markets. This entails that any rebound and outperformance in EM risk assets and currencies will prove to be short-lived. Arthur Budaghyan Chief Emerging Markets Strategist arthurb@bcaresearch.com Equities Recommendations Currencies, Credit And Fixed-Income Recommendations
Highlights On a national level, China’s foreign currency debt does not seem excessive. Nevertheless, foreign currency debt is concentrated in the weakest sectors: property developers, banks and non-bank financial companies. The authorities can resort to FX swaps to smooth China’s currency depreciation. This will assure there is no currency turmoil. Yet, these FX swaps transactions will only defer downward pressure on the local currency, but will not eliminate it. Feature Chart I-1China's Aggregate FX Debt
China's Aggregate FX Debt
China's Aggregate FX Debt
China’s foreign debt has increased dramatically over the past 10 years, from $390 billion to $1.83 trillion currently (Chart I-1). With the RMB’s recent depreciation, the pressure on Chinese debtors to service foreign currency debt is rising. In this week's report, we gauge the size of the nation’s foreign currency debt, assess its vulnerability and discuss how policymakers will manage potential downside risks to the exchange rate. Quantifying The Size Of External Debt The State Administration of Foreign Exchange (SAFE) currently reports foreign currency denominated liabilities amounting to $1.97 trillion. This includes debts of general (central and local) government, the central bank, commercial banks and other enterprises. However, SAFE does not record foreign currency debt of offshore subsidiaries of Chinese companies. For example, if a subsidiary of a Chinese company in Hong Kong issued bonds denominated in foreign currency, this amount will not be captured in SAFE’s data. To get a more complete picture of China’s total foreign currency debt, we included the foreign debt of offshore subsidiaries to the SAFE figure. Also, we exclude banks' foreign currency deposits from foreign debt. Table I-1 is a comprehensive profile of China’s foreign currency debt. Table I-1Who Owes FX Debt In China
China’s Foreign Debt, And A Secret Weapon
China’s Foreign Debt, And A Secret Weapon
The key takeaways are as follows: China’s aggregate foreign currency debt is $1.83 trillion, or 13% of GDP. Public sector foreign currency debt stands at $263 billion, or 0.2% of GDP. Such a low number suggests one should not worry about the government’s foreign currency indebtedness. Companies’ and banks’ foreign indebtedness as of the end of March 2019 amounted to $436 billion and $1.3 trillion, respectively, totaling $1.7 trillion (or 12.5% of GDP) (Chart I-2A and I-2B). Chart I-2AFX Debt Of Companies And Banks
FX Debt Of Companies And Banks
FX Debt Of Companies And Banks
Chart I-2BFX Debt Of Companies And Banks
FX Debt Of Companies And Banks
FX Debt Of Companies And Banks
For banks, we deducted foreign currency deposits from the SAFE numbers – in other words, banks’ foreign currency debt excludes their foreign currency deposits. For instance, a mainland bank operating in Hong Kong has a large number of Hong Kong dollar deposits, yet the latter does not really constitute a foreign currency debt, as it is an inherent part of banking operations and is counterbalanced by Hong Kong dollar assets. A foreign borrowing binge by banks and companies began in 2009, paused in 2015 and took off again in 2016. Overseas financing regulation was loosened in September 2015. The idea was to facilitate foreign currency borrowing so that the proceeds would offset the rampant capital outflows during that period and stabilize the exchange rate. This relaxation of regulation contributed to the overseas borrowing binge, especially short-term debt, which does not require approval from SAFE. The fact that U.S. dollar rates have been below mainland RMB interest rates have enticed foreign currency borrowing by mainland entities over this decade. In addition, the authorities’ deleveraging campaign since late 2016 constrained domestic credit creation relative to the boom of the previous years and drove enterprises to seek capital overseas. For companies, foreign debt constitutes 5% of their aggregate debt (Chart I-3). As to banks, foreign debt is equal to 3% of non-deposit liabilities (Chart I-4). Chart I-3Companies Reliance On FX Debt Has Risen But Remains Low
Companies Reliance On FX Debt Has Risen But Remains Low
Companies Reliance On FX Debt Has Risen But Remains Low
Chart I-4Banks Reliance On FX Debt Is Low
Banks Reliance On FX Debt Is Low
Banks Reliance On FX Debt Is Low
The currency of China’s aggregate foreign debt is mostly USD (85% of total) and HK$ (10% of total). Provided the latter is pegged to the greenback – something we do not expect to change anytime soon – the overwhelming portion of foreign currency debt is de facto in U.S. dollars. Companies’ and banks’ foreign indebtedness as of the end of March 2019 amounted to $436 billion and $1.3 trillion, respectively, totaling $1.7 trillion (or 12.5% of GDP). Bottom Line: While small as a share of total debt, the absolute size of foreign currency debt held by Chinese companies and banks is not trivial. Meaningful currency depreciation poses risks for industries where foreign currency debt is concentrated. Vulnerability Assessment We examine China’s vulnerability stemming from foreign currency debt on the national level as well as on the level of both banks and enterprises. National Level On the national level, China’s foreign currency debt does not seem problematic. Total foreign currency debt accounts for 70% of exports and 58% of foreign currency reserves at the central bank (Chart I-5). These ratios are lower than those of many other EM countries. Foreign debt service obligations (FDSOs) are the sum of interest payments and amortization of all types of external debt over the next 12 months. China’s current FDSOs stand at 11% relative to its exports of goods and services, and at 24% relative to the central bank’s foreign exchange reserves (Chart I-6). These numbers are also somewhat lower than in other emerging countries. Chart I-5Macro Metrics For Foreign Debt
Macro Metrics For Foreign Debt
Macro Metrics For Foreign Debt
Chart I-6Foreign Debt Service Obligations
Foreign Debt Service Obligations
Foreign Debt Service Obligations
Chart I-7Foreign Funding Requirements
Foreign Funding Requirements
Foreign Funding Requirements
Exports are a country’s foreign currency earnings (cash flow) that can be used to service foreign exchange-denominated debt. Central banks’ foreign exchange reserves are a stock of liquid foreign currency assets that can be used by the central bank to plug the gap in the balance of payments, if needed. Foreign funding requirements (FFRs) are calculated as the current account deficit plus FDSOs in the next 12 months. FFRs measure the amount of net foreign capital inflows required in the next 12 months for a country to cover any potential shortfall in its current account balance, as well as to service and repay its foreign currency debt coming due (both principal and interest). Chart I-7 illustrates the Chinese mainland’s FFRs over the next 12 months exceed the current account surplus by $600 billion. The fact that U.S. dollar rates have been below mainland RMB interest rates have enticed foreign currency borrowing by mainland entities over this decade. The yuan has depreciated by 12% since April 2018. This has raised foreign debt burdens relative to GDP as well as made debt servicing more expensive. Please refer to Box I-1 that elaborates why currency depreciation is more damaging than a rise in interest rates for debtors with foreign currency borrowing. Box I-1
China’s Foreign Debt, And A Secret Weapon
China’s Foreign Debt, And A Secret Weapon
Companies And Banks Table I-3 illustrates the industry composition of non-government external debt. This also includes foreign debt of offshore subsidiaries. Table I-3
China’s Foreign Debt, And A Secret Weapon
China’s Foreign Debt, And A Secret Weapon
Non-policy banks have the highest amount of outstanding private external debt, at $367 billion, followed by real estate companies at $240 billion and financial service companies at $172 billion. Overall, foreign currency debt is concentrated in the weakest links of the Chinese economy: First, revenues and cash flows of property developers, banks and non-bank finance companies are predominantly in yuan. Hence, RMB currency depreciation reduces their cash flow in U.S. dollar terms, hurting their ability to service foreign debt. The yuan has depreciated by 12% since April 2018. This has raised foreign debt burdens relative to GDP as well as made debt servicing more expensive. Second, debt stress recedes in economic upswings and rises in economic downturns. The reason is that companies’ cash flows shrink in downturns and grow in economic expansions. Property developers, banks and non-bank finance companies are not only the largest foreign currency debtors in China, but also have the weakest profit/cash flow outlooks. Chart I-8Chinese Real Estate: Starts Outpacing Completions
Chinese Real Estate: Starts Outpacing Completions
Chinese Real Estate: Starts Outpacing Completions
Property developers’ cash flow positions will deteriorate further as the lack of policy stimulus for real estate in this cycle will constrain housing demand. Chart I-8 illustrates property developers have had many starts, but few completions and generally weak sales. This is due to the fact that they use starts to raise cash through pre-sales (down payments). Once they have raised the cash, they slow the pace of construction, as demand as well as their own cash positions are weak. As to banks and non-bank financial companies, their total assets skyrocketed until the 2016 deleveraging campaign kicked in. Since then, their asset growth has been relatively tame. This along with rising non-performing loans is hurting their profits, and consequently their debt-servicing ability. Third, for non-policy banks, short-term debt is very high at $234 billion. The same measure for property developers and non-bank finance companies is $31 billion and $33 billion, respectively. Finally, companies and banks in aggregate will be confronted with $438 billion of U.S. dollar debt maturing over the coming two years. In particular, real estate companies and financial services companies are faced with repayment pressures of $99 billion and $79 billion, respectively. Risks From Currency Hedging Prior the RMB breaking below the important 7 CNY/USD technical level, it was safe to assume that there was no pressure to hedge currency risks by debtors with FX debt. Odds are that following the breaching of this technical level and in anticipation of further devaluation, many of these debtors have begun hedging their foreign currency exposure. In turn, demand to hedge currency risk for $1.3 trillion foreign currency debt by companies and non-policy banks could exert further downward pressure on the exchange rate. Do the authorities have the tools to avoid self-feeding currency depreciation? A Secret Defense Weapon: FX Swaps Chart I-9Few FX Reserves Compared With RMB Money Supply
Few FX Reserves Compared With RMB Money Supply
Few FX Reserves Compared With RMB Money Supply
China’s central bank has about $3 trillion of foreign exchange (FX) reserves that can be used to intervene in the spot market. However, the authorities are very reluctant to use these reserves. One of the primary reasons is that these FX reserves are equal to only 12% of broad money supply and RMB deposits (Chart I-9). These are very low numbers in comparison with other countries. In addition, when a central bank sells its international reserves and buys local currency, the banking system’s liquidity/excess reserves at the central bank shrink, leading to higher interbank rates. Hence, defending the currency with FX reserves comes at the expense of tighter liquidity. This is unacceptable for Chinese policymakers because the economy remains very weak and extremely reliant on credit to grow. The good news is that the authorities have another tool – FX swaps – and are likely already using it to defend the yuan. Other EM countries have used FX swaps to defend their currencies as well, most notably Brazil in 2014-‘15. Media reports on several occasions have speculated that Chinese state banks sold U.S. dollars in the forward foreign exchange market in a bid to defend the forward rate and thus influence the spot market. We suspect this may be true, even though there is no available information on the amount and counterparties of FX swaps. What are the mechanisms and implications of FX swap interventions? In a FX swap transaction, a bank (the central bank or a state-owned bank) sells U.S. dollars to a company in the forward market. There is no flow of dollars or yuan in the spot market. If by the maturity date of the FX swap, the RMB depreciates more than what was implied by forwards on the date of the transaction, the bank suffers a loss. Otherwise, the bank makes a profit. The bad news is that a lot of FX debt is concentrated in the most vulnerable segments of the Chinese economy. In a nutshell, the authorities (state banks or the central bank) could hypothetically support the yuan by selling unlimited amounts of dollars in the forward market. Unlike the sale of U.S. dollars from the People’s Bank of China’s FX reserves, this would entail neither a depletion of foreign currency reserves nor a withdrawal of yuan liquidity. Chart I-10Large Bank Stocks Have Broken Down
Large Bank Stocks Have Broken Down
Large Bank Stocks Have Broken Down
These interventions are positive as they smooth the exchange rate trend and rule out a sharp tumble in the currency value. However, this strategy still has several shortcomings: (1) These FX swap operations can lead to large losses at state-owned banks. Barring the Ministry of Finance or the PBoC writing a check to these state banks to cover these losses, the latter will dampen banks’ earnings. Consequently, their share prices will slump (Chart I-10). (2) These FX swaps transactions only delay demand for dollars in the spot market and thereby defer downward pressure on the local currency, but they do not eliminate it forever. Conclusions The bad news is that a lot of FX debt is concentrated in the most vulnerable segments of the Chinese economy: property developers, banks and finance companies. They have little FX revenues so they are exposed to RMB depreciation. Given the exchange rate has broken below the psychological level of 7 CNY/USD (Chart I-11), odds are they will try to hedge their currency risk by buying U.S. dollars in the forward market. This will heighten depreciation pressure on the yuan. Chart I-11RMB And Its Volatility
RMB And Its Volatility
RMB And Its Volatility
The good news is that the authorities have a tool to smooth the currency depreciation via FX swaps. This will assure there is no currency turmoil in China, even if demand for dollars escalates. The costs of defending will be losses at large state-owned banks. Yet, those losses can ultimately be borne by the central government, which has little debt (20% of GDP). Downward pressure on the RMB will persist because of: Large demand for dollars from companies and banks with large FX debt levels as they attempt to hedge their FX risks; Weak economic activity, U.S. import tariffs and deflationary pressures - warranting currency depreciation; Potentially large demand for dollars from resident capital outflows. Lin Xiang, Research Analyst linx@bcaresearch.com Arthur Budaghyan Chief Emerging Markets Strategist arthurb@bcaresearch.com Footnotes
Image
ECB President Mario Draghi managed to achieve his last “whatever it may take” moment. Interest rates on the ECB Deposit Facility have been cut to -0.5% from -0.4%, which is slightly less than traders anticipated.…
Anecdotal evidences from industry specialists suggest that many manufacturers have been engaging in re-routing their supply chains to avoid the U.S.-China tariffs. This is welcome news. Manufacturing slowdowns have tended to last 18 months peak-to-trough,…
The tug of war between deteriorating global growth and easing liquidity conditions cannot last forever. Either the dollar breakout morphs into a panic buying frenzy or proves to be a bull trap. Are we at the cusp of a bottom in global growth, or approaching a…
Highlights Currency markets continue to fight a tug-of-war between deteriorating global growth and easing global financial conditions. Such an environment is typically fertile ground for a dollar bull market, yet the trade-weighted dollar is up only 2.3% this year. The lack of more-pronounced strength in the greenback suggests that other powerful underlying forces are preventing the dollar from gapping higher. The breakdown in the bond-to-gold ratio is an important distress signal for dollar bulls. As both political and economic uncertainty remain elevated, likely winners in the interim remain safe-haven currencies such as the yen and the Swiss franc. For the remainder of the year, portfolio managers should focus on relative value trades at the crosses, rather than outright dollar bets. Stand aside on the pound for now. Aggressive investors can place a buy stop at 1.25 and sell stop at 1.20. The Riksbank’s hawkish surprise was a welcome development for the krona. Remain long SEK/NZD. The SEK might be the best-performing G10 currency over the next five years. Feature Yearly performance is an important benchmark for most portfolio managers. As most CIOs return to their desks from a summer break, they will be looking at a few barometers to help them navigate the rest of 2019. On the currency front, here is what the report card looks like so far: The dollar has been a strong currency, but the magnitude of the increase has been underwhelming, given market developments. The Federal Reserve’s trade-weighted dollar is up only 2.3% this year. In contrast, the yen is up 3.6% and the Canadian dollar 2.3%. Meanwhile, the best shorts have been the Swedish krona (down 9.7%) and the kiwi. Through the lens of the currency market, the dollar has been in a run-of-the-mill bull market, rather than in a panic buying frenzy (Chart I-1). Chart I-1A Report Card On Currency Performance
Preserving Capital During Riot Points
Preserving Capital During Riot Points
Gold has broken out in every major currency. This carries a lot of weight because it has occurred amid dollar strength, a historical rarity. Importantly, the breakout culminates the seven-or-so-year pattern where gold was stable versus many major currencies (Chart I-2). We are no technical analysts, but ever since gold peaked in 2011, all subsequent rallies have seen diminishing amplitude, which by definition were bull traps. This appeared to have changed since 2015-2016, which could be a signal that the dollar bull market is nearing an end. Commodities have been a mixed bag. Precious metals have surged alongside gold. Despite the recent correction, oil is still up 13.8% for the year. Meanwhile, natural gas is in a bear market. Among metals, nickel has surged 70%, while Doctor Copper is down 5.1%. The only semblance of agreement is among soft commodities, which have been mostly deflating (Chart I-3). In short, there has been no coherent theme for commodity currencies. All the talk of a Sino-U.S. trade war, Chinese A-shares are up 18.7% for the year. This more than makes up for any CNY depreciation. Equities have performed well across the board, mostly up double digits. The only notable laggards have been in Asia, specifically Japan, Hong Kong and Korea. That said, of all the talk of a Sino-U.S. trade war, Chinese A-shares are up 18.7% for the year. This more than makes up for any CNY depreciation. This also suggests that capital flows into equities have not been a major driver of currencies this year. Chart I-2Gold Has Been The Ultimate Currency
Gold Has Been The Ultimate Currency
Gold Has Been The Ultimate Currency
Chart I-3Commodities Are A Mixed Bag
Commodities Are A Mixed Bag
Commodities Are A Mixed Bag
Yields have collapsed, with higher-beta markets seeing bigger drops. Differentials have mostly moved against the dollar in recent weeks as the U.S. 10-year yield plays catch-up to the downside. One important question is that with Swiss 10-year yields now at -0.96% and German yields at -0.67%, is there a theoretical floor to how low bond yields can fall (Chart I-4)? Chart I-4Yields Have Melted
Yields Have Melted
Yields Have Melted
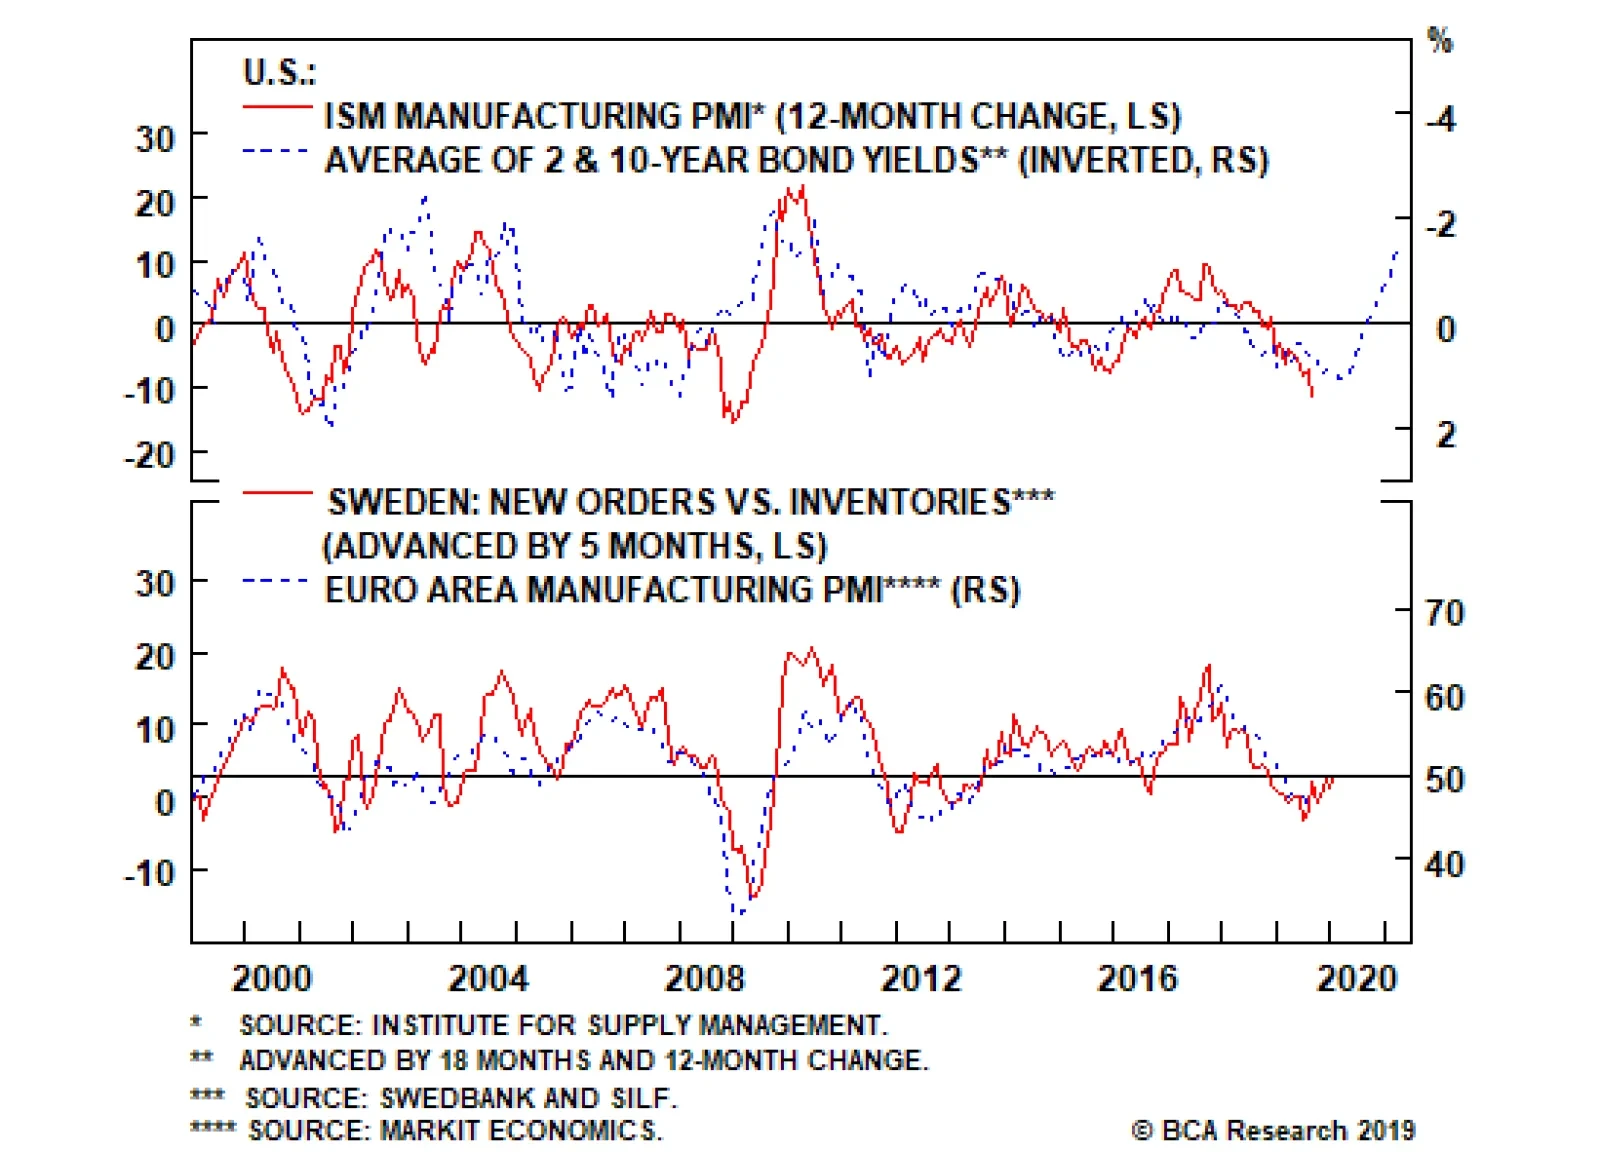
Heading back to his office, the CIO is now pondering how to deploy fresh capital. On one hand, the typical narrative that we have been operating in the quadrant of a deflationary bust, given the trade war, manufacturing recession, political unrest and rapidly rising probability of recession is not clearly visible in financial data. This would have been historically dollar bullish, and negative for other asset classes. However, the plunge in bond yields begs the question of whether this is a prelude to worse things to come. A more sanguine assessment is that we might be at a crossroads of sorts. If economic data continues to deteriorate due to much larger endogenous factors, a defensive strategy is clearly warranted. One way to tell will be an emerging divergence between our leading indicators and actual underlying data. On the flip side, any specter of positive news could light a fire under sectors, currencies and countries that have borne the brunt of the slowdown. Time is of the essence, and strategy will be dependent on horizons. A review of the leading indicators for the major economic blocks is in order. Are We At The Cusp Of A Recession? Centripetal systems tend to stay in equilibrium, while centrifugal forces can explode in spectacular fashion. In the currency world, this means that the tug of war between deteriorating global growth and easing liquidity conditions cannot last forever. Either the dollar breakout morphs into a panic buying frenzy or proves to be a bull trap. Are we at the cusp of a bottom in global growth, or approaching a riot point? Let us start with the economic front: U.S.: Plunging U.S. bond yields have historically been bullish for growth. More importantly, the recent decline in the ISM Manufacturing Index is approaching 2008 recessionary levels. Either easing in financial conditions revive the index, or the decoupling persists for a while longer. The tone on the political front appears reconciliatory, which means September and October data will be critical. In 2008, the divergence between deteriorating economic conditions and falling yields was an important signpost for a riot point (Chart I-5). Eurozone: The Swedish manufacturing PMI ticked up to 52.4 in August. Most importantly, the new orders-to-inventories ratio is suggesting that the German (and European) manufacturing recession is reversing (Chart I-6). For all the debate about whether China is stimulating enough or not, the beauty about this indicator is that there are no Chinese variables in it (the euro zone and Sweden export a lot of goods and services to China). Any surge higher in this indicator will categorically conclude the euro zone manufacturing recession is over, lighting a fire under the euro in the process. Whatever the number is, if it can stabilize Chinese growth, a powerful deflationary force that dictated markets in 2018-2019 will dissipate. China: Chinese bond yields have melted alongside global yields. This is reflationary, given the liberalization in the bond market over the past few years. Policy makers are currently discussing the quota for next year’s fiscal spending. Whatever the number is, if it can stabilize Chinese growth, a powerful deflationary force that dictated markets in 2018-2019 will dissipate. Chart I-5Is U.S. Manufacturing Close ##br##To A Bottom?
Is U.S. Manufacturing Close To A Bottom?
Is U.S. Manufacturing Close To A Bottom?
Chart I-6Is Eurozone Manufacturing Close To A Bottom?
Is Eurozone Manufacturing Close To A Bottom?
Is Eurozone Manufacturing Close To A Bottom?
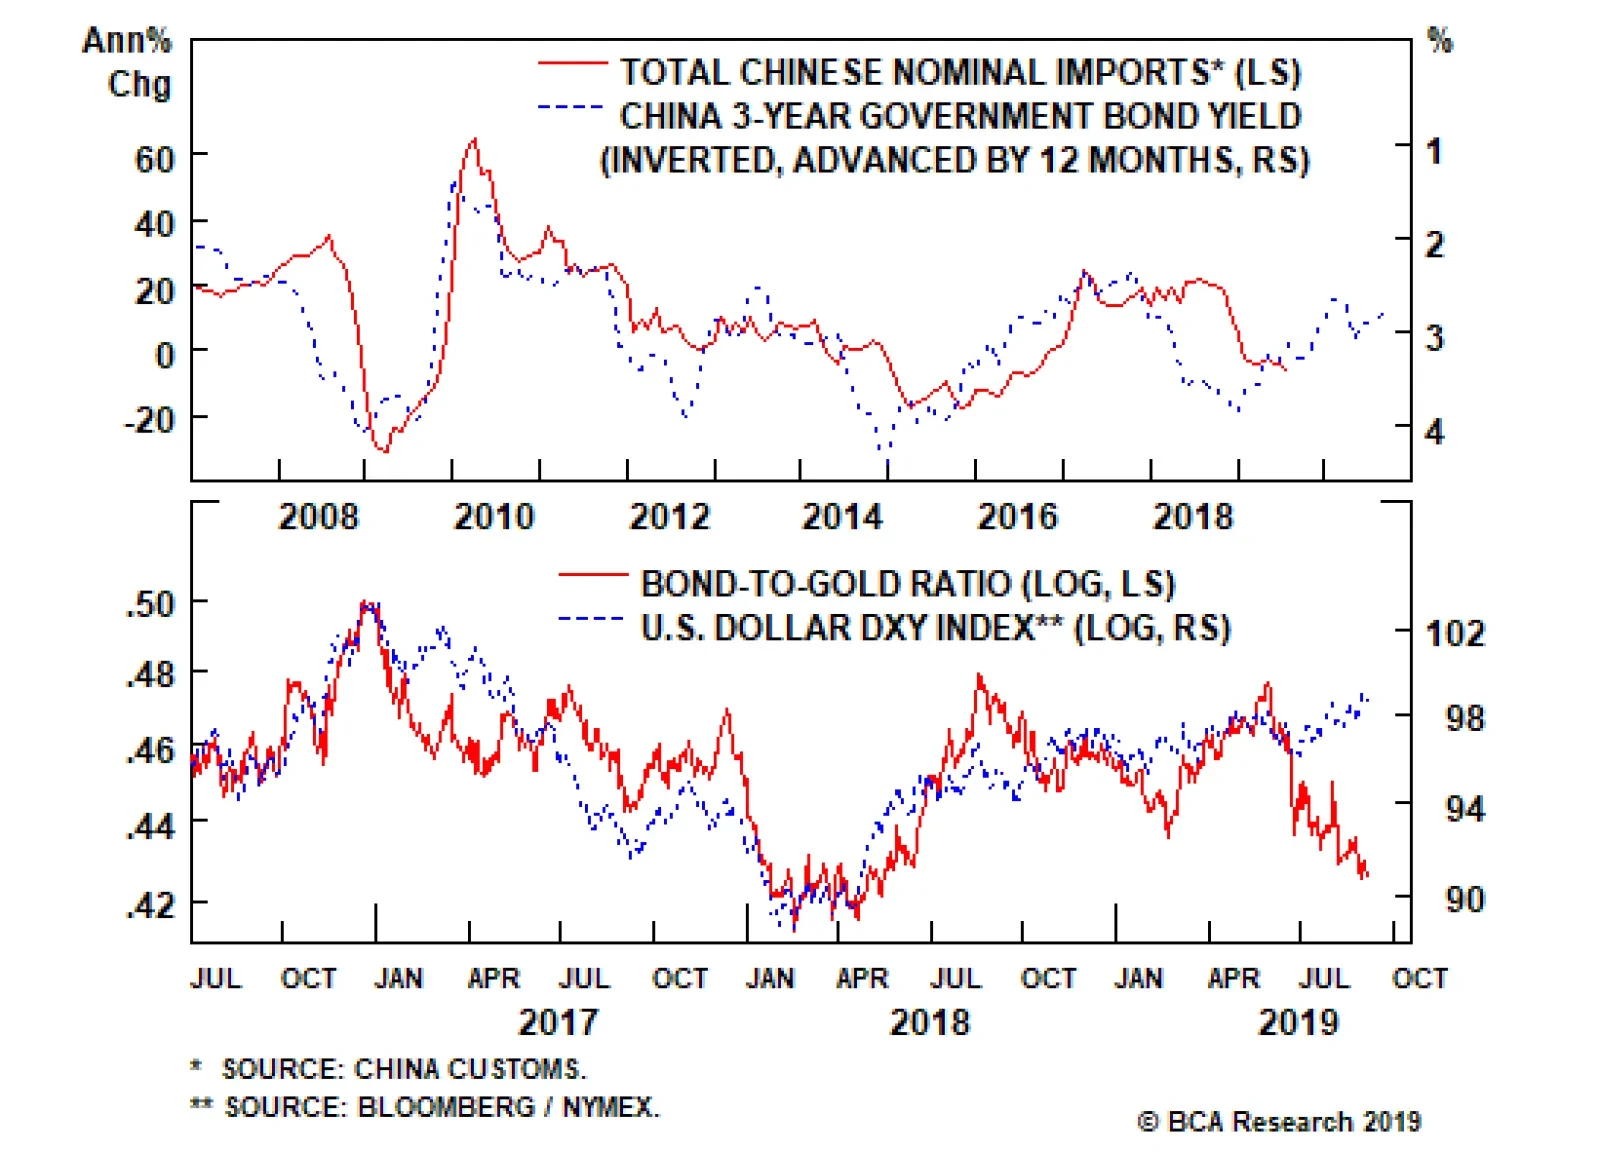
Discussions among industry specialists suggest some anecdotal evidence that many manufacturers have been engaged in re-routing channels and parallel manufacturing chains to avoid the U.S.-China tariffs. This is welcome news, since global exports and global trade are still in a downtrend. A key barometer to watch on whether the global slowdown is infecting domestic demand will be Chinese imports (Chart I-7). So far, the message is that traditional correlations have not yet broken down. As a contrarian, this is positive. Manufacturing slowdowns have tended to last 18 months peak-to-trough, the final months of which are characterized by fatigue and capitulation. However, unless major imbalances exist (our contention is that so far they do not), mid-cycle slowdowns sow the seeds of their own recovery via accumulated savings and pent-up demand. In the currency world, the dollar has tended to be an excellent counter-cyclical barometer. On the dollar, the bond-to-gold ratio is breaking down, in contrast to the rise in the DXY. This is not a sustainable divergence (Chart I-8). The last time the bond-to-gold ratio diverged from the DXY was in 2017, and that proved extremely short-lived. As global growth rebounded and U.S. repatriation flows eased, dollar support was quickly toppled over. Chart I-7Chinese Imports Could Soon Rebound
Chinese Imports Could Soon Rebound
Chinese Imports Could Soon Rebound
Chart I-8Mind The Gap
Mind The Gap
Mind The Gap
Ever since the end of the Bretton Woods agreement broke the gold/dollar anchor in the early 1970s, bullion has stood as a viable threat to dollar liabilities, capturing the ebbs and flows of investor confidence in the greenback tick-for-tick. While U.S. yields remain attractive, portfolio outflows and a deteriorating balance-of-payments backdrop will keep longer-term investors on the sidelines. Chart I-9Dollar Bulls Need A More Hawkish Fed
Dollar Bulls Need A More Hawkish Fed
Dollar Bulls Need A More Hawkish Fed
Capital tends to gravitate towards higher returns, and the U.S. tax break in 2017 was a one-off that is now ebbing. Meanwhile, despite wanting to resist the appearance of influence from President Trump, the Fed realises that the neutral rate of interest in the U.S. is now below its target rate, which should keep them on an easing path. A dovish Fed has historically been bearish for the dollar (Chart I-9). Bottom Line: In terms of strategy, heightened uncertainty can keep the greenback bid in the coming weeks, but we will be sellers on strength. Our favorite plays remain the Swedish krona, the Norwegian krone, and, for insurance purposes, the Japanese yen. Outright dollar shorts await confirmation from more economic data. What To Do About CAD? The Bank of Canada (BoC) decided to stay on hold at its latest policy meeting. This was highly anticipated, but the silver lining is that the BoC might later reflect on this move as a policy mistake, given the arms race by other central banks to ease policy. The three most important variables for the Canadian economy are a:) what is happening to the U.S. economy, b:) what is happening to crude oil prices and c:) what is happening to consumer leverage and the housing market. On all three fronts, there has been scant good news in recent weeks. Heightened uncertainty can keep the greenback bid in the coming weeks, but we will be sellers on strength. The Nanos Investor Confidence Index suggests Canadian GDP might be at the cusp of a slowdown after an excellent run of a few quarters (Chart I-10). One of the key drivers for the CAD/USD exchange rate is interest rate differentials with the U.S., and the compression in rates could run further (Chart I-11). Unless the BoC adopts a looser monetary stance, a rising exchange rate is likely to tighten financial conditions. Rising energy prices will be a tailwind, but the Western Canadian Select discount, and persistent infrastructure problems are headwinds. As such, we think domestic conditions will continue to knock down whatever benefit comes from rising oil prices. Chart I-10Canadian Data Has##br## Been Firm
Canadian Data Has Been Firm
Canadian Data Has Been Firm
Chart I-11A Firm Exchange Rate Could Tighten Financial Conditions
A Firm Exchange Rate Could Tighten Financial Conditions
A Firm Exchange Rate Could Tighten Financial Conditions
On the consumer side, real retail sales are deflating at the worst pace since the financial crisis, but consumer confidence remains elevated given the robust labor market data (Chart I-12). However, if house prices continue to roll over, confidence is likely to crater (Chart I-13). Chart I-12Canada: Consumer Spending Is Weak
Canada: Consumer Spending Is Weak
Canada: Consumer Spending Is Weak
Chart I-13Canada: The Housing Market Is Softening
Canada: The Housing Market Is Softening
Canada: The Housing Market Is Softening
On the corporate side of the equation, the latest Canadian Business Outlook Survey suggests there has been no meaningful revival in capital spending. This is a big headwind, since Canada finances itself externally rather than via domestic savings. For external investors, the large stock of debt in the Canadian private sector and overvaluation in the housing market are likely to continue leading to equity outflows (from bank shares) on a rate-of-change basis (Chart I-14). Chart I-14Foreign Investors Are Fleeing Canadian Securities
Foreign Investors Are Fleeing Canadian Securities
Foreign Investors Are Fleeing Canadian Securities
Technically, the USD/CAD failed to break below the upward sloping trend line drawn from its 2012 lows, and the series of lower highs since the 2016 peak is forcing the cross into the apex of a tight wedge. The next resistance zone on the downside is the 1.30-1.32 level. Our bias is that this zone will prove to be formidable resistance. We continue to recommend investors short the CAD, mainly via the euro. Housekeeping We were stopped out of our short XAU/JPY position amid fervent buying in gold. Even though we are gold bulls, the rationale behind the trade was that the ratio of the two safe havens was at a speculative extreme. We will stand aside for now and look to re-establish the position in the near future. The Risksbank left rates on hold this week. This was welcome news for our long SEK/NZD position. The weakness in the SEK this year was expected given the surge in summer volatility, but the magnitude of the fall took us by surprise. In general, as soon as President Trump ramped up the trade-war rhetoric and China started devaluing the RMB, the environment became precarious for all pro-cyclical currencies. In terms of strategy going forward, the SEK probably has some additional downside, but not a lot. It is currently the cheapest currency in the G10. Should the Riksbank be actively trying to weaken the currency ahead of ECB policy stimulus this month, the final announcement, depending on what it entails, might be the bottom for the SEK and top for the EUR/SEK. Finally, as the Brexit drama unfolds, the outlook for the pound is highly binary. Aggressive investors can place a buy stop at 1.25 and a sell stop at 1.20. Anything in between should be regarded as noise. Chester Ntonifor, Foreign Exchange Strategist chestern@bcaresearch.com Currencies U.S. Dollar Chart II-1USD Technicals 1
USD Technicals 1
USD Technicals 1
Chart II-2USD Technicals 2
USD Technicals 2
USD Technicals 2
Recent data in the U.S. have been firm: PCE deflator nudged up from 1.3% to 1.4% year-on-year in July. Core PCE was unchanged at 1.6% year-on-year. Michigan consumer sentiment index fell from 92.1 to 89.8 in August. Trade deficit narrowed marginally by $1.5 billion to $54 billion in July. Notably, the trade deficit with China increased by 9.4% to $32.8 billion in July. Initial jobless claims was little changed at 217 thousand for the past week. Unit labor cost increased by 2.6% in Q2. Nonfarm productivity remained unchanged at 2.3%. Factory orders increased by 1.4% month-on-month in July. More importantly on the PMI front, Markit manufacturing PMI was down from 50.4 in July to 50.3 in August. ISM manufacturing PMI deteriorated to 49.1 in August, while ISM non-manufacturing PMI increased to 56.4, up from the previous 53.7 and well above estimates. DXY index fell by 0.5% this week. The recent worries about a near-term recession since the 10/2 yield curve inverted last month has been supporting the dollar, together with possible additional tariffs against China and the Chinese yuan devaluation. Going forward, we believe the dollar strength will ebb, given fading interest rate differentials. Report Links: Has The Currency Landscape Shifted? - August 16, 2019 USD/CNY And Market Turbulence - August 9, 2019 Focusing On the Trees But Missing The Forest - August 2, 2019 The Euro Chart II-3EUR Technicals 1
EUR Technicals 1
EUR Technicals 1
Chart II-4EUR Technicals 2
EUR Technicals 2
EUR Technicals 2
Recent data in the euro area have been firm: Unemployment rate was unchanged at 7.5% in July. Both headline and core preliminary inflation were unchanged at 1% and 0.9% year-on-year respectively in August. PPI fell from 0.7% to 0.2% year-on-year in July. On the PMI front, Markit composite PMI was little changed at 51.9 in August. Manufacturing component was unchanged at 47, while services component nudged up slightly to 53.5. Retail sales growth fell from upwardly-revised 2.8% to 2.2% year-on-year in July, still better than the estimated 2%. EUR/USD appreciated by 0.5% this week. While the manufacturing sector across Europe remain depressed, the services sector seems to be alive and well. The ECB monetary policy meeting next Thursday will be key for the path of the euro. Report Links: Battle Of The Central Banks - June 21, 2019 EUR/USD And The Neutral Rate Of Interest - June 14, 2019 Take Out Some Insurance - May 3, 2019 The Yen Chart II-5JPY Technicals 1
JPY Technicals 1
JPY Technicals 1
Chart II-6JPY Technicals 2
JPY Technicals 2
JPY Technicals 2
Recent data in Japan have been mixed: Housing starts fell by 4.1% year-on-year in July. Construction orders increased by 26.9% year-on-year in July, a positive shift from 4.2% contraction in the previous month. Capital spending growth slowed to 1.9% in Q2. Manufacturing PMI fell slightly to 49.3 in August, while services PMI jumped from 51.8 to 53.3. USD/JPY increased by 0.5% this week. The consumption tax hike in Japan is scheduled for October 1. The tax rate will rise from 8% to 10%, with possible exemption on several goods such as food and non-alcoholic beverages, which could be a drag on domestic spending. That being said, we continue to favor the Japanese yen due to the risk of a recession amid the escalating global trade war. Report Links: Has The Currency Landscape Shifted? - August 16, 2019 Portfolio Tweaks Into Thin Summer Trading - July 5, 2019 Battle Of The Central Banks - June 21, 2019 British Pound Chart II-7GBP Technicals 1
GBP Technicals 1
GBP Technicals 1
Chart II-8GBP Technicals 2
GBP Technicals 2
GBP Technicals 2
Recent data in the U.K. continued to deteriorate: Nationwide house price index was unchanged in August. Markit composite PMI fell to 50.2 in August: Manufacturing component slowed to 47.4; Construction PMI fell to 45; Services component decreased to 50.6. Retail sales contracted by 0.5% year-on-year in August. GBP/USD increased by 1.2% this week. Brexit remains the biggest driver behind the pound. British PM Boris Johnson’s brother resigned this week, citing tension between “family loyalty” and “national interest”. Our Geopolitical Strategy upgraded a no-deal Brexit probability to about 33%, maintaining that it is not the base case since nobody wants an imminent recession. From a valuation perspective, the pound is quite cheap and currently trading far below its fair value. Report Links: Battle Of The Central Banks - June 21, 2019 A Contrarian View On The Australian Dollar - May 24, 2019 Take Out Some Insurance - May 3, 2019 Australian Dollar Chart II-9AUD Technicals 1
AUD Technicals 1
AUD Technicals 1
Chart II-10AUD Technicals 2
AUD Technicals 2
AUD Technicals 2
Recent data in Australia have been mixed: Building approvals keep contracting by 28.5% year-on-year in July. Australian Industry Group (AiG) manufacturing index increased to 53.1 in August. The services index soared to 51.4 in August from a previous reading of 43.9. Current account balance shifted to A$5.9 billion in Q2, the first surplus since 1975. Retail sales contracted by 0.1% month-on-month in July. GDP growth slowed down to 1.4% year-on-year in Q2, the lowest rate in over a decade. Exports and imports both grew by 1% and 3% month-on-month respectively. Trade surplus narrowed marginally to A$7.3 million. AUD/USD increased by 1.4% this week. While Q2 GDP growth rate continued to soften, the current account and PMI data are showing tentative signs of a recovery. On Monday, the RBA kept interest rates unchanged at 1%. In the press release, the Bank acknowledged that low income growth and falling house prices limited household consumption in the first half of the year. Going forward, the tax cuts, infrastructure spending, housing market stabilization, and a healthy resources sector should all support the Australian economy, and put a floor under the Aussie dollar. Report Links: A Contrarian View On The Australian Dollar - May 24, 2019 Beware Of Diminishing Marginal Returns- April 19, 2019 Not Out Of The Woods Yet - April 5, 2019 New Zealand Dollar Chart II-11NZD Technicals 1
NZD Technicals 1
NZD Technicals 1
Chart II-12NZD Technicals 2
NZD Technicals 2
NZD Technicals 2
Recent data in New Zealand have been negative: Consumer confidence improved slightly to 118.2 in August. Building permits continued to contract by 1.3% month-on-month in July. Terms of trade increased to 1.6% in Q2. NZD/USD increased by 1.2% this week. In a Bloomberg interview earlier this week, the New Zealand finance minister Grant Robertson expressed his confidence on the fundamentals of the domestic economy, especially the low unemployment rate and sound wage growth. The largest downside risk remains the global trade and manufacturing slowdown. As a small open economy, New Zealand is ultimately vulnerable to exogenous factors, especially those related to its large trading partners including U.S., China, and Australia. On the policy side, the finance minister believes that there is “still room to move” in terms of monetary policy. Report Links: USD/CNY And Market Turbulence - August 9, 2019 Where To Next For The U.S. Dollar? - June 7, 2019 Not Out Of The Woods Yet - April 5, 2019 Canadian Dollar Chart II-13CAD Technicals 1
CAD Technicals 1
CAD Technicals 1
Chart II-14CAD Technicals 2
CAD Technicals 2
CAD Technicals 2
Recent data in Canada have been mostly negative: Annualized Q2 GDP growth jumped from 0.5% to 3.7% quarter-on-quarter, well above estimates. Bloomberg Nanos confidence fell slightly from 57 to 56.4. Markit manufacturing PMI fell to 49.1 in August, right after a small rebound in July to 50.2. Trade deficit widened to C$1.12 billion in July. USD/CAD fell by 0.5% this week. On Wednesday, BoC held its interest rate unchanged at 1.75%, as widely expected. In its monetary policy statement, the BoC sounded cautiously dovish, and expects economic activity to slow in the second half of the year amid global growth worries. The strong Q2 rebound was mostly driven by cyclical energy production and robust export growth, which could be temporary given the current market volatility. The rate cut probability next month is currently at 40%. Report Links: Portfolio Tweaks Into Thin Summer Trading - July 5, 2019 On Gold, Oil And Cryptocurrencies - June 28, 2019 Currency Complacency Amid A Global Dovish Shift - April 26, 2019 Swiss Franc Chart II-15CHF Technicals 1
CHF Technicals 1
CHF Technicals 1
Chart II-16CHF Technicals 2
CHF Technicals 2
CHF Technicals 2
Recent data in Switzerland have been positive: KOF leading indicator was unchanged at 97 in August. Real retail sales grew by 1.4% year-on-year in July, up from the previous 0.7%. Manufacturing PMI increased to 47.2 in August, up from 44.7 in the previous month. Headline inflation remained muted at 0.3% year-on-year in July. GDP yearly growth slowed to 0.2% in Q2, from a downwardly-revised 1% in Q1. USD/CHF fell by 0.2% this week. We remain positive on the Swiss franc. The global economic slowdown and increasing worries about a near-term recession remain tailwind for the safe-haven franc. Report Links: What To Do About The Swiss Franc? - May 17, 2019 Beware Of Diminishing Marginal Returns - April 19, 2019 Balance Of Payments Across The G10 - February 15, 2019 Norwegian Krone Chart II-17NOK Technicals 1
NOK Technicals 1
NOK Technicals 1
Chart II-18NOK Technicals 2
NOK Technicals 2
NOK Technicals 2
Recent data in Norway have been mostly negative: Retail sales increased by 0.9% year-on-year in July. Current account surplus plunged by 60% from NOK 73.1 billion to NOK 30.6 billion in Q2, the lowest since Q4 2017. USD/NOK fell by 1.3% this week. The rebound in oil prices this week has supported petrocurrencies. On the supply side, the production discipline is likely to be maintained. On the demand side, fiscal stimulus globally should revive overall demand. A potential weaker USD should also support oil prices in the second half of the year, which will be bullish for the Norwegian krone. Report Links: Portfolio Tweaks Into Thin Summer Trading - July 5, 2019 On Gold, Oil And Cryptocurrencies - June 28, 2019 Currency Complacency Amid A Global Dovish Shift - April 26, 2019 Swedish Krona Chart II-19SEK Technicals 1
SEK Technicals 1
SEK Technicals 1
Chart II-20SEK Technicals 2
SEK Technicals 2
SEK Technicals 2
Recent data in Sweden have been mixed: Manufacturing PMI increased slightly to 52.4 in August, from 52 in the previous month. Current account surplus narrowed from SEK 63 billion to SEK 37 billion in Q2. Industrial production increased by 3.2% year-on-year in July. Manufacturing new orders increased by 0.4% in July compared with last month. However, on a year-on-year basis, it fell by 2.2%. The Swedish krona rallied this week, appreciating by 1.4% against USD. The Riksbank held its interest rate unchanged at -0.25% this Thursday, and stated that they still plan to raise interest rates this year or early next, but at a slower pace than the previous forecast. Report Links: Where To Next For The U.S. Dollar? - June 7, 2019 Balance Of Payments Across The G10 - February 15, 2019 A Simple Attractiveness Ranking For Currencies - February 8, 2019 Trades & Forecasts Forecast Summary Core Portfolio Tactical Trades Limit Orders Closed Trades
Highlights The lingering global manufacturing recession and the substantial drop in U.S. bond yields have been behind the decoupling between both EM stocks and the S&P 500, and cyclical and defensive equities. Neither the most recent economic data, nor the relative performance of global cyclicals, China-related plays and high-beta markets herald a broad-based and lasting risk-on phase in global markets. On the contrary, economic and market signposts continue to indicate either further bifurcation in global markets or a risk-off period. We review some of our long-standing themes and associated recommendations. Feature Global financial markets have become bifurcated. On one hand, numerous segments of global financial markets leveraged to global growth, including EM stocks, have already sold off (Chart I-1). On the other hand, share prices of growth companies, defensive stocks and global credit markets have remained resilient. Chart I-2 shows that a similar divergence has taken place within EM asset classes: EM share prices have plummeted while EM corporate credit excess returns have not dropped much. Chart I-1Bifurcated Equity Markets
Bifurcated Equity Markets
Bifurcated Equity Markets
Chart I-2Bifurcated Markets In EM
Bifurcated Markets In EM
Bifurcated Markets In EM
How to explain this market bifurcation? Financial markets sensitive to global trade and manufacturing cycles have been mirroring worsening conditions in global trade and manufacturing. Some of the affected segments include: Global cyclical equity sectors. Emerging Asia manufacturing-related currencies (KRW, TWD and SGD) versus the U.S. dollar (Chart I-3). EM and DM commodity currencies (Chart I-4). Chart I-3Total Return (Including Carry): KRW, TWD And SGD Vs. USD
bca.ems_wr_2019_09_05_s1_c3
bca.ems_wr_2019_09_05_s1_c3
Chart I-4EM And DM Commodity Currencies
EM And DM Commodity Currencies
EM And DM Commodity Currencies
Industrial and energy commodities prices. U.S. high-beta stocks as well as U.S. small caps (Chart I-5). Chart I-5U.S. High-Beta Stocks
U.S. High-Beta Stocks
U.S. High-Beta Stocks
DM bond yields. Crucially, the current global trade and manufacturing downturns have taken place despite robust U.S. consumer spending. In fact, our theme for the past several years has been that a global business cycle downturn would occur despite ongoing strength in American household spending. The rationale has been that China and the rest of EM combined are large enough on their own to bring down global trade and manufacturing, irrespective of strength in U.S. consumer spending. At the current juncture, one wonders whether such a market bifurcation is justified. It is not irrational. The basis for decoupling between cyclical and defensive equities has been U.S. bond yields. The substantial downshift in U.S. interest rate expectations has led to a re-rating of non-cyclicals and growth company stocks. Corporate bonds have also done well, given the background of a falling risk-free rate. Will the current market bifurcation continue? Or will these segments in global financial markets recouple and in which direction? What To Watch China rather than the U.S. has been the epicenter of this slowdown, as we have argued repeatedly in the past. Hence, a major rally in global cyclical equities and EM risk assets all hinge on a recovery in the Chinese business cycle. The basis for decoupling between cyclical and defensive equities has been U.S. bond yields. The substantial downshift in U.S. interest rate expectations has led to a re-rating of non-cyclicals and growth company stocks. Even though Caixin’s PMI for China was slightly up in August, many other economic indicators remain downbeat: The latest hard economic data out of Asia suggest that global trade/manufacturing continues to contract. Korea’s total exports in August contracted by 12.5% from a year ago, and its shipments to China plunged by 20% (Chart I-6). The import sub-component of China’s manufacturing PMI is not showing signs of amelioration (Chart I-7). The mainland’s import recovery is very critical to a revival in global trade and manufacturing. Chart I-6Korean Exports: No Recovery
Korean Exports: No Recovery
Korean Exports: No Recovery
Chart I-7Chinese Imports To Remain Weak
Chinese Imports To Remain Weak
Chinese Imports To Remain Weak
Chart I-8German Manufacturing Confidence
German Manufacturing Confidence
German Manufacturing Confidence
German manufacturing IFO business expectations and current conditions both suggest that it is still early to bet on a global trade recovery (Chart I-8). Newly released August data points reveal that U.S., Taiwanese, and Swedish manufacturing new export orders continue to tumble. To gauge whether bifurcated markets will recouple and whether it will occur to the downside or the upside, investors should watch the relative performance of China-exposed markets, global cyclicals and high-beta plays – the ones that have already sold off substantially. The notion is as follows: These markets’ relative performance will likely bottom before their absolute performance recovers. If so, their relative performance will likely foretell the outlook for their absolute performance. Concerning share prices of growth companies, defensive equity sectors and credit markets, these segments are at risk because of expensive valuations and crowded investor positioning. In other words, they could sell off even if a global recession is avoided. Concerning share prices of growth companies, defensive equity sectors and credit markets, these segments are at risk because of expensive valuations and crowded investor positioning. To assess the outlook for global cyclicals and China-related plays, we are monitoring the following financial market indicators: The Risk-On/Safe-Haven currency ratio is the average of high-beta commodity currencies such as the CAD, AUD, NZD, BRL, CLP and ZAR total return (including carry) indices relative to the average of JPY and CHF total returns (including carry). This ratio is dollar-agnostic. This ratio is making a new cyclical low (Chart I-9). Hence, it presently warrants a negative view on global growth, China’s industrial sector and commodities. Global cyclical equity sectors seem to be on the edge of breaking down versus defensives (Chart I-10). This ratio does not signal ameliorating global growth conditions. Chart I-9The Risk-On/Safe-Haven Currency Ratio
bca.ems_wr_2019_09_05_s1_c9
bca.ems_wr_2019_09_05_s1_c9
Chart I-10Global Cyclicals Versus Defensives
Global Cyclicals Versus Defensives
Global Cyclicals Versus Defensives
Chart I-11U.S. High-Beta Stocks Versus S&P 500
U.S. High-Beta Stocks Versus S&P 500
U.S. High-Beta Stocks Versus S&P 500
Finally, U.S. high-beta stocks continue to underperform the S&P 500 (Chart I-11). This is consistent with overall U.S. growth deceleration. Bottom Line: Neither the most recent economic data, nor the relative performance of global cyclicals, China-related plays and high-beta markets herald a broad-based and lasting risk-on phase in global markets. On the contrary, economic and market signposts continue to foreshadow either further bifurcation in global markets or a risk-off period. Continue trading EM stocks and currencies on the short side, and underweighting EM risk assets versus DM. Our Investment Themes And Positions Some of our open positions often run for years because they reflect our long-standing themes. Our core theme has for some time been that a global trade/manufacturing recession will be generated by a growth relapse in China. To capitalize on this theme, we have been recommending a short EM stocks / long 30-year U.S. Treasurys strategy since April 2017. This recommendation has produced a 25% gain since its initiation (Chart I-12). Continue betting on lower local interest rates in emerging economies where the central bank can cut rates despite currency depreciation. To implement this theme, we have been recommending receiving swap rates in Korea and Chile for the past several years. Our reluctance to recommend an outright buy on local bonds stems from our bearish view on both currencies – the Korean won and Chilean peso. In fact, we have been shorting both the KRW and the CLP against the U.S. dollar. Chart I-13 shows that swap rates in Korea and Chile have dropped substantially since our recommendations to receive rates in these countries. More rate cuts are forthcoming in these economies, and we are maintaining these positions. Chart I-12EM Stocks Have Massively Underperformed U.S. Bonds
EM Stocks Have Massively Underperformed U.S. Bonds
EM Stocks Have Massively Underperformed U.S. Bonds
Chart I-13Continue Receiving Rates In Korea And Chile
Continue Receiving Rates In Korea And Chile
Continue Receiving Rates In Korea And Chile
We have been bearish on EM banks in general and Chinese banks in particular. We have expressed these themes in a number of ways: Short EM and Chinese / long U.S. bank stocks. Short EM banks / long EM consumer staples (Chart I-14). Within Chinese banks, we have been short Chinese medium and small banks / long large ones. All these strategies remain valid. In credit markets, we have been favoring U.S. corporate credit versus EM sovereign and corporate credit. Ability to service debt is better among U.S. debtors than EM/Chinese borrowers. We have been playing this theme in the following ways: Underweight EM sovereign and corporate credit / overweight U.S. investment-grade corporates (Chart I-15). Chart I-14Short EM Banks / Long EM Consumer Staples
Short EM Banks / Long EM Consumer Staples
Short EM Banks / Long EM Consumer Staples
Chart I-15Underweight EM Credit / Overweight U.S. Investment-Grade Corporates
Underweight EM Credit / Overweight U.S. Investment-Grade Corporates
Underweight EM Credit / Overweight U.S. Investment-Grade Corporates
Underweight Asian high-yield corporate credit / overweight emerging Asian investment-grade corporates. As a bet on a deteriorating political and business climate in Hong Kong, in our Special Report on Hong Kong SAR from June 27, we reiterated the following positions: Short Hong Kong property stocks / long Singapore equities. Arthur Budaghyan Chief Emerging Markets Strategist arthurb@bcaresearch.com Mexico: Crying Out For Policy Easing The Mexican economy is heading into a full-blown recession. Most segments of the economy are in contraction, and leading indicators point to further downside. Both manufacturing and non-manufacturing PMIs are well below 50 (Chart II-1). Monetary policy remains too restrictive: Nominal and real interest rates are both very high and plunging narrow money (M1) growth is signaling further downside in economic activity (Chart II-2). Chart II-1The Economy Is Deteriorating
The Economy Is Deteriorating
The Economy Is Deteriorating
Chart II-2Narrow Money Points To Negative Growth
Narrow Money Points To Negative Growth
Narrow Money Points To Negative Growth
An inverted yield curve signifies that the central bank is behind the curve and foreshadows growth contraction (Chart II-3). Fiscal policy has tightened as the government has remained committed to achieving a primary fiscal surplus of 1% of GDP in 2019 (Chart II-4, top panel). Consequently, nominal government expenditures have been curbed (Chart II-4, bottom panel). The government’s fiscal stimulus has not been large and has been implemented too late. Chart II-3A Message From The Inverted Yield Curve
A Message From The Inverted Yield Curve
A Message From The Inverted Yield Curve
Chart II-4Fiscal Policy Has Tightened A Lot
Fiscal Policy Has Tightened A Lot
Fiscal Policy Has Tightened A Lot
Finally, business confidence is extremely low due to uncertainty over President Andrés Manuel López Obrador’s (AMLO) policies towards the private sector. The president is attempting to revive business confidence, but it will take time. Chart II-5Mexico Versus EM: Domestic Bonds And Sovereign Credit
Mexico Versus EM: Domestic Bonds And Sovereign Credit
Mexico Versus EM: Domestic Bonds And Sovereign Credit
Our major theme for Mexico has been that both monetary and fiscal policies are very tight. Consequently, we have been recommending overweight positions in Mexican domestic bonds and sovereign credit relative to their respective EM benchmarks. (Chart II-5). Recessions are bad for share prices, but in tandem with prudent macro policies, they can be positive for fixed-income markets. Meanwhile, we have been favoring the Mexican peso relative to other EM currencies due to the fact that AMLO is not as negative for the country as was initially perceived by markets. With inflation falling and the Federal Reserve cutting rates, Banxico will ease further. Yet, it will likely cut rates slower than warranted by the economy. The longer the central bank takes to ease, the lower domestic bond yields will drop. Concerning sovereign credit, investors should remain overweight Mexico within an EM credit portfolio. Mexico’s fiscal position is healthier, and macroeconomic policies will be more prudent relative to what the market is currently pricing. We continue to believe concerns about Pemex’s financing and its impact on government debt are overblown, as we discussed in detail in our previous Special Report. In July, the government released an action plan for Pemex financing. We view this plan as marginally positive. To supplement this plan, the government can use the $14.5 billion federal budget stabilization fund to fill in financing shortfalls in the coming years. Importantly, the starting point of Mexican public debt is quite low, which will allow the government to finance Pemex in the years to come by borrowing more from markets. Recessions are bad for share prices, but in tandem with prudent macro policies, they can be positive for fixed-income markets. Lastly, our overweight recommendation in Mexican stocks has not played out. However, we are maintaining it for the following reasons: Chart II-6 illustrates that when Mexican domestic bond yields decline relative to EM ones (shown inverted on Chart II-6), Mexican share prices usually outperform their EM counterparts in common currency terms. Consistent with our view that Mexican local currency bonds will outperform their EM peers, we expect Mexican stocks to outpace the EM equity benchmark. The Mexican bourse’s relative performance against EM often swings with the relative performance of EM consumer staples versus the EM equity benchmark. This is due to the large share of consumer staples stocks in Mexico (34.5%) compared to that in the EM benchmark (7%). Consumer staples stocks are beginning to outpace the EM equity index, raising the odds of Mexican equity outperformance versus its EM peers (Chart II-7). Chart II-6Local Bond Yields And Relative Stocks: Mexico Versus EM
Local Bond Yields And Relative Stocks: Mexico Versus EM
Local Bond Yields And Relative Stocks: Mexico Versus EM
Chart II-7Consumer Staples Have A Large Weight In Mexican Bourse
Consumer Staples Have A Large Weight In Mexican Bourse
Consumer Staples Have A Large Weight In Mexican Bourse
We do not expect a major rally in this nation’s stock market given the negative growth outlook. Our bet is that Mexican share prices - having already deflated considerably - will drop less in dollar terms than the overall EM equity index. Bottom Line: We continue to recommend an overweight stance on Mexican sovereign credit, domestic bonds and equities relative to their respective EM benchmarks. The main risk to the Mexican peso stems from persisting selloff in EM currencies. Traders’ net long positions in the MXN are elevated posing non-trivial risk (Chart II-8). We have been long MXN versus ZAR but are taking profit today. This trade has generated a 9.7% gain since March 29, 2018. A plunging oil-gold ratio warrants a caution on this cross rate in the near term (Chart II-9). Chart II-8Investors Are Long MXN
Investors Are Long MXN
Investors Are Long MXN
Chart II-9Take Profits On Long MXN / Short ZAR Trade
Take Profits On Long MXN / Short ZAR Trade
Take Profits On Long MXN / Short ZAR Trade
Juan Egaña, Research Associate juane@bcaresearch.com Arthur Budaghyan Chief Emerging Markets Strategist arthurb@bcaresearch.com Footnotes Equities Recommendations Currencies, Credit And Fixed-Income Recommendations
As the summer holidays become a memory, central banks globally are mobilizing to fight mounting recession risks. More than 30 at last count are busily easing financial conditions to boost growth (Chart of the Week). Going into 4Q19, this monetary stimulus – coupled with fiscal stimulus globally – should allow growth ex-U.S. to revive, which will weaken the USD. This will be bullish for commodity demand in general, oil in particular. Fundamentally, the supply side of the oil market is in good shape. Production discipline by OPEC 2.0 will be maintained, while members of the coalition iterate on the level of output required to keep the rate of growth on the supply side below that of consumption.1 Capital discipline is being forced on U.S. shale-oil operators by markets. This will restrain their output growth rates to levels markets can absorb without inducing unintended inventory accumulation. A ceasefire in the Sino-U.S. trade war also could brighten short-term demand prospects and revive global trade volumes. This would indicate a recovery in manufacturing, given the heavy weight of manufactured goods in trade flows, and also in the the low-sulfur marine fuel markets. Going into 4Q19 and 1Q20, these supply-demand fundamentals will tighten markets, and force crude oil and refined product inventories lower. This will push Brent crude oil prices to our forecast levels of $66 and $75/bbl on average this year and next, with WTI trading $6.50 and $4/bbl under that. In addition, it would further backwardate crude oil forward curves. Chart of the WeekFinancial Conditions Continue Easing
Financial Conditions Continue Easing
Financial Conditions Continue Easing
Among the risks to this view: Too-weak monetary/fiscal stimulus, leading to a failure to revive demand and stave off recession; a breakdown in OPEC 2.0’s production discipline; an expansion of the Sino-U.S. trade war; a disorderly Brexit; and, critically, a stubbornly strong USD, which raises the risk of direct intervention in FX markets by the U.S. central bank. Highlights Energy: Overweight. Saudi Aramco’s board of directors apparently has ruled out a listing of its IPO in New York, owing to legal risk in the U.S., according to Reuters news service.2 Riyadh and London reportedly are favored by board members. The Kingdom’s Crown Prince Mohammed bin Salman reportedly has the final say. Base Metals: Neutral. The nickel rally likely corrects over the short term, after a vertical shot that lifted the metal ~56.2% between early June and this week. This was partly fueled by speculation over commentary from an Indonesian official in July reinforcing the country’s stated goal of banning raw ore exports by 2022. Indonesia is the largest nickel ore producer in the world.3 Precious Metals: Neutral. Our tactical long platinum position is up 3.9% since it was recommended last week. We continue to expect platinum will draft in gold’s wake, benefiting from safe-haven demand for precious metals generally. Fundamentally, the risk of power outages in South Africa, which produces ~67% of the world’s platinum, remains high this month, putting platinum-group metal production at risk there. Technically, the metal held long-term support at $785/oz this year – a level that goes back to the Global Financial Crisis lows – and has since rallied ~ 18%. Ags/Softs: Underweight. Chinese tariffs on U.S. soybean imports went up 5% to a total of 30% September 1, coinciding with the imposition of additional tariffs on $300 billion of Chinese imports. Feature USD strength remains a headwind to stronger EM growth, which is keeping oil demand growth in check (Chart 2).4 Indeed, in local-currency terms, oil prices remain closer to their 2014 highs, when Brent and WTI were trading above $100/bbl (Chart 3). The persistently strong USD is one reason we lowered our oil-demand forecast four times this year, which puts it at 1.2mm b/d for 2019. Chart 2USD Strength Hinders Oil Demand Growth
USD Strength Hinders Oil Demand Growth
USD Strength Hinders Oil Demand Growth
Chart 3USD Strength Keeps Local-Currency Costs High
USD Strength Keeps Local-Currency Costs High
USD Strength Keeps Local-Currency Costs High
The slowdown in global oil demand began in 2H18 and picked up speed in 1H19. We believe this largely was the result of a global tightening in financial conditions – apparent in the Chart of the Week – led by the Fed, which, with near-singular determination, raised its policy rate four times last year. Fed policy kept USD-denominated assets well bid, but, equally importantly, it raised the costs of commodities and all goods and services invoiced in USD globally in local-currency terms. This reduced aggregate demand ex-U.S. as households’ and firms’ discretionary incomes fell.5 Commodity demand also was derailed by the extended de-leveraging campaign by Chinese policymakers, which ran from 2017-18 and succeeded in its goal of bringing down the country’s debt-to-GDP ratio and the growth rate of leverage. Central Banks Scramble To Revive Growth The Treasury may be forced to up the ante and directly intervene in FX markets to weaken the dollar. To reverse the tightening of monetary conditions worldwide, central banks this year started moving to more accommodative monetary-policy settings, which we expect will continue to support looser financial conditions around the globe. In addition, fiscal stimulus either is being deployed or readied in key EM economies like China and India, which, together, account for 36% of the 53.5mm b/d of EM oil consumption we estimate for 2019. These policy responses should revive GDP growth – particularly in EM economies – and, all else equal, oil demand in the process going into 4Q19. The performance of our leading indicators support this expectation (Chart 4). That said, with so many systematically important central banks weakening their currencies, the USD could remain strong in relative terms.6 If the dollar remains a safe-haven asset in uncertain markets, while serving as the world’s reserve/invoicing/funding currency, weakening the USD during a period of high financial stress could be difficult. In that case, the Treasury may be forced to up the ante and directly intervene in FX markets to weaken the dollar. Chart 4Global LEIs Bottomed And Are Moving Up
Global LEIs Bottomed And Are Moving Up
Global LEIs Bottomed And Are Moving Up
Managing Financial Conditions In A Trade War We do not expect the Sino-U.S. trade war to be resolved. National security, foreign policy and technology positions that have been advanced by both sides appear impossible to walk back (e.g., protecting 5G networks from spying, and safeguarding intellectual property). This suggests the Sino-U.S. relationship is in the early stages of a Cold War, which could go hot in the short run.7 Still, a short-term agreement or ceasefire this year or next is still possible. The basis for such a shift would be President Trump staging a retreat to try to clinch a deal and improve the economy prior to his re-election campaign. China might accept a temporary reprieve. This would allow both sides to retreat to re-group for the almost-certain renewed trade tension that will mark the Sino-U.S. relationship going forward. Over the short run, a ceasefire could brighten demand prospects and revive global trade volumes. This would be supportive of crude oil and refined-products markets, particularly the low-sulfur marine fuel market, which, on January 1, will be bound by IMO 2020 standards.8 In the medium to longer-run, however, neither the U.S. nor China will cede ground if it strengthens the hand of the other, particularly regarding national security and technology, which will continue to be the key concern for all national security issues. This complicates fiscal and monetary policy for both sides going forward, along with trade relationships for each. We do not believe either side has these issues sorted, and likely will need time and space to develop policies for the medium- and longer-term. It also means each side’s respective allies will have to make hard choices in deciding whose camp they will migrate toward. These considerations cloud the outlook for the medium- to long-term oil markets. We will be exploring them in greater depth in forthcoming Commodity & Energy Strategy reports. Investment Implications We remain broadly long in our exposure to oil markets, expecting the fundamentals outlined above to tighten supply, strengthen demand and draw down inventories. Given this view, we remain long WTI flat price, and long 4Q19 Brent futures vs. short 4Q20 Brent futures, expecting a steeper backwardation. We also remain long the S&P GSCI commodity index, given its relatively heavy exposure to energy markets. Bottom Line: Supply-demand fundamentals, coupled with a favorable fiscal and monetary backdrop, indicate oil prices will move higher from current levels toward our forecasts of $75/bbl and $71/bbl next year for Brent and WTI, respectively. This view is not without risk – chiefly around the Sino-U.S. trade war, and the risk that an expansion of tensions would stunt global demand for oil significantly. We continue to follow this closely. Robert P. Ryan, Chief Commodity & Energy Strategist rryan@bcaresearch.com Footnotes 1 OPEC 2.0 is the name we coined for the producer coalition led by the Kingdom of Saudi Arabia (KSA) and Russia. It was formed in 2016 to manage production and reduce oil inventory levels globally. For a complete summary of our supply-demand expectations for this year and next, please see the August 22, 2019 Commodity & Energy Strategy Weekly Report, "USD Strength Slows Oil Demand Growth; 2020 Brent Forecast Remains At $75/bbl". 2 Please see Exclusive: Saudi Aramco board sees too many risks for New York IPO - sources, published by reuters.com August 30, 2019. 3 Please see Nickel price forecast revised up as speculative rally boosts tight market — report, published by mining.com August 29, 2019. 4 We have shown in previous research EM income growth accounts for most of the growth in oil demand globally. This year, for example, we expect EM demand growth to account for 87% of 2019’s 1.2mm b/d growth in oil consumption. Next year, EM is expected to account for 79% of the 1.5mm b/d of growth we expect. For this reason, oil prices – and base metals prices – are a good barometer of the of EM income growth. 5 Maurice Obstfeld noted at the Fed’s June 2019 Conference on Monetary Policy Strategy, Tools, and Communication Practices (A Fed Listens Event) that the USD is not only the world’s reserve currency, it also is the dominant invoicing and funding currency. “… the dollar’s invoice-currency role affects the international price mechanism by influencing how U.S. monetary policy will move real exchange rates, inflation, and export competitiveness throughout the world. … (The) dollar’s funding currency role mediates the transmission of U.S. monetary policy to global financing conditions. “Through both mechanisms, U.S. monetary policy has an outsized impact on global economic activity – consistent with the evidence on unconventional policy spillovers. … The Federal Reserve, more than other central banks, should therefore consider spillbacks from the global economy as a relevant transmission mechanism for its policies.” Prof. Obstfeld’s paper can be downloaded at the Fed website, Global Dimensions of U.S. Monetary Policy. 6 In the August 26, 2019, issue of BCA Research’s U.S. Investment Strategy, our colleague Doug Peta, chief U.S. investment strategist, notes, “No central bank wants a stronger currency while confronting a demand deficiency aggravated by trade tensions and a global manufacturing slowdown. The New York Times Business section put the prevailing policy winds into living color in a nearly full-page, four-column graphic spotlighting the 32 central banks that have cut their policy rate so far this year.” For further discussion, please see Market Messages, published August 26, 2019, by BCA Research’s U.S. Investment Strategy. It is available at usis.bcaresearch.com. 7 Our geopolitical strategists make the odds of a trade agreement 40%, perhaps a bit higher. Please see Big Trouble In Greater China, published August 23, 2019, by BCA Research’s Geopolitical Strategy, for an excellent discussion of the fraught Sino-U.S. relationship. It is available at gps.bcaresearch.com. 8 We expect global shipping-fuels market to tighten as UN-mandated fuel standards kick in next year. This will keep ship fuels, specifically Gasoil and ULSFO, and other distillate prices – e.g., diesel and jet fuel – elevated relative to other refined products like gasoline. This will boost demand for lighter, sweeter crudes – particularly Brent and similar grades – that allow refiners to raise distillate yields, as they scramble to meet higher demand for low-sulfur ship-fuel next year. For more information on IMO 2020, please see IMO 2020: The Greening Of The Ship-Fuel Market, published by BCA Research’s Commodity & Energy Strategy February 28, 2019. It is available at ces.bcaresearch.com. Investment Views and Themes Recommendations Strategic Recommendations Tactical Trades TRADE RECOMMENDATION PERFORMANCE IN 2019 Q2
Central Bank Easing Key To Oil Prices
Central Bank Easing Key To Oil Prices
Commodity Prices and Plays Reference Table Trades Closed in 2019 Summary of Closed Trades
Central Bank Easing Key To Oil Prices
Central Bank Easing Key To Oil Prices
Highlights Coincident measures of economic activity suggest that China’s economy continued to slow in July. The August manufacturing PMIs were positive, but they more likely reflect tariff front-running activity than a genuine improvement in the export outlook. The decline in the RMB will have a positive reflationary effect for Chinese producers, but it will not likely be enough to prevent a further slowdown in activity if the export outlook continues to deteriorate (as we expect). Our investment strategy recommendations remain unchanged: underweight Chinese stocks over a tactical (i.e. 0-3 month) time horizon, but overweight cyclically (6-12 months) on the basis that policymakers will ultimately act on the need to ease further. Feature Tables 1 and 2 on pages 2 and 3 highlight key developments in China’s economy and its financial markets over the past month. On the growth front, coincident measures of economic activity suggest that China’s economy continued to slow in July. The August manufacturing PMIs were positive (especially the Caixin PMI), but the absence of a pickup in manufacturing outside of China suggests that the August improvement (and the recent trend in China’s export data) reflects the same kind of tariff front-running activity that has occurred on more than one occasion over the past 18 months (and which sharply unwound in late-2018 / early-2019). On the housing front, July’s update saw a narrowing in the gap between lofty housing construction and depressed sales volume, suggesting that housing-related activity is unlikely to provide a ballast to counter a weakening external demand outlook absent further policy support for the sector. Table 1China Macro Data Summary
China Macro And Market Review
China Macro And Market Review
Table 2China Financial Market Performance Summary
China Macro And Market Review
China Macro And Market Review
Within financial markets, the continued decline in the RMB is the most noteworthy development, with USD-CNH having risen roughly 4.5% since we initiated our long position in mid-May. The still-controlled decline is likely to have a reflationary effect for Chinese producers, but not likely enough to prevent a further slowdown in activity if the export outlook continues to deteriorate in Q4 (as we expect). Consequently, our investment strategy recommendations remain unchanged: the near-term outlook remains bearish for China-related assets, but Chinese policymakers will be forced over the coming 3-6 months to recognize the need to ease further. Investors should remain overweight Chinese stocks over a 6-12 month horizon, but should continue to hedge RMB exposure by being long USD-CNH. In reference to Tables 1 and 2, we provide below several detailed observations concerning developments in China’s macro and financial market data: Chart 1The Chinese Economy Continues To Slow
The Chinese Economy Continues To Slow
The Chinese Economy Continues To Slow
Based on coincident activity indicators such as the Li Keqiang index (LKI), China’s economy continued to slow in July (Chart 1). While the pace of growth remains stronger today than it did during the depths of the 2015/2016 slowdown, momentum is clearly negative and a further deceleration is likely over the coming few months. In short, Chinese growth has not yet bottomed. Our leading indicator for the LKI remains in a shallow uptrend, but slowed in July. The sequential decline occurred in nearly all of the components of the indicator; credit was particularly disappointing, with adjusted total social financing growth having decelerated nearly a half a percentage point on a YoY basis. Our indicator underscores that more easing will ultimately be needed in order to stabilize economic activity, even though we acknowledge that it will only likely arrive in piecemeal fashion until policymakers are pressured with a further significant slowdown in growth. The July housing data update was significant, as it featured a narrowing of the gap between lofty housing construction and depressed sales volume (Chart 2). While both the pace of pledged supplementary lending as well as sales volume growth marginally improved in July, floor space started decelerated to mid-single-digit territory (from 10+%). We have noted in several reports that the gap between starts and sales is unsustainable, suggesting that housing-related activity is unlikely to provide a ballast to counter a weakening external demand outlook absent further policy support. At first blush, China’s August PMIs were surprisingly positive. While the official manufacturing PMI slightly declined, the new export orders component improved as did the overall Caixin manufacturing PMI. The improvement in the latter was particularly significant, as it brought the index back into expansionary territory. However, our view of the pickup is less sanguine, and we expect it to reverse over the coming few months. August’s trade data has yet to be released, but the divergence between export and import growth in July provides a clue that the pickup in manufacturing/export sentiment is likely to be temporary. Ex-China, the global PMI has not meaningfully improved (Chart 3), which implies that the acceleration in Chinese export growth is indicative of the same kind of tariff front-running activity that has occurred on more than one occasion over the past 18 months (and which sharply unwound in late-2018 / early-2019). As a result, investors should view the near-term improvement in Chinese export-related data as a sign of an impending slowdown in trade activity, rather than an indication that the underlying trade situation is improving. Chart 2The Unsustainable Pace Of Housing Starts Is Slowing
The Unsustainable Pace Of Housing Starts Is Slowing
The Unsustainable Pace Of Housing Starts Is Slowing
Chart 3China's August PMI Likely Reflects Tariff Front-Running
China's August PMI Likely Reflects Tariff Front-Running
China's August PMI Likely Reflects Tariff Front-Running
Chart 4A-Shares Are Trading More Off Domestic Stimulus Odds Than Investable Stocks
A-Shares Are Trading More Off Domestic Stimulus Odds Than Investable Stocks
A-Shares Are Trading More Off Domestic Stimulus Odds Than Investable Stocks
The most relevant high-level insight emanating from China’s equity markets continues to be the divergence in performance between investable and domestic stocks over the past three months. While investable stocks have trended lower due to the strong focus of foreign investors on the trade war, domestic stocks have moved sideways versus the global benchmark in US$ terms (Chart 4). To us, this suggests that domestic stocks are acting as a better barometer of domestic reflation than their investable peers and, for now, A-shares are acting as if reflationary efforts will just offset weak external demand. The likelihood of a further growth slowdown coupled with the reluctance of Chinese policymakers to aggressively stimulate implies that the domestic market is at risk of a near-term relapse, but global investors should watch closely for a breakout to the upside as an indication that policy is becoming considerably easier (and that investable stocks may soon follow the domestic market higher). Over the past month, sector performance within the investable equity market has mostly been along cyclical/defensive lines, with the former underperforming the latter. One notable exception is the investable consumer discretionary sector, which has risen more than 7% over the past month in absolute US$ terms, and has been rising in relative terms since the beginning of the year. Alibaba now accounts for a sizeable portion of the investable consumer discretionary sector, and its outperformance may be signaling a stable outlook for domestic consumer spending. China’s interbank and government bond market has been little changed over the past month. After having declined roughly 20 bps from late-July to early-August, Chinese government bond yields remain at a nearly 3-year low as part of ongoing investor expectations that monetary policy in China will remain easy. The PBOC’s mid-August reform of the loan prime rate (LPR) was a small step in the direction of further easing, but was not likely large enough to have a material impact on credit growth. More fiscal spending remains the most likely avenue for significant additional stimulus, but we do not expect it to materialize before economic activity slows further. Chart 5Onshore Corporate Bond Returns: Negligant Impact Of Defaults
Onshore Corporate Bond Returns: Negligant Impact Of Defaults
Onshore Corporate Bond Returns: Negligant Impact Of Defaults
Chinese onshore corporate bond spreads fell slightly over the past month, reversing part of a modest uptrend in spreads that had begun in May. Abstracting from the day-to-day changes in spreads, the bigger story is that acute concerns over the potential for widespread corporate defaults have not led to any material impact on onshore corporate bond performance at any point over the past 18 months (which is in line with what we argued several times last year). In RMB terms the ChinaBond Corporate Bond Total Return Index has risen nearly 8% over the past year, or roughly 2.6% in unhedged US$ terms using spot exchange rates (Chart 5). While we would not advise an unhedged currency position in onshore corporate bonds at this time given our long stance towards USD-CNH, the bottom line for investors is that onshore corporate bond spreads already account for rising defaults, and probably overstate the risk. China’s controlled but very significant currency depreciation has continued over the past month, with USD-CNH having nearly reached 7.2 this week. Our earnings recession model for the MSCI China index suggests that the depreciation is likely to have a stimulative effect; holding the current pace of credit growth and the outlook for new export orders constant, the decline in the RMB has probably cut the odds of an ongoing contraction in EPS from roughly two-thirds to slightly over one-half over the past month. However, we noted above that the modest improvement in China’s manufacturing PMIs likely reflects unsustainable trade frontrunning, signaling that further stimulus will likely be required. This will have to come either through a more intense pace of credit growth, or meaningful further currency depreciation (or both). As such, investors should stay long USD-CNH for now, despite the significant rise over the past month. Jonathan LaBerge, CFA, Vice President Special Reports jonathanl@bcaresearch.com Jing Sima China Strategist jings@bcaresearch.com Cyclical Investment Stance Equity Sector Recommendations