Currencies

Highlights The failure of the dollar to break out amid one of the most bullish fundamental catalysts in months suggests that many opposing tectonic forces are at play. Our bias is that short-term and longer-term investors are caught in a tug-of-war. Longer-term headwinds are a deteriorating balance-of-payment backdrop. Shorter-term tailwinds are ebbing global growth. Traders who have become accustomed to buying the dollar as a safe haven should be cognizant that correlations could be shifting amid the fall in global bond yields. The yen and gold remain the currencies of choice in this environment. Despite economic headwinds, the BoJ has historically needed an external shock to act, suggesting the path towards additional stimulus will be lined with a stronger yen. Our bias is that USD/JPY could weaken to 100 in the next three-to-six months, especially if market volatility spikes further. If global growth eventually picks up, the yen will surely weaken on its crosses, but could still strengthen versus the dollar. The reversal in the EUR/GBP is worth monitoring. Aggressive investors can short the pair now for a trade. Feature Chart I-1A Worrisome Development
A Worrisome Development
A Worrisome Development
Consider the events over the last few weeks: U.S. President Donald Trump blindsided investors by firing a new salvo in the trade war. China retaliated by depreciating the RMB below the psychologically important 7 level. In Argentina, a heavy loss for reformist Mauricio Macri has sent the peso down almost 40% this year. Venezuela is now completely shut off from the U.S., given continued friction between the regime of incumbent Nicolás Maduro and Juan Guaidó. In Europe, Boris Johnson has all but assured us that he is taking the U.K. out of the EU, sending the pound to near post-referendum lows. And on the global economic front, July manufacturing data was dismal across the board. This is nudging the U.S. 10-year versus 2-year Treasury yield curve into inversion, adding to the recessionary indicators that have accumulated so far (Chart I-1). Both gold and the yen have bounced in sympathy with these developments, but the trade-weighted dollar (either using the DXY or the Federal Reserve’s broader measure) is up only circa 1% over the last month. Had a currency manager taken a one-month leave of absence, this setup would be incredibly perplexing upon return. Has the investment landscape changed, or are both traders and algorithmic platforms sitting on the sidelines given thin summer trading? More importantly, has the dollar lost its crown as a safe-haven currency? The answers to these questions are obviously very important for the cyclical view on the dollar. Is This Time Different? It is too early to tell if the dollar’s muted response is just the lagged effect of thin summer trading, or a signal towards much bigger opposing forces at play. What we can infer is that both short-term and longer-term investors are caught in a tug-of-war, currently in a stalemate. The short-term boost for the dollar comes from the fact that global growth is weak and the U.S. economy has the upper hand, given the smaller contribution from the manufacturing sector to GDP. Meanwhile, U.S. interest rates, while falling, remain among the most attractive in the developed world. Portfolio flows into the U.S. economy is the ultimate link between global growth and the dollar. The caveat is that these bullish factors are slowly ebbing. We have argued in past reports that global growth will soon bottom, if past correlations between monetary stimulus and economic growth hold. Meanwhile, the Federal Reserve is slated to become more dovish, which will remove an important tailwind for the dollar (Chart I-2). The latest comments from Olli Rehn, governor of the Finnish central bank and member of the ECB’s rate-setting committee, suggests that significant stimulus will be forthcoming in September. This should keep a bid under the DXY index. However, investors also understand that other governments are unlikely to sit pat and watch their trading partners wage a currency war. Political pressure towards lower rates is now as high as it has ever been (Chart I-3), a change from the past. Chart I-2The U.S. Yield Advantage Is Fading
The U.S. Yield Advantage Is Fading
The U.S. Yield Advantage Is Fading
Chart I-3Political Pressure To Cut Rates
Political Pressure To Cut Rates
Political Pressure To Cut Rates
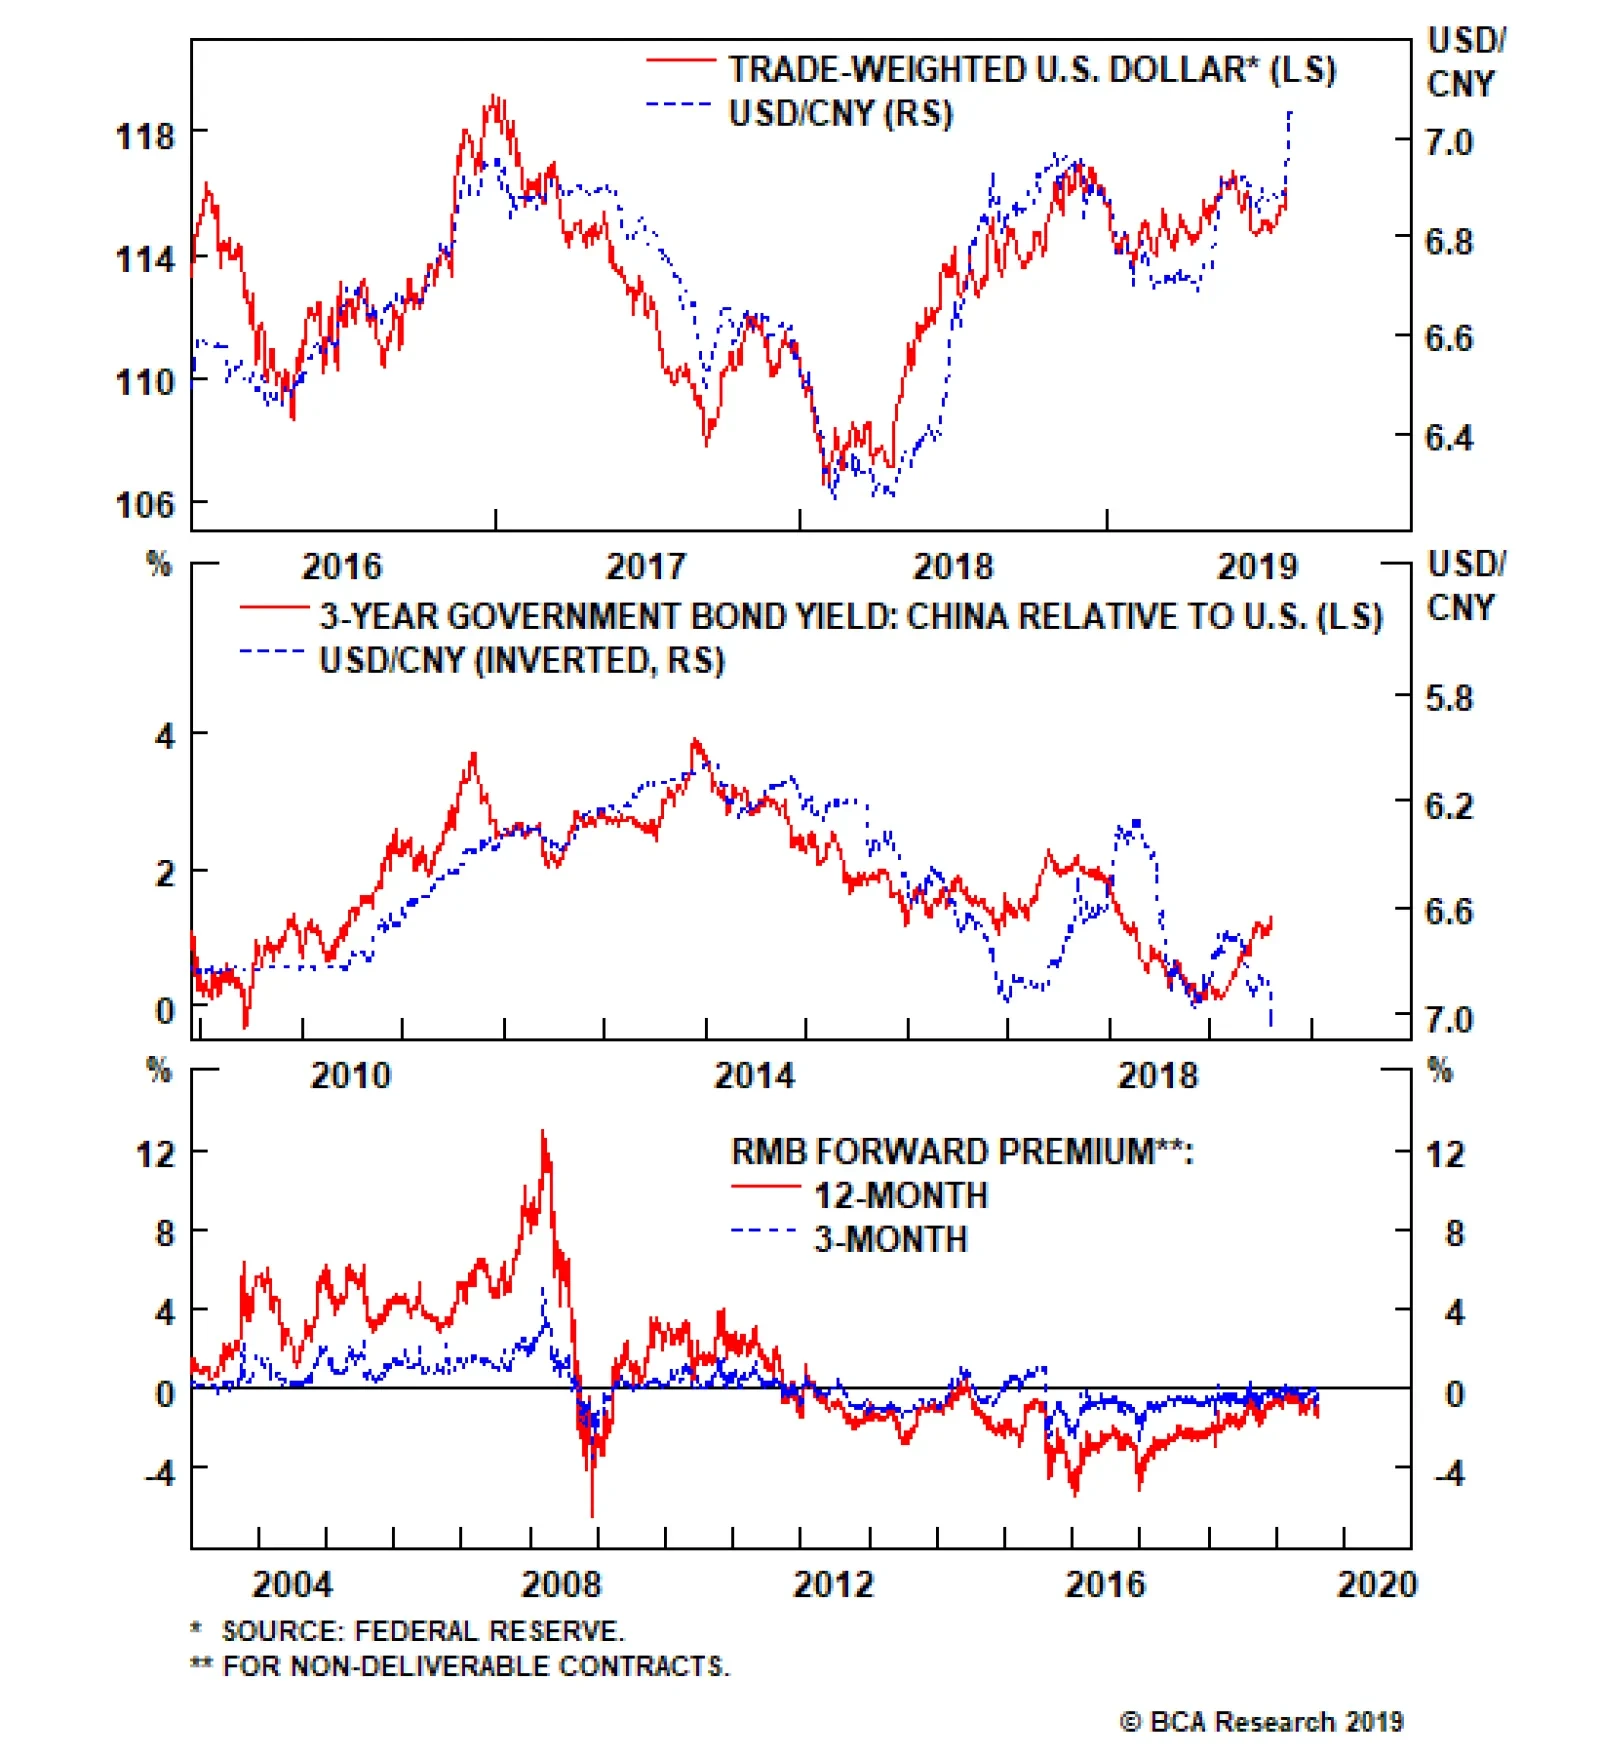
But why has the dollar not strengthened more in the interim, given that bullish forces remain present? The answer lies in underlying portfolio flows into the U.S. economy, which is the ultimate link between global growth and the dollar. Everyone understands the standard feedback loop between global growth and the greenback. The U.S., being a relatively closed economy, sees outflows when global growth is improving. This is because capital tends to gravitate to higher-yielding currencies that are more levered to the manufacturing cycle. And during risk-off environments, that capital finds its way back home – the so-called “home-bias” – that boosts the dollar. This has been the story for most of the last two decades. However, things began to shift a few years ago. Following cascading crises (in Europe, Japan and even some commodity-producing countries, for example), interest rates outside the U.S. began to fall rapidly, and the U.S. bond market became one of the most attractive in yield terms. For example, at the onset of 2014, 10-year bond yields were at 4.4% in Australia while they were sitting at 3% in the U.S. Today, a 10-year Australian bond yields 0.9% while 10-year Treasurys are at 1.5%. The implication is that the U.S. dollar has now become an object of carry trades itself, as confirmed by current positioning data (Chart I-4). However, here comes the important crux. It is difficult for the dollar to act as both a safe-haven and a carry currency, because the forces that drive both move in opposite directions. For one, safe-haven assets tend to be lower-yielding, but also during episodes of capital flight, investors choose to repatriate capital to pay down debt, with creditor nations having the upper hand. And given that U.S. investors have already been repatriating close to $300 billion in assets over the past 12 months (in part because of better returns, but also because of the 2017 Trump tax cuts), the dollar’s safe-haven bid has partially evaporated. Traders who have been used to buying the dollar as a safe haven should be cognizant that correlations may have shifted amid the fall in global bond yields. Flows into the U.S. capital markets are instructive. What has been supporting capital flows into the U.S. are agency, corporate, and Treasury bond purchases, with foreign investors already stampeding out of U.S. equities at the fastest pace on record (Chart I-5). This is because the starting point for the U.S. is an equity market that is one of the most overvalued, dictating that subsequent returns will pale by historical comparison.
Chart I-4
Chart I-5Banks Have Been Supporting U.S. Inflows
Banks Have Been Supporting U.S. Inflows
Banks Have Been Supporting U.S. Inflows
Meanwhile, cracks are beginning to appear in the Treasury market, one of the last pillars of support for U.S. inflows. Foreign officials have already been exiting the U.S. bond market for both geopolitical and balance-of-payment concerns, but private purchases still remain robust. However, the latest data shows that net foreign private purchases of U.S. Treasury bonds have rolled over from about $220 billion dollars earlier this year to about $200 billion currently. Ebbs and flows in the U.S. Treasury market have historically had a great track record of capturing major turning points in the U.S. bond yields over the last decade (Chart I-6). To be sure, these flows are still positive, with June data robust, but they are rolling over. It is likely that July and August data will be stronger, given the drop in yields. However, long Treasurys and long dollar positions are some of the most crowded trades today. The bottom line is that if the dollar cannot rise under a bullish near-term backdrop, it is likely to fall hard when these fundamental forces evaporate. Monitoring the bond-to-gold ratio is a good way to gauge where the balance of forces are shifting, and the picture is not constructive for dollar bulls (Chart I-7). Meanwhile, currencies such as the Japanese yen or even the Swiss franc, which have been used to fund carry trades, remain ripe for further short-covering flows. Chart I-6What Happens When Bond Investors Flee?
What Happens When Bond Investors Flee?
What Happens When Bond Investors Flee?
Chart I-7Unsustainable Divergence
Unsustainable Divergence
Unsustainable Divergence
Bottom Line: Traders who have been used to buying the dollar as a safe haven should be cognizant that correlations may have shifted amid the fall in global bond yields. Stay Short USD/JPY Should the selloff in global risk assets persist, the yen will strengthen further. On the other hand, if global growth does eventually pick up, the yen could weaken on its crosses but strengthen vis-à-vis the dollar. This places short USD/JPY bets in an enviable “heads I win, tails I do not lose too much” position. Economic data from Japan over the past few weeks suggests the economy is not yet succumbing to pressures of weak external growth (Chart I-8). The services PMI remains relatively high compared to manufacturing, vehicles sales are accelerating at a 7% year-on-year pace and bank lending is still robust. The labor market also remains relatively tight, with Tokyo office vacancies hitting post-crisis lows. The preliminary print of second quarter GDP growth slowed to 1.8% from 2.2%, but this was entirely driven by the external sector. A return towards deflationary pressures will eventually force the Bank of Japan’s hand, but the yen will strengthen in the interim. What these developments suggest is that the hurdle for delaying the consumption tax is now extremely high. And since the late 1990s, every time Japan’s consumption tax has been hiked, the economy has slumped by an average of over 1.3% in subsequent quarters. A return towards deflationary pressures will eventually force the Bank of Japan’s hand, but the yen will strengthen in the interim. This is because the BoJ will need to come up with even more unconventional policies, something that requires time. Total annual asset purchases by the BoJ are currently running at about ¥22 trillion, while JGBs purchases are running below ¥20 trillion. This is a far cry from the central bank’s soft target of ¥80 trillion, and unlikely to change anytime soon, since JGB yields are trading near the floor of the central bank’s range (Chart I-9). Chart I-8Japan Is Fine For Now
Japan Is Fine For Now
Japan Is Fine For Now
Chart I-9The BoJ Is Out Of Bullets
The BoJ Is Out Of Bullets
The BoJ Is Out Of Bullets
It is important to remember why deflation is so pervasive in Japan, making the BoJ’s target of 2% a bit of a pipedream if it stands pat. The overarching theme for prices in Japan is a rapidly falling (and rapidly ageing) population, leading to deficient demand (Chart I-10). Meanwhile, domestically, an aging population (that tends to be the growing voting base), prefers falling prices. What is needed is to convince the younger generation to save less and consume more, but that is almost impossible when high debt levels lead to insecurity about the social safety net. Hence the reason for the consumption tax, which has historically been deflationary. Chart I-10Deflation Is Pervasive In Japan
Deflation Is Pervasive In Japan
Deflation Is Pervasive In Japan
On the other side of the coin, the importance of financial stability to the credit intermediation process has been a recurring theme among Japanese policymakers, with the health of the banking sector an important pillar. YCC and negative interest rates have been anathema for Japanese net interest margins and share prices (Chart I-11). This, together with QE, has pushed banks to search for yield down the credit spectrum. Any policy shift that is increasingly negative for banks could easily tip them over. This suggests the shock needed for either the BoJ or the government to act has to be “Lehman” like. The eventual bottom in global growth is a key risk to a long yen position. However, inflows into Japan could accelerate, given cheap equity valuations and improved corporate governance that has been raising the relative return on capital. The propensity of investors to hedge these purchases will dictate the yen’s path. The traditional negative relationship between the yen and the Nikkei still holds but has been weakening in recent years. Over the past few years, an offshoring of industrial production has been marginally eroding the benefit of a weak yen/strong Nikkei. If a company’s labor costs are no longer incurred in yen, then the translation effect for profits is reduced on currency weakness (Chart I-12). Chart I-11Japan: More Easing Will Kill Banks
Japan: More Easing Will Kill Banks
Japan: More Easing Will Kill Banks
Chart I-12The Nikkei And Yen Have Diverged
The Nikkei And Yen Have Diverged
The Nikkei And Yen Have Diverged
Bottom Line: Inflation expectations are falling to rock-bottom levels in Japan, at a time when the BoJ may be running out of policy bullets. Meanwhile, the margin of error for the BoJ is non-trivial, since a small external shock could tip the economy back into deflation. The BoJ will eventually act, but it may first require a riot point (Chart I-13). Remain short USD/JPY. Chart I-13What More Could The BoJ Do?
What More Could The BoJ Do?
What More Could The BoJ Do?
Housekeeping Chart I-14Look To Sell EUR/GBP
Look To Sell EUR/GBP
Look To Sell EUR/GBP
Tactical investors could try selling EUR/GBP for a trade ahead of our actual limit-sell at 0.95. The ever-shifting political landscape warrants tight stops, but despite all the noise, economic surprises in the euro area are rolling over relative to the U.K., which usually benefits the pound (Chart I-14). Finally, the Norges bank has chosen to remain on hold, though has begun to sound less hawkish. We remain long NOK/SEK but are ready to take profits on any sign a currency war is intensifying, or that oil prices are headed much lower. Chester Ntonifor, Foreign Exchange Strategist chestern@bcaresearch.com Currencies U.S. Dollar Chart II-1USD Technicals 1
USD Technicals 1
USD Technicals 1
Chart II-2USD Technicals 2
USD Technicals 2
USD Technicals 2
Recent data in the U.S. have been robust: Headline and core inflation both edged up 10 bps to 1.8% and 2.2% year-on-year respectively in July. Mortgage applications surged by 21.7%, reversing prior weakness in the MBA Purchase Index. NY Empire State manufacturing index increased to 4.8 in August; The Philly Fed manufacturing index fell to 16.8, still well above the consensus of 9.5. Retail sales jumped by 0.7% month-on-month in July, up from downwardly-revised 0.3% in June. Nonfarm productivity grew by 2.3% quarter-on-quarter in Q2; The unit labor costs went up 2.4% quarter-on-quarter. Real hourly earnings in July however, slowed to 1.3% year-on-year. Industrial production fell by 0.2% month-on-month in July. DXY index appreciated by 0.6% this week. Consumer prices rebounded in July, mostly driven by shelter, and medical care services. This marginally lowered the prospect for more aggressive rate cuts by the Federal Reserve. Report Links: USD/CNY And Market Turbulence - August 9, 2019 Focusing On the Trees But Missing The Forest - August 2, 2019 Global Growth And The Dollar - July 19, 2019 The Euro Chart II-3EUR Technicals 1
EUR Technicals 1
EUR Technicals 1
Chart II-4EUR Technicals 2
EUR Technicals 2
EUR Technicals 2
Recent data in the euro area continue to deteriorate: ZEW sentiment fell to -43.6 in August, the lowest since 2012. Preliminary GDP yearly growth was flat at 1.1% year-on-year in Q2, even though the German economy stagnated. Industrial production contracted by 2.6% year-on-year in June. Employment growth slowed to 1.1% year-on-year in Q2. EUR/USD fell by 0.9%, following the relatively soft data. However, if the world economy avoids recession, it will be tough for data to deteriorate meaningfully from current levels. We believe that manufacturing data will get a boost once global growth stabilizes. Meanwhile, the euro is currently trading at an attractive discount to its fair value. Report Links: Battle Of The Central Banks - June 21, 2019 EUR/USD And The Neutral Rate Of Interest - June 14, 2019 Take Out Some Insurance - May 3, 2019 Japanese Yen Chart II-5JPY Technicals 1
JPY Technicals 1
JPY Technicals 1
Chart II-6JPY Technicals 2
JPY Technicals 2
JPY Technicals 2
Recent data in Japan have been mixed: Producer prices contracted by 0.6% year-on-year in July. Core machinery orders increased by 12.5% year-on-year in June, while preliminary machine tool orders for July fell by 33% year-on-year, from -38% the prior month. Industrial production contracted by 3.8% year-on-year in June. Capacity utilization fell by 2.6% year-on-year in June. USD/JPY appreciated by 0.3% this week. Japanese data was notable healthier in June, suggesting that weakness in July was exacerbated by external factors. That said, long yen bets are in an enviable “heads I win, tails I do not lose too much” position, as posited in the front section of this bulletin. Report Links: Portfolio Tweaks Into Thin Summer Trading - July 5, 2019 Battle Of The Central Banks - June 21, 2019 Short USD/JPY: Heads I Win, Tails I Don’t Lose Too Much - May 31, 2019 British Pound Chart II-7GBP Technicals 1
GBP Technicals 1
GBP Technicals 1
Chart II-8GBP Technicals 2
GBP Technicals 2
GBP Technicals 2
There was a flurry of data out of the U.K. this week, most of which were firm: Preliminary GDP growth fell to 1.2% year-on-year in Q2, from the previous 1.8%. This was mostly driven by investment that contracted by 1.6%. This makes sense given Brexit uncertainties. Exports contracted by 3.3% quarter-on-quarter in Q2, but imports fell 12.9% quarter-on-quarter. The total trade balance increased to £1.78 billion in June. The unemployment rate nudged up to 3.9% in June, but the labor report was robust. Weekly earnings soared by 3.9%. Headline and core inflation moved up to 2.1% and 1.9% year-on-year respectively in July. Lastly, total retail sales increased by 3.3% year-on-year in July. GBP/USD has been flat this week. While GDP data was clearly negative, the drop in the pound is clearly improving the balance of payments backdrop for the U.K. Our bias is that the pound could soon rebound once the Brexit chaos settles. Short EUR/GBP at 0.95. Report Links: Battle Of The Central Banks - June 21, 2019 A Contrarian View On The Australian Dollar - May 24, 2019 Take Out Some Insurance - May 3, 2019 Australian Dollar Chart II-9AUD Technicals 1
AUD Technicals 1
AUD Technicals 1
Chart II-10AUD Technicals 2
AUD Technicals 2
AUD Technicals 2
Recent data in Australia have been positive: NAB business confidence edged up to 4 in July, from 2. Westpac consumer confidence also rebounded by 3.6% month-on-month in August. Consumer inflation expectations increased to 3.5% in August. The employment report was robust. The unemployment rate was unchanged at 5.2% in July; 34.5 thousand full-time jobs and 6.7 thousand part-time jobs were created; Participation rate was little changed at 66.1%. Wages remained at 2.3% year-on-year in Q2. AUD/USD fell by 0.4% this week. The Aussie is a very ripe candidate for mean reversion, once the appropriate catalysts fall in place. Net speculative positions on the Aussie dollar are very close to a bearish nadir. We continue to favor the Aussie dollar from a contrarian perspective. Report Links: A Contrarian View On The Australian Dollar - May 24, 2019 Beware Of Diminishing Marginal Returns - April 19, 2019 Not Out Of The Woods Yet - April 5, 2019 New Zealand Dollar Chart II-11NZD Technicals 1
NZD Technicals 1
NZD Technicals 1
Chart II-12NZD Technicals 2
NZD Technicals 2
NZD Technicals 2
There is scant data from New Zealand this week: Net migration to New Zealand fell to 3100 in June. House sales increased by 3.7% year-on-year in July. NZD/USD fell by 0.5% this week. We remain bearish on the kiwi due to decreasing net migration, and falling terms-of-trade. Remain long AUD/NZD as a strategic holding. Report Links: USD/CNY And Market Turbulence - August 9, 2019 Where To Next For The U.S. Dollar? - June 7, 2019 Not Out Of The Woods Yet - April 5, 2019 Canadian Dollar Chart II-13CAD Technicals 1
CAD Technicals 1
CAD Technicals 1
Chart II-14CAD Technicals 2
CAD Technicals 2
CAD Technicals 2
Recent data in Canada have been negative: Housing starts came in at 222K in July from 246K. Building permits decreased by 3.7% month-on-month in June; Existing home sales increased by 3.5% month-on-month in July. The labor report was poor. Unemployment increased to 5.7% in July. 11.6 thousand full-time jobs and 12.6 part-time jobs were lost in the month of July. Average hourly wages however, soared by 4.5% year-on-year in July, from the previous 3.6%. Bloomberg nanos confidence index fell to 57.8 over the past week. USD/CAD increased by 0.7% this week. A combination of robust wage growth, accommodative fiscal policy, and low interest rates, has supported the Canadian housing market in the summer. Moreover, energy prices should hook up which will benefit CAD. We remain positive on the loonie in the near-term. Report Links: Portfolio Tweaks Into Thin Summer Trading - July 5, 2019 On Gold, Oil And Cryptocurrencies - June 28, 2019 Currency Complacency Amid A Global Dovish Shift - April 26, 2019 Swiss Franc Chart II-15CHF Technicals 1
CHF Technicals 1
CHF Technicals 1
Chart II-16CHF Technicals 2
CHF Technicals 2
CHF Technicals 2
Recent data in Switzerland have been negative: Unemployment rate was stable at 2.3% in July. Producer and import prices contracted by 1.7% year-on-year in July. USD/CHF has been flat this week. The terms-of-trade in Switzerland soared to 128 in June from the previous 117 in May. We continue to favor the franc due to a positive current account, and its safe-haven allure. Report Links: What To Do About The Swiss Franc? - May 17, 2019 Beware Of Diminishing Marginal Returns - April 19, 2019 Balance Of Payments Across The G10 - February 15, 2019 Norwegian Krone Chart II-17NOK Technicals 1
NOK Technicals 1
NOK Technicals 1
Chart II-18NOK Technicals 2
NOK Technicals 2
NOK Technicals 2
Recent data in Norway have been mostly positive: Headline inflation was stable at 1.9% year-on-year in July, while core inflation fell slightly to 2.2% year-on-year in July. Producer prices contracted by 8.6% year-on-year in July. The trade balance widened to NOK 6.5 billion in July. USD/NOK increased by 1% this week. The Norges Bank kept interest rates unchanged yesterday at 1.25%, and said the policy outlook has become more uncertain amid rising global risks. The central bank guidance had been irrefutably hawkish prior to yesterday. The current dovish shift reflects more uncertainties in the global market and energy prices. Remain long NOK/SEK for now, while earning a positive carry. Report Links: Portfolio Tweaks Into Thin Summer Trading - July 5, 2019 On Gold, Oil And Cryptocurrencies - June 28, 2019 Currency Complacency Amid A Global Dovish Shift - April 26, 2019 Swedish Krona Chart II-19SEK Technicals 1
SEK Technicals 1
SEK Technicals 1
Chart II-20SEK Technicals 2
SEK Technicals 2
SEK Technicals 2
Recent data in Sweden have been mixed: Household consumption decreased by 0.3% year-on-year in June. Unemployment rate nudged up to 6.3% in July. Headline and core inflation both fell to 1.7% year-on-year in July. USD/SEK increased by 0.5% this week. The July inflation has been the lowest since early last year, mostly due to a slowdown in the prices of transport, recreation and culture, and durable goods. That said, disinflation is now a global phenomenon. We remain long SEK/NZD as a relative value trade. Report Links: Where To Next For The U.S. Dollar? - June 7, 2019 Balance Of Payments Across The G10 - February 15, 2019 A Simple Attractiveness Ranking For Currencies - February 8, 2019 Trades & Forecasts Forecast Summary Core Portfolio Tactical Trades Limit Orders Closed Trades
Highlights So What? Maintain a cautious stance on Turkish currency and risk assets. Why? Following the AKP’s defeat in Istanbul, Erdogan has doubled down on unorthodox economic policies. Improvements in the current account balance are temporary. Unless investor sentiment is meaningfully repaired, the lira will resume its decline in 2020. In the meantime, tensions with the West – especially the U.S. – will remain elevated. The imposition of secondary sanctions from the U.S. is likely. Feature U.S. President Donald Trump is wavering in the trade war, which is ostensibly positive news for global risk assets that are selling off dramatically amid very gloomy expectations about the near future. The question is whether the delay is too little, too late to halt the slide in financial markets in the near term. The reason to be optimistic is that interest rates have fallen and the global monetary policy “put” is fully in effect. Moreover, it is irrefutable now that President Trump is sensitive to the negative financial effects of the trade war. He is delaying new tariffs on some of the remaining $300 billion worth of imports from China not simply because consumer price inflation has ticked up but more fundamentally because the tightening of financial conditions increases the risk of a recession. A president can survive a small increase in inflation but not a big increase in unemployment. The reason to be pessimistic is that global economic expectations are threatening the crisis levels of 2008 (Chart 1) and Trump’s tariff delay offers cold comfort. His administration has not delayed all the tariffs, and the delay lasts only three months. Rather than renew the license for U.S. companies to do business with Chinese telecom giant Huawei, his Commerce Department has deferred any decision – leaving uncertainty to fester in the all-important tech sector. Chart 1Global Economic Expectations Near Crisis Levels
Global Economic Expectations Near Crisis Levels
Global Economic Expectations Near Crisis Levels
Chart 2More China Stimulus Needed To Prevent EM Breakdown
More China Stimulus Needed To Prevent EM Breakdown
More China Stimulus Needed To Prevent EM Breakdown
Beneath the surface is the fact that China’s money-and-credit growth faltered in July, suggesting that negative sentiment is still suppressing credit demand and preventing policy stimulus from having as big of a bang as in 2015-16. The late-July Politburo meeting signaled a more accommodative turn in policy, as we have expected, and BCA’s China strategist Jing Sima expects more fiscal stimulus to be announced after the October 1 National Day celebration. But high-beta economies and assets will suffer in the meantime – especially emerging market assets (Chart 2). Emerging markets are also seeing geopolitical risks rise across the board – and with the exception of China and Brazil, these risks are underrated by markets: Greater China: Beijing is getting closer to intervening in Hong Kong with police or military force. Such a crackdown will increase the odds of a confrontation with Taiwan and a backlash across the region and world, meaning that East Asian currencies in particular have more room to break down. India: The escalation in Kashmir is not a “red herring.” A single terrorist attack in India blamed on Pakistan could trigger a dangerous military standoff that hurts rather than helps Indian equities, unlike the heavily dramatized standoff ahead of the election earlier this year. Russia: Large-scale protests, overshadowed by Hong Kong, highlight domestic instability amid falling oil prices. These developments bode ill for Russian currency and equities. We will return to these risks in the coming weeks. This week we offer a special report on Turkey, where political risk is becoming extremely underrated as the lira rallies despite a further deterioration in governance (Chart 3). Chart 3Political Risks Are Underrated In Turkey
Political Risks Are Underrated In Turkey
Political Risks Are Underrated In Turkey
Too Early To Write Off Erdogan “Whoever wins Istanbul, wins Turkey … Whoever loses Istanbul, loses Turkey.” President Recep Tayyip Erdogan Turkey’s ruling Justice and Development Party (AKP) has had a tough year. The March 31 local elections – especially the rerun election for mayor of Istanbul – dealt the party its biggest electoral losses since it emerged as the country’s dominant political force in 2002 (Chart 4). The elections came to be seen as a referendum on President Recep Tayyip Erdogan and thus raise the question of whether the party’s strongman leader is in decline – and what that might mean for emerging market investors. Erdogan’s grip on power has long been overrated – it is his vulnerability that has driven him to such extremes of policy over the past decade. The Gezi Park protests of 2013 and the attempted military coup of 2016 revealed significant strains of internal opposition in the aftermath of the Great Recession.
Chart 4
With each case of dissent, the AKP responded by stimulating the economy and tightening state control over society (Chart 5). But this strategy faltered last year when monetary policy finally became overextended, the currency collapsed, and the country slid into recession. The opposition finally had its moment.
Chart 5
The AKP is less a source of unity.
Chart 6
As a consequence, the AKP is less a source of unity among Turkish voters. Both its share of seats in parliament and the overall level of party concentration in the Turkish parliament have declined since 2002 (Chart 6). Were it not for its coalition partner, the Nationalist Movement Party (MHP), the AKP would not have gained a majority in the 2018 parliamentary election. The AKP’s popular base consists of conservative, rural, and religious voters. This bloc is losing influence in parliament relative to centrist and left-wing parties (Chart 7). Moreover, the share of Turks identifying with political Islam, while still the largest grouping, is declining. Those who identify with more secular Turkish nationalism are on the rise (Chart 8).
Chart 7
Does this shift entail a major turn in national policy? Will a new party emerge to challenge the AKP at last? Chart 8Secular Nationalism Is On The Rise
Secular Nationalism Is On The Rise
Secular Nationalism Is On The Rise
There has long been speculation that former AKP leaders such as former Turkish president Abdullah Gul, former prime minister Ahmet Davutoglu, and former deputy prime minister Ali Babacan might form a political alternative. The latter resigned from the AKP on July 8, reviving speculation that a rival party could emerge that is capable of combining disillusioned AKP voters with the broader opposition movement at a time when Erdogan’s vulnerability has been made plain. However, the opposition is likely getting ahead of itself. The ruling party still has many tools at its disposal. Its share of seats in parliament is more than double that of the main opposition party, the Republican People’s Party (CHP). It is also viewed favorably in rural areas, and support for Erdogan there will not shift easily. Moreover, despite the negative electoral trend, the AKP has a lot of enthusiasm among its supporters – it is the party with the highest favorability among its own voters (Chart 9). The March election served as a wakeup call for the AKP – a warning not to take its power for granted. Erdogan can still salvage his position. The next election is not due until June 2023, leaving the party with four years to recuperate. While polls for the 2023 parliamentary election paint an ominous sign (Chart 10), they are very early, and the key will be whether Erdogan can divide the opposition and reconnect with his voter base. Above all, this will depend on what changes he makes to economic policy.
Chart 9
Chart 10Erdogan Needs To Reconnect With Voter Base
Erdogan Needs To Reconnect With Voter Base
Erdogan Needs To Reconnect With Voter Base
Bottom Line: Erdogan’s and the AKP’s popularity is waning, but it is too soon to write them off. The key question is how Erdogan will handle economic policy now that there are chinks in his armor. Doubling Down On Erdoganomics The fluctuation in the lira “is a U.S.-led operation by the West to corner Turkey … The inflation rate will drop as we lower interest rates.” President Recep Tayyip Erdogan
Chart 11
Erdogan needs to see the economy back to recovery in order to secure his success in the next election. A survey conducted early this year reveals that Turks view unemployment, the high cost of living, and the depreciation of the lira as the most significant problems facing Turkey, with 27% of respondents indicating that unemployment is the most important problem facing the country (Chart 11). More importantly, Turks do not have much confidence in the government’s ability to manage this pain – only one-third of respondents viewed economic policies as successful, a 14pp decline from the previous year. This highlights the need for Erdogan to revive confidence in Turkey’s policymaking institutions and to deliver on the economic front. The key is how Erdogan will handle economic policy. However, it is still too early to call for a sustainable improvement in the Turkish economy as many of the same fundamental imbalances continue to pose risks. While the current account has improved significantly – even registering a surplus in May – the improvement will not endure (Chart 12). On the one hand, the weaker lira has made exports more attractive relative to global competition. However, the improvement in the external balance is in large part due to weaker imports which are now more expensive for Turkey’s residents and have fallen by 19% y/y in 1H2019. Shrinking imports also reflect weak domestic demand which has been weighed down by tight monetary conditions (Chart 13). Chart 12Current Account Improvement Will Not Endure
Current Account Improvement Will Not Endure
Current Account Improvement Will Not Endure
Chart 13Tight Monetary Conditions Weighed On Domestic Demand
Tight Monetary Conditions Weighed On Domestic Demand
Tight Monetary Conditions Weighed On Domestic Demand
What is more, portfolio inflows which in the past were necessary to offset the large current account deficit, have collapsed (Chart 14). Were it not for the improvement in the trade balance, the central bank of the Republic of Turkey (CBRT) would have experienced a pronounced decline in its foreign reserves, and currency pressures would have been significant. A meaningful improvement in investor sentiment – which will remain cautious on the back of economic and geopolitical risks – is a necessary precondition for the return of these inflows. Nevertheless, the current account deficit will likely remain narrow in the second half of the year as the trade balance improves on the back of a weak lira and imports remain depressed due to soft domestic demand. This will keep the lira supported over this period. Although risks from a wide current account deficit have been temporarily put off, years of foreign debt accumulation are a hazard to a sustainable improvement in the lira. Foreign debt obligations (FDO) due over the coming 12 months are extremely elevated at $167 billion (Chart 15). It is not clear that they can be paid off. While the FDO figure is overly pessimistic as some of these debts will be rolled over, net central bank foreign exchange reserves can cover only 2.7% of these obligations. This poses downside risks on the lira at a time when inflows have not yet recovered.1 Moreover, unorthodox economic policies will eventually reverse any improvement in the currency. Chart 14Financial Account Does Not Lend Support
Financial Account Does Not Lend Support
Financial Account Does Not Lend Support
Chart 15FDO Pose A Risk To The Currency
FDO Pose A Risk To The Currency
FDO Pose A Risk To The Currency
While the 4 years between now and the next election could be an opportunity to embark on unpopular structural reforms that will improve the outlook by the time voting season rolls in, Erdogan has instead doubled down on his current strategy. Less than two weeks after the results of the Istanbul election rerun, CBRT governor Murat Cetinkaya was removed by presidential decree. A month later, key CBRT staff were dismissed.2
Chart 16
At his first monetary policy committee meeting as governor on July 25, Murat Uysal slashed the one-week repo rate by 425bps. Given Erdogan’s outspoken distaste for high interest rates, the president’s consolidation of power over economic decision making implies that the outlook for easier monetary policy is now guaranteed. However, the ramifications of this dovish shift will be concerning for voters. The depreciating lira was singled out as the most important economic problem facing Turkey by the largest number of survey respondents (Chart 16). Erdogan’s pursuit of dovish policies despite popular opinion shows that he is doubling down on unorthodox policy despite popular opinion. Monetary easing threatens to unwind the current account improvement and ultimately de-stabilize the lira. Assuming that the banking sector does not hold back the supply of credit to the private sector, lower rates will generate a pickup in demand which will raise imports and widen the current account deficit. Unless there is a marked improvement in investor sentiment – which will remain tainted by the erosion of central bank independence and increased tensions with the West – a return in portfolio inflows to pre-2018 levels is unlikely. As a consequence the lira will begin to soften anew in 2020. The lira will soften anew in 2020. While inflation will subside as the lira stabilizes this year, it will likely remain elevated relative to pre-2018 levels – in the 10% to 15% range. Contrary to Erdoganomics, traditional economic theory postulates that interest rate cuts pose upside pressure on prices. The resurgence in domestic demand will occur against a backdrop of rising wages (Chart 17). Chart 17Price Pressures Will Persist
Price Pressures Will Persist
Price Pressures Will Persist
With foreign currency reserves running low, the CBRT recently adopted several measures to discourage locals from exchanging their liras for foreign currency. These efforts reflect attempts to mitigate the negative impact of monetary easing on the lira, and to ensure FX reserves are supported: A 1-percentage point increase in the reserve requirement ratio for foreign currency deposits and participation funds. A 1-percentage point reduction in the interest rate on dollar-denominated required reserves, reserve options and free reserves held at the bank. An increase in the tax on some foreign exchange sales to 0.1% from zero. These measures make it more expensive for banks to hold foreign currency, incentivizing lira holdings instead. They also raise the CBRT’s foreign reserves highlighting the downside risks on these holdings and the lira. However, given that these measures boost CBRT reserves only superficially – rather than mirroring an improvement in the underlying economic conditions – they highlight that need for policy tightening to defend the lira, even as the CBRT officially pursues an accommodative path. Bottom Line: The Turkish economy will be extremely relevant to Erdogan’s fate in 2023. However with large foreign debt obligations, a rate cutting cycle underway, and foreign investors who remain uneasy, the case for Turkey’s economic recovery – especially amid turbulent global conditions – is weak. In the meantime, Erdogan will continue to blame external factors for the nation’s malaise. Don’t Bet On Trump-Erdogan Friendship “Being Asian and in Asia is as important as being European and in Europe for us.” Turkish Foreign Minister Melvut Cavusoglu For several years Erdogan has attempted to distract the populace from the country’s economic slide by adopting an aggressive foreign policy, particularly toward the West. The immediate cause is Syria, where Turkey has fundamental security interests that clash with those of the U.S. and Europe. But tensions also stem from Erdogan’s economic and political instability. This aggressive foreign policy has not changed in the wake of the AKP’s electoral loss. Erdogan is continuing to test the U.S.’s and EU’s limits and the result is likely to be surprise events, such as U.S.-imposed sanctions, that hurt Turkey’s economy and financial assets. Erdogan clashes with the West both because of substantive regional disagreements and because it plays well domestically. Turks increasingly see the U.S. and other formal NATO allies as a threat, while looking more favorably upon American rivals like Russia, China, Iran, and Venezuela (Chart 18). The U.S., meanwhile, is expanding the use of “secondary sanctions” to impose costs on states that make undesirable deals with its rivals, and Turkey is now in its sights. The reason is Erdogan’s decision to purchase the S400 missile defense system from Russia. This decision exemplifies the breakdown in the U.S.-Turkish alliance and Turkey’s search for alternative partners and allies. The arms sale is likely – eventually – to trigger secondary sanctions under the U.S. International Emergency Economic Powers Act and especially the Countering America’s Adversaries Through Sanctions Act (CAATSA). Washington has already imposed sanctions on China for buying the same weapons from Russia. Erdogan recently accepted the first delivery of components for the S400s, which are supposed to go live by April 2020. He stuck with this decision in disregard of Washington’s warnings. He has a solid base of popular support across political parties for this act of foreign policy and military independence from the U.S. (Chart 19). But the full consequences have not yet been felt.
Chart 18
Chart 19
President Trump’s response is muted thus far. He banned Turkish pilots from the U.S. F-35 program and training but has not yet imposed sanctions due to his special relationship with Erdogan and ongoing negotiations over Syria. Syria is the root of the breakdown in Turkish-American relations since 2014. Washington and Ankara have clashed repeatedly over their preferred means of intervening into the Syrian civil war and fighting the Islamic State. The U.S. relies on the Syrian Democratic Forces, led by the Kurdish People’s Protection Units (YPG), which are affiliated with the Kurdistan Workers’ Party (PKK). The PKK is based in Turkey and both the U.S. and Turkey designate it as a “terrorist organization” due to its militant activities in its long-running struggle for autonomy from Turkey.
Chart 20
Turkey has intervened in Syria west of the Euphrates River and has repeatedly threatened to conduct deeper strikes against the Kurds. The latter would put U.S. troops in harm’s way and could result in lost leverage for Western forces seeking to maintain their YPG allies and force an acceptable settlement to the Syrian conflict. There is a basis for a deal between Presidents Trump and Erdogan that could keep sanctions from happening. Trump is attempting to wash its hands of Syria to fulfill a promise of limiting U.S. costs in wars abroad. Meanwhile an aggressive intervention in Syria is not a popular option in Turkey, which is why Erdogan has not acted on threats to seize a larger swath of territory (Chart 20). As a result, the U.S. and Turkey recently formed a joint operation center to coordinate and manage “safe zones” for Syrian refugees. If they can manage the gray area on the Turkish-Syrian border, the Trump administration can continue to prepare for withdrawal while preventing Erdogan from taking too much Kurdish territory. The tradeoff is clear, but similar agreements have fallen apart. First, the U.S. Congress is ready to impose sanctions over the S400s and Trump is under pressure to punish Turkey for undermining NATO and dealing with the Russians. Second, the Trump administration has not found an acceptable solution to the Syrian imbroglio that makes full withdrawal possible. If Trump becomes convinced that the risks of a total and rapid withdrawal from Syria are greater than the rewards (as many of his GOP allies staunchly believe), then he has less incentive to protect Erdogan. Meanwhile Erdogan could still decide he needs to plunge deeper into Syria to counteract the YPG. Or he could retaliate against any sanctions over the S400s and provoke a broader tit-for-tat exchange. He has threatened to cancel orders for Boeing aircraft worth $10 billion. Clearly U.S. sanctions will cause the lira to fall and send Turkey into another bout of financial turmoil. In the meantime Turkey’s relations with Europe also pose risks. While the refugee crisis has abated, in great part due to Turkish cooperation, other disagreements are still problematic: The EU is not upgrading Turkey’s customs union and both sides know that Turkey is not eligible for EU membership anytime soon. In response to what the EU has deemed as illegal drilling for oil and gas off the coast of Cyprus, the EU called off high-level political meetings with Turkey and suspended EUR 145.8 million in pre-accession aid. EU foreign ministers have also put off talks on the Comprehensive Air Transport Agreement between the two parties which would have led to an increase in passengers using Turkish airports as a transit hub. In addition, EU ministers asked the European Investment Bank to review its lending activities in Turkey, which amounted to EUR 358.8 million last year. Erdogan is taking a bolder approach to Cyprus. He has decided to send a fourth ship to drill for natural gas in Cyprus’s Exclusive Economic Zone in the Eastern Mediterranean. The purpose is to rally support for his government by calling on the public’s strong allegiance to Turkish Cypriots (Chart 21). The problem is that a confrontation sought as a domestic distraction could provoke negative policy reactions from the EU (or the U.S., which is reconsidering its arms embargo on the Greek Cypriot side). Relations with the West would get worse.
Chart 21
Chart 22... But Turkey Cannot Afford To Flout The EU
... But Turkey Cannot Afford To Flout The EU
... But Turkey Cannot Afford To Flout The EU
Turkey cannot afford to flout the U.S. and EU. Its economy is dependent on Europe (Chart 22). And the U.S. still underwrites Turkey’s NATO membership and access to the global financial system. The problem is that Erdogan is an ambitious and unorthodox leader and he has clearly wagered that he can rally domestic support through various confrontations with Western policies. This means that for the immediate future the country is more likely to clash with Western nations than it is to recognize its own limits. Political risks are frontloaded and investors should be cautious before trying to snap up the depressed lira or Turkish government bonds. Bottom Line: Tensions with the West – especially the U.S. – will likely lead to economic sanctions. While there is a basis for Presidents Trump and Erdogan to avoid a falling out, it is not reliable enough to underpin a constructive investment position – especially given Erdogan has not changed course in the wake of this year’s significant electoral loss. Investment Conclusions Chart 23Optimism On Lira Amid Unresolved Risks
Optimism On Lira Amid Unresolved Risks
Optimism On Lira Amid Unresolved Risks
The lira has rallied by 3.6% since the Istanbul election. It has risen 0.3% since the replacement of CBRT Governor Murat Cetinkaya and rallied further despite the sacking of the central bank’s chief economist and other high-level staff (Chart 23). Given that the market knows that the central bank reshuffle entails interest rate cuts, is this a clear signal that the lira has hit a firm bottom and cannot fall further? Turkey is more likely to clash with Western nations. We doubt it. First, Erdogan’s doubling down on unorthodox policy threatens the recovery in the currency and risk assets and his aggressive foreign policy raises the risk of sanctions and further economic pain. Second, although Turkey is not overly exposed to China, it is heavily exposed to Europe, which is on the brink of a full-fledged recession and depends heavily on the Chinese credit cycle – which had another disappointment in July. German manufacturing PMI has been sinking further below the 50 boom-bust mark since the beginning of the year, and the economy contracted in 2Q2019 (Chart 24). Chart 24Global Backdrop Not Yet Supportive
Global Backdrop Not Yet Supportive
Global Backdrop Not Yet Supportive
Chart 25Improvement In Spread Will Be Fleeting
Improvement In Spread Will Be Fleeting
Improvement In Spread Will Be Fleeting
Given these domestic and global economic risks and geopolitical tensions, we expect any improvement in the sovereign spread to be fleeting (Chart 25). While the lira may experience temporary improvement, pressures will re-emerge in 2020 as the lagged impact of Erdogan’s pursuit of growth at all costs re-emerge. Stay on the sidelines as any improvement in the near term is fraught with risk. Roukaya Ibrahim, Editor/Strategist Geopolitical Strategy roukayai@bcaresearch.com Matt Gertken, Vice President Geopolitical Strategist mattg@bcaresearch.com Footnotes 1 See Emerging Markets Strategy Weekly Report, “Country Insights: Indonesia, Turkey, And The UAE” May 2, 2019, ems.bcaresearch.com. 2 Among those removed are the central bank’s chief economist Hakan Kara as well as the research and monetary policy general manager, markets general manager, and banking and financial institutions general manager.
Highlights Economic data suggest the current business cycle in China has not yet reached a bottom. Stimulus measures have not been forceful enough to fully offset a slowing domestic economy and weakening global demand. With possibly more U.S. tariffs to come, intensifying political unrest in Hong Kong and a currency set to depreciate further, the potential downside risks outweigh any potential upside over the near term. Investors who are already positioned in favor of Chinese equities should stay long. We are still early in a credit expansionary cycle, and we expect further economic weakness to pave the way for more policy support in China. However, we recommend investors who are not yet invested in Chinese assets to remain on the sidelines until clearer signs of materially stronger stimulus emerge. Feature Chart 1A Breakdown In Chinese Stocks
A Breakdown In Chinese Stocks
A Breakdown In Chinese Stocks
Financial market volatility surged in the first half of the month following U.S. President Donald Trump’s recent tweet, vowing to impose a 10% tariff on the remaining $300 billion of U.S. imports of Chinese goods by September 1st. By the end of last week, prices of China investable stocks relative to global equities had nearly wiped out all their 2019 year-to-date gains. (Chart 1) The extent of the decline has left some investors wondering whether the time has come to bottom-fish Chinese assets. In our view, the answer is no. In this week’s report we detail five reasons why the near-term outlook for China-related assets remains negative. We remain bullish on Chinese stocks over the cyclical (i.e. 6-12 month) horizon and recommend investors who are already positioned in favor of China-related assets stay long. However, we also recommend investors who are not yet invested to remain on the sidelines until surer signs of materially stronger stimulus emerge. As we go to press, the U.S. Trade Representative Office announced that the Trump administration would delay imposing the 10% tariff on a series of consumer goods imported from China — including laptops and cell phones — until December.1 Stocks in the U.S. surged on the news. Today’s rally in the equity market highlights our view, that short-term market performance can be dominated and distorted by news on the trade front. However, market rallies based on headline news will not sustain without the support of economic fundamentals. Reason #1: Chinese Economic Growth Has Not Yet Bottomed In a previous China Investment Strategy report,2 we presented some simple arithmetic to help investors formulate their outlook on the Chinese economy. We argued that in a full-tariff scenario, investors should focus on the likely outcome of one of the two following possibilities: Scenario 1 (Bullish): Effects of Stimulus – Impact of Tariff Shock > 0 Scenario 2 (Bearish): Effects of Stimulus – Impact of Tariff Shock ≤ 0 In scenario 1, the impact of China’s reflationary efforts more than offsets the negative shock to aggregate demand from the sharp decline in exports to the U.S. Scenario 2 denotes an outcome where China’s reflationary response is not larger than the magnitude of the shock. For now, we remain in scenario 2 due to Chinese policymakers’ continual reluctance to allow the economy to re-leverage. The magnitude of the credit impulse so far has been “half measured” relative to previous cycles.3 More than seven months into the current credit expansionary cycle, Chinese economic data have not yet exhibited a clear bottom. As a result, more than seven months into the current credit expansionary cycle, Chinese economic data have not yet exhibited a clear bottom, with the main pillars supporting China’s “old economy” still in the doldrums (Chart 2 and Chart 3). Chart 2No Clear Bottom, Yet
No Clear Bottom, Yet
No Clear Bottom, Yet
Chart 3Key Economic Drivers Struggling To Trend Higher
Key Economic Drivers Struggling To Trend Higher
Key Economic Drivers Struggling To Trend Higher
In addition to a weakening domestic economy, China’s external sector has been weighed down by U.S. import tariffs as well as slowing global demand. (Chart 4). The possibility of adding a 10% tariff by year end on the remaining $300 billion of Chinese goods exports to the U.S. may trigger another tariff “front-running” episode in the 3rd quarter. However, Chart 5 and Chart 6 highlight that any front-running would be against the backdrop of sluggish global demand. Therefore, not only the upside in Chinese export growth will be very limited in the subsequent months following the front-running, but export growth is also likely to fall deeper into contraction. Chart 4Domestic Demand More Concerning Than Exports
Domestic Demand More Concerning Than Exports
Domestic Demand More Concerning Than Exports
Chart 5Pickup In Global Demand Not Yet Visible
Pickup In Global Demand Not Yet Visible
Pickup In Global Demand Not Yet Visible
Chart 6Bottoming In Global Manufacturing Also Delayed
Bottoming In Global Manufacturing Also Delayed
Bottoming In Global Manufacturing Also Delayed
Reason # 2: A-Shares Are Not Yet Signaling A Sizeable Policy Response
Chart 7
In previous China Investment Strategy reports, we have written at length about how Chinese policymakers are reluctant to undo their financial deleveraging efforts and push for more stimulus. After incorporating July credit data, our credit impulse, at a very subdued 26% of nominal GDP, was in fact a pullback from June’s credit growth number (Chart 7). This confirms our view that the current stimulus is clearly falling short compared to the 2015-2016 credit expansionary cycle. It underscores Chinese policymakers’ commitment to keep their foot off the stimulus pedal. What’s more, the recent performance of China’s domestic financial markets has been consistent with a half-measured credit response, and is not yet signaling a meaningful change in China’s policy stance. The A-share market since last summer has been trading off of the likely policy response to the trade war. Chart 8Market Not Signaling Significant Policy Shift
Market Not Signaling Significant Policy Shift
Market Not Signaling Significant Policy Shift
Chart 8 (top panel) shows that the A-share market has closely tracked China’s domestic credit growth over the past year. Given this, we believe that the A-share market is reacting more to the likely policy response to the trade war, in contrast to the investable market which rises and falls in near-lockstep with trade-related news (middle panel). The fact that A-share stocks have been trending sideways underscores that China’s domestic equity market continues to expect “half measured” stimulus. This week’s sharp decline in China’s 10-year government bond yield is in part related to escalating political unrest in Hong Kong (bottom panel), and in our view does not yet signal any major change in the PBOC’s stance. Finally, our corporate earnings recession probability model provides another perspective on the equity market implications of the current path of stimulus. If the current size of stimulus holds through the end of 2019, our model suggests that the probability of an outright contraction in corporate earnings lasting through year end remains quite elevated, at close to 50% (first X in Chart 9). The July Politburo statement signaled a greater willingness to stimulate the economy; as a result, we are penciling in a slightly more optimistic scenario on forthcoming credit growth through the remainder of the year, by adding 300 billion yuan of debt-to-bond swaps4 and 800 billion yuan of extra infrastructure spending5 to our baseline estimate for the rest of 2019. However, this would only add a credit impulse equivalent of 1 percentage point of nominal GDP and would only marginally reduce the probability of an earnings recession to 40% (second X in Chart 9). A 40% chance of an earnings recession is well above “normal” levels that would be consistent with a durable uptrend in stock prices, and in previous cycles, Chinese stock prices picked up only after business cycles and corporate earnings had bottomed (Chart 10). In sum, the current pace of credit growth, signals from the domestic equity market, and our earnings recession model all suggest that it is too early to bottom fish Chinese stocks. Chart 9A "Measured" Pickup in Stimulus Will Not Be A Game Changer
A "Measured" Pickup in Stimulus Will Not Be A Game Changer
A "Measured" Pickup in Stimulus Will Not Be A Game Changer
Chart 10Too Early To Bottom Fish
Too Early To Bottom Fish
Too Early To Bottom Fish
Reason #3: The Trade War Is Far From Over Our Geopolitical Strategy team maintains that the U.S. and China have only a 40% chance of concluding a trade agreement by November 2020, and that any trade truce is likely to be shallow.6 We agree with this assessment, which has clear negative near-term implications for Chinese investable stocks, even if temporary rallies such as what took place yesterday periodically occur. Since the onset of the trade war, Chinese investable stocks appear to have traded nearly entirely in reaction to trade-related events. Hence, until global investors are given proof that much stronger stimulus can and will offset the impact of the trade war on corporate earnings, Chinese stocks are likely to continue to underperform their global peers. Reason #4: The Hong Kong Crisis Is A Near-Term Risk Another near-term catalyst for financial market turbulence in China is the worsening situation in Hong Kong. For now, we hold the view that a full-blown crisis (i.e. China intervening with military force) can be avoided, but we are not ruling out the possibility of a severe escalation or its potential impact on market sentiment towards Chinese assets. On the surface, China investable stocks (the MSCI China Index, the predominantly investable index that now includes some mainland A-shares) are not directly linked to businesses in Hong Kong: Out of the top 10 constituents of the MSCI China Index, which account for roughly 50% of the index’s market capitalization, seven are headquartered in mainland China and do not appear to have significant revenue exposure to Hong Kong. By contrast, at least 30% of Hang Seng Index-listed companies have business operations in Hong Kong. The remaining three companies in the top 10 MSCI China Index are Tencent (the largest component of the index, with a weight of approximately 15%), Ping An Insurance (4% weight), and China Mobile (3% weight) – all of which registered large losses in the past week. Both Tencent and Ping An Insurance are headquartered in Shenzhen, a southeastern China metropolis that links Hong Kong to mainland China. China Mobile appears to have the most revenue exposure to Hong Kong of any top constituent through its CMHK subsidiary, which is the largest telecommunications provider in Hong Kong. It is true that there has been little evidence so far that Chinese investable stocks have been more impacted by the escalation in political unrest in Hong Kong than by the escalation in the trade war. Indeed, the fact that the two escalations were overlapping this past week makes it difficult to isolate their effects. But if unrest in Hong Kong spirals out of control, it could result in mainland China intervening. According to an analysis done by BCA’s Geopolitical Strategy team,6 the deployment of mainland troops would likely lead to casualties and could trigger sanctions from western countries. The 1989 Tiananmen Square incident shows that such an event could lead to a non-negligible hit to domestic demand and foreign exports under sanctions. Should this to occur, the near-term idiosyncratic risk to Chinese stocks in both onshore and offshore markets will be significant. Reason #5: Further RMB Depreciation May Weigh On Stock Prices Whether due to manipulation or market forces, last week’s depreciation in the Chinese currency (RMB) was economically justified and long overdue. Chart 11RMB Depreciation Long Overdue
RMB Depreciation Long Overdue
RMB Depreciation Long Overdue
Chart 11 shows the close relationship between the U.S.-China one-year swap rate differential and the USD/CNY exchange rate. The true source of the correlation shown in the chart remains somewhat of a mystery, given that Chinese capital controls, particularly following the 2015 devaluation episode, prevent the arbitrage activities that link rate differentials and exchange rates in economies with fully open capital accounts. However, Chart 11 clearly shows that China’s currency would have already weakened by now if it was fully market-driven, and we do not believe that the People’s Bank of China will be inclined to tighten monetary policy in order to reverse the recent devaluation. Hence, the path of least resistance for the CNY is further depreciation. If the threatened 10% tariff on all remaining U.S. imports from China is imposed this year, our back-of-the-envelope calculation based on Chart 12 suggests that a market-driven “equilibrium” USD/CNY exchange rate should be at around 7.6. We have high conviction, based on previous RMB devaluation episodes, that China’s central bank will not allow its currency to depreciate in a manner that invites speculation of meaningful further weakness – meaning we are not likely to see a straight-lined or rapid depreciation down to the 7.6 mark. Chart 12Market Driven 'Equilibrium' Provides Some Guidance On The Exchange Rate
Market Driven 'Equilibrium' Provides Some Guidance On The Exchange Rate
Market Driven 'Equilibrium' Provides Some Guidance On The Exchange Rate
A “managed” currency depreciation is in and of itself stimulative for the Chinese economy. At the same time, aggressive market intervention via the PBoC burning through its foreign exchange reserves is also unlikely: A “managed” currency depreciation is in and of itself stimulative for the economy. It improves Chinese export goods’ price competitiveness and helps mitigate some of the pain caused by increased tariffs. Therefore it is in the PBoC’s every interest to allow such depreciation. However, no matter how “orderly” RMB depreciation may be, the fact that the PBoC has signaled it is no longer defending a “line in the sand” exchange-rate mark is likely to trigger another round of “race to the bottom” currency devaluation from other regional, export-dependent economies.7 A weaker RMB and emerging market currencies will also contribute to USD strength. A strong dollar has been negatively correlated with global risky assets, implying that for a time, a weaker RMB will be a risk-off event for risky assets and thus presumably for Chinese and EM equity relative performance. Investment Implications Our analysis above highlights that the near-term outlook for Chinese stocks is fraught with risk, and it is for this reason that we recommended an underweight tactical position in Chinese stocks for the remainder of the year in our July 24 Weekly Report.8 However, by next summer (the tail-end of our cyclical investment horizon), it is our judgement that one of two things will have likely occurred: The trade war with the U.S. will have abated or been called off, and investors will have determined that a “half-strength” credit cycle is likely enough to stabilize Chinese domestic demand and the earnings outlook. In this scenario, Chinese stocks are likely to rise US$ terms over the coming year, relative to global stocks. The trade war with the U.S. will have continued, and Chinese policymakers will have acted on the need to stimulate aggressively further in order to stabilize domestic demand. In combination with an ultimately stimulative (although near-term negative) decline in the RMB, the relative performance of Chinese stocks versus the global benchmark will likely be higher in hedged currency terms. Because of the near-term risks to the outlook, we agree that investors who are not yet invested should remain on the sidelines until surer signs of materially stronger stimulus emerge. But investors who are already positioned in favor of Chinese equities should stay long, and should bet on the latter scenario: rising relative Chinese equity performance in local currency terms, alongside a falling CNY-USD / appreciating USD-CNY exchange rate. Jing Sima China Strategist JingS@bcaresearch.com Footnotes 1 “US to delay some tariffs on Chinese goods”, Financial Times, August 13, 2019. 2 Please see China Investment Strategy Weekly Report, “Simple Arithmetic”, dated May 15, 2019, available at cis.bcaresearch.com. 3 Please see China Investment Strategy Weekly Reports, “Threading A Stimulus Needle (Part 1): A Reluctant PBoC”, dated July 10, 2019, and “Threading A Stimulus Needle (Part 2): Will Proactive Fiscal Policy Lose Steam?”, dated July 24, 2019, available at cis.bcaresearch.com. 4 The remaining of 14 trillion debt-to-bond swap program rounds up to 315 billion yuan. 5 The relaxed financing requirement for infrastructure projects can add 800 billion yuan. 6 Please see Geopolitical Strategy Weekly Report, “The Rattling Of Sabers”, dated August 9, 2019, available at gps.bcaresearch. 7 Please see Emerging Markets Strategy Weekly Report, “The RMB: Depreciation Time?”, dated May 23, 2019, available at ems.bcaresearch.com. 8 Please see China Investment Strategy Weekly Report, Threading A Stimulus Needle (Part 2): Will Proactive Fiscal Policy Lose Steam?”, dated July 24, 2019, available at cis.bcaresearch.com. Cyclical Investment Stance Equity Sector Recommendations
The RMB has been trading like a pro-cyclical currency, meaning it is becoming an important signaling mechanism for the evolution of the cycle. The USD/CNY has been moving tick-for-tick with emerging market equities, Asian currencies, and even some commodity…
Highlights A unified push among central banks to drop their currencies inevitably leads to lower interest rates, which eventually sows the seeds of a recovery. However, with prospects of a full-blown trade war in front view, fundamentals could be put to the wayside for longer, as markets keep the switch on risk aversion. The new round of tariffs could pin USD/CNY at about 7.3-7.4, given the impact from negative feedback loops. The breakdown in the AUD/JPY cross is precarious. Stay short USD/JPY, but focus on the crosses rather than on outright bets versus the dollar. The RBNZ’s dovish surprise was a positive catalyst for our AUD/NZD and SEK/NZD positions. Remain long. Feature Chart I-1Summer Blues
Summer Blues
Summer Blues
Just as summer trading volumes are falling close to new lows, central banks appear to be weaponizing their exchange rates in a renewed currency war salvo. Both the Reserve Bank of India (RBI) and the Reserve Bank of New Zealand (RBNZ) surprised market participants this week by slashing rates by more than expected. In retrospect, the European Central Bank probably fired the first shot at its forum in Sintra, Portugal this June. ECB President Mario Draghi highlighted back then that if the inflation outlook failed to improve, the central bank had considerable headroom to launch a fresh expansion of its balance sheet. What has followed is a renewed wave of dovishness by global central banks, which should intensify, given the latest flare-up in the trade war. For currency strategy, this means fundamentals could be temporarily put to the wayside, as markets keep the switch on risk aversion (Chart I-1). This is because there is little visibility on either the political or the economic front. Our strategy remains three-fold: First, maintain tight stops on tactical positions. Second, we prefer trades at the crosses rather than versus the dollar, for now. Finally, maintain portfolio insurance by being short the USD/JPY. USD/CNY And The Economics Of Tariffs Chart I-2Sino-U.S. Trade Is Small Relative To Domestic Demand
Sino-U.S. Trade Is Small Relative To Domestic Demand
Sino-U.S. Trade Is Small Relative To Domestic Demand
Standard theory suggests that exchange rates should move to equalize prices across any two countries. The question that naturally follows is by how much? The answer is that the exchange rate should move by exactly the same percentage point as the price change, everything else equal. If both countries produce homogeneous goods, then it is easy to see why, since there is perfect substitution. All demand will flow to one country, until its currency rises by enough to equalize prices across borders again. However, assume countries ‘A’ and ‘B’ produce heterogeneous goods (‘A’ being the U.S. in this case, and ‘B’ China). Then the loss of purchasing power in Country ‘A’ will lead to less demand for Country ‘B’’s goods. The former loses purchasing power because prices of imports have increased by the amount of the tariff. This means the latter’s currency will have to adjust downwards for the markets to clear. The decrease has to match the magnitude of the price increase, if there are no other outlets to liquidate Country ‘B’’s goods. This is obviously a very simplified version of the real world economy, but it highlights an important point that is central to the discussion: The currency move necessary to realign competitiveness will always be equal to, or less than, in percentage point terms, to the price increase. In the case where the entire production base is tradeable, it will be the former. But with a rise in the number of trading partners, a more complex export basket, import substitution, shipping costs, and many other factors that influence tradeable prices, the currency adjustment needed should be smaller. Since the onset of 2018, the U.S. has slapped various tariffs on China, the latest of which is 10% on $300 billion worth of Chinese goods. The U.S. currently imports $509 billion worth of goods from China, about 16% of its total imports. However, as a percentage of overall U.S. demand, this only represents 2.4% (Chart I-2). This suggests that at best, a 25% tariff on all Chinese imports will only lift import prices by 4% and consumer prices by much less. On the Chinese side of the equation, exports to the U.S. account for 18.4% of total exports, a ratio that has been falling since 2018. Therefore, a tariff of 25% should only lift export prices by 4.5%. The conclusion is that the yuan and the dollar only need to adjust by 4-5% to negate the impact of a 25% tariff. Part of the rise in the dollar and fall in the RMB has been due to tariffs, but it has mostly been due to the fact that global trade has been slowing. This brings us to an important point: Part of the rise in the dollar and fall in the RMB has been due to tariffs, but it has mostly been due to the fact that global trade has been slowing (Table I-1). The DXY index is up 10% since its 2018 trough, while the USD/CNY has risen by 12%. This is much more than economic theory would suggest. In quantity terms, the IMF estimated that a 20% import tariff from East Asia would lift the U.S. dollar’s REER by 5% over five years, while dropping output by 0.6% over the same timeframe.1 But if past is prologue, the new round of tariffs will pin USD/CNY at about 7.3-7.4, given the impact from negative feedback loops – mainly a slowing global economy and a slowing Chinese economy.
Chart I-
With no corresponding export subsidy for U.S. goods, however, the rise in the dollar makes exporters worse off. And with over 40% of S&P 500 sales coming from outside the U.S., this will make a meaningful dent in corporate profits. This is an important political impediment. Historically, trade wars are usually synonymous with recessions. As such, there are acute political constraints inching both sides towards an agreement. A Disorderly Breakdown Or Steady Depreciation? The RMB has been trading like a pro-cyclical currency, meaning it is becoming an important signaling mechanism for the evolution of the cycle. The USD/CNY has been moving tick-for-tick with emerging market equities, Asian currencies, and even some commodity prices (Chart I-3). It has also closely mirrored the broad trade-weighted dollar (Chart I-4). This has implications for developed market currencies, especially those tied to Chinese demand. Therefore, it will be important to see if the RMB has a disorderly breakdown towards 7.4 or if it stabilizes at higher levels. A few barometers will be key to watch: Chart I-3The Yuan Is Pro-cyclical
The Yuan Is Pro-cyclical
The Yuan Is Pro-cyclical
Chart I-4Is The Dollar Headed Higher?
Is The Dollar Headed Higher?
Is The Dollar Headed Higher?
In a world of rapidly falling yields, Chinese rates remain attractive. Historically, USD/CNY has moved in line with interest rate differentials between the U.S. and China. The current divergence is unsustainable (Chart I-5). Typically, offshore markets have had a good track record of anticipating depreciation in the yuan. Back in 2014, offshore markets started pricing in a rising USD/CNY rate, and maintained that view all the way through to 2018, when the yuan eventually bottomed. Right now, not much depreciation is being priced in (Chart I-6). The reason offshore markets in Hong Kong and elsewhere can be prescient is because more often than not, they are the destination for illicit flows out of China. Chart I-5The Chinese Bond Market Is Attractive
The Chinese Bond Market Is Attractive
The Chinese Bond Market Is Attractive
Chart I-6Forward Markets Not Concerned As In 2015
Forward Markets Not Concerned As In 2015
Forward Markets Not Concerned As In 2015
Chinese money and credit growth, especially forward-looking liquidity indicators such as M2 relative to GDP, have bottomed. Historically, this led the cycle by a few months. The drop in Chinese bond yields is also reflationary, and should soon stimulate imports, especially if the improvement in exports continues (Chart I-7). Chinese government expenditures are likely to inflect higher, especially given acute weakness in the July manufacturing data. Again, this suggests stimulus this time around may be more fiscal than monetary (Chart I-8). In addition, the recent VAT cuts for manufacturing firms, a cut to social security contributions, and a pickup in infrastructure spending are all net positives. Chart I-7Trade War Extends Traditional Lags
Trade War Extends Traditional Lags
Trade War Extends Traditional Lags
Chart I-8Government Spending Set To Increase
Government Spending Set To Increase
Government Spending Set To Increase
The housing market remains healthy. A revival in the property market will support construction activity and investment. House prices have been rising to the tune of 10% year-on-year, and real estate stocks in China remain firm relative to the overall index. If house prices roll over, this will be a negative development (Chart I-9). The housing market remains healthy. A revival in the property market will support construction activity and investment. If house prices roll over, this will be a negative development. In terms of market dynamics, the AUD/JPY cross breached the important technical level of 72 cents, but has since recovered. This is important, since the cross failed to break below this level both during the euro area debt crisis in 2011-2012 and the China slowdown of 2015-2016. It will be especially important to see a clear breach to signal we are entering a deflationary bust (Chart I-10). Chart I-9China Housing Is Fine
China Housing Is Fine
China Housing Is Fine
Chart I-10AUD/JPY Breakdown Is Precarious
AUD/JPY Breakdown Is Precarious
AUD/JPY Breakdown Is Precarious
Bottom Line: We are watching a few key reflationary indicators to gauge whether it pays to be contrarian. The message is that it is not time yet, given the ramp-up in the trade war rhetoric. Notes On The RBNZ Chart I-11AUD/NZD Is Cheap
AUD/NZD Is Cheap
AUD/NZD Is Cheap
This week, the RBNZ surprised markets by cutting interest rates by 50 basis points to parity (expectations were for a 25-basis-point cut). From an external standpoint, this makes sense. Australia and China are New Zealand’s biggest trading partners, and have been easing policy much earlier. The RBNZ’s bet was that demand was probably going to recover by now. The latest salvo in the trade war probably dashed those hopes. Meanwhile, over the last 35 years, the AUD/NZD cross has spent more than 95% of the time over 1.06. With the AUD/NZD near record lows, the cross is cheap on a real effective exchange rate basis (meaning NZD is expensive) (Chart I-11). This suggests that even though interest rates are aligning in both Australia and New Zealand, the Aussie should be 11% higher relative to the Kiwi because of the valuation starting point (Chart I-12). The market remains more dovish on Australia relative to New Zealand, in part due to a more accelerated downturn in house prices and a significant slowdown in China. The reality is that the downturn in Australia has allowed some cleansing of sorts, and brought it far along the adjustment path relative to New Zealand. Economic data in New Zealand are now converging to the downside relative to Australia (Chart I-13). Chart I-12Interest Rates Could Move In Favor Of AUD
Interest Rates Could Move In Favor Of AUD
Interest Rates Could Move In Favor Of AUD
Chart I-13New Zealand Has More Economic Downside
New Zealand Has More Economic Downside
New Zealand Has More Economic Downside
The RBNZ began a new mandate on April 1st to include full employment in addition to inflation targeting. But given that the RBNZ has been unable to fulfill its price stability mandate over the last several years, it is hard to argue it will find a dual mandate any easier. Business confidence is rapidly falling, and employment will soon follow suit (Chart I-14). Meanwhile, for an economy driven by agricultural exports, productivity gains will be hard to come by. Economic data in New Zealand are now converging to the downside relative to Australia. The final catalyst for the AUD/NZD cross will be a terms-of-trade shock which, at the moment, is turning in favor of the Aussie (Chart I-15). Iron ore prices may face further downside, given that supply from Brazil is back online, but China’s clear environmental push has lifted the share of liquefied natural gas in Australia’s export mix. Since eliminating pollution is a strategic goal in China, this will be a multi-year tailwind. As the market becomes more liberalized and long-term contracts are revised to reflect higher spot prices, the Aussie will get a boost. Chart I-14Employment Growth Could Collapse In New Zealand
Employment Growth Could Collapse In New Zealand
Employment Growth Could Collapse In New Zealand
Chart I-15Terms Of Trade Favors##br## Aussie
Terms Of Trade Favors Aussie
Terms Of Trade Favors Aussie
Bottom Line: Remain long AUD/NZD as a strategic position and SEK/NZD as a tactical position. Housekeeping The stop on our short XAU/JPY position was triggered at 158,000 with a loss of -3.27%. This was a mean-reversion trade between two safe-havens, likely to work even if volatility remains elevated. Put it back on. Finally, lift the limit sell on EUR/GBP to 0.95. Chester Ntonifor, Foreign Exchange Strategist chestern@bcaresearch.com Footnotes 1 Maurice Obstfeld, “Tariffs Do More Harm Than Good At Home,” IMFBlog, September 8, 2016. Currencies U.S. Dollar Chart II-1USD Technicals 1
USD Technicals 1
USD Technicals 1
Chart II-2USD Technicals 2
USD Technicals 2
USD Technicals 2
Recent data in the U.S. have been mostly positive: Labor market remains tight: Unemployment rate was steady at 3.7%; Participation rate increased to 63%; Average hourly earnings increased by 3.2% year-on-year; Nonfarm payrolls increased by 164 thousand. Initial jobless claims fell to 209 thousand last week. Trade balance narrowed slightly to $55.2 billion in June. Michigan sentiment index was unchanged at 98.4 in July. Markit composite and services PMI both increased to 52.6 and 53 respectively in July, while ISM non-manufacturing PMI fell to 53.7 in July. DXY index fell by 1% this week, erasing the gains following the Fed’s hawkish surprise last week. Weakness in the dollar given a ramp-up in trade war rhetoric suggest that dollar tailwinds are facing diminishing marginal returns. A few of our favorite dollar indicators, including the bond-to-gold ratio, are sending a warning signal. Report Links: Focusing On the Trees But Missing The Forest - August 2, 2019 Global Growth And The Dollar - July 19, 2019 On Gold, Oil And Cryptocurrencies - June 28, 2019 The Euro Chart II-3EUR Technicals 1
EUR Technicals 1
EUR Technicals 1
Chart II-4EUR Technicals 2
EUR Technicals 2
EUR Technicals 2
Recent data in the euro area have continued to deteriorate: Producer price inflation fell to 0.7% year-on-year in June. Retail sales increased by 2.6% year-on-year in June, surprising to the upside. Markit composite PMI was unchanged at 51.5 in July, while services PMI fell slightly to 53.2. Sentix investor confidence fell further to -13.7 in August, the lowest since 2014. EUR/USD increased by 1% this week. In the most recent Economic Bulletin, the ECB highlighted the risk of a weaker Q2 global services PMI which might lead to a more broad-based deterioration in global growth. With negative interest rates and diminishing marginal returns to monetary policy, the euro area will be ever dependent on fiscal stimulus. Report Links: Battle Of The Central Banks - June 21, 2019 EUR/USD And The Neutral Rate Of Interest - June 14, 2019 Take Out Some Insurance - May 3, 2019 Japanese Yen Chart II-5JPY Technicals 1
JPY Technicals 1
JPY Technicals 1
Chart II-6JPY Technicals 2
JPY Technicals 2
JPY Technicals 2
Recent data in Japan have been mixed: Composite PMI was unchanged at 51.2 in July, while services PMI fell to 51.8. Household spending yearly growth fell to 2.7% in June. That said, previous growth of 4% was too high relative to Japan’s potential. Wages increased by 0.4% year-on-year in June. Leading economic index and coincident index both fell to 93.3 and 100.4 respectively in June. The trade balance increased to ¥759.3 billion in June. Current account balance narrowed to ¥1,211 billion in June. USD/JPY fell by 0.9% this week. In the Summary of Opinions released this week, the BoJ concluded that the Japanese economy has been moderately expanding, a trend that is likely to continue in the second half. However, this may be too ambitious. As we go to press, Q2 GDP growth is still pending, and a marked slowdown could be a harbinger for a much softer second half, especially given renewed trade tensions. That said, the path to easier monetary policy will be lined by a stronger yen. Report Links: Portfolio Tweaks Into Thin Summer Trading - July 5, 2019 Battle Of The Central Banks - June 21, 2019 Short USD/JPY: Heads I Win, Tails I Don’t Lose Too Much - May 31, 2019 British Pound Chart II-7GBP Technicals 1
GBP Technicals 1
GBP Technicals 1
Chart II-8GBP Technicals 2
GBP Technicals 2
GBP Technicals 2
Recent data in the U.K. have been mostly positive: Markit composite PMI increased to 50.7 in July. Services and construction components also increased to 51.4 and 45.3 respectively. Retail sales increased by 0.1% year-on-year in July. Halifax house prices contracted by 0.2% month-on-month in July. GBP/USD has been very volatile but returned flat this week. All eyes are on the new PM Boris Johnson and new Brexit developments. Our Geopolitical strategist is assigning 21% risk of a no-deal Brexit, and the probability would rise to 30% if negotiations with the EU fail. We believe that the pound could easily drop to 1.10-1.15 if there is no deal. That being said, we are looking to sell EUR/GBP at 0.94, given Europe will also absorb some collateral damage from a hard Brexit. Report Links: Battle Of The Central Banks - June 21, 2019 A Contrarian View On The Australian Dollar - May 24, 2019 Take Out Some Insurance - May 3, 2019 Australian Dollar Chart II-9AUD Technicals 1
AUD Technicals 1
AUD Technicals 1
Chart II-10AUD Technicals 2
AUD Technicals 2
AUD Technicals 2
Recent data in Australia have been mostly positive: Producer price inflation increased to 2% year-on-year in Q2. Retail sales grew by 0.4% month-on-month in June. Both composite and services PMI increased to 52.1 and 52.3 respectively in July. Australian Industry Group (AiG) construction index fell to 39.1 in July. Exports grew by 1% month-on-month in June, while imports contracted by 4% month-on-month. This nudged the trade surplus to A$8 billion in June, a record. AUD/USD fell by 1.8% initially, then rebounded, returning flat this week. The RBA held interest rates unchanged at 1% on Tuesday, after cutting by 25 bps both in June and July. Long-term government bond yields declined to record-lows. Currency markets are currently focused on interest rate differentials. Once the focus shifts to other fundamentals as global interest rates converge, the Aussie dollar will get a boost. Report Links: A Contrarian View On The Australian Dollar - May 24, 2019 Beware Of Diminishing Marginal Returns- April 19, 2019 Not Out Of The Woods Yet - April 5, 2019 New Zealand Dollar Chart II-11NZD Technicals 1
NZD Technicals 1
NZD Technicals 1
Chart II-12NZD Technicals 2
NZD Technicals 2
NZD Technicals 2
Recent data in New Zealand have been positive: Consumer confidence decreased by 5.1% month-on-month in July. On the labor market front, the participation rate was steady at 70.4% in Q2; Unemployment rate fell to 3.9%; Wages increased by 2.2% year-on-year in Q2. NZD/USD fell by 0.8% this week. RBNZ shocked the market with the half-percentage point rate cut this Wednesday, stating that a larger initial move would be best to meet the inflation and employment objectives in New Zealand. The RBNZ also lowered 2-year inflation expectations from 2.01% to 1.86% in Q3. Relative terms-of-trade favors our long AUD/NZD position. Stay with it. Report Links: Where To Next For The U.S. Dollar? - June 7, 2019 Not Out Of The Woods Yet - April 5, 2019 Balance Of Payments Across The G10 - February 15, 2019 Canadian Dollar Chart II-13CAD Technicals 1
CAD Technicals 1
CAD Technicals 1
Chart II-14CAD Technicals 2
CAD Technicals 2
CAD Technicals 2
Recent data in Canada have been mostly positive: Imports and exports both fell to C$50.2 billion and C$50.3 billion in June. The trade balance thus narrowed to C$0.14 billion. Bloomberg Nanos confidence index increased to 58.6 last week. Ivey PMI increased to 54.2 in July. New housing price index contracted by 0.2% year-on-year in June. USD/CAD increased by 0.2% this week. The sudden oil prices drop has dragged down the Canadian dollar. WTI crude oil prices plunged by more than 10% during the past week, and Western Canadian Select crude oil spot prices fell by 14.5%. Report Links: Portfolio Tweaks Into Thin Summer Trading - July 5, 2019 On Gold, Oil And Cryptocurrencies - June 28, 2019 Currency Complacency Amid A Global Dovish Shift - April 26, 2019 Swiss Franc Chart II-15CHF Technicals 1
CHF Technicals 1
CHF Technicals 1
Chart II-16CHF Technicals 2
CHF Technicals 2
CHF Technicals 2
Recent data in Switzerland have been mostly negative: Headline and core consumer price inflation dropped to 0.3% and 0.4% year-on-year respectively in July. Manufacturing PMI fell to 44.7 in July. Consumer confidence fell to -8 in July. Real retail sales increased by 0.7% year-on-year in June. USD/CHF fell by 1.2% this week. The concerns over the global growth, an escalating trade war, a potential hard-Brexit, political tensions in the Middle East and East Asia continue to weigh on investors’ sentiment. VIX once again touched 24 following Trump’s tweet to threaten to impose 10% tariffs over $300 billion Chinese goods last Thursday. We continue to favor the safe-haven Swiss franc as a tactical portfolio hedge. Report Links: What To Do About The Swiss Franc? - May 17, 2019 Beware Of Diminishing Marginal Returns - April 19, 2019 Balance Of Payments Across The G10 - February 15, 2019 Norwegian Krone Chart II-17NOK Technicals 1
NOK Technicals 1
NOK Technicals 1
Chart II-18NOK Technicals 2
NOK Technicals 2
NOK Technicals 2
There is little data from Norway this week: Manufacturing production yearly growth fell from 5% in May to 3% in June. USD/NOK has been flat this week. Next week, the Norges Bank is likely to reverse its well-telegraphed forward guidance of rate hikes, following global developments. With oil prices down, and a new trade war, they will stand pat in line with market expectations, but an interest rate cut cannot be ruled out. Report Links: Portfolio Tweaks Into Thin Summer Trading - July 5, 2019 On Gold, Oil And Cryptocurrencies - June 28, 2019 Currency Complacency Amid A Global Dovish Shift - April 26, 2019 Swedish Krona Chart II-19SEK Technicals 1
SEK Technicals 1
SEK Technicals 1
Chart II-20SEK Technicals 2
SEK Technicals 2
SEK Technicals 2
Recent data in Sweden have been mixed: Industrial production contracted by 0.7% year-on-year in June. Services production yearly growth also fell to 1.3% in June. However, industrial orders increased by 7.5% year-on-year in June, the strongest since July 2018. Budget balance widened to SEK 28.2 billion in July. USD/SEK fell by 0.9% this week. The upside surprise in industrial orders is mainly led by transport equipment. Mining and quarrying also rebounded to 9.3% compared with -7.8% in May. Our SEK/NZD position is now 0.4% in the money. The negative carry has been narrowed following RBNZ’s 50 bps rate cut. Report Links: Where To Next For The U.S. Dollar? - June 7, 2019 Balance Of Payments Across The G10 - February 15, 2019 A Simple Attractiveness Ranking For Currencies - February 8, 2019 Trades & Forecasts Forecast Summary Core Portfolio Tactical Trades Limit Orders Closed Trades
It is impossible to know whether the recent RMB depreciation was market-driven or engineered by the PBoC. Our best guess is that the latest RMB depreciation was driven by both market pressures as well as the authorities’ increased tolerance of a weaker RMB. …
Highlights So What? Tariffs and currency depreciation will likely lead to military saber-rattling in Asia Pacific. Why? President Trump is not immune to the market’s reaction to his trade war escalation. Yet China’s currency depreciation is a major escalation and the near-term remains fraught with danger for investors. Military shows of force and provocations could crop up across Asia Pacific, further battering sentiment or delaying trade talks. Remain short CNY-USD, short the Hang Seng index, long JPY-USD, and long gold. Overweight the U.S. defense sector relative to global stocks. Feature The Osaka G20 tariff ceasefire has collapsed; U.S. President Donald Trump is threatening tariffs on all Chinese imports; the People’s Bank of China has allowed the renminbi to depreciate beneath the important 7.0 exchange rate to the dollar; and the United States has formally labeled China a “currency manipulator.” What a week! The spike in volatility is likely to be accompanied by a rise in credit risk, as measured by the TED spread (Chart 1). Safe havens like gold, treasuries, and the Japanese yen are rallying in a classic risk-off episode, while messengers of global growth like copper, the Australian dollar, and the CRB raw industrials index are stumbling (Chart 2). Only green shoots in Chinese trade and German manufacturing have kept the selloff in check this week by improving the cyclical outlook despite elevated near-term risks. Chart 1So Much For The Osaka G20 Tariff Ceasefire!
So Much For The Osaka G20 Tariff Ceasefire!
So Much For The Osaka G20 Tariff Ceasefire!
Chart 2Key Risk-On/Risk-Off Indicators Breaking Down
Key Risk-On/Risk-Off Indicators Breaking Down
Key Risk-On/Risk-Off Indicators Breaking Down
While we anticipated the re-escalation of U.S.-China tensions, now is the time to take stock and reassess. President Trump is a political animal. While he has demonstrated a voracious risk appetite throughout the year, he is ultimately focused on reelection in November 2020. The United States will survive without a trade deal by then, but Trump may not. Presumably, Trump’s reason for increasing pressure on China throughout 2019 is to secure a deal by the end of the year. This would be to see China’s concessions translate into trade perks for the U.S. markets and economy in 2020 by the time he hits the campaign trail. The experience of Q4 2018 suggests that Trump changed his negotiating tack after U.S. equities fell by only 4% from their peak – but we consider an equity correction a clear pain threshold (Chart 3). Trump is closely associated with the economic fortunes of the country, even more so than the average president. Bear markets tend to coincide with recessions. Trump – beset by controversy and scandal at home – must assume that a recession will be the coup de grâce. Chart 3Where Is President Trump's Pain Threshold?
Where Is President Trump's Pain Threshold?
Where Is President Trump's Pain Threshold?
Chart 4Will Huawei Ban Hit The Tech Sectors?
Will Huawei Ban Hit The Tech Sectors?
Will Huawei Ban Hit The Tech Sectors?
Investors will get some clarity next week when the Commerce Department decides whether to renew the general temporary license for American companies to trade with Chinese telecoms giant Huawei. A full denial of the license would signal that Trump is unconcerned with recession and reelection probabilities and focusing exclusively on the national security threat from China. It would send technology sectors and the broader equity market into a plunge on both sides of the Pacific (Chart 4) and could significantly increase the risk that the global economy begins a downturn. Positive signals are scarce as we go to press: New tariff is on track: The U.S. Trade Representative is preparing a final list of $300 billion in goods to fall under a new 10% tariff, despite reports that Trump overrode USTR Robert Lighthizer in announcing the new tariff. This does not guarantee that the tariff will go into effect on September 1 but it does make it more likely than not. Huawei is under pressure: Office of Management and Budget has disqualified Huawei from any U.S. government contracts as of August 13 – a ban to be extended to any third parties contracting Huawei as of the same date next year. This is not encouraging for Huawei but it is a separate and more limited determination from that of the Commerce Department. Still, we expect the Trump administration to take some moves to offset the ongoing trade escalation. While we are inclined to think the new tariff will take effect, Huawei will likely get a reprieve in the meantime. This will help to ensure that the September trade talks in Washington, DC go forward. The administration has an interest in keeping the trade negotiations alive. Furthermore, there is some evidence that President Trump is recognizing the need to calm other “trade wars” to mitigate the impact of the central China trade war. In September the administration will attempt ratification of the USMCA in Congress – we still think this is slightly favored to go through. We also expect a U.S.-Japan trade agreement to materialize rapidly – likely at the UN General Assembly from September 17-30. Another positive sign is that the European Union has agreed to expand beef imports from the United States. Real movement on agriculture, while China cancels U.S. ag imports, implies that President Trump is less likely to impose car tariffs on Europe for national security reasons on November 13-14.1 The problem is that the fallout from China’s currency depreciation and the new tariffs will hit the market before anything else, which means we remain tactically bearish. Heightened trade tensions are also likely to spill into the strategic sphere in the near term. Saber-rattling – military shows of force and provocations – will increase the geopolitical risk premium across the globe, especially in East Asia. A frightening U.S.-China clash may ultimately encourage real compromises in the trade negotiations, but the market would get the negative news first. If Washington does not make any reassuring moves but expands the current policy assault on China – including through a Huawei ban – then we will consider shifting to a defensive posture cyclically as well as tactically. Bottom Line: We recognize that President Trump may be forced by the risk of a recession to relax the trade pressure and accept some kind of China deal – we may upgrade this 40% chance if and when the U.S. veers toward an equity bear market. In the meantime we expect further negative fallout from the past week’s aggressive maneuvers by both sides. Currency War Assuming that an equity correction is inevitable at some point and that Trump goes crawling back to the Chinese for trade talks: How will they respond? Will Xi Jinping, the strongman general secretary of a resurgent Communist Party, return to talks and reassure global markets at Trump’s beck and call? Or will he refuse, let the market do what it will, and let Trump hang? By letting the currency drop … Beijing is expressing open defiance. The renminbi’s depreciation – through PBoC inaction on August 5, then through action on August 8 – is a warning that Trump is approaching the point of no return. His initial grievance has always been Chinese “currency manipulation” but until now he has refrained from formally leveling this accusation (only using it on Twitter). By letting the currency drop well beneath the level at which Trump was inaugurated (6.8 CNY-USD), and beyond the global psychological threshold, Beijing is expressing open defiance and threatening essentially to break off negotiations. Chart 5China Sends Warning Via Currency Depreciation
China Sends Warning Via Currency Depreciation
China Sends Warning Via Currency Depreciation
The effect of continued depreciation would be to offset the effect of tariffs and ease financial conditions in China. This is fully in keeping with our view that China has opted for stimulus over reform this year. China is likely to follow up with further cuts to banks’ reserve requirement ratios and a cut to the benchmark policy interest rate (Chart 5). The July Politburo statement showed a greater willingness to stimulate the economy and it occurred prior to Trump’s new volley of tariffs. Currency appreciation is the surest way to rebalance China’s economy toward household consumption and obviate a strategic conflict with the United States. By contrast, yuan depreciation will exacerbate the U.S. trade deficit and give Trump’s Democratic rivals convenient evidence that the “Art of the Deal” is counterfeit. How far will the renminbi fall? Chart 6 updates our back-of-the-envelope calculation of the implication from different tariff scenarios assuming that the equilibrium bilateral exchange rate depreciation will equal the tariffs collected as a share of total exports to the United States. (10% tariff on $259 billion = $25.9 billion, which is 5% of $509 billion total.) The yuan is now approaching Scenario D, 25% tariffs on the first half of imports and 10% on the second half, which points toward 7.6 CNY-USD. There are reasons to believe that this simple framework won’t apply, at least in terms of the magnitude of the impact, but it gives an indication of considerable downward pressure. Chart 6The Yuan Will Fall, But Not Freely
The Yuan Will Fall, But Not Freely
The Yuan Will Fall, But Not Freely
Chester Ntonifor of our Foreign Exchange Strategy sees the yuan falling to around 7.3-7.4 if the new tariffs are applied based on the fact that the 25% tariff on $250 billion worth of goods produced a roughly 10% decline in the bilateral exchange rate. Our Emerging Markets Strategy also expects about a 5% drop in the CNY-USD. Having tightened capital controls during the last bout of depreciation in 2015-16, China is probably capable of controlling the pace of depreciation, preventing capital outflows from becoming a torrent, by selling foreign exchange reserves, further tightening capital controls, or utilizing foreign currency forward swaps. But Asian currencies, global trade revenues in dollars, and EM currencies and risk assets will suffer – and they have more room to break down from current levels.2 Meanwhile even a modest drop in the renminbi – amid a return to dovish monetary policy in global central banks – has revived concerns about a global currency war. A rising dollar is anathema to President Trump, who aims to reduce the trade deficit, encourage the on-shoring of manufacturing, and maintain easy financial conditions for the U.S. economy. Table 1U.S. Demands On China In Trade Talks
The Rattling Of Sabers
The Rattling Of Sabers
Chart 7U.S. Allies' Share Of Treasuries Rises
U.S. Allies' Share Of Treasuries Rises
U.S. Allies' Share Of Treasuries Rises
Trump’s decision to slap a sweeping new tariff on China – reportedly at the objection of all of his trade advisers except the ultra-hawkish Peter Navarro (Table 1) – was at least partly driven by his desire to see the Fed cut rates beyond the 25 basis point cut on July 31 and weaken the dollar. Yet the escalation of the trade war weighs on global trade and growth, which will push the dollar up. This reinforces the above argument that Trump will probably seek to offset the recent trade war escalation with some mitigating moves. Beyond inducing the Fed to cut further, it is difficult for President Trump to drive the dollar down. The Treasury Department can intervene in foreign exchange markets, but direct intervention does not have a successful track record. Interventions usually have to be sterilized (expansion of the money supply externally must be addressed at home by mopping up the new liquidity), which in the context of free-moving global capital means that any depreciation will be short-lived. An unsterilized intervention would be extremely unorthodox and is unlikely short of a major crisis and breakdown in institutional independence. The U.S. could attempt to engineer an internationally coordinated currency intervention, as we have highlighted in the past. But it is highly unlikely to succeed this time around. The U.S. is less dominant of a military and economic power than it was when it orchestrated the Smithsonian Agreement of 1971 and the Plaza Accord of 1985. Neither the European nor the Japanese economies are in a position to tighten monetary policy or financial conditions through currency appreciation. While China weans itself off treasuries, U.S. allies and others fill the void. Indeed, after a long period in which American allies declined as a share total holders of treasuries – as China and emerging markets increased their forex reserves and treasury holdings momentously – allies are now taking a greater share (Chart 7). Chart 8China Diversifies While It Depreciates
China Diversifies While It Depreciates
China Diversifies While It Depreciates
China is driving down the yuan not by buying more treasuries but by buying other things – diversifying away from the USD into alternative reserve currencies and hard assets, such as gold and resources tied to the Belt and Road Initiative (Chart 8). As trade, globalization, and global growth have slowed down, and as China’s growth model and the U.S.-China special relationship expire, global dollar liquidity is shrinking. Dollar liquidity is the lifeblood of the global financial system and the consequence is to tighten financial conditions, including via equity markets (Chart 9). The solution would be a trade deal in which China agrees to reforms to pacify the U.S., including an appreciation renminbi, while the U.S. abandons tariffs, enabling global trade, growth, commodity prices, and dollar liquidity to recover. Yet China was never likely to agree to a new Plaza Accord because it is delaying reform to its economy in order to maintain overall political stability – and the financial turmoil of 2015-16 only hardened this position. Chart 9Dollar Liquidity A Risk To Global Equities
Dollar Liquidity A Risk To Global Equities
Dollar Liquidity A Risk To Global Equities
Moreover Japan in 1985 was already a subordinate ally and had a security guarantee from the United States that was not in question. By contrast, China today is asserting its “equality” as a nation with the U.S., and has no guarantee that Americans are not demanding economic reforms so as to debilitate China’s political stability and strategic capability. After tariffs and currency war comes saber-rattling. Comparing China to Japan in the decades leading up to the Plaza Accord shows how remote of a possibility this solution is: China’s currency has been moving in precisely the opposite direction (Chart 10). Chart 10So Much For Plaza Accord 2.0
So Much For Plaza Accord 2.0
So Much For Plaza Accord 2.0
The Plaza Accord is a useful analogy for another reason: it marked the peak in Japanese market share in the U.S. economy. In Japan’s case, currency appreciation was the primary mover, while Japan also relocated production to the United States. Chart 11The Real Analogy With The Plaza Accord
The Real Analogy With The Plaza Accord
The Real Analogy With The Plaza Accord
In China’s case, if currency appreciation is ruled out and production is not relocated due to a failure to secure a trade agreement, then U.S. protectionism will remain the primary means of capping China’s share of the market (Chart 11). The dollar will remain strong and this will continue to weigh on global markets. Bottom Line: China’s recent currency depreciation is a warning signal to the U.S. that the trade negotiations could be broken off. There is further downside if the U.S. implements the new tariffs or hikes tariff rates further. The renminbi is unlikely to enter a freefall, however, because China maintains tight capital controls and is stimulating its economy. It is doubtful that the Trump administration can engineer a depreciation of the dollar through a multilateral agreement. It lacks the geopolitical heft of the 1970s-80s, and it does not have a strategic understanding with China that would enable Beijing to make the same degree of concessions that Tokyo made in 1985. Saber-Rattling After tariffs and currency depreciation, the next likeliest manifestation of strategic tensions lies in the military sphere.
Chart 12
While the U.S. threatens to cut off Chinese tech companies like Huawei, Beijing has signaled that countermeasures would include an embargo on U.S. imports of rare earth elements and products.3 When China implemented a partial rare earth export ban on Japan (Chart 12), the context was a maritime-territorial dispute in the East China Sea in which military and strategic tensions were also escalating. The threat to industry only amplified these tensions. There are several locations in East Asia where conditions are ripe for clashes and incidents that could add to negative global sentiment. Indeed, saber-rattling has already begun in Hong Kong, Taiwan, the Koreas, and the East and South China Seas. The following areas are the most likely to darken the outlook for U.S.-China negotiations: Direct U.S.-China tensions: The U.S. and China have experienced several minor clashes since the beginning of the Trump administration. The near-collision of a Chinese warship with the USS Decatur occurred in October 2018, after the implementation of the first sweeping tariff on $200 billion worth of goods – a period of tensions very similar to that of today.4 October 1 marks the 70th anniversary of the People’s Republic of China, an event that will be marked by outpourings of nationalism and a flamboyant military parade displaying advanced new weapons. The government in Beijing will be extremely sensitive in the lead-up to this anniversary, leading to tight domestic controls of news and media, hawkish rhetoric, and the potential for provocations on the high seas. Hong Kong and Taiwan: Chinese officials, including the People’s Liberation Army garrison commander in Hong Kong, the director of the Office of Hong Kong and Macao Affairs, and the city’s embattled Chief Executive Carrie Lam have warned in various ways that if unrest spirals out of control, it could result in mainland China’s intervention. A large-scale police exercise in Shenzhen, Guangdong, just across the water, has highlighted Beijing’s willingness to take forceful action. The deployment of mainland troops would likely lead to casualties and could trigger sanctions from western countries that would have common cause on this issue. The Tiananmen Square incident shows that such an event could lead to a non-negligible hit to domestic demand and foreign exports under sanctions (Chart 13). Hong Kong is obviously a much smaller share of total exports to China these days, but when combined with Taiwan – where there could also be a hit to sentiment from Hong Kong unrest and possibly separate economic sanctions – the impact could be substantial (Chart 14). Chart 13Mainland Intervention In Hong Kong Could Prompt Sanctions
Mainland Intervention In Hong Kong Could Prompt Sanctions
Mainland Intervention In Hong Kong Could Prompt Sanctions
Chart 14HK/Taiwan A Significant Share Of Greater China Trade
HK/Taiwan A Significant Share Of Greater China Trade
HK/Taiwan A Significant Share Of Greater China Trade
Why would Taiwan get worse as a result of Hong Kong? Unrest in Hong Kong has already galvanized opposition to the mainland’s policies in Taiwan, where the presidential election polling has shifted in incumbent President Tsai Ing-wen’s favor (Chart 15). Beijing has imposed new travel restrictions and held a number of intimidating military exercises, while the U.S. has increased freedom of navigation operations in the Taiwan Strait. These trends could worsen over the next year. Japan and the East China Sea: Japan’s top military official – General Koji Yamazaki – recently warned that Chinese military intrusions are increasing around the disputed Senkaku (Diaoyu) islands in the East China Sea. He called particular attention to China’s change of the Coast Guard from civilian to military control, which he said posed new risks of escalation in disputed waters. Japan itself may have an interest in a more confrontational stance over the coming year. The Japanese government has seen a rise in public opposition to its plan to revise the constitution to enshrine the Self-Defense Forces and thus move toward a more “normal” Japanese military and security posture (Chart 16).
Chart 15
Chart 16
A revival of trouble in the South China Sea: China has not reduced its assertive foreign policy in order to win regional allies amid its conflict with the United States. On the contrary, it has continued asserting itself to the point of alienating governments that have largely sought to warm up to the Xi administration, including both Vietnam and the Philippines. The Vietnamese have engaged in a month-long standoff over alleged Chinese encroachments in its Exclusive Economic Zone. And a clash near Sandy Cay in the Spratly Islands is forcing Philippine President Rodrigo Duterte, who has otherwise avoided confrontation with China, to address President Xi over the international court decision in 2016 that ruled out China’s claims of sovereignty over the disputed islands. The South China Sea is important because it is a vital supply line for all of the countries in the region. Even if the United States washed its hands of Beijing’s efforts to control the sea lanes, U.S. allies would still face a security threat that would drive tensions in these waters. This is a formidable group of Asian nations that China fears will seek to undermine it (Chart 17). And of course the Americans are not washing their hands of the region but actually reasserting their interest in maintaining a western Pacific defense perimeter. The Korean peninsula: North Korea has resumed testing short-range missiles, causing another hiccup in U.S. attempts at diplomacy (Chart 18). These tensions have the potential to flare as the U.S.-China trade talks deteriorate, since Beijing has offered cooperation on North Korea’s missile and nuclear program as a concession. Chart 17U.S. Asian Allies Formidable
U.S. Asian Allies Formidable
U.S. Asian Allies Formidable
Chart 18North Korean Provocations Still Low-Level
North Korean Provocations Still Low-Level
North Korean Provocations Still Low-Level
Ultimately North Korea needs to be part of the U.S.-China solution, so as long as tensions rise it sends a negative signal regarding the status of talks. And vice versa. South Korea is another case in which China is not reducing its foreign policy aggressiveness in order to win friends. On July 23, a combined Russo-Chinese bomber exercise over the disputed Dokdo (Takeshima) islands in the Sea of Japan led to interception by both Korean and Japanese fighter jets and the firing of hundreds of warning shots. The incident reveals that South Korean President Moon Jae-in is not seeing an improvement in relations with these countries despite his more pro-China orientation and his attempt to engage with North Korea. It also shows that while South Korea’s trade spat with Japan can persist for some time, it may take a back seat to these rising security challenges. As long as North Korean tensions rise it sends a negative signal regarding U.S.-China talks. Chart 19Russia May Need To Distract From Domestic Unrest
Russia May Need To Distract From Domestic Unrest
Russia May Need To Distract From Domestic Unrest
Russia, like China, is feeling immense domestic political pressure, including large protests, that may result in greater foreign policy aggression (Chart 19). And as China and Russia tighten their informal alliance in the face of a more aggressive U.S., American allies face new operational pressures and the potential for geopolitical crises will rise. Bottom Line: The whole panoply of East Asian geopolitical risks is heating up as U.S.-China tensions escalate. While the U.S. and China may engage in direct provocations or miscalculations, their East Asian neighbors are implicated in the breakdown of the regional strategic order. A crisis in any of these hotspots could jeopardize the already unfavorable context for any U.S.-China trade deal over the next year, especially during rough patches like the very near term. Investment Implications Chart 20A Strategic Investment
A Strategic Investment
A Strategic Investment
The potential for saber-rattling in the near term – on top of a series of critical U.S. decisions that could mitigate or exacerbate the increase in tensions surrounding the new tariff hike – argues strongly against altering our tactically defensive positioning at the moment. In this environment we advise clients to stick with our two strategic defense plays – long the BCA global defense basket in absolute terms, and long S&P500 Aerospace and Defense equities relative to global equities. The U.S. Congress’s newly agreed bipartisan budget deal provides a substantially improved fiscal backdrop for American defense stocks, which are already breaking out amid positive fundamentals. A host of non-negligible geopolitical risks speaks to the long-term nature of this trade (Chart 20). Our U.S. Equity Strategy recently reaffirmed its bullish position on this sector. We maintain that the U.S. and China have a 40% chance of concluding a trade agreement by November 2020. Note, however, that even a “no deal” scenario does not entail endless escalation. Presidents Trump and Xi could agree to another tariff ceasefire; negotiations could even lead to some tariff rollback in 2020. That would be, after all, Trump’s easiest way to “ease” trade policy amid recession risks. Nevertheless, our highest conviction call is not about whether there will be a deal, but that any trade truce that is reached will be shallow – an attempt to mitigate the trade war’s damage, save face, and bide time for the next round in U.S.-China conflict. We give only a 5% chance of a “Grand Compromise” by November 2020 that greatly expands the U.S.-China economic and corporate earnings outlook over the long haul. In this sense the ultimate trade deal will be a disappointment for markets. Matt Gertken, Vice President Geopolitical Strategist mattg@bcaresearch.com Footnotes 1 At the signing ceremony President Trump reminded his European interlocutors that the risk of car tariffs is not yet off the table. He concluded the celebration saying, “Congratulations. And we’re working on deal where the European Union will agree to pay a 25 percent tariff on all Mercedes-Benz’s, BMWs, coming into our nation. So, we appreciate that. I’m only kidding. (Laughter.) They started to get a little bit worried. They started — thank you. Congratulations. Best beef in the world. Thank you very much.” 2 See Emerging Markets Strategy Weekly Report, “EM: Into A Liquidation Phase?” August 8, 2019, ems.bcaresearch.com. 3 The national rare earth association holding a special working meeting and pledging to support any countermeasures China should take against U.S. tariffs. See Tom Daly, “China Rare Earths Group Supports Counter-Measures Against U.S. ‘Bullying,’” Reuters, August 7, 2019. 4 Military tensions are already heating up as Beijing criticizes the U.S. over the new Defense Secretary Mark Esper’s claim during his Senate confirmation hearings that new missile defense may be installed in the region in the coming years. This comes in the wake of the U.S. withdrawal from the 1987 Intermediate-Range Nuclear Forces Treaty, partly due to China’s not being a signatory of the agreement. Missile defense is a long-term issue but these developments feed into the current negative atmosphere.
Analysis on India is available below. Highlights Moderate RMB depreciation is consistent with the economic as well as political objectives of Chinese authorities. Yet, this is bad news for EM currencies and risk assets. As EM currencies depreciate, driven by a weaker RMB and lower commodities prices, foreign investors will head for the exit and EM risk assets will plummet. Meanwhile, there are tell-tale signs of an incipient EM breakdown. We continue to recommend shorting a basket of the following EM currencies versus the U.S. dollar: ZAR, CLP, COP, IDR, MYR, PHP and KRW. We also remain structurally short the RMB. Feature In our May 23 report titled The RMB: Depreciation Time? , we argued that the odds of an RMB depreciation were rising and that the currency would likely depreciate by some 6-8% versus the dollar. We contended that this would be bad news not only for EM currencies but also for all EM risk assets. EM fundamentals have been poor – both exports and cyclical domestic sectors have been contracting for some time. We illustrated the weak domestic demand conditions experienced by the majority of developing economies in our recent report, Domestic Demand In Individual EM Countries. Nevertheless, many investors have been ignoring the growing evidence of deteriorating growth conditions. The recent breakdown in the CNY/USD cross has reminded investors of the 2015 episode, when global risk assets – particularly in EM – tumbled following the yuan’s depreciation. We expect the RMB to depreciate by another 5-6% or so. We expect the RMB to depreciate by another 5-6% or so (Chart I-1). This will likely trigger a full-scale breakdown in EM risk assets. With respect to investor positioning, sentiment on EM was buoyant up until last week. Chart I-2 shows that asset managers’ and leveraged funds’ net long positions in EM equity index futures and high-beta liquid currencies futures was elevated as of Friday August 2. Chart I-1More Downside In RMB
More Downside In RMB
More Downside In RMB
Chart I-2Investor Sentiment On EM Was Positive As Of Last Week
Investors Are Very Bullish On EM Investor Sentiment On EM Was Positive As Of Last Week
Investors Are Very Bullish On EM Investor Sentiment On EM Was Positive As Of Last Week
With negative news proliferating on many fronts – the U.S.-China confrontation, slumping global trade, shrinking EM profits, tumbling commodities prices and RMB depreciation – the risk of a portfolio capital exodus from EM is rising, and a liquidation phase is highly probable. Implications Of RMB Depreciation It is impossible to know whether the recent RMB depreciation was market-driven or engineered by the PBoC. Our best guess is that the latest RMB depreciation was driven by both market pressures as well as the authorities’ increased tolerance of a weaker RMB. The mainland economy requires a weaker currency to counteract accumulating deflationary pressures from deteriorating domestic and foreign demand, as well as to offset rising U.S. import tariffs. The Chinese leadership likely regards RMB depreciation as an economic and political response to U.S. import tariffs. That said, the Chinese authorities have significant latitude to control the exchange rate, not only via selling the central bank’s foreign currency reserves and tightening capital controls but also by utilizing foreign currency forward swaps. Therefore, the RMB depreciation will run further but will unlikely spiral out of control. Regardless of the cause of the depreciation, a weaker RMB will affect the rest of the world in general and EM in particular. Regardless of the cause of the depreciation, a weaker RMB will affect the rest of the world in general and EM in particular via the following two channels: Escalating competitive devaluation: The RMB is causing a breakdown in other Asian currencies, especially those exposed to manufacturing exports (Chart I-3). Critically, falling export prices herald currency depreciation not only in China but also in other Asian economies such as Korea, Singapore and Taiwan (Chart I-4). Chart I-3Breakdown In Emerging Asian Currencies
Breakdown In Emerging Asian Currencies
Breakdown In Emerging Asian Currencies
Chart I-4Lower Export Prices Warrant Currency Depreciation
bca.ems_wr_2019_08_08_s1_c4
bca.ems_wr_2019_08_08_s1_c4
Less Chinese imports = a drag on global trade: An RMB devaluation reduces Chinese importers’ purchasing power in U.S. dollar terms. The same amount of credit and fiscal stimulus in yuan when converted into U.S. dollars can be used to procure less goods and commodities. In brief, the gap between mainland imports in yuan and in dollars will widen (Chart I-5). Chart I-5Chinese Imports In Dollars Will Continue Shrinking
Chinese Imports In Dollars Will Continue Shrinking
Chinese Imports In Dollars Will Continue Shrinking
Chinese imports in dollar terms will continue contracting. Many EM and some DM currencies will be negatively affected, since China is a major source of demand for these economies. Bottom Line: Moderate RMB depreciation is consistent with the economic as well as political objectives of Chinese authorities. Yet, this is bad news for EM currencies and risk assets. An EM Breakdown Is In The Making There are a number of financial markets and individual share prices that have been forewarning of potential breakdowns in EM/China plays and global pro-cyclical assets. In particular: Having failed to break above its 200-day moving average, the Risk-On vs. Safe-Haven currency ratio1 has dropped below its three-year moving average (Chart I-6, top panel). This indicator has had a very high correlation with EM stocks and global materials equities. Hence, its breakdown heralds a gap down in EM share prices as well as global materials stocks (Chart I-6, middle and bottom panels). Chart I-6Beware Of Breakdowns
bca.ems_wr_2019_08_08_s1_c6
bca.ems_wr_2019_08_08_s1_c6
The rationale for using the 400-day (18-month), 800-day (three-year) and other long-term moving averages is similar to why investors utilize the 200-day (nine-month) moving average. When a market fails to punch below or above any of its long-term moving averages, odds are that it will make a new high or low, respectively. We discussed these technical indicators and have offered empirical examples of how these signals have historically worked in principal markets such as the S&P 500 and U.S. bond yields in our past reports. Base metals (including copper) and oil prices as well as global steel stocks have broken below their three-year moving averages (Chart I-7). Commodities prices have been exhibiting a very bearish chart formation, and will likely plunge further. BCA’s Emerging Markets Strategy team remains bearish on commodities prices, even though BCA’s house view is bullish. The primary basis for this divergence in view has been and remains the Chinese growth outlook. Chart I-7Commodities Are In A Trouble Spot
Commodities Are In A Trouble Spot
Commodities Are In A Trouble Spot
Chart I-8Canary In A Coal Mine For Commodities
Canary In A Coal Mine For Commodities Complex
Canary In A Coal Mine For Commodities Complex
Share price of Glencore – a major player in the commodities space – has plunged below its three-year moving average, which has served as a support a couple of times in recent years2 (Chart I-8). Crucially, this stock has exhibited a head-and-shoulders formation, and has nose-dived below its neckline. Kennametal (KMT) – a high-beta U.S. industrial stock – leads the U.S. manufacturing cycles and has formed a similar configuration as Glencore’s (Chart I-9). This raises the odds that the U.S. manufacturing PMI will drop below the 50 line. Finally, the relative performance of S&P 500 global cyclical stocks versus global defensives3 has resumed its downtrend after failing to break above its 200-day moving average (Chart I-10). This foreshadows a poor global growth outlook and serves as a downbeat signal for global cyclical plays. Chart I-9Canary In A Coal Mine For U.S. Industrials
Canary In A Coal Mine For U.S. Industrials
Canary In A Coal Mine For U.S. Industrials
Chart I-10A Message From S&P 500 Industry Groups
A Message From S&P 500 Industry Groups
A Message From S&P 500 Industry Groups
Does all of the above imply that the global growth slowdown is already priced into global financial markets? Not necessarily. These breakdowns have occurred on the fringes of markets. As the average investor heeds to these signals and as these breakdowns move from the periphery to the center, there will be more damage to global risk assets in general and EM in particular. Importantly, there are cyclical segments of global and EM financial markets that have not adjusted and remain vulnerable. For example, global semiconductor stocks and global industrial share prices remain elevated despite the enduring global manufacturing recession (Chart I-11). Chart I-11Mind The Gaps
Mind The Gaps
Mind The Gaps
The wide gap between share prices and revenues of these cyclical sectors implies that investors have been pricing an imminent business cycle recovery. Odds are that the current global manufacturing downturn will last longer or that a bottoming-out phase will be more extended than in 2012 and 2015. We have elaborated on the rationale for a more extended downturn in our past reports, and our conclusions still stand: A lack of aggressive stimulus in China, a lower propensity to spend among Chinese households and companies, as well as the ongoing trade war will continue to dampen business sentiment worldwide. Consequently, the current gap between share prices of these cyclical sectors and their underlying revenues will likely be closed via lower stock prices. As to non-cyclical equity sectors, they are less vulnerable to a profit downturn but their valuations are very expensive, and investor positioning is heavy. Further, EM local currency bonds as well as EM sovereign and corporate credit markets have been buoyant because of falling U.S. interest rates. Yet EM currencies are at risk from both RMB devaluation and falling commodities prices. EM currency depreciation will in turn undermine returns on EM local currency bonds and spur an investor exodus from high-yielding domestic bonds. Chart I-12Which Way These Gaps Will Close?
Which Way These Gaps Will Close?
Which Way These Gaps Will Close?
Excess returns on EM sovereign and corporate credit have historically correlated with EM currencies and commodities prices as well as with equity returns (Chart I-12). Commodities prices, EM currencies and share prices are all poised to weaken further. It will be very surprising if sovereign and corporate spreads do not widen from their current tight levels. Bottom Line: There are a number of tell-tale signs of an incipient EM breakdown. As EM currencies depreciate driven by a weaker RMB and lower commodities prices, foreign investors will head for the exit and all EM risk assets will plummet. Investment Recommendations We are reiterating our negative stance on EM currencies and risk assets both in absolute terms and relative to their DM counterparts. Our recommended country overweights and underweights for EM equity, sovereign credit and local currency bond portfolios are always available at the end of our reports (please refer to pages 18 and 19 ). As to exchange rates, we continue to recommend shorting a basket of the following EM currencies versus the U.S. dollar: ZAR, CLP, COP, IDR, MYR, PHP and KRW. We also remain structurally short the RMB. In a nutshell, EM currency depreciation will -- for now -- overwhelm the positive impact of lower domestic interest rates on EM equities and in some cases will prevent developing nations’ central banks from reducing rates further. Finally, we recommended a long gold / short oil and copper trade on July 11 and this has panned out nicely (Chart I-13). Gold has made a structural breakout versus the rest of commodities complex and investors should hold into this position. We recommended a long gold / short oil and copper trade on July 11 and this has panned out nicely. Chart I-13A Structural Breakout In Gold Versus Oil And Copper
A Structural Break In Gold Versus Oil And Copper
A Structural Break In Gold Versus Oil And Copper
Arthur Budaghyan Chief Emerging Markets Strategist arthurb@bcaresearch.com Indian Stocks: Poor Profit Outlook Amid Rich Valuation Indian stocks have failed to break out above their highs, in both local currency and U.S. dollar terms, and have rolled over decisively (Chart 1, top panel). Chart II-1Indian Stocks Failed To Break Major Resistance Levels
Indian Stocks Failed To Break Major Resistance Levels
Indian Stocks Failed To Break Major Resistance Levels
Relative to the EM equity benchmark, Indian share prices have recently been underperforming despite collapsing oil prices and plunging U.S. interest rates. Furthermore, this bourse’s relative performance against the global equity index in common currency terms has bounced lower from a major structural technical resistance (Chart II-1, bottom panel). India’s recent underwhelming equity dynamics have transpired despite ongoing monetary policy easing by the country's central bank. In a nutshell, the roots of this poor equity performance trace back to lackluster profitability, rich equity valuations and overcrowded positioning. We recommend investors continue avoiding Indian equities for now as more downside is likely. Domestic Growth/Corporate Earnings Slump Indian domestic demand growth has been nosediving with no clear end in sight: Sales of passenger cars, two-wheelers, three-wheelers, tractors as well as medium & heavy commercial trucks are all contracting at double-digit rates (Chart II-2). Similarly, real gross fixed capital formation growth has decelerated, the number of capex projects underway are falling, capital goods imports and production are contracting and cement production growth has plummeted (Chart II-3). Chart II-2Domestic Demand Is Very Weak
Domestic Demand Is Very Weak
Domestic Demand Is Very Weak
Chart II-3Capex And Infrastructure Are Heading South
Capex And Infrastructure Are Heading South
Capex And Infrastructure Are Heading South
Some cracks are also appearing in India’s real estate sector. Chart II-4 shows nationwide housing price growth is decelerating in nominal terms and deflating in real (inflation-adjusted) terms. Chart II-4House Prices Are Contracting In Real Terms
House Prices Are Contracting In Real Terms
House Prices Are Contracting In Real Terms
Typically, share prices become extremely sensitive to business cycles slowdowns when valuations are elevated. This is currently the case for the Indian bourse. In fact, India’s latest corporate earnings season was lackluster and many companies across various sectors have warned about slowing growth. More visibility on an ameliorating profit outlook as well as lower valuation multiples are needed for share prices to reach a sustainable bottom. India Is Joining The “Kick The Can Down Road” Club Banks have been the star performers within the Indian bourse with non-financials generating underwhelming returns. This warrants particular attention to bank stocks’ fundamentals and valuations. Recent media reports have been highlighting that India’s NPL cycle has finally turned for the better – marking an end to the country’s bad asset cycle that started in 2013. Chart II-5Poor Debt Servicing Ability Among Indian Corporate Borrowers
Poor Debt Servicing Ability Among Indian Corporate Borrowers
Poor Debt Servicing Ability Among Indian Corporate Borrowers
However, scratching below the surface, the recent reduction in India’s NPLs ratio has not occurred due to organic improvement in India’s corporate borrowers’ ability to service debt. For instance, the EBITDA-to-interest expense ratio for the country’s non-financial publically-listed companies has not improved at all (Chart II-5). Rather, what seems to be driving the NPLs ratio lower is a regulatory forbearance: The new Governor of the RBI – Shaktikanta Das – issued a new circular on NPL recognition in June. It essentially provides commercial banks with much more flexibility in the way they can deal with their bad assets and permits them to delay their NPL recognition. The central bank also allowed India’s manufacturing and infrastructure corporates in default to borrow via the External Commercial Borrowing route in order to pay down their domestic loans under a one-off settlement. Furthermore, the RBI permitted commercial banks to restructure loans of micro-, small-, and medium-sized businesses before they turn bad - allowing banks to delay the proper recognition of such types of loans as well. Finally, the RBI reduced the risk weight of consumer credit from 125% to 100% in its monetary policy meeting yesterday. The objective of this measure is to accelerate consumer credit growth even though the latter has been booming in the past ten years. All in all, these regulatory measures reverse banks and corporate sector restructuring efforts and thereby are negative from a structural perspective. In the past, we were positive on the Indian banking system structurally because the central bank was promoting critical reforms. Under the new leadership of the RBI, India is now joining the “kick the can down the road” club. This warrants somewhat lower equity multiples for banks than before. Financials Stocks Are Still Expensive Despite the selloff, Indian bank stocks are not yet cheap. For Indian public banks we focused our analysis on the State Bank of India (SBI) as it is the largest and only public bank that has performed reasonably well. This bank presently trades at a price-to-book value (PBV) ratio of 1.15. Our analysis shows that at a more realistic 12% NPL ratio4 and assuming a 30% recovery ratio, 25% of its equity would be impaired. This would move its adjusted PBV ratio to 1.5. Assuming a fair-value PBV ratio of 1.3, the SBI appears to be overvalued by 15-17%. As to private banks,5 they are also expensive. For instance, if their NPLs rise to 6% from around 3% currently, they would seem overvalued by at least 12% (Table II-1). The analysis assumes a generous recovery ratio of 50% and a very high fair-value PBV ratio of 3.3.
Chart II-
Finally, a comment on non-bank financial companies (NBFCs) is warranted. Their liquidity situation is extremely grim. Chart II-6 shows that our proxy for liquidity, measured as short-term investments (including cash) minus short-term borrowing for the 11 large NBFCs we assessed,6 is in a deep negative territory. In other words, these companies have a substantial maturity mismatch. Chart II-6Major Asset-Liability Mismatches In Non-Bank Finance Sector
Major Asset-Liability Mismatches In Non-Bank Finance Sector
Major Asset-Liability Mismatches In Non-Bank Finance Sector
Remarkably, these non-bank organizations grew their assets at a 20% annual compounded growth rate since 2009. Odds are they have misallocated capital to a large extent and their NPL ratio is probably in the double-digits. According to the RBI, non-bank financials’ gross NPLs ratio stood at 6.6% as of March 2019. By comparison the NPLs ratio of Indian banks peaked at 11.2%. Meanwhile, their valuations are not cheap at all. For instance, the NBFCs included in the MSCI India equity index carry a PBV ratio of 3.5 for consumer finance focused companies and a PBV ratio of 3 for thrift & mortgage finance focused companies. Bottom Line: Share prices of banks and non-bank financials are far from being cheap and remain at risk of further decline. Investment Recommendations In absolute U.S. dollar terms, Indian stocks have meaningful downside. This is confirmed by some precarious technical signals: the equal-weighted stocks index has dropped by 28% from its top in January 2018 and small-cap stocks are breaking down (Chart II-7). Finally, while the RBI cut rates yesterday, share prices still closed lower. Chart II-7Ominous Signals From The Indian Broader Equity Market
Ominous Signals From The Indian Broader Equity Market
Ominous Signals From The Indian Broader Equity Market
In terms of our relative strategy, we continue to recommend that dedicated EM equity investors keep underweighting Indian stocks for now, but our conviction level is lower than it was in May. The basis is that ongoing fiscal and monetary easing, coupled with very low U.S. bonds yields and oil prices, might help Indian equities to outpace their EM peers at some point. For now, we will wait for a better entry point to upgrade. Our strongest conviction is that Indian stocks will underperform the global equity index in common currency terms (please see Chart II-1 on page 11). As for the currency, lingering problems in the NBFC sector will force the RBI to keep liquidity in the banking system abundant. Excessive liquidity expansion amid the ongoing selloff in EM currencies will hurt the rupee. Fixed-income investors should play a yield curve steepening trade as lower short rates and rupee deprecation could generate a yield curve steepening. Ayman Kawtharani, Editor/Strategist ayman@bcaresearch.com Footnotes 1 Average of CAD, AUD, NZD, BRL, CLP & ZAR total return (including carry) indices relative to average of JPY & CHF total returns. 2 The drop occurred well before the latest negative profit report. 3 These indexes are based on U.S. S&P 500 industry groups and published by Goldman Sachs. The Bloomberg tickers for S&P 500's global cyclicals and global defensives indexes are GSSBGCYC and GSSBGDEF, respectively. 4 Instead of the 7.5% ratio it reported last week. 5 We analyzed the six largest private banks: HDFC Bank, ICICI Bank, Axis Bank, Yes Bank, IDFC First Bank and Kotak Mahindra Bank 6 Six of which are listed in the MSCI India equity index and account for 12% of MSCI total market cap. Equity Recommendations Fixed-Income, Credit And Currency Recommendations
Highlights Chinese economic growth slowed in June & July, but at a more moderate pace than had been the case earlier this year. The housing market is a notable exception, which appeared in June to slow in a broad-based fashion. The near-term (0-3 month) outlook is bearish for China-related assets, and investors should bet on further weakness in the RMB. However, investors should remain cyclically bullish (i.e., over a 6-12 month time horizon) in anticipation of an eventual reflationary response from Chinese policymakers that will boost domestic demand enough to offset the intensifying drag from weak external demand. Feature Tables 1 and 2 on pages 2 and 3 highlight key developments in China’s economy and its financial markets over the past month. On the growth front, coincident measures of economic activity suggest that China’s economy experienced “controlled weakness” in June and July: growth continued to slow, but at a more moderate pace than had been the case in late-2018 and early-2019. The housing market appeared to be the exception to this relative stability; all 10 of the core housing indicators that we track decelerated in June, suggesting that a moderation in housing-related activity was broad-based. This implies that a further slowdown in construction is likely over the coming months, barring a meaningful pickup in sales. Table 1China Macro Data Summary
China Macro And Market Review
China Macro And Market Review
Table 2China Financial Market Performance Summary
China Macro And Market Review
China Macro And Market Review
Within financial markets, all of the key developments have occurred over the past several trading days, in response to President Trump’s threat last week to further hike U.S. import tariffs at the beginning of September. Both investable and domestically-listed Chinese stocks have significantly underperformed the global benchmark, as have Hong Kong stocks in response to intensifying protests in the city. A sharp decline in the RMB and the U.S. designation of China as a currency manipulator have unnerved Chinese and global investors, and our bias is to expect even further weakness in the yuan. The near-term outlook remains bearish for China-related assets, as we see the selloff over the past week as the beginning of a financial market riot point that will force policymakers, both in China and the U.S., to address the economic weakness that a full-tariff scenario will entail. The near-term outlook remains bearish for China-related assets, as we see the selloff over the past week as the beginning of a financial market riot point that will force policymakers, both in China and the U.S., to address the economic weakness that a full-tariff scenario will entail. Still, investors should remain cyclically bullish in anticipation of an eventual reflationary response from Chinese policymakers that will boost domestic demand enough to offset the drag from weak external demand. Otherwise stated, we expect Chinese relative performance to trend lower in the near-term, but to be higher 12-months from today. Investors should also continue to hedge the inherent RMB exposure from a long US$ cyclical position in Chinese stocks with a long USD-CNH position. In reference to Tables 1 and 2, we provide below several detailed observations concerning developments in China’s macro and financial market data: Our leading indicator for the Li Keqiang Index is now in a clear uptrend, most recently led by a meaningful improvement in monetary conditions and credit growth. Chart 1Our Leading Indicator Is Now In A (Moderate-Strength) Uptrend
Our Leading Indicator Is Now In A (Moderate-Strength) Uptrend
Our Leading Indicator Is Now In A (Moderate-Strength) Uptrend
Chart 2Money, And Still-Modest Credit Growth, Are Holding Back Our Leading Indicator
Money, And Still-Modest Credit Growth, Are Holding Back Our Leading Indicator
Money, And Still-Modest Credit Growth, Are Holding Back Our Leading Indicator
The Li Keqiang index (LKI) rose moderately in June after a significant decline in May, but remains in a downtrend (Chart 1). The June increase was driven entirely by a pickup in electricity production (which had nearly contracted in May); bank loan growth and rail cargo volume both decelerated. The takeaway for investors is that while the Chinese economy did not slow meaningfully further in June, the pace of growth remained tepid, suggesting the economic activity remains vulnerable to a further increase in U.S. import tariffs. Our leading indicator for the LKI is now in a clear uptrend, most recently led by a meaningful improvement in monetary conditions and credit growth (Chart 2). However, the magnitude of the rise in the indicator is being held back by growth in the money supply, which has only slightly accelerated over the past few months, as well as a “half strength” recovery in credit. Our view is that Chinese policymakers are likely to wait for further economic weakness before allowing money & credit growth to significantly overshoot, which increases the odds of a continued market riot in the short-term. Chart 3Decelerating House Price Appreciation Is Coming
Decelerating House Price Appreciation Is Coming
Decelerating House Price Appreciation Is Coming
All 10 of the housing indicators shown in Table 1 decelerated in June, suggesting that a moderation in housing-related activity was broad-based. Our BCA 70-city diffusion index for (YoY) house prices has an excellent track record at leading inflection points in overall price growth (Chart 3), and is currently suggesting that house price appreciation is at risk of falling back to mid-2018 levels (which would imply a 5-6 percentage point deceleration). Continued weakness in floor space sold continues to suggest that the ongoing pace of housing construction is unsustainable; we expect a further moderation in floor space started over the coming several months barring a meaningful pickup in sales. Both the Caixin and official manufacturing PMI for China rose in July, including the official new export orders component (which we have been closely following). However, the survey was taken prior to President Trump’s renewed tariff threat last week, and we expect the July gains to reverse in August barring a major de-escalation in the conflict. Both investable and domestically-listed Chinese stocks have significantly underperformed the global benchmark over the past week due to President Trump’s threat to impose tariffs on all remaining imports from China. We noted in our May 29 weekly report that a financial market riot point remained likely over the coming few months,1 and we explicitly recommend an underweight position in Chinese stocks for the remainder of 2019 in last week’s report.2 Still, investors should remain cyclically bullish in anticipation of an eventual reflationary response from Chinese policymakers that will boost domestic demand enough to offset the drag from weak external demand. Investors who are already positioned in favor of Chinese stocks should stay long, despite the likelihood of further near-term losses. Investors should remain cyclically bullish in anticipation of an eventual reflationary response from Chinese policymakers that will boost domestic demand enough to offset the drag from weak external demand. Chart 4Intensifying Protests Have Weighed On Hong Kong's Relative Equity Performance
Intensifying Protests Have Weighed On Hong Kong's Relative Equity Performance
Intensifying Protests Have Weighed On Hong Kong's Relative Equity Performance
The MSCI Hong Kong index has also significantly underperformed the global benchmark since late-July, in response to intensifying protests in the city (Chart 4). The protests have been driven by underlying socio-economic factors as well as Beijing’s encroachment on traditional political liberties. However, Hong Kong has no real alternative to Beijing’s sovereignty, and the unrest should gradually die down as long as the imposition of martial law is avoided. Nonetheless, Hong Kong’s stock market is likely to remain under pressure in the interim; for now, we recommend that investors stay underweight versus China and Taiwan. The sector performance within China’s investable and domestically-listed equity markets over the past month has largely been along cyclical / defensive lines. In the investable market, consumer staples, health care, financials, information technology, communication services, and utilities have all outperformed, in contrast to energy, materials, industrials, consumer discretionary, and real estate stocks. The pattern has been similar in the domestic market, with two exceptions: modest staples underperformance, and material underperformance of comm services. Real estate stocks have been among the worst performers in both markets over the past month, possibly in response to the deteriorating housing market data that we highlighted above. China’s 3-month repo rate has fallen approximately 20 bps over the past month, and is now back close to its one-year low. We continue to believe that a cut to the benchmark lending rate is unlikely in the near-term, but could occur in Q4 if economic conditions in China weaken materially further. Chinese onshore corporate spreads increased modestly over the past month, but have not yet risen to a new high for the year. The uptrend in spreads that began in late-May does reflect renewed risks to the Chinese economy from a further increase in U.S. import tariffs, but annualizing the most recent pace of onshore corporate defaults suggests that onshore bond spreads are still much too high. Our long China onshore corporate bond trade continues to register gains in local currency terms (Chart 5), and we recommend that investors stick with a long/overweight currency-hedged stance. Our bias is to bet on further RMB weakness until policymakers aggressively ramp up their reflationary efforts. The yuan weakened sharply this week, with the U.S. dollar breaking above 7 versus both the onshore and offshore RMB (Chart 6). This is the weakest level for the currency since the global financial crisis, and the decline has clearly occurred in response to last week’s tariff threat. We noted in our May 15 report that a meaningful decline in the exchange rate would likely be required in order to stabilize the outlook for earnings & the economy,3 and we recommended at that time that investors should hedge the inherent RMB exposure from a long US$ cyclical position in Chinese stocks by opening a long USD-CNH trade. It is difficult to forecast how much further the RMB is likely to fall, but our bias is to bet on further weakness until policymakers aggressively ramp up their reflationary efforts. Stay tuned. Chart 5Despite Ongoing Default Concerns, Onshore Corporate Bonds Are Winners
Despite Ongoing Default Concerns, Onshore Corporate Bonds Are Winners
Despite Ongoing Default Concerns, Onshore Corporate Bonds Are Winners
Chart 6Weakest RMB In A Decade, And Further Declines Are Likely
Weakest RMB In A Decade, And Further Declines Are Likely
Weakest RMB In A Decade, And Further Declines Are Likely
Jonathan LaBerge, CFA, Vice President Special Reports jonathanl@bcaresearch.com Jing Sima China Strategist jings@bcaresearch.com 1 Please see China Investment Strategy Weekly Report, “Waiting For The Pain,” dated May 29, 2019. 2 Please see China Investment Strategy Weekly Report, “Threading A Stimulus Needle (Part 2): Will Proactive Fiscal Policy Lose Steam?” dated July 24, 2019. 3 Please see China Investment Strategy Weekly Report, “Simple Arithmetic,” dated May 15, 2019. Cyclical Investment Stance Equity Sector Recommendations
The move is not unprecedented - the U.S. accused China of currency manipulation from 1992-94 - but our Geopolitical Team argues that the U.S. and China have experienced a structural break in relations that is the fundamental driver of the tit-for-tat trade…