Currencies

Executive Summary UK Stocks Are Close To A Bottom
UK Stocks Are Close To A Bottom
UK Stocks Are Close To A Bottom
The UK economic outlook has greatly deteriorated. Weak global growth and punishing energy inflation will cause activity to contract over the next 12 months. Cost-push pressures will drag inflation above 10% in 2022. Moreover, demand-pull inflation highlights problems with the supply-side of the economy. UK yields have downside relative to those in the Euro Area. GBP/USD will bottom once global stock prices find a floor. EUR/GBP possesses more upside. UK stocks will enjoy a structural tailwind relative to their Eurozone counterparts as a result of a secular bull market in commodity prices. Nonetheless, UK equities are likely to underperform in the second half of 2022. UK small-cap stocks are massively oversold compared to large-cap shares; however, a peak in energy inflation must take place for small-cap equities to stage a rebound. TACTICAL INCEPTION DATE RETURN SINCE INCEPTION (%) COMMENT Overweight UK Gilts Within European Fixed-Income Portfolios 05/16/2022 Cyclical Buy European Healthcare Equities / Sell UK Healthcare Equities 05/16/2022 Tactical Buy European Financials Equities / Sell UK Financials Equities 05/16/2022 Tactical Bottom Line: British Gilts will outperform because of the weakness in UK economic activity, but the trade-weighted pound will remain under pressure. The performance of UK large-cap names is mostly independent from the state of the British economy. The commodity secular bull market will create a potent tailwind for this market. However, a better entry point lies ahead. The Bank of England’s (BoE) latest policy meeting was a cold shower for market participants and their aggressive interest rate pricing in the SONIA curve. Money markets expected a peak in the Bank Rate of 2.7% in 2023, but the BoE’s new Market Participants Survey is calling for it to peak at 1.75% before easing off to 1.5% in 2024. The UK economy is in trouble. Inflation is high and broad-based, which explains why investors are pricing in such an aggressive path for the Bank Rate. Yet, economic activity is weakening and could even contract in early 2023. The BoE clearly puts more weight on growth than investors do. What are the implications of the inflation, growth, and policy outlook for British assets? BCA has upgraded its view on UK bonds to overweight within global fixed income portfolios. We expect more softness in the pound versus the euro. UK large-cap stocks will continue to trade in line with energy dynamics, which means it is still too early to buy British small-cap equities. In the meantime, UK financial and healthcare names will underperform their Euro Area counterparts. Growth To Weaken Further The -0.1% month-over-month GDP contraction in March underscores that UK economic activity has already decelerated sharply. However, the deterioration is only starting. Most sectors of the economy show ominous signs for the quarters ahead. Consumer Sector The biggest hurdle facing UK consumers, like most of their European neighbors, is the surge in inflation, particularly energy and food prices. Safety nets are looser than on the continent, and UK households’ real disposable income are contracting sharply. The impact of this weakening of activity is already visible. UK consumer confidence is falling in line with the knock to real disposable income (Chart 1, top panel). Moreover, real retail sales have already slowed sharply, and the BRC Like-For-Like Retail Sales measure is contracting on an annual basis (Chart 1, bottom panel). As a result, the outlook for consumption is worsening. Ofgem, the UK gas and electricity market regulator, lifted its energy price cap by 54% on April 1st and plans to increase it again by an expected 40% in October. Consequently, the BoE anticipates the share of households’ disposable income spent on energy to hit 7.7% by the end of the year — its highest level since the early 1980s (Chart 2). Chart 1Falling Real Incomes Hurt
Falling Real Incomes Hurt
Falling Real Incomes Hurt
Chart 2Intensifying Energy Drag
Intensifying Energy Drag
Intensifying Energy Drag
The savings cushion developed during the pandemic will not be enough to prevent weaker retail sales. More than 40% of households plan to dip into their existing savings and curtail their savings rate; however, UK excess savings skew heavily toward the richer households. Poorer households with low savings are the ones who spend the largest share of their income on energy (Chart 3), and they are also the ones with a higher marginal propensity to consume. Thus, the knock to these households portends further weakness in consumption volumes. Chart 3The Poor Are Hit Harder
Is UK Stagflation Priced In?
Is UK Stagflation Priced In?
Chart 4No Salvation From Housing
No Salvation From Housing
No Salvation From Housing
Housing is unlikely to save the day. While house prices and housing transactions are robust (Chart 4, top panel), mortgage approvals are declining rapidly and average sales per chartered surveyors are also softening (Chart 4, bottom panels), which suggests housing activity will slow. Rising mortgage rates are a problem. Since January, the quoted rates on mortgages with 90% LTV and 75% LTV are up 65bps and 70bps, respectively, which is hurting housing marginal demand. Moreover, 20% of the UK’s mortgage stock carries variable rates, which further hurts aggregate demand. Business Sector The business sector is also feeling the crunch from rapidly rising energy and input costs. It also dreads the deterioration in consumer sentiment and its implication for future final demand. Chart 5Dwindling Capex Outlook
Dwindling Capex Outlook
Dwindling Capex Outlook
Business confidence is falling abruptly. The CBI Inquiry Business Optimism measure has fallen to its lowest level since the beginning of the pandemic in 2020, when the UK GDP was contracting at a 21% annualized rate (Chart 5). Unsurprisingly, the collapse in business confidence prompted a rapid slowdown in CAPEX. The BoE’s Agents Survey reports that 40% of UK firms have unsustainably low profit margins because of rising input prices and partial pass-through. As a result of financial stress, further capex weakness is likely in the coming quarters. The impact on overall activity of these expanding worries is evident. UK industrial production has slowed very sharply and is now a meager 0.7% on an annual basis. The situation will degrade. Export growth remains strong, which is helping the business sector; however, the rapid slowdown in global industrial production indicates that UK exports will follow suit (Chart 5, second panel). This will have a knock-on effect on corporate profits (Chart 5, bottom panel), which will depress capex further. Other Considerations Chart 6No Offset From The Government
No Offset From The Government
No Offset From The Government
The problems of the private sector may be encapsulated in one indicator. After a surge that boosted GDP, the UK’s nonfinancial private sector’s credit impulse is rapidly contracting (Chart 6), which confirms that risks to activity are building. The public sector will not provide an offset. According to the IMF Fiscal Monitor’s projections, the UK’s fiscal thrust will equal -3.3% of GDP in 2022 and -1.4% in 2023, even after the small giveaways from Chancellor Rishi Sunak’s Spring Statement (Chart 6, bottom panel). Together, these developments confirm our view that UK GDP may also flirt with a recession in the coming 12 months. Bottom Line: The UK economy is facing potent headwinds and activity is set to contract over the coming quarters. Surging energy costs are hurting household consumption and businesses are cutting investment. This time around, government spending is unlikely to come to the rescue, at least not until further pain is inflicted on the UK’s private sector. The BoE expects output to contract in early 2023, with which we agree. Inflation: The Worst Of Both Worlds UK headline inflation is likely to move into double digits territory before year-end. Worrisomely, it will also be more stubborn than that of the Eurozone, because it goes beyond higher food and energy input costs. Essentially, the UK suffers from both the cost-push inflation plaguing the rest of Europe and the demand-pull inflation witnessed in the US. Chart 7Continued Pass-Through
Is UK Stagflation Priced In?
Is UK Stagflation Priced In?
The UK’s cost-push inflation will worsen in the second half of the year and could lift headline CPI above 10% by Q4 2022. Its main driver will be the Ofgem’s second energy cap increase scheduled for October, which is expected to increase household energy costs by 40%. Companies will also try to pass through a greater proportion of their rising costs to their consumers to protect their depleted margins. So far, the BoE’s Agents Survey reveals that on average, UK firms have passed through 80% of their non-labor input cost increases (Chart 7, top panel). In all the sectors surveyed, expected price increases are set to accelerate compared to the past 12 month and may even reach 14% in the manufacturing sector and 8% in the consumer goods sector (Chart 7, bottom panel). Demand-pull inflation is also present in the UK, unlike the rest of Europe, with core CPI at 5.7%, high service inflation, and rapidly rising wage growth. The key problem is an overheating labor market exacerbated by labor supply problems. By the end of 2021, the UK recorded 600 thousand inactive people more than before the pandemic, or individuals who are of working age but outside of the labor force and not seeking a job. This has compressed the labor participation rate to 63%, or the lowest level since the 2011-2012 period (Chart 8). So far, not even rapid wage gains have incentivized these persons to seek employment. The impact of Brexit further curtails the supply of labor. Since the pandemic began, the size of the working age population has decreased by 100 thousand as EU citizens have moved back home (Chart 8, second panel). Labor demand, however, is not weak. Job vacancies have surged to an all-time high of 1.3 million, or a ratio of one job vacancy per unemployed worker. Moreover, according to the BoE’s Agents Survey, the proportion of firms reporting recruitment difficulties is extremely elevated (Chart 8, third panel). As a result of weak labor supply but strong labor demand, wages are rising rapidly (Chart 8, bottom panel), with the KPMG/REC Indicator of pay higher than 6%. Chart 8Labor Market Tightness
Labor Market Tightness
Labor Market Tightness
Chart 9Poor Productivity Weighs On Trend GDP
Poor Productivity Weighs On Trend GDP
Poor Productivity Weighs On Trend GDP
Rapidly increasing wages and underlying inflation are indicative of a greater malaise. UK GDP is still 3.6% below its pre-COVID trend, while US GDP has already moved past its previous peak. Yet, wages and underlying inflation are just as strong in both economies. This suggests that the UK trend GDP has slowed more than in the US and that aggregate demand is colliding more rapidly with the constraint created by a weaker potential GDP. Labor supply is not the only culprit behind the slowdown in UK’s trend GDP. Since Brexit, UK capex has been particularly weak, which has depressed productivity growth and suppressed trend GDP further (Chart 9). Bottom Line: The BoE expects UK headline CPI inflation to move above 10% before the end of the year. We agree with this assessment. Cost-push inflation will remain strong in response to additional increases in regulated energy prices this fall and greater pass-through from businesses. Meanwhile, the labor market is overheated because of weak labor supply and surging job vacancies. The UK core inflation is likely to be sticky as Brexit weighs on the country’s trend GDP, which causes aggregate demand to surpass aggregate supply easily. Investment Implications The investment implications of the UK’s weak growth and strong inflation outlook are far reaching. Fixed Income Implications BCA’s Global Fixed Income Strategy service upgraded UK government bonds to overweight from underweight in their global fixed income portfolios. We heed this message and move to overweight UK Gilts relative to German Bunds within European fixed income portfolios. Chart 10The BoE's Dovish Justification
The BoE's Dovish Justification
The BoE's Dovish Justification
The BoE’s forecast calls for a deeply negative output gap as well as a rising rate of unemployment in 2023 and 2024. According to the BoE’s model, these dynamics will weigh on headline CPI next year (Chart 10). We take the BoE at its word when it communicated a gentler pace of rate hikes than was anticipated by the SONIA curve. The BoE believes that the weakness in the UK’s trend GDP growth weighs on the country’s neutral rate of interest. Thus, there is a limited scope before higher interest rates hurt economic activity. Since the BoE already foresees a poor growth outcome and weaker inflation next year, this view of the neutral rate logically results in a shallow path of interest rate increases. In other words, the BoE is not the Fed. This view prompts our fixed income colleagues to expect the SONIA curve to move toward the gentler rhythm of interest rate hikes proposed by the BoE. As a corollary, it implies that Gilt yields have more downside. More specifically, BCA sees room for UK-German yields spreads to narrow. Investors have expected the BoE to be significantly more hawkish than the European Central Bank (ECB), and a partial convergence in expected interest rate paths is likely. Moreover, UK yields have a higher beta than German ones. As a result, the current wave of risk aversion driven by global growth fears should cause an outperformance of UK government bonds compared to German ones. Currency Market Implications The outlook for GBP/USD depends on the evolution of overall market conditions. If risk assets remain under pressure, so will Cable. Chart 11Cable And EM Stocks
Cable And EM Stocks
Cable And EM Stocks
A durable bottom in GBP/USD will coincide with a rebound in EM equities (Chart 11). The correlation between these two assets most likely reflects the UK’s current account deficit of 2.8% of GDP in 2021. Large external financing needs render the currency very sensitive to global liquidity conditions and thus, to the dollar’s trend and global risk aversion, as is the case with EM assets. Peter Berezin, BCA Chief Global Strategist, expects global stocks to rebound in the near future, which will lift EM equities in the process. Interestingly, GBP/USD does not correlate with the relative performance of EM shares. Thus, a rebound in Cable does not contradict BCA’s Emerging Market Strategy service’s view that EM stocks are likely to underperform further in the coming months. Chart 12A Big Handicap For the GBP vs the EUR
A Big Handicap For the GBP vs the EUR
A Big Handicap For the GBP vs the EUR
BCA’s Foreign Exchange strategy team sees further upside in EUR/GBP, toward the 0.9 level. 2-year yield differentials between the UK and Germany are likely to narrow in response to the downgrade of the SONIA curve. Importantly, the wide UK current account deficit necessitates higher real interest rates to prop the pound against the euro because the Eurozone current account surplus stands at 2.3% of GDP. However, neither the 2-year nor 10-year real rates are higher in the UK than they are in the Euro Area (Chart 12). Additionally, even the nominal yield premium of UK bonds vanishes once they are hedged into euros. UK hedged 2-year bonds yield 50bps less than their German counterparts, and 10-year Gilts offer 80bps less than Bunds, which limits continental inflows into the UK. Equity Market Implications UK stocks are pro-cyclical, and their absolute performance will bottom in tandem with global equities. The near-term outlook for global equities remains clouded by the confluence of global growth fears, a weaker CNY, and tighter monetary policy around the world. Meanwhile, UK stocks are very cheap, trading at a forward P/E ratio of 11. They are tactically oversold and are lagging forward earnings (Chart 13). Relative to global equities, the performance of UK stocks will continue to track that of global energy firms compared to the broad market. The heavy exposure of UK large-cap indices to oil and gas stocks has been a major asset since energy shares have become market darlings (Chart 14). Chart 13UK Stocks Are Close To A Bottom
UK Stocks Are Close To A Bottom
UK Stocks Are Close To A Bottom
Chart 14UK Large-Caps Are About Oil
UK Large-Caps Are About Oil
UK Large-Caps Are About Oil
At the time of writing, Sweden and Finland have yet to officialize their membership application to NATO, but BCA’s Geopolitical Strategy team assigns a high probability to this outcome. Russia will not stand idly by, especially as the EU threatens to cut their oil imports. Consequently, a deeper energy embargo is increasingly likely, which should prompt a temporary but violent rally in oil and natural gas prices. This process should sustain a few more weeks of outperformance from UK large-cap shares relative to the rest of the world. Chart 15The UK vs The Eurozone: Cheap But Overbought
The UK vs The Eurozone: Cheap But Overbought
The UK vs The Eurozone: Cheap But Overbought
Structurally, UK equities are likely to remain well supported. A pullback in relative performance later this year is possible once oil prices ease off as BCA’s Commodity and Energy team expects. However, the oil market will stay tight for years to come because of the investment dearth observed since 2014-2015, when OPEC 2.0 started its market-share war. According to Bob Ryan, BCA’s Chief Commodity Strategist, it will take years of high returns in the sector to attract the capital needed to lift energy capex enough to line up supply with demand. Thus, energy remains a structurally favored sector, which will boost the cheap UK market’s appeal. UK stocks enjoy a structural tailwind relative to Euro Area shares. They remain cheap, because they still trade at a significant historical discount (Chart 15). Moreover, relative earnings are moving decisively in favor of UK stocks, something that is unlikely to change, even if the UK economy contracts. Ultimately, UK large-cap names derive the bulk of their profits from overseas and the structural tailwind of a secular commodity bull market will continue to assert itself on relative profits. Nevertheless, UK shares have also become extremely overbought, which raises the risk of a pullback in the second half of the 2022 (Chart 15, third and fourth panel). The recent outperformance of UK stocks relative to those of the Eurozone has been larger than what sectoral biases explain. An equal-sector weights version of the UK MSCI has outperformed a similarly constructed Euro Area index by 9.6% year-to-date. Chart 16Waiting For Catalysts To A Eurozone Rebound
Waiting For Catalysts To A Eurozone Rebound
Waiting For Catalysts To A Eurozone Rebound
A tactical rectification of the overbought conditions in the performance of UK equities relative to those of the Euro Area will require an ebbing of stagflation fears in the Euro Area (Chart 16, top panel). This implies that investors looking to buy Eurozone equities are waiting for a stabilization in the energy market (that is, waiting for clarity about Sweden’s and Finland’s NATO decision as well as Russia’s response). It also means that the Chinese economy must stabilize, since Eurozone equities are more sensitive to the evolution of the Chinese credit impulse than UK ones (Chart 16, second panel). Nonetheless, BCA’s Global Fixed Income Strategy team’s view on UK-German spreads is consistent with an eventual tactical pull back in the relative performance of UK stocks vis-à-vis Euro Area ones (Chart 16, bottom panel). Two pair trades make attractive vehicles to bet on an underperformance of UK stocks relative to those of the Euro Area in the second half of 2022. The first one is to sell UK financials at the expense of Euro Area financials. Historically, a decline in UK Gilt yields relative to their German equivalent strongly correlates with an underperformance of UK financials (Chart 17). The second one is to sell UK healthcare names relative to those in the Eurozone. The relative performance of healthcare shares has greatly outpaced relative earnings and is now hitting a critical resistance level (Chart 18). Moreover, UK healthcare firms are exceptionally overbought relative to their Euro Area competitors. Importantly, those two trades display little correlation to the broad market trend. Chart 17Challenges To UK Financials
Challenges To UK Financials
Challenges To UK Financials
Chart 18UK Healthcare: Running Ahead Of Itself
UK Healthcare: Running Ahead Of Itself
UK Healthcare: Running Ahead Of Itself
Finally, UK small-cap stocks are becoming attractive relative to their large-cap counterparts, although the timing remains risky. Unlike the internationally focused large-cap indices, small-cap shares are a direct bet on the health of the UK domestic economy. Hence, small- and mid-cap names have massively underperformed the FTSE-100 as market participants sniffed out the poor outlook for UK economic activity (Chart 19). They are now extremely oversold relative to large-cap names and their overvaluation has been corrected. The main problem with small-cap shares is the lack of a catalyst to rectify their oversold conditions. The most likely candidate for such a reversal would be a peak in energy inflation, considering it stands at the crux of the headwinds that UK consumption and growth face. However, energy CPI will not peak until later this fall and thus, the pain on UK households will build until then. As a result, wait for a clear sign that energy inflation recedes before entering a long UK small-cap / short UK large-cap contrarian trade (Chart 20). Chart 19Bombed Out Small-Caps...
Bombed Out Small-Caps...
Bombed Out Small-Caps...
Chart 20…Need A Peak In Energy Inflation
...Need A Peak In Energy Inflation
...Need A Peak In Energy Inflation
Bottom Line: In line with our expectations that UK growth will worsen significantly in the quarters ahead, we follow the BCA Global Fixed Income team and move to overweight UK government bonds within European fixed income portfolios. While we expect GBP/USD will bottom once global risk assets find a floor, BCA’s Foreign Exchange Strategy team also anticipates Sterling to depreciate further relative to the euro. Because of their large energy and materials exposure, UK large-cap equities will enjoy a structural outperformance relative to Euro Area large-cap indices on the back of a secular bull market in commodities. However, a temporary pullback in the UK’s relative performance is likely in the second half of 2022. Selling UK financials and UK healthcare stocks relative to their Eurozone counterparts offers a compelling approach to implement this view. Finally, UK small-caps are oversold relative to large-caps, but we recommend investors wait until energy CPI peaks when a relative rebound may emerge. Mathieu Savary, Chief European Strategist Mathieu@bcaresearch.com Tactical Recommendations Cyclical Recommendations Structural Recommendations
Listen to a short summary of this report. Executive Summary The Dollar Likes Volatility
The Dollar Likes Volatility
The Dollar Likes Volatility
Uncertainty about Fed policy has supercharged volatility in bond markets, and correspondingly, USD demand (Feature chart). A well-telegraphed path of interest rates will deflate the volatility “bubble” in Treasury markets and erode the USD safety premium. The dollar has also already priced in a very aggressive path for US interest rates. The onus is on the Fed to deliver on these expectations. Our theme of playing central bank convergence – by fading excessive hawkishness or dovishness by any one central bank – continues to play out. Our latest candidate: short EUR/JPY. The Russia-Ukraine conflict, and ensuing volatility in oil markets, is providing some trading opportunities. One of those is that “good” oil will continue to trade at a premium to “bad” oil. Go long a basket of CAD and NOK versus the RUB. TRADES* INITIATION DATE INCEPTION LEVEL TARGET RATE STOP LOSS PERCENT RETURNS SPOT CARRY** TOTAL Short DXY 2022-05-12 104.8 95 107 Short EUR/JPY 2022-05-12 133.278 120 137 Bottom Line: We recommended shorting the DXY index on April 8th at 102, with a tight stop at 104. That stop-loss was triggered this week. We are reinitiating this trade this week at 104.8, in line with our cyclical view that the dollar faces downside on a 12–18 month horizon. Multiple factors tend to drive the dollar: Real interest rate differentials, growth divergences, portfolio flows into both public and private capital markets, or even safe-haven demand. Across both developed and emerging market currency pairs, the dollar has been strong (Chart 1), but what has been the key driver of these inflows? For most of this year, interest rate differentials have played a key role in pushing the dollar higher. That said, they have not been the complete story. Chart 2 shows that the dollar has very much overshot market expectations of Fed interest rate policy, relative to other central banks. That premium has been around 8%-10% in the DXY index. In real terms, the overshoot has been even higher. Chart 1The Dollar Has Been King
Month In-Review: A Hefty Safe-Haven Premium In The Dollar
Month In-Review: A Hefty Safe-Haven Premium In The Dollar
Chart 2The Fed And The Dollar
The Fed And The Dollar
The Fed And The Dollar
Chart 3The Dollar Likes Volatility
The Dollar Likes Volatility
The Dollar Likes Volatility
A key source of this safe-haven premium has been rising volatility, specifically in the bond market. For most of the last two years, the dollar has tracked the MOVE index, a volatility measure of US Treasurys (Chart 3). Uncertainty about the path of US interest rates, and the corresponding rise in dollar hedging costs, have ushered in a wave of “naked” foreign buyers – owning USTs without a corresponding dollar hedge. Foreign purchases of US Treasurys are surging. Speculators have also expressed bearish bets on the euro, yen, and even sterling via the dollar. There is a case to be made that some of these bullish dollar bets will be unwound in the next few months, even if marginally. For example, the market expects rates to be 248 bps and 313 bps higher in the US by year end, respectively, compared to the euro area and Japan (Chart 4). This might be exaggerated. The real GDP growth and inflation differential between the eurozone and the US is 0.1% and 0.8%, respectively, for 2022. The difference in the neutral rate could be as low as 1.25%. This suggests that a simplified Taylor-rule framework will prescribe a policy rate differential of only 1.7% (1.25 + 0.5(0.8+0.1)). In a global growth slowdown, US inflation will come in much lower, which will allow the Fed to ratchet back interest rate expectations. Should growth accelerate, however, then growth differentials between open economies and the US will widen, narrowing the policy divergence we have been experiencing. The safe-haven premium in the dollar has also been visible in the equity market. One striking feature of the correction has been the inability for US equities to outperform, as they usually do, during a market riot point. The carnage in technology stocks has been absolute, and the tech-heavy US equity market continues to struggle against its global peers. As such, there has been a break in the historically strong relationship between the dollar and the outperformance of the US equity market (Chart 5). Chart 4Pricing In The Euro And Yen In Line With Rates
Pricing In The Euro And Yen In Line With Rates
Pricing In The Euro And Yen In Line With Rates
Chart 5The Dollar Has Overshot The Relative Performance Of US Equities
The Dollar Has Overshot The Relative Performance Of US Equities
The Dollar Has Overshot The Relative Performance Of US Equities
As US equity markets were surging throughout 2021, investors started accumulating dollars as a hedge against equity market capitulation, which explained the tight correlation between the put/call ratio and the USD (Chart 6). As the carry on the dollar has risen, and puts have become more expensive, our suspicion is that the greenback has become a preferred hedge. Chart 6Dollar Hedges Against A Drawdown In The S&P
Dollar Hedges Against A Drawdown In The S&P
Dollar Hedges Against A Drawdown In The S&P
As we have highlighted in past reports, the dollar continues to face a tug of war. Higher interest rates undermine the US equity market leadership, while lower rates will reverse the record high speculative positioning in the dollar. Given recent market action, the path of US bond yields will be critical for the dollar outlook. Cresting inflation could pressure bond yields lower. As a strategy, we recommended shorting the DXY index on April 8th at 102, with a tight stop 104. That stop-loss was triggered this week. We are reinitiating this trade at 104.8, in line with our cyclical view that the dollar faces downside on a 12–18-month horizon. As usual, this week’s Month In Review report goes over our take on the latest G10 data releases and the implications for currency strategy both in the near term and longer term. Chester Ntonifor Foreign Exchange Strategist chestern@bcaresearch.com US Dollar: Inflation Will Be Key Chart 7How Sustainable Is The Breakout?
How Sustainable Is The Breakout
How Sustainable Is The Breakout
The dollar DXY index is up 9% year-to-date, hitting multi-year highs (panel 1). The Fed increased interest rates by 50bps this month. In our view, the Fed will continue to calibrate monetary policy based on data, and the key releases continue to surprise to the upside. Headline CPI came in at 8.3% in April, while the core measure was at 6.2%. Both were higher than expected. Importantly, the month-on-month rate for core was 0.6%, much higher than a run rate of 0.2% that will be consistent with the Fed’s target of inflation (panel 2). It is important to note that used car prices have had an important contribution to US CPI. Airfares had an abnormally large contribution to US CPI for the month of April. As these prices crest, along with other supply-driven costs, inflation could meaningfully roll over in the coming months (panel 3). The job’s report was robust, but there was disappointment in the participation rate that fell from 62.4% to 62.2%. This suggests there might be more labor slack in the US than a 3.6% unemployment rate suggests. Wages continue to inflect higher. The Atlanta Fed Wage Growth Tracker currently sits at 6% (panel 4). These developments continue to underpin market expectations for aggressive interest rate increases. The market now expects the Fed to raise rates to 2.5% by December 2022. Speculators are also very long the dollar. Three factors could unhinge market expectations. First, inflation could come crashing back down to earth which will unwind some of the rate hikes priced in the very near term. That would hurt the dollar. Second, growth could pick up outside the US, especially in economies with lots of pent-up demand like Japan. Third, financial conditions could ease, which will help revive animal spirits. In conclusion, our 3-month view on the dollar remains neutral, but our 12-18-month assessment is to sell the dollar. We are reinitiating our short DXY position today with a stop-loss at 106. Euro: A Recession Is Priced Chart 8Go Short EUR/JPY
Go Short EUR/JPY
Go Short EUR/JPY
The euro has broken below 1.05 and the whisper circulating in markets is that parity is within striking distance. EUR/USD is down 8.7% year-to-date. We have avoided trading the euro against the dollar and have mostly focused on the crosses – long EUR/GBP, and this week, we are selling EUR/JPY. The euro is in a perfect tug of war: Rising inflation is threatening the credibility of the ECB while there is the risk of slowing growth tipping the euro area into a recession. In our view, the euro has already priced in the latter, much more than potentially higher rates in the eurozone. The ZEW sentiment index, a gauge of European growth prospects, is at COVID-19 lows, along with EUR/USD (panel 1). My colleague, Mathieu Savary, constructed a stagflation index for Europe which perfectly encapsulates the ECB’s quandary. A growing cohort of ECB members are supporting a July rate hike. On the surface, the ECB has the lowest rate in the G10 (outside of Switzerland). With HICP inflation at 7.5% (panel 2), emergency monetary settings are no longer required. A “least regrets” approach suggests gently nudging rates higher to address inflationary pressures. House prices in Germany and Italy are rising at their fastest pace in over a decade, much more than wage inflation (panel 3). The key for the ECB will be to telegraph that policy remains extremely accommodative. It is hard to envision that hiking rates from -0.5% to -0.25% will trigger a European recession, but the ECB will need to balance that outcome with the possibility that inflation crests and real rates rise in Europe. In our trading books, we are long EUR/GBP as a play on policy convergence between the ECB and the BoE. This week, we are playing the same theme via shorting EUR/JPY. In a risk-off environment, EUR/JPY should fall. In an economic boom, the cross has already priced in a stronger euro, relative to the yen (panel 4). We are neutral on the euro over a 3-month horizon but are buyers over 12-18 months. Japanese Yen: A Mean-Reversion Play Chart 9A Capitulation In The Yen?
A Capitulation In The Yen?
A Capitulation In The Yen?
The Japanese yen is down 10.5% year-to-date, one of the worst performing G10 currency this year. In retrospect, a chart formation since 1990 suggests that we witnessed a classic liquidation phase that could only be arrested by an exhaustion in selling pressure, or a shift in fundamentals (panel 1). The two key drivers of yen weakness are the rise in US yields (panel 2) and the higher cost of energy imports. As today’s price move suggests, any reversal in these key variables will lead to a selloff in USD/JPY – falling bond yields and/or lower energy prices. We have been timidly long the yen, via a short CHF position. Today we are introducing a short EUR/JPY trade as well. What has been remarkable in the last month is the improvement in Japanese economic fundamentals, as the country slowly emergences from the latest COVID-19 wave: Both the outlook and current situation components of the Eco Watchers Survey improved in April. This is a survey of small and medium-sized businesses, very sensitive to domestic conditions. PMIs in Japan are improving on both the manufacturing and service fronts. The Tokyo CPI surprised to the upside, with the headline figure at 2.5%. Historically, the earlier release of the Tokyo CPI has been a reliable gauge for nationwide inflation. Importantly, the release was much below BoJ forecasts. Inflation in Japan could surprise to the upside (panel 3). Employment numbers remain robust. The unemployment rate fell to 2.6% in March, and the jobs-to-applicants ratio rose to 1.22. The Bank of Japan has stayed dovish, reinforcing yield curve control in its April 27 meeting, with strong forward guidance. That said, the BoJ will have no choice but to pivot if inflationary pressures prove stronger than they anticipate, and/or the output gap in Japan closes much faster as demand recovers. Related Report Foreign Exchange StrategyWhat To Do About The Yen? We were stopped out of our short USD/JPY position at 128. In retrospect, USD/JPY rallied above 131 and is finally falling back down to earth. We are already in the money on our short CHF/JPY position, from our last in-depth report on the yen. This week, we recommend shorting EUR/JPY. British Pound: A Volte-Face By The BoE Chart 10The Pound Is Being Traded As High Beta
The Pound Is Being Traded As High Beta
The Pound Is Being Traded As High Beta
The pound is down 9.8% year-to-date. While the Bank of England raised rates to 1% this month, they also expect the economy to temporarily dip into recession this year. This week’s disappointing GDP release confirmed the BoE’s fears. In short, pricing in the SONIA curve for BoE rate hikes remains aggressive. The Bank of England has been one of the more proactive central banks, yet the currency has been performing akin to an inflation crisis in emerging markets (panel 1). Inflation continues to soar in the UK with headline CPI now at 6.2% (panel 2). According to the BoE’s projections, inflation will rise to around 10% this year before peaking, well above previous forecasts of 8%. Together with tighter fiscal policy, the combination will be a hit to consumer sentiment. While the BOE must contain inflationary pressures (in accordance with their mandate), the risks of a policy mistake have risen, akin to the eurozone. Labor market conditions appear tight on the surface (panel 3), but our prognosis is that the UK needs less labor regulation, especially towards areas in the economy where labor shortages are acute and are pressuring wages higher. That is unlikely to change in the near term. As such, the current stance of tight monetary and fiscal policy will stomp out any budding economic green shoots. We are currently short sterling, via a long EUR position. In our view, the EUR/GBP cross still heavily underprices the risks to the UK economy in the near term. Given that the pound is very sensitive to global financial conditions (panel 1), it could rebound if recession fears ease, but our suspicion is that it will still underperform the euro. Canadian Dollar: The BoC Will Stay Hawkish Chart 11The CAD Will Stay Resilient
The CAD Will Stay Resilient
The CAD Will Stay Resilient
The CAD is down 3% year-to-date. The key driver of the CAD remains the outlook for monetary policy and the path of energy prices (panel 1). In the near term, oil prices will stay volatile, but the CAD has not priced in the fact that the BoC is matching the Fed during this interest rate cycle, and/or the rise in energy prices. Together with the NOK, we are going long the CAD versus the RUB today. As we expected, the Bank of Canada raised interest rates by 50bps to 1% at the April 13 meeting. Since then, all the measures the BoC looks at to calibrate monetary policy are continuing to suggest more tightening in monetary policy. Both headline and core inflation came in strong, with headline inflation at 6.7% in March. The common, trim, and median inflation prints were at 2.8%, 4.7%, and 3.8%, respectively, well above the BoC’s target. This continues to suggest inflationary pressures in Canada are broad- based (panel 2). The employment report in April disappointed market consensus, but employment in Canada is back above pre-pandemic levels, and the unemployment rate fell to 5.2%, close to estimates of NAIRU. This suggests the BoC’s path for monetary policy will not be altered (panel 3). House price inflation seems to be moderating across many cities, which argues that monetary policy is having the intended effect, but price increases remain well above nominal income growth (panel 4). Speculators are slightly long the CAD, a risky stance over the next three months. That said, we are buyers of CAD over a 12-to-18-month horizon. New Zealand Dollar: Positive Catalysts, But Fairly Valued Chart 12Real NZ Rates Need To Stabilize
Real NZ Rates Need To Stabilize
Real NZ Rates Need To Stabilize
The NZD is down 8.7% year-to-date. The RBNZ remains the most hawkish central bank in the G10. They further raised interest rates to 1.5% on April 13. Given a strict mandate on inflation, together with house price considerations, long bond yields have accepted that the RBNZ will be steadfast in tightening policy and hit 3.8% this month. This will help stabilize real yields are rising (panel 1). Underlying data suggests that the “least regrets” approach by the RBNZ makes sense – in a nutshell, tighten policy as fast as economically possible, to get ahead of the inflation curve. CPI continues to accelerate, hitting 6.9% year-on-year in Q1, from 5.9% the previous quarter (panel 2). House price inflation is rolling over from very elevated levels (panel 3). This suggests that monetary policy is having the intended effect of dampening demand. A weak NZD could sustain imported inflation, but a hawkish central bank cushions this risk. The RBNZ is forecasting a 2.8% overnight rate for June 2023. The OIS curve suggests that market expectations are much higher. This fits with our view that the market had been overpricing higher interest rates in New Zealand, especially relative to other countries. We already took profits on our long AUD/NZD trade and continue to expect the NZD to underperform at the crosses, even if it rises versus the dollar. Australian Dollar: Our Top Pick Against The Dollar Chart 13The AUD Has A Terms Of Trade Tailwind
The AUD Has A Terms Of Trade Tailwind
The AUD Has A Terms Of Trade Tailwind
The Australian dollar is down 5.5% year-to-date. The Reserve Bank of Australia raised interest rates by 15bps on its May 3rd meeting, in line with the hawkish tone telegraphed at the prior meeting. The two critical measures that the RBA is focusing on, inflation and wages, have been improving. That said, we had expected the RBA to wait for fresh wage data, out next week, before calibrating monetary policy. The key point is that emergency monetary settings are no longer required in Australia. Home prices remain robust, the unemployment rate has fallen to a cycle low of 4% in and inflationary pressures remain persistent. Headline CPI was at 5.1% year-on-year in Q1. The trimmed-mean and weighted- median CPI print came in at 3.7% and 3.2%, respectively, above the upper bound of the RBA’s 2%-3% target range. The external environment is one area of concern for the AUD. The trade balance continues to soar, but China’s zero COVID-19 policy is a risk to Australian exports. On the flip side, many speculators are now short the Aussie, which is bullish from a contrarian perspective. We are long the AUD as of 72 cents, expecting this trade to be volatile in the near term, but to pay off over a longer horizon. Swiss Franc: The Yen Is A Better Hedge Chart 14Swiss Inflation Will Fall
Swiss Inflation Will Fall
Swiss Inflation Will Fall
Year-to-date, CHF is down 9% against USD and flat against the EUR. The Swiss economy continues to perform well and remains relatively insulated from the inflation dynamics taking place in the rest of the G10. In April, headline CPI inched higher to 2.5% and core CPI to 1.5% year-over-year (panel 2), while the unemployment rate was down to 2.3%. The KOF indicator was also above expectations at 101.7. At 62.5, the manufacturing PMI is still well in the expansionary zone. In other data, retail sales were up 0.8% month-on-month in March and the trade surplus was down to CHF 1.8bn, likely due to the elevated exchange rate versus the euro. Since then, the franc has given up all its gains against the euro. Several SNB board members have recently spoken about the beneficial role of a strong franc in helping to control inflation (panel 4). That said, it is unclear whether the SNB, known for rampant currency interventions, will be as welcoming to a highly valued franc should inflation roll over. Switzerland’s trade surplus as a share of GDP has been persistently increasing since the early 2000s. An expensive currency would not be positive for economic growth. In fact, SNB sight deposits, have been on the rise recently. Last week, these deposits posted the largest one-week increase in two years. In a world where inflation starts to roll over, the SNB will be more dovish. In this environment, EUR/CHF can see more upside. Norwegian Krone: Bullish On A 12-to-18 Month Horizon Chart 15NOK Has Upside
Month In-Review: A Hefty Safe-Haven Premium In The Dollar
Month In-Review: A Hefty Safe-Haven Premium In The Dollar
The NOK is down 10.7% against the USD this year. This is a remarkable development amidst higher real rates in Norway (panel 1). The Norges Bank is one of the most predictable central banks. It is set to deliver quarterly 25bps hikes through the end of 2023 to a total of 2.5%. In April, headline CPI rose 5.4% and the measure excluding energy was up 2.6% (panel 2). Although slightly above the latest projections, these figures are unlikely to make the bank deviate from its projected rate path. Economic activity is recovering steadily since the removal of pandemic-related restrictions in February. Household consumption and retail sales grew 4.3% and 3.3% month-over-month, respectively, in March. The manufacturing PMI broke above the 60 level in April, while industrial production was up 2.2% on the month in March. Registered unemployment fell under 2% in April, below pre-pandemic levels. This is helping boost wages (panel 3). Norway’s trade balance continued to break all-time highs with a NOK 138bn surplus in March. Elevated energy prices and the transition away from Russian energy should be a significant tailwind for the Norwegian economy. Oil companies planned to increase investment even before the invasion, and recent developments will likely induce more capex. NOK has significantly underperformed in the last month largely due to broad risk-off sentiment. Once markets stabilize, the krone should strengthen over the next 12–18 months. Given the relatively “safer” nature of Norwegian oil, we are initiating a long NOK/RUB trade today, along with a long CAD leg. Swedish Krona: Into A Capitulation Phase Chart 16SEK Has Upside
SEK Has Upside
SEK Has Upside
The SEK is down 10.8% versus the dollar this year. In a major policy U-turn, the Riksbank raised rates by 25bps during its last meeting, after inflation came in above expectations at 6.1% on the year in March. The Bank also announced a faster pace of balance-sheet reduction, as well as expecting two-to-three more hikes before the end of the year. Just like the euro area, Sweden is within firing range of tensions between Russia and Ukraine (panel 1). Swedish GDP contracted 0.4% from the previous quarter. Global uncertainty and rising prices are weighing on consumer confidence, reflected in subdued retail sales and household consumption in March. The manufacturing PMI remains robust at 55 but is falling quite rapidly, as are real rates (panel 2). As a small open economy, Sweden needs external demand to recover. On a positive note, orders remain very strong and an easing of lockdowns in China should contribute to growth in manufacturing and goods exports later this year. It is also encouraging that Sweden’s trade surplus rose to 4.7bn SEK in March. The krona remains vulnerable to both a growth contraction in Europe as well as geopolitical risk, especially as Finland might join NATO, sparring retaliation from Russia. That said, the negative news is likely already priced in. SEK should benefit from growth normalization and a pick-up in the Chinese credit impulse in the second half of the year. As a way to benefit from this dynamic, we are short CHF/SEK, but short USD/SEK positions will be warranted later this year. Chester Ntonifor Foreign Exchange Strategist chestern@bcaresearch.com Artem Sakhbiev Research Associate artem.sakhbiev@bcaresearch.com Footnotes Strategic View Cyclical Holdings (6-18 months) Tactical Holdings (0-6 months) Limit Orders Forecast Summary
Executive Summary The surge in food prices following Russia's invasion of Ukraine will drive EM headline inflation higher, given more of individuals' incomes in these economies are spent on food. Economies in the MENA will remain at risk for higher food prices, given their reliance on wheat imports from Ukraine and Russia, which together comprise ~ 30% of global wheat exports. Wheat is the most widely traded grain in the world; its production is second only to that of corn. Higher shipping and input costs – especially for fertilizers – will exacerbate the upside price pressure on grains, particularly wheat. Tenuous social contracts raise the risk of social unrest in MENA reminiscent of the Arab Spring unrest of 2011, which was fueled by food scarcity, economic stagnation and popular anger at autocratic governments. A strong USD will continue to raise the local-currency cost of grains and food, which also will fuel EM inflation. The War Increased Food Prices…
High Food Prices Drive EM Inflation
High Food Prices Drive EM Inflation
Bottom Line: Wheat prices will remain volatile with a bias to the upside for as long as the Russia-Ukraine war persists. The uncertain evolution of this war means EM states will be more exposed to grain-price volatility and higher inflation. This could prove to be destabilizing to MENA states in particular. Separately, we update our recommendations below. Feature High food prices will drive EM headline inflation, owing to the fact a higher proportion of individuals’ incomes in these economies are spent on food. These pressures are particularly acute for wheat following Russia's invasion of Ukraine. Related Report Commodity & Energy StrategyCopper Demand Will Ignore Recession Wheat is the most widely traded grain in the world, according to the World Population Review (WPR).1 In terms of global production, it is second only to corn, totaling 760mm tons in 2020. In order, the top three wheat producers in the world are China, India, and Russia, which account for 41% of global output. The US is the fourth-largest producer. The WPR notes that if the EU were to be counted as a single country, its wheat production would be second only to China (Chart 1). Within emerging markets, the Middle East and North African (MENA) nations will be worst hit by rising wheat prices.2 This is because the bulk of their wheat imports are sourced from Russia and Ukraine, and shipped from Black Sea ports, which are literally caught in the crosshairs of the Russia-Ukraine war. Many of these states do not have sufficient grain reserves to tide themselves over this crisis, and will be forced to import food at elevated prices. A strong USD, which this past week hit a 19-year high, will add to the price of USD-denominated commodity imports, particularly wheat. Russia’s invasion of Ukraine will continue to exacerbate EM food scarcity and drive input costs – e.g., fertilizers – and shipping rates higher. This will keep food and wheat prices volatile with a strong bias to the upside (Chart 2). Chart 1Wheat Production Faces Concentration Risk
High Food Prices Drive EM Inflation
High Food Prices Drive EM Inflation
Chart 2The War Increased Food Prices…
High Food Prices Drive EM Inflation
High Food Prices Drive EM Inflation
In addition to the inflation risk from high food and energy prices, the tenuous social contracts in many states again raises the risk of social unrest in MENA, as occurred in the 2011 Arab Spring protests against food scarcity, economic stagnation and autocratic government.3 War Disruptions Will Continue Russia’s invasion of Ukraine jeopardized wheat supply from two countries which together constitute nearly 30% of total global wheat exports. The invasion will continue to keep wheat prices volatile and biased to the upside (Chart 3). The UN Food and Agriculture Organization (FAO) forecasts Ukraine’s 2021/22 wheat output will drop below its 5-year average, since at least 20% of total arable land cannot be used due to the war. While nearly 60% lower than this time last year, Ukrainian wheat exports in March were not completely shut down. However, they were re-routed around the direct routes from the Black Sea.4 In March, Ukraine managed to export 309k tons of wheat. Chart 3...Particularly Wheat
...Particularly Wheat
...Particularly Wheat
Ukraine will need to rely on these convoluted routes until port services are either restored or unblocked. Exports through more circuitous routes will delay distribution and increase transport costs. This, of course, also adds to the delivered cost of wheat that is being rerouted and slows the overall distribution of grains globally. Additionally, Ukrainian exports via other countries will be disrupted by those countries’ own trade slowdowns, since global bottlenecks affects all trade. Thus far, Russia has been able to maintain wheat exports. Russia continued to supply wheat to global markets in March and April. The USDA estimates that during the 2021/22 crop year, which ends in June, Russian wheat exports will total 33mm tons, which is just 2mm tons lower than the USDA's pre-crisis estimate.5 Because of high carryover stocks and record production, Russia's exports in the 2022/23 crop year are expected to be more than 40mm tons. Sourcing Alternative Wheat Supplies With a sizable portion of global wheat supply at risk – primarily from Ukraine – other exporting countries will need to increase output to fill this gap (Chart 4). This production, however, is not guaranteed, as it depends primarily on weather and fertilizer prices. New trade routes will also need to be created. This will tax existing export infrastructures as shipping dynamics are reconfigured. Particularly important will be how far the new-found sources of supply have to travel to deliver grain, shipping availability, and, of course, the incremental costs incurred to move supplies. As of 2021, the EU – the Black Sea states’ principle competitor in the wheat-export market – and 48% of total wheat exports to Middle East and African countries (Chart 5). The EU's ability to increase exports for the remainder of the 2021/22 crop year will depend on its production, since demand for exports will be guaranteed given the crisis in the Black Sea. Chart 4Other Exporters Will Need To Ramp Up
High Food Prices Drive EM Inflation
High Food Prices Drive EM Inflation
Chart 5MENA Is EU’s Primary Wheat Export Market
High Food Prices Drive EM Inflation
High Food Prices Drive EM Inflation
The European Commission expects the EU to export a record 40mm tons of wheat for the 2022/23 market year, 6mm tons higher than its expected 2021/22 exports. Based on past trade patterns, these excesses will go to the Middle East, Northern and Sub-Saharan Africa. Strong USD Favors LatAm Exports US wheat exports will not be competitive this year or next, given the strong USD and relatively high prices (Chart 6). Additionally, this year’s winter-wheat crop will be affected by current drought conditions in the key Hard Red Winter wheat growing regions of Western Kansas, Colorado, Oklahoma and Texas. Canada faces a similar issue to its North American neighbor. Compared to other major wheat exporting states, it exports wheat at the second highest price, after the US. Furthermore, in 2021/22 Canadian wheat output is expected to be the lowest in 14 years following a warm and dry summer. The USDA expects strong Argentinian and Brazilian wheat exports in 2021/22. Compared to exports from the EU, US, Australia and Canada, wheat from these two sources is cheaper and hence will attract price sensitive bids from the Middle East and Africa. Chart 6US Wheat Remains Non-Competitive
US Wheat Remains Non-Competitive
US Wheat Remains Non-Competitive
A strong USD will incentivize the LatAm giants’ wheat exports since their input costs are in local-currency terms and their revenues are in USD. While some countries have taken advantage of high wheat and food prices to increase exports, others have imposed restrictions or outright bans on exports, which will continue to drive prices higher. Kazakhstan, which constitutes nearly 5% of global wheat exports, now has a quota on such exports, which will affect Central Asian import markets. India was expected to constitute an uncharacteristically large share of wheat exports this year and next. However, the country is experiencing its hottest March in 122 years, which most likely will reduce its harvest this year and incentivize it to keep wheat stocks at home. The world’s second largest wheat producing and consuming nation expects a 6% drop in production this year.6 Fertilizer Costs Will Remain High … Countries’ abilities to increase production will depend on fertilizer availability and costs. The USDA cited high fertilizer prices as one of the causes for lower expected Australian wheat output in 2022/23. Prices of natural gas – the primary feedstock for fertilizers – took off like a rocket following Russia's invasion of Ukraine. High natgas prices feed directly into fertilizer costs (Chart 7). The EU's proposal to ban Russian oil imports could see Russia embargo natgas supply in retaliation, which would further spike natgas and fertilizer costs. This will have knock-on effects on all ags markets. Fertilizer export bans announced by Russia and China are another factor driving fertilizer prices higher (Chart 8). High fertilizer costs most likely will dissuade farmers from using fertilizers in volumes associated with more normal market conditions, and likely will cause them to wait on planting and treating acreage, which will lower crop quality or delay planting. Both scenarios will lead to higher crop prices (Chart 9). Chart 7High Natgas Prices Feeds Right Into Fertilizers
High Natgas Prices Feeds Right Into Fertilizers
High Natgas Prices Feeds Right Into Fertilizers
Chart 8Russia, China Are Big Fertilizer Exporters
High Food Prices Drive EM Inflation
High Food Prices Drive EM Inflation
Chart 9Nitrogen Fertilizer Prices Continue To Rise
Nitrogen Fertilizer Prices Continue To Rise
Nitrogen Fertilizer Prices Continue To Rise
…As Do Shipping Costs Redrawing trade routes – i.e., finding new supplies and new shippers to compensate for the loss of Ukrainian wheat exports – will be expensive. For example, US grain shipping costs soared to an 8-year high after countries, led by China, dramatically increased soybean imports from the US due to a drought in Brazil.7 In 2021, high shipping costs led directly to higher food prices (Chart 10).8 Shipping, like any other commodity, is a function of supply and demand for different types of vessels capable of carrying grain from one part of the world to another. On the supply-side, port closures in China and the Black Sea are increasing port congestion, and making ships available for moving grains scarce. The Ukraine war has stranded ships in the Black Sea and forced merchants to re-route their shipments. This increases sailing times, which has the effect of contributing to supply scarcity in shipping markets. Fewer available ships, coupled with high fuel prices are keeping freight rates elevated. A low orderbook of expected new-vessel additions to the global shipping fleet in 2022 and 2023, along with guidance for ships to reduce speeds to increase fuel efficiency, will exacerbate current ship supply scarcity.9 On the demand side, the major international economic organizations have reduced 2022 GDP estimates due to lower economic activity. Lower economic activity will translate into lower ship demand and hence reduce prices (Chart 11). Chart 10Shipping Prices Remain Elevated
Shipping Prices Remain Elevated
Shipping Prices Remain Elevated
Chart 11Shipping Demand Driven By Economic Activity
Shipping Demand Driven By Economic Activity
Shipping Demand Driven By Economic Activity
Shipping prices will drop meaningfully once port congestion clears. This will depend on the duration of COVID-19 in China and the evolution of the Russia-Ukraine war. A recession – the probability of which will increase if the EU bans Russian oil imports and Russia retaliates with its own natgas ban – acts as a downside risk to shipping costs. Investment Implications The gap in Black Sea wheat exports produced by the Russia-Ukraine war will require a ramp-up in other countries’ supply. Higher production is contingent on weather conditions and input costs. Changing weather patterns, due to climate change, will increase food insecurity, and make it more difficult to predict how ag markets – particularly grain trading – will handle this shock and other shocks down the road. We remain neutral agricultural commodities but will follow wheat and food market developments closely. Ashwin Shyam Research Analyst Commodity & Energy Strategy ashwin.shyam@bcaresearch.com Paula Struk Research Associate Commodity & Energy Strategy paula.struk@bcaresearch.com Robert P. Ryan Chief Commodity & Energy Strategist rryan@bcaresearch.com Commodity Round-Up Energy: Bullish Going into the Northern Hemisphere's summer driving season, US retail gasoline prices are trading at record levels -- $4.328/gal ($181.78/bbl) as of 9 May 2022, according to the US Energy Information Administration (Chart 12). Regular gasoline (RBOB specification traded on the NYMEX) for delivery in the NY Harbor settled at $144.27/bbl ($3.4349/gal) on Tuesday, giving refiners a rough wholesale margin (versus Brent crude oil) of $41.81/bbl. Retail diesel fuel prices also have been extremely well bid, posting record highs as well of $5.623/gal ($236.17/bbl) on 9 May 2022 (Chart 13). On the NYMEX, the ultra-low sulfur diesel fuel contract for July delivery settled at $3.6793/gal ($154.53/bbl). Jet fuel prices also are extremely well bid, as demand increases against a backdrop of lower refinery output pushed NY Harbor prices to $7.61/gal ($319.62/bbl) on 4 April 2022. NY Harbor jet-fuel prices have been much stronger than US Gulf prices and European prices seen in the Amsterdam-Rotterdam-Antwerp (ARA) markets, which were averaging ~ $3.60/gal, according to the EIA. This is accounted for by robust demand – evident since mid-2021, when it recovered pandemic-induced losses – and lower-than-normal output of jet by refiners. Assuming the US does not go into a profound recession, refined-product markets likely will remain tight during the summer-driving season and into the rest of this year, in our estimation. As is the case with the Exploration & Production companies, refiners also have been parsimonious with their capex, which translates into lower capacity to meet demand. Base Metals: Bullish Per the latest US CFTC data, we believe hedge funds and speculators investing in copper are dismissing bullish micro fundamentals and are focusing on bearish macroeconomic factors, such as the probability of an economic slow down increases. This would explain why funds’ short positions have exceeded long positions for the first time since end-May 2020. We have written about medium-to-long-term bullish micro fundamentals at length in previous reports.10 On micro fundamentals, the Chilean constitutional assembly passed articles expanding environmental protection from mining over the weekend. These will be added to the draft constitution to be voted on in September. The article expanding state control in Chilean mining activity did not pass and will be renegotiated before being sent back to the constitutional assembly for a second vote. Uncertain governance will affect mining investment in the state, as BHP recently highlighted. Chart 12
High Food Prices Drive EM Inflation
High Food Prices Drive EM Inflation
Chart 13
High Food Prices Drive EM Inflation
High Food Prices Drive EM Inflation
Footnotes 1 Please see Wheat Production by Country 2022, published by worldpopulationreview.com. 2 Awika (2011) notes, "… cereal grains are the single most important source of calories to a majority of the world population. Developing countries depend more on cereal grains for their nutritional needs than the developed world. Close to 60% of calories in developing countries are derived directly from cereals, with values exceeding 80% in the poorest countries." Please see Joseph M. Awika (2011), "Major Cereal Grains Production and Use around the World," published by the American Chemical Society. The three most important grains in this regard are rice, corn and wheat. 3 Please see Egypt's Arab Spring: The bleak reality 10 years after the uprising, published by dw.com on January 25, 2021. 4 Please see First Ukrainian corn cargo leaves Romanian Black Sea port, published by Reuters on April 29, 2022. 5 All USDA estimates mentioned in this report are taken from the USDA’s Grain and Feed Annual for each country. 6 Please refer to After five record crops, heat wave threatens India’s wheat output, export plans, published by Reuters on May 2, 2022. 7 Please refer to U.S. Grain Shipping Costs Soar With War and Drought Swinging Demand, published by Bloomberg on March 18, 2022. 8 For a more detailed discussion, please refer to Risk of Persistent Food-Price Inflation, which we published on November 11, 2021. 9 For estimates of orderbook vessels in 2022/23 please see Shipping market outlook 2022 Container vs Dry bulk, published by IHS Markit on November 30, 2021; slower speeds could reduce effective shipping capacity by 3-5%, according to S&P Global (see Shipping efficiency targets could prompt slower speeds and reduced capacity: market sources). 10 For the latest on this, please see Copper Demand Will Ignore Recession, which we published on April 14, 2022. Investment Views and Themes Recommendations Recommendations: We are re-establishing our positions in XME, PICK and XOP, which were stopped out APRIL 22, 2022 with gains of 42.42%, 9.77% and 20.91%, respectively, at tonight's close. We also will be adding the VanEck Oil Refiners ETF (CRAK) to our recommendations, given our bullish view of the global refining sector. Strategic Recommendations Trades Closed in 2022
Image
Executive Summary The Fed, Bank of England (BoE) and Reserve Bank of Australia all hiked rates last week. The BoE, however, signaled a note of caution on future UK growth, given soaring energy prices and plunging consumer and business confidence. Interest rate markets are pricing in a peak in UK policy rates over the next year near 2.5%, above realistic estimates of neutral that are more in the 1.5-2% range. UK productivity and potential growth remain too weak to support a higher neutral rate than that. With the BoE forecasting near recessionary conditions over the next couple of years if those market-implied rate hikes come to fruition, the time is right to increase exposure to UK government bonds in global fixed income portfolios. UK Rate Expectations Are Too High
UK Rate Expectations Are Too High
UK Rate Expectations Are Too High
Bottom Line: Markets are overestimating how much additional tightening the Bank of England can deliver. We are upgrading our recommended strategic stance on UK Gilts from underweight (2 out of 5) to overweight (4 out of 5). Not All Central Bankers Can Credibly Restore Credibility Chart 1Developed Market Bond Yields Back To 2018 Highs
Developed Market Bond Yields Back To 2018 Highs
Developed Market Bond Yields Back To 2018 Highs
Three more central bank meetings, three more rate hikes. Last week brought a 50bp hike from the Fed, a 25bp hike – the first of this tightening cycle – by the Reserve Bank of Australia (RBA) and a 25bp rate increase from the Bank of England (BoE). The Fed and RBA moves did little to stabilize the government bond bear markets in the US and Australia, but the BoE was able to provide a temporary reprieve for the Gilt selloff by playing up potential UK recession (stagflation?) risks. Bond yields worldwide remains laser focused on high global inflation and the associated monetary policy response that will be needed to stabilize inflation expectations (Chart 1). That includes both interest rate hikes and reducing the size of bloated central bank balance sheets. The threat of such “double tightening” is weighing on global growth expectations and risk asset valuations. The MSCI World equity index is down -6.4% (in USD terms) so far in the Q2/2022 and down -14.5% since the mid-November/2021 peak. Although in a more mitigated way, credit markets are also being impacted, with the Bloomberg Global High-Yield index down -2.6% so far in Q2 on an excess return basis versus government bonds. Rate hike expectations have started to catch up to elevated inflation expectations, at least according to inflation linked bonds. The yield on 10-year US TIPS now sits at +0.29%, a huge swing from the -1% level seen just one month ago (Chart 2). The 10-year real yield is even higher in Canada (+0.81%) where the Bank of Canada just delivered its own 50bp rate hike in April. On the other hand, 10-year real yields remain deeply below 0% in Europe and the UK, where central bankers have been providing less explicit guidance on future rate hikes and asset purchase reductions compared to the Fed or Bank of Canada. Interest rate markets remain reluctant to price in significantly positive real policy interest rates at the peak of the current tightening cycle. Our proxy for the real terminal rate expectation, the 5-year/5-year overnight index swap rate (OIS) minus the 5-year/5-year CPI swap rate, is only +0.18% in the US. It is still deeply negative in Europe (-1.53%) and the UK (-0.97%). Our estimates of the term premium component of 10-year government bond yields in those three markets is rising alongside interest rate expectations yet remains deeply negative in Europe and the UK (Chart 3). Chart 2Real Rate Divergences In The Face Of A Global Inflation Shock
Real Rate Divergences In The Face Of A Global Inflation Shock
Real Rate Divergences In The Face Of A Global Inflation Shock
Chart 3Markets Still Pricing In Structurally Low Rates
Markets Still Pricing In Structurally Low Rates
Markets Still Pricing In Structurally Low Rates
Of those three major bond markets, we see the UK term premium as being the least likely to see additional upward repricing, with the BoE less likely than the Fed or ECB to push for an aggressively smaller balance sheet given domestic economic risks. UK Rate Expectations Are Too Hawkish Chart 4Our BoE Monitor Justifies Recent Tightening Moves
Our BoE Monitor Justifies Recent Tightening Moves
Our BoE Monitor Justifies Recent Tightening Moves
The Bank of England raised rates by 25bps last week, pushing Bank Rate to a 13-year high of 1.0%. The decision was a 6-3 majority, with three Monetary Policy Committee (MPC) members calling for a 50bp hike – matching recent moves by other G-10 central banks like the Fed and Bank of Canada – given tight UK capacity constraints (i.e. low unemployment) and high realized inflation. The MPC noted that additional rate increases would likely be necessary to tame very high UK inflation, a message confirmed by the elevated level of our UK Central Bank Monitor (Chart 4). However, the new economic forecasts presented by the BoE painted a gloomy picture on UK growth, raising the risks of a recession even as UK inflation is expected to continue climbing to a 10% peak in late 2022 on the back of high energy prices.1 Strictly looking at current inflation, the case for the BoE to continue hiking rates is obvious. Yet the BoE may now be placing more weight on the downside risks to growth from the energy shock, at a time when fiscal tightening is no longer providing stimulus. In the press conference following last week’s MPC meeting, BoE Governor Andrew Bailey noted the difficult situation policymakers are facing given the huge surge in energy prices that is fueling inflation while also weighing on household and business real incomes. So what is “neutral” anyway? Related Report Global Fixed Income StrategyThe UK Leads The Way The BoE is one of the least transparent major central banks when it comes to providing guidance on what it thinks the neutral policy rate is. Market participants are left to arrive at their own conclusions and those can vary substantially, as is currently the case. The UK OIS curve is discounting a peak in rates of 2.72% in 2023 and discounting rate cuts after that starting in 2024. Yet the respondents to the BoE’s new Market Participants Survey are calling for a much lower trajectory with rates peaking at 1.75% before falling to 1.5% in 2024 (Chart 5). Those rate levels are in the lower half of the range of longer-run neutral rate estimates from the same Market Participants Survey, between 1.5% and 2.0% (the shaded box in the chart). Chart 5UK Rate Expectations Are Too High
UK Rate Expectations Are Too High
UK Rate Expectations Are Too High
Chart 6Recessionary BoE Forecasts, Except For GDP
Recessionary BoE Forecasts, Except For GDP
Recessionary BoE Forecasts, Except For GDP
Combining the messages from the OIS curve and the Survey, markets are pricing in a path for the BoE Bank Rate that will become restrictive by mid-2023, with another 172bps of rate hikes. The BoE uses market pricing for future interest rates in its economic forecasts. The Bank’s models suggest that a move to raise rates to 2.5% in response to high UK inflation, as markets are discounting, would result in a severe UK downturn that would both push up unemployment from the current 3.7% to 5.4% by Q2/2025 (Chart 6). Headline inflation would plunge to 1.3% over the same period as the UK output gap widens to -2.25% of GDP from the current “excess demand” level of +0.5%. Oddly enough, the BoE is only forecasting a flat profile for real GDP growth over that entire three-year forecasting period, although there will clearly be some negative GDP prints during that period to generate such a massively disinflationary outcome. A mixed picture on UK growth Currently, the UK economy is flashing some warning signs on growth momentum. The UK manufacturing PMI was 55.8 in April, still well above the 50 level indicating growth but 9.8 pts below the cyclical peak in 2021 (Chart 7). The services PMI is in better shape at 58.9, but it did dip lower in the latest reading. The GfK consumer confidence index has fallen sharply in response to contacting real household income growth, reaching the second-lowest reading in the history of the series dating back to 1974 in April. This is a warning sign for consumer spending – retail sales fell in April for the first time in fifteen months (middle panel). Business confidence is also impacted by the high costs of both energy and labor that is squeezing profit margins. UK real investment spending is nearly contracting on a year-over-year basis, despite the robust readings on investment intentions from the BoEs’ Agents Survey of UK businesses (bottom panel).UK firms are facing higher wage costs at a time of very tight labor market and robust labor demand. The BoE estimates that UK private sector wage growth, after adjusting for compositional effects related to the pandemic, will accelerate to 5.1% by the end of Q2/2022 (Chart 8). Chart 7UK Growth Facing Inflationary Headwinds
UK Growth Facing Inflationary Headwinds
UK Growth Facing Inflationary Headwinds
Chart 8UK Labor Market Remains Healthy
UK Labor Market Remains Healthy
UK Labor Market Remains Healthy
Chart 9Will House Prices Signal The Peak In UK Inflation?
Will House Prices Signal The Peak In UK Inflation?
Will House Prices Signal The Peak In UK Inflation?
A robust labor market and quickening wage growth is forcing the BoE to maintain a relatively hawkish bias at a time of high energy inflation, even with the growth outlook darkening in the central bank’s own forecasts. Booming house prices are also making the central bank’s job more challenging. The annual growth rate of the Nationwide UK house price index reached 12.4%, a 17-year high, in March. However, rising mortgage rates and declining household real incomes will likely begin to eat into housing demand and, eventually, help slow the rapid pace of house price growth (Chart 9, bottom panel). Summing it all up, the overall UK inflation picture, including wages and housing costs in addition to energy prices and durable goods prices, will force the BoE to deliver a few more rate hikes before year-end before reaching a peak level that is lower than current market pricing. The neutral UK interest rate is likely very low Chart 10Structurally Weak UK Growth = A Low Neutral Rate
Structurally Weak UK Growth = A Low Neutral Rate
Structurally Weak UK Growth = A Low Neutral Rate
The UK economy has suffered from structurally low potential economic growth dating back to the Brexit referendum in 2016. UK businesses stopped investing in the face of the uncertainty over the UK’s relationship with Europe. There has basically been no growth in UK fixed investment over the past five years. In response, UK productivity has only grown an annualized 0.9% over that same period (Chart 10) and the OECD’s estimate of UK potential GDP growth has been cut from 2% to 1.1%. With such low potential growth, the neutral BoE policy interest rate is likely even lower than the 1.5-2% range of estimates from the BoE’s Market Participant Survey. Tighter fiscal policy also lowers the neutral UK interest rate, with the UK Office of Budget Responsibility forecasting a narrowing of the UK budget deficit of -13.6 percentage points between the 2021 peak and 2027 (bottom panel). A flat UK Gilt curve is also a sign that the neutral interest rate is quite low. The 2-year/10-year Gilt curve now sits at a mere -49bps with Bank Rate only at 1% (Chart 11). While this is modestly steeper from the near-inversion of the curve seen at the start of 2022, a very flat curve at a nominal policy rate of only 1% suggests that the neutral rate is not far from the current level. Sluggish UK equity market performance and widening UK corporate credit spreads also argue that Bank Rate may already be turning restrictive, although a lower trade-weighted pound is helping to mitigate the overall tightening of UK financial conditions. Chart 11UK Financial Conditions Are Not Restrictive (Yet)
UK Financial Conditions Are Not Restrictive (Yet)
UK Financial Conditions Are Not Restrictive (Yet)
Chart 12Pressure On The BoE Will Not Peak Until Inflation Does
Pressure On The BoE Will Not Peak Until Inflation Does
Pressure On The BoE Will Not Peak Until Inflation Does
In the end, the pressure on the BoE to tighten will not ease until UK inflation peaks. The BoE is suffering a severe credibility crisis, with its own public opinion survey showing the deepest level of public dissatisfaction with the bank since the Global Financial Crisis (Chart 12). Inflation expectations are at similar levels that prevailed during that period, although the unique nature of the current inflation upturn, fueled by global supply-chain squeezes and war-related boosts to commodity prices, will likely prevent a repeat of the relatively fast reversal of inflation expectations seen after the Global Financial Crisis. Investment Implications – Get Ready For Gilt Outperformance Chart 13Upgrade UK Gilts To Overweight
Upgrade UK Gilts To Overweight
Upgrade UK Gilts To Overweight
With the BoE already pushing Bank Rate towards a plausible neutral range, we do not expect many more rate hikes in the UK. Our base case is that the BoE hikes 2-3 more times by year-end, pushing Bank Rate to 1.5-1.75%, before pausing. This would represent a lower peak in policy rates than currently priced in the UK OIS curve. That is a relatively dovish outcome that typically leads to positive performance for a government bond market according to our “Global Golden Rule” framework, which we will revisit in next week’s Strategy Report. For now, however, we see a strong case to turn more positive on UK Gilts, with the BoE likely to deliver fewer rate hikes than discounted (Chart 13). The BoE is also far less likely to begin reducing its balance sheet by selling its Gilt holdings back to the market. BoE Governor Bailey strongly hinted last week that such aggressive quantitative tightening (QT) was not a given, even after the Bank research staff presents its proposals to the MPC in August. A delay in QT would also be a factor boosting UK Gilt performance versus other developed economy bond markets where more aggressive reductions in central bank balance sheets are more likely, like the US and potentially even the euro area. This week, we are upgrading our recommended strategic UK weighting from underweight to overweight. In next week’s report, we will consider the proper allocation for the UK within our model bond portfolio, after reviewing potential bond return forecasts stemming from our Global Golden Rule. Bottom Line: Markets are overestimating how much additional tightening the Bank of England can deliver. We are upgrading our recommended strategic stance on UK Gilts from underweight (2 out of 5) to overweight (4 out of 5). Robert Robis, CFA Chief Fixed Income Strategist rrobis@bcaresearch.com Footnotes 1 The mechanical way that the UK government’s energy price regulator, Ofgem, sets price caps on retail gas and electricity costs - based on changes in wholesale energy costs implied by futures curves – means that UK household energy prices will rise by 40% in October, according to BoE estimates. GFIS Model Bond Portfolio Recommended Positioning Active Duration Contribution: GFIS Recommended Portfolio Vs. Custom Performance Benchmark
It’s Time To Flip The Script - Upgrade UK Gilts
It’s Time To Flip The Script - Upgrade UK Gilts
The GFIS Recommended Portfolio Vs. The Custom Benchmark Index
It’s Time To Flip The Script - Upgrade UK Gilts
It’s Time To Flip The Script - Upgrade UK Gilts
Tactical Overlay Trades
Executive Summary Ingredients For A Policy Mistake
Ingredients For A Policy Mistake
Ingredients For A Policy Mistake
The hawks on the European Central Bank Governing Council have become vocal about a July rate hike. Such a move would be a policy mistake because European growth is weak, while inflation is supply-driven and will soften meaningfully. July 2022 hike is not yet certain. A policy mistake suggests that the current interest rate pricing for June 23 is too aggressive. Buy June 2023 Euribor contract. The serious risk of a policy mistake and the uncertainty surrounding Europe’s energy security confirm that investors should maintain a defensive stance in European assets. The pronounced threats to UK growth warrant a negative view on the pound. Recommendation INCEPTION DATE RETURN SINCE INCEPTION (%) COMMENT Buy June 2023 Euribor contract 05/09/2022 Bottom Line: Stay defensive in Europe. The risk of a policy mistake is high. Only when inflation peaks should investors move into cyclical stocks. In recent weeks, a chorus of ECB hawks expressed the need to increase rates as early as July 2022. Inflation data is on their side; HICP stands at 7.5% and core CPI has reached 3.5%, levels never seen since the introduction of the euro. Markets are responding. The ESTR curve is pricing in a positive ECB deposit rate for the October 2022 Governing Council meeting. We need to examine the underlying European economic picture to address two key questions: Will the ECB lift rates as early as July? And will doing so constitute a policy mistake that would hurt European assets? Weaker Growth Let’s start with the growth outlook. European economic activity is rapidly deteriorating. Real GDP growth in the Eurozone has slowed markedly. In Q1, real GDP growth fell to 0.2% quarter-on-quarter or an annualized rate of 0.8%. Worrisomely, Italy’s GDP contracted by -0.2% over that time frame and the very economically sensitive Swedish activity contracted by -0.4%, which suggests that Europe’s deceleration is only starting. Soft data confirm the flagging economic outlook on the continent. Consumer confidence is plunging to levels that are consistent with a recession, led by the collapse in the willingness to make large purchases (Chart 1, top panel). The ZEW as well as the Ifo survey confirm that growth expectations point to a very large decline in output (Chart 1, bottom panel). The weakness is also evident in hard data. High inflation erodes real household income, which squeezes consumer spending. Retail sales across Europe are slowing sharply, only growing at an annual rate of 0.8% while contracting -0.4% on a monthly basis; on a level basis, they are lower today than they were in June 2021. Meanwhile, German retail sales volumes are falling at a -5.4% annual rate. The situation is even worse for new car registrations, which are collapsing at an annual rate of 20.2% (Chart 2). Chart 1Soft Data Point To Soft Growth...
Soft Data Point To Soft Growth...
Soft Data Point To Soft Growth...
Chart 2...So Do Hard Data
...So Do Hard Data
...So Do Hard Data
Industrial production has not been spared. Euro Area IP softened to 2% annually in February and contractions are now visible in Germany and France. Some of this weakness reflects supply difficulties, but the -3.1% annual fall in German factory orders indicates that demand is frail too and that industrial production will shrink further in the months ahead (Chart 2, bottom panel). The deterioration in the global outlook further hurts Europe economic prospects. Our global growth tax indicator, based on energy prices, the dollar, and global bond yields, points toward a further deceleration in the global and US manufacturing PMI, it suggests Euro Area PMIs could fall below 50 (Chart 3). China woes continue to reverberate throughout the global economy. Potential supply constraints will hurt industrial production, but, more importantly, the weakness in China’s marginal propensity to consume (as measured by the gap between the growth rate of M1 relative to M2) predicts a much greater deterioration in European industrial orders, which means that the demand for European capital goods will slow (Chart 3, bottom panel). Chart 3Risks To The Downside
Risks To The Downside
Risks To The Downside
Chart 4Tightening Financial Conditions
Tightening Financial Conditions
Tightening Financial Conditions
European financial conditions are also tightening significantly. The iTraxx Crossover Index is rising swiftly. European high-yield corporate spreads are now above 450bps, levels that coincide with past recessions in the Euro Area (Chart 4). Government bond markets are increasingly under duress too. Italian BTPs now yield close to 200bps above German Bunds (Chart 4, bottom panel), which accentuates the periphery’s pain. Bottom Line: The Eurozone economy is slowing sharply. While Q1 GDP avoided a contraction, soft and hard data indicators suggest that Q2 is likely to record an actual output contraction for the whole Euro bloc. High Inflation, But For How Long? At first glance, European inflation numbers scream for an ECB rate hike, preferably one yesterday. However, the picture is not that clear-cut. Supply factors predominantly drive the Eurozone’s inflation surge. Chart 5 highlights the role of energy, utilities, food, and transportation costs in the HICP and shows that these factors account for more than 80% of the 7.5% HICP rate. Moreover, the fluctuations in energy CPI continue to explain most of the gyration in headline CPI. The close relationship between energy CPI and core CPI highlights an elevated degree of pass-though, the result of higher electricity and transportation costs (Chart 6). Chart 5Energy, Food And Transport Dominate European CPI
An ECB Policy Mistake And Your Portfolio
An ECB Policy Mistake And Your Portfolio
Chart 6All About Energy
All About Energy
All About Energy
Chart 7No Demand Pull-Inflation In Europe
No Demand Pull-Inflation In Europe
No Demand Pull-Inflation In Europe
Unlike those in the US, Euro Area underlying inflation drivers are weak and inconsistent with demand-pull inflation. Wage growth in Europe stands at a paltry 1.6% annual rate, while in the US, the Atlanta Fed Wage Tracker has jumped to 4.5% (Chart 7, top panel). Moreover, Eurozone rent inflation remains stable at 1.2%, while it is a very elevated 4.5% in the US (Chart 7, bottom panel). The bifurcation in demand-driven inflation reflects vastly different output gaps between the two regions. US nominal GDP stands 2.5% above its 2014-2019 trend, while that of the Eurozone is still 5.3% below it. In the consumer durable goods sector, where the US experienced the greatest demand-supply mismatch – and therefore, the greatest inflation pressures – purchases are 25% above their 2014-2019 trend, while in Europe, they are still 9.5% below that trend (Chart 8) Year-on-year inflation prints should roll over this summer, as highlighted by weakening sequential inflation. Even if it remains elevated, the monthly Trimmed Mean CPI peaked last year. Energy inflation, moreover, is already contracting on a month-to-month basis (Chart 9). Chart 8Mind The Output Gap
Mind The Output Gap
Mind The Output Gap
Chart 9Weakening Sequential Inflation
Weakening Sequential Inflation
Weakening Sequential Inflation
Chart 10A Naive Inflation Forecast
A Naive Inflation Forecast
A Naive Inflation Forecast
Simple simulation exercises also confirm that annual inflation will peak this summer (Chart 10). Monthly headline inflation averaged 0.11% from 2010 to 2019, 0.31% in the first half of 2021, and 0.55% from mid-2021 to January 2022. If we assume that monthly inflation prints remain in line with its most recent average, annual inflation will peak by year-end at 9.1%, before falling to 6.8% by April 2023. However, if monthly inflation falls back to an historically elevated monthly average of 0.31%, annual headline inflation will peak in September and fall back to 3.8% by April 2023. Similarly, if monthly core CPI averages 0.28%, annual core CPI will peak in October before declining to 3.4% by April 2023, but it will fall to 2.1% by April 2023, if monthly core CPI averages an historically elevated 0.17%, or the average observed in the first half of 2021 (Chart 10, bottom two panels). Chart 11A Conditional Inflation Forecast
A Conditional Inflation Forecast
A Conditional Inflation Forecast
A more sophisticated exercise based on energy prices and the EUR/USD exchange rate also underlines the downside for Euro Area headline inflation. Energy inflation, which drives headline CPI, closely tracks the evolution of brent prices in euro terms and Deutsch natural gas prices. Assuming that natural gas prices average the historically very high level of €100/MWh over the next twelve months, that Brent averages US$95/bbl over that time frame (consistent with BCA’s commodity and energy team forecasts), and that the euro progressively moves back to EUR/USD1.10 by April 2023 (a weaker expectation than BCA’s Foreign Exchange Strategy team anticipates), then the Eurozone’s energy inflation will collapse to -10% by April 2023 (Chart 11). We can also assume that Russia enacts a full energy embargo on Western Europe if Sweden and Finland apply for NATO membership. In this case, Brent would spike quickly to $140/bbl and natural gas to €250/MWh. In our scenario, prices stay elevated for two months, before they ultimately normalize by early 2023. Under this scenario, energy inflation would experience a spike to 80% (!) in June 2022 before falling back sharply. In all cases, the collapse in energy inflation is consistent with a rapid decline in headline inflation toward 2% in 2023. Bottom Line: European inflation is elevated but remains mainly driven by supply factors, particularly the evolution of energy inflation. Demand-pull inflation is minimal, unlike that in the US. Additionally, both core and headline inflations are set to peak in the coming months based on the evolution of sequential monthly inflation as well as the behavior of the energy market. A July ECB rate hike would constitute a policy mistake for three reasons: (i) the ECB has no control over supply-driven inflation; (ii) Eurozone inflation is set to weaken; and (iii) economic growth will remain poor. Investment Implications Despite the noise made by the hawks, a large amount of uncertainty around the July 2022 meeting’s outcome remains. It is easy to forget that the ECB’s decisions are consensual. Influential members such as Vice-President Luis de Guindos continues to see a July 2022 hike as possible but unlikely. Others, such as Executive Board member Fabio Panetta, are very worried about the Eurozone’s economic slowdown. Moreover, ECB President Christine Lagarde has not endorsed the hawks. In the context of weak growth and a potential top in inflation, achieving consensus about an early summer hike could be difficult. Chart 12Patience Would Be Rewarded
Patience Would Be Rewarded
Patience Would Be Rewarded
The great paradox is that, if the ECB waits before pushing interest rates up, it will have an opportunity to increase rates durably next year. Wage growth is anemic today, but the decline in the Eurozone unemployment rate is consistent with a pickup in salaries in 2023 (Chart 12). Moreover, if energy inflation slows, the relative price-shock that is hurting households and domestic demand will ebb, which will allow consumption to recover. Patience would give Europe strength and the ECB a very strong basis to lift rates sustainably. The hawks will sway the council to their views. Inflation has latency, which means that its inertia may cause HICP to remain elevated beyond this summer. Moreover, the EU’s proposed ban on Russian oil imports along with Sweden’s and Finland’s likely accession-demand to NATO in the upcoming weeks could provoke Russia to strike first by cutting all its energy export to the EU to zero immediately. This would lift inflation for somewhat longer, as we showed in Chart 9. Related Report European Investment StrategyThe Three Forces Hurting European Earnings In response to the significant risk of a rate hike, we continue to recommend investors stay short cyclical stocks relative to defensive ones. Moreover, if the risk of a Russian energy cutoff increases, so does the threat of a severe recession in Europe, as a recent Bundesbank study posits (Chart 13). Capital preservation is paramount in today’s context; thus, we continue to lean on the side of prudence, especially considering Europe’s soft profit outlook. Once risks recede, we will abandon this strategy. This decision, however, would require clarification of Sweden and Finland’s decision about their membership in NATO as well as Russia’s response, a confirmation that the ECB is not hiking rates in July, and a pullback in inflation surprises, which would prove a powerful help for European equities and the cyclicals/defensive split (Chart 14). Chart 13The Russian Embargo Risk
An ECB Policy Mistake And Your Portfolio
An ECB Policy Mistake And Your Portfolio
Chart 14Wait For Inflation To Turn
Wait For Inflation To Turn
Wait For Inflation To Turn
In fact, our view that inflation will peak leads to direct implications for European markets. The periods that followed the previous four peaks in European core inflation were associated with an outperformance of small-cap stocks and cyclical stocks over the subsequent six and twelve months as well as declines in German yields and narrower credit spreads (Table 1A). The sectoral implications were not as clear, but industrials enjoyed an edge, while healthcare stocks suffered marked declines. Our conviction is strongest that energy CPI will fall. Again, this environment is associated with an outperformance of small-caps stocks and cyclicals over the following six months (Table 1B). Sector-wise, energy names suffer in this climate along with defensives, especially communication services equities. Table 1APeaks In Core CPI & Subsequent European Asset Performance
An ECB Policy Mistake And Your Portfolio
An ECB Policy Mistake And Your Portfolio
Table 1BPeaks In Energy CPI & Subsequent European Asset Performance
An ECB Policy Mistake And Your Portfolio
An ECB Policy Mistake And Your Portfolio
Looking at this period of disinflation more broadly rather than just following peaks in inflation, we find similar results. Declining core CPI is associated with an outperformance of cyclicals relative to defensives as well as strength in small-cap equities (Table 2A). This larger sample allows for a clearer view of sectors. Specifically, the performance of industrials and tech relative to the broad market improves markedly, while utilities suffer greatly. We reach roughly similar conclusions when energy CPI is contracting, except that, in this instance, energy stocks also underperform (Table 2B). Interestingly, so do financial companies. This is a surprising result, but previous instances of weaker energy CPI in the sample reflected weaker demand, not an evolving supply shock. Weaker aggregate demand always hurts financials. Table 2ADisinflation & Subsequent European Asset Performance
An ECB Policy Mistake And Your Portfolio
An ECB Policy Mistake And Your Portfolio
Table 2BEnergy Deflation & Subsequent European Asset Performance
An ECB Policy Mistake And Your Portfolio
An ECB Policy Mistake And Your Portfolio
Bottom Line: The risk of a policy mistake at the July ECB meeting is elevated. A policy mistake suggests that the current interest rate pricing for June 23 is too aggressive. Buy June 2023 Euribor contract. Moreover, Russian energy exports are still under threat. Accordingly, we continue to emphasize capital preservation and favor defensives over cyclicals. However, a buying opportunity will emerge rapidly once inflation peaks, especially if the ECB follows our base case. At this point, investors should buy small-cap and cyclical stocks. Industrials will beat energy, while all the defensive sectors will suffer. The BoE’s Tough Choice The Bank of England is stuck between a rock and a hard place. UK inflation shares characteristics of that of both the Eurozone and the US. On the one hand, energy inflation is increasing and could push headline CPI into double-digit territory around October 2022, once fuel subsidies fully expire. On the other hand, wage growth is strong as labor supply elasticity declined after Brexit. Demand-pull inflation is also rampant, which has pushed core CPI to a 5.7% annual rate. The UK’s cost push inflation, along with the growth slowdown in Europe and increasing tax rates are likely to cause a recession in the UK over the coming twelve months. The demand-pull inflation, however, will force the BoE to hike interest rates. This accentuates the downside risk to UK economic activity. Chart 15BoE's First Victim: The Pound
BoE's First Victim: The Pound
BoE's First Victim: The Pound
The obvious victim of this configuration is the pound. Weak growth will prevent the BoE from matching the pace of rate hikes of the Fed and poor economic growth will detract from investments in the UK. As a result, we see further downside in GBP/USD (Chart 15). BCA’s FX strategy team is also selling the pound versus the euro. This position is likely to generate further gains as investors will revise down their views for UK economic activity relative to the Euro Area, since they already hold much more dire expectations for the latter than the former. Bottom Line: EUR/GBP possesses more upside. The growth outlook for the Eurozone is poor, but investors currently overestimate the growth path of the UK relative to that of its southern neighbor. Mathieu Savary, Chief European Strategist Mathieu@bcaresearch.com Tactical Recommendations Cyclical Recommendations Structural Recommendations
Executive Summary The US Still Dominates Economic Output
The US Still Dominates Economic Output
The US Still Dominates Economic Output
While the Ukraine war has been positive for the greenback, there is a slow tectonic shift away from the dollar as China rethinks holding concentrated foreign currency reserves. In the near term, the dollar faces positive macro variables and still-rising geopolitical tensions. Longer term, as global trade slows and countries gravitate into regional trading blocs, the dollar will need to fall to narrow the US trade deficit. By the same token, the Chinese RMB could weaken in the near term but will stabilize longer term. China will promote its currency across Asia. Currency volatility will take a step-function higher in this new paradigm. Winners will be the currencies of small open economies, especially in resource-rich nations. Trade Recommendation Inception Date Return LONG GOLD 2019-12-06 27.7% Bottom Line: Cyclical forces continue to underpin the dollar, such as rising US interest rates, a slowdown in global growth, and a safe haven premium from still-high geopolitical tensions. That said, the dollar is overbought, expensive, and vulnerable to reserve diversification over the longer term. While tactical long positions make sense, strategic investors should not chase the dollar higher. Feature Currency market action this week focused on two key central bank meetings: the Federal Reserve and the Bank of England. The Fed raised rates by 50 basis points while the BoE raised by 25 points, yet the market expectation differs. In the US, markets imply that the Fed can keep real interest positive while engineering a soft landing in the economy. In the UK (and Euro Area), markets see more acute stagflationary risks and assign a higher probability to a policy error. This situation, together with rising geopolitical risk, has put a bid under the dollar. Related Report Commodity & Energy StrategyDie Cast By EU: Inflation, Recession Risks Rise Brewing in the background is the prospect that the Ukraine war and US sanctions on Russia could have longer-term consequences on the dollar. Specifically, Russia and China are now locked into a geopolitical partnership to undermine US geopolitical dominance, including the dollar’s supremacy. While this discussion will inevitably come with some speculation about what will happen in the future, what does the evidence say so far? More importantly, what are some profitable investment opportunities that could arise from any shift? The Russo-Chinese Rebellion Chart 1The US Needs To Externally Finance Defense Spending
The US Needs To Externally Finance Defense Spending
The US Needs To Externally Finance Defense Spending
From Russia’s and China’s point of view, the United States threatens to establish global hegemony. The US possesses the world’s largest economy and most sophisticated military. It has largely maintained its preponderance in these spheres despite the rise of China, the resurgence of Russia, and the formation of the European Union as a geopolitical entity (Chart 1). If the US succeeds in its current endeavor of crippling Russia’s economy and surrounding it with NATO military allies, the world will be even more imbalanced in terms of power, while China will be isolated and insecure. To illustrate this point, NATO’s military spending is much higher than that of the Shanghai Cooperation Organization (SCO), which is not nearly as developed a military alliance (Chart 2). Hence Russia and China believe they must take action to counter the US and establish a global balance of power. When Presidents Vladimir Putin and Xi Jinping met on February 4 to declare that their strategic partnership will suffer “no limits,” which means no military limits, they declared a new multipolar era and warned against US domination under the guise of liberalism. If China allows Putin to fail in his conflict with the West, the Russian regime will eventually undergo a major leadership and policy change and China will become isolated. Whereas if China accepts Russia’s current strategic overture, China will be fortified. Russia can be immensely supportive of China’s Eurasian strategy to bypass US maritime dominance and improve supply security (Chart 3). Chart 2NATO Vs SCO: US Threat Of Dominance
FX Consequences Of The US-Russia Conflict
FX Consequences Of The US-Russia Conflict
The consequence of this Russo-Chinese alliance will be to transact in a currency that falls outside sanctions by the US. This will be no easy feat. The US dollar still monopolizes the world’s monetary system, even though the US is likely to lose economic clout over time. Chart 3China Cannot Reject Russia
FX Consequences Of The US-Russia Conflict
FX Consequences Of The US-Russia Conflict
De-Dollarization And A Brewing USD Crisis? Fact Versus Fiction A reserve currency must serve the three basic functions of money on a global scale – providing a store of value, unit of account, and accepted medium of exchange. This status gives the dominant reserve currency an “exorbitant privilege,” a range of advantages including the ability to run persistent current account deficits and impose devastating sanctions on geopolitical rivals. Since the turn of the century, the US has struggled to maintain domestic political stability and has failed to deter challenges to its global leadership posed by Russia, China, and lesser powers. Lacking public support for foreign military adventures after Iraq and Afghanistan, Washington turned to economic sanctions to try to influence the behavior of other states. The results have been mixed in terms of geopolitics but cumulatively they have been neutral or positive for the trade-weighted dollar. The US adopted harsh sanctions against North Korea in 2005, Iran in 2010, Russia in 2012, Venezuela in 2015, and China in 2018. The primary trend in the dollar was never altered (Chart 4). Chart 4A Chronicle Of Sanctions And The Dollar
A Chronicle Of Sanctions And The Dollar
A Chronicle Of Sanctions And The Dollar
Yet sweeping sanctions against Russia and China are qualitatively different from other sanctions– as they are among the world’s great powers. The extraordinary sanctions on Russia in 2022 – including cutting off its access to US dollar reserves – have proven deeply unsettling for China and other nations that fear they might someday end up on the wrong side of the US’s foreign policy. Russia’s own experience proves that diversification away from the dollar is likely to occur. From a peak of 47% in 2007, Russia reduced its dollar-denominated foreign exchange reserves to 16%. It cut its Treasury holdings from a peak of over 35% of international reserves to less than 1% today. Meanwhile Russia increased its gold holdings from 2% in 2008 to 20% (Chart 5). The Russians accelerated their diversification away from the dollar after invading Ukraine in 2014 to reduce the impact of sanctions. However, the world is familiar with Russian economic isolation. The West embargoed the USSR throughout the Cold War from 1949-1991. The dollar rose to prominence during this period, so it is not intuitive that Russia’s latest withdrawal from the global economy will enable other countries to abandon the dollar when they have failed in the past due to lack of alternatives. What is clear is that there is no clean or easy exit today from a dollar-denominated financial system. But there are a few lessons from Russia: The ruble has recouped all the losses since the implementation of sanctions. It runs a large current account surplus and has stemmed capital outflows. Another factor has been a sharp reduction in its dependence on the dollar. This will cushion the inflationary impact of US sanctions. Going forward, Russia will be much more insulated from the US dollar but at a terrible cost to potential economic growth (Chart 6). A dearth of US dollar capex into Russia will cripple productivity growth. The lesson for other US rivals will be to take economic stability into account when engaging in geopolitical rivalry. Chart 5Russia Was Able To Dump Treasurys...
Russia Was Able To Dump Treasurys...
Russia Was Able To Dump Treasurys...
The dollar has been unfazed by the Russian debacle. The victims have been other reserve currencies such as the euro, British pound, and Japanese yen, which are engulfed in an energy crisis from Russia’s actions. Chart 6...But The Economic Impact Will Remain Severe
...But The Economic Impact Will Remain Severe
...But The Economic Impact Will Remain Severe
The key question that matters for investors will be what China will do. As one of the largest holders of US Treasurys, a destabilizing exit would have dramatic currency market impacts and could backfire on China. The trick will be to continue exiting this system without precipitating domestic instability. What Will China Do? China has learned two critical lessons from the Russo-Ukrainian conflict, with regard to raising the appeal of the RMB. First, the economic impact of US sanctions can still be devastating even when you have diversified out of dollars. Second, access to commodities is ever more important. As such, any strategy China chooses will need to mitigate these risks. China started diversifying away from the dollar in 2011 and today holds $1.05 trillion in US Treasurys. A little less than half of its foreign exchange reserves are denominated in dollars (Chart 7). This has been a gradual diversification that has not upended the current monetary regime. More importantly, China’s diversification accounts for the bulk of the shift by non-allies away from treasuries. Their share of foreign-held treasuries has fallen from 41% in 2009 to 23% today (Chart 8). Chart 7China Has Lowered USD Reserve Holdings
China Has Lowered USD Reserve Holdings
China Has Lowered USD Reserve Holdings
Chart 8US Allies Still Willing To Hold USDs...
US Allies Still Willing To Hold USDs...
US Allies Still Willing To Hold USDs...
China’s diversification has helped drive down the overall foreign share of US government debt holdings (excluding domestic central banks) from close to 50% in the middle of the last decade to 36% today (Chart 9). It has also weighed on the dollar. China can and will speed up its diversification from the dollar in the wake of the Ukraine war. While Americans will say that China only need fear such sanctions if it attacks Taiwan or other countries, China will not rest assured. Beijing must respond to US capability, not the Biden Administration’s stated intentions. A new Republican administration could arise as soon as January 2025 and take the offensive against China. The US and China are already engaged in great power rivalry and Beijing cannot afford to substitute hope for strategy. China ran a $224 billion current account surplus in 2021, so part of its strategy could be to reduce the pool of savings that need to be recycled every year into global assets. Since 2007 China has sent large amounts of outward direct investment into the world to acquire real assets and natural resources. The Xi administration tried to bring coherence to this outward investment by prioritizing different countries and investments adhere to China’s economic and strategic aims. The Belt and Road Initiative is the symbol of this process (Chart 10). Going forward, China will continue this process. It will also recycle more of its savings at home by increasing investment in critical industries such as energy security, semiconductors, and defense. Chart 9...But A Slow Diversification From US Debt Persists
FX Consequences Of The US-Russia Conflict
FX Consequences Of The US-Russia Conflict
The key priorities will remain a Eurasian strategy of circumventing the US navy. Building natural gas pipelines and other infrastructure to link up with Russia is an obvious area of emphasis, although it will involve tough negotiations with Moscow. China will also prioritize Central Asia, the Middle East, South Asia, and mainland Southeast Asia as areas where its influence can grow with limited intervention by the US and its allies (Chart 11). Chart 10The Belt And Road Initiative In Progress
The Belt And Road Initiative In Progress
The Belt And Road Initiative In Progress
Chart 11China Outward Investment Will Need To Be Strategic
FX Consequences Of The US-Russia Conflict
FX Consequences Of The US-Russia Conflict
Chart 12The RMB Could Dominate Intra-Regional Asean Trade
FX Consequences Of The US-Russia Conflict
FX Consequences Of The US-Russia Conflict
As China invests more at home and in other countries, financing and invoicing deals in the renminbi will grow. While the dollar is the transactional currency globally, it is far less relevant when considering local trading blocs. The euro dominates intra-European trade, suggesting China can try to expand RMB invoicing for intra-Asian trade (Chart 12). Even then, however, the yuan faces serious obstacles from China’s inability or unwillingness to extend security guarantees to its partners, failure shift the economic model to consumerism, persistent currency controls, closed capital account, and geopolitical competition with the United States. Investors should pay close attention to shifts occurring at the margin. The number of bilateral swap lines offered to foreign central banks by the People’s Bank of China has grown (Chart 13), with a total amount of around 4 trillion yuan. This allows the PBoC to use its massive foreign exchange reserves, worth about US$3.2 trillion, to back yuan liabilities. As China continues to grow and increases the share of RMB trade within its sphere of influence, the yuan will rise as an invoicing currency (Chart 14). This could take years, even decades, but a shift is already underway. Chart 13The People's Bank Of Asia?
FX Consequences Of The US-Russia Conflict
FX Consequences Of The US-Russia Conflict
Chart 14China Is Growing In Economic Importance
China Is Growing In Economic Importance
China Is Growing In Economic Importance
In the near term, any US sanctions on China will hurt the RMB. Combined with hypo-globalization, China’s zero-Covid policy, narrowing interest rate differentials, and flight from Chinese assets, it is too soon to be positive on the RMB in the context of US-China confrontation (Chart 15). Longer term, China’s ability to ascend the reserve currency ladder will require a more radical change in Chinese policy to move the dollar. Chart 15CNY And US Sanctions
CNY And US Sanctions
CNY And US Sanctions
Where Does The Euro Fit In? The biggest competitor to the US dollar is the euro, which took the largest chunk out of the US’s share of the global currency reserve basket in recent decades (Chart 16). Yet the EU could suffer a long-term loss of security, productivity, and stability from Russia’s invasion of Ukraine and the ensuing energy cutoff with Russia. Chart 16The Dollar Remains A Reserve Currency
The Dollar Remains A Reserve Currency
The Dollar Remains A Reserve Currency
The EU will have to spend more on energy security and national defense. This will lead to an increase in debt securities that other countries could buy, which offers a way for countries to diversify from the dollar. However, Europe does not provide China or Russia with protection from US sanctions. The EU is allied with the US, it imposed sanctions on Russia along with the US, and like the US is pursuing extra-territorial law enforcement with its sanctions. When the US withdrew from the 2015 Iran nuclear deal, the EU disagreed technically, but in practice it enforced the sanctions anyway. The euro is hardly a safer reserve currency than sterling or the yen for countries looking to quarrel with the United States. The fact is that all of these allied states are likely to cooperate together in the event that any other state attempts to revise the global order as Russia has done. Not necessarily because they are democracies and share similar values but because they derive their national security from the US and its alliance system. The takeaway is that the euro will become a buying opportunity if and when the security environment stabilizes. Then diversification into the euro will occur. But it will not become a landslide that unseats the dollar, since the euro will still have a higher geopolitical risk premium. Investment Takeaways The historical evidence suggests that US sanctions have not weighed on the dollar. In the case of the Russo-Ukrainian conflict, it has been positive for the greenback. That said, there is a slow tectonic shift from the dollar, as each economic powerhouse evaluates the merits of holding concentrated foreign currency reserves. In the near term, the dollar will continue to be driven by traditional economic variables – global growth, real interest rate differentials, and the resilience of the US economy. That remains a positive. Geopolitical tensions reinforce the dollar’s current rally. Longer term, as globalization deteriorates and countries gravitate into regional trading blocs, the dollar will need to adjust lower to narrow the US trade deficit. By the same token, the RMB could weaken in the near term but will need to stabilize longer term, if Beijing wants it to be considered an anchor and store of value for other Asian currencies. Chart 17Silver Demand Could Explode Higher As Currency Volatility Rises
Silver Demand Could Explode Higher As Currency Volatility Rises
Silver Demand Could Explode Higher As Currency Volatility Rises
The key takeaway is that currency volatility will take a step-function higher in this new paradigm. The winners could be the currencies of small open economies, especially in resource-rich nations. A world in which economic powers increasingly pursue national interests is likely to be inflationary. These powers will deplete the external pool of global savings, as current account balances wind down in favor of national and strategic interests. They will also likely encourage the demand for anti-fiat assets as currency volatility takes a step-function higher. Gold is likely to do well is this environment, but silver could be on the cusp of an explosion higher. The metal has found some measure of support around $22-23 per ounce even as manufacturing bottlenecks have hammered industrial demand. Long-only investors should hold both gold and silver, but a short gold/silver position makes sense both economically and from a valuation standpoint (Chart 17). Geopolitical Housekeeping: We are closing our Long FTSE 100 / Short DM-ex-US Equities trade for a gain of 19.5%. We still favor this trade cyclically and will look to reinstate it at a future date. We are also booking gains on our short TWD-USD trade for a return of 5.8% — though we remain short Taiwanese equities and continue to expect a fourth Taiwan Strait geopolitical crisis. Chester Ntonifor Foreign Exchange Strategist chestern@bcaresearch.com Matt Gertken Chief Geopolitical Strategist mattg@bcaresearch.com Strategic Themes Open Tactical Positions (0-6 Months) Open Cyclical Recommendations (6-18 Months) Regional Geopolitical Risk Matrix
In lieu of next week’s report, I will be presenting a webcast titled ‘The 5 Big Mispricings In The Markets Right Now, And How To Profit From Them’. I do hope you can join. Executive Summary Just as the railway timetables set in train the First World War, central bank timetables for aggressive rate hikes are setting in train a global recession. Demand is already cool, so aggressive rate hikes will take it to outright cold. The risk is elevated because central banks are desperate to repair their damaged credibility on fighting inflation, and it may be their last chance. Inflationary fears and hawkishness from central banks are weighing on bonds and stocks, and it may take some weeks, or months, for inflation fears to recede. But we could be approaching a turning point. By the summer, core inflation should be receding. Furthermore, the fractal structures of the sell-offs in both the 30-year T-bond and the tech-heavy NASDAQ index are approaching points of extreme fragility that have signalled inflection points. Fractal trading watchlist: 30-year T-bond, NASDAQ, FTSE 100 versus Euro Stoxx 50, Netherlands versus Switzerland, and Petcare (PAWZ). US Inflation Is Hot, But Demand Is Not
US Inflation Is Hot, But Demand Is Not
US Inflation Is Hot, But Demand Is Not
Bottom Line: Tactically cautious, but long-term investors who do not need to time the market bottom should overweight bonds and overweight long-duration defensive equities versus short-duration cyclical equities – for example, overweight US versus non-US equities. Feature The First World War, the historian AJP Taylor famously argued, was “imposed on the statesmen of Europe by railway timetables.” Taylor proposed that the railways and their timetables were so central to troop mobilisation – and specifically, the German Schlieffen Plan – that a plan once set in motion could not be stopped. “Once started the wagons and carriages must roll remorselessly and inevitably to their predestined goal.” Otherwise, the whole process would unravel, and an opportunity to demonstrate military credibility would be lost that might never come again. Today, could a global recession be imposed upon us by central bank timetables for aggressive rate hikes? Just as it was difficult to unwind the troop mobilisation that led to the Great War, it will be difficult to back down from the aggressive rate hikes that the central banks have timetabled, at least in the near term. Otherwise, an opportunity to demonstrate inflation fighting credibility would be lost that might never come again. Just as the railway timetables set in train the First World War, central bank timetables for aggressive rate hikes may set in train another global recession. Unfortunately, central banks do not have precision weapons. Quite the contrary, monetary tightening is a blunt instrument which works by cooling overall demand. But demand is already cool, as evidenced by the contraction of the US economy in the first quarter. In their zeal to repair their damaged credibility on fighting inflation, the danger is that central banks take the economy from cool to outright cold. Granted, the US economy was dragged down by a drop in inventories and net exports. But even US domestic demand – which strips out inventories and net exports – is barely on its pre-pandemic trend (Chart I-1). Meanwhile, the euro area economy is still 5 percent below its pre-pandemic trend (Chart I-2). To reiterate, by hiking rates aggressively into economies that are at best lukewarm, central banks are risking an outright recession. Chart I-1US Inflation Is Hot, But Demand Is Not
US Inflation Is Hot, But Demand Is Not
US Inflation Is Hot, But Demand Is Not
Chart I-2Euro Area Inflation Is Hot, But Demand Is Not
Euro Area Inflation Is Hot, But Demand Is Not
Euro Area Inflation Is Hot, But Demand Is Not
Our Three-Point Checklist For A Recession Has Three Ticks My colleague Peter Berezin has created a three-point checklist for a recession: The build-up of an imbalance makes the economy vulnerable to downturn. A catalyst exposes this imbalance. Amplifiers exacerbate the downturn. Is there a major imbalance? You bet there is. The post-pandemic 26 percent overspend on durable goods in the US constitutes one of the greatest imbalances in economic history. Other advanced economies also experienced unprecedented binges on durable goods. The catalyst that is exposing this major imbalance is the realisation that durable goods are, well, durable. So, if you overspent on durables in 2020/21, then the risk is that you symmetrically underspend in 2022/23 (Chart I-3). The post-pandemic 26 percent overspend on durable goods in the US constitutes one of the greatest imbalances in economic history. Meanwhile, a future underspend on goods cannot be countered by an overspend on services because the consumption of services is constrained by time, opportunity, and biology. There is a limit to how often you can eat out, go to the movies, or go to the doctor (Chart I-4). Indeed, for certain services, an underspend will persist, because we have made some permanent post-pandemic changes to our lifestyles: for example, hybrid office/home working and more online shopping and online medical care. Chart I-3An Overspend On Goods Can Be Corrected By A Subsequent Underspend...
An Overspend On Goods Can Be Corrected By A Subsequent Underspend...
An Overspend On Goods Can Be Corrected By A Subsequent Underspend...
Chart I-4...But An Underspend On Services Cannot Be Corrected By A Subsequent Overspend
...But An Underspend On Services Cannot Be Corrected By A Subsequent Overspend
...But An Underspend On Services Cannot Be Corrected By A Subsequent Overspend
Finally, the amplifier that will exacerbate the downturn is monetary tightening. If central banks follow their railway timetables for aggressive rate hikes, a goods downturn will magnify into an outright recession. So, in Peter’s three-point checklist, we now have tick, tick, and tick. Inflation Is Hot, But Demand Is Not If economic demand is at best lukewarm, then what caused the post-pandemic inflation that central banks are now fighting? The simple answer is massive fiscal stimulus combined with the equally massive shift in spending to durable goods. Locked at home and flush with government supplied cash, we couldn’t spend it on services, so we spent it on goods. This created a massive shock in the distribution of demand, out of services whose supply could easily adjust downwards, and into goods whose supply could not easily adjust upwards. For example, airlines could cut back their flights, but auto manufacturers couldn’t make more cars. So, airfares didn’t collapse but used car prices went vertical! The causality from stimulus payments to durable goods spending to core inflation is irrefutable. The causality from stimulus payments to durable goods spending to core inflation is irrefutable. The biggest surges in US durable goods spending all coincided with the government’s stimulus checks (Chart I-5). And the three separate surges in month-on-month core inflation all occurred after surges in durable goods demand (Chart I-6). As further proof, core inflation is highest in those economies where the stimulus checks and furlough schemes were the most generous – like the US and the UK. Chart I-5Stimulus Checks Caused The Surges in Durable Goods Spending
Stimulus Checks Caused The Surges in Durable Goods Spending
Stimulus Checks Caused The Surges in Durable Goods Spending
Chart I-6The Surges In Durable Goods Spending Caused The Surges In Core Inflation
The Surges In Durable Goods Spending Caused The Surges In Core Inflation
The Surges In Durable Goods Spending Caused The Surges In Core Inflation
What Does All This Mean For Investment Strategy? Our high conviction view is that the pandemic’s inflationary impulse combined with the Ukraine war will turn out to be demand-destructive, and thereby ultimately morph into a deflationary impulse. Yet central banks are all pumped up to demonstrate their inflation fighting credibility. Given that this credibility is badly damaged, it may be their last opportunity to repair it before it is shattered forever. To repeat, just as the railway timetables set in train the First World War, central bank timetables for aggressive rate hikes may set in train another global recession. That said, a recession is not inevitable. The interest rate that matters most for the economy and the markets is not the policy rate that central banks want to hike aggressively, it is the long-duration bond yield. A lower bond yield can underpin both the economy and the financial markets, just as it did during the pandemic in 2020. But to the extent that the bond market is following the real economic data, we are in a dangerous phase. Because, as is typical at an inflection point, the real data will be noisy and ambiguous. Meaning it may take some weeks, or months, for inflation fears to be trumped by growth fears. On March 10th, in Are We In A Slow-Motion Crash? we predicted: “On a tactical (3-month) horizon, the inflationary impulse from soaring energy and food prices combined with the choke on growth from sanctions will weigh on both the global economy and the global stock market. As such, bond yields could nudge higher, the global stock market has yet to reach its crisis bottom, and the US dollar will rally” That prediction proved to be spot on! Recession, or no recession, we are still in a difficult period for markets because inflationary fears and hawkishness from central banks are weighing on bonds and stocks, while buoying the US dollar. As such, tactical caution is still warranted. Fractal structures of the sell-offs in both the 30-year T-bond and the tech-heavy NASDAQ index are approaching points of extreme fragility. But we could be approaching a turning point. By the summer, core inflation should be receding. Furthermore, the fractal structures of the sell-offs in both the 30-year T-bond and the tech-heavy NASDAQ index are approaching points of extreme fragility that have reliably signalled previous inflection points (Chart I-7 and Chart I-8). Chart I-7The Sell-Off In The 30-Year T-Bond Is Approaching Fractal Fragility
The Sell-Off In The 30-Year T-Bond Is Approaching Fractal Fragility
The Sell-Off In The 30-Year T-Bond Is Approaching Fractal Fragility
Chart I-8The Sell-Off In The NASDAQ Is Approaching Fractal Fragility
The Sell-Off In The NASDAQ Is Approaching Fractal Fragility
The Sell-Off In The NASDAQ Is Approaching Fractal Fragility
The advice for long-term investors who do not need to time the market bottom is: Bonds will ultimately rally. Overweight the 30-year T-bond and the 30-year Chinese bond. Equities will be conflicted between slowing growth which will weigh on cyclical profits, and falling bond yields which will buoy long-duration valuations. Therefore, overweight long-duration defensive sectors and markets versus short-duration cyclical sectors and markets. For example, overweight US versus non-US equities. Fractal Trading Watchlist As just discussed, the sell-offs in the 30-year T-bond and the NASDAQ are approaching points of fractal fragility that have signalled previous turning points. Hence, we are adding both investments to our watchlist. Also added to our watchlist is the outperformance of the FTSE100 versus Euro Stoxx 50, and the underperformance of Netherlands versus Switzerland, both of which are approaching potential reversals. Our final addition is Petcare (PAWZ). After a stellar 2020, Petcare gave back most of its gains in 2021. But this underperformance is now approaching a point of fragility which might provide a new entry point. There are no new trades this week, but the full watchlist of investments at, or approaching, turning points is available on our website: cpt.bcaresearch.com Fractal Trading Watchlist: New Additions A Potential New Entry Point Into Petcare
A Potential New Entry Point Into Petcare
A Potential New Entry Point Into Petcare
FTSE100 Outperformance Vs. Euro Stoxx 50 Vulnerable To Reversal
FTSE100 Outperformance Vs. Euro Stoxx 50 Vulnerable To Reversal
FTSE100 Outperformance Vs. Euro Stoxx 50 Vulnerable To Reversal
Netherlands Underperformance Vs. Switzerland Close To Exhaustion
Netherlands Underperformance Vs. Switzerland Close To Exhaustion
Netherlands Underperformance Vs. Switzerland Close To Exhaustion
Chart 1The Strong Trend In The 18-Month-Out US Interest Rate Future Is Fragile
The Strong Trend In The 18-Month-Out US Interest Rate Future Is Fragile
The Strong Trend In The 18-Month-Out US Interest Rate Future Is Fragile
Chart 2The Strong Trend In The 3 Year T-Bond Is Fragile
The Strong Trend In The 3 Year T-Bond Is Fragile
The Strong Trend In The 3 Year T-Bond Is Fragile
Chart 3AUD/KRW Is Vulnerable To Reversal
AUD/KRW Is Vulnerable To Reversal
AUD/KRW Is Vulnerable To Reversal
Chart 4Canada Versus Japan Is Reversing
Canada Versus Japan Is Reversing
Canada Versus Japan Is Reversing
Chart 5Canada's TSX-60's Outperformance Might Be Over
Canada's TSX-60's Outperformance Might Be Over
Canada's TSX-60's Outperformance Might Be Over
Chart 6US Healthcare Providers Vs. Software At Risk of Reversal
US Healthcare Providers Vs. Software At Risk of Reversal
US Healthcare Providers Vs. Software At Risk of Reversal
Chart 7A Potential Switching Point From Tobacco Into Cannabis
A Potential Switching Point From Tobacco Into Cannabis
A Potential Switching Point From Tobacco Into Cannabis
Chart 8Biotech Is A Major Buy
Biotech Is A Major Buy
Biotech Is A Major Buy
Chart 9CAD/SEK Reversal Has Started
CAD/SEK Reversal Has Started
CAD/SEK Reversal Has Started
Chart 10Financials Versus Industrials To Reverse
Financials Versus Industrials To Reverse
Financials Versus Industrials To Reverse
Chart 11Norway's Outperformance Could End
Norway's Outperformance Could End
Norway's Outperformance Could End
Chart 12Greece's Brief Outperformance To End
Greece's Brief Outperformance To End
Greece's Brief Outperformance To End
Chart 13BRL/NZD At A Resistance Point
BRL/NZD At A Resistance Point
BRL/NZD At A Resistance Point
Chart 14The Outperformance Of Resources Versus Healthcare Is Vulnerable To Reversal
The Outperformance Of Resources Versus Healthcare Is Vulnerable To Reversal
The Outperformance Of Resources Versus Healthcare Is Vulnerable To Reversal
Chart 15The Outperformance Of Resources Versus Biotech Has Started To Reverse
The Outperformance Of Resources Versus Biotech Has Started To Reverse
The Outperformance Of Resources Versus Biotech Has Started To Reverse
Chart 16Cotton's Outperformance Is Vulnerable To Reversal
Cotton's Outperformance Is Vulnerable To Reversal
Cotton's Outperformance Is Vulnerable To Reversal
Chart 17US Homebuilders' Underperformance Has Reached A Potential Turning Point
US Homebuilders' Underperformance Has Reached A Potential Turning Point
US Homebuilders' Underperformance Has Reached A Potential Turning Point
Chart 18Switzerland's Outperformance Vs. Germany Has Started To End
Switzerland's Outperformance Vs. Germany Has Started To End
Switzerland's Outperformance Vs. Germany Has Started To End
Chart 19The Rally In USD/EUR Could End
The Rally In USD/EUR Could End
The Rally In USD/EUR Could End
Chart 20The Outperformance Of MSCI Hong Kong Versus China Is Vulnerable To Reversal
The Outperformance Of MSCI Hong Kong Versus China Is Vulnerable To Reversal
The Outperformance Of MSCI Hong Kong Versus China Is Vulnerable To Reversal
Chart 21A Potential New Entry Point Into Petcare
A Potential New Entry Point Into Petcare
A Potential New Entry Point Into Petcare
Chart 22FTSE100 Outperformance Vs. Euro Stoxx 50 Vulnerable To Reversal
FTSE100 Outperformance Vs. Euro Stoxx 50 Vulnerable To Reversal
FTSE100 Outperformance Vs. Euro Stoxx 50 Vulnerable To Reversal
Chart 23Netherlands Underperformance Vs. Switzerland Close To Exhaustion
Netherlands Underperformance Vs. Switzerland Close To Exhaustion
Netherlands Underperformance Vs. Switzerland Close To Exhaustion
Dhaval Joshi Chief Strategist dhaval@bcaresearch.com Fractal Trading System Fractal Trades
Central Bank ‘Railway Timetables’ Are Dragging Us Into Recession
Central Bank ‘Railway Timetables’ Are Dragging Us Into Recession
Central Bank ‘Railway Timetables’ Are Dragging Us Into Recession
Central Bank ‘Railway Timetables’ Are Dragging Us Into Recession
6-Month Recommendations Structural Recommendations Closed Fractal Trades Indicators To Watch - Bond Yields Chart II-1Indicators To Watch - Bond Yields - Euro Area
Indicators To Watch - Bond Yields - Euro Area
Indicators To Watch - Bond Yields - Euro Area
Chart II-2Indicators To Watch - Bond Yields - Europe Ex Euro Area
Indicators To Watch - Bond Yields - Europe Ex Euro Area
Indicators To Watch - Bond Yields - Europe Ex Euro Area
Chart II-3Indicators To Watch - Bond Yields - Asia
Indicators To Watch - Bond Yields - Asia
Indicators To Watch - Bond Yields - Asia
Chart II-4Indicators To Watch - Bond Yields - Other Developed
Indicators To Watch - Bond Yields - Other Developed
Indicators To Watch - Bond Yields - Other Developed
Indicators To Watch - Interest Rate Expectations Chart II-5Indicators To Watch - Interest Rate Expectations
Indicators To Watch - Interest Rate Expectations
Indicators To Watch - Interest Rate Expectations
Chart II-6Indicators To Watch - Interest Rate Expectations
Indicators To Watch - Interest Rate Expectations
Indicators To Watch - Interest Rate Expectations
Chart II-7Indicators To Watch - Interest Rate Expectations
Indicators To Watch - Interest Rate Expectations
Indicators To Watch - Interest Rate Expectations
Chart II-8Indicators To Watch - Interest Rate Expectations
Indicators To Watch - Interest Rate Expectations
Indicators To Watch - Interest Rate Expectations
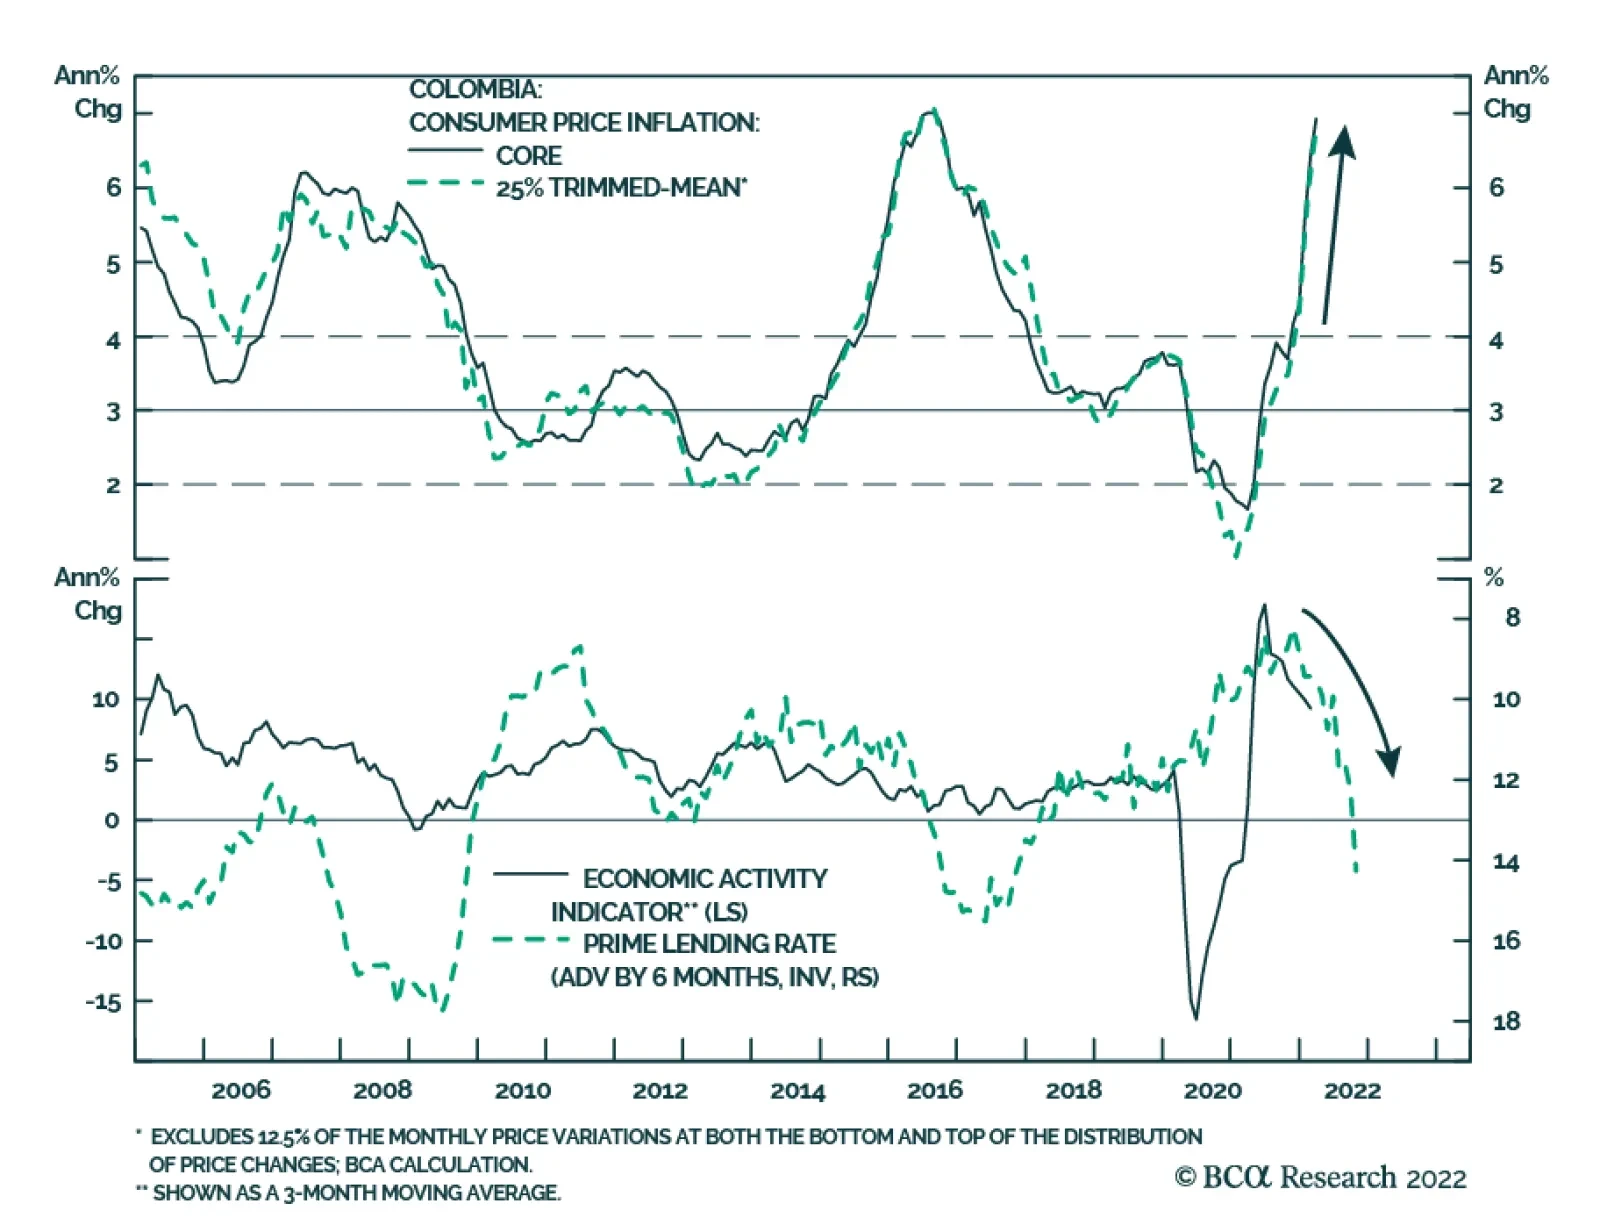
Strong domestic growth and sky-high oil prices have supported the rally in Colombian equities and the currency this year. However, a business cycle slowdown, an uncertain outlook for oil prices, and rising political risk will weigh down on Colombian stocks…
Executive Summary A True Bond Bear Market, USD-Hedged Or Unhedged
A True Bond Bear Market, USD-Hedged Or Unhedged
A True Bond Bear Market, USD-Hedged Or Unhedged
The US dollar has appreciated in 2022, most notably against the euro and Japanese yen. The rally has been more muted against the currencies of major US trading partners like the Canadian dollar and Chinese yuan. The dollar strength to date has had minimal impact on US inflation and will not force any adjustment in the Fed’s hawkish path on interest rates. The weakness of the euro and yen versus the USD will not turn the ECB or Bank of Japan more hawkish, given the lack of visible pass-through from currency depreciation to domestic inflation in Europe and Japan. The two largest owners of US Treasuries, China and Japan, have not increased Treasury purchases in response to higher US yields and a firmer US dollar. Geopolitical tensions and a desire to diversify out of US assets will continue to limit China buying of US Treasuries. Even higher US yields will be needed to compensate Japanese investors for higher bond and currency volatility at a time when the cost to hedge USD exposure is high and rising. Bottom Line: An appreciating US dollar is not yet a reason to expect a peak in US inflation or Treasury yields, or a change in ECB/BoJ policy. Maintain a neutral global duration stance and continue to underweight US Treasuries versus German Bunds and JGBs. Feature The strengthening US dollar (USD) has gotten the attention of investors, with the DXY index up +8.1% since the start of 2022 and threatening a major breakout from the range that has prevailed since 2016 (Chart 1). There have been notable moves in the major currencies that are in the DXY index, especially the euro (EUR) and Japanese yen (JPY). EUR/USD now sits at 1.05 and is threatening a move towards the parity level last seen in 2002. USD/JPY has seen a stunningly rapid increase to the current 130 level, rising 15 big figures in just two months. On a broader basis, the USD rally has been less impressive. The Federal Reserve’s nominal broad trade-weighted dollar index is up a more modest +3.7% year-to-date (Chart 2). Currencies of the major US trading partners have seen less impressive moves versus the dollar compared to the euro and yen. The Canadian dollar is down -1.9%, while the Mexican peso is flat, versus the dollar so far in 2022. Even the tightly managed Chinese currency (CNY) has belatedly joined the depreciation party, with USD/CNY up +4% since mid-April. Chart 1USD Breaking Out Against The Majors
USD Breaking Out Against The Majors
USD Breaking Out Against The Majors
Chart 2Smaller FX Moves From The Larger US Trade Partners
Smaller FX Moves From The Larger US Trade Partners
Smaller FX Moves From The Larger US Trade Partners
For bond markets, the move towards a stronger US dollar is relevant if a) it is sustainable; b) it helps cool off the overheating US economy; and c) it induces capital flows into US Treasuries. On all three counts, the current bout of dollar strength has not been enough to reverse the upward trajectory of US Treasury yields, in absolute terms and relative to government bonds in Europe and Japan. Multiple Drivers Of The USD Rally First and foremost, the latest appreciation of the USD has been about rising US interest rate expectations. The Fed’s increasingly hawkish rhetoric in response to surging inflation has forced a sharp upward adjustment of both the near-term and medium-term path for US bond yields. This has been most evident in the real yield component of yields, with the yield on the 10-year inflation-protected TIPS now in positive territory at +0.15% - a big increase from the -0.5 to -1% range that has prevailed during the past two years of the COVID pandemic. Related Report Global Fixed Income StrategyWe’re All Yield Chasers Now The momentum of the USD rally, with a +13.6% year-over-year gain in the DXY index, has been robust compared to the outright level of US bond yield spreads versus the major developed markets, especially after adjusting for realized inflation differentials (Chart 3). This reflects other USD-bullish factors beyond US interest rate expectations. The US dollar typically behaves as a defensive currency, appreciating during periods of slowing global growth and/or rising investor risk aversion. Both are happening at the same time right now, boosting the safe haven appeal of the US dollar. Global growth expectations are depressed, with the ZEW survey of investment professionals back down to the pandemic lows of 2020 (Chart 4, top panel).1 Worries about slowing growth and high inflation, and the rapid tightening of global monetary policies needed to combat that inflation, are also weighing on investor confidence. US equity market volatility has picked up and investors are paying up to protect their portfolios via options - the VIX index is back above 30 and the CBOE put/call ratio is at a two-year high (middle panel). Chart 3A Big USD Rally Fueled By Wider Real Yield Differentials
A Big USD Rally Fueled By Wider Real Yield Differentials
A Big USD Rally Fueled By Wider Real Yield Differentials
Chart 4Slowing Global Growth & Rising Risk Aversion Weighing On USD
Slowing Global Growth & Rising Risk Aversion Weighing On USD
Slowing Global Growth & Rising Risk Aversion Weighing On USD
This “perfect storm” of USD-bullish factors – rising US interest rate expectations, slowing global growth expectations and increased investor nervousness – has pushed to USD to a level that now appears stretched. BCA Research’s US Dollar Composite Technical Indicator, which combines measures of breadth, momentum, sentiment and trader positioning, is now at an overbought extreme that has heralded past US dollar reversals (bottom panel). Bottom Line: The rising US dollar now discounts a lot of Fed tightening, growth pessimism and investor fear. Conditions for a reversal are in place if any of those USD-bullish factors lose influence, most notably Fed expectations. USD Strength Does Not Impact The Outlook For The Fed, ECB Or BoJ Chart 5A True Bond Bear Market, USD-Hedged Or Unhedged
A True Bond Bear Market, USD-Hedged Or Unhedged
A True Bond Bear Market, USD-Hedged Or Unhedged
USD strength has made life even more difficult of bond investors, at a time when returns across the fixed income universe have suffered because of the duration-related losses from rising bond yields. The Bloomberg Global Treasury index is down -12.2% so far in 2022, and down -18% from the 2020 peak, on a currency-unhedged basis (Chart 5). The returns are not much better this year on a USD-hedged basis, down -6.8% since the start of the year. The latter is suffering from both duration losses and the rising cost to hedge the US dollar. An investor hedging USD exposure into JPY must pay an annualized 165bps (using 3-month currency forwards), while hedging USD exposure into EUR costs 200bps. Those hedging costs primarily reflect higher US interest rate expectations versus Europe and Japan. They will only come down when markets believe that the Fed will stop raising interest rates and begin to easy policy. It is not clear that the current bout of USD strength, on its own, is enough to change the Fed’s plans. Typically, a substantially stronger US dollar would lead the Fed along a less hawkish path, as it would act to slow imported inflation pressures. However, this is not a typical Fed cycle with US headline CPI inflation at a 41-year high of 8.5%. A huge part of that US inflation overshoot is due to global supply squeezes that have impacted the prices of traded goods and commodities. On a rate-of-change basis, the appreciating US dollar is coinciding with some slowing of commodity price momentum, but less so for goods prices. The index of world export prices compiled by the CPB Research Bureau in the Netherlands is up +12.2% on a year-over-year basis, a rapid pace that typically exists during periods of US dollar depreciation (Chart 6, top panel). The annual growth of the CRB commodity index is +17.2%, down from the peak of +54.4% in June 2021, and has roughly tracked the acceleration of the US dollar (middle panel). Yet even with the moderation of commodity inflation, the US dollar strength seen to date has not been enough to slow overshooting global goods price inflation – a necessary condition for central banks like the Fed to turn less hawkish (bottom panel). We do expect global goods price inflation to moderate over the rest of 2022, especially in the US, as post-pandemic consumer spending patterns shift away from goods back towards services. This will be a demand-related story, however, not a USD-strength-related story. Until there is more decisive evidence that goods inflation is slowing meaningfully, the Fed will be forced to deliver on its latest hawkish rhetoric. This includes shifting to a path of hiking rates by 50bps per meeting and moving towards a faster reduction of the Fed’s balance sheet. Right now, there is not much evidence suggesting that the stronger dollar should derail that trajectory (Chart 7): Chart 6USD Strength Not Helping To Slow Global Inflation
USD Strength Not Helping To Slow Global Inflation
USD Strength Not Helping To Slow Global Inflation
Chart 7The Fed Will Remain Hawkish, Despite A Firmer USD
The Fed Will Remain Hawkish, Despite A Firmer USD
The Fed Will Remain Hawkish, Despite A Firmer USD
Non-oil import prices are expanding at a +7.5% pace and accelerating in the face of a firmer US dollar that would normally coincide with slowing import price growth (top panel) The overall level of US financial conditions – which includes not only the currency but other variables like equity prices and corporate bond yields - remains stimulative, both in absolute terms and relative to the level of the trade-weighted US dollar (middle panel). One area of concern is the widening US trade deficit, now nearly -5% of GDP in nominal terms (bottom panel). That wider deficit is primarily related to the combination of strong import demand (and soaring import prices) and soft export demand given slowing global growth. A stronger US dollar does not help reverse either of those trends. However, it is difficult for the Fed to isolate the impact of the currency on the trade deficit given the other non-currency-related factors weighing on US export and import demand (i.e. weaker exports because of the Ukraine war and China COVID lockdowns). In sum, the US dollar strength seen so far does not change our expectations on the path of US inflation, and the pace of Fed tightening, over the next 6-12 months. We still see the Fed delivering multiple rate hikes, but less than the 298bps discounted in the US overnight index swap (OIS) curve over the next year. Conversely, the weakness of the euro and yen versus the US dollar does not change our outlook for the ECB and Bank of Japan. We see both central banks not delivering anything close to the rate hikes discounted in OIS curves. Chart 8Not Much Inflation From A Weaker Euro & Yen
Not Much Inflation From A Weaker Euro & Yen
Not Much Inflation From A Weaker Euro & Yen
On a trade-weighted basis, the euro is only down -5% over the past year - a modest move in comparison to soaring euro area inflation, which hit +7.5% on a headline basis and +3.5% on a core basis in April (Chart 8, middle panel). The ECB is under pressure to end its asset purchases very quickly and begin raising rates, but the euro does not appear to be a reason to accelerate the ECB’s timetable. In Japan, the very rapid weakening of the yen has generated shockingly little inflation, especially in the current environment of strong global goods/commodities inflation. The trade-weighted yen is down -12.7% on a year-over-year basis, yet Japan’s “core-core” CPI index that excludes food and energy prices remains in deflation hitting -0.7% in March – a move exaggerated by plunging mobile phone prices, but still very weak compared to the path of the yen and global goods prices. OIS curves are currently discounting 183bps of ECB rate hikes and 9bps of Bank of Japan rate hikes over the next year. We recommend fading that pricing by staying overweight core Europe and Japan in global bond portfolios, especially versus the US where the Fed is far more likely to follow through on discounted rate hikes. Bottom Line: The dollar strength to date has had minimal impact on US inflation and will not force any adjustment in the Fed’s hawkish path on interest rates. At the same time, the weakness of the euro and yen versus the USD will not turn the ECB or Bank of Japan more hawkish, given the lack of visible pass-through from currency depreciation to domestic inflation in Europe and Japan. Can Foreign Investors Replace Fed Treasury Buying? Chart 9UST Demand Shifting To More Price-Sensitive Buyers
UST Demand Shifting To More Price-Sensitive Buyers
UST Demand Shifting To More Price-Sensitive Buyers
For bond investors, the role of non-US demand for US Treasuries has always been a source of mystery that is often used to explain yield movements. Rumors of flows from major emerging market currency reserve managers or large Asian pension funds has often been used to justify a bullish or bearish view on Treasuries – even when hard data that could prove the existence of such flows is published with long lags that make it useless for timely analysis. The impact of potential foreign bond buying on US Treasury yields has been less influential over the past couple of years. Fed buying via quantitative easing (QE) has swamped all other sources of demand for Treasuries. With the Fed now in a rate hiking cycle that will also lead to a rapid start of quantitative tightening (QT) this summer, the question of who will replace the Fed’s demand for US Treasuries becomes once again relevant for the future path of US bond yields beyond the expected path of the fed funds rate. Already, there has been an adjustment in the term premium for longer-term US Treasury yields – the component of bond yield valuation that would be most impacted by large flows - as the Fed has slowed its pace of bond buying (Chart 9). The New York Fed’s estimates of the term premium on the 10-year Treasury yield reached deeply depressed levels – around -100bps - at the peak of the Fed’s pandemic QE program in 2020. As the US economy has recovered from the 2020 COVID recession, US interest rate expectations have increased but so have estimates of the term premium, which are now back to zero or even slightly positive. The Fed’s QE bond buying has been purely volume driven, with the size and timing of the purchases announced well in advance. The Fed is often called a “price insensitive” buyer since its buying is done without any consideration of yield levels. Other Treasury investors, including foreign buyers, are more price sensitive, with demand influenced by the level of yields. According to the TIC database on US capital flows produced by the US Treasury Department, net foreign buying of Treasuries has picked up, totaling +$346 billion over the 12 months to the most recently available data from February 2022 (Chart 10). That increase has entirely come from private investors, as so-called “official” flows have been flat. Chart 10China Remains On A UST Buyer's Strike
China Remains On A UST Buyer's Strike
China Remains On A UST Buyer's Strike
Chart 11European Buying Of USTs Set To Peak?
European Buying Of USTs Set To Peak?
European Buying Of USTs Set To Peak?
The latter is a continuation of the trend seen over the past few years where China, the nation with the second largest holdings of US Treasuries, has stopped buying them. This is a decision rooted in both geopolitics and economics. Smaller trade surpluses mean China has fewer new currency reserves to invest, while worsening Sino-US tensions have led Chinese authorities to diversify existing reserve holdings away from US Treasuries into gold and other assets. Looking ahead, China is unlikely to significantly ramp up its Treasury purchases despite more attractive US yields and Chinese policymakers tolerating some mild currency weakness versus the US dollar. Beyond China, demand for Treasuries from Europe and Japan has picked up but remains moderate by historical standards. For European investors, there has been a major swing in the TIC data, moving from a net outflow (on a 12-month running total basis) of -$194 billion in December 2020 to a net inflow of +$24 billion in February 2022 (Chart 11, top panel). Typically, net inflows into Treasuries are linked to the FX-hedged spread between US and German government debt. Specifically, when the hedged 10-year Treasury-Bund spread widens to a level between 100-150bps, the flows from Europe into Treasuries begin to improve (middle panel) When that hedged spread narrows to zero or lower, the flows turn the other way and European demand for Treasuries begins to wane. That is typically followed by a widening of the unhedged Treasury-Bund spread (bottom panel). With the current FX-hedged Treasury-Bund spread now at zero, a result of the high cost of hedging US dollars into euros given elevated US rate expectations, we expect European demand for Treasuries to diminish over the rest of 2022. This will help support a wider Treasury-Bund spread as the Fed delivers far more rate hikes than the ECB. For Japan, the largest holder of Treasuries, there has only been a stabilization of outflows over the 12 months to February 2022 (Chart 12, top panel). Past periods of large net inflows from Japan into US Treasuries have occurred when the hedged 10-year US Treasury-JGB spread has approached 200bps (middle panel). With the current spread at only 112bps, Japanese investor demand for Treasuries is unlikely to return without a significant increase in US yields. Chart 12UST Yields Not Attractive Enough To Induce More Japanese Demand
UST Yields Not Attractive Enough To Induce More Japanese Demand
UST Yields Not Attractive Enough To Induce More Japanese Demand
Chart 13Foreign Bond Investing Is Too Volatile For Japanese Investors Right Now
Foreign Bond Investing Is Too Volatile For Japanese Investors Right Now
Foreign Bond Investing Is Too Volatile For Japanese Investors Right Now
More timely weekly capital flow data from Japan shows that Japanese investors have been reluctant to move money into foreign bonds (Chart 13). Elevated levels of bond/rate volatility, and currency volatility given the huge rally in USD/JPY, have made large Japanese bond investors more cautious on increasing foreign bond allocations, even on a currency-hedged basis. If bond/FX volatility subsides, Japanese investors will become “better buyers” of foreign bonds once again. However, Japanese investors may opt to increase allocations to European bonds rather than US Treasuries, with European yields at comparable levels to US Treasuries in JPY-hedged terms (Tables 1-4). For example, a 30-year German Bund hedged into yen now yields 1.46%, compared to a JPY-hedged 30-year US Treasury yield of 1.33%. Table 12-Year Developed Market Government Bond Yields, Hedged Into USD, EUR & JPY
Recent USD Strength Is Not Bond Bullish
Recent USD Strength Is Not Bond Bullish
Table 25-Year Developed Market Government Bond Yields, Hedged Into USD, EUR & JPY
Recent USD Strength Is Not Bond Bullish
Recent USD Strength Is Not Bond Bullish
Table 310-Year Developed Market Government Bond Yields, Hedged Into USD, EUR & JPY
Recent USD Strength Is Not Bond Bullish
Recent USD Strength Is Not Bond Bullish
Table 430-Year Developed Market Government Bond Yields, Hedged Into USD, EUR & JPY
Recent USD Strength Is Not Bond Bullish
Recent USD Strength Is Not Bond Bullish
Bottom Line: Foreign demand for US Treasuries is unlikely to accelerate enough to replace diminished Fed QE purchases over the next 6-12 months, given high USD-hedging costs and elevated Treasury yield volatility. Non-US investors will not help bring an end to the US bond bear market. Robert Robis, CFA Chief Fixed Income Strategist rrobis@bcaresearch.com Footnotes 1 The Global ZEW expectations series shown in Chart 4 is an equal-weighted average of the individual expectations series for the US and euro area. GFIS Model Bond Portfolio Recommended Positioning Active Duration Contribution: GFIS Recommended Portfolio Vs. Custom Performance Benchmark
Recent USD Strength Is Not Bond Bullish
Recent USD Strength Is Not Bond Bullish
The GFIS Recommended Portfolio Vs. The Custom Benchmark Index Global Fixed Income - Strategic Recommendations* Cyclical Recommendations (6-18 Months)
Recent USD Strength Is Not Bond Bullish
Recent USD Strength Is Not Bond Bullish
Tactical Overlay Trades
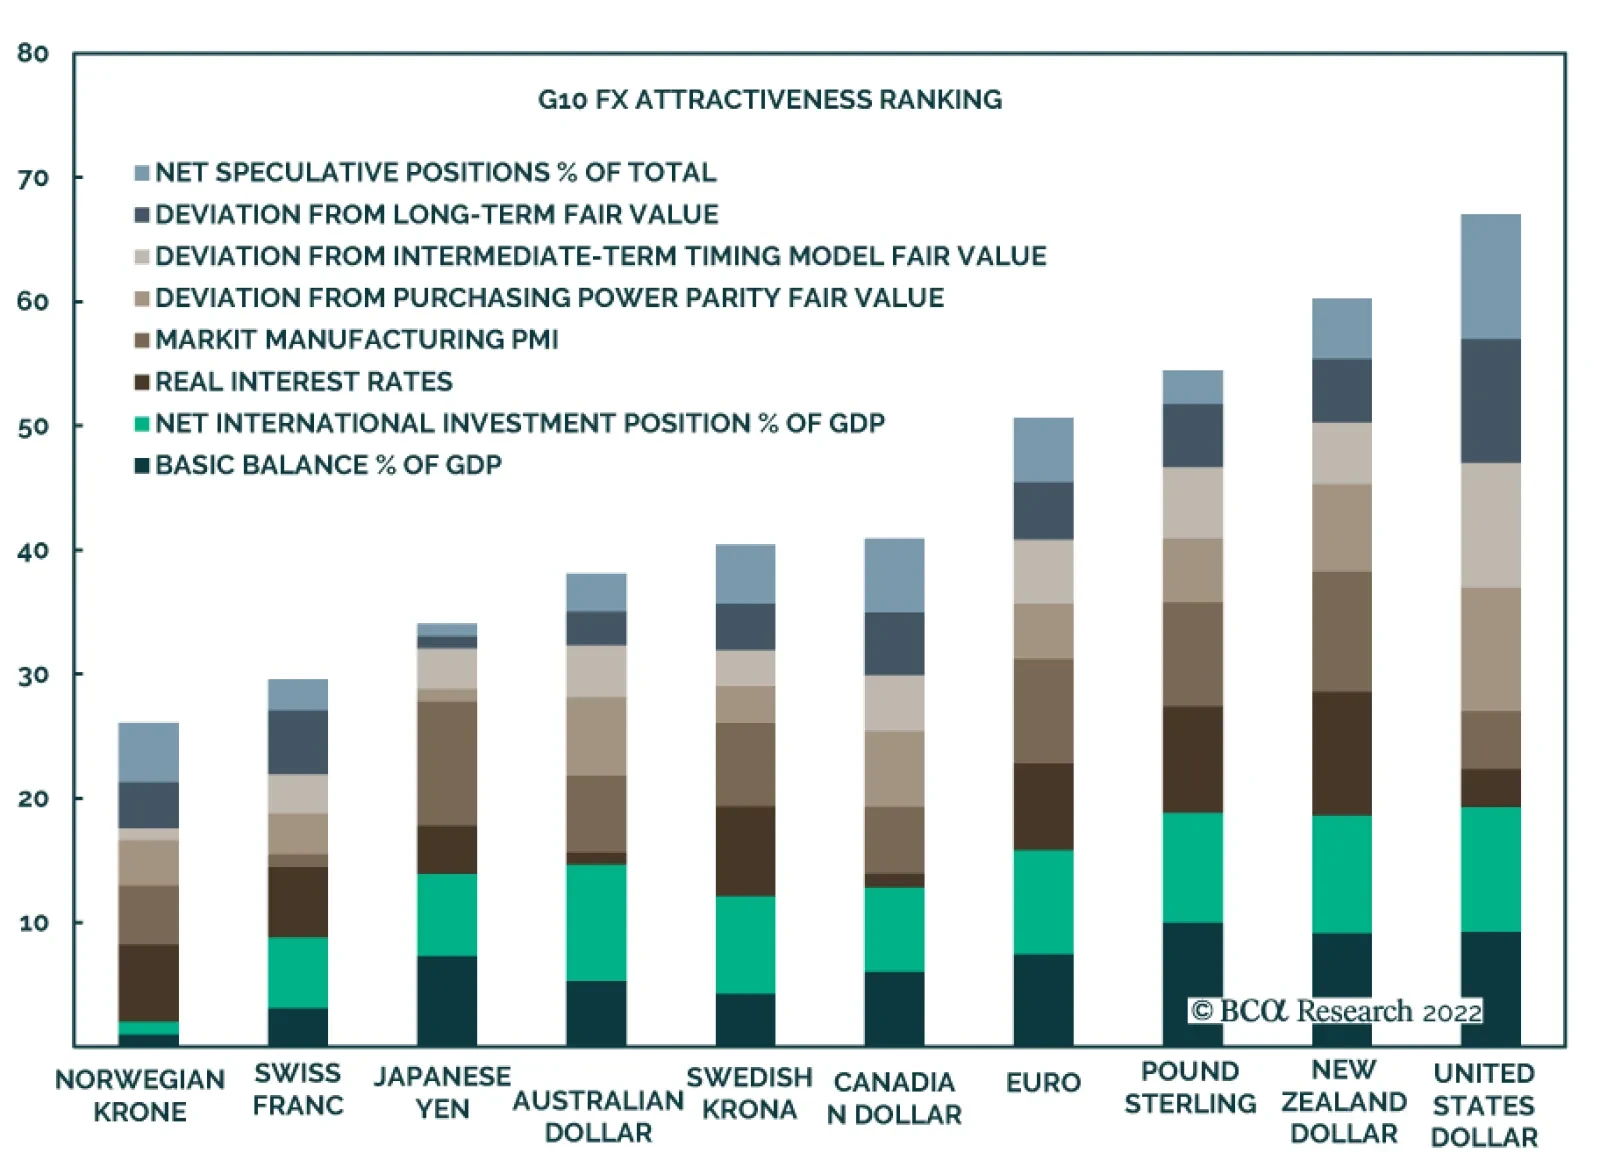
The DXY has returned 7.8% so far this year, making the US dollar the best performing currency within the G10 universe. While commodity currencies such as the AUD, CAD, BRL and MXN have been under less pressure, a vicious liquidation has weighed down on the…