Currencies
According to BCA Research’s US Political Strategy service there is no clear case that the dollar suffers from US sanctions. Foreigners hold 26% of outstanding treasuries. Of this 26%, defense allies hold about 36%. Notably the share of foreign-held…

Executive Summary German GeoRisk Indicator
German GeoRisk Indicator
German GeoRisk Indicator
Russia and Germany have begun cutting off each other’s energy in a major escalation of strategic tensions. The odds of Finland and Sweden joining NATO have shot up. A halt to NATO enlargement, particularly on Russia’s borders, is Russia’s chief demand. Tensions will skyrocket. China’s reversion to autocracy and de facto alliance with Russia are reinforcing the historic confluence of internal and external risk, weighing on Chinese assets. Geopolitical risk is rising in South Korea and Hong Kong, rising in Spain and Italy, and flat in South Africa. France’s election will lower domestic political risk but the EU as a whole faces a higher risk premium. The Biden administration is doubling down on its defense of Ukraine, calling for $33 billion in additional aid and telling Russia that it will not dominate its neighbor. However, the Putin regime cannot afford to lose in Ukraine and will threaten to widen the conflict to intimidate and divide the West. Trade Recommendation Inception Date Return LONG GLOBAL DEFENSIVES / CYCLICALS EQUITIES 2022-01-20 14.2% Bottom Line: Stay long global defensives over cyclicals. Feature Chart 1Geopolitical Risk And Policy Uncertainty Drive Up Dollar
Geopolitical Risk And Policy Uncertainty Drive Up Dollar
Geopolitical Risk And Policy Uncertainty Drive Up Dollar
The dollar (DXY) is breaking above the psychological threshold of 100 on the back of monetary tightening and safe-haven demand. Geopolitical risk does not always drive up the dollar – other macroeconomic factors may prevail. But in today’s situation macro and geopolitics are converging to boost the greenback (Chart 1). Global economic policy uncertainty is also rising sharply. It is highly correlated with the broader trade-weighted dollar. The latter is nowhere near 2020 peaks but could rise to that level if current trends hold. A strong dollar reflects slowing global growth and also tightens global financial conditions, with negative implications for cyclical and emerging market equities. Bottom Line: Tactically favor US equities and the US dollar to guard against greater energy shock, policy uncertainty, and risk-aversion. Energy Cutoff Points To European Recession Chart 2Escalation With Russia Weighs Further On EU Assets
Escalation With Russia Weighs Further On EU Assets
Escalation With Russia Weighs Further On EU Assets
Russia is reducing natural gas flows to Poland and Bulgaria and threatening other countries, Germany is now embracing an oil embargo against Russia, while Finland and Sweden are considering joining NATO. These three factors are leading to a major escalation of strategic tensions on the continent that will get worse before they get better, driving up our European GeoRisk indicators and weighing on European assets (Chart 2). Russia’s ultimatum in December 2021 stressed that NATO enlargement should cease and that NATO forces and weapons should not be positioned east of the May 1997 status quo. Russia invaded Ukraine to ensure its military neutrality over the long run.1 Finland and Sweden, seeing Ukraine’s isolation amid Russian invasion, are now reviewing whether to change their historic neutrality and join NATO. Public opinion polls now show Finnish support for joining at 61% and Swedish support at 57%. The scheduling of a joint conference between the country’s leaders on May 13 looks like it could be a joint declaration of their intention to join. The US and other NATO members will have to provide mutual defense guarantees for the interim period if that is the case, lest Russia attack. The odds that Finland and Sweden remain neutral are higher than the consensus holds (given the 97% odds that they join NATO on Predictit.org). But the latest developments suggest they are moving toward applying for membership. They fear being left in the cold like Ukraine in the event of an attack. Russia’s response will be critical. If Russia deploys nuclear weapons to Kaliningrad, as former President Dmitri Medvedev warned, then Moscow will be making a menacing show but not necessarily changing the reality of Russia’s nuclear strike capabilities. That is equivalent to a pass and could mark the peak of the entire crisis. The geopolitical risk premium would begin to subside after that. Related Report Geopolitical StrategyLe Pen And Other Hurdles (GeoRisk Update) However, Russia has also threatened “military-political repercussions” if the Nordics join NATO. Russia’s capabilities are manifestly limited, judging by Ukraine today and the Winter War of 1939, but a broader war cannot entirely be ruled out. Global financial markets will still need to adjust for a larger tail risk of a war in Finland/Sweden in the very near term. Most likely Russia will retaliate by cutting off Europe’s natural gas. Clearly this is the threat on the table, after the cutoff to Poland and Bulgaria and the warnings to other countries. In the near term, several companies are gratifying Russia and paying for gas in rubles. But these payments violate EU sanctions against Russia and the intention is to wean off Russian imports as soon as possible. Germany says it can reduce gas imports starting next year after inking a deal with Qatar. Hence Russia might take the initiative and start reducing the flow earlier. Bottom Line: If Europe plunges into recession as a result of an immediate natural gas cutoff, then strategic stability between Russia and the West will become less certain. The tail risk of a broader war goes up. Stay cyclically long US equities over global equities and tactically long US treasuries. Stay long defense stocks and gold. Stay Short CNY At the end of last year we argued that Beijing would double down on “Zero Covid” policy in 2022, at least until the twentieth national party congress this fall. Social restrictions serve a dual purpose of disease suppression and dissent repression. Now that the state is doubling down, what will happen next? The economy will deteriorate: imports are already contracting at a rate of 0.1% YoY. The manufacturing PMI has fallen to 48.1 and the service sector PMI to 42.0, indicating contraction. Furthermore, social unrest could emerge, as lockdowns serve as a catalyst to ignite underlying socioeconomic disparities. Hence the national party congress is less likely to go smoothly, implying that investors will catch a glimpse of political instability under the surface in China as the year progresses. The political risk premium will remain high (Chart 3). Chart 3China's Confluence Of Domestic And Foreign Risk Weighs On Stocks And Currency
China's Confluence Of Domestic And Foreign Risk Weighs On Stocks And Currency
China's Confluence Of Domestic And Foreign Risk Weighs On Stocks And Currency
While Chairman Xi Jinping is still likely to clinch another ten years in power, it will not be auspicious amid an economic crash and any social unrest. Xi could be forced into some compromises on either Politburo personnel or policy adjustments. A notable indicator of compromise would be if he nominated a successor, though this would not provide any real long-term assurance to investors given the lack of formal mechanisms for power transfer. After the party congress we expect Xi to “let 100 flowers bloom,” meaning that he will ease fiscal, regulatory, and social policy so that today’s monetary and fiscal stimulus can work effectively. Right now monetary and fiscal easing has limited impact because private sector actors are averse to taking risk. Easing policy to boost the economy could also entail a diplomatic charm offensive to try to convince the US and EU to avoid imposing any significant sanctions on trade and investment flows, whether due to Russia or human rights violations. Such a diplomatic initiative would only succeed, if at all, in the short run. The US cannot allow a deep re-engagement with China since that would serve to strengthen the de facto Russo-Chinese strategic alliance. In other words, an eruption of instability threatens to weaken Xi’s hand and jeopardize his power retention. While it is extremely unlikely that Xi will fall from power, he could have his image of supremacy besmirched. It is likely that China will be forced to ease a range of policies, including lockdowns and regulations of key sectors, that will be marginally positive for economic growth. There may also be schemes to attract foreign investment. Bottom Line: If China expands the range of its policy easing the result could be received positively by global investors in 2023. But the short-term outlook is still negative and deteriorating due to China’s reversion to autocracy and confluence of political and geopolitical risk. Stay short CNY and neutral Chinese stocks. Stay Short KRW South Koreans went to the polls on March 9 to elect their new president for a five-year term. The two top candidates for the job were Yoon Suk-yeol and Lee Jae-myung. Yoon, a former public prosecutor, was the candidate for the People Power Party, a conservative party that can be traced back to the Saenuri and the Grand National Party, which was in power from 2007 to 2017 under President Lee Myung-bak and President Park Geun-hye. Lee, the governor of the largest province in Korea, was the candidate for the Democratic Party, the party of the incumbent President Moon Jae-in. Yoon won by a whisker, garnering 48.6% of the votes versus 47.8% for Lee. The margin of victory for Yoon is the lowest since Korea started directly electing its presidents. President-elect Yoon will be inaugurated in May. He will not have control of the National Assembly, as his party only holds 34% of the seats. The Democratic Party holds the majority, with 172 out of 300 seats. The next legislative election will be in 2024, which means that President Yoon will have to work with the opposition for a good two years before his party has a chance to pass laws on its own. President-elect Yoon was the more pro-business and fiscally restrained candidate. His nomination of Han Duck-soo as his prime minister suggests that, insofar as any domestic policy change is possible, he will be pragmatic, as Han served under two liberal administrations. Yoon’s lack of a majority and nomination of a left-leaning prime minister suggest that domestic policy will not be a source of uncertainty for investors through 2024. Foreign policy, by contrast, will be the biggest source of risk for investors. Yoon rejects the dovish “Moonshine” policy of his predecessor and favors a strong hand in dealing with North Korea. “War can be avoided only when we acquire an ability to launch pre-emptive strikes and show our willingness to use them,” he has argued. North Korea responded by expanding its nuclear doctrine and resuming tests of intercontinental ballistic missiles with the launch of the Hwasong-17 on March 24 – the first ICBM launch since 2017. In a significant upgrade of North Korea’s deterrence strategy, Kim Yo Jong, the sister of Kim Jong Un, warned on April 4 that North Korea would use nuclear weapons to “eliminate” South Korea if attacked (implying an overwhelming nuclear retaliation to any attack whatsoever). Kim Jong Un himself claimed on April 26 that North Korea’s nuclear weapons are no longer merely about deterrence but would be deployed if the country is attacked. President-elect Yoon welcomes the possibility of deploying of US strategic assets to strengthen deterrence against the North. The hawkish turn is not surprising considering that North-South relations failed to make any substantive improvements during President Moon’s five-year tenure as a pro-engagement president. South Koreans, especially Yoon’s supporters, are split on whether inter-Korean dialogue should be continued. They are becoming more interested in developing their own nuclear weapons or at the very least deploying US nuclear weapons in South Korea. Half of South Korean voters support security through alliance with the US, while a third support security through the development of independent nuclear weapons. The nuclear debate will raise tensions on the peninsula. An even bigger change in South Korea’s foreign policy is its policy towards China. President-elect Yoon has accused President Moon of succumbing to China’s economic extortion. Moon had established a policy of “three No’s,” meaning no to additional THAAD missiles in South Korea, no to hosting other US missile defense systems, and no to joining an alliance with Japan and the United States. By contrast, Yoon’s electoral promises include deploying more THAAD and joining the Quadrilateral Dialogue (US, Japan, Australia, India). Polls show that South Koreans hold a low opinion of all of their neighbors but that China has slipped slightly beneath Japan and North Korea in favorability. Even Democratic Party voters feel more negative towards China. While negative attitudes towards China are not unique to Korea, there is an important difference from other countries: the Korean youth dislike China the most, not the older generations. Negative sentiment is less tied to old wounds from the Korean war and more related to ideology and today’s grievances. Younger Koreans, growing up in a liberal democracy and proud of their economic and cultural success, have been involved in campus clashes against Chinese students over Korean support for Hong Kong democrats. Negative attitudes towards China among the youth should alarm investors, as young people provide the voting base for elections to come, and China is the largest trading partner for Korea. Korea’s foreign policy will hew to the American side, at risk to its economy (Chart 4). Chart 4South Korean Geopolitical Risk Rising Under The Radar
South Korean Geopolitical Risk Rising Under The Radar
South Korean Geopolitical Risk Rising Under The Radar
President-elect Yoon’s policies towards North Korea and China will increase geopolitical risk in East Asia. The biggest beneficiary will be India. Both Korea and Japan need to find a substitute to Chinese markets and labor, which have become less reliable in recent years. South Korea’s newly elected president is aligned with the US and West and less friendly toward China and Russia. He faces a rampant North Korea that feels emboldened by its position of an arsenal of 40-50 deliverable nuclear weapons. The North Koreans now claim that they will respond to any military attack with nuclear force and are testing intercontinental ballistic missiles and possibly a nuclear weapon. The US currently has three aircraft carriers around Korea, despite its urgent foreign policy challenges in Europe and the Middle East. Bottom Line: Stay long JPY-KRW. South Korea’s geopolitical risk premium will remain high. But favor Korean stocks over Taiwanese stocks. Stay Neutral On Hong Kong Stocks Hong Kong’s leadership change will trigger a new bout of unrest (Chart 5). Chart 5Hong Kong: More Turbulence Ahead
Hong Kong: More Turbulence Ahead
Hong Kong: More Turbulence Ahead
On April 4, Hong Kong’s incumbent Chief Executive, Carrie Lam, confirmed that she would not seek a second term but would step down on June 30. John Lee, the current chief secretary of Hong Kong, became the only candidate approved to run for election, which is scheduled to be held on May 8. With the backing of the pro-Beijing members in the Election Committee, Lee is expected to secure enough nominations to win the race. Lee served as security secretary from when Carrie Lam took office in 2017 until June 2021. He firmly supported the Hong Kong extradition bill in 2019 and National Security Law in 2020, which provoked historic social unrest in those years. He insisted on taking a tough security stance towards pro-democracy protests. With Lee in power, Hong Kong will face more unrest and tougher crackdowns in the coming years, which will likely bring more social instability. Lee will provoke pro-democracy activists with his policy stances and adherence to Beijing’s party line. For example, his various statements to the news media suggest a dogmatic approach to censorship and political dissent. With the adoption of the National Security Law, Hong Kong’s pro-democracy faction is already deeply disaffected. Carrie Lam was originally elected as a popular leader, with notable support from women, but her popularity fell sharply after the passage of the extradition bill and National Security Law, as well as her mishandling of the Covid-19 outbreak. Her failure to handle the clashes between the Hong Kong people and Beijing damaged public trust in government. Trust never fully recovered when it took another hit recently from the latest wave of the pandemic. Putting another pro-Beijing hardliner in power will exacerbate the trend. Hong Kong equities are vulnerable not merely because of social unrest. During the era of US-China engagement, Hong Kong benefited as the middleman and the symbol that the Communist Party could cooperate within a liberal, democratic, capitalist global order. Hence US-China power struggle removes this special status and causes Hong Kong financial assets to contract mainland Chinese geopolitical risk. As a result of the 2019-2020 crackdown, John Lee and Carrie Lam were among a list of Hong Kong officials sanctioned by the US Treasury Department and State Department in 2020. Now, after the Ukraine war, the US will be on the lookout for any Hong Kong role in helping Russia circumvent sanctions, as well as any other ways in which China might further its strategic aims by means of Hong Kong. Bottom Line: Stay neutral on Hong Kong equities. Favor France Within European Equities French political risk will fall after the presidential election, which recommits the country to geopolitical unity with the US and NATO and potentially pro-productivity structural reforms (Chart 6). France is already a geopolitically secure country so the reduction of domestic political risk should be doubly positive for French assets, though they have already outperformed. And the Russia-West conflict is fueling a risk premium regardless of France’s positive developments. Chart 6France's Domestic Political Risk Will Subside But Russian War Will Keep Geopolitical Risk Elevated
France's Domestic Political Risk Will Subside But Russian War Will Keep Geopolitical Risk Elevated
France's Domestic Political Risk Will Subside But Russian War Will Keep Geopolitical Risk Elevated
The French election ended with a solid victory for the political establishment as we expected. President Emmanuel Macron gaining 58% of the vote to Marine Le Pen’s 42%. Macron beat his opinion polling by 4.5pp while Le Pen underperformed her polls by 4.5pp. A large number of voters abstained, at 28%, compared to 25.5% in 2017. The regional results showed a stark divergence between overseas or peripheral France (where Marine Le Pen even managed to get over half of the vote in several cases) and the core cities of France (where Macron won handily). Macron had won an outright majority in every region in 2017. Macron did best among the young and the old, while Le Pen did best among middle-aged voters. But Macron won every age group except the 50 year-olds, who want to retire early. Macron did well among business executives, managers, and retired people, but Le Pen won among the working classes, as expected. Le Pen won the lowest paid income group, while Macron’s margin of victory rises with each step up the income ladder. Macron’s performance was strong, especially considering the global context. The pandemic knocked several incumbent parties out of power (US, Germany) and required leadership changes in others (Japan, Italy). The subsequent inflation shock now threatens to cause another major political rotation in rapid succession, leaving various political leaders and parties vulnerable in the coming months and years (Australia, the UK, Spain). Only Canada and now France marked exceptions, where post-pandemic elections confirmed the country’s leader. The Ukraine war constitutes yet another shock but it helped Macron, as Le Pen had objective links and sympathies with Russian President Vladimir Putin. Macron’s timing was lucky but his message of structural reform for the sake of economic efficiency still resonates in contemporary France, where change is long overdue – at least compared with Le Pen’s proposal of doubling down on statism, protectionism, and fiscal largesse. The French middle class was never as susceptible to populism as the US, UK, and Italy because it had been better protected from the ravages of globalization. Populism is still a force to be reckoned with, especially if left-wing populists do well in the National Assembly, or if right-wing populists find a fresher face than the Le Pen dynasty. But the failure of populism in the context of pandemic, inflation, and war suggests that France’s political establishment remains well fortified by the economic structure and the electoral system. Whether Macron can sustain his structural reforms depends on legislative elections to be held on June 12-19. Early projections are positive for his party, which should keep a majority. Macron’s new mandate will help. Le Pen’s National Rally and its predecessors may perform better than in the past but that is not saying much as their presence in the National Assembly has been weak. Bottom Line: France is geopolitically secure and has seen a resounding public vote for structural reform that could improve productivity depending on legislative elections. French equities can continue to outperform their European peers over the long run. Our European Investment Strategy recommends French equities ex-consumer stocks, French small caps over large caps, and French aerospace and defense. Favor Spanish Over Italian Stocks Chart 7Italian And Spanish Political Risk Will Rise But Favor Spanish Stocks
Italian And Spanish Political Risk Will Rise But Favor Spanish Stocks
Italian And Spanish Political Risk Will Rise But Favor Spanish Stocks
What about Spain? It is still a “divided nation” susceptible to a rise in political risk ahead of the general election due by December 10, 2023 (Chart 7). In the past few months, a series of strategic mistakes and internal power struggles have led to a significant decline in the popularity of Spain’s largest opposition party, the People’s Party. Due to public infighting and power struggle, Pablo Casado was forced to step down as the leader of the People’s Party on February 23, as requested by 16 of the party’s 17 regional leaders. It is yet to be seen if the new party leader, Alberto Nunez Feijoo, can reboot People’s Party. The far-right VOX party will benefit from the People Party’s setback. The latter’s misstep in a regional election (Castile & Leon) gave VOX a chance to participate in a regional government for the very first time. Hence VOX’s influence will spread and it will receive greater recognition as an important political force. Meanwhile the ruling Socialist Worker’s Party (PSOE) faces anger from the public amid inflation and high energy prices. However, Spanish Prime Minister Pedro Sanchez’s decision to send offensive military weapons to Ukraine is widely supported among major parties, including even his reluctant coalition partner, Unidas Podemos. The People’s Party’s recent infighting gives temporary relief to the ruling party. The Russia-Ukraine issue caused some minor divisions within the government but they are not yet leading to any major political crisis, as nationwide pro-Ukraine sentiment is largely unified. The Andalusia regional election, which is expected this November, will be a check point for Feijoo and a pre-test for next year’s general election. Andalusia is the most populous autonomous community in Spain, consisting about 17% of the seats in the congress (the lower house). The problem for Sanchez and the Socialists is that the stagflationary backdrop will weigh on their support over time. Bottom Line: Spanish political risk is likely to spike sooner rather than later, though Spanish domestic risk it is limited in nature. Madrid faces low geopolitical risk, low energy vulnerability, and is not susceptible to trying to leave the EU or Euro Area. Favor Spanish over Italian stocks. Stay Constructive On South Africa The political and economic status quo is largely unchanged in South Africa and will remain so going into the 2024 national elections. Fiscal discipline will weaken ahead of the election, which should be negative for the rand, but the global commodity shortage and geopolitical risks in Russia and China will probably overwhelm any negative effects from South Africa’s domestic policies. Rising commodity prices have propped up the local equity market and will bring in much-needed revenue into the local economy and government coffers. But structural issues persist. Low growth outcomes amid weak productivity and high unemployment levels will remain the norm. The median voter is increasingly constrained with fewer economic opportunities on the horizon. Pressure will mount on the ruling African National Congress (ANC), fueling civil unrest and adding to overall political risk (Chart 8). Chart 8South Africa's Political Status Quo Is Tactically Positive For Equities And Currency
South Africa's Political Status Quo Is Tactically Positive For Equities And Currency
South Africa's Political Status Quo Is Tactically Positive For Equities And Currency
Almost a year has passed since the civil unrest episode of 2021. Covid-19 lockdowns have lifted and the national state of disaster has ended, reducing social tensions. This is evident in the decline of our South Africa GeoRisk indicator from 2021 highs. While we recently argued that fiscal austerity is under way in South Africa, we also noted that fiscal policy will reverse course in time for the 2024 election. In this year’s fiscal budget, the budget deficit is projected to narrow from -6% to -4.2% over the next two years. Government has increased tax revenue collection through structural reforms that are rooting out corruption and wasteful expenditure. But the ANC will have to tap into government spending to shore up lost support come 2024. Already, the ANC have committed to maintaining a special Covid-19 social-grant payment, first introduced in 2020, for another year. This grant, along with other government support, will feature in 2024 and possibly beyond. Unemployment is at 34.3%, its highest level ever recorded. The ANC cannot leave it unchecked. The most prevalent and immediate recourse is to increase social payments and transfers. Given the increasing number of social dependents that higher unemployment creates, government spending will have to increase to address rising unemployment. President Cyril Ramaphosa is still a positive figurehead for the ANC, but the 2021 local elections showed that the ANC cannot rely on the Ramaphosa effect alone. The ANC is also dealing with intra-party fighting. Ramaphosa has yet to assert total control over the party elites, distracting the ANC from achieving its policy objectives. To correct course, Ramaphosa will have to relax fiscal discipline. To this outcome, investors should expect our GeoRisk indicator to register steady increases in political risk moving into 2024. The only reason to be mildly optimistic is that South Africa is distant from geopolitical risk and can continue to benefit from the global bull market in metals. Bottom Line: Maintain a cyclically constructive outlook on South African currency and assets. Tight global commodity markets will support this emerging market, which stands to benefit from developments in Russia and China. Investment Takeaways Stay strategically long gold on geopolitical and inflation risk, despite the dollar rally. Stay long US equities relative to global and UK equities relative to DM-ex-US. Favor global defensives over cyclicals and large caps over small caps. Stay short CNY, TWD, and KRW-JPY. Stay short CZK-GBP. Favor Mexico within emerging markets. Stay long defense and cyber security stocks. We are booking a 5% stop loss on our long Canada / short Saudi Arabia equity trade. We still expect Middle Eastern tensions to escalate and trigger a Saudi selloff. Matt Gertken Chief Geopolitical Strategist mattg@bcaresearch.com Jesse Anak Kuri Associate Editor Jesse.Kuri@bcaresearch.com Yushu Ma Research Analyst yushu.ma@bcaresearch.com Guy Russell Senior Analyst GuyR@bcaresearch.com Footnotes 1 The campaign in the south suggests that Ukraine will be partitioned, landlocked, and susceptible to blockade in the coming years. If Russia achieves its military objectives, then Ukraine will accept neutrality in a ceasefire to avoid losing more territory. If Russia fails, then it faces humiliation and its attempts to save face will become unpredictable and aggressive. Strategic Themes Open Tactical Positions (0-6 Months) Open Cyclical Recommendations (6-18 Months) Regional Geopolitical Risk Matrix Geopolitical Calendar
Executive Summary Using the real yield on inflation protected bonds as a gauge of the long-term real interest rate is possibly the biggest mistake in finance. The ultra-low real yield on inflation protected bonds captures nothing more than a stampede for inflation protection overwhelming a tiny supply of inflation protected bonds. The long-term real interest rate embedded in the US bond and US stock markets is likely to be significantly higher than the -0.2 percent real yield on US inflation protected bonds. Long-term investors should overweight conventional bonds and stocks versus inflation protected bonds. On a 6-12 month horizon, overweight both US bonds and US stocks. With core inflation on the cusp of rolling over and global growth decelerating, the end is in sight for the sell-offs both in long duration bonds and in the stock market. Fractal trading watchlist: High dividend stocks, and MSCI Hong Kong versus MSCI China. The Low ‘Real Bond Yield’ Just Reflects A Massive Demand For Inflation Protection
The Low 'Real Bond Yield' Just Reflects A Massive Demand For Inflation Protection
The Low 'Real Bond Yield' Just Reflects A Massive Demand For Inflation Protection
Bottom Line: The end is in sight for the sell-offs both in long duration bonds and in the stock market. Feature “It ain’t what you don’t know that gets you into trouble. It’s what you know for sure that just ain’t so” One of my favourite quotes, ostensibly attributed to Mark Twain, warns us that trouble doesn’t come from what you don’t know. Rather, trouble comes from what you think you know for certain but turns out to be wrong. In economics and finance the “what you know for sure that just ain’t so” is the long-term real interest rate. In economics and finance the “what you know for sure that just ain’t so” is the long-term real interest rate. The long-term real interest rate is arguably the most fundamental concept in economics and finance. It encapsulates the risk-free real return on savings, and it is embedded in the returns offered by all assets such as bonds and equities. The trouble is, the way that most people quantify the long-term real interest rate turns out to be wrong. Specifically, most people define the long-term real interest rate as the real yield on (10-year) inflation protected bonds, which now stands at -0.2 percent in the US and -2.3 percent in the UK. US and UK inflation protected bonds will of course deliver the negative long-term real returns that their yields offer. So, most people believe that the long-term real interest rate is still depressed, permitting many rate hikes from the Federal Reserve and Bank of England before monetary policy becomes ‘restrictive’, and providing a massive cushion to asset valuations before they become expensive.This commonly held belief is arguably the biggest mistake in finance. The Long-Term Real Interest Rate Is Not What You Think The biggest mistake in finance stems from the confluence of two factors: first, the inflation protected bond market is the only true hedge against inflation; and second, it is tiny. Compared with the $45 trillion US equity market and the $25 trillion T-bond market, the Treasury Inflation Protected Securities (TIPS) market is worth just $1.5 trillion. Many other economies do not even have an inflation protected bond market! The ultra-low real yield on inflation protected bonds captures nothing more than the massive imbalance between huge demand for inflation hedges and tiny supply. When the price level surges, as it has recently, stock and bond investors have a fiduciary duty to seek an inflation hedge, even if they are shutting the stable door after the horse has bolted (Chart I-1). With at least $70 trillion worth of investors all wanting a piece of the $1.5 trillion TIPS market, the demand for TIPS surges, meaning that their real yield collapses. Therefore, the ultra-low real yield on inflation protected bonds captures nothing more than the massive imbalance between huge demand for inflation hedges and tiny supply. Chart I-1When The Price Level Surges, Investors Flood Into Inflation Protected Bonds
When The Price Level Surges, Investors Flood Into Inflation Protected Bonds
When The Price Level Surges, Investors Flood Into Inflation Protected Bonds
The proof comes from the perfect positive correlation between the oil price and so-called ‘inflation expectations.’ As a surging oil price drives down the 10-year TIPS yield relative to the 10-year T-bond yield, this difference in yields – which is the commonly accepted definition of expected inflation through 2022-32 – also surges (Chart I-2and Chart I-3). This perfect positive correlation also applies to the so-called ‘5-year, 5-year forward’ inflation rate, the expected inflation rate through 2027-32 (Chart I-4). Chart I-2Inflation Expectations Just Track The Oil Price
Inflation Expectations Just Track The Oil Price
Inflation Expectations Just Track The Oil Price
Chart I-3Inflation Expectations Are Just A Mathematical Function Of The Oil Price
Inflation Expectations Are Just A Mathematical Function Of The Oil Price
Inflation Expectations Are Just A Mathematical Function Of The Oil Price
Chart I-4Even The ‘5-Year, 5-Year Forward’ Inflation Expectation Just Tracks The Oil Price
Even The '5-Year, 5-Year Forward' Inflation Expectation Just Tracks The Oil Price
Even The '5-Year, 5-Year Forward' Inflation Expectation Just Tracks The Oil Price
Yet this observed positive correlation between the oil price and inflation expectations is nonsensical, because the reality is the exact opposite! The higher the price level at a given moment, the lower will be the subsequent inflation rate. This is just basic maths. The subsequent inflation rate is the future price divided by the current price, so dividing by a higher price results in a lower number. The empirical evidence over the last 50 years confirms this. The higher the oil price, the lower the subsequent inflation rate (Chart I-5). Chart I-5But A Higher Oil Price Means Lower Subsequent Inflation
But A Higher Oil Price Means Lower Subsequent Inflation
But A Higher Oil Price Means Lower Subsequent Inflation
As the price level surges, subsequent inflation declines, both in theory and in practice. Hence, we should subtract a smaller number from the nominal bond yield to get a higher long-term real interest rate. In other words, all else being equal, the impact of a higher price level is to lift the long-term real interest rate. To repeat, the very low real yield on inflation protected bonds just captures the stampede of inflation hedging demand overwhelming a tiny supply (Chart I-6). Given this distortion, the real yield on inflation protected bonds is likely not the long-term real interest rate embedded in the much larger bond and stock markets. Right now, the long-term real interest rate embedded in the bond and stock markets is likely to be significantly higher than the -0.2 percent real yield on TIPS. Chart I-6The Low ‘Real Bond Yield’ Just Reflects A Massive Demand For Inflation Protection
The Low 'Real Bond Yield' Just Reflects A Massive Demand For Inflation Protection
The Low 'Real Bond Yield' Just Reflects A Massive Demand For Inflation Protection
To which the obvious rejoinder is: if the real yield embedded in conventional bonds and stocks is much higher than in inflation protected bonds, why does the market not arbitrage it away? The simple answer is that the market will arbitrage it away, but in slow motion. This is because the mispricing between expected and realised inflation will crystallise in real time, and not ahead of it. Nevertheless, this slow motion arbitrage provides a compelling opportunity for patient long-term investors. Overweight conventional bonds and stocks versus inflation protected bonds. The Best Way To Value The Stock Market Given that we cannot use the yield on inflation protected bonds as a reliable measure of the long-term real interest rate embedded in stock prices, it is also a big mistake to value equities versus the real bond yield. In The Case Against A ‘Super Bubble’ (And The Case For) we explained the much better way to value equities. The basic idea is that the cashflows of any investment can be condensed into one future ‘lump sum payment’. So, we just need to know the size of this lump sum payment, and then to calculate its present value. The US stock market tracks (the 30-year T-bond price) multiplied by (profits expected in the year ahead). For a stock market, the size of the payment just tracks current profits multiplied by ‘a structural growth constant’, and the present value just tracks the value of an equal duration bond. For example, the duration of the US stock market is the same as that of the 30-year T-bond, at around 25 years.1 It follows that the US stock market price should track: (The 30-year T-bond price) multiplied by (profits expected in the year ahead) multiplied by (a structural growth constant) To the extent that the structural growth outlook for profits does not change, we can simplify the expression to: (The 30-year T-bond price) multiplied by (profits expected in the year ahead) This approach might seem simplistic, yet it perfectly explains the US stock market’s evolution both over the past 40 years (Chart I-7) and over the past year (Chart I-8). Specifically, in 2022 to date, the major drag on the US stock market has been the sell-off in the 30-year T-bond. Chart I-7The US Stock Market = The 30-Year T-Bond Price Times Profits (40 Year Chart)
The US Stock Market = The 30-Year T-Bond Price Times Profits (40 Year Chart)
The US Stock Market = The 30-Year T-Bond Price Times Profits (40 Year Chart)
Chart I-8The US Stock Market = The 30-Year T-Bond Price Times Profits (1 Year Chart)
The US Stock Market = The 30-Year T-Bond Price Times Profits (1 Year Chart)
The US Stock Market = The 30-Year T-Bond Price Times Profits (1 Year Chart)
For the foreseeable future, we expect profit growth to be lacklustre, keeping the 30-year T-bond price as the dominant driver of the US stock market. With core inflation on the cusp of rolling over and global growth decelerating, the end is in sight for the sell-off in long duration bonds and therefore for the sell-off in the stock market. On a 6-12 month horizon, overweight both US bonds and US stocks. Fractal Trading Watchlist This week, we note that the MSCI index outperformance of Hong Kong versus Chinese has reached a point of fragility on its 260-day fractal structure that has signalled previous major turning points in 2015, 2016, 2018, 2019, and 2020. Therefore, we have added this to our watchlist of investments that are at or approaching turning points, which is available in full on our website: cpt.bcaresearch.com We also highlight that the strong rally in high dividend stocks (the ETF is HDV) is vulnerable to correction if, as we expect, bond yields stabilise or reverse (Chart I-9). Accordingly, the recommended trade is to short high dividend stocks (HDV) versus the 10-year T-bond, setting the profit target and symmetrical stop-loss at 6 percent. Chart I-9The Outperformance Of High Dividend Stocks Is Vulnerable To Reversal
The Outperformance Of High Dividend Stocks Is Vulnerable To Reversal Fractal Trading Watch List
The Outperformance Of High Dividend Stocks Is Vulnerable To Reversal Fractal Trading Watch List
The Outperformance Of MSCI Hong Kong Versus China Is Vulnerable To Reversal
The Outperformance Of MSCI Hong Kong Versus China Is Vulnerable To Reversal
The Outperformance Of MSCI Hong Kong Versus China Is Vulnerable To Reversal
Chart 1The Strong Trend In The 18-Month-Out US Interest Rate Future Is Fragile
The Strong Trend In The 18-Month-Out US Interest Rate Future Is Fragile
The Strong Trend In The 18-Month-Out US Interest Rate Future Is Fragile
Chart 2The Strong Trend In The 3 Year T-Bond Is Fragile
The Strong Trend In The 3 Year T-Bond Is Fragile
The Strong Trend In The 3 Year T-Bond Is Fragile
Chart 3AUD/KRW Is Vulnerable To Reversal
AUD/KRW Is Vulnerable To Reversal
AUD/KRW Is Vulnerable To Reversal
Chart 4Canada Versus Japan Is Reversing
Canada Versus Japan Is Reversing
Canada Versus Japan Is Reversing
Chart 5Canada's TSX-60's Outperformance Might Be Over
Canada's TSX-60's Outperformance Might Be Over
Canada's TSX-60's Outperformance Might Be Over
Chart 6US Healthcare Providers Vs. Software At Risk of Reversal
US Healthcare Providers Vs. Software At Risk of Reversal
US Healthcare Providers Vs. Software At Risk of Reversal
Chart 7Bitcoin's 65-Day Fractal Support Is Holding For Now
Bitcoin's 65-Day Fractal Support Is Holding For Now
Bitcoin's 65-Day Fractal Support Is Holding For Now
Chart 8A Potential Switching Point From Tobacco Into Cannabis
A Potential Switching Point From Tobacco Into Cannabis
A Potential Switching Point From Tobacco Into Cannabis
Chart 9Biotech Is A Major Buy
Biotech Is A Major Buy
Biotech Is A Major Buy
Chart 10CAD/SEK Reversal Has Started
CAD/SEK Reversal Has Started
CAD/SEK Reversal Has Started
Chart 11Financials Versus Industrials To Reverse
Financials Versus Industrials To Reverse
Financials Versus Industrials To Reverse
Chart 12Norway's Outperformance Could End
Norway's Outperformance Could End
Norway's Outperformance Could End
Chart 13Greece's Brief Outperformance To End
Greece's Brief Outperformance To End
Greece's Brief Outperformance To End
Chart 14BRL/NZD At A Resistance Point
BRL/NZD At A Resistance Point
BRL/NZD At A Resistance Point
Chart 15The Outperformance Of Resources Versus Healthcare Is Vulnerable To Reversal
The Outperformance Of Resources Versus Healthcare Is Vulnerable To Reversal
The Outperformance Of Resources Versus Healthcare Is Vulnerable To Reversal
Chart 16The Outperformance Of Resources Versus Biotech Has Started To Reverse
The Outperformance Of Resources Versus Biotech Has Started To Reverse
The Outperformance Of Resources Versus Biotech Has Started To Reverse
Chart 17Cotton's Outperformance Is Vulnerable To Reversal
Cotton's Outperformance Is Vulnerable To Reversal
Cotton's Outperformance Is Vulnerable To Reversal
Chart 18US Homebuilders' Underperformance Has Reached A Potential Turning Point
US Homebuilders' Underperformance Has Reached A Potential Turning Point
US Homebuilders' Underperformance Has Reached A Potential Turning Point
Chart 19Switzerland's Outperformance Vs. Germany Has Started To End
Switzerland's Outperformance Vs. Germany Has Started To End
Switzerland's Outperformance Vs. Germany Has Started To End
Chart 20The Rally In USD/EUR Could End
The Rally In USD/EUR Could End
The Rally In USD/EUR Could End
Chart 21The Outperformance Of MSCI Hong Kong Versus China Is Vulnerable To Reversal
The Outperformance Of MSCI Hong Kong Versus China Is Vulnerable To Reversal
The Outperformance Of MSCI Hong Kong Versus China Is Vulnerable To Reversal
Dhaval Joshi Chief Strategist dhaval@bcaresearch.com Footnotes 1 The duration of any investment quantifies how far into the future its cashflows lie, by averaging those cashflows into one theoretical future ‘lump sum’. Defined mathematically, it is the weighted average of the times of its cashflows, in which the weights are the present values of the cashflows. For a bond, the duration also equals the percentage change in the bond price for every 1 percent change in its yield. Fractal Trading System Fractal Trades
This Is The Biggest Mistake In Finance: The Real Interest Rate
This Is The Biggest Mistake In Finance: The Real Interest Rate
This Is The Biggest Mistake In Finance: The Real Interest Rate
This Is The Biggest Mistake In Finance: The Real Interest Rate
6-Month Recommendations Structural Recommendations Closed Fractal Trades Indicators To Watch - Bond Yields Chart II-1Indicators To Watch - Bond Yields - Euro Area
Indicators To Watch - Bond Yields - Euro Area
Indicators To Watch - Bond Yields - Euro Area
Chart II-2Indicators To Watch - Bond Yields - Europe Ex Euro Area
Indicators To Watch - Bond Yields - Europe Ex Euro Area
Indicators To Watch - Bond Yields - Europe Ex Euro Area
Chart II-3Indicators To Watch - Bond Yields - Asia
Indicators To Watch - Bond Yields - Asia
Indicators To Watch - Bond Yields - Asia
Chart II-4Indicators To Watch - Bond Yields - Other Developed
Indicators To Watch - Bond Yields - Other Developed
Indicators To Watch - Bond Yields - Other Developed
Indicators To Watch - Interest Rate Expectations Chart II-5Indicators To Watch - Interest Rate Expectations
Indicators To Watch - Interest Rate Expectations
Indicators To Watch - Interest Rate Expectations
Chart II-6Indicators To Watch - Interest Rate Expectations
Indicators To Watch - Interest Rate Expectations
Indicators To Watch - Interest Rate Expectations
Chart II-7Indicators To Watch - Interest Rate Expectations
Indicators To Watch - Interest Rate Expectations
Indicators To Watch - Interest Rate Expectations
Chart II-8Indicators To Watch - Interest Rate Expectations
Indicators To Watch - Interest Rate Expectations
Indicators To Watch - Interest Rate Expectations
Executive Summary Allies Still Have Faith In USD
Allies Still Have Faith In USD
Allies Still Have Faith In USD
The Biden administration’s use of sanctions has prompted market speculation about the longevity of the dollar. Yet the DXY has hit 100 and could break out, in the context of rising interest rates and safe-haven demand. The US’s increasingly frequent recourse to economic sanctions is a sign of growing foreign policy challenges. US rivals will continue to diversify away from dollar-denominated reserves. However, from a big picture point of view, there is no clear case that the dollar suffers from US sanctions. When global growth reaccelerates, the dollar can weaken. But until then it will remain resilient. Recommendation (Tactical) Inception Level Inception Date Return Long DXY 96.19 23-FEB-22 5.8% Bottom Line: Tactically stay long DXY and defensives over cyclicals. Feature The US’s aggressive use of sanctions against Russia, in response to its invasion of Ukraine, has prompted market speculation about the future of the global financial and monetary system. Related Report US Political StrategyBiden's Foreign Policy And The Midterms It is helpful to begin with facts – what we really know – before launching into grandiose predictions for the future. For example, while some analysts are predicting the demise of the US dollar’s position as the leading reserve currency, so far global investors have bid up the dollar in the face of rising policy uncertainty (Chart 1). In this report we conduct a short overview of US sanctions policy and draw a few simple investment conclusions. Chart 1US Political Risk And The Dollar
US Political Risk And The Dollar
US Political Risk And The Dollar
US Extra-Territorialism Not Yet Hurting The USD The DXY is now trading at 101.2, above the psychological threshold of 100, suggesting that it could break out above its 2016 102.2 peak. The drivers are an expected sharp rise in real interest rates, in both absolute and relative terms, as the Federal Reserve starts on a rate hike cycle that is expected to add 225 basis points to the Fed funds rate this year alone to combat core inflation of 6.5%. This monetary backdrop must be combined with extreme global political and economic instability to explain the dollar’s potential breakout. The global situation is growing less stable, as EU-Russia energy trade breaks down while China imposes lockdowns to stop the spread of Covid-19. Over the past twenty years, the US has struggled to maintain its global leadership. Washington became distracted by wars in the Middle East and South Asia, a national property market crash and financial crisis, and a spike in political polarization and populism. The US public grew war-weary, while the US faced growing challenges from large and powerful nations that it could not confront militarily. Therefore US policymakers turned to economic tools to try to achieve their objectives: namely sanctions but also tariffs and export controls. Many economists and political scientists have warned that the US’s expanding use of economic sanctions – and broader trend of international, extra-territorial, law enforcement – would drive other countries to sell the US dollar and buy other assets, so as to reduce their vulnerability to US tools. This reasoning is sound, as we can see with Russia, which has reduced its dollar-denominated foreign exchange reserves from 41% to 16% since 2016, while increasing its gold holdings from 15% to 22% over the same period. Other major countries vulnerable to US sanctions could follow in Russia’s footsteps. However, so far, the dollar is not suffering excessively from such moves. On the contrary it is rising. The US started using sanctions aggressively with North Korea in 2005, Iran in 2010, and Russia since 2012. The dollar has fluctuated based on other factors, namely rising when the global commodity and industrial cycle was falling (Chart 2). Chart 2TWUSD And DXY Since 2000
TWUSD And DXY Since 2000
TWUSD And DXY Since 2000
Sanctions are a limited prism through which to examine the dollar. But if there is any observable effect of the US’s turn toward sanctions against major players like Russia in 2012 and China in 2018, it is that it has boosted the dollar rather than hurt it. Obviously that trend could change someday. But for now, as the Ukraine war dramatically heightens the US struggle with its rivals, investors should observe that the dollar is on the verge of a breakout. If the dollar continues to rise, it suggests that the US’s structural turn toward more aggressive economic and financial sanctions is not negative for the dollar. It may be neutral or positive. Cyclically the trade-weighted dollar is nowhere near its 2020 peak and could still fall short of that peak, especially if global tensions subside. But the collapse in the euro has caused the DXY to break above its 2020 peak already. Bottom Line: Stay tactically long DXY while watching whether it can break sustainably above 100 to determine whether our cyclically neutral view should be upgraded. US Sanctions On North Korea In this century, the US began to turn more aggressive in its use of sanctions when it confronted the “Axis of Evil” following the terrorist attacks on September 11, 2001. North Korea withdrew from the Nuclear Non-Proliferation Treaty in 2003 and began to pursue a nuclear and ballistic missile program more intently. The US responded by levying serious sanctions on that state beginning in 2005. Gradually tougher US sanctions never caused a change in the North Korean regime or foreign policy. On the contrary North Korea achieved nuclear weaponization and is today outlining an expansive nuclear doctrine. US sanctions on North Korea were never going to drive global macro trends. However, they could have had an impact on South Korean trends. Initially none of the US sanctions reversed the dollar’s decline against the Korean won. After the global financial crisis in 2008, when the dollar began an uptrend against the won, we observe periods of significant new sanctions in which the won rises and the dollar falls (Chart 3, top panel). The same can be said for the outperformance of US equities relative to South Korean equities – if sanctions had any impact, they simply reinforced the flight to US assets in a globally disinflationary context. The trend was mirrored within the US equity market by the rise of tech versus industrials (Chart 3, bottom panel). Chart 3US Sanctions On North Korea
US Sanctions On North Korea
US Sanctions On North Korea
Since Covid-19, the outperformance of US tech is now being overturned by high inflation, which has triggered a vicious selloff in tech. In 2022, global growth is slowing, stagflation is taking shape, and the odds of a recession are rising. Stagflation is negative for both industrials and tech, but more so tech. However, South Korea is still suffering from a deteriorating global macro and geopolitical backdrop, as globalization falters, US-China competition rises, and the US fails to contain North Korean ambitions. Sanctions are a symptom rather than a cause. Bottom Line: US sanctions on North Korea pose no threat to the US dollar. Tactically US industrials can continue to outperform tech but both sectors will suffer in a stagflationary context. US Sanctions On Venezuela The US has slapped sanctions on Venezuela since the early 2000s but these sanctions kicked into high gear in 2015 after President Nicolas Maduro took power and eliminated the last vestiges of democratic and constitutional order. The US recognized the opposition as the legitimate government so sanctions relief will not be easy or convenient. Sanctions have not changed the regime’s behavior, but the regime has all but collapsed and major changes could happen sooner than people expect. Moreover any short-term sanction relief prompted by high oil prices will not be sustainable: the Republican Party will oppose it, hence private US corporations will doubt its durability, and Venezuela’s failing oil industry cannot be revived quickly anyway (Chart 4, top panel). The US has strong relations with Venezuela’s neighbor Colombia. Yet Colombia faces the greatest economic and security risks from Venezuelan instability. The US dollar vastly outstripped the Colombian peso over the past decade, consistent with the US energy sector’s underperformance (Chart 4, bottom panel). Chart 4US Sanctions On Venezuela
US Sanctions On Venezuela
US Sanctions On Venezuela
With Covid-19, this trend reversed because of the global energy squeeze and inflationary environment. The implication was positive for the Colombian peso as well as global (and US) energy sector relative performance. But the peso only marginally improved against the dollar, while US energy outperformance is now stretched. Bottom Line: Energy sector still enjoys macro tailwinds but it is no longer clear that US energy stocks will outperform the broad market for much longer. Favor energy by staying long US energy small caps versus large caps. Also stay long oil and gas transportation and storage sub-sector relative to the broad market. The Biden administration is unlikely to give sanction relief to Venezuela. If it does, it will be ineffective at reducing oil prices in the short term. Either way, there will be little impact on the US dollar. US Sanctions On Iran US policy toward Iran is critical to global stability and energy prices in 2022 and the coming years. US sanctions did not change Iran’s behavior alone, but in league with the P5+1 (the UK, France, China, Russia, plus Germany) sanctions forced Iran to accept limit on its nuclear program in 2015. However, the Trump administration withdrew from that agreement and imposed “maximum pressure” sanctions on Iran in 2018, leading to a sharp depreciation in the market exchange rate of the Iranian toman (Chart 5, top panel). The Saudi Arabian riyal, by contrast, is pegged to the dollar and remains steady except when oil prices collapse (Chart 5, middle panel). The Saudis still rely on the Americans for national security so they are unlikely to abandon the dollar, though they may marginally diversify their foreign exchange reserves. The Biden administration wants to rejoin the 2015 deal but first is trying to extract concessions from Iran. Iran feels limited pressure: while its currency is still weak and inflation high, Iran has not succumbed to social unrest. Iranian oil production and exports are rising amid global high prices (Chart 5, bottom panel). Ultimately Iran wants to continue to advance its nuclear program in line with the North Korean strategy. Hence Biden can rejoin the deal unilaterally if he wants to avoid Middle Eastern instability ahead of the midterm elections. But it would be a short-term, stop-gap agreement and the reduction in oil prices would be fleeting. By contrast, if Biden fails to lift Iran’s sanctions, then the risk of oil disruptions from the Middle East goes way up. Tactically investors should expect upside risks to the oil price, but that would kill more demand and weigh on global growth. Over the past decade the outperformance of US equities relative to Saudi and Emirati equities falls in line with the outperformance of US tech relative to energy sectors. As mentioned, this trend has largely run its course, although it can go further in the short run. But there is a broader trend related to growth versus value styles. The UAE’s stock market is heavily weighted toward financials, while the US is heavily weighted toward tech. The US tech sector has collapsed relative to financials (Chart 6). Chart 5US Sanctions On Iran
US Sanctions On Iran
US Sanctions On Iran
Chart 6US Sanctions On Iran
US Sanctions On Iran
US Sanctions On Iran
Bottom Line: US energy and financials sectors can fare reasonably well in a stagflationary context but their outperformance relative to tech is largely priced from a cyclical point of view. US maximum pressure sanctions on Iran never hurt the US dollar. US Sanctions On Russia The US’s extraordinary sanctions against Russia in 2022 – including freezing its dollar-denominated foreign exchange reserves – have sparked market fears that countries will divest from US dollars to protect themselves from any future US sanctions. To be clear, the US has confiscated foreign enemies’ property and foreign exchange reserves in the past. True, Russia is qualitatively different from other countries, such as Iran, because it is one of the world’s great powers. Yet the US closed off all economic and financial linkages with Russia from 1949-1991 because of the Cold War, the very period when the US dollar rose to prominence as the global reserve currency. In 2022, sanctions on Russia have primarily hurt the Russian ruble, not the US dollar (Chart 7). The Russians divested from the dollar after invading Ukraine in 2014 to reduce the impact of sanctions. But they were not able to divest fast enough to prevent the 2022 sanctions from pummeling their financial system and economy. Chart 7US Sanctions On Russia
US Sanctions On Russia
US Sanctions On Russia
Going forward Russia will be much more insulated from the US dollar but at a terrible cost to long-term productivity. The lesson for other US rivals may be to diversify away from the dollar – but that will be a secondary lesson. The primary lesson will be to take economic stability into account when making strategic security decisions. Economic stability requires ongoing engagement in the global financial system and US dollar system. US sanctions on Russia have benefited US equities and dollar relative to Russian assets as one would expect. Russia’s invasion of Ukraine exacerbated the trend. The takeaway for US investors is that the energy sector’s outperformance sector’s outperformance can continue in the short run but is becoming stretched from a cyclical perspective. Bottom Line: Investors should expect oil and the energy sector to remain strong in the short run, while tech will suffer in an inflationary and stagflationary environment. But energy may not outperform tech for much longer. US Sanctions On China US policy toward China is the critical question today. China holds $1 trillion in dollar-denominated exchange reserves and must recycle around $200 billion in current account surpluses every year into global assets. The US has imposed sweeping sanctions on Iran since 2010, Russia since 2012, and China since 2018. China began diversifying away from dollar-denominated foreign exchange reserves in 2011 in the wake of the Great Recession. The US-initiated trade war in 2018 solidified the change in China’s foreign reserve strategy. The US sanctions against Russia will further solidify it. There are some signs that US punitive measures affected the USD-CNY exchange rate but global economic cycles are far more powerful. The yuan appreciated from 2005 until the global financial crisis, during the height of US-China economic and diplomatic engagement. It depreciated through the manufacturing slowdown of 2015 and the US-China trade war. It appreciated again with the pandemic stimulus and global trade rebound. The yuan was affected by US sanctions and tariffs on the margin amid these larger macro swings (Chart 8, top panel). Still, the overarching trend since 2014 points to a rising dollar and falling yuan. Globalization is in retreat and US-China strategic competition is heating up. As with South Korea, these trends are negative for Chinese assets. US sanctions are a symptom rather than a cause of the underlying macro and geopolitical dynamics. The same point can be made with regard to US equity performance relative to Chinese – and hence US tech outperformance relative to US industrial stocks (Chart 8, bottom panel). However, as with Korea, the cyclical takeaway is to favor industrials over technology in a stagflationary environment. Chart 8US Sanctions On China
US Sanctions On China
US Sanctions On China
Bottom Line: Tactically favor US industrials over tech until the world’s stagflationary trajectory is corrected. US-China relations are one area where US sanction policy can hurt the dollar, as China will seek to diversify over time. But so far the evidence is scant. US Sanctions And Foreign Holdings Of Treasuries Having examined US sanctions on a country-by-country basis, we should now turn toward holdings of US dollars and Treasury securities. Are US economic sanctions jeopardizing the willingness of states to hold US assets? First, Americans hold 74% of outstanding treasuries. Foreigners hold the remaining 26% (Chart 9, top panel). This is a large degree of foreign ownership that reflects the US’s openness as an economy, as well as the size of the treasury market, which makes it attractive to foreign savers who need a place to store their wealth. Of this 26%, defense allies hold about 36%. Theoretically up to 17% of treasuries stand at risk of rapid liquidation by non-allied states afraid of US sanctions. But a conservative estimate would be 6%. Notably the share of foreign-held treasuries held by non-allies has fallen from 40% in 2009 to 23% today. Non-allies are reducing their share fairly rapidly (Chart 9, middle panel). What this really means is that China and Hong Kong are reducing their share – from 26% in 2008 to 16% today. Brazil and India have maintained a steady 6% of foreign-held treasuries. Notably the offshore financial centers see a growing share, suggesting that trust in the dollar remains strong even among states and entities that wish to hide their identity. Some of the divestment that has occurred from non-allied states may be overstated due to rerouting through these third parties. Looking at the data in absolute terms, only China – and arguably Brazil – can be said with any certainty to be pursuing a dedicated policy of divesting from US dollar reserves (Chart 10). This makes sense, as China, like Russia, is engaged in geopolitical competition with the US and therefore must take precautions against future US punitive measures. But these measures are not so far generating a worldwide flight from the dollar, either at the micro level or the macro level. Chart 9Foreign Purchases Of US Treasuries
Foreign Purchases Of US Treasuries
Foreign Purchases Of US Treasuries
Chart 10Foreigners With Large Treasury Holdings
Foreigners With Large Treasury Holdings
Foreigners With Large Treasury Holdings
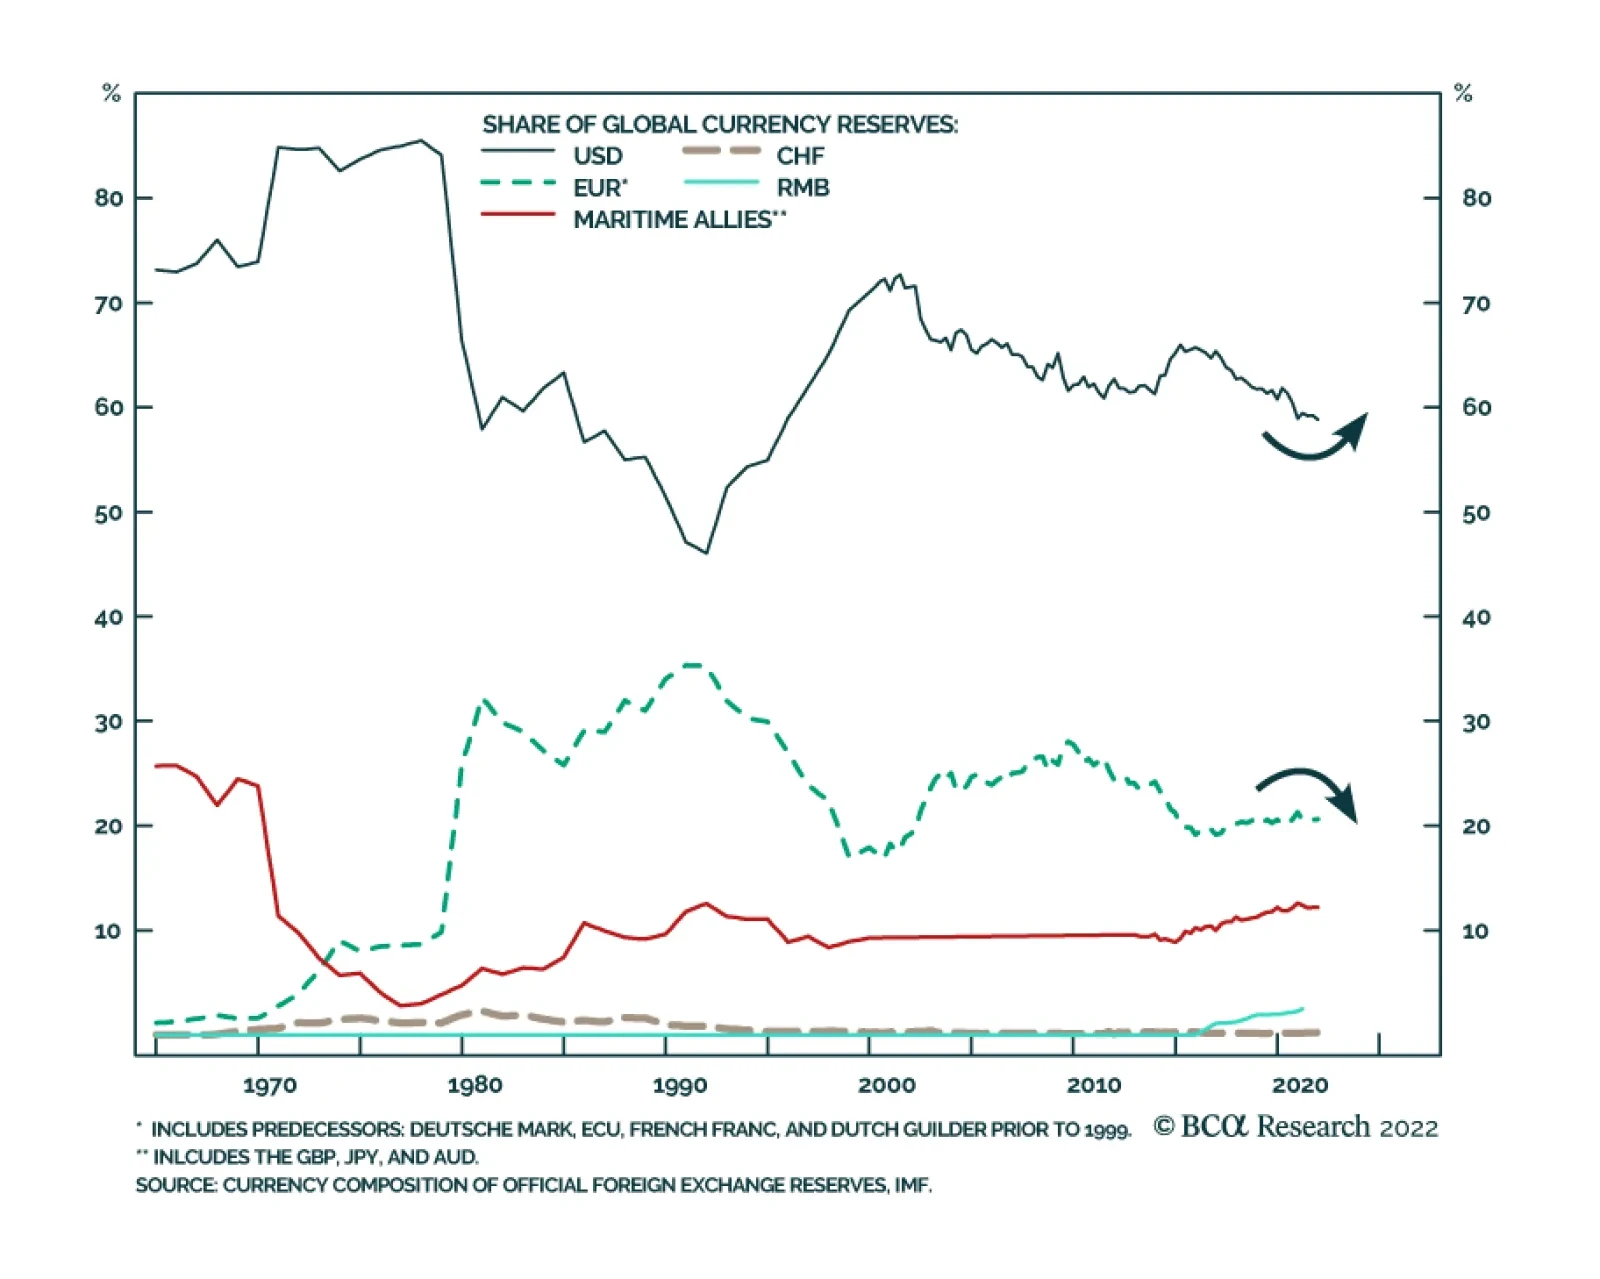
In fact, the biggest competitor to the US dollar is the euro. This is clear from looking at the share of global currency reserves – the two are inversely proportional (Chart 11). And yet it is the European Union, not the US, that could suffer a long-term loss of security, productivity, and stability as a result of Russia’s invasion of Ukraine. The euro is losing status as a reserve currency and the war could exacerbate that trend. Chart 11Global Reserve Currency Basket
Global Reserve Currency Basket
Global Reserve Currency Basket
Europe does not provide protection from US sanctions. The EU, like the US, utilizes economic sanctions and the two entities share many similar foreign policy objectives. Europe is also allied with the US through NATO. When the US withdrew from the Iran nuclear deal, the EU did not withdraw, yet EU entities enforced the sanctions, as their economic linkages with the US were much more valuable than those with Iran. In the case of Russia, the two have imposed sanctions in league, as they will likely do toward other small or great powers that attempt to reshape the global order through military force. The next competitors to the dollar and euro are grouped together in Chart 11 above because they are the US’s “maritime allies,” such as Japan, the United Kingdom, and Australia. These countries will pursue a similar foreign policy to the United States and they do not offer protection from US sanctions during times of conflict or war. The true competitor is the Chinese renminbi. The renminbi will grow as a share of global reserves. But it faces serious obstacles from China’s economic policy, currency controls, closed capital account, and geopolitical competition with the United States. Washington’s sanctions have already targeted China yet the US dollar has remained resilient. Bottom Line: The US’s erratic foreign policy in recent decades has potentially weighed on the US’s commanding position as a global reserve currency, with its share of reserves falling from 71% in 2000 to 59% today. But US allies have mostly picked up the slack. And the dollar’s top competitor, the euro, is likely to suffer more than the dollar from the Ukraine war. Still it is true that US sanctions are alienating China, which will continue to diversify away from the dollar. Investment Takeaways Tactically stay long the US dollar (DXY). The combination of monetary policy tightening and foreign policy challenges is driving a dollar rally that could result in a breakout. US sanctions policy is not a convincing reason to sell the dollar in today’s context. Over the medium term dollar diversification poses a risk, although the dollar will still remain the single largest reserve currency over a long-term, strategic horizon. For further discussion see the Special Report by our Foreign Exchange Strategy and Geopolitical Strategy, “Is The Dollar’s Reserve Status Under Threat?” Given US domestic policy uncertainty in an election year, and foreign policy challenges, stay long defensive sectors, namely health care, over cyclical sectors. Tactically our renewable energy trade has dropped sharply. But cyclically it remains attractive, as our recent Special Report with our US Equity Strategy team demonstrates. If Congress fails to succeed in promoting its new climate and energy bill, then this trade could suffer bad news in the near term. Tactically US industrials can continue to outperform the tech sector, given the stagflationary context that is developing. Energy’s outperformance, especially relative to tech, is becoming stretched, at least from a cyclical point of view. But geopolitical trends suggest oil risks are still to the upside tactically. For now, maintain exposure to high energy prices by staying long energy small caps versus large caps and O&G transportation and storage. Matt Gertken Senior Vice President Chief US Political Strategist mattg@bcaresearch.com Strategic View Open Tactical Positions (0-6 Months) Open Cyclical Recommendations (6-18 Months) Table A2Political Risk Matrix
US Sanctions And The Market Impact
US Sanctions And The Market Impact
Table A3US Political Capital Index
US Sanctions And The Market Impact
US Sanctions And The Market Impact
Chart A1Presidential Election Model
US Sanctions And The Market Impact
US Sanctions And The Market Impact
Chart A2Senate Election Model
US Sanctions And The Market Impact
US Sanctions And The Market Impact
Table A4APolitical Capital: White House And Congress
US Sanctions And The Market Impact
US Sanctions And The Market Impact
Table A4BPolitical Capital: Household And Business Sentiment
US Sanctions And The Market Impact
US Sanctions And The Market Impact
Table A4CPolitical Capital: The Economy And Markets
US Sanctions And The Market Impact
US Sanctions And The Market Impact
According to BCA Research’s Foreign Exchange Strategy service, the answer to whether the carnage in the yen is in an apocalyptic phase depends on the time horizon. Daily traders, reconciling positions every few hours, should continue shorting the yen.…
Listen to a short summary of this report. Dear Client, In lieu of our weekly report next week, I will be hosting a webcast on Tuesday with my colleague Mathieu Savary, Chief European Strategist, on the implications of stagflation on European assets and global FX markets. I look forward to answering any questions you might have. Kind regards, Chester Executive Summary The Yen And Interest Rates
The Yen And Interest Rates
The Yen And Interest Rates
The Japanese yen is in liquidation. The historical evidence suggests waiting for an exhaustion in selling pressure, before placing fresh bets. This exhaustion is likely to occur once global bond yields stabilize (Feature chart), and energy price inflation abates. A move lower in these two key variables would catalyze an explosive rebound in the yen, on the back of very cheap valuations and a large net short speculative position. The Bank of Japan will not meaningfully pivot soon. The reason is that downside risks to the Japanese economy supersede the risk of an inflation overshoot. What Japan needs is stronger fiscal spending, that would offset deficient domestic demand. That said, Japan is also one of the best candidates for generating non-inflationary growth, a bullish backdrop for the currency. Our 2022 target for the yen is 110. Our sense is that most of the downside risks are well understood by markets, while upside surprises are much underappreciated. RECOMMENDATIONS INCEPTION LEVEL inception date RETURN Short chf/JPY 135 2022-04-21 - Bottom Line: The yen has undershot. According to our in-house PPP models, the Japanese currency is undervalued by 35%. Historically, an investor buying the yen at such undervalued levels has made 6% per year over the subsequent 5 years. Feature The yen’s move in recent weeks has been explosive. Since early March, the yen has collapsed by 11%, pushing USD/JPY from around 115 to a nudge below 130. Over the last year, the yen is down 16%. In retrospect, a chart formation since 1990 suggests this is a classic liquidation phase that is unlikely to reverse until fundamentals shift. The two key drivers of yen weakness have been higher global yields, and elevated energy prices. Chart 1 shows that the yen has been perfectly tracking the US 10-year Treasury yield. Yield curve control (YCC) is leading to a capitulation of both domestic and foreign investors, fleeing from Japanese bonds towards external bond markets. Looking out the curve, investors do not expect the Bank of Japan to lift rates higher than 50 bps until 2028 (Chart 2). Chart 1The Yen And Interest Rates
The Yen And Interest Rates
The Yen And Interest Rates
Chart 2The BoJ Is Expected To Stay Dovish
The BoJ Is Expected To Stay Dovish
The BoJ Is Expected To Stay Dovish
Meanwhile, higher energy costs are also putting selling pressure on the yen as merchants sell JPY to pay for more expensive imports in US dollars. Is Selling Pressure Exhausted? Chart 3A Technical Profile Of The Japanese Yen
A Technical Profile Of The Japanese Yen
A Technical Profile Of The Japanese Yen
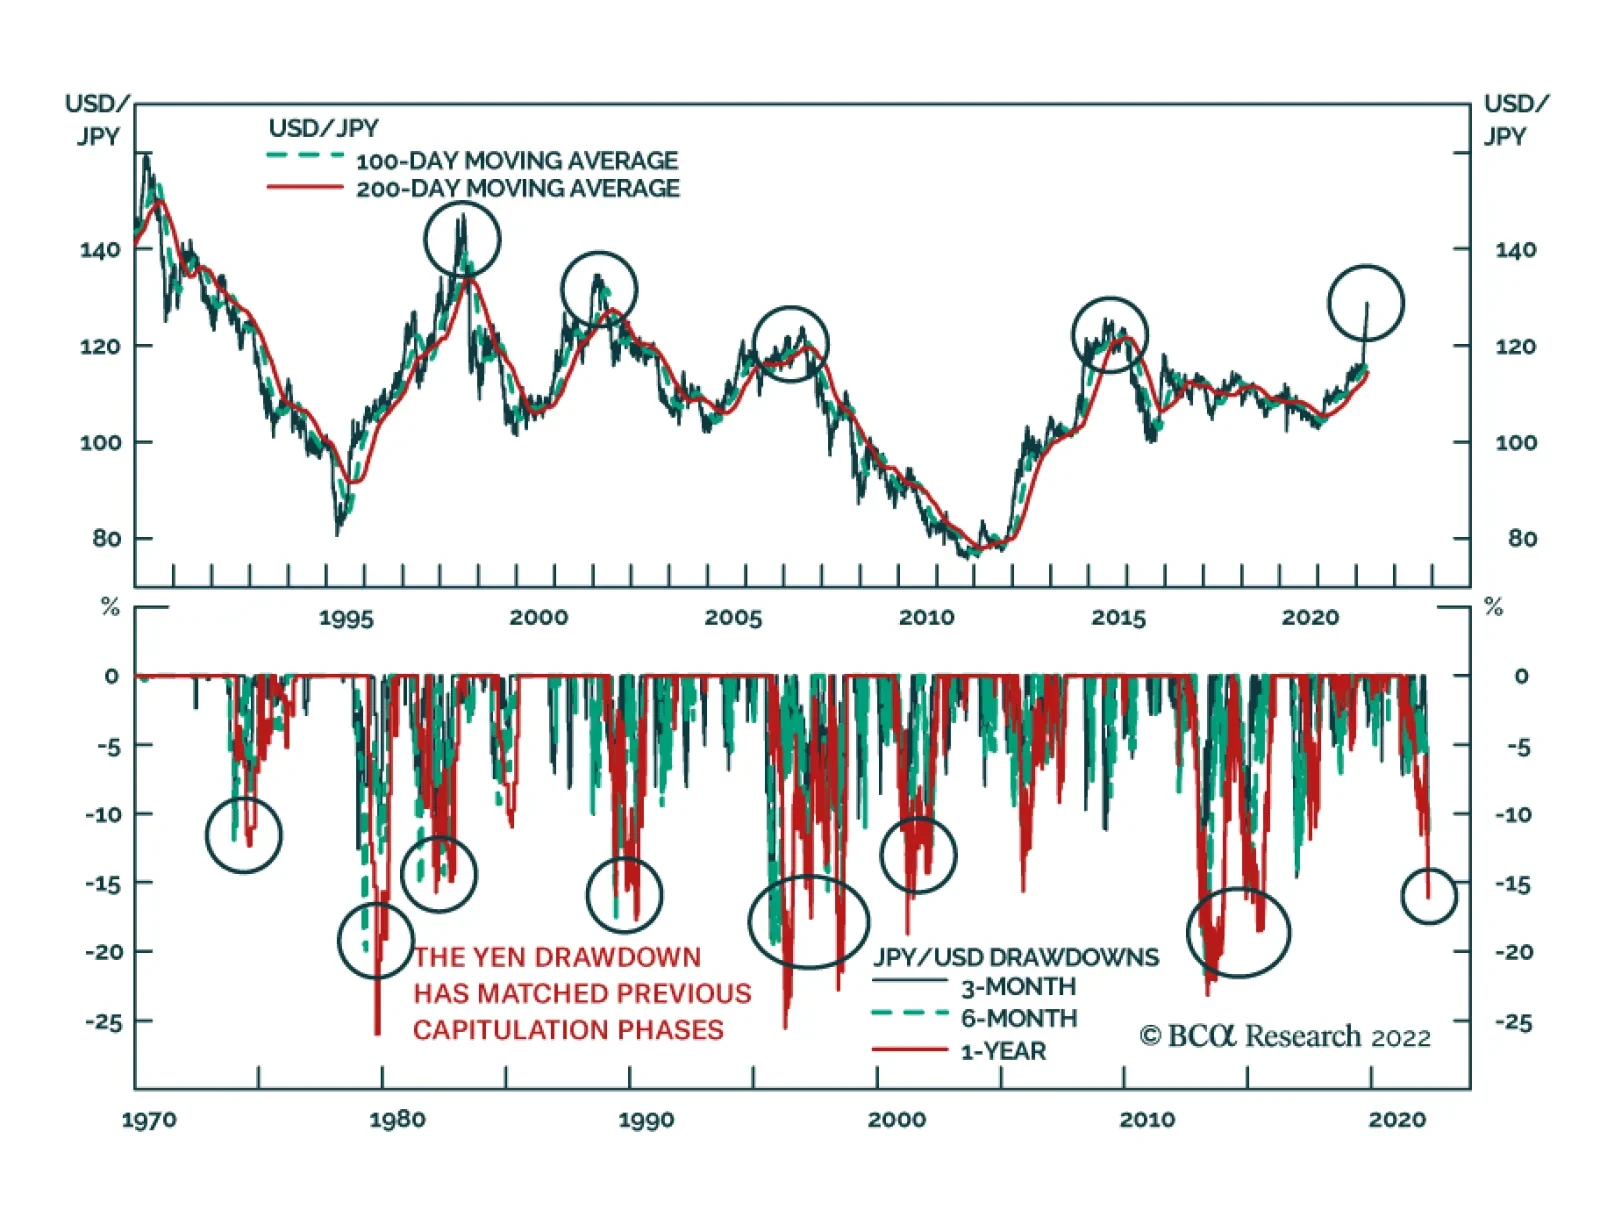
The key question for investors is whether the carnage in the yen is in an apocalyptic phase. The answer depends on the time horizon. Daily traders, reconciling positions every few hours, should continue shorting the yen. Exhaustion in selling pressure is likely to manifest itself through a few technical patterns, most notably, a consolidation phase. Chart 3 suggests that reversals in the yen have tended to pass through a period of indigestion, allowing investors enough time to play on a reversal. We are not there yet. That said, for longer-term investors, being contrarian could pay off handsomely. The 1-year drawdown in the yen is within the scope of historical capitulation phases (Chart 4). Since JPY became freely floating, selloffs have been around 15%-20% especially during major events (the Asian financial crisis or the manufacturing recession the last decade, for example). The last major selloff was around Abenomics in 2012, a pivotal event. Chart 4The Yen Drawdown Has Matched Previous Capitulation Phases
The Yen Drawdown Has Matched Previous Capitulation Phases
The Yen Drawdown Has Matched Previous Capitulation Phases
Speculators are also very short JPY and sentiment is quite depressed. This is bullish from a contrarian perspective. Low rates in Japan have led to the proliferation of carry trades. While these are likely to persist, the bulk of investors have already jumped on this bandwagon. A stabilization and/or reversal in US Treasury yields could flush out stale shorts in the yen (Chart 5). If, as we expect, the greenback does weaken in the second half of this year, that will also support the yen. Chart 5Sentiment On The Yen Is Very Depressed
Sentiment On The Yen Is Very Depressed
Sentiment On The Yen Is Very Depressed
Japan’s Economic Outlook The yen tends to appreciate when the Japanese economy is exiting a recession (Chart 6). Part of the reason why the yen has been so weak is because economic growth in Japan has been anemic. While the external sector has been benefiting from a global trade boom, the domestic sector has been under siege from the pandemic, until recently. Chart 6The Yen Tends To Rebound When The Japanese Economy Recovers
The Yen Tends To Rebound When The Japanese Economy Recovers
The Yen Tends To Rebound When The Japanese Economy Recovers
It is notable that while goods spending has been picking up around the world, the personal consumption component of GDP in Japan remains 5% below the pre-pandemic trend. Shinkansen passenger volumes are still down 42% this year after an even bigger collapse last year. Inbound tourists, a meaningful source of demand, has collapsed from about 25% of the overall Japanese population before the pandemic to zero today. These dire statistics are likely to reverse. The manufacturing PMI is ticking higher. The number of daily new COVID-19 cases has dramatically rolled over. This will be a welcome fillip to much subdued consumer and business sentiment. 2% Inflation = Mission Impossible? The BoJ is likely to get its wish of 2% inflation in the coming months. However, it will prove fleeting. The overarching theme for Japan is an aging and declining population which has put a lid on consumer prices (Chart 7). This will support real interest rates. Inflation does not tend to accelerate on the island until the output gap is fully closed. That has yet to occur. Meanwhile, the political push to cut mobile phone prices has been a drag on CPI. Mobile phone charges alone have cut around 1.2%-1.5% from the core core measure of Japanese inflation, according to the BoJ. This has been a structural trend. As a result, long-term inflation expectations in Japan remain anchored near 1%, even though the rest of the world is seeing a price boom (Chart 8). The revealed preference is for low/stable prices. Chart 7Demographics Are Weighing On Japanese##br##Inflation
Demographics Are Weighing On Japanese Inflation
Demographics Are Weighing On Japanese Inflation
Chart 8Long-Term Inflation Expectations In Japan Are Rising, But Muted
Long-Term Inflation Expectations In Japan Are Rising, But Muted
Long-Term Inflation Expectations In Japan Are Rising, But Muted
Clearly, the Bank of Japan would like this to change, as it aims for a persistent 2% inflation target. That said, it will be unable to adjust monetary settings aggressively. The BoJ already owns over 50% of Japanese government bonds, and that has made the market very illiquid. As a result, ownership as a share of GDP is nearing attrition (Chart 9). Related Report Foreign Exchange StrategyThe Yen In 2022 Arguably, the BoJ could widen the target band for yield curve control, while lowering short rates further below zero, but that is unlikely to do much for inflation expectations. It could also expand its 0% bank loan scheme beyond renewable industries, and/or small/medium-sized firms, but the problem in Japan is a lack of demand. The currency remains the sole policy lever for the BoJ. Unfortunately, for a small, open economy, the BoJ has less control over the currency. The Ministry of Finance last intervened to support the currency in 1998 (Chart 10). That helped the yen temporarily, but global factors dictated its longer-term trend. Intervention this time around will not assuage the whale of carry traders. Chart 9The BoJ Has Not Been Aggressively Buying Government Bonds
The BoJ Has Not Been Aggressively Buying Government Bonds
The BoJ Has Not Been Aggressively Buying Government Bonds
Chart 10The MoF Could Soon ##br##Intervene
The MoF Could Soon Intervene
The MoF Could Soon Intervene
A falling yen would allow some pass-through inflation, but this is unlikely to be sticky. The yen needs to fall 10% every year to generate 1% inflation in Japan (Chart 11). Meanwhile, a policy based on depreciating your currency could lead to a crisis of confidence, especially vis-à-vis Japanese trade partners. Our model for core core inflation suggests that all the weakness in the currency will only boost this print to 0.5% in the coming months (Chart 12). Chart 11Currency Weakness Will Only Temporarily Help Boost Inflation
Currency Weakness Will Only Temporarily Help Boost Inflation
Currency Weakness Will Only Temporarily Help Boost Inflation
Chart 12Core CPI Will Not Meaningfully ##br##Recover
Core CPI Will Not Meaningfully Recover
Core CPI Will Not Meaningfully Recover
What Japan needs is more fiscal spending. For a low-growth economy, with ultra-loose monetary settings, the fiscal multiplier tends to be much larger. Putting it all together, real rates are unlikely to fall very much in Japan. This is very positive for the yen in a world with deeply negative real rates. As demand recovers, and the Japanese economy generates non-inflationary growth, the currency should find a solid footing. Why Valuation Matters Chart 13The Yen Is Very Cheap
The Yen Is Very Cheap
The Yen Is Very Cheap
Japan is running a big trade deficit on the back of high energy prices. A cheap currency at least increases Japan’s competitiveness. This is particularly the case since the boom in external demand has been a much welcome cushion for Japanese growth. According to our PPP models, the Japanese yen is the cheapest G10 currency, undervalued by around 35% (Chart 13). Why valuations matter is because an investor who buys the yen today can expect to make 6% a year over the next half decade, based on the historical correlation between valuation and subsequent currency returns (Chart 14). This will especially be the case if Japanese inflation keeps lagging inflation in the US. As we argued at the beginning of this report, US yields will need to stabilize before long yen positions make sense on a tactical basis (Chart 15). Chart 14Valuation Matters For The Japanese Yen
Valuation Matters For The Japanese Yen
Valuation Matters For The Japanese Yen
Chart 15Global Yields Need To Stabilize For The Yen To Bounce
Global Yields Need To Stabilize For The Yen To Bounce
Global Yields Need To Stabilize For The Yen To Bounce
The Yen As A Safe Haven The yen still appears to have the best correlation with a rising VIX (Chart 16). In a world of slowing global growth and the potential for equity market turbulence, this bodes well for long yen positions. That said, the carry on this position will be unbearable especially if the Federal Reserve continues to sound hawkish. The better play on potential yen strength is a short CHF/JPY position. Historically, these currencies have tended to move together. However, more recently, the CHF has risen substantially versus the JPY, suggesting some mean reversion is due (Chart 17). Chart 16The Yen Remains A Good Hedge
The Yen Remains A Good Hedge
The Yen Remains A Good Hedge
Chart 17Go Short CHF/JPY
Go Short CHF/JPY
Go Short CHF/JPY
Strategically, we were stopped out of our short USD/JPY position at 128, initiated at 124. Our 2022 target for the yen is 110. Our sense is that most of the downside risks are well understood by markets, while upside surprises are much underappreciated. Tactically, we will wait for the consolidation phase we outlined earlier in this report, before initiating fresh positions. Chester Ntonifor Foreign Exchange Strategist chestern@bcaresearch.com Trades & Forecasts Strategic View Cyclical Holdings (6-18 months) Tactical Holdings (0-6 months) Limit Orders Forecast Summary
Executive Summary After having overspent on goods ex-autos over the past two years and experiencing contracting incomes in real terms, US and European households will reduce their purchases of goods ex-autos. Risks to global growth stemming from China remain to the downside. Leading indicators from Asia and global financial markets are signaling a contraction in global trade. Yet, US core inflation will not drop below 4% for the rest of this year. Consequently, the Fed will likely end up hiking rates and sounding hawkish amidst a major global trade slump. This will give rise to stagflation anxiety among investors and will be negative for global risk assets in general and EM equities, currencies and credit markets in particular. The yuan is breaking down versus the US dollar. A weaker RMB will pull down Emerging Asian as well as other EM currencies. Does This Divergence From A Historic Correlation Signify Stagflation?
Does This Divergence From A Historic Correlation Signify Stagflation?
Does This Divergence From A Historic Correlation Signify Stagflation?
Bottom Line: Global equity and credit portfolios should remain defensive and continue underweighting EM. Currency investors should be positioned for another upleg in the US dollar and a downleg in EM currencies. Feature The volume of global trade is about to contract. Meantime, US inflation will remain well above the Fed’s target. This combination will produce stagflation anxiety among investors. It is impossible to know whether stagflation will be a long-lasting phenomenon in the real economy. In our view, the stagflation narrative will dominate global financial markets in the coming months. This heralds a cautious stance on global and EM risk assets. The slowdown in global manufacturing and trade will be pervasive and broad-based but will exclude auto production. The latter will in fact recover as chip/input shortages ease. The main drivers of the slowdown are (1) a mean reversion in US and European demand for goods ex-autos; (2) China’s economic woes and (3) moribund domestic demand in mainstream EM. Shrinking DM Household Demand For Goods ex-Autos Chart 1DM Household Demand For Goods ex-Autos Will Experience Mean Reversion
DM Household Demand For Goods ex-Autos Will Experience Mean Reversion
DM Household Demand For Goods ex-Autos Will Experience Mean Reversion
After having overspent on goods ex-autos over the past two years and experiencing contracting income in real terms (after adjusting for inflation), US and European households will reduce their purchases of goods ex-autos. US and European consumption of goods ex-autos exploded at the onset of the pandemic two years ago and has stayed robust until now. Chart 1 illustrates that since mid-2020, the consumption of goods ex-autos was running well above its trend, which signifies excessive demand over the past two years. Such excessive demand has led to bottlenecks and shortages, giving producers an opportunity to hike prices. In a nutshell, inflation in tradable goods in the past 18 months was primarily driven by demand, not supply constraints. A portion of future goods consumption has been pulled forward, which implies that household demand for these goods has become saturated. Moreover, as the pandemic subsides, consumers are shifting their spending from goods to services. These dynamics could create an air pocket in the demand for certain goods. Chart 2DM Household Real Incomes Are Contracting
DM Household Real Incomes Are Contracting
DM Household Real Incomes Are Contracting
Critically, US and European household income is contracting in real terms (Chart 2). Wage growth has not kept up with the surge in inflation. Due to shrinking disposable real income, consumers in advanced economies will curtail their consumption of discretionary items, primarily goods ex autos on which they have overspent during the past two years. Bottom Line: Demand for goods ex-autos will shrink in advanced economies in the next 6-12 months. This will weigh on global merchandise trade. China’s Trilemma Chinese authorities are facing an “impossible trinity” in their attempts to simultaneously achieve three objectives: (1) pursuing the dynamic zero-Covid policy, (2) delivering decent economic growth, and (3) not resorting to “irrigation-style” massive stimulus. We do not think all three objectives can be achieved. China’s economy was struggling prior to the recent lockdowns. The COVID-related restrictions have only made matters worse and have weighed heavily on economic activities and household income. Domestic orders for industrial enterprises plunged below 50, i.e., they are in contraction territory (Chart 3). These surveys, released on March 30-31, were not affected by the Shanghai lockdowns, which have proliferated since March 28. Exports orders are also contracting (Chart 4). Chart 3China: Domestic Orders Were Plunging Prior To Lockdowns
China: Domestic Orders Were Plunging Prior To Lockdowns
China: Domestic Orders Were Plunging Prior To Lockdowns
Chart 4China: Exports Are Set To Contract
China: Exports Are Set To Contract
China: Exports Are Set To Contract
Further, China’s import and export volumes were contracting in January – prior to the Ukraine war and the recent lockdowns. Notably, Chart 5 highlights that prior to the recent lockdowns, import weakness was broad-based, including commodities, machinery and semiconductors. In particular, total imports in USD are flat in March compared to a year ago. With commodity prices up significantly, it is clear that import volumes in March have shrunken substantially. National disposable income per capita was growing at about 6% in nominal terms before the lockdowns (Chart 6, top panel). Household mortgage growth had decelerated considerably before lockdowns became widespread (Chart 6, bottom panel). Chart 5Chinese Imports Were Shrinking Before Lockdowns
Chinese Imports Were Shrinking Before Lockdowns
Chinese Imports Were Shrinking Before Lockdowns
Chart 6China: Household Income And Mortgage Borrowing
China: Household Income And Mortgage Borrowing
China: Household Income And Mortgage Borrowing
As the lockdowns wreak havoc on the economy and household income, and with the government not providing direct transfers to the population, household consumption will be severely affected in the months ahead. The property market remains in the doldrums and is unlikely to recover soon. As we have highlighted in previous reports, structural headwinds, continue to weigh down on the property market. Since 2009, there has been no business cycle recovery in China without the real estate market playing the leading role. Residential floor space sold was down by 20% in Q1 from a year ago (Chart 7, top panel). House prices have begun deflating in tier-3 cities. Deflation will likely spread to tier-1 and -2 cities due to a pandemic-driven decline in income and confidence. Critically, the plunge in property developers’ financing entails shrinkage in housing completion (construction work) (Chart 7, bottom panel). The latter has so far held up as authorities have been forcing developers to use their limited financing to complete projects that they had already started. The massive issuance of local government bonds will spur an acceleration in infrastructure spending. China’s government gave the green light already this year to infrastructure projects worth nearly 70% of what was allowed for the whole of last year. Yet, this might be insufficient to produce a rapid business cycle recovery in an environment of rolling lockdowns and with other segments of the economy facing challenges. Related Report Emerging Markets StrategyGlobal Semi Stocks: More Downside Given these negative forces, the Chinese economy requires massive government stimulus in the form of direct transfers to households and SMEs – as the US offered in the spring of 2020. Yet, it does not seem that the government is rushing to provide such direct and significant stimulus. In our opinion, the policy stimulus measures announced so far by the government fall short of what is required to lift the economy. Policymakers are neither ready to abandon the dynamic zero-Covid policy nor provide “irrigation-type” stimulus, especially for households and the property market. With these two constraints, economic growth in China is set to underwhelm. Bottom Line: Risks to global growth stemming from China remain to the downside. In EM ex-China, ongoing fiscal tightening, monetary tightening in LATAM and feeble household income growth in India and ASEAN will all cap consumer spending and business investment (Chart 8). Chart 7China: Property Construction Is Set To Shrink
China: Property Construction Is Set To Shrink
China: Property Construction Is Set To Shrink
Chart 8EM ex-China: Domestic Demand Will Remain Sluggish
EM ex-China: Domestic Demand Will Remain Sluggish
EM ex-China: Domestic Demand Will Remain Sluggish
Signs Of A Global Trade Contraction There is already evidence to suggest that a major relapse in global manufacturing and trade is beginning: Taiwanese shipments to China are dipping into negative territory, and they lead global exports (Chart 9). Taiwanese exports to China are a good leading indicator of global trade dynamics because mainland producers order inputs from Taiwan first before they produce final goods for export. When producers located in China order less inputs, they evidently expect less in the way of production and shipments. Korea’s business survey of exporting companies indicates a substantial deterioration in their business conditions in April (Chart 10). This points to a major slump in the nation’s exports and, hence, global trade. Chart 9Global Trade Is Set To Contract
Global Trade Is Set To Contract
Global Trade Is Set To Contract
Chart 10Korean Exporters Are Downgrading Their Expectations
Korean Exporters Are Downgrading Their Expectations
Korean Exporters Are Downgrading Their Expectations
Korean and Japanese non-financial share prices have plunged despite considerable currency depreciation, which is typically positive for their competitiveness. As many of these non-financial companies are major exporters, this development points to a major downtrend in global trade. Global cyclicals have been underperforming global defensives. This dynamic has historically been a good leading indicator for the global industrial downturn (Chart 11). Finally, early cyclical stocks in the US have sold off and have substantially underperformed domestic defensives (Chart 12). This also points to a slowdown in US growth. Chart 11Global Equity Sector Performance Points To A Relapse In Global Manufacturing
Global Equity Sector Performance Points To A Relapse In Global Manufacturing
Global Equity Sector Performance Points To A Relapse In Global Manufacturing
Chart 12Beware Of A Relapse in US Early Cyclical Stocks
Beware Of A Relapse in US Early Cyclical Stocks
Beware Of A Relapse in US Early Cyclical Stocks
Bottom Line: Leading indicators from Asian economies and global financial markets are signaling that global trade will experience a contraction and global growth will slow. Inflation Amid A Global Trade Contraction? Chart 13US Wages Are Surging in Nominal Terms Yet Shrinking In Real Terms
US Wages Are Surging in Nominal Terms Yet Shrinking In Real Terms
US Wages Are Surging in Nominal Terms Yet Shrinking In Real Terms
A natural question is why worry about inflation when global trade volumes will be contracting? The primary source of anxiety in this context is US inflation and the Fed’s tightening. A decline in global trade will not be enough to bring down US core inflation substantially. By contrast, China and Asia do not face an inflation problem. US inflation worries will persist, and the Fed will likely continue to hike rates and sound hawkish for the following reasons: First, US capital expenditures by companies and household spending on services will remain robust. US services make up a larger share of the American economy and employment than do goods-producing sectors. Hence, we do not expect a broad-based recession in the US this year. Second, as we have previously noted, the US has a genuine inflation problem. American wages are accelerating, and a tight labor market will push up wage growth above 5-6% (Chart 13, top panel). Importantly, real wages in the US have contracted (Chart 13, bottom panel). Faced with a decline in purchasing power, employees will demand higher wages. The tight labor market raises the odds that companies will likely accommodate higher wages. Chart 14Unit Labor Costs Are The Key To Core Inflation
Unit Labor Costs Are The Key To Core Inflation
Unit Labor Costs Are The Key To Core Inflation
Given that US productivity growth is no more than 1.5-2%, wage growth over 5-6% means that unit labor costs will be rising by more than 3-4%. This will prevent core inflation from falling a lot. Unit labor costs have historically been the main driver of core inflation in the US (Chart 14). Finally, inflation is a lagging and inert phenomenon. It takes a long time (more than six to nine months) of sub-par growth for inflation to subside. Odds are that even though global trade volumes will be contracting, the Fed will continue hiking rates and sounding hawkish because US inflationary pressures will remain acute. Bottom Line: Annual core CPI inflation will drop in the US due to the base effect and a drop in some goods prices. Yet, we expect core CPI and PCE to remain above 4% for the rest of this year. Underlying inflationary pressures have spilled over into the labor market, and the wage-price spiral has probably unraveled. Therefore, inflation cannot be reduced meaningfully without bringing economic growth down below potential growth and weakening the labor market for a few quarters. Investment Implications Shrinking global trade volumes and a hawkish Fed are bearish for global risk assets in general and EM equities, currencies and credit markets in particular. Contracting exports and a hawkish Fed are negative for the Chinese yuan and other Asian currencies. The CNY/USD exchange rate has broken below its 200-day moving average and odds are that it will depreciate further (Chart 15). Our target for CNY/USD is 6.7. The broad trade-weighted US dollar has more upside and EM currencies will depreciate. Chart 16 illustrates that investors’ net long positions in ZAR, BRL and MXN are high. Chart 15The RMB Is Breaking Down
The RMB Is Breaking Down
The RMB Is Breaking Down
Chart 16Investors Are Long EM Commodity Currencies
Investors Are Long EM Commodity Currencies
Investors Are Long EM Commodity Currencies
Our recommended currency shorts for now are ZAR, PHP, IDR, COP, HUF, PEN and PLN. Global equity and credit portfolios should continue underweighting EM. Notably, global defensive equity sectors have been outperforming non-TMT stocks despite rising US/global bond yields (Chart 17). This is a major departure from the historical relationship and likely signifies a period of slower global growth ahead but continuous Fed tightening. Global equity managers should favor defensive stocks. Chart 17Does This Divergence From A Historic Correlation Signify Stagflation?
Does This Divergence From A Historic Correlation Signify Stagflation?
Does This Divergence From A Historic Correlation Signify Stagflation?
For EM equity managers, we also recommend favoring defensive sectors like consumer staples. Presently, our country overweights are Korea, Singapore, Chinese A-shares, Mexico and Brazil. Our underweights are India, Central Europe, Indonesia, Turkey, South Africa, Colombia and Peru. In local rates, we continue recommending receiving Chinese and Malaysian 10-year swap rates, a long position in Brazilian 10-year bonds, betting on yield curve flattening in Mexico and paying Polish 10-year swap rates while receiving Czech 10-year swap rates. Arthur Budaghyan Chief Emerging Markets Strategist arthurb@bcaresearch.com
A Whiff Of Stagflation?
A Whiff Of Stagflation?
A Whiff Of Stagflation?
A Whiff Of Stagflation?
Executive Summary In this first of a regular series of ‘no holds barred’ conversations with a concerned client we tackle the hot topic of inflation. Month-on-month US core inflation has already peaked, 12-month US core inflation is about to peak, and demand destruction will ultimately pull down headline inflation too. Given modest and slowing growth in unit labour costs, there is no imminent risk of a wage-price spiral. Surging inflation expectations are just capturing the frothiness in inflation protected bond prices that massive hedging demand is creating. This recent massive demand for inflation hedges such as inflation protected bonds and commodities will recede and take the frothiness out of their prices. On a 6-12 month horizon, underweight inflation protected bonds and commodities… …overweight conventional bonds and stocks… …and tilt towards healthcare and biotech. The Performance Of Inflation Protected Bonds Versus Conventional Bonds Just Tracks The Oil Price
The Performance Of TIPS Versus T-Bonds Is Just A Play On The Oil Price
The Performance Of TIPS Versus T-Bonds Is Just A Play On The Oil Price
Bottom Line: US core inflation is about to peak, demand destruction will ultimately pull down headline inflation, and there is no imminent risk of a wage-price spiral. On a 6-12 horizon, overweight stocks and conventional bonds versus commodities and inflation protected bonds. Feature Welcome to the first of a regular series of Counterpoint reports that takes the form of a ‘no holds barred’ conversation with a concerned client. Roughly once a month, our open and counterpoint conversations will address a major question or concern for investors. This inaugural conversation tackles the hot topic of inflation. On Peak Inflation Client: Thank you for addressing my worries. Like many people right now, I am concerned about inflation. My first question is, when is inflation going to peak? CPT: The good news is that, in an important sense, inflation has already peaked. Month-on-month core inflation in the US reached a high of 0.9 percent through April-June last year. In the more recent pickup through October-January it reached a ‘lower peak’ of 0.6 percent. And in March it dropped to 0.3 percent. Client: Ok, but inflation usually refers to the 12-month inflation rate – when will that peak? CPT: The 12-month inflation rate is just the sum of the last twelve month-on-month rates. So, when the big numbers of April-June of last year drop off to be replaced by the smaller numbers of April-June of this year, the 12-month inflation rate will fall sharply (Chart I-1). Chart I-1Month-On-Month Core Inflation Has Already Peaked, And 12-Month Core Inflation Is About To Peak
Month-On-Month Core Inflation Has Already Peaked, And 12-Month Core Inflation Is About To Peak
Month-On-Month Core Inflation Has Already Peaked, And 12-Month Core Inflation Is About To Peak
Client: Even if the 12-month inflation rate does peak soon, it will still be far too high. When will it return to the 2 percent target? CPT: In the pandemic era, monthly core inflation has been non-linear. Meaning it has been either ‘high-phase’ of 0.5 percent and above, or ‘low-phase’ of 0.3 percent and below. In March it returned to low-phase. If it stays in low-phase, then as an arithmetic identity, the 12-month core inflation rate will be close to its target twelve months from now. Client: So far, you have just talked about core inflation which excludes energy and food prices. What about headline inflation? Specifically, isn’t the Ukraine crisis a massive supply shock for Russian and Ukrainian sourced energy and food? Demand destruction will ultimately pull down headline inflation too. CPT: Yes, headline inflation may take longer to come down than core inflation. But supply shocks ultimately resolve themselves through demand destruction. Client: Could you elaborate on that? CPT: Sure. With fuel and food prices surging, many people are asking: do I really need to make that journey? Do I really need to keep the heating on? Can I buy a cheaper loaf of bread? So, they will cut back, and to the extent that they can’t cut back on energy and food, demand for other more discretionary items will come down, and eventually weigh on prices. Client: At the same time, the pandemic is still raging – look at what’s happening in Shanghai right now. Won’t further disruptions to supply chains just add further fuel to inflation? CPT: Yes, but to repeat, inflation that is entirely due to a supply shock ultimately resolves itself through demand destruction. On The Source Of The Inflation Crisis Client: I am puzzled. If supply shock generated inflation resolves itself, then what has caused the post-pandemic inflation to be anything but ‘transitory’? CPT: The simple answer is the pandemic’s draconian lockdowns combined with massive handouts of government cash unleashed a massive demand shock. But it wasn’t a shock in the magnitude of demand, it was a shock in the distribution of demand (Chart I-2). Chart I-2The Pandemic's Draconian Lockdowns Combined With Massive Government Stimulus Unleashed A Massive Shock In The Distribution Of Demand
The Pandemic's Draconian Lockdowns Combined With Massive Government Stimulus Unleashed A Massive Shock In The Distribution Of Demand
The Pandemic's Draconian Lockdowns Combined With Massive Government Stimulus Unleashed A Massive Shock In The Distribution Of Demand
Client: Could you explain that? CPT: Well, we were all locked at home and flush with government supplied cash, and we couldn’t spend the cash on services. So, we spent it on what we could spend it on – namely, durable goods. This created a massive shock in the distribution of demand, out of services whose supply could easily adjust downwards, and into goods whose supply could not easily adjust upwards. Client: Can you give me some specific examples? CPT: Sure. Airlines could cut back their flights, but auto manufacturers couldn’t make more cars. So, airfares didn’t collapse but used car prices went vertical! The result being the surge in inflation. Client: Do you have any more evidence? Inflation is highest in those economies where the cash handouts and furlough schemes were the most generous, like the US and the UK. CPT: Yes, the three separate surges in month-on-month core inflation all occurred after surges in durable goods demand (Chart I-3). Additionally, inflation is highest in those economies where the cash handouts and furlough schemes were the most generous – like the US and the UK. Chart I-3The Three Surges In Month-On-Month Core Inflation All Occurred After Surges In Durable Goods Demand
The Three Surges In Month-On-Month Core Inflation All Occurred After Surges In Durable Goods Demand
The Three Surges In Month-On-Month Core Inflation All Occurred After Surges In Durable Goods Demand
Client: If we get more waves of Covid, what’s to stop all this happening again? CPT: Nothing, so we should be vigilant. That said, we now have coping strategies for Covid that do not necessitate massive handouts of government cash. Also, we have already binged on durable goods, making it much harder to repeat that trick. On Wages And Inflation Expectations Client: I am still worried that if workers can negotiate much higher wages in response to higher prices, then it would threaten a wage-price spiral. CPT: Agreed, but it is technically incorrect to focus on wage inflation. The correct metric to focus on is unit labour cost inflation – which is wage growth in excess of productivity growth. In the US, this was 3.5 percent through 2021, slowing to just a 0.9 percent annual rate in the fourth quarter. So, it is not flashing danger, at least yet. Client: Ok, but what about the surge in inflation expectations. Isn’t that flashing danger? CPT: We should treat inflation expectations with a huge dose of salt, as they simply track the oil price, and therefore provide a nonsensical prediction of future inflation! (Chart I-4) Chart I-4The Tight Relationship Between The Oil Price And Inflation Expectations Is Intuitive, Appealing... And Nonsense
The Tight Relationship Between The Oil Price And Inflation Expectations Is Intuitive, Appealing... And Nonsense
The Tight Relationship Between The Oil Price And Inflation Expectations Is Intuitive, Appealing... And Nonsense
Client: What can explain this nonsense? CPT: Simply that when the oil price is high, investors flood into inflation hedges such as inflation protected bonds. So, the surge in inflation expectations is just capturing the frothiness in inflation protected bond prices that this massive hedging demand is creating. We can see similar frothiness in some commodity prices. The recent massive demand for inflation hedges such as inflation protected bonds and commodities will recede and take the frothiness out of their prices. Client: How so? CPT: Well to the extent that commodity prices drive headline inflation, the apples-for-apples relationship should be between commodity price inflation and headline inflation, and this is what we generally see (Chart I-5). But recently, this relationship has broken down and instead we see a tighter relationship between headline inflation and commodity price levels (Chart I-6 and Chart I-7). The likely causality here is that, just as for inflation protected bonds, massive inflation hedging demand has created frothiness in some commodity prices. Chart I-5Commodity Price Inflation Usually Drives Headline Inflation, But Recently The Relationship Broke Down
Commodity Price Inflation Usually Drives Headline Inflation, But Recently The Relationship Broke Down
Commodity Price Inflation Usually Drives Headline Inflation, But Recently The Relationship Broke Down
Chart I-6Recently, We See A Weak Relationship Between Commodity Price Inflation And Headline Inflation...
Recently, We See A Weak Relationship Between Commodity Price Inflation And Headline Inflation...
Recently, We See A Weak Relationship Between Commodity Price Inflation And Headline Inflation...
Chart I-7...But A Tight Relationship Between Headline Inflation And Commodity Price Levels
...But A Tight Relationship Between Headline Inflation And Commodity Price Levels
...But A Tight Relationship Between Headline Inflation And Commodity Price Levels
On The Investment Implications Client: To sum up your view then, month-on-month US core inflation has already peaked, 12-month US core inflation is about to peak, and demand destruction will ultimately pull down headline inflation. Given modest and slowing growth in unit labour costs, there is no imminent risk of a wage-price spiral, and surging inflation expectations are just capturing the frothiness in inflation protected bond prices that massive hedging demand is creating. What does this view mean for investment strategy? On a 6-12 horizon, overweight stocks and conventional bonds versus commodities and inflation protected bonds. CPT: Well given that inflation is peaking, one obvious implication is that the massive demand for inflation hedges will recede and take the frothiness out of their prices. On a 6-12 month horizon this means underweighting inflation protected bonds and commodities (Chart I-8). Chart I-8The Performance Of Inflation Protected Bonds Versus Conventional Bonds Just Tracks The Oil Price
The Performance Of Inflation Protected Bonds Versus Conventional Bonds Just Tracks The Oil Price
The Performance Of Inflation Protected Bonds Versus Conventional Bonds Just Tracks The Oil Price
Client: What about the surge in bond yields – when will that reverse? CPT: Empirically, we have seen that bond yields turn just ahead of the turn in the 12-month core inflation rate. Hence, on a 6-12 month horizon this means overweighting bonds. Client: Finally, what does all this mean for stock markets? CPT: The weakness of stock markets this year has been entirely due to falling valuations, rather than falling profits. If the headwind to valuations from rising bond yields turns into a tailwind from falling bond yields, it will boost stocks – especially long-duration stocks with relatively defensive profits. On a 6-12 month horizon this means overweighting stocks, and our favourite sectors are healthcare and biotech. Client: Thank you very much for this open and counterpoint conversation. Fractal Trading Watchlist Due to the Easter holidays, there are no new trades this week. However, the full updated watchlist of 20 investments that are experiencing or approaching turning points is available on our website: cpt.bcaresearch.com Chart 1The Strong Trend In The 18-Month-Out US Interest Rate Future Is Fragile
The Strong Trend In The 18-Month-Out US Interest Rate Future Is Fragile
The Strong Trend In The 18-Month-Out US Interest Rate Future Is Fragile
Chart 2The Strong Trend In The 3 Year T-Bond Is Fragile
The Strong Trend In The 3 Year T-Bond Is Fragile
The Strong Trend In The 3 Year T-Bond Is Fragile
Chart 3AUD/KRW Is Vulnerable To Reversal
AUD/KRW Is Vulnerable To Reversal
AUD/KRW Is Vulnerable To Reversal
Chart 4Canada Versus Japan Is Vulnerable To Reversal
Canada Versus Japan Is Vulnerable To Reversal
Canada Versus Japan Is Vulnerable To Reversal
Chart 5Canada's TSX-60's Outperformance Might Be Over
Canada's TSX-60's Outperformance Might Be Over
Canada's TSX-60's Outperformance Might Be Over
Chart 6US Healthcare Providers Vs. Software At Risk of Reversal
US Healthcare Providers Vs. Software At Risk of Reversal
US Healthcare Providers Vs. Software At Risk of Reversal
Chart 7Bitcoin's 65-Day Fractal Support Is Holding For Now
Bitcoin's 65-Day Fractal Support Is Holding For Now
Bitcoin's 65-Day Fractal Support Is Holding For Now
Chart 8A Potential Switching Point From Tobacco Into Cannabis
A Potential Switching Point From Tobacco Into Cannabis
A Potential Switching Point From Tobacco Into Cannabis
Chart 9Biotech Is A Major Buy
Biotech Is A Major Buy
Biotech Is A Major Buy
Chart 10CAD/SEK Reversal Has Started
CAD/SEK Reversal Has Started
CAD/SEK Reversal Has Started
Chart 11Financials Versus Industrials To Reverse
Financials Versus Industrials To Reverse
Financials Versus Industrials To Reverse
Chart 12Norway's Outperformance Could End
Norway's Outperformance Could End
Norway's Outperformance Could End
Chart 13Greece's Brief Outperformance To End
Greece's Brief Outperformance To End
Greece's Brief Outperformance To End
Chart 14BRL/NZD At A Resistance Point
BRL/NZD At A Resistance Point
BRL/NZD At A Resistance Point
Chart 15The Outperformance Of Resources Versus Healthcare Is Vulnerable To Reversal
The Outperformance Of Resources Versus Healthcare Is Vulnerable To Reversal
The Outperformance Of Resources Versus Healthcare Is Vulnerable To Reversal
Chart 16The Outperformance Of Resources Versus Biotech Is Vulnerable To Reversal
The Outperformance Of Resources Versus Biotech Is Vulnerable To Reversal
The Outperformance Of Resources Versus Biotech Is Vulnerable To Reversal
Chart 17Cotton's Outperformance Is Vulnerable To Reversal
Cotton's Outperformance Is Vulnerable To Reversal
Cotton's Outperformance Is Vulnerable To Reversal
Chart 18US Homebuilders' Underperformance Is At A Potential Turning Point
US Homebuilders' Underperformance Is At A Potential Turning Point
US Homebuilders' Underperformance Is At A Potential Turning Point
Chart 19Fractal Trading Watch List
Fractal Trading Watch List
Fractal Trading Watch List
Chart 20Fractal Trading Watch List
Fractal Trading Watch List
Fractal Trading Watch List
Dhaval Joshi Chief Strategist dhaval@bcaresearch.com Fractal Trading System Fractal Trades
Conversation With A Concerned Client: On Inflation
Conversation With A Concerned Client: On Inflation
Conversation With A Concerned Client: On Inflation
Conversation With A Concerned Client: On Inflation
6-Month Recommendations Structural Recommendations Closed Fractal Trades Indicators To Watch - Bond Yields Chart II-1Indicators To Watch - Bond Yields - Euro Area
Indicators To Watch - Bond Yields - Euro Area
Indicators To Watch - Bond Yields - Euro Area
Chart II-2Indicators To Watch - Bond Yields - Europe Ex Euro Area
Indicators To Watch - Bond Yields - Europe Ex Euro Area
Indicators To Watch - Bond Yields - Europe Ex Euro Area
Chart II-3Indicators To Watch - Bond Yields - Asia
Indicators To Watch - Bond Yields - Asia
Indicators To Watch - Bond Yields - Asia
Chart II-4Indicators To Watch - Bond Yields - Other Developed
Indicators To Watch - Bond Yields - Other Developed
Indicators To Watch - Bond Yields - Other Developed
Indicators To Watch - Interest Rate Expectations Chart II-5Indicators To Watch - Interest Rate Expectations
Indicators To Watch - Interest Rate Expectations
Indicators To Watch - Interest Rate Expectations
Chart II-6Indicators To Watch - Interest Rate Expectations
Indicators To Watch - Interest Rate Expectations
Indicators To Watch - Interest Rate Expectations
Chart II-7Indicators To Watch - Interest Rate Expectations
Indicators To Watch - Interest Rate Expectations
Indicators To Watch - Interest Rate Expectations
Chart II-8Indicators To Watch - Interest Rate Expectations
Indicators To Watch - Interest Rate Expectations
Indicators To Watch - Interest Rate Expectations
Listen to a short summary of this report. Executive Summary The Currency And Interest Rates: On A Collision Course?
The Currency And Interest Rates: On A Collision Course?
The Currency And Interest Rates: On A Collision Course?
The dip in the Swedish krona has priced in a recession in the domestic economy. If a contraction does indeed occur, the impact on the currency is already a fait accompli. If it does not, the currency is poised for a coiled spring rebound. Fundamentally, the krona is cheap, and there is a dearth of SEK bulls, which is positive from a contrarian perspective. The Riksbank’s mandate is price stability. Given inflationary pressures and a weak currency, the Riksbank will have no choice but to turn more hawkish or lose credibility (Feature chart). There is potential for a brewing demand boom in Sweden – via refugees from Ukraine and Russia – that would increase government outlays and strengthen the need for higher rates. Admittedly, catalysts for SEK weakness remain in place – geopolitical tensions, rising energy costs and a stampede into safe-haven assets, including the dollar. Our strategy therefore is to buy on dips. We could be on the precipice of a capitulation phase that will present investors with an opportunity to accumulate the SEK at a fire-sale price. RECOMMENDATIONS INCEPTION LEVEL inception date RETURN Short chf/sek 10.15 2022-04-14 0.27 Bottom Line: Sweden is a small, open economy, very sensitive to global economic conditions. A recession is already priced by weakness in the SEK. Investors willing to tolerate volatility should buy the SEK on any further weakness. Feature Chart 1The SEK Tracks The DXY
The SEK Tracks The DXY
The SEK Tracks The DXY
The Riksbank has been one of the more dovish central banks, both within the G10 and globally. Policy rates in Sweden are still at the zero bound, while they are rising in many other countries. In the Riksbank’s latest monetary policy report, domestic inflationary pressures were characterized as transitory. As such, the repo rate would not be raised until the second half of 2024. The consequence of the Riksbank’s dovishness has been weakness in the Swedish krona, and a steep rise in inflation expectations. Most central banks are admitting that emergency policy settings are no longer appropriate in the current environment, especially after unprecedented monetary and fiscal stimulus. Yet, Sweden remains in the dovish camp. In this report, we argue that the Riksbank will have to raise rates sooner rather than later to maintain credibility and fend off inflationary pressures. The result of the Riksbank’s easy monetary policy has been the proliferation of massive carry trades, as investors sell the SEK and buy the dollar and/or other higher yielding currencies (Chart 1). As a small open economy, this could potentially unanchor longer-term inflation expectations, via a weak currency. Why Should The Riksbank Hike Rates? Chart 2The SEK Has Priced A Swedish Recession
The SEK Has Priced A Swedish Recession
The SEK Has Priced A Swedish Recession
Sweden is likely to experience a technical recession in the coming quarters. The new orders-to-inventories ratio has contracted sharply, underscoring that the manufacturing sector will deflate (Chart 2). As a small, open economy, the manufacturing sector holds the key to the business cycle. Despite this, our bias is that the Riksbank will overlook the temporary dip in economic activity for the following reasons: The currency has already acted as a relief valve, which should cushion further downside in manufacturing activity (Chart 3). This is especially beneficial in a world where purchasing managers’ indices are declining everywhere. By the same token, the incentive for a central bank to raise rates when inflation is rising and the currency is more compelling, compared to a regime where a stronger currency tightens monetary conditions. Chart 4 shows that is weak is krona has been a fluid conduit for higher inflation in Sweden. A stronger krona will cap rising inflation expectations. Chart 3SEK Weakness Has Been A Welcome Relief Valve
SEK Weakness Has Been A Welcome Relief Valve
SEK Weakness Has Been A Welcome Relief Valve
Chart 4SEK Weakness = High Imported Inflation
SEK Weakness Equals High Imported Inflation
SEK Weakness Equals High Imported Inflation
It is remarkable that the traditional relationship between the SEK and oil prices (which is positive) has broken down (Chart 5). This is because rising oil prices usually reflect strong global demand, which benefits Sweden. This time around, a weak SEK is a tax on the economy as energy prices soar. Chart 5The Energy Shock To Sweden Has Been Unusual
The Energy Shock To Sweden Has Been Unusual
The Energy Shock To Sweden Has Been Unusual
The Chinese credit impulse has bottomed, which is historically a good sign that Swedish central bankers can tolerate a stronger currency (Chart 6). Sweden’s biggest trade surplus is with the US, which in turn has the biggest trade deficit with China (Chart 7). As such, the relationship between the Swedish krona and the Chinese credit impulse is tightly knit. China’s zero COVID-19 policy is generating huge supply bottlenecks that are affecting inter-oceanic supply chains, but the pent-up demand once that ends could be tectonic. Chart 6The SEK Tracks The Chinese Credit Impulse
The SEK Tracks The Chinese Credit Impulse
The SEK Tracks The Chinese Credit Impulse
Chart 7Sweden Needs The US And China
Sweden Needs The US And China
Sweden Needs The US And China
The Riksbank’s mandate is to manage inflation expectations. Inflation is at 6%. The Riksbank’s own measure of resource utilization is at a level that has typically been associated with a much higher repo rate. The output gap is closing, raising the risk of a wage inflation spiral (Chart 8). Simply put, the Riksbank would have to raise interest rates or engender a crisis of confidence in monetary policy. Chart 8A Taylor Rule Approach Suggests Interest Rates Are Too Low
A Taylor Rule Approach Suggests Interest Rates Are Too Low
A Taylor Rule Approach Suggests Interest Rates Are Too Low
Finally, house prices are surging to record highs, on the back of very low mortgage rates and extremely accommodative monetary policy (Chart 9). Chart 9Low Rates Have Led To A Debt Binge And Housing Boom
Low Rates Have Led To A Debt Binge And Housing Boom
Low Rates Have Led To A Debt Binge And Housing Boom
A Potential Demand Boom The unemployment rate in Sweden remains above pre-pandemic levels. More importantly, it might rise in the coming quarters, but that would not be particularly worrisome. The reason is a potential increase in the labor dividend in Sweden, as new entrants increase the size of the labor force. First, the employment component of the manufacturing PMI index suggests employment growth should remain around 2% or so. There has been a tight correlation between employment growth in Sweden and the purchasing managers’ survey of the employment outlook (Chart 10). In our view, there is good reason to expect employment growth to remain resilient and in turn, stimulate demand. Related Report Foreign Exchange StrategyThe Unsung Case For The Euro Sweden has a long history of openness towards immigration compared to many other European countries. If we go back to the Syrian crisis several years ago, the number of asylum seekers skyrocketed to over 160,000 or circa 1.5% of the total population (Chart 11). This was a huge labor dividend. This time around, migrants from both Ukraine and Russia will add to the skilled pool of domestic workers. Some estimates suggest there could be as many as 200,000 immigrants, just from the current crisis. This said, it will also increase frictional unemployment, as new migrants integrate into the labor force and adopt a new language. Chart 10Employment Is Holding Up In Sweden
Employment Is Holding Up In Sweden
Employment Is Holding Up In Sweden
Chart 11There Is Potential For A Huge Labor Dividend
There Is Potential For A Huge Labor Dividend
There Is Potential For A Huge Labor Dividend
Foreign-born workers have been rising as a share of the Swedish labor force and now constitute about 20% of the total population (Chart 12). This growth dividend will be reaped for years to come. With the Social Democrats in power, upside surprises to immigration numbers are within a reasonable confidence interval of outcomes. In a nutshell, Sweden enjoys a relatively positive demographic outlook (Chart 13). Chart 12Foreign Workers Are Important
Foreign Workers Are Important
Foreign Workers Are Important
Chart 13Sweden Has A Demographic Dividend
Sweden Has A Demographic Dividend
Sweden Has A Demographic Dividend
The inflow of migrants has a mixed impact on inflation. While there is downward pressure on wages, due to an increase of lower-paying jobs, there is still upward pressure on housing and consumption, notwithstanding a fiscal boost as the government spends more on social services. Meanwhile, the unemployment rate among foreign-born people is around 16.2%. This means that the Phillips curve is flat for the first few years, before it starts to steepen. The Riksbank clearly understands these dynamics, which is why over the prior years, its stance has been dovish even when the Swedish economy has been holding up well. The difference this time is that inflation is surging, and the potential for cost-push pressures to translate into demand-pull inflation (via higher wages) is rising in Sweden. In our view, Governor Stefan Ingves will renormalize policy as quickly as possible, given that he is managing a small open economy with one of the cheapest currencies in the G10 universe, with a large footprint of imported inflation. Trading Strategy Chart 14The Riksbank Will Have To Raise Rates
The Riksbank Will Have To Raise Rates
The Riksbank Will Have To Raise Rates
Our currency strategy is to buy the SEK on weakness. The recent dovish path by the ECB will mean that the Riksbank will tread very carefully in sounding too hawkish. However, every real-time indicator of its mandate suggests emergency policy settings are no longer necessary. Real rates are falling in Sweden relative to both the US and the euro area. As such, the SEK has not yet priced a shift in the Riksbank's policy setting. (Chart 14). This suggests that while the carry cost is high from being long the SEK at current levels, a capitulation phase will present investors with an opportunity to accumulate the SEK at a fire-sale price. As for Long EUR/SEK, the cross could overshoot, but will head lower on a 12–18-month horizon. Long SEK/CHF positions are also attractive. Chester Ntonifor Foreign Exchange Strategist chestern@bcaresearch.com Trades & Forecasts Strategic View Cyclical Holdings (6-18 months) Tactical Holdings (0-6 months) Limit Orders Forecast Summary
Executive Summary The unemployment rate in the US stands at 3.6%, 0.4 percentage points below the FOMC’s estimate of full employment. Historically, the Fed’s efforts to nudge up the unemployment rate have failed: The US has never averted a recession when the 3-month average of the unemployment rate has increased by more than a third of a percentage point. Despite this somber fact, there are reasons to think it will take longer for a recession to arrive than widely believed. Unlike in the lead-up to many past recessions, the US private sector is currently running a financial surplus. If anything, there are indications that both households and businesses are set to expand – rather than retrench – spending over the coming quarters. Investors should pay close attention to the housing market. As the most interest-rate sensitive sector of the economy, it will dictate the degree to which the Fed can raise rates. The US housing market has cooled, but remains in reasonably good shape, supported by rising incomes and low home inventories. Stocks will likely rise modestly over the next 12 months as inflation temporarily dips and the pandemic recedes from view. However, equities will falter towards the end of 2023. Stocks Tend To Fare Well When There Is No Recession On The Horizon
Stocks Tend To Fare Well When There Is No Recession On The Horizon
Stocks Tend To Fare Well When There Is No Recession On The Horizon
Bottom Line: The US may not be able to avoid a recession, but an economic downturn is unlikely until 2024. Stay modestly overweight stocks over a 12-month horizon. Jobs Aplenty The US unemployment rate fell from 3.8% in February to 3.6% in March, bringing it close to its pre-pandemic low of 3.5%. Adding job openings to employment and comparing the resulting sum with the size of the labor force, the excess of labor demand over labor supply is now the highest since July 1969 (Chart 1). Chart 1Labor Demand Is Outstripping Labor Supply By The Largest Margin Since 1969
Is A Recession Inevitable?
Is A Recession Inevitable?
Granted, the labor force participation rate is still one full percentage point below where it was prior to the pandemic. If the participation rate were to rise, the gap between labor demand and supply would shrink. Some of the decline in the participation rate is permanent in nature, reflecting ongoing population aging, which has been compounded by an increase in early retirements during the pandemic (Chart 2). Some workers who dropped out will probably re-enter the workforce. Chart 3 shows that employment among low-wage workers has been slower to recover than for other groups. With expanded unemployment benefits no longer available, the motivation to find gainful employment will escalate. Chart 2Not All Of The Decline In Labor Participation During The Pandemic Was Due To Increased Early Retirements
Not All Of The Decline In Labor Participation During The Pandemic Was Due To Increased Early Retirements
Not All Of The Decline In Labor Participation During The Pandemic Was Due To Increased Early Retirements
Chart 3Low-Wage Workers Have Not Returned In Full Force
Low-Wage Workers Have Not Returned In Full Force
Low-Wage Workers Have Not Returned In Full Force
Nevertheless, it is doubtful that the entry of low-wage workers into the labor force will do much to reduce the gap between labor demand and supply. Low-wage workers tend to spend all of their incomes (Chart 4). Thus, while an increase in the number of low-wage workers will allow the supply of goods and services to rise, this will be counterbalanced by an increase in the demand for goods and services. Chart 4Richer Households Tend To Save More Than Poorer Ones
Is A Recession Inevitable?
Is A Recession Inevitable?
To cool the labor market, the Fed will need to curb spending, and that can only be achieved by raising interest rates. Trying to achieve a soft landing in this manner is always easier said than done. The US has never averted a recession when the 3-month average of the unemployment rate has increased by more than a third of a percentage point. Rising unemployment tends to produce a negative feedback loop: A weaker labor market depresses spending. This, in turn, leads to less hiring and more firing, resulting in even higher unemployment. Where is the Choke Point? How high will interest rates need to rise to trigger such a feedback loop? Markets currently expect the Fed to raise rates to 3% by mid-2023 but then cut rates by at least 25 basis points over the subsequent months (Chart 5). So, the market thinks the neutral rate of interest – the interest rate consistent with a stable unemployment rate – is around 2.5%. The Fed broadly shares the market’s view. The median dot for the terminal Fed funds rate stood at 2.4% in the March Summary of Economic Projections (Chart 6). When the Fed first started publishing its dot plot in 2012, it thought the terminal rate was 4.25%. Chart 5The Markets See The Fed Funds Rate Reaching 3% Next Year
Is A Recession Inevitable?
Is A Recession Inevitable?
Chart 6The Fed's Estimate Of The Terminal Rate Has Fallen Over The Years
The Fed's Estimate Of The Terminal Rate Has FalLen Over The Years
The Fed's Estimate Of The Terminal Rate Has FalLen Over The Years
Low Imbalances Imply a Higher Neutral Rate We have discussed the concept of the neutral rate extensively in the past, so we will not regurgitate the issues here (interested readers should consult the Feature Section of our latest Strategy Outlook). Instead, it would be worthwhile to dwell on the relationship between the neutral rate and economic imbalances. Simply put, when an economy is suffering from major imbalances, it does not take much monetary tightening to push it over the edge. The private-sector financial balance measures the difference between what households and firms earn and spend. A recession is more likely to occur when the private-sector financial balance is negative — that is, when spending exceeds income — since households and firms are more prone to cut spending when they are living beyond their means. In the lead-up to the Great Recession, the private-sector financial balance hit a deficit of 3.9% of GDP in the US. Leading up to the 2001 recession, it reached a deficit of 5.4% of GDP. Today, the US private-sector financial balance, while down from its peak during the pandemic, still stands at a comfortable surplus of 3% of GDP. Rather than looking to retrench, households and businesses are poised to increase spending over the coming quarters (Chart 7). Private-sector financial balances are also positive in Japan, China, and most of Europe (Chart 8). Chart 7Consumers And Businesses Are Set To Spend More
Consumers And Businesses Are Set To Spend More
Consumers And Businesses Are Set To Spend More
Chart 8Private-Sector Financial Balances Are Positive In Most Major Economies
Is A Recession Inevitable?
Is A Recession Inevitable?
Watch Housing Chart 9Rising Interest Rates In The Early 1980s Had Much More Of A Negative Effect On Housing Than Business Investment
Rising Interest Rates In The Early 1980s Had Much More Of A Negative Effect On Housing Than Business Investment
Rising Interest Rates In The Early 1980s Had Much More Of A Negative Effect On Housing Than Business Investment
At the 2007 Jackson Hole conference, Ed Leamer presented what turned out to be a very prescient paper. Titled “Housing is the Business Cycle,” Leamer concluded that “Of the components of GDP, residential investment offers by far the best early warning sign of an oncoming recession.” Housing is a long-lived asset, and one that is usually financed with debt. To a much greater extent than nonresidential investment, the housing sector is very sensitive to changes in interest rates. When the Fed hiked rates in the early 1980s, residential investment collapsed but business investment barely contracted (Chart 9). The jump in mortgage yields has started to weigh on housing (Chart 10). Mortgage applications for home purchases have fallen by 25% from their highs. Pending home sales have dropped. Homebuilder confidence has dipped. Homebuilder stocks are down 29% year-to-date. Housing is likely to slow further in the months ahead, even if mortgage yields stabilize. Chart 11 shows that changes in mortgage yields lead home sales and housing starts by about six months. Chart 10The Jump In Mortgage Rates Has Weighed On The Housing Market
The Jump In Mortgage Rates Has Weighed On The Housing Market
The Jump In Mortgage Rates Has Weighed On The Housing Market
Chart 11Swings In Mortgage Rates Explain Short-Term Fluctuations In Housing Activity
Swings In Mortgage Rates Explain Short-Term Fluctuations In Housing Activity
Swings In Mortgage Rates Explain Short-Term Fluctuations In Housing Activity
The key question for investors is whether the housing market will enter a deep freeze or merely cool down. We think the latter is more likely. The 30-year fixed mortgage rate has increased nearly two percentage points since last August, but at around 5%, it is still below the average of 6% that prevailed during the 2000-2006 housing boom (Chart 12).
Image
Moreover, unlike during the housing boom, when homebuilders flooded the market with houses, the supply of new homes remains contained. The nationwide homeowner vacancy rate stands at record lows. Building permits are near cycle highs (Chart 13). Granted, real home prices are close to record highs. However, relative to incomes, US home prices have not broken out of their historic range (Chart 14). Chart 13The Homeowner Vacancy Rate Is Near Record Lows
The Homeowner Vacancy Rate Is Near Record Lows
The Homeowner Vacancy Rate Is Near Record Lows
Chart 14Homes In The US Are Relatively Cheap
Homes In The US Are Relatively Cheap
Homes In The US Are Relatively Cheap
Home affordability is much more stretched outside of the United States. The Bank of Canada, for example, has less scope to raise rates than the Fed. Chart 15Some Signs Of Easing In Supply-Side Pressures
Some Signs Of Easing In Supply-Side Pressures
Some Signs Of Easing In Supply-Side Pressures
Investment Conclusions As investors, we need to be forward looking. The widespread availability of Paxlovid later this year — which, in contrast to the vaccines, is effective against all Covid strains — will help boost global growth while relieving supply-chain bottlenecks. Shipping costs, used car prices, and ISM supplier delivery times have already come down from their highs (Chart 15). Central banks have either started to raise rates or are gearing up to do so. However, monetary policy is unlikely to turn restrictive in any major economy over the next 12 months. Stocks usually go up outside of recessionary environments (Chart 16). Global equities are trading at 17-times forward earnings. The corresponding earnings yield is about 630 basis points higher than the real global bond yield – a very wide gap by historic standards (Chart 17). Chart 16Stocks Tend To Fare Well When There Is No Recession On The Horizon
Stocks Tend To Fare Well When There Is No Recession On The Horizon
Stocks Tend To Fare Well When There Is No Recession On The Horizon
Chart 17AThe Equity Risk Premium Remains Elevated (I)
The Equity Risk Premium Remains Elevated (I)
The Equity Risk Premium Remains Elevated (I)
Chart 17BThe Equity Risk Premium Remains Elevated (II)
The Equity Risk Premium Remains Elevated (II)
The Equity Risk Premium Remains Elevated (II)
Investors should remain modestly overweight equities over a 12-month horizon and look to increase exposure to non-US stock markets, small caps, and value stocks over the coming months. Government bond yields are unlikely to rise much over the next 12 months but will increase further over the long haul. The dollar should peak during this summer, and then weaken over the subsequent 12 months. A complete discussion of our market views is contained in our recently published Second Quarter Strategy Outlook. Peter Berezin Chief Global Strategist peterb@bcaresearch.com Global Investment Strategy View Matrix
Is A Recession Inevitable?
Is A Recession Inevitable?
Special Trade Recommendations Current MacroQuant Model Scores
Is A Recession Inevitable?
Is A Recession Inevitable?