Currencies

Executive Summary For the Fed, maintaining its credibility with a long sequence of rate hikes that does not crash the economy, real estate market, and stock market is akin to the ‘Hail Mary’ move of (American) football. The likelihood that the Fed completes the straight sequence of eight rate hikes which the market is now pricing seems very low. Hence, today we are opening a new trade. Go long the September 2023 Eurodollar futures contract. Additionally, stay underweight Treasury Inflation Protected Securities (TIPS) versus T-bonds. And on a 12-month horizon, underweight the commodity complex, whose elevated prices are highly vulnerable to a near-certain upcoming demand destruction. Fractal trading watchlist: US interest rate futures, 3-year T-bond, Canada versus Japan, AUD/KRW, and EUR/CHF. Spending On Goods Looks Like An Earthquake On A Seismograph
Spending On Goods Looks Like An Earthquake On A Seismograph
Spending On Goods Looks Like An Earthquake On A Seismograph
Bottom Line: The likelihood that the Fed completes the straight sequence of eight rate hikes which the market is now pricing seems very low. Feature Amid the uncertainties of the Ukraine crisis, there is one certainty. The latest surge in energy and grain prices is a classic supply shock. Prices have spiked because vital supplies of Russian and Ukrainian energy and grains have been cut. This matters for central banks, because to the extent that they can bring down inflation, they can do so by depressing demand. They can do nothing to boost supply. In fact, depressing demand during a supply shock is a sure way to start a recession. But what about the inflation that came before the Ukraine crisis, wasn’t that due to excess demand? No, that inflation came not from a demand shock, but from a displacement of demand shock – as consumers displaced their firepower from services to goods on a massive scale. This matters because central banks are also ill placed to fix such a misallocation of demand. Chart I-1 looks like a seismograph after a huge earthquake, and in a sense that is exactly what it is. The chart shows the growth in spending on durable goods, which has just suffered an earthquake unlike any in history. Zooming in, we can see the clear causality between the surges in spending on durables and the surges in core inflation. The important corollary being that when the binge on durables ends – as it surely must – or worse, when durable spending goes into recession, inflation will plummet (Chart I-2). Chart I-1Spending On Goods Looks Like An Earthquake On A Seismograph
Spending On Goods Looks Like An Earthquake On A Seismograph
Spending On Goods Looks Like An Earthquake On A Seismograph
Chart I-2The Goods Binges Caused The Core Inflation Spikes
The Goods Binges Caused The Core Inflation Spikes
The Goods Binges Caused The Core Inflation Spikes
But, argue the detractors, what about the uncomfortably high price inflation in services? What about the uncomfortably high inflation expectations? Most worrying, what about the recent surge in wage inflation? Let’s address these questions. Underlying US Inflation Is Running At Around 3 Percent In the US, the dominant component of services inflation is housing rent, which comprises 40 percent of the core consumer price index. Housing rent combines actual rent for those that rent their home, with the near-identically behaving owners’ equivalent rent (OER) for those that own their home. Given the state of the jobs market, there is nothing unusual in the current level of rent inflation. Housing rent inflation closely tracks the tightness of the jobs market, because you need a job to pay the rent. With the unemployment rate today at the same low as it was in 2006, rent inflation is at the same high as it was in 2006: 4.3 percent. In other words, given the state of the jobs market, there is nothing unusual in the current level of rent inflation (Chart I-3). Chart I-3Given The Jobs Market, Rent Inflation Is Where It Should Be
Given The Jobs Market, Rent Inflation Is Where It Should Be
Given The Jobs Market, Rent Inflation Is Where It Should Be
Given its dominance in core inflation, rent inflation running at 4.3 percent would usually be associated with core inflation running at around 3 percent – modestly above the Fed’s target, rather than the current 6.5 percent (Chart I-4). Confirming that it is the outsized displacement of spending into goods, and its associated inflation, that is giving the Fed and other central banks a massive headache. Yet, to repeat, monetary policy is ill placed to fix such a misallocation of demand. Chart I-4Given Rent Inflation, Core Inflation Should Be 3 Percent
Given Rent Inflation, Core Inflation Should Be 3 Percent
Given Rent Inflation, Core Inflation Should Be 3 Percent
Still, what about the surging expectations for inflation? Many people believe that these are an independent and forward-looking assessment of how inflation will evolve. Yet nothing could be further from the truth. The bond market’s expected inflation is just the result of an algorithm that uses historic inflation. And at that, an extremely short period of historic inflation, just six months.1 The upshot is that when the backward-looking six month inflation rate is low, like it was in the depths of the global financial crisis in late 2008 or the pandemic recession in early 2020, the market assumes that the forward-looking ten year inflation rate will be low. And when the backward-looking six-month inflation rate is high, like early-2008 or now, the bond market assumes that the forward-looking ten year inflation rate will be high. In other words: Inflation expectations are nothing more than a reflection of the last six months’ inflation rate (Chart I-5). Chart I-5Inflation Expectations Are Just A Reflection Of The Last Six Months' Inflation Rate
Inflation Expectations Are Just A Reflection Of The Last Six Months' Inflation Rate
Inflation Expectations Are Just A Reflection Of The Last Six Months' Inflation Rate
Turning to wage inflation, with US average hourly earnings inflation running close to 6 percent, it would appear to be game, set, and match to ‘Team Inflation.’ Except that this is a flawed argument. To the extent that wages contribute to inflation, it must come from the inflation in unit labour costs, meaning the ratio of hourly compensation to labour productivity. After all, if you get paid 6 percent more but produce 6 percent more, then it is not inflationary (Chart I-6). Chart I-6If You Get Paid 6 Percent More But Produce 6 Percent More, Then It Is Not Inflationary
If You Get Paid 6 Percent More But Produce 6 Percent More, Then It Is Not Inflationary
If You Get Paid 6 Percent More But Produce 6 Percent More, Then It Is Not Inflationary
In this regard, US unit labour costs increased by 3.5 percent through 2021, and slowed to just a 0.9 percent (annualised) increase in the fourth quarter.2 Still, 3.5 percent, and slowing, is modestly above the Fed’s inflation target, and could justify a slight nudging up of the Fed funds rate. But it could not justify the straight sequence of eight rate hikes which the market is now pricing. The Fed Is Praying For A ‘Hail Mary’ Fortunately, the bond market understands all of this. How else could you say 7 percent inflation and 2 percent long bond yield in the same breath?! This is crucial, because it is the long bond yield that drives rate-sensitive parts of the economy, such as housing and construction. And it is the long bond yield that sets the level of all asset prices, including real estate and stocks. Although the Fed cannot admit it, the central bank also understands all of this and hopes that the bond market continues to ‘get it.’ Meaning that it hopes that the long end of the interest rate curve does not lift too far and crash the economy, real estate market, and stock market. So why is the Fed hiking the policy interest rate? The answer is that there will be a time in the future when it does need to lift the entire interest rate curve, and for that it will need its credibility intact. Not hiking now could potentially shred the credibility that is the lifeblood of any central bank. Still, to maintain its credibility without crashing the economy the Fed will have to make the ‘Hail Mary’ move of (American) football. For our non-American readers, the Hail Mary is a high-risk desperate move with little hope of completion. Go long the September 2023 Eurodollar futures contract. To sum up, the likelihood that the Fed completes the straight sequence of eight rate hikes which the market is now pricing seems very low. Hence, today we are opening a new trade. Go long the September 2023 Eurodollar futures contract (Chart I-7). Chart I-7The Likelihood That The Fed Completes A Straight Sequence Of Eight Rate Hikes Seems Low
The Likelihood That The Fed Completes A Straight Sequence Of Eight Rate Hikes Seems Low
The Likelihood That The Fed Completes A Straight Sequence Of Eight Rate Hikes Seems Low
Additionally, stay underweight Treasury Inflation Protected Securities (TIPS) versus T-bonds (Chart I-8). Chart I-8Underweight TIPS Versus T-Bonds
Underweight TIPS Versus T-Bonds
Underweight TIPS Versus T-Bonds
And on a 12-month horizon, underweight the commodity complex, whose elevated prices are highly vulnerable to a near-certain upcoming demand destruction. Fractal Trading Watchlist Confirming the fundamental analysis in the preceding sections, the strong trend in both the 18 month out US interest rate future and the equivalent 3 year T-bond has reached the point of fragility that has identified previous turning-points in 2018 and 2021 (Chart I-9 and Chart I-10). This week we are also adding to our watchlist the commodity plays Canada versus Japan and AUD/KRW, whose outperformances are vulnerable to reversal. From next week you will be able to see the full watchlist of investments that are vulnerable to reversal on our website. Stay tuned. Finally, the underperformance of EUR/CHF has reached the point of fragility on its 260-day fractal structure that has identified the previous major turning-points in 2018 and 2020 (Chart I-11). Accordingly, this week’s recommended trade is long EUR/CHF, setting a profit target and symmetrical stop-loss at 3.6 percent. Chart I-9The Strong Trend In The 18-Month-Out US Interest Rate Future Is Fragile
The Strong Trend In The 18-Month-Out US Interest Rate Future Is Fragile
The Strong Trend In The 18-Month-Out US Interest Rate Future Is Fragile
Chart I-10The Strong Trend In The 3 Year T-Bond Is Fragile
The Strong Trend In The 3 Year T-Bond Is Fragile
The Strong Trend In The 3 Year T-Bond Is Fragile
Chart I-11Go Long EUR/CHF
Go Long EUR/CHF
Go Long EUR/CHF
Canada Versus Japan Is Vulnerable To Reversal
Canada Versus Japan Is Vulnerable To Reversal
Canada Versus Japan Is Vulnerable To Reversal
AUD/KRW Is Vulnerable To Reversal
AUD/KRW Is Vulnerable To Reversal
AUD/KRW Is Vulnerable To Reversal
Dhaval Joshi Chief Strategist dhaval@bcaresearch.com Footnotes 1 The expected 10-year inflation rate = (deviation of 6-month annualized inflation from 1.6)*0.2 + 1.6. 2 Source: Bureau of Labor Statistics Fractal Trading System Fractal Trades
The Fed Needs A ‘Hail Mary’ To Maintain Credibility Without Crashing The Economy
The Fed Needs A ‘Hail Mary’ To Maintain Credibility Without Crashing The Economy
The Fed Needs A ‘Hail Mary’ To Maintain Credibility Without Crashing The Economy
The Fed Needs A ‘Hail Mary’ To Maintain Credibility Without Crashing The Economy
6-Month Recommendations Structural Recommendations Closed Fractal Trades Indicators To Watch - Bond Yields Chart II-1Indicators To Watch - Bond Yields - Euro Area
Indicators To Watch - Bond Yields - Euro Area
Indicators To Watch - Bond Yields - Euro Area
Chart II-2Indicators To Watch - Bond Yields - Europe Ex Euro Area
Indicators To Watch - Bond Yields - Europe Ex Euro Area
Indicators To Watch - Bond Yields - Europe Ex Euro Area
Chart II-3Indicators To Watch - Bond Yields - Asia
Indicators To Watch - Bond Yields - Asia
Indicators To Watch - Bond Yields - Asia
Chart II-4Indicators To Watch - Bond Yields - Other Developed
Indicators To Watch - Bond Yields - Other Developed
Indicators To Watch - Bond Yields - Other Developed
Indicators To Watch - Interest Rate Expectations Chart II-5Indicators To Watch - Interest Rate Expectations
Indicators To Watch - Interest Rate Expectations
Indicators To Watch - Interest Rate Expectations
Chart II-6Indicators To Watch - Interest Rate Expectations
Indicators To Watch - Interest Rate Expectations
Indicators To Watch - Interest Rate Expectations
Chart II-7Indicators To Watch - Interest Rate Expectations
Indicators To Watch - Interest Rate Expectations
Indicators To Watch - Interest Rate Expectations
Chart II-8Indicators To Watch - Interest Rate Expectations
Indicators To Watch - Interest Rate Expectations
Indicators To Watch - Interest Rate Expectations
Executive Summary Winners And Losers
The Impact Of The Ukraine War On The US Economy And Equity Sectors
The Impact Of The Ukraine War On The US Economy And Equity Sectors
Combining Russia and Ukraine: Taken together, Russia and Ukraine account for a small fraction of global trade. However, Russia is a key player in the global energy and metals markets, providing rare materials like palladium. Ukraine is a sizable agricultural producer, as well as an exporter of specialized products such as neon. Effects on global trade: Shortages of metals and agricultural goods will reverberate across the global economy, exacerbating shortages and supply disruptions. Manufacturer anxiety about the availability of raw input materials catalyzed an explosive rally in the commodity universe. Effect on the US companies: Most US equity sectors have limited direct sales exposure to Russia. However, self-sanctioning will have an adverse immediate effect on many multinationals, while indirect effects of the war will be even more impactful. Winners and losers: At the margin, the escalation in Ukraine is a net positive for Energy, Big Tech, and Metals & Mining, while Travel, Consumer Staples, Semiconductors Manufacturers, and Automakers will be hit by shortages and surging input costs. Bottom Line:The war in Ukraine has wreaked havoc in the US equity market, even though US trade with Russia and Ukraine is insignificant and is mostly limited to energy, palladium, and other rare metals. However, US companies are affected by the scarcity of selected metals and materials, soaring prices, and supply chain disruptions. Feature Introduction The war in Ukraine has become the proverbial black swan that has blindsided even the most cautious investors. The world simply did not expect Russia to wage such a bloody, and all-out war. As such, tragically, small Ukraine has come out of obscurity, and became a focal point of the world’s attention, mostly for humanitarian reasons. While our heart goes out to the people living under fire, it is our job as investment strategists to conduct a detailed economic analysis of the effect of the war in Ukraine and sanctions on Russia’s goods and services on US equities. To do so, we will first investigate trade links between Ukraine, Russia, and the US. And then look at the indirect effects of the war on US equity sectors. Russia And Ukraine Effect On Global Trade Taken together, Russia and Ukraine account for about 3.5% of global GDP in PPP terms and only 1.9% in dollar terms. Even a deep recession in each of these economies is unlikely to cause a dent in global growth, at least not directly. Unfortunately, the indirect effects of this war are substantial. What Is Russia Producing? In 2019, Russia exported $407B in goods, which made it the 13th largest exporter in the world. It is the second-largest commodities exporter (after the US) and the second-largest oil producer, accounting for 12% of annual global output. Energy: Russia’s crude oil exports account for 8.4% of global crude consumption, while natural gas exports account for 5.9% of global consumption, and 3.4% for coal (Table 1). These energy products constitute roughly 60% of Russia’s exports. Its exports of natural gas represent close to half of all European gas imports. Table 1Russia’s Global Share In Various Commodities
The Impact Of The Ukraine War On The US Economy And Equity Sectors
The Impact Of The Ukraine War On The US Economy And Equity Sectors
Nickel: Russia is also one of the top metal producers. It is the third largest producer of nickel, accounting for 4.4.% of global output. The recent surge in nickel prices reflects manufacturers’ anxiety about the potential shortages of this metal.1 Elon Musk has said that a shortage of nickel is the “biggest challenge” in “producing high-volume, long-range batteries”. Palladium: In addition, to nickel, Russia accounts for 35.6% of global palladium output. Palladium is widely used in catalytic converters, electrodes, and other types of electronics.2 Palladium prices are up 46% since the start of the year. Chart 1War Wreaked Havoc In Commodities Market
The Impact Of The Ukraine War On The US Economy And Equity Sectors
The Impact Of The Ukraine War On The US Economy And Equity Sectors
Fertilizers: Together, Russia and Belarus account for about 40% of global potash production, a key ingredient in potassium-based fertilizers. Russia also produces two-thirds of all ammonium nitrate, the main source of nitrogen-rich fertilizers. Wheat and lumber: Russia produces 10% of the global supply of wheat and lumber. While Russia’s trading network is wide, the most common destinations for its exports are China (14%), Netherlands (10%), Belarus (5%), and Germany (4.6%), making its direct effect on global trade limited. What Is Ukraine Producing? Ukraine’s effect on global trade is less significant: In 2019 it exported only $49.5B, with exports dominated by agricultural products and metals (Chart 2). Food: Ukraine’s production is dominated by foodstuffs such as corn, wheat, and seed oils. Russia and Ukraine together account for 25% of global wheat exports, much of which is going to the developing nations of Africa and Asia (Chart 3). Russia and Ukraine are also significant producers of potatoes, sunflowers, and sugar beets. Chart 2Ukraine Exports Metals And Food
The Impact Of The Ukraine War On The US Economy And Equity Sectors
The Impact Of The Ukraine War On The US Economy And Equity Sectors
Chart 3Wheat Is Exported To North Africa And Asia
The Impact Of The Ukraine War On The US Economy And Equity Sectors
The Impact Of The Ukraine War On The US Economy And Equity Sectors
With war and sanctions, most of this output will be lost or kept for domestic consumption, accelerating food inflation, which is already rampant. Of course, the rest of the world could try to compensate for lost agricultural output, but there is a major snag: Russia, Ukraine, and Belarus are significant producers of fertilizer. Metals: Ukraine produces significant amounts of steel. ArcelorMittal and Metinvest suspended production at their Ukrainian plants last week. Auto Components: In addition, Ukraine is a major producer of automotive wire harnesses. Volkswagen, BMW, and Porsche have all had to curtail auto production due to war-related shortages. Neon: Then there are the more esoteric commodities. The bulk of semiconductor-grade neon, used in high-precision lasers, comes from Ukraine. A dearth of this critical gas could exacerbate the semiconductor shortage. While Ukraine trades predominately with its European neighbors, such as Russia, Germany, Poland, and Italy, shortages of agricultural products, semiconductors, and automotive components are likely to reverberate across the globe. The US Is An Island… Almost According to the OEC,3 in 2019 the US was the number two economy in terms of total exports ($1.51T), and the number one economy in total imports ($2.38T). Russia barely registers as the US trading partner, with only $14.B or 0.61% of total imports coming from Russia. Ukraine is even less significant for the US: Its exports constitute only $1.23B. US exports to Ukraine and Russia constitute less than 1% of its total exports. However, to uncover the potential effects of the possible halting of Russian trade on the US economy, let’s look at what goods the US is buying. The reality on the ground may be complex. Petrochemicals Refined and crude petroleum constitute about half of all Russian imports to the US and account for roughly $7 billion (Chart 4). The US sanctioning of Russian oil is unlikely to have a significant effect on the US economy: It constitutes only about 5.7% of all the US oil imports, both crude and refined, which in 2019 were about $123B. As a result, the recent US embargo of Russian oil is unlikely to have much impact. Platinum, Titanium, And Other Rare and Precious Metals US imports roughly $7B worth of platinum, over one-fifth of which is sourced from Russia. Russia also provides about 21.5% of all titanium and 23% of radioactive chemicals that the US imports. Chart 4US Imports Fuels And Rare Metals From Russia
The Impact Of The Ukraine War On The US Economy And Equity Sectors
The Impact Of The Ukraine War On The US Economy And Equity Sectors
Palladium The situation with palladium is even more strained: Russia produces 42% of the palladium imported by the US while South Africa supplies another 30%. All other exports of palladium are fragmented, and producers are unlikely to be able to ramp up production fast enough. Nickel US imports only $1.4B worth of nickel per year, 11% of which is coming from Russia. Australia and Canada are the only other large producers of this metal, and it is not clear if they will be able to step in and fill in the void left by Russia. How Much Production From Russia Will Be Curtailed? The West’s official sanctions affect Russian exports of certain commodities but there is also a reluctance on the part of private companies to buy or ship Russian exports. This latter factor makes it nearly impossible to gauge just how much supply of each individual commodity will be curtailed. In addition, Putin has announced his decision to suspend some commodity exports at least until 2023. Assuming in the near term that a considerable share of Russia’s commodity exports will be blocked from global markets, the largest impact will be on oil, palladium, copper, nickel, fertilizer, and grains. The Stock Market Is Not The Economy US Companies Most Exposed To Russian Trade Most US multinational companies have limited direct sales exposure to Russia. Among those that do have some exposure (Table 2), Philip Morris comes on top of the list at 8% of sales, PepsiCo 4.3%, Mondelez 3.1%, and McDonald’s 4.5%. Apple has generated only 1.3% of its sales in Russia. Overall, the Consumer Staples sector has the highest exposure to Russia. Exodus The majority of US multinationals have announced their exit from the Russian market in protest at the war. The exodus affects wide swaths of the Russian economy, including joint ventures in energy, auto manufacturing, finance, retail, entertainment, and fast food (See Appendix for the list). The war affects US sectors in many different way, and there are winners and losers (Chart 5). Table 2US Multinationals With The Highest Exposure To Russia
The Impact Of The Ukraine War On The US Economy And Equity Sectors
The Impact Of The Ukraine War On The US Economy And Equity Sectors
Chart 5Winners And Losers
The Impact Of The Ukraine War On The US Economy And Equity Sectors
The Impact Of The Ukraine War On The US Economy And Equity Sectors
Investment Implications Energy Sector – Positive The US embargo of Russian oil does not have a pronounced immediate and direct effect on the US energy sector as US imports from Russia are minor. Exxon’s exit from Russia is not going to have any noticeable short-term effect on the US energy sector. On the contrary, elevated oil and gas prices create an impetus for the US shale producers to ramp up output. Oil Equipment and Services companies will be the key beneficiaries of the new energy Capex cycle. While we closed our overweight in E&P companies with a view that OPEC will open oil spigots and cure high prices, locking in a gain of 60%, we remain overweight E&S Energy industry. Consumer Staples – Negative Companies such as Mondelez, Philip Morris, and PepsiCo are most exposed to the Russian market. All three have announced that they are discontinuing or curtailing Russian operations, taking a direct hit on earnings. However, disruptions in agricultural exports from Russia and Ukraine, and accompanying soaring food prices (Chart 6), are likely to have a broad negative effect on the sector, increasing input prices while sector margins are already razor-thin. So far, the sector had been able to pass on costs to customers, but its pricing power may be limited going forward (Chart 7). Chart 6Food Price Surge Is Parabolic
Food Price Surge Is Parabolic
Food Price Surge Is Parabolic
Chart 7Consumer Staples Have Been Able To Pass Costs On To Customers
Consumer Staples Have Been Able To Pass Costs On To Customers
Consumer Staples Have Been Able To Pass Costs On To Customers
We are overweight Consumer Staples thanks to its defensive attributes in the face of overall market volatility. However, we will be monitoring this position closely. Semiconductors - Neutral Disruptions in supplies of neon, palladium, and nickel, which are essential components of the manufacturing of semiconductors, will exacerbate global chip shortages, and hit profits of semiconductor manufacturers, mostly in Asia. However, the majority of the large US semiconductor companies are chip designers and are unlikely to be affected. The only exception is Intel, which is an integrated semiconductor company. Intel has also announced that it is exiting Russia, which may have an adverse effect on its profitability. Auto Manufacturers - Negative Overall, US car manufacturers have limited direct exposure to Russia. Ford has recently closed its joint venture with a Russian car manufacturer. GM does not have a significant presence in Russia, selling only 3,000 cars a year there, of the six million it sells worldwide. Tesla’s presence in Russia is also insignificant – there are only 700 Teslas registered there. However, there are supply problems. Shortages of metals, such as palladium and nickel, widely used in catalytic converters and electrodes, will compound shortages in tight auto component markets. Travel Complex: Hotels, Restaurants, and Airlines Hilton, Marriott, and Hyatt have announced that they are halting development and new investments in Russia. While these actions on the margin will have a long-lasting negative effect on their business, a more immediate concern is that a war in Europe will suppress travel, which only recently started rebounding after COVID-19 country closures. US airlines will suffer from a double whammy of rising fuel costs, and consumer reluctance for international travel in the light of hostilities in the heart of Europe. International and business travel are the most lucrative segments of their business, the rebound of which is needed for these companies to restore profitability. We were positive on airlines in light of the reopening of international travel as the Omicron wave was receding, but now have to reconsider our optimistic stance if oil prices don’t normalize soon. Fast-food restaurant closures in Russia (Burger King, McDonald’s, Starbucks, etc.) will result in a significant hit to their bottom line. To put these actions in perspective, McDonald’s announced that temporary closures of its 750 restaurants in Russia and 180 in Ukraine will make it lose $50 million a month, resulting in a 9% hit to its revenue. In addition, these businesses are already reeling from rising food prices and consumers shifting their goods and services away from discretionary spending to necessities because of negative wage growth. We are overweight the Travel complex but are likely to downgrade it in the coming days. Big Tech – Positive According to a recent report by the IDC, the global impact of a steep decline in Information and Communications Technology (ICT) spending in Russia and Ukraine will be somewhat limited. Combined, the two countries only account for 5.5% of all ICT spending in Europe and 1% worldwide.4 Meanwhile, tech spending among Western European countries may increase in part due to expanded defense and security allocations. We believe that dislocation also creates an opportunity for US technology companies, especially in the software and cybersecurity space. Exiting the Russian market is likely to have a limited negative effect on US technology companies’ revenue, as most of them derive only a very small proportion of it from Russia. We are overweight the Software and Cybersecurity industries. Metals and Mining - Positive Disruption of the supply of metals from Russia and Ukraine creates an opportunity for US metals and mining companies, with soaring pricing promising a profits windfall. Unlike with oil and gas, an increase of supply in metals not only takes substantial investment but also takes years to bring to production. As a result, there is no respite in sight. As such, we will consider adding to our existing position, bringing allocation to an overweight. Stay tuned. Bottom Line The war in Ukraine has wreaked havoc in the US equity market, even though US trade with Russia and Ukraine is insignificant and is mostly limited to energy, palladium, and other rare metals. However, the US economy is affected by the scarcity of selected metals and materials, soaring prices, and supply chain disruptions. As is often the case, there are winners and losers: Energy, and Metals & Mining are mostly immune to the crisis and are likely to benefit by picking up slack in supply. The Technology sector, especially Software and Cybersecurity, will benefit from the disruption of the war. Consumer Staples, Travel, Auto Manufacturers, and Semiconductor Manufacturers are likely to take a hit because of shortages and soaring input prices. Irene Tunkel Chief Strategist, US Equity Strategy irene.tunkel@bcaresearch.com Appendix: Companies’ Self-Sanctions In Russia5 Airlines American Airlines, Delta, and United cut ticket sales partnerships with Russian airlines. All three have stopped flying over Russia. Banks Goldman Sachs became the first American bank to announce that it is exiting Russia. Citigroup also indicated that it is curtailing operations in Russia. Technology Accenture is discontinuing its operations in Russia. Airbnb (ABNB) announced that the company is suspending all operations in Russia and Belarus. Amazon (AMZN)’s cloud division, Amazon Web Services (AWS), said it would halt new sign-ups for the service in Russia and Belarus. AWS indicated that it has no data centers in Russia and, as a matter of policy, it does not do business with the Russian government. It stated that while it had Russian customers, they are all headquartered outside of Russia. Apple (AAPL) has stopped selling its products in Russia, and limited access to digital services, such as Apple Pay, inside Russia. Google confirmed that it is no longer accepting new Google Cloud customers in Russia. It has also halted its advertisement operations in the country. IBM (IBM) has suspended all business in Russia. Intel (INTC) has stopped all shipments to Russia and Belarus, the company announced. Microsoft (MSFT) is suspending all new sales of its products and services in Russia. Microsoft (MSFT) also said it will continue aiding in Ukrainian cybersecurity. Netflix (NFLX) said it will be suspending its streaming service in Russia. Spotify (SPOT) said it has closed its office in Russia “indefinitely” and restricted shows “owned and operated by Russian state-affiliated media.” Adobe stopped all new sales in Russia Uber is divesting from internet company Yandex Paypal suspended all services in Russia Big Four Accounting Firms Ernst & Young, Deloitte, KPMG, and PwC are pulling out of the country. Energy Exxon pledged to leave its last remaining oil and gas project in Russia and not to invest in new developments in the country. Credit Card Providers All three American credit card giants, Mastercard (MA), Visa (V), and American Express (Amex), have suspended all their network operations in Russia. Credit cards issued by Russian banks will not work in other countries, and cards issued elsewhere will not work for purchases in Russia. Hotels Hyatt (H), Hilton (HLT), and Marriott (MAR) are halting development and new investments in Russia. Hilton and Marriott are closing their corporate offices. Hilton is keeping its existing 26 hotels open (a fraction of the company’s 6,800 properties worldwide). Marriott hotels are franchised and the company is evaluating the ability to keep these hotels open. Industrials 3 has halted operations in Russia. Dow (DOW) has suspended all purchases of feedstocks and energy from Russia. It has also stopped all investments in the region and is supplying only limited essential goods in Russia. General Electric (GE) suspended most of its operations in Russia, with the exception of “providing essential medical equipment and supporting existing power services.” John Deere (DE) has halted shipments of its products to Russia. Caterpillar (CAT) is suspending operations at its Russian manufacturing facilities. Boeing (BA) said it would suspend support for Russian airlines. Automakers Ford (F) announced it was suspending its operations in Russia. The American automaker has a 50% stake in Ford (F) Sollers, a joint venture that employs at least 4,000 workers. GM does not have much of a presence in Russia. Entertainment Disney (DIS) is also suspending the release of its theatrical films in Russia, citing “the unprovoked invasion of Ukraine.” WarnerMedia said on February 28 that it would pause the release of “The Batman” in Russia. The company is also pausing all new business in Russia, ceasing broadcast of its channels, halting all new content licensing with Russian entities, and pausing planned theatrical and games releases. Retail Estée Lauder Companies will suspend all commercial activity in Russia, including closing every store and brand site and halting shipments to any of our retailers in Russia. The company had also already suspended business investments and initiatives in Russia. TJX has promised to divest its equity ownership in Familia, an off-price retailer with more than 400 stores in Russia. Consumer Staples Mondelez (MDLZ) said it would scale back all non-essential activities in Russia “while helping maintain continuity of the food supply.” The company said it would focus on “basic offerings,” and discontinue all new capital investments and suspend advertising spending in the country. Procter & Gamble (PG) has discontinued all new capital investments in Russia and is suspending all media, advertising, and promotional activity. The company will continue to provide basic health, hygiene, and personal care items. Philip Morris suspended planned investments and will reduce manufacturing in Russia. PepsiCo will stop selling soda in Russia but will continue to produce dairy and baby food. Restaurants Yum Brands (YUM) is closing 70 company-owned KFC restaurants and 50 Pizza Hut franchises in Russia. It will also suspend all investment and restaurant development in the country. McDonald’s (MCD) is closing some 750 restaurants in Russia. Russia’s restaurants along with another 108 in Ukraine, accounted for 9% of the company’s revenue in 2021. The company said that halting Russian operations will cost it $50 million a month. Restaurant Brands International (owner of Burger King) will end corporate support for 800 locations in Russia and will not approve any additional investment or expansion. Starbucks is closing all of its locations in Russia. Transportation UPS, DHL, and FedEx have suspended operations in Russia and Belarus. Footnotes 1 The nickel price increase was compounded by a margin call on a major Chinese nickel producer that had accumulated a large short position through forward contracts in order to lock in a price for future delivery. 2 Palladium - Wikipedia 3 United States (USA) Exports, Imports, and Trade Partners | OEC - The Observatory of Economic Complexity 4 A New Report from IDC Looks at the Initial Impact of the Russia-Ukraine War on Global ICT Markets. 5 Which Companies Have Pulled Out of Russia? Here’s a List. - The New York Times (nytimes.com) and https://www.cnn.com/2022/03/02/business/companies-pulling-back-russia-ukraine-war-intl-hnk/index.html Recommended Allocation
Dear client, This week we are sending you a joint Special Report with my colleague Chester Ntonifor, Foreign Exchange Strategist. The Special Report provides our outlook on the RMB. I trust that you will find the report very insightful. Best regards, Jing Sima China Strategist Executive Summary The RMB And Real Interest Rates
The RMB And Real Interest Rates
The RMB And Real Interest Rates
The RMB has overshot and will likely consolidate gains in the coming months. That said, the yuan remains underpinned by a current account surplus, positive real rates, and a valuation cushion. This will support modest appreciation over the next 12-18 months (Feature Chart). The dollar is likely to enter a period of weakness beyond the Russo-Ukrainian crisis, underpinning a firm RMB. Yield spreads between China and the US will narrow across the bond curve, slowing the pace of any RMB appreciation. In its quest to dominate Asian trade flows, China will also seek a stable yuan which can be an anchor for regional currencies. Low volatility in the Chinese bond and currency market will increasingly make it an attractive hedge for global portfolio managers. This will encourage RMB inflows. The financial sanctions on Russia from the ongoing Ukrainian conflict will accelerate Chinese diversification from US assets. It will also boost the use of RMB in global trade, lifting its share in global FX reserves. Bottom Line: In the near term, USD/CNY is due for a bounce and could retrace to 6.5. It is also the case that a lot of the gains in the Chinese RMB have been frontloaded, suggesting a flattish path ahead. Beyond the near term, we expect the DXY to hit 90 in the next 12-18 months, which will boost the RMB towards 6.0. Feature The RMB has been strong across the board versus most major currencies (Chart 1). Year-to-date, the DXY dollar index is up 2% while the CFETS basket is up 3%. This places the Chinese yuan as one of the best performing major currencies this year. Such a configuration where USD/CNY diverges from the broad dollar trend has been very rare in recent history (Chart 2). More importantly, this has occurred amidst very low volatility. Chart 1A Bull Market In Yuans
A Bull Market In Yuans
A Bull Market In Yuans
Chart 2USD/CNY And The Dollar Diverge
USD/CNY And The Dollar Diverge
USD/CNY And The Dollar Diverge
In this Special Report, we try to understand the driving forces behind a rising RMB, to gauge its likely path going forward. In our view, while the yuan is vulnerable tactically, it is underpinned by strong structural forces that support modest appreciation over the next 12-18 months. The Chinese Economy, Interest Rates, And The RMB An exchange rate is simply a mechanism to equalize rates of returns across countries. For most currencies, the key determinants of this arbitrage window are real interest rate differentials. In China, while nominal interest rates vis-à-vis the US have been collapsing, real interest rate differentials are near a record high. This has been the key driver of a rising RMB (Chart 3). Real interest rates tend to matter because high and rising inflation destroys the purchasing power of any currency. Our bias is that higher real rates in China versus the US will persist and keep the RMB firm. Five key reasons underpin this view: The Chinese economy is expected to accelerate this year relative to the US. The IMF expects 4.8% GDP growth in China, versus 4% in the US. Bloomberg consensus estimates corroborate this view – 5.2% growth is expected for China this year, versus 3.6% for the US. Even the Chinese government’s GDP growth target this year is 5.5%, much higher than street estimates. US interest rates are likely to rise over the medium term, but so will those in China. The Chinese credit impulse has bottomed, and it is usually a good precursor to both stronger economic activity and higher relative government bond yields (Chart 4). Chart 3The RMB And Real Versus Nominal Rates
The RMB And Real Versus Nominal Rates
The RMB And Real Versus Nominal Rates
Chart 4Interest Rate Differentials And The Credit Impulse
Interest Rate Differentials And The Credit Impulse
Interest Rate Differentials And The Credit Impulse
While Chinese productivity growth is slowing, it remains structurally higher compared to that in the US or Europe. Stronger productivity growth suggests the neutral rate of interest in China will remain higher than in Western economies for years to come. This will continue to attract further fixed-income inflows. The RMB is a procyclical currency and tends to benefit when flows into emerging market assets in general, and Chinese stocks in particular, are fervent. While the Chinese authorities have cracked down on the property and information technology/communication service sectors, they have done so without causing widespread capital flight and hurting the RMB (Chart 5). Going forward, odds are that the interest from foreign bargain hunters will rise as these sectors reset from lower and much cheaper levels. It is well known that the Chinese economy has excess capacity, which is inherently deflationary (and positive for real rates). Like Japan, China has excess savings and deficient demand (Chart 6). However, in an inflationary world, this excess capacity can easily be exported, especially to the US, which is on the verge of overheating. A healthy trade balance in China suggests there is little reason for the RMB to depreciate meaningfully. Chart 6Excess Savings In China And Low Inflation
Excess Savings In China And Low Inflation
Excess Savings In China And Low Inflation
Chart 5The RMB And Chinese Equities
The RMB And Chinese Equities
The RMB And Chinese Equities
It is remarkable that despite being the largest commodity importer in the world, terms of trade in China is picking up. Rising terms of trade is usually synonymous with a stronger currency. On the flip side, a stronger currency will also temper inflationary pressures in China (Chart 7). Chart 7The RMB, Terms Of Trade And Inflation
The RMB, Terms Of Trade And Inflation
The RMB, Terms Of Trade And Inflation
The bottom line is that real interest rates will remain relatively high in China, even as the US begins to tighten monetary policy while China eases. The reason is that the US economy is much more inflationary, and Chinese bond yields tend to rise when the PBoC stimulates growth. Market Liberalization And Portfolio Flows With attractive real yields, Chinese bonds have been gaining widespread investor appeal. Their inclusion in the world’s three major bond indices has been a seminal milestone in the process of liberalizing the Chinese fixed-income market. Chinese bonds have also acted as perfect portfolio hedges, moving inversely to US and global equities (Chart 8). The result has been significant portfolio inflows into Chinese bonds. As a reminder, Chinese bonds were initially included in the Bloomberg Barclays Global Aggregate Index (BBGA) in April 2019. Following that, they were added to the JP Morgan Government Bond - Emerging Market Index (GBI-EM) in February 2020. Finally, FTSE Russell announced their inclusion of in the FTSE World Government Bond Index (WGBI) as of October 2021. Since their inclusion, a net US$350 billion has flowed into Chinese bonds. We estimate that about 35% of that has been due to index inclusion. The amount of Chinese onshore bonds held by overseas investors has breached US$600 billion, a record high (Chart 9). Chart 9A Healthy Appetite From Foreign Investors
A Healthy Appetite From Foreign Investors
A Healthy Appetite From Foreign Investors
Chart 8RMB Bonds As A Portfolio Hedge
RMB Bonds As A Portfolio Hedge
RMB Bonds As A Portfolio Hedge
In a nutshell, the path of the RMB in the short term will follow relative growth dynamics between China and the rest of the world, but structural factors such the inclusion of RMB bonds in global portfolios will underpin strong inflows into the Chinese fixed-income market. The Dollar, Trade, And Lessons From The Ukrainian Conflict Chart 10China Is Destocking USDs
China Is Destocking USDs
China Is Destocking USDs
Another factor to consider vis-à-vis the RMB is the dollar’s reserve status, and the overreach that it commands. Quite simply, transactions conducted in US dollars anywhere fall under US law. This means that if a company in any country buys energy from Iran and the transaction is done in US dollars, the Treasury has powers to sanction the parties involved. Russian holdings of US Treasurys peaked during the Georgian war and have since fallen to near 0% of total reserves. Even so, the world has witnessed how vulnerable the Russian economy has been to a cut-off from the Society For Worldwide Interbank Financial Telecommunication (SWIFT) messaging system. China is the largest holder of US Treasurys and what it decides to do with this war chest of savings is of critical importance. At a minimum, a few trends that have been underway in recent years are likely to accelerate. China will continue to destock its holding of Treasurys into gold and other currencies (Chart 10). This will put downward pressure on the dollar and boost the RMB. In fact, ever since China started destocking Treasurys in earnest in 2015, the DXY has been unable to sustainably punch through the 100 level. Trade flows in Asia remain rather buoyant, even as globalization has peaked (Chart 11A and 11B). With most Asian countries having China as a large trading partner, the logical step will be more and more invoicing in RMB. Most global trade hubs in history (such as Hong Kong for example) have always sought a stable currency with low volatility to instill confidence in trade. China is likely to also favor a stable RMB. Chart 11AChina Could Dominate Asian Trade
China Could Dominate Asian Trade
China Could Dominate Asian Trade
Chart 11BAsian Trade Is Booming
What Next For The RMB?
What Next For The RMB?
As Asian trade continues to expand, the PBoC can step in as the regional central bank and lender of last resort. It is notable that China is already engaging in this role. Since the global financial crisis, the number of bilateral swap lines offered to foreign central banks by the PBoC has ballooned (Chart 12). According to the most recent data (from the PBoC), the Chinese central bank had bilateral local currency swap agreements with central banks or monetary authorities in 40 countries and regions, with a total amount of around 4 trillion yuan. The People’s Bank of China has massive foreign exchange reserves, worth about US$3.2 trillion. This means it can provide swap agreements that will almost cover the totality of EM foreign dollar debt. The Cross-Border Interbank Payment System (CIPS) already allows the transfer and clearing of yuan-denominated payments. In 2021, the system processed US$12.7 trillion, a 75% increase in turnover from the previous year.1 While the system still largely relies on SWIFT messaging for most cross-border transactions, progress towards independence is moving fast. The key point is that as China continues to rise as an economic power and increases the share of RMB trade within its sphere of influence, the yuan will naturally become the de facto Asian currency. This will allow the RMB to continue to gain international appeal (Chart 13). Chart 12The People's Bank Of Asia?
What Next For The RMB?
What Next For The RMB?
Chart 13The RMB And International Appeal
The RMB And International Appeal
The RMB And International Appeal
Valuation Concerns Most of the discussion above has focused on the cyclical outlook for the Chinese economy and bond yields, as well as the geopolitical ramifications from the Russo-Ukrainian conflict. While the macro environment is by far the most important driver of currencies, valuation and sentiment tend to matter as well. On this note: Our productivity model suggests the RMB is at fair value. Productivity in China remains higher than among its western trading partners, but the gap has been closing. This has flattened the slope of the fair-value model (Chart 14). That said, the US and Europe are generating much higher inflation than China, suggesting there is higher pressure for unit labor costs to rise in these countries. This will improve the competitive profile of the RMB. Our PPP model for the RMB, using an apples-to-apples consumer basket vis-à-vis the US suggests the RMB is undervalued by 11% (Chart 15). Historically, such levels of undervaluation have seen the RMB appreciate by 2% per year over the next 4 years (Chart 16). Chart 14The RMB Is At Fair Value Based On Productivity Trends
The RMB Is At Fair Value Based On Productivity Trends
The RMB Is At Fair Value Based On Productivity Trends
Chart 15The RMB Is Cheap Based On Relative Prices
The RMB Is Cheap Based On Relative Prices
The RMB Is Cheap Based On Relative Prices
Chart 16Potential RMB Returns For Foreign Investors
Potential RMB Returns For Foreign Investors
Potential RMB Returns For Foreign Investors
Valuation tends to be important because it is usually the trigger for imbalances to manifest themselves. Back in 2015-20162 when Chinese capital outflows (especially illicit flows) were rampant amongst global and Chinese concerns, the RMB also happened to be very overvalued. Today, such a risk is much limited. Concluding Thoughts The RMB and the dollar tend to move in harmony, and so a discussion of one entails talking about the other. We have characterized the dollar this year as caught in a tug of war. Specifically, aggressive rate hikes by the Federal Reserve will boost interest rate differentials in favor of the US but undermine the equity market via a derating in stocks. This will tighten financial conditions, nudging the Fed to pivot. On the other hand, less accommodation by the Fed will significantly unwind the rate-driven rally that has nudged the DXY close to 100. On the other hand, the Chinese credit impulse has bottomed meaning bond investors will benefit from rising bond yields in China. Equity investors will also benefit from a cheaper market, as well as exposure to sectors that are primed to benefit as the global economy reopens. This combination could sustain the pace of foreign capital inflows. In the near term, USD/CNY is due for a bounce and could retrace to 6.5. It is also the case that a lot of the gains in the Chinese RMB have been front loaded, suggesting a flattish path ahead. Beyond the near term, we expect the DXY to hit 90 in the next 12-18 months, which will boost the RMB towards 6.0. Chester Ntonifor Foreign Exchange Strategist chestern@bcaresearch.com Footnotes 1 Reuters: https://www.reuters.com/markets/europe/what-is-chinas-onshore-yuan-clearing-settlement-system-cips-2022-02-28/ 2 Please see Chinese Investment Strategy Special Report, titled “Monitoring Chinese Capital Outflows,” dated March 20, 2019, available at cis.bcaresearch.com Strategic Themes Cyclical Recommendations Tactical Recommendations
Executive Summary The RMB And Real Interest Rates
The RMB And Real Interest Rates
The RMB And Real Interest Rates
The RMB has overshot and will likely consolidate gains in the coming months. The said, the yuan remains underpinned by a current account surplus, positive real rates, and a valuation cushion. This will support modest appreciation over the next 12-18 months (Feature Chart). The dollar is likely to enter a period of weakness beyond the Russo-Ukrainian crisis, underpinning a firm RMB. Yield spreads between China and the US will narrow across the bond curve, slowing the pace of any RMB appreciation. In its quest to dominate Asian trade flows, China will also seek a stable yuan which can be an anchor for regional currencies. Low volatility in the Chinese bond and currency market will increasingly make it an attractive hedge for global portfolio managers. This will encourage RMB inflows. The financial sanctions on Russia from the ongoing Ukrainian conflict will accelerate Chinese diversification from US assets. It will also boost the use of RMB in global trade, lifting its share in global FX reserves. Bottom Line: In the near term, USD/CNY is due for a bounce and could retrace to 6.5. It is also the case that a lot of the gains in the Chinese RMB have been frontloaded, suggesting a flattish path ahead. Beyond the near term, we expect the DXY to hit 90 in the next 12-18 months, which will boost the RMB towards 6.0. Feature The RMB has been strong across the board versus most major currencies (Chart 1). Year-to-date, the DXY dollar index is up 2% while the CFETS basket is up 3%. This places the Chinese yuan as one of the best performing major currencies this year. Such a configuration where USD/CNY diverges from the broad dollar trend has been very rare in recent history (Chart 2). More importantly, this has occurred amidst very low volatility. Chart 1A Bull Market In Yuans
A Bull Market In Yuans
A Bull Market In Yuans
Chart 2USD/CNY And The Dollar Diverge
USD/CNY And The Dollar Diverge
USD/CNY And The Dollar Diverge
In this Special Report, we try to understand the driving forces behind a rising RMB, to gauge its likely path going forward. In our view, while the yuan is vulnerable tactically, it is underpinned by strong structural forces that support modest appreciation over the next 12-18 months. The Chinese Economy, Interest Rates, And The RMB An exchange rate is simply a mechanism to equalize rates of returns across countries. For most currencies, the key determinants of this arbitrage window are real interest rate differentials. In China, while nominal interest rates vis-à-vis the US have been collapsing, real interest rate differentials are near a record high. This has been the key driver of a rising RMB (Chart 3). Real interest rates tend to matter because high and rising inflation destroys the purchasing power of any currency. Our bias is that higher real rates in China versus the US will persist and keep the RMB firm. Five key reasons underpin this view: The Chinese economy is expected to accelerate this year relative to the US. The IMF expects 4.8% GDP growth in China, versus 4% in the US. Bloomberg consensus estimates corroborate this view – 5.2% growth is expected for China this year, versus 3.6% for the US. Even the Chinese government’s GDP growth target this year is 5.5%, much higher than street estimates. US interest rates are likely to rise over the medium term, but so will those in China. The Chinese credit impulse has bottomed, and it is usually a good precursor to both stronger economic activity and higher relative government bond yields (Chart 4). Chart 3The RMB And Real Versus Nominal Rates
The RMB And Real Versus Nominal Rates
The RMB And Real Versus Nominal Rates
Chart 4Interest Rate Differentials And The Credit Impulse
Interest Rate Differentials And The Credit Impulse
Interest Rate Differentials And The Credit Impulse
While Chinese productivity growth is slowing, it remains structurally higher compared to that in the US or Europe. Stronger productivity growth suggests the neutral rate of interest in China will remain higher than in Western economies for years to come. This will continue to attract further fixed-income inflows. The RMB is a procyclical currency and tends to benefit when flows into emerging market assets in general, and Chinese stocks in particular, are fervent. While the Chinese authorities have cracked down on the property and information technology/communication service sectors, they have done so without causing widespread capital flight and hurting the RMB (Chart 5). Going forward, odds are that the interest from foreign bargain hunters will rise as these sectors reset from lower and much cheaper levels. It is well known that the Chinese economy has excess capacity, which is inherently deflationary (and positive for real rates). Like Japan, China has excess savings and deficient demand (Chart 6). However, in an inflationary world, this excess capacity can easily be exported, especially to the US, which is on the verge of overheating. A healthy trade balance in China suggests there is little reason for the RMB to depreciate meaningfully. Chart 6Excess Savings In China And Low Inflation
Excess Savings In China And Low Inflation
Excess Savings In China And Low Inflation
Chart 5The RMB And Chinese Equities
The RMB And Chinese Equities
The RMB And Chinese Equities
It is remarkable that despite being the largest commodity importer in the world, terms of trade in China is picking up. Rising terms of trade is usually synonymous with a stronger currency. On the flip side, a stronger currency will also temper inflationary pressures in China (Chart 7). Chart 7The RMB, Terms Of Trade And Inflation
The RMB, Terms Of Trade And Inflation
The RMB, Terms Of Trade And Inflation
The bottom line is that real interest rates will remain relatively high in China, even as the US begins to tighten monetary policy while China eases. The reason is that the US economy is much more inflationary, and Chinese bond yields tend to rise when the PBoC stimulates growth. Market Liberalization And Portfolio Flows With attractive real yields, Chinese bonds have been gaining widespread investor appeal. Their inclusion in the world’s three major bond indices has been a seminal milestone in the process of liberalizing the Chinese fixed-income market. Chinese bonds have also acted as perfect portfolio hedges, moving inversely to US and global equities (Chart 8). The result has been significant portfolio inflows into Chinese bonds. As a reminder, Chinese bonds were initially included in the Bloomberg Barclays Global Aggregate Index (BBGA) in April 2019. Following that, they were added to the JP Morgan Government Bond - Emerging Market Index (GBI-EM) in February 2020. Finally, FTSE Russell announced their inclusion of in the FTSE World Government Bond Index (WGBI) as of October 2021. Since their inclusion, a net US$350 billion has flowed into Chinese bonds. We estimate that about 35% of that has been due to index inclusion. The amount of Chinese onshore bonds held by overseas investors has breached US$600 billion, a record high (Chart 9). Chart 9A Healthy Appetite From Foreign Investors
A Healthy Appetite From Foreign Investors
A Healthy Appetite From Foreign Investors
Chart 8RMB Bonds As A Portfolio Hedge
RMB Bonds As A Portfolio Hedge
RMB Bonds As A Portfolio Hedge
In a nutshell, the path of the RMB in the short term will follow relative growth dynamics between China and the rest of the world, but structural factors such the inclusion of RMB bonds in global portfolios will underpin strong inflows into the Chinese fixed-income market. The Dollar, Trade, And Lessons From The Ukrainian Conflict Chart 10China Is Destocking USDs
China Is Destocking USDs
China Is Destocking USDs
Another factor to consider vis-à-vis the RMB is the dollar’s reserve status, and the overreach that it commands. Quite simply, transactions conducted in US dollars anywhere fall under US law. This means that if a company in any country buys energy from Iran and the transaction is done in US dollars, the Treasury has powers to sanction the parties involved. Russian holdings of US Treasurys peaked during the Georgian war and have since fallen to near 0% of total reserves. Even so, the world has witnessed how vulnerable the Russian economy has been to a cut-off from the Society For Worldwide Interbank Financial Telecommunication (SWIFT) messaging system. China is the largest holder of US Treasurys and what it decides to do with this war chest of savings is of critical importance. At a minimum, a few trends that have been underway in recent years are likely to accelerate. China will continue to destock its holding of Treasurys into gold and other currencies (Chart 10). This will put downward pressure on the dollar and boost the RMB. In fact, ever since China started destocking Treasurys in earnest in 2015, the DXY has been unable to sustainably punch through the 100 level. Trade flows in Asia remain rather buoyant, even as globalization has peaked (Chart 11A and 11B). With most Asian countries having China as a large trading partner, the logical step will be more and more invoicing in RMB. Most global trade hubs in history (such as Hong Kong for example) have always sought a stable currency with low volatility to instill confidence in trade. China is likely to also favor a stable RMB. Chart 11AChina Could Dominate Asian Trade
China Could Dominate Asian Trade
China Could Dominate Asian Trade
Chart 11BAsian Trade Is Booming
What Next For The RMB?
What Next For The RMB?
As Asian trade continues to expand, the PBoC can step in as the regional central bank and lender of last resort. It is notable that China is already engaging in this role. Since the global financial crisis, the number of bilateral swap lines offered to foreign central banks by the PBoC has ballooned (Chart 12). According to the most recent data (from the PBoC), the Chinese central bank had bilateral local currency swap agreements with central banks or monetary authorities in 40 countries and regions, with a total amount of around 4 trillion yuan. The People’s Bank of China has massive foreign exchange reserves, worth about US$3.2 trillion. This means it can provide swap agreements that will almost cover the totality of EM foreign dollar debt. The Cross-Border Interbank Payment System (CIPS) already allows the transfer and clearing of yuan-denominated payments. In 2021, the system processed US$12.7 trillion, a 75% increase in turnover from the previous year.1 While the system still largely relies on SWIFT messaging for most cross-border transactions, progress towards independence is moving fast. The key point is that as China continues to rise as an economic power and increases the share of RMB trade within its sphere of influence, the yuan will naturally become the de facto Asian currency. This will allow the RMB to continue to gain international appeal (Chart 13). Chart 12The People's Bank Of Asia?
What Next For The RMB?
What Next For The RMB?
Chart 13The RMB And International Appeal
The RMB And International Appeal
The RMB And International Appeal
Valuation Concerns Most of the discussion above has focused on the cyclical outlook for the Chinese economy and bond yields, as well as the geopolitical ramifications from the Russo-Ukrainian conflict. While the macro environment is by far the most important driver of currencies, valuation and sentiment tend to matter as well. On this note: Our productivity model suggests the RMB is at fair value. Productivity in China remains higher than among its western trading partners, but the gap has been closing. This has flattened the slope of the fair-value model (Chart 14). That said, the US and Europe are generating much higher inflation than China, suggesting there is higher pressure for unit labor costs to rise in these countries. This will improve the competitive profile of the RMB. Our PPP model for the RMB, using an apples-to-apples consumer basket vis-à-vis the US suggests the RMB is undervalued by 11% (Chart 15). Historically, such levels of undervaluation have seen the RMB appreciate by 2% per year over the next 4 years (Chart 16). Chart 14The RMB Is At Fair Value Based On Productivity Trends
The RMB Is At Fair Value Based On Productivity Trends
The RMB Is At Fair Value Based On Productivity Trends
Chart 15The RMB Is Cheap Based On Relative Prices
The RMB Is Cheap Based On Relative Prices
The RMB Is Cheap Based On Relative Prices
Chart 16Potential RMB Returns For Foreign Investors
Potential RMB Returns For Foreign Investors
Potential RMB Returns For Foreign Investors
Valuation tends to be important because it is usually the trigger for imbalances to manifest themselves. Back in 2015-20162 when Chinese capital outflows (especially illicit flows) were rampant amongst global and Chinese concerns, the RMB also happened to be very overvalued. Today, such a risk is much limited. Concluding Thoughts The RMB and the dollar tend to move in harmony, and so a discussion of one entails talking about the other. We have characterized the dollar this year as caught in a tug of war. Specifically, aggressive rate hikes by the Federal Reserve will boost interest rate differentials in favor of the US but undermine the equity market via a derating in stocks. This will tighten financial conditions, nudging the Fed to pivot. On the other hand, less accommodation by the Fed will significantly unwind the rate-driven rally that has nudged the DXY close to 100. On the other hand, the Chinese credit impulse has bottomed meaning bond investors will benefit from rising bond yields in China. Equity investors will also benefit from a cheaper market, as well as exposure to sectors that are primed to benefit as the global economy reopens. This combination could sustain the pace of foreign capital inflows. In the near term, USD/CNY is due for a bounce and could retrace to 6.5. It is also the case that a lot of the gains in the Chinese RMB have been front loaded, suggesting a flattish path ahead. Beyond the near term, we expect the DXY to hit 90 in the next 12-18 months, which will boost the RMB towards 6.0. Chester Ntonifor Foreign Exchange Strategist chestern@bcaresearch.com Footnotes 1 Reuters: https://www.reuters.com/markets/europe/what-is-chinas-onshore-yuan-clearing-settlement-system-cips-2022-02-28/ 2 Please see Chinese Investment Strategy Special Report, titled “Monitoring Chinese Capital Outflows,” dated March 20, 2019, available at cis.bcaresearch.com Trades & Forecasts Strategic View Tactical Holdings (0-6 months) Limit Orders Forecast Summary
Executive Summary On a tactical (3-month) horizon, the inflationary impulse from soaring energy and food prices combined with the choke on growth from sanctions will weigh on both the global economy and the global stock market. As such, bond yields could nudge higher, the global stock market has yet to reach its crisis bottom, and the US dollar will rally. But on a cyclical (12-month) horizon, the short-term inflationary impulse combined with sanctions will be massively demand-destructive, at which point the cavalry of lower bond yields will charge to the rescue. Therefore: Overweight the 30-year T-bond and the 30-year Chinese bond, both in absolute terms and relative to other 30-year sovereign bonds. Overweight equities. Overweight long-duration US equities versus short-duration non-US equities. Fractal trading watchlist: Brent crude oil, and oil equities versus banks equities. The DAX Has Sold Off ##br##Because It Expects Profits To Plunge…
The DAX Has Sold Off Because It Expects Profits To Plunge...
The DAX Has Sold Off Because It Expects Profits To Plunge...
…But The S&P 500 Has Sold Off ##br##Because The Long Bond Has Sold Off
...But The S&P 500 Has Sold Off Because The Long Bond Has Sold Off
...But The S&P 500 Has Sold Off Because The Long Bond Has Sold Off
Bottom Line: In the Ukraine crisis, the protection from lower bond yields and fiscal loosening will not come as quickly and as powerfully as it did during the pandemic. If anything, the fixation on inflation and sanctions may increase short-term pain for both the economy and the stock market, before the cavalry of lower bond yields ultimately charges to the rescue. Feature Given the onset of the largest military conflict in Europe since the Second World War, with the potential to escalate to nuclear conflict, you would have thought that the global stock market would have crashed. Yet since Russia’s full-scale invasion of Ukraine on February 24 to the time of writing, the world stock market is down a modest 4 percent, while the US stock market is barely down at all. Is this the stock market’s ‘Wile E Coyote’ moment, in which it pedals hopelessly in thin air before plunging down the chasm? Is this the stock market’s ‘Wile E Coyote’ moment, in which it pedals hopelessly in thin air before plunging down the chasm? Admittedly, since the invasion, European bourses have fallen – for example, Germany’s DAX by 10 percent. And stock markets were already falling before the invasion, meaning that this year the DAX is down 20 percent while the S&P 500 is down 12 percent. But there is a crucial difference. While the DAX year-to-date plunge is due to an expected full-blooded profits recession that the Ukraine crisis will unleash, the S&P 500 year-to-date decline is due to the sell-off in the long-duration bond (Chart I-1 and Chart I-2). This difference in drivers will also explain the fate of these markets as the crisis evolves, just as in the pandemic. Chart I-1The DAX Has Sold Off Because It Expects Profits To Plunge...
The DAX Has Sold Off Because It Expects Profits To Plunge...
The DAX Has Sold Off Because It Expects Profits To Plunge...
Chart I-2...But The S&P 500 Has Sold Off Because The Long Bond Has Sold Off
...But The S&P 500 Has Sold Off Because The Long Bond Has Sold Off
...But The S&P 500 Has Sold Off Because The Long Bond Has Sold Off
During The Pandemic, Central Banks And Governments Saved The Day… We can think of a stock market as a real-time calculator of the profits ‘run-rate.’ In this regard, the real-time stock market is several weeks ahead of analysts, whose profits estimates take time to collect, collate, and record. For example, during the pandemic, the stock market had already discounted a collapse in profits six weeks before analysts’ official estimates (Chart I-3 and Chart I-4). Chart I-3The German Stock Market Is Several Weeks Ahead Of Analysts
The German Stock Market Is Several Weeks Ahead Of Analysts
The German Stock Market Is Several Weeks Ahead Of Analysts
Chart I-4The US Stock Market Is Several Weeks Ahead ##br##Of Analysts
The US Stock Market Is Several Weeks Ahead Of Analysts
The US Stock Market Is Several Weeks Ahead Of Analysts
We can also think of a stock market as a bond with a variable rather than a fixed income. Just as with a bond, every stock market has a ‘duration’ which establishes which bond it most behaves like when bond yields change. It turns out that the long-duration US stock market has the same duration as a 30-year bond, while the shorter-duration German stock market has the same duration as a 7-year bond. Pulling this together, and assuming no change to the very long-term structural growth story, we can say that: The US stock market = US profits multiplied by the 30-year bond price (Chart I-5 and Chart I-6). The German stock market = German profits multiplied by the 7-year bond price (Chart I-7 and Chart I-8). Chart I-5US Profits Multiplied By The 30-Year Bond Price...
US Profits Multiplied By The 30-Year Bond Price...
US Profits Multiplied By The 30-Year Bond Price...
Chart I-6...Equals The US Stock Market
...Equals The US Stock Market
...Equals The US Stock Market
Chart I-7German Profits Multiplied By The 7-Year Bond Price...
German Profits Multiplied By The 7-Year Bond Price...
German Profits Multiplied By The 7-Year Bond Price...
Chart I-8...Equals The German Stock Market
...Equals The German Stock Market
...Equals The German Stock Market
When bond yields rise – as happened through December and January – the greater scope for a price decline in the long-duration 30-year bond will hurt the US stock market both absolutely and relatively. But when bond yields decline – as happened at the start of the pandemic – this same high leverage to the 30-year bond price can protect the US stock market. When bond yields decline, the high leverage to the 30-year bond price can protect the US stock market. During the pandemic, the 30-year T-bond price surged by 35 percent, which more than neutralised the decline in US profits. Supported by this surge in the 30-year bond price combined with massive fiscal stimulus that underpinned demand, the pandemic bear market lasted barely a month. What’s more, the US stock market was back at an all-time high just four months later, much quicker than the German stock market. …But This Time The Cavalry May Take Longer To Arrive Unfortunately, this time the rescue act may take longer. One important difference is that during the pandemic, governments quickly unleashed tax cuts and stimulus payments to shore up demand. Whereas now, they are unleashing sanctions on Russia. This will choke Russia, but will also choke demand in the sanctioning economy. Another crucial difference is that as the pandemic took hold in March 2020, the Federal Reserve slashed the Fed funds rate by 1.5 percent. But at its March 2022 meeting, the Fed will almost certainly raise the interest rate (Chart I-9). Chart I-9As The Pandemic Took Hold, The Fed Could Slash Rates. Not Now.
As The Pandemic Took Hold, The Fed Could Slash Rates. Not Now.
As The Pandemic Took Hold, The Fed Could Slash Rates. Not Now.
As the pandemic was unequivocally a deflationary shock at its outset, it was countered with a massive stimulatory response from both central banks and governments. In contrast, the Ukraine crisis has unleashed a new inflationary shock from soaring energy and food prices. And this on top of the pandemic’s second-round inflationary effects which have already dislocated inflation into uncomfortable territory. Our high conviction view is that this inflationary impulse combined with sanctions will be massively demand-destructive, and thereby ultimately morph into a deflationary shock. Yet the danger is that myopic policymakers and markets are not chess players who think several moves ahead. Instead, by fixating on the immediate inflationary impulse from soaring energy and food prices, they will make the wrong move. In the Ukraine crisis, the big risk is that the protection from lower bond yields and fiscal loosening will not come as quickly and as powerfully as it did during the pandemic. If anything, the fixation on inflation and sanctions may increase short-term pain for both the economy and the stock market. Compared with the pandemic, both the sell-off and the recovery will take longer to play out. In the Ukraine crisis, the big risk is that the protection from lower bond yields and fiscal loosening will not come as quickly and as powerfully as it did during the pandemic. One further thought. The Ukraine crisis has ‘cancelled’ Covid from the news and our fears, as if it were just a bad dream. Yet the virus has not disappeared and will continue to replicate and mutate freely. Probably even more so, now that we have dismissed it, and Europe’s largest refugee crisis in decades has given it a happy hunting ground. Hence, do not dismiss another wave of infections later this year. The Investment Conclusions Continuing our chess metaphor, a tactical investment should consider only the next one or two moves, a cyclical investment should be based on the next five moves, while a long-term structural investment (which we will not cover in this report) should visualise the board after twenty moves. All of which leads to several investment conclusions: On a tactical (3-month) horizon, the inflationary impulse from soaring energy and food prices combined with the choke on growth from sanctions will weigh on both the global economy and the global stock market. As such, bond yields could nudge higher, the global stock market has yet to reach its crisis bottom, and the US dollar will rally (Chart I-10). Chart I-10When Stock Markets Sell Off, The Dollar Rallies
When Stock Markets Sell Off, The Dollar Rallies
When Stock Markets Sell Off, The Dollar Rallies
But on a cyclical (12-month) horizon, the short-term inflationary impulse combined with sanctions will be massively demand-destructive, at which point the cavalry of lower bond yields will charge to the rescue. Therefore: Overweight the 30-year T-bond and the 30-year Chinese bond, both in absolute terms and relative to other 30-year sovereign bonds. Overweight equities. Overweight long-duration US equities versus short-duration non-US equities. How Can Fractal Analysis Help In A Crisis? When prices are being driven by fundamentals, events and catalysts, as they are now, how can fractal analysis help investors? The answer is that it can identify when a small event or catalyst can have a massive effect in reversing a trend. In this regard, the extreme rally in crude oil has reached fragility on both its 65-day and 130-day fractal structures. Meaning that any event or catalyst that reduces fears of a supply constraint will cause an outsized reversal (Chart I-11). Chart I-11The Extreme Rally In Crude Oil Is Fractally Fragile
The Extreme Rally In Crude Oil Is Fractally Fragile
The Extreme Rally In Crude Oil Is Fractally Fragile
Equally interesting, the huge outperformance of oil equities versus bank equities is reaching the point of fragility on its 260-day fractal structure that has reliably signalled major switching points between the sectors (Chart I-12). Given the fast-moving developments in the crisis, we are not initiating any new trades this week, but stay tuned. Chart I-12The Huge Outperformance Of Oil Equities Versus Banks Equities Is Approaching A Reversal
The Huge Outperformance Of Oil Equities Versus Banks Equities Is Approaching A Reversal
The Huge Outperformance Of Oil Equities Versus Banks Equities Is Approaching A Reversal
Fractal Trading Watchlist Biotech To Rebound
Biotech Is Starting To Reverse
Biotech Is Starting To Reverse
US Healthcare Vs. Software Approaching A Reversal
US Healthcare Vs. Software Approaching A Reversal
US Healthcare Vs. Software Approaching A Reversal
Norway's Outperformance Could End
Norway's Outperformance Could End
Norway's Outperformance Could End
Greece’s Brief Outperformance To End
Greece Is Snapping Back
Greece Is Snapping Back
Dhaval Joshi Chief Strategist dhaval@bcaresearch.com Fractal Trading System Fractal Trades
Are We In A Slow-Motion Crash?
Are We In A Slow-Motion Crash?
Are We In A Slow-Motion Crash?
Are We In A Slow-Motion Crash?
6-Month Recommendations Structural Recommendations Closed Fractal Trades Indicators To Watch - Bond Yields Chart II-1Indicators To Watch - Bond Yields ##br##- Euro Area
Indicators To Watch - Bond Yields - Euro Area
Indicators To Watch - Bond Yields - Euro Area
Chart II-2Indicators To Watch - Bond Yields ##br##- Europe Ex Euro Area
Indicators To Watch - Bond Yields - Europe Ex Euro Area
Indicators To Watch - Bond Yields - Europe Ex Euro Area
Chart II-3Indicators To Watch - Bond Yields ##br##- Asia
Indicators To Watch - Bond Yields - Asia
Indicators To Watch - Bond Yields - Asia
Chart II-4Indicators To Watch - Bond Yields ##br##- Other Developed
Indicators To Watch - Bond Yields - Other Developed
Indicators To Watch - Bond Yields - Other Developed
Indicators To Watch - Interest Rate Expectations Chart II-5Indicators To Watch - Interest Rate Expectations
Indicators To Watch - Interest Rate Expectations
Indicators To Watch - Interest Rate Expectations
Chart II-6Indicators To Watch - Interest Rate Expectations
Indicators To Watch - Interest Rate Expectations
Indicators To Watch - Interest Rate Expectations
Chart II-7Indicators To Watch - Interest Rate Expectations
Indicators To Watch - Interest Rate Expectations
Indicators To Watch - Interest Rate Expectations
Chart II-8Indicators To Watch - Interest Rate Expectations
Indicators To Watch - Interest Rate Expectations
Indicators To Watch - Interest Rate Expectations
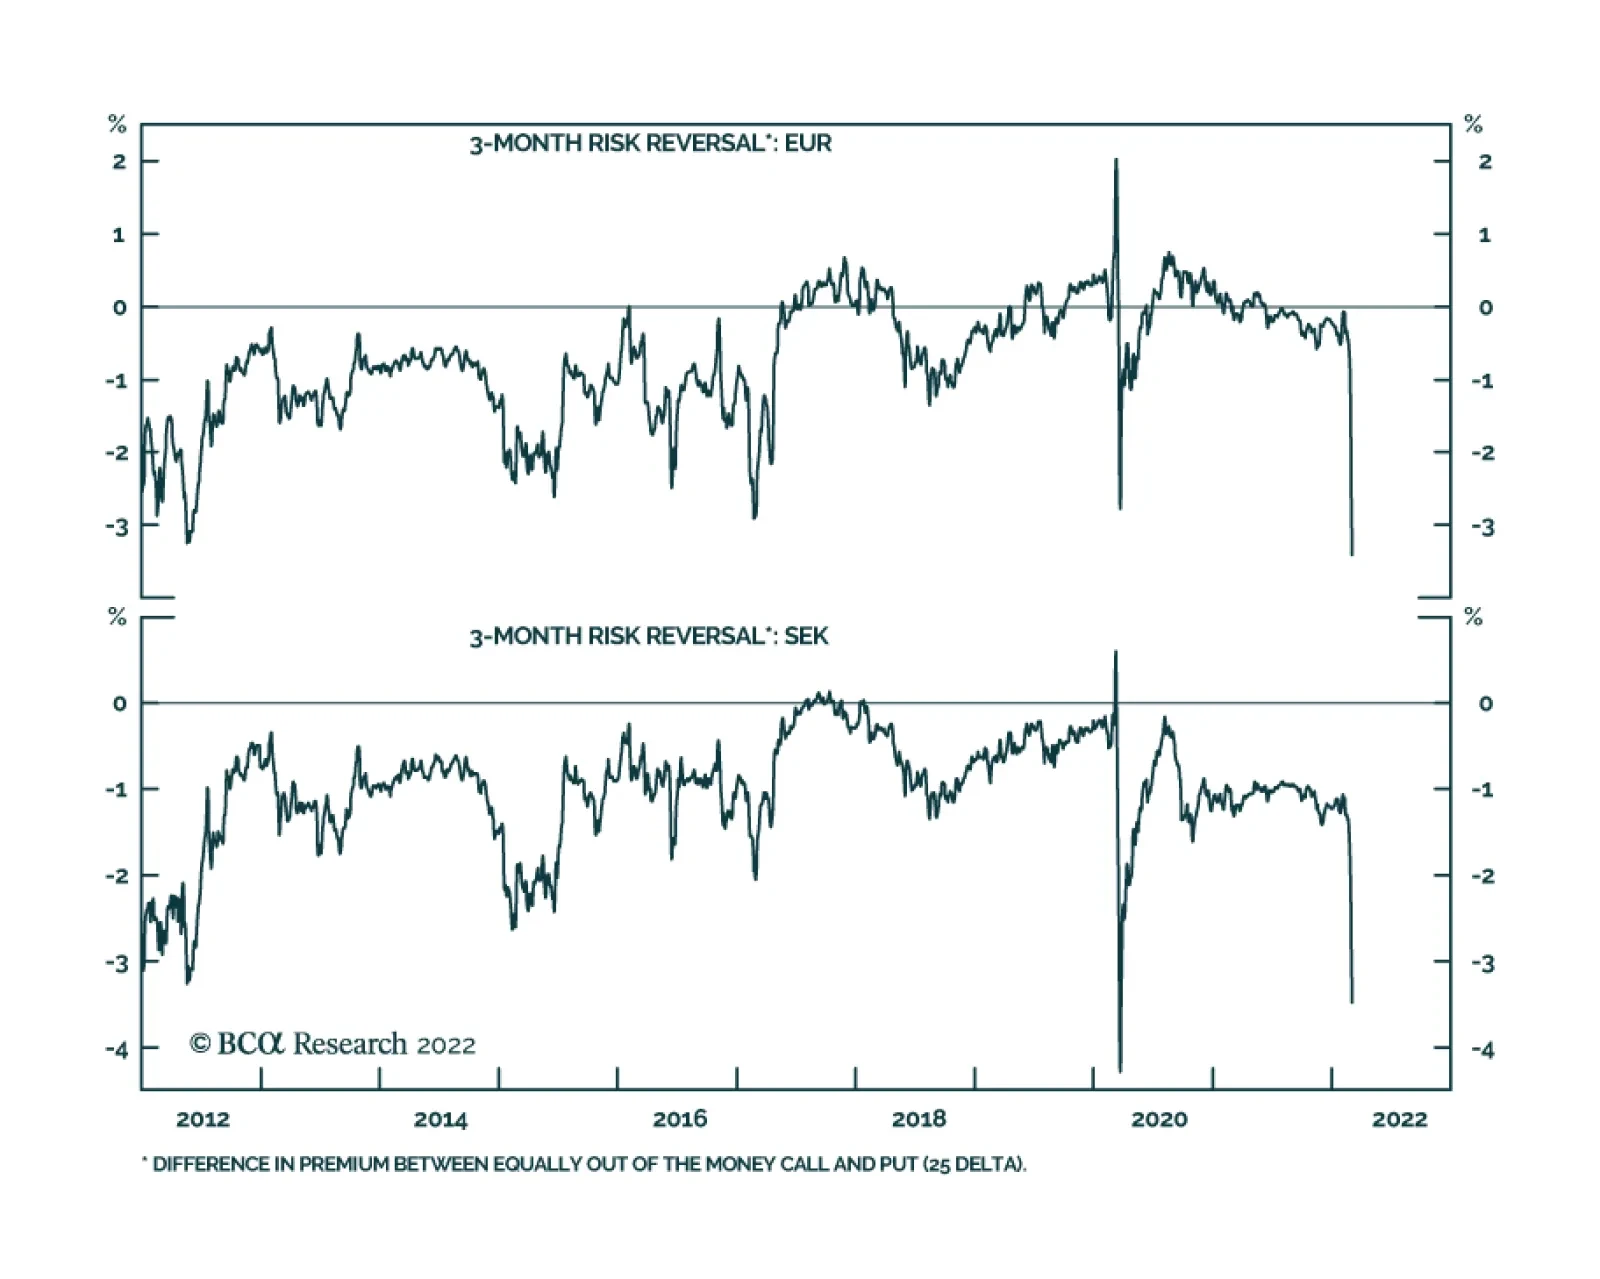
The explosion at the Zaporizhzhia plant in south-eastern Ukraine last week sent shock waves throughout financial markets. Equity prices around the world sold off, bond yields tumbled and the dollar DXY index was a nudge below the 100 level. What may ensue…
Executive Summary No Contagion Yet
No Contagion Yet
No Contagion Yet
The risk of contagion into other FX pairs from the collapse of the RUB remains contained but is rising. The main transmission mechanism will be a global rush into dollars, should the crisis trigger a global recession. For now, European countries with big trade and financial relationships with Russia are the ones in the firing range of any escalation. The euro has already adjusted lower. As such, while the crisis could get worse before it gets better, the broad DXY index is unlikely to rally much beyond 100. Meanwhile, the Federal Reserve will be swift in addressing any offshore dollar funding crises, via facilities revived during the depths of the COVID-19 crisis. Crude prices could be near capitulation highs. A reversal in oil prices (as the forward curve suggests) will benefit oil consumers versus producers. Long EUR/CAD and short NOK/SEK positions are on our shopping list. Recommendations Inception Level Inception Date Return Short NOK/SEK 1.11 Mar 3/2022 - Bottom Line: Bottom Line: If a further escalation in the crisis triggers a global recession, it will lead to another down leg in stocks, and a rally in the dollar. Meanwhile, a détente will allow the bull market in stocks to continue, and the dollar rally to reverse. As we argue below, while the crisis could get worse before it gets better, the broad DXY index is unlikely to rally much beyond 100. Feature The market is treating the Russo-Ukrainian conflict as a localized event that is unlikely to trigger a global recession. While the DXY index is fast approaching the psychological 100 level, other FX pairs forewarning a major risk-off event on the horizon remain rather sanguine. For example, the AUD/JPY cross is toppy but has tracked the mild correction in global stocks. The big losers in the DXY index have been the Swedish krona and the euro, currencies directly in the firing range of any escalation in the crisis (Chart 1). Chart 2Investors Have Bought FX Hedges
Investors Have Bought FX Hedges
Investors Have Bought FX Hedges
Chart 1No Contagion Yet
No Contagion Yet
No Contagion Yet
Specific to the euro, risk reversals — the difference in implied volatility between out-of-the-money calls versus puts — have collapsed below COVID-19 lows. Across a broad spectrum of currencies, investors have been building hedges against losses (Chart 2). The mirror image of this is near record-high net speculative positioning in the dollar. Given this market configuration, the key question is where next? Clearly, if a further escalation in the crisis triggers a global recession, it will lead to another down leg in stocks, and a rally in the dollar. Meanwhile, a détente will allow the bull market in stocks to continue, and the dollar rally to reverse. As we argue below, while the crisis could get worse before it gets better, the broad DXY index is unlikely to rally much beyond 100. A Review Of The Fed Put Chart 3The Fed And Liquidity Crises
The Fed And Liquidity Crises
The Fed And Liquidity Crises
Both a global pandemic and fear of a global war are existential threats which have occurred throughout history. As such, should we survive an escalation in tensions, the DXY could behave as it did during the COVID-19 crisis. Specifically, the pandemic triggered a rush into dollars amidst a global shortage. This was a key reason why the DXY punched above 100. Fast forward to today, and a lot of the facilities that were tapped into during the COVID-19 crisis can be reactivated. A review of the sequence of events back then is instructive: The Fed began by offering unlimited funding through swap lines to five major central banks at the overnight index swap + 25 basis points.1 This was effective as of the week of March 16, 2020 (Chart 3). When this proved insufficient to satiate the demand for dollars, the swap lines were extended to nine more central banks, with a cap of US$60 billion and a maturity of 84 days.2 This was announced on March 19, 2020. Finally, FIMA account holders were allowed to temporarily exchange their Treasury securities held with the Fed for US dollars. This was announced on March 24, 2020. In hindsight, it turned out that the Fed’s actions on March 19 marked the peak in the dollar at 103, even though we continue to live with Covid-19 today. That peak was 5% above current levels. What ensued was a period of volatility, with periodic rallies towards 100, but these provided excellent shorting opportunities for the DXY. The behavior of the DXY today could be more sanguine, with the benefit of hindsight. Barometers Of Contagion Chart 4Defaults Less Likely Outside Russia
Defaults Less Likely Outside Russia
Defaults Less Likely Outside Russia
No two crises are the same. It is likely that holders of Russian US dollar debt will never be made whole, with coupon payments already suspended. As a result, the risk is that investors liquidate other holdings of emerging market dollar bonds to cover margin calls. This will lead to a self-reinforcing spiral which will transform a localized liquidity crisis into a global solvency one. Credit default swaps in major EM economies are rising, as they blow out for Russian debt (Chart 4). That said, there are a few similarities with past Russian incursions: The selloff in Russian debt during the invasion of Crimea was a localized event. The invasion of Georgia took place at the heart of the global financial crisis of 2008. In the former, a self-reinforcing feedback loop of higher refinancing rates and defaults did not ensue. The reaction from other EM currencies and equity markets has been rather constructive, despite the wholesale liquidation in Russian assets (Chart 5). As adjustment mechanisms, currencies are good at sniffing out the risk of contagion. That is not the case yet. Finally, the DXY and the RUB have already decoupled, as they did in previous episodes of a Russian invasion (Chart 6). In the past, this was a good indication that the event was localized, even though the RUB only bottomed after falling 35% and 47% in 2008 and 2014, respectively. While the risk today can be characterized as much greater, this dynamic remains the same (the dollar is up only 1.6% since the incursion). Chart 5Spot The Outlier
Spot The Outlier
Spot The Outlier
Chart 6The Dollar And Rouble Have Already Decoupled
The Dollar And Rouble Have Already Decoupled
The Dollar And Rouble Have Already Decoupled
What is clear is that the longer the conflict lasts, the less likely it is that the Fed will deliver the aggressive rate hikes originally priced by the market this year. This will keep US policy very accommodative, at a time when the real fed funds rate is still well below estimates of neutral (Chart 7). Chart 7The Fed Is Still Very Accomodative
The Fed Is Still Very Accomodative
The Fed Is Still Very Accomodative
The message from the Bank of Canada this week could be a model for other central banks, where quantitative tightening (QT) and rate hikes complement each other. This could signal a slower pace of hikes than the market expects and, in turn, could help lead to a steeping of yield curves, especially as growth eventually recovers. Applying The Russian Template The bigger question for currency markets longer term is what happens to foreign holders of US assets when the dust settles. Russian holdings of US Treasurys peaked during the Georgian war and have since fallen to nearly 0% of total reserves (Chart 8). This has been replaced by gold, RMB assets, euro assets, and other currencies. With US geopolitical rivals having seen how vulnerable the Russian economy has been to a cut-off from the SWIFT messaging system, currency alliances outside the scope of the dollar are likely to solidify. China is the number one contributor to the US trade deficit, which is hitting record lows. It is also the largest holder of US Treasurys, which it continues to destock. This could be a subtle retaliation against past US policies, or perhaps a way to make room for the internationalization of the RMB (Chart 9). What is clear is that nations getting cutoff from the US financial system can only accelerate this trend. Chart 8Template For US Geopolitical Rivals?
Template For US Geopolitical Rivals?
Template For US Geopolitical Rivals?
Chart 9China Has Stopped Recycling Surpluses Into Treasurys
China Has Stopped Recycling Surpluses Into Treasurys
China Has Stopped Recycling Surpluses Into Treasurys
From a broader perspective, the process of reserve diversification out of US dollars, into other currencies has been accelerating in recent years. International Monetary Fund (IMF) data shows that the global allocation of foreign exchange reserves to the US dollar peaked at about 72% in the early 2000s and has been in a downtrend ever since. Meanwhile, allocations to other currencies as well as gold have been surging. Ever since the trend began to accelerate in 2015, the DXY has been unable to sustainably punch through the 100 level (Chart 10). Chart 10The DXY: 100 Is The Line In The Sand
The DXY: 100 Is The Line In The Sand
The DXY: 100 Is The Line In The Sand
Portfolio Strategy Deflationary shocks tend to be bullish for US Treasurys and the dollar. An inflationary dislocation will push investors towards gold (and currencies that act as an inflation hedge such as the NOK, CAD, AUD, and NZD). So far, the market seems to be betting on stagflation, where both Treasury yields and gold rise in tandem (Chart 11). The response of the Federal Reserve will be the key arbiter. A growth slowdown arising from the pandemic will slow the pace of rate hikes. As such, rising inflation and low real yields will reduce the appeal of US Treasurys and boost the appeal of gold in the near term. Historically, this has been bearish for the US dollar (Chart 12). Chart 11Competing Safe-Haven Assets Have Diverged
Competing Safe-Haven Assets Have Diverged
Competing Safe-Haven Assets Have Diverged
Chart 12The Bond-To-Gold Ratio And The Dollar
The Bond-To-Gold Ratio And The Dollar
The Bond-To-Gold Ratio And The Dollar
In our portfolio, we have two trades: A short CHF/JPY position, as we believe the yen will be a better hedge than the franc given higher real rates in Japan; and a long EUR/GBP position, given that the euro is closer to pricing in a recession, compared to the pound (or even the Canadian dollar). We will adjust our positions accordingly as the crisis unfolds. Chester Ntonifor Foreign Exchange Strategist chestern@bcaresearch.com Footnotes 1 These included the Bank of Canada, the Bank of Japan, the Bank of England, the European Central Bank, and the Swiss National Bank. 2 These include the Reserve Bank of Australia, the Banco Central do Brasil, the Danmarks Nationalbank (Denmark), the Bank of Korea, the Banco de Mexico, the Norges Bank, the Reserve Bank of New Zealand, the Monetary Authority of Singapore, and the Sveriges Riksbank. Trades & Forecasts Strategic View Tactical Holdings (0-6 months) Limit Orders Forecast Summary
Executive Summary Russia Not Prepared To Invade West Ukraine Yet
Imbalance Of Terror (GeoRisk Update)
Imbalance Of Terror (GeoRisk Update)
Russia is escalating its aggressiveness in Ukraine, marked by the shelling of a nuclear power station, troop reinforcements, and rhetorical threats of nuclear attack. Global financial markets will continue to suffer from negative news arising from this event until Russia achieves its aims in eastern Ukraine. Private sector boycotts on Russian commodity exports are imposing severe strains on the Russian economy, provoking it to apply more pressure on Ukraine and the West. Western governments are losing the ability to control the pace of strategic escalation, a dangerous dynamic. Moscow’s demand for security guarantees from Finland and Sweden will lead to a further escalation of strategic tensions between Russia and the West. During the Cold War the US and USSR saw a “balance of terror” due to rapidly expanding nuclear arms, which prevented them from waging war against each other. Today the same balance will probably prevent nuclear war but a nuclear scare that rattles financial markets may be required first. Trade Recommendation Inception Date Return Long Gold (Strategic) 2019-12-06 32.1% Bottom Line: Russia’s aggressiveness toward the US and Europe, including nuclear threats and diplomatic demands, will continue to escalate until it achieves its core military objectives. Investors should stick to safe havens and defensive equity markets and sectors on a tactical basis. Book profits on tactical trade long Japan/Germany industrials at close of trading on March 4. Feature Russian military forces shelled the Zaporizhzhia Nuclear Power Station on March 4, causing a fire. The International Atomic Energy Agency (IAEA) declared that “essential equipment” was not damaged and that the facility possessed adequate containment structures to prevent a nuclear meltdown. Local authorities said the facility was “secured.” This incident, which may or may not be settled, should be added to several others to highlight that Russia is escalating its aggression in Ukraine and global financial markets face more bad news that they will be forced to discount. Signposts For Further Escalation Map 1 shows the status of the Russian invasion of Ukraine, along with icons for the nuclear power plants. Map 1War In Ukraine, Status Of Russian Invasion As Of March 2, 2022
Imbalance Of Terror (GeoRisk Update)
Imbalance Of Terror (GeoRisk Update)
To understand the end-game in Ukraine – and why we think the war will escalate and are keeping open our bearish trade recommendations – we need to review our net assessment for this conflict: Our 65% “limited invasion” scenario included the seizure of strategic territory east of the Dnieper river and all of the southern coastline. Energy trade would be exempt from sanctions, saving Europe from a recession and limiting the magnitude of global energy shock. We gave 10% odds to a “full-scale invasion of all of Ukraine” (deliberate wording) because we viewed it as highly unlikely that Russia would invade the mountainous and guerilla-happy far west, the ethnic Ukrainian core. Energy trade would be sanctioned, delivering a global energy shock and European recession. A handful of clients have criticized us for not predicting that Russia would attack Kiev and for not defining a full-scale invasion as one that involved replacing the government. We never gave a view on whether Russia would invade Kiev. It is not clear that the focus on Kiev is warranted since the US and EU had committed to powerful sanctions in the event of any invasion at all. This fixed price of invasion may have given Moscow the perverse incentive to invade Kiev. Either way, Russia invaded Kiev and eastern Ukraine and the US and EU imposed crippling sanctions but exempted the energy trade. Thus anything that breaks off energy trade between the EU and Russia – and any Russian attempt to invade the west of the country to Poland – should be seen as a significant escalation. Unfortunately there are signs that the energy trade is being disrupted. Any westward campaign to Poland will be delayed until Putin sacks Kiev and controls the east and south of Ukraine, at which point he will be forced either to invade the west to cut off the supply lines of the insurgency or, more likely, to negotiate a ceasefire that partitions Ukraine. Global investors will not care about the war in Ukraine as long as strategic stability is achieved between Russia and the West. But that is far away. Today, as Russia’s economic situation deteriorates, Putin is escalating on the nuclear front. Bottom Line: Russia’s showdown with the West is escalating. Good news for the Ukrainians will lead to bad news for financial markets. Global investors should not view the situation as stabilized and should maintain safe haven trades and defensive equity positioning. Energy Boycotts Will Antagonize Russia Chart 1Russia Not Prepared To Invade West Ukraine Yet
Imbalance Of Terror (GeoRisk Update)
Imbalance Of Terror (GeoRisk Update)
So far Russia has not conducted a full-scale invasion of all of Ukraine. The reason is that it does not have the necessary military forces, as we have highlighted. Russia is limiting its invasion force to around 200,000 troops while Ukraine consists of 30 million prime age citizens (Chart 1). Unless Russia massively reinforces its troops, it does not have the basic three-to-one troop ratio that is the minimum necessary to invade, conquer, and hold the entire country. However, Russia is likely to increase troop sizes. We are inclined to believe that Russia has started shifting troops from its southern and eastern military districts to reinforce the Ukraine effort, according to the Kyiv Independent, citing the Ukrainian armed forces’ general staff. Apparently it aims to conquer the east and then either invade further west or negotiate a new ceasefire with greater advantage. Investors should not accept the consensus narrative in the western world that Russia is losing the war in the east. Russia is encountering various difficulties but it is gradually surrounding and blockading Ukraine and cutting its power supply. It is capable of improving its supply lines and increasing the size and destructiveness of its forces. Remember that the US took 20 days to sack Baghdad in 2003. Russia has only been fighting for nine days. Having incurred crippling economic sanctions, Putin cannot afford to withdraw without changing the government in Kiev. The odds of Ukraine “winning” the war are low, while the odds of Russia dramatically intensifying its efforts are high. This is why new developments on the energy front and worrisome: Chart 2Energy Trade Remains The Fulcrum
Imbalance Of Terror (GeoRisk Update)
Imbalance Of Terror (GeoRisk Update)
While western governments refrained from sanctioning Russian energy as predicted, private companies are boycotting Russian energy to avoid sanctions and unpopularity. Estimates vary but about 20% of Russian oil exports could be affected so far.1 Russian oil will make its way to global markets – Russian, Chinese, and other third parties will pick up the slack – but in the meantime the Russian economy is suffering more than expected due to the cutoff. Energy is the vital remaining source of Russian economic stability and Russo-European relations (Chart 2). If it fails then Russia could grow more desperate while Europe’s economy would fall into recession and Europe would become less stable and less coordinated in its responses to the conflict. These private boycotts make it beyond the control of western governments to control the pace and intensity of pressure tactics, since it is politically impractical to demand that companies trade with the enemy. Bottom Line: With the rapidly mounting economic pressure, it should be no surprise that Russia is escalating its threats – it is under increasing economic pressure and wants to drive the conflict to a quick decision in its favor. Russia’s Nuclear Threats And Putin’s Mental State Russia is terrorizing Ukraine and the western world with threats of either nuclear missile attacks or a nuclear meltdown. Putin put the country’s nuclear deterrent forces on “special combat status” on February 27. His forces began shelling the Zaporizhzhia nuclear power plant on March 4. Russia is also demanding security guarantees from Finland and Sweden, which are becoming more favorable toward joining the NATO alliance.2 Their lack of membership in NATO, while maintaining a strong military deterrent with defense support from the US, was a linchpin of stability in the Cold War but is now at risk. They will retain the right to choose their alliances at which point Russia will need to threaten them with attack. Since Russia cannot plausibly invade them with full armies while invading Ukraine, it may resort to nuclear brinksmanship. The western media is greatly amplifying a narrative in which Russia’s actions can only be understood in the context of Putin’s insanity or fanaticism. This may be true. But it is also suspicious because it saves the West from having to address the problem of NATO enlargement, which, along with Russia’s domestic weaknesses, contributed to Russia’s decision over the past 17 years to stage an aggressive campaign to control Ukraine and the former Soviet Union. There is a swirl of conspiracy theories in the news about Putin’s illnesses, age, vaccines, or psychology, none of which are falsifiable. Putin has an incentive to appear reckless and insane so that his enemies capitulate sooner. The decision to invade a non-NATO member, rather than a NATO member, suggests that he is still making rational calculations. Rational, that is, from the perspective of Russian history and an anarchic international system in which nation states that seek to survive, secure themselves, and expand their power. If Ukraine were to become a military ally of the US then Russian security would suffer a permanent degradation. Of course, Putin may be a fanatic and it is possible that he grows desperate or miscalculates. The western public (and global investors) will thus be reminded of the “balance of terror” that prevailed throughout the Cold War, in which the world lived and conducted business under the shadow of nuclear holocaust. Today Russia has 1,588 deployed strategic nuclear warheads, contra the US’s 1,644. Both countries can deliver nuclear weapons via ballistic missiles, submarines, and bombers and are capable of destroying hundreds of each other’s cities on short notice (Table 1). While the US has at times contemplated the potential for nuclear attacks to occur but remain limited, the Soviet Union’s nuclear doctrine ultimately rejected the likelihood of limitations and anticipated maximum escalation.3 Table 1The Return Of The Balance Of Terror
Imbalance Of Terror (GeoRisk Update)
Imbalance Of Terror (GeoRisk Update)
Ultimately the US and Russia avoided nuclear war in the Cold War because it entailed “mutually assured destruction” which violated the law of self-preservation. Neither Stalin nor Mao used nukes on their opponents, including when they lost conflicts (e.g. to Afghanistan and Vietnam). The US tied with North Korea and lost to Vietnam without using nukes. However in the current context the US has been wary of antagonizing Putin for fear of his unpredictable and aggressive posture. In response to Putin’s activation of combat-ready nuclear forces, the US called attention to its own nuclear deterrent subtly by canceling the regular test of a ballistic missile and issuing a press statement highlighting the fact and saying that it was too responsible to bandy in nuclear threats. Yet the autocratic nature of Putin’s regime means that if Putin ultimately does prove to be a lunatic then large parts of the world face existential danger. Our Global Investment Strategist Peter Berezin ascribes Russian Roulette odds to nuclear Armageddon – while arguing that investors should stay invested over the long run anyway. Sanctions on the Russian central bank have frozen roughly half of the country’s $630 billion foreign exchange reserves (Table 2). If the energy trade also stops, then the economy will crash and Putin could become desperate. Table 2Western Sanctions On Russia As Of March 4, 2022
Imbalance Of Terror (GeoRisk Update)
Imbalance Of Terror (GeoRisk Update)
Bottom Line: Global financial markets have yet to experience the full scare that is likely as Russia escalates its aggression and nuclear brinksmanship to ensure it achieves it strategic aims in Ukraine and prevents Finland from joining NATO. GeoRisk Indicators In March In what follows we provide our monthly update of our quantitative, market-based GeoRisk Indicators. Russian geopolitical risk is surging as the ruble and equity markets collapse (Chart 3). The violent swings of the underlying macroeconomic variables as Russia saw a V-shaped recovery from the COVID-19 lockdowns, then sharply decelerated again, prevented our risk indicator from picking up the full scale of the geopolitical risk until recently. But alternative measures of Russian risk show the historic increase more clearly – and it can also be demonstrated by reducing the weighting of the underlying macroeconomic variables relative to the USD-RUB exchange rate in the indicator’s calculation (Chart 4). Chart 3Russian GeoRisk Indicator
Russian GeoRisk Indicator
Russian GeoRisk Indicator
Chart 4Other Measures Of Russian Geopolitical Risk
Other Measures Of Russian Geopolitical Risk
Other Measures Of Russian Geopolitical Risk
This problem of dramatically volatile pandemic-era macro data skewing our risk indicators has been evident over the past year and is more apparent with some indicators than with others. China’s geopolitical risk as measured by the markets is starting to peak and stall but we do not recommend investors try to take advantage of the situation. China’s domestic and international political risk will remain elevated through the twentieth national party congress this fall. The sharp increase in commodity prices will amplify the problem. The earliest China’s political environment can improve substantially is in 2023 after President Xi Jinping cements another ten years’ in power (Chart 5). And yet that very process is negative for long-term political stability. Chart 5China GeoRisk Indicator
China GeoRisk Indicator
China GeoRisk Indicator
British geopolitical risk is contained. It enjoys some insulation from the war on the continent, underpinning our long GBP-CZK trade and long UK equities trade relative to developed markets other than the United States (Chart 6). Chart 6United Kingdom GeoRisk Indicator
United Kingdom GeoRisk Indicator
United Kingdom GeoRisk Indicator
German and French geopolitical risk is being priced higher as expected (Charts 7 and 8). Of these two Germany is the more exposed due to the risk of energy shortages. France is nuclear-armed and nuclear-powered, and unlikely to see a change of president in the April presidential elections. Italian risk was already at a higher level than these countries but the Russian conflict and high energy supply risk will keep it elevated (Chart 9). Chart 7Germany GeoRisk Indicator
Germany GeoRisk Indicator
Germany GeoRisk Indicator
Chart 8France GeoRisk Indicator
France GeoRisk Indicator
France GeoRisk Indicator
Chart 9Italy GeoRisk Indicator
Italy GeoRisk Indicator
Italy GeoRisk Indicator
Canada’s trucker strikes are over and the loonie will benefit from the country’s status as energy producer and insulation from geopolitical threats due to proximity with the United States (Chart 10). Chart 10Canada GeoRisk Indicator
Canada GeoRisk Indicator
Canada GeoRisk Indicator
Spain still has substantial domestic political polarization but this will have little impact on markets amid the Ukraine war. Spain is distant from the fighting and will act as a conduit for liquefied natural gas imports into Europe (Chart 11). Chart 11Spain GeoRisk Indicator
Spain GeoRisk Indicator
Spain GeoRisk Indicator
Australia’s political risk will remain elevated due to its clash with China amid the emerging global conflict between democracies and autocracies as well as the country’s looming general election, which threatens a change of ruling party (Chart 12). However, as a commodity and LNG producer and staunch US ally the country’s risks are overrated. Chart 12Australia GeoRisk Indicator
Australia GeoRisk Indicator
Australia GeoRisk Indicator
Markets are gradually starting to price the risk of an eventual China-Taiwan military conflict as a result of the Ukrainian conflict. China is unlikely to invade Taiwan on Russia’s time frame given the greater difficulties and risks associated with an amphibious invasion of a much more strategically critical territory in the world. But Taiwan’s situation is comparable to that of Ukraine and it is ultimately geopolitically unsustainable, so we expect Taiwanese assets to suffer a higher risk premium over the long run (Chart 13). Chart 13Taiwan Territory GeoRisk Indicator
Taiwan Territory GeoRisk Indicator
Taiwan Territory GeoRisk Indicator
South Korea faces a change of ruling parties in its March 9 general election as well as uncertainties emanating from China and a new cycle of provocations from North Korea (Chart 14). However these risks are probably not sufficient to prevent a rally in South Korean equities on a relative basis as China stabilizes its economy. Chart 14Korea GeoRisk Indicator
Korea GeoRisk Indicator
Korea GeoRisk Indicator
Turkey’s international environment has gotten even worse as a result of Russia’s invasion of Ukraine and effective closure of the Black Sea to international trade. Turkey has invoked the 1936 Montreux Convention to close the Dardanelles and Bosporus straits to Russian warships, although it will let those ships return to home from outside the Black Sea. The Black Sea is highly vulnerable to “Black Swan” events, highlighted by the sinking of an Estonian ship off Ukraine’s coast in recent days. Turkey’s domestic political situation will also generate a political risk premium through the 2023 presidential election (Chart 15), as President Recep Erdogan’s reelection bid may benefit from international chaos and yet he is an unorthodox and market-negative leader, and if he loses the country will be plunged into factional conflict. Chart 15Turkey GeoRisk Indicator
Brazil GeoRisk Indicator
Brazil GeoRisk Indicator
South Africa looks surprisingly attractive in the current environment given our assessment that the government is stable and relatively friendly to financial markets, the next general election is years away, and the search for commodity alternatives to Russia amid a high commodity price context will benefit South Africa (Chart 16). Chart 16South Africa GeoRisk Indicator
South Africa GeoRisk Indicator
South Africa GeoRisk Indicator
India And Brazil: A Tale Of Two Emerging Markets Russia’s invasion of Ukraine will have a minimal impact on the growth engines of India and Brazil. This is because Russia directly accounts for a smidgeon of both these countries trade pie. However, the main route through which this war will be felt in both markets is through commodity prices. Brazil by virtue of being a commodity exporter is better positioned as compared to India which is a commodity importer and is richly valued to boot. The year 2022 promises to be important from the perspective of domestic politics in both countries and will add to the policy risks confronting both EMs. Our Brazilian GeoRisk indicator has collapsed but is highly likely to recover and rise from here (Chart 17). Chart 17Brazil GeoRisk Indicator
Brazil GeoRisk Indicator
Brazil GeoRisk Indicator
Commodity Price Spike – Advantage Brazil Politically India and Brazil have a lot in common today. The popularity ratings of their respective right-leaning heads of states, Prime Minister Narendra Modi in India and President Jair Bolsonaro in Brazil, have suffered over the last two years. The economic prospects of the median voter in both countries have weakened over the last year (Chart 18). Policymakers in both countries face a dilemma: they cannot stimulate their way out of their problems without an adverse market reaction since both countries are loaded with public debt. Chart 18Economic Miseries Rising For Both India's And Brazil's Median Voter
Economic Miseries Rising For Both India's And Brazil's Median Voter
Economic Miseries Rising For Both India's And Brazil's Median Voter
Despite these commonalties, Brazil’s equity markets have outperformed relative to EMs whilst India has underperformed (Chart 19). On a tactical horizon, we expect this divergent performance to continue as the effects of the Russian invasion feed through commodity markets. Chart 19India Is Richly Valued, Brazil Has Outperformed EMs
India Is Richly Valued, Brazil Has Outperformed EMs
India Is Richly Valued, Brazil Has Outperformed EMs
Commodity markets were tight even before the Russian invasion. The ongoing war will force inventories to draw across a range of commodities including oil, iron ore and even corn. Given that India is a net importer of oil whilst Brazil is a net commodity exporter, the current spike in commodity prices will benefit Brazil over India in the short term. However, our Commodity & Energy Strategy team expects supply responses from oil producers to eventually come through, thereby sending the price of Brent crude to $85 per barrel by the end of 2022. Hence if Indian equities correct in response to the current oil spike or domestic politics (see below), then investors can turn constructive on India on a tactical horizon. Elections Stoke Policy Risks – In India And Brazil Results of key state elections in India will be announced on March 10, 2022. Of all the state elections, the results that the market will most closely watch will be those of Uttar Pradesh, the most populous state of India. In a base case scenario, we expect the Bhartiya Janata Party (BJP) which rules this state, to cross the 50% seat share mark and retain power. But the BJP will not be able to beat the extraordinary 77% seat share it won at the 2017 elections in Uttar Pradesh. A sharp deviation from this benchmark may lead the BJP to focus on populism ahead of the next round of state elections due in 4Q 2022. At a time when the Indian government’s appetite to take on structural reforms is waning, we worry that such a populist tilt could perturb Indian equity markets. Also, general elections are due in India in 2024. If the latest state election results suggest that the BJP has ceded a high vote share to regional parties (such as the Samajwadi Party in Uttar Pradesh or Aam Aadmi Party in Punjab), then this would mean that regional parties can pose a credible threat to BJP’s ability to maintain a comfortable majority in 2024. In Brazil, some polls show that left-leaning former president Lula da Silva's lead on President Bolsonaro may have narrowed. While we expect Lula to win the presidential elections due in Brazil in October 2022, the road to victory will not be as smooth as markets expect. If the difference between the two competitors’ popularity stays narrow, then there is real a chance that President Bolsonaro will make a last-ditch effort to cling to power. He will resort to fiscal populism and attacks on Brazil’s institutions, potentially opening up institutional or civil-military rifts that generate substantially greater uncertainty among investors. Bolsonaro already appears to be planning a cut in fuel prices and a bill to further this could be tabled as soon as next week. He has coddled Russian President Putin to shore up his base of authoritarian sentiment at home. To conclude, investors must balance these two opposing forces affecting Brazilian markets today. On one hand are the latent policy risks engendered by a far-right populist who still has a few months left in office. On the other hand, in a year’s time Bolsonaro will likely be gone while Brazil stands to benefit as commodity prices rise and EM investors shift funds into commodity exporters like Brazil. Against this backdrop, we re-iterate our view that investors should take-on selective tactical exposure in Brazil. Risk-adjusted returns in Brazil at this juncture can be maximized by buying into sectors like financials as these sectors’ inherent political and policy sensitivity is low. Postscript: Is India’s Foreign Policy Reverting To Non-Alignment? India traditionally has followed a foreign policy of non-alignment, carefully maintaining ties with both America and Russia through the Cold War. Things changed in the 2000s as Russia under President Putin courted closer ties with China while the US tried to warm up to India. India’s decision to join the newly energized US-led “quadrilateral” alliance in 2017 is a clear sign that India is gradually shedding its historical stance of neutrality and veering towards America. However, this thesis is being questioned as India, like China, is continuing to trade and transact with Russia despite its invasion of Ukraine, providing Russia with a lifeline as it suffers punishing sanctions from the US and European Union. India repeatedly abstained from voting resolutions critical of Russia at the United Nations in recent weeks. In other words, India’s process of transitioning over to the US alignment will be “definitive yet slow,” owing to reasons of both history and practicality. The former Soviet Union’s support played a critical role in helping India win several regional battles like the Indo-Pakistan war of 1971. Russia’s military and security influence in Central Asia makes it useful to India, which seeks a counter to Pakistan on its flank in Afghanistan. India sees Russia as a fairly dependable partner that cannot be abandoned until America is willing to provide much greater and more reliable guarantees and subsidies to India – through military support and beneficial trade deals. The backbone of Indo-Russia relations has been their arms trade (Chart 20). India’s reliance on Russia for arms could decline in the long term. But in the short term, as India tilts towards the US at a calibrated pace, India could remain a source of meaningful defense revenue for Russia. It is possible but not likely that the US would impose sanctions on India for maintaining this trade. Chart 20India Today Is A Key Buyer Of Russian Weapons
Imbalance Of Terror (GeoRisk Update)
Imbalance Of Terror (GeoRisk Update)
The fundamental long-term dynamic is that Russia has foreclosed its relations with the West and will therefore be lashed to China, at least until the Putin regime falls and a Russian diplomatic reset with the West can be arranged. In the face of this combined geopolitical bloc, India will gradually be driven to cooperate more closely with the United States. But India will not lead the transition away from Russia – rather it will react appropriately depending on the US’s focus and resolve in countering China and assisting India’s economy. Matt Gertken Chief Geopolitical Strategist mattg@bcaresearch.com Ritika Mankar, CFA Editor/Strategist ritika.mankar@bcaresearch.com Footnotes 1 Energy Aspects long-term estimate. 2 Tzvi Joffre, “Russian FM repeats nuclear war rhetoric as invasion of Ukraine continues,” Reuters, March 3, 2022. 3 Jack L. Snyder, “The Soviet Strategic Culture : Implications for Limited Nuclear Operations,” Rand Corporation, R-2154-AF (1977), argues that Soviet and American strategic cultures differ greatly and that the US should not be “sanguine about the likelihood that the Soviets would abide by American-formulated rules of intrawar restraint." Strategic Themes Open Tactical Positions (0-6 Months) Open Cyclical Recommendations (6-18 Months) Regional Geopolitical Risk Matrix "Batting Average": Geopolitical Strategy Trades (2022) Section III: Geopolitical Calendar
Executive Summary Russian Stocks Are Breaking Below Their 2008 And 2015 Lows
Russian Stocks Are Breaking Below Their 2008 And 2015 Lows
Russian Stocks Are Breaking Below Their 2008 And 2015 Lows
The Kremlin will not halt its military operations in Ukraine for now. The strategic objective of Putin is to bring Ukraine back into its geopolitical and economic orbit. His immediate goal is to unseat the current government in Kyiv and install a pro-Kremlin administration. Russia is embracing a long period of economic and financial isolation. Russian financial markets will remain uninvestable for an extended period. We are downgrading Central European equities and local currency bonds to underweight within their respective EM portfolios. As a new trade, we recommend shorting the Polish zloty versus the US dollar. Recommendation Inception Date Return Short PLN / Long USD Mar 02, 2022 Bottom Line: The security situation in Europe will continue to deteriorate, especially if the Russian army fails to secure a rapid military victory. This poses a risk to global and EM risk assets. Within a global equity portfolio, investors should overweight the US, and underweight EM and Europe. Feature Global macro has taken a back seat and geopolitics has become the dominant driver of financial markets. Still, we believe geopolitical risks are underappreciated by global financial markets. Will Western Sanctions Halt Russia’s Military Operation? While sanctions have started and will continue to hurt the Russian economy and its financial system, the Kremlin will not halt its military operations in Ukraine for now. The strategic objective of Putin is to bring Ukraine back into its geopolitical and economic orbit. His immediate goal is to unseat the current government in Kyiv and install a pro-Kremlin administration. In fact, having already incurred considerable economic and financial costs, Russia will not pull back its army anytime soon. If anything, Russia’s rhetoric and actions will get more aggressive in the coming weeks. For now, the Kremlin will not agree to anything short of the surrender of Ukraine’s government and its army. In turn, Ukraine authorities and its military intend to continue fighting with the support of arms supplies from the West. As a result, any peace talks will be futile. The situation will thus continue to escalate and the risk premium in global financial markets will rise further. The global political uncertainty index will be rising and, as a rule of thumb, it heralds a lower P/E ratio for global equities (Chart 1). Chart 1Rising Geopolitical Risks = Lower P/E Ratio
Rising Geopolitical Risks = Lower P/E Ratio
Rising Geopolitical Risks = Lower P/E Ratio
The main question is, therefore, how bad could it get? We believe the conflict might take a turn for the worse. If the Russian military fails to achieve its goal to remove the current government in Kyiv, Putin will go all out. Losing this war is not an option for him. The failure of the Kremlin to secure a rapid military victory implies a massive escalation on two fronts: (1) the military actions of the Russian army in Ukraine will intensify and civilian infrastructure and potentially the population at large might be threatened; and (2) Russia will become more aggressive in its threats to the West. If and when Putin perceives that his military operation is failing or his power is threatened at home, he will resort to the extreme actions he has been warning about. Putin will bolster his military threats to Europe and to the US. In such a scenario, global risk assets will tank. Bottom Line: The security situation in Europe will continue to deteriorate, especially if the Russian army fails to secure a rapid military victory. Investors should position their portfolio to account for the fact that things will get worse before they improve. Russian Markets Are Uninvestable Chart 2No Buyers For Russian Bonds
No Buyers For Russian Bonds
No Buyers For Russian Bonds
Russian markets have become uninvestable and will remain so for some time (Chart 2). The elevated odds of further military escalation in Ukraine entails more downside in Russian financial assets. Additional sanctions on the Russian economy cannot be ruled out at this point. These sanctions as well as the capital controls imposed by Russia on both residents and non-residents make Russian financial markets uninvestable. We downgraded Russian stocks to underweight within an EM equity portfolio on December 17, 2021, arguing that geopolitical tensions surrounding Ukraine would escalate. Chart 3 suggests that Russian share prices in USD terms are about to break below their 2008 and 2015 lows. Technically speaking, if this transpires, it will entail considerable downside. Similarly, the ruble versus an equally-weighted basket of the US dollar and euro on a total return basis has formed a technically bearish head-and-shoulders configuration (Chart 4, top panel). Notably, the ruble’s real effective exchange rate based on both CPI and PPI is not as cheap as it was in 1998 and 2015 (Chart 4, bottom panel). Chart 4More Downside In The Ruble
More Downside In The Ruble
More Downside In The Ruble
Chart 3Russian Stocks Are Breaking Below Their 2008 And 2015 Lows
Russian Stocks Are Breaking Below Their 2008 And 2015 Lows
Russian Stocks Are Breaking Below Their 2008 And 2015 Lows
The sanctions have effectively cut off the largest Russian commercial banks1 from the SWIFT electronic system and frozen the central bank of Russia’s (CBR) foreign exchange reserves deposited at foreign institutions. As of June 2021, roughly US$ 377 billion out of US$ 585 billion of Russian foreign exchange reserves were held in Western commercial banks or institutions, most of it in liquid financial securities. Meanwhile, the rest were held either in gold physical holdings (US$ 127 billion) or at Chinese institutions (US$ 80 billion). If all western countries freeze the CRB’s assets held at their banks, Russia’s effective foreign exchange reserves will be down to US$ 207 billion. This assumes the amount of international reserves at western banks has not changed since June 2021. As a result, the ratio of the central bank’s foreign reserves-to-broad money supply (all household and corporate local currency deposits) has dropped from 0.9 to 0.6 (Chart 5). This suggests that the central bank’s available amount of foreign exchange reserves coverage of broad money supply has been reduced dramatically in recent days due to economic and financial sanctions. This and a massive flight of capital out of the country has led the authorities to impose capital controls. Also, the government is compelling domestic exporting firms to sell 80% of their foreign generated revenues. Will the West lift sanctions right after the war in Ukraine ends? We doubt it. In our view, Russia is embracing a long period of economic and financial isolation. Besides, Russia lacks the manufacturing capabilities needed to mitigate the effects of these sanctions. Chart 6 shows that Russia has been investing little outside resource sectors and real estate. At 8-8.5% of GDP, investment in non-resource sectors excluding properties has been too low for too long. Chart 5Russia: FX Reserves' Coverage Of Money Supply
Russia: FX Reserves' Coverage Of Money Supply
Russia: FX Reserves' Coverage Of Money Supply
Chart 6Russia Has Not Been Investing Much
Russia Has Not Been Investing Much
Russia Has Not Been Investing Much
This entails that Russia cannot become self-sufficient in many manufacturing sectors and technology. Trade with China will be the main channel that Russia can secure the manufacturing goods, machinery and technology it requires. Still, this will not allow the Russian economy to avoid a prolonged period of stagflation. Bottom Line: Odds are high that Russian financial markets will remain uninvestable for an extended period. The Russia economy is facing years of stagflation. Central European Financial Markets: Contagion Or An Existential Threat? Chart 7Central European Currencies Will Depreciate
Central European Currencies Will Depreciate
Central European Currencies Will Depreciate
Although Central European countries are not at risk from Russia’s military attack, their financial markets will remain jittery for a while. We are downgrading Polish, Czech and Hungarian equities, currencies and domestic bonds to underweight (Chart 7). The likelihood of strikes on Poland, the Baltic states or any other neighboring NATO member country is very low. Attacking a NATO member would trigger Article V of NATO and force the organization to defend its member. Importantly, we do not think the Kremlin has the appetite for war against NATO. Even though Russia is unlikely to stage an attack on any NATO member, there could still be threats from Moscow and escalation involving central European countries. This will be especially so if Putin fails to secure the change of government in Kyiv in the coming weeks and starts threatening the West due to the latter’s support of Ukraine. As a result, Central European financial markets will continue selling off further in response to this potential escalation. Bottom Line: We are downgrading Central European equities and local currency bonds to underweight within a respective EM universe. We are maintaining the long CZK / short HUF trade. As a new trade, we recommend shorting the Polish zloty versus the US dollar. Investment Recommendations Global share prices will continue selling off. Our US equity capitulation indicator has fallen significantly but is not yet at 2010, 2011, 2015-16 and 2018 levels (Chart 8). It will at least reach this level before the S&P 500 bottoms. Chart 8The S&P 500 Selloff Is Not Over
The S&P 500 Selloff Is Not Over
The S&P 500 Selloff Is Not Over
Our capitulation indicator for EM stocks is not low yet either (Chart 9). Hence, there is more downside. Investors should continue to take a defensive stance. Chart 9EM Stocks: Is There A Capitulation Phase Still Ahead?
EM Stocks: Is There A Capitulation Phase Still Ahead?
EM Stocks: Is There A Capitulation Phase Still Ahead?
Chart 10US Stocks Are About To Resume Their Relative Outperformance
US Stocks Are About To Resume Their Relative Outperformance
US Stocks Are About To Resume Their Relative Outperformance
Within a global equity portfolio, investors should overweight the US, and underweight EM and Europe. As US/global bond yields drop due to geopolitical jitters, the US stock market and growth stocks will resume their outperformance, at least for a period of time (Chart 10). Within an EM equity portfolio, we recommend overweighting Brazil, Mexico, Chinese A-shares, Singapore and Korea and underweighting Russia, Central Europe, South Africa, Indonesia, Turkey, Peru, Chinese Investable Stocks, Colombia and Chile. EM currencies and fixed-income markets remain vulnerable as the global risk off move causes the US dollar to spike. Arthur Budaghyan Chief Emerging Markets Strategist arthurb@bcaresearch.com Andrija Vesic Associate Editor andrijav@bcaresearch.com Footnotes 1 Following the invasion of Ukraine on February 26, the US administration added the two largest Russian banks, Sberbank and VTB Bank, to the sanction lists. Both banks combined total assets represent close to 40% of total Russian banking system assets.
Executive Summary Chinese Onshore Stocks Are Less Impacted By External Factors
Upgrading Chinese Onshore Stocks To Neutral
Upgrading Chinese Onshore Stocks To Neutral
We are upgrading Chinese onshore stocks from underweight to neutral relative to global stocks. At the same time, we are closing our tactical trade of long Chinese investable stocks/short global stocks. In the near term, Russia’s armed invasion of Ukraine will spark a further selloff in global risk assets. Volatility in Chinese onshore stock prices will remain high; A-share prices in absolute terms may also drop but should fall by less than their peers in European and emerging markets. On the other hand, Chinese offshore stocks are more vulnerable to geopolitical risks compared with their onshore counterparts. There are tentative signs that home prices may be stabilizing, although demand for housing remains in deep contraction. Chinese policymakers remain vigilant in preventing the property market from overheating and credit creation from overshooting. However, the ongoing Russia/Ukraine incursion has the potential to catalyze a larger stimulus package in China. If the escalating geopolitical crisis threatens the global economy, China’s authorities will likely strengthen policy supports at home to buttress the country’s domestic political, economic and financial conditions. Bottom Line: Chinese onshore stocks will weather the ongoing geopolitical storm better than their offshore and global peers. China’s economy is also less negatively impacted by the Russia/Ukraine hostilities. If the crisis deepens, China’s leadership will likely step up measures to support its economy and ensure stable domestic financial and political dynamics. Feature The conflict between Russia and Ukraine unnerved global financial markets in the past few weeks. Chinese offshore stocks were not insulated from the geopolitical event; the MSCI China Index declined by about 4% in February, in-line with the selloff in global stocks. Chart 1Chinese Onshore Financial Markets Held Up Relatively Well Last Month
Chinese Onshore Financial Markets Held Up Relatively Well Last Month
Chinese Onshore Financial Markets Held Up Relatively Well Last Month
The current global geopolitical environment, however, has turned us a bit more positive on Chinese onshore stocks in relative terms. In the near term, the onshore market should hold up better than its offshore and European counterparts. China’s closed capital market prevents panic capital outflows and its large current account surplus as well as favorable real interest rate differentials help to maintain strength in the RMB (Chart 1). On a cyclical basis, China’s domestic economic fundamentals will continue to drive prices in the A-share market. China’s aggregate economy is less affected by the Russia/Ukraine conflict than Europe. Energy supplies from Russia to China will likely continue and may even accelerate, mitigating the risks of energy shock-induced inflation spikes. As such, we are upgrading Chinese onshore stocks from underweight to neutral in a global portfolio, both in tactical and cyclical time horizons. We remain cautious about the size of Chinese stimulus for the year and, therefore, are neutral in our cyclical view on Chinese onshore stocks relative to global equities. Despite some nascent signs of reflation and an easing of housing policy in a few Chinese cities, aggregate property demand remains weak and overall policy easing in the sector has been marginal. Nonetheless, the situation surrounding Ukraine and the global sanctions against Russia are highly fluid and may provide some ground for Chinese policymakers to ramp up stimulus at home. If the conflict intensifies and derails the European/global economy, Beijing will be more inclined to adopt measures to ensure the stability of its domestic economy, financial markets and political dynamics. Meanwhile, we are closing our long MSCI China/short MSCI global tactical trade. Chinese offshore stocks are more vulnerable to geopolitical tensions and risk-off sentiment among global investors. The Russia Incursion Has Limited Direct Impact On China’s Economy Chinese stocks were not immune last week to the global financial market’s gyrations triggered by Russia’s invasion of Ukraine. While Russia’s attack on its neighbor will create short-term disruptions on the prices of global commodities and China’s A-shares, the cyclical performance of Chinese onshore stocks is tied to the country’s domestic economic fundamentals. The military conflict between Russia and Ukraine should have a limited knock-on effect on China’s business cycle dynamics for the following reasons: Russia and Ukraine together account for less than 3% of Chinese total exports as of 2021, limiting the negative impact from reduced demand in the region on China’s current account balance. Chart 2Ukraine: China’s Major Source Of Agricultural Commodity Supplies
Upgrading Chinese Onshore Stocks To Neutral
Upgrading Chinese Onshore Stocks To Neutral
Russia’s incursion of Ukraine may have consequences on China’s food prices. Ukraine is a major agricultural commodity exporter to China, hence a prolonged military conflict may disrupt agricultural supplies and push up imported food prices in China (Chart 2). In this scenario, we expect that Beijing will provide subsidies to ease pressures on domestic food prices due to supply shocks, rather than tighten monetary policy to reduce demand. China is unlikely to experience shocks linked to possible energy disruptions. Russia is a core exporter of energy to China and supplies of crude oil, natural gas and coal have increased in recent years (Chart 3). We do not expect that Russia’s energy supply to China will be disrupted. Indeed, following the 2014 Russia’s invasion of Crimea, Russia’s crude oil exports to China increased by 40% (Chart 3, top panel). We anticipate that oil prices will fall from the current level in the second half of the year, limiting the upshot from higher oil prices on Chinese inflation. So far, the US and EU have announced tough sanctions on Russia’s non-energy sectors, but they have avoided halting Russia’s energy exports. In the unlikely scenario that energy flows from Russia to Europe are disrupted in any meaningful and long-lasting way, either through European sanctions or a Russian embargo, Russia would probably turn to China to absorb its energy exports. Given that Russia cannot easily replace Europe with any other alternative market, particularly natural gas, China would gain an upper hand in price negotiations with the Russians (Chart 4). Thus, a steady supply of cheap natural gas and other forms of energy would be a net positive for China’s economy. Chart 4Russia Cannot Easily Replace Europe With Any Alternative Consumer Other Than China
Upgrading Chinese Onshore Stocks To Neutral
Upgrading Chinese Onshore Stocks To Neutral
Chart 3Russia's Ties With China On Energy Supplies Will Likely Strengthen
Russia's Ties With China On Energy Supplies Will Likely Strengthen
Russia's Ties With China On Energy Supplies Will Likely Strengthen
Meanwhile, oil’s current price spike may widen the gap in profits between China’s upstream and downstream industrial enterprises (Chart 5). However, the effect from higher oil prices on Chinese downstream manufacturers should be temporary. Our Commodity and Energy Strategists believe that the Russian invasion will prompt increased production from core OPEC producers. These production increases would reduce prices from last week’s $105 per barrel level to $85 per barrel by the second half of 2022 and keep it at that level throughout 2023 (Chart 6). Chart 6Crude Oil Price Risk Premium Will Abate But Not Disappear
Crude Oil Price Risk Premium Will Abate But Not Disappear
Crude Oil Price Risk Premium Will Abate But Not Disappear
Chart 5Rising Oil Prices May Temporarily Widen Profit Gaps Between China's Up- And Downstream Industries
Rising Oil Prices May Temporarily Widen Profit Gaps Between China's Up- And Downstream Industries
Rising Oil Prices May Temporarily Widen Profit Gaps Between China's Up- And Downstream Industries
Bottom Line: Russia’s invasion of Ukraine should have a limited direct impact on China’s domestic economy, inflation and monetary policy. Tentative Signs Of Home Price Stabilization Although the property market is showing some signs of improvement, the aggregate demand for homes remains very sluggish. Recently released housing data in China show some slight progress, as fewer cities reported a month-on-month drop in new home prices in January (Chart 7). The monthly average new home prices among China’s 70 cities were broadly flat last month following four consecutive months of falling prices. Tier 1 and Tier 2 cities had the largest increases in home prices, whereas prices in other regions continued to contract through January, albeit to a lesser degree (Chart 7, bottom panel). The minor improvement in home prices reflects recently implemented measures to help shore up the flagging market. Last month, the PBoC cut the policy rate by 10 bps and reduced the one- and five-year loan prime rates by 10 bps and 5 bps, respectively. Moreover, last week several regional banks lowered the down payments on mortgages for homebuyers. Chart 8...Demand For Housing Remains In Deep Contraction
...Demand For Housing Remains In Deep Contraction
...Demand For Housing Remains In Deep Contraction
Chart 7Although There Are Some Early Signs Of Stabilization In Home Prices...
Although There Are Some Early Signs Of Stabilization In Home Prices...
Although There Are Some Early Signs Of Stabilization In Home Prices...
Nonetheless, the aggregate demand for housing remains weak. China’s 100 largest developers experienced a roughly 40% year-on-year plunge in total sales in January, indicating that recent easing measures failed to revive the downbeat sentiment among homebuyers (Chart 8). Bottom Line: Policymakers will remain vigilant in not inducing another surge in house prices and will continue to target steady home prices. As such, it is too early to upgrade our cyclical view on China’s property market, stimulus and economic recovery. Investment Conclusions We are upgrading Chinese onshore stocks to neutral relative to global equities (both tactically and in the next 6 to 12 months), while closing our tactical trade of long MSCI China/short MSCI global index. Chart 9Chinese Onshore Stock Prices Are Largely Driven By Domestic Rather Than External Factors...
Chinese Onshore Stock Prices Are Largely Driven By Domestic Rather Than External Factors...
Chinese Onshore Stock Prices Are Largely Driven By Domestic Rather Than External Factors...
Given the limited impact of the Russia/Ukraine conflict on China’s domestic economy and the low correlation to the global equity index, Chinese onshore stock prices may also fall in absolute terms in the coming weeks, but not by as much as their offshore and European counterparts (Chart 9). Furthermore, while we maintain a cautious cyclical outlook for China’s stimulus, the ongoing geopolitical crisis has the potential to provide a catalyst for Chinese policymakers to stimulate the domestic economy more forcefully. If the clash evolves into a real risk to the European economy and global financial markets, odds are high that Chinese policymakers will step up stimulus measures to ensure domestic stability. In this scenario, Chinese onshore stocks will likely outperform global equities. In the past, Chinese authorities refrained from a credit overshoot when the business cycle slowed in an orderly manner, but they stimulated substantially following an exogenous shock. For example, China rolled out massive stimulus packages after the 2008 Global Financial and the 2011/12 European credit crises. Beijing did not directly respond to Russia’s 2014 annexation of Crimea with additional monetary support to China’s domestic economy. However, the Chinese authorities started to aggressively stimulate when a collapse in domestic demand coincided with a global manufacturing recession in 2015. Chart 10...Whereas Chinese Offshore Stocks Are More Vulnerable To Global Risk-Off Sentiment
...Whereas Chinese Offshore Stocks Are More Vulnerable To Global Risk-Off Sentiment
...Whereas Chinese Offshore Stocks Are More Vulnerable To Global Risk-Off Sentiment
The PBoC’s outsized liquidity injection in the interbank system last Friday is also a sign that Beijing is willing to accelerate policy easing if the geopolitical backdrop meaningfully worsens. Regarding Chinese investable stocks, we maintain our cyclical underweight stance relative to global equities. In the near term, risk-off sentiment among global investors will undermine the performance of Chinese offshore stocks in both absolute and relative terms (Chart 10). Over a longer time horizon (6 to 12 months), growth stocks will likely underperform value stocks when global stocks recover. Thus, the tech-heavy MSCI China Index is less attractive to investors compared with other emerging and developed market equities that are more value-centric. Jing Sima China Strategist jings@bcaresearch.com Strategic Themes Cyclical Recommendations Tactical Recommendations