Currencies

Executive Summary Wars Don’t Usually Affect Markets For Long
Monthly Portfolio Update: Keep Calm And Stay Invested
Monthly Portfolio Update: Keep Calm And Stay Invested
We expect the war in Ukraine to stay within its borders, and therefore to have little impact on global growth. Markets will be volatile, but we recommend allocators stay invested – with some moderate hedges in place. The Fed won’t tighten as fast as markets expect, and US long rates will not rise much further this year. So, within fixed-income, we raise government bonds to neutral. Flat rates remove a positive for the Financials equity sector, which we lower to neutral. The oil price will fall back to $85 by the second half, as Saudi and others increase supply. We reduce our recommendation for Canadian equities and the CAD. Recommendation Changes
Monthly Portfolio Update: Keep Calm And Stay Invested
Monthly Portfolio Update: Keep Calm And Stay Invested
Bottom Line: Stay invested in risk assets, but have some hedges. We shift from Financials to the defensive-growth IT sector, raise our weight in UK equities, and suggest long positions in cash, CHF and JPY. Recommended Allocation
Monthly Portfolio Update: Keep Calm And Stay Invested
Monthly Portfolio Update: Keep Calm And Stay Invested
The war in Ukraine is likely to have only a limited impact on markets beyond the short term. As disturbing as the human tragedy is, Russia’s aims are limited to regime change in Kyiv. The European Union and US face restraints on how draconian sanctions against Russia can be, balking (so far at least) at blocking imports of Russian energy to the EU, given how much this would hurt the economy. The risk of the conflict spreading beyond Ukraine’s borders is low, limited perhaps to cyberattacks on Western targets. A Russian attack on a NATO member, such as Poland or one of the Baltic states, is extraordinarily unlikely – though Moldova and Georgia (not NATO members) might be more vulnerable at some point in the future. For more detailed analysis, please read the two reports on the Ukraine situation by our Geopolitical Service that we have made available to all BCA Research subscribers.1 Asset allocators need to look at these events dispassionately. Markets are likely to remain volatile over the coming months, as events in Ukraine unfold. But the lesson of most major conflicts is that they typically do not have a long-lasting impact on asset performance (Chart 1). There is little chance that the Ukraine war will significantly dent global growth. The only exception would be if the oil price were to rise much further to, say, $120 a barrel as some are forecasting. Certainly, in the past, a jump in the oil price has often been associated with recessions – even though the causality is unclear (Chart 2). But BCA’s Energy strategists expect to see an increase in oil supply by Saudi Arabia and Gulf states which will bring Brent crude back to $85 by the second half (from $98 now). Chart 1Wars Don't Usually Affect Markets For Long
Wars Don't Usually Affect Markets For Long
Wars Don't Usually Affect Markets For Long
Chart 2But A Jump In Oil Prices Would
But A Jump In Oil Prices Would
But A Jump In Oil Prices Would
Meanwhile, global growth remains robust, with all major economies expected to continue to grow well above trend this year, supported by robust consumption and capex (Chart 3). And sentiment towards equities has turned very pessimistic since the start of the year, with indicators such the US Association of Individual Investors’ weekly survey at its most bearish level since 2008 (Chart 4). These sort of sentiment levels have typically pointed to a rebound in risk assets. Chart 4Sentiment Is At Rock-Bottom
Sentiment Is At Rock-Bottom
Sentiment Is At Rock-Bottom
Chart 3Economic Growth Still Above Trend
Monthly Portfolio Update: Keep Calm And Stay Invested
Monthly Portfolio Update: Keep Calm And Stay Invested
Our advice now would be to stay invested, but with some moderate safe-haven hedges in place – largely as we have recommended since late last year. We continue to recommend an overweight in cash, but will look to allocate this to risk assets when it becomes clearer how the situation in Ukraine will pan out. The trajectory of markets over the rest of this year still largely comes down to what the Fed and other central banks will do. The hawkish turn by the Fed in December has been the driver of markets in the past two months, with the result that none of the major asset classes have produced positive returns year to-date – only inflation hedges such as commodities and gold (Chart 5). Chart 5Most Asset Classes Are Down Year-To-Date
Monthly Portfolio Update: Keep Calm And Stay Invested
Monthly Portfolio Update: Keep Calm And Stay Invested
The futures market is pricing the Fed to raise rates seven times over the next 12 months, the fastest rate of predicted tightening since the early 2000s (Chart 6). We think that is a little excessive. Inflation, as we have argued previously, is likely to fade over the coming quarters, as the supply response to strong consumer demand for manufactured goods brings down the price of cars, semiconductors, shipping and other major items. The Fed may well start in March with the intention of raising rates by 25bps every meeting, but the slowing of inflation we expect, and the tightening of financial conditions already under way (Chart 7), make it unlikely that it will continue at that pace. And remember that Fed policy will need to be even more hawkish than the market is currently pricing in for it to have an incrementally negative impact on risk assets. Chart 6Market Believes Fed Will Hike Fast
Market Believes Fed Will Hike Fast
Market Believes Fed Will Hike Fast
Chart 7Financial Conditions Have Already Tightened
Financial Conditions Have Already Tightened
Financial Conditions Have Already Tightened
There are certainly risks to this scenario. The forward yield curve is pointing to inversion one year ahead, something which normally presages recession over the following 1-3 years (Chart 8). Higher prices are starting to hurt consumer confidence, though there is a big disparity between the two main US indicators (Chart 9). Chart 8Will Yield Curve Invert Within A Year?
Will Yield Curve Invert Within A Year?
Will Yield Curve Invert Within A Year?
Chart 9Inflation May Be Hurting Consumer Confidence
Inflation May Be Hurting Consumer Confidence
Inflation May Be Hurting Consumer Confidence
What all this boils down to is how high a level of interest rates the economy is able to withstand. The futures markets imply that, in most countries, central banks will raise rates aggressively this year, but then be forced to stop or even cut rates after that because their actions cause an economic slowdown (Table 1). Our view is that the terminal rate is much higher than what is priced by markets and projected by central banks: In the US perhaps 3-4% in nominal terms.2 Even with seven Fed hikes over the next year, the policy rate would therefore remain well below neutral – an environment in which historically equities have outperformed bonds (Chart 10). Table 1Central Banks Will Hike Aggressively – But Then Stop Soon
Monthly Portfolio Update: Keep Calm And Stay Invested
Monthly Portfolio Update: Keep Calm And Stay Invested
Chart 10Even In A Year, Rates Will Be Well Below Neutral
Even In A Year, Rates Will Be Well Below Neutral
Even In A Year, Rates Will Be Well Below Neutral
One final comment: On long-term returns. As a result of the recent moderate equity correction, strong earnings growth, and higher long-term rates, the outlook is somewhat rosier than when we published our most recent report on Return Assumptions in May 2021 – though admittedly forward long-term returns are still likely to be lower than over the past 20 years (Table 2). This is not, then, a time to turn defensive. Table 2Long-Term Return Outlook No Longer Looks So Gloomy
Monthly Portfolio Update: Keep Calm And Stay Invested
Monthly Portfolio Update: Keep Calm And Stay Invested
Fixed Income: In the short-term, government bonds look oversold (Chart 11). With inflation set to peak and the Fed likely to be less hawkish than the market has priced in, we do not see the 10-year US Treasury yield rising more than another 25 basis points or so above its current level this year. Accordingly, we are changing our duration call from underweight to neutral, and raise our recommendation for government bonds within the (still underweight) fixed-income bucket to neutral. For more cautious investors, a slight increase in government bond holdings might be warranted. Within credit, investment-grade bonds still offer little pickup, despite the moderate rise in spreads this year (from 92 to 121 in the US, for example), and so we lower this asset class to underweight. We continue to prefer high-yield bonds, which in the US now imply a jump in the default rate from 1.2% over the past 12 months to 4.5% over the coming year (Chart 12). As long as the economy grows in line with our expectations, that is very unlikely. Chart 11Government Bonds Look Oversold
Government Bonds Look Oversold
Government Bonds Look Oversold
Chart 12Will Defaults Really Jump This Much?
Will Defaults Really Jump This Much?
Will Defaults Really Jump This Much?
Equities: With the economy continuing to grow above-trend, global earnings should remain robust. This will not be a classic year for equity returns, but we expect them to do better than bonds. We continue to prefer US over European equities. As was seen in the aftermath of the invasion of Ukraine, US stocks are more defensive, and European growth will continue to be under threat from higher energy prices (Chart 13). We also move our recommended portfolio a little in the defensive direction by going overweight UK equities (which have a particularly high weight in defensive growth sectors, such as a 13 point overweight in Consumer Staples); we fund this by lowering Canadian equities to underweight, given their close linkage with oil (Chart 14), and the vulnerability of the Canadian housing market to rising rates. We remain underweight EM, but Chinese stocks (which were very oversold in late 2021) have been a relative safe haven as China started to stimulate, and so we continue with our neutral position for now. Chart 13Higher Energy Prices Threaten Europe
Higher Energy Prices Threaten Europe
Higher Energy Prices Threaten Europe
Chart 14Canadian Stocks Move With The Oil Price
Canadian Stocks Move With The Oil Price
Canadian Stocks Move With The Oil Price
Chart 15Financials Not So Attractive If Rates Don't Rise
Financials Not So Attractive If Rates Don't Rise
Financials Not So Attractive If Rates Don't Rise
Our view that long-term rates have limited upside this year makes us more cautious on Financials stocks, which are closely correlated with rates, and so we cut this sector to neutral (Chart 15). A period of slowing growth points towards a preference for defensive growth, and so we raise our recommended weight in the IT sector to overweight from neutral. It is tempting to think of this sector as being composed of ridiculously overvalued speculative internet names, but it is in fact dominated by established hardware and software titans with deep competitive moats (Table 3). While the sector is not exactly cheap, its risk premium over bonds is quite reasonable by historical standards (Chart 16). Table 3Tech Sector Is Not Made Up Of Speculative Stocks
Monthly Portfolio Update: Keep Calm And Stay Invested
Monthly Portfolio Update: Keep Calm And Stay Invested
Chart 16Tech Is Not Unreasonably Priced
Tech Is Not Unreasonably Priced
Tech Is Not Unreasonably Priced
Chart 17Relative Rates Suggest Some Upward Pressure On USD
Relative Rates Suggest Some Upward Pressure On USD
Relative Rates Suggest Some Upward Pressure On USD
Currencies: A neutral position on the US dollar still makes sense. Short-term rates are likely to rise somewhat faster in the US, relative to expectations, than in Europe or Japan (Chart 17). Nevertheless, the USD is expensive, and long-dollar is a consensus trade – reasons why the dollar has risen by less than 1% year-to-date on a trade-weighted basis, despite all the higher rate expectations and geopolitical shocks. Investors looking for hedges against downside risk might look to the Japanese yen, which is particularly cheap, and the Swiss franc. By contrast, the Canadian dollar, like Canadian equities, is closely linked to the oil price and a fallback in the Brent price would be negative; we move underweight. We also raise the CNY to neutral, since it may become a safe haven currency in the current geopolitical situation, though the Chinese authorities won’t let it rise too much since that would slow the economy. Commodities: China’s stimulus remains somewhat halfhearted (Chart 18). Although the credit and fiscal impulse has bottomed, we expect to see it rebound only moderately, with just minor cuts in interest rates and the reserve ratio. This will stabilize Chinese growth, but not cause a boom as in 2020, 2016 or 2013. The rise in industrial commodities prices, therefore, is likely to be limited from here. For oil, as mentioned above, we expect to see Brent crude return to around $85 by the second half, as new supply comes onto the market. Gold has done well, as expected, in the face of a major geopolitical event. But it is expensive by historical standards, vulnerable to a rise in real (as opposed to nominal rates) as inflation eases (Chart 19), and faces cryptocurrencies as a rival. We keep our neutral, as a hedge against the tail-risk of much higher inflation, but would not chase the price at this level. Chart 18China's Stimulus Isn't Enough To Help Metals Prices
China's Stimulus Isn't Enough To Help Metals Prices
China's Stimulus Isn't Enough To Help Metals Prices
Chart 19Rising Real Rates Are Negative For Gold
Rising Real Rates Are Negative For Gold
Rising Real Rates Are Negative For Gold
Garry Evans, Senior Vice President Global Asset Allocation garry@bcaresearch.com Footnotes 1 Please see Geopolitical Strategy Special Reports, “Russia Takes Ukraine: What Next?” dated February 24, 2022, and "From Nixon-Mao To Putin-Xi," dated February 25, 2022. 2 Please see Global Investment Strategy, “The New Neutral” dated January 14, 2022. Recommended Asset Allocation Model Portfolio (USD Terms)
Executive Summary Hopes of an imminent peace deal between Russia and Ukraine will be dashed. The conflict will worsen over the coming days. As was the case during the original Cold War, both sides will eventually forge an understanding that allows the pursuit of mutually beneficial arrangements. A stabilization in geopolitical relations, coupled with fading pandemic headwinds, should keep global growth above trend this year, helping to support corporate earnings. The era of hyperglobalization is over. While central banks will temper their plans to raise rates in the near term, increased spending on defense and energy independence will lead to higher interest rates down the road. How Stocks Fared During The Cuban Missile Crisis
How Stocks Fared During The Cuban Missile Crisis
How Stocks Fared During The Cuban Missile Crisis
Bottom Line: The near-term outlook for risk assets has deteriorated. We are downgrading global equities from overweight to neutral on a tactical 3-month horizon. We continue to expect stocks to outperform bonds on a 12-month horizon as the global economic recovery gains momentum. On an even longer 2-to-5-year horizon, equities are likely to struggle as interest rates rise more than expected. Dear Client, Given the rapidly evolving situation in Ukraine, we are sending you our thoughts earlier than normal this week. We will continue to update you as events warrant it. Best regards, Peter Berezin Chief Global Strategist False Dawn In the lead-up to the invasion, Vladimir Putin assumed that Ukrainian forces would fold just as quickly as US-backed Afghan forces did last summer. He also presumed that the rest of the world would reluctantly accept Russia’s takeover of Ukraine. Both assumptions appear to have been proven wrong. Even if Putin succeeds in installing a puppet government in Kyiv, a protracted insurgency is sure to follow. In the initial days of the invasion, Russian troops generally tried to avoid harming civilians, partly in the hope that Ukrainians would see the Russian military as liberators. Now that this hope has been dashed, a more brutal offensive could unfold. This would trigger even more sanctions, leading to a wider gulf between Russia and the West. It is highly doubtful that sanctions will dissuade Putin from trying to subdue Ukraine. Putin made a name for himself by staging a successful invasion of Chechnya in 1999, just three years after the Yeltsin government had suffered a major defeat there. To withdraw from Ukraine now, without having fomented a regime change in Kyiv, would be a humiliating outcome for him. In this light, BCA’s geopolitical team, led by Matt Gertken, has argued that ongoing peace talks taking place on the border of Ukraine and Belarus are unlikely to amount to much. The situation will get worse before it gets better. Market Implications It always feels a bit crass writing about finance during times like this, but as investment strategists, it is our job to do so. With that in mind, we would make the following observations: Global equities are likely to suffer another leg down in the near term as hopes of an imminent peace deal fizzle. Consequently, we are downgrading our view on global stocks from overweight to neutral on a 3-month horizon. Nimble investors with a low risk tolerance should consider going underweight equities. We are shifting our stance on US stocks from underweight to neutral on a 3-month horizon. Europe could face significant pressures from near-term disruptions to Russian gas supplies. It does not make much sense for Russia to export gas if it is effectively barred from accessing the proceeds of its sales. Central and Eastern Europe will be particularly hard hit (Chart 1). Chart 1Central and Eastern Europe Would Suffer The Most From A Russian Energy Blockade
A New Cold War
A New Cold War
For now, we are maintaining an overweight to stocks on a 12-month horizon. While it will take a month or two, both sides will ultimately forge an understanding whereby Russia and the West continue to publicly bad-mouth each other while still pursuing mutually beneficial arrangements. Remember that during the Cold War, the Soviet Union continued to sell oil to the West. Even the Cuban Missile Crisis had only a fleeting impact on equities (Chart 2). Chart 2How Stocks Fared During The Cuban Missile Crisis
How Stocks Fared During The Cuban Missile Crisis
How Stocks Fared During The Cuban Missile Crisis
Chart 3European Fiscal Policy Will Remain Structurally Looser Over The Coming Years
A New Cold War
A New Cold War
Assuming that any reduction in Russian energy exports is temporary, oil prices will eventually recede. BCA’s commodities team, led by Bob Ryan, expects Brent to settle to $88/bbl by the end of 2022 (down from the current spot price of $101/bbl and close to the forward price of $87/bbl). Like oil, gold prices have upside in the near term but should edge lower once the dust settles. Global growth should remain solidly above trend in 2022 as pandemic-related headwinds fade and fiscal policy turns more expansionary. Even before the Ukraine invasion, the structural primary budget deficit in Europe was set to swing from a small surplus to a deficit (Chart 3). The emerging new world order will lead to sizable additional military spending, as well as increased outlays towards achieving energy independence (new LNG terminals, more investment in renewables, and perhaps even some steps towards restarting nuclear power programs). China will also step up credit easing and fiscal stimulus. This will not only benefit the Chinese economy, but it will also provide some much-needed support to European exporters (Chart 4). While credit spreads are apt to widen further in the near term, corporate bonds should benefit from stronger growth later this year. US high-yield bonds are pricing in a jump in the default rate from 1.3% over the past 12 months to 4.2% over the coming year, which seems somewhat excessive (Chart 5). Chart 4Chinese Policy Will Be A Tailwind For Growth
Chinese Policy Will Be A Tailwind For Growth
Chinese Policy Will Be A Tailwind For Growth
Chart 5Credit Markets Are Pricing In An Excessive Default Rate
Credit Markets Are Pricing In An Excessive Default Rate
Credit Markets Are Pricing In An Excessive Default Rate
Central banks will temper their plans to raise rates in the near term. Investors and speculators are net short duration at the moment, which could amplify any downward move in bond yields (Chart 6). However, over a multi-year horizon, recent events will lead to both higher inflation and interest rates. Larger budget deficits will sap global savings. The retreat from globalization will also put upward pressure on wages and prices. As defensive currencies, the US dollar and the Japanese yen will strengthen in the near term as the conflict in Ukraine escalates. Looking beyond the next few months, the dollar will weaken. On a purchasing power parity basis, the dollar is amongst the most expensive currencies (Chart 7). For example, relative to the euro, the dollar is 22% overvalued (Chart 8). The US trade deficit has doubled since the start of the pandemic, even as equity inflows have dipped (Chart 9). Speculators are long the greenback, which raises the risk of an eventual reversal in dollar sentiment. Chart 6Short Duration Is A Crowded Trade
Short Duration Is A Crowded Trade
Short Duration Is A Crowded Trade
Chart 7The US Dollar Is Overvalued…
A New Cold War
A New Cold War
Chart 8...Especially Against The Euro
A New Cold War
A New Cold War
The freezing of Russia’s foreign exchange reserves will encourage China to diversify away from US dollars towards hard assets such as land and infrastructure in economies where they are less likely to be seized. It will also encourage the Chinese authorities to bolster domestic demand and permit a further modest appreciation of the RMB since these two steps will reduce the current account surpluses that make foreign exchange accumulation necessary. EM currencies will benefit from this trend. Chart 9The Trade Deficit Is A Headwind For The Dollar
The Trade Deficit Is A Headwind For The Dollar
The Trade Deficit Is A Headwind For The Dollar
In summary, the near-term outlook for risk assets has deteriorated. We are downgrading global equities from overweight to neutral on a tactical 3-month horizon. We continue to expect stocks to outperform bonds on a 12-month horizon as the global economic recovery gains momentum. On an even longer 2-to-5-year horizon, equities are likely to struggle as interest rates rise more than expected. Trade Update: We closed our long Brent oil trade for a gain of 24% last week. Earlier today, we were stopped out of the trade we initiated on September 16, 2021 going long the Russian ruble and the Brazilian real. The BRL leg was up 6.2% at the time of termination while the RUB leg was down 23.1% (based on the Bloomberg RUB/USD Carry Return Index as of 4pm EST today). Peter Berezin Chief Global Strategist peterb@bcaresearch.com View Matrix
A New Cold War
A New Cold War
Special Trade Recommendations
A New Cold War
A New Cold War
Current MacroQuant Model Scores
A New Cold War
A New Cold War
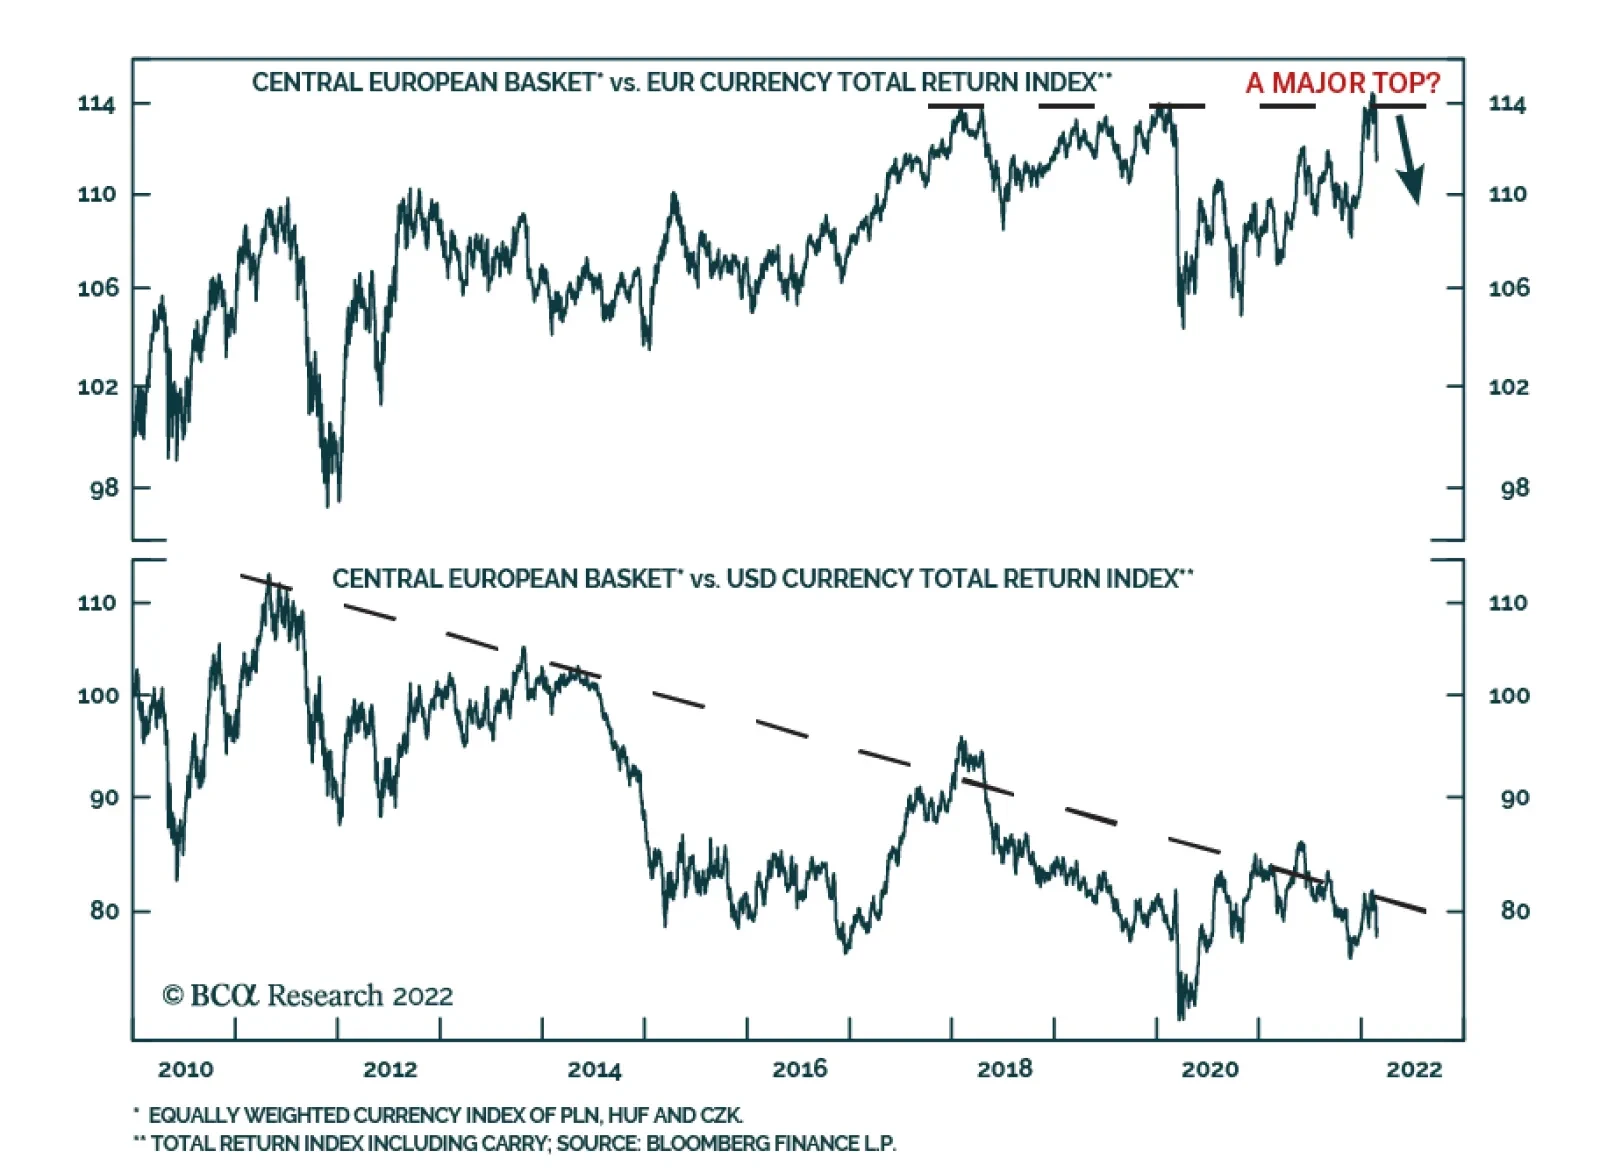
Although Central European countries are not at risk from Russia’s military attack, their financial markets will remain jittery for a while. Central European financial markets, namely Poland, Hungary, and Czech Republic, have sold off due to the ongoing war…
Executive Summary Stronger Capex Than Last Decade
Fallout From Ukraine
Fallout From Ukraine
The fog of war continues, but the worst potential outcome for the market—a freeze of Russian energy exports to Europe—has been avoided. Energy inflation is reaching its apex. Markets will remain volatile in the near term as uncertainty remains elevated in the coming days. Moreover, a transition from a recovery driven by consumer durable goods to services remains a hurdle against near-term European outperformance. Italian bonds and European banks are attractive, but it is not yet prudent to plunge headfirst into the euro. The longer-term consequences of the conflicts point toward greater capex and public deficits in Europe. This will boost the neutral rate of interest and European yields. Industrials and defense stocks are also key structural beneficiaries. Bottom Line: Keep hedges in place for the near term, as uncertainty remains rife. Buy Italian bonds and European banks, which will benefit from ECB support. Industrials still face near-term hurdles but should be a structural overweight position in European equity portfolios, along with financials and defense stocks. Feature The situation in Ukraine is reaching a climax. Following Russia’s recognition of the breakaway Luhansk and Donetsk People’s Republics (LPR and DPR) and its invasion of Ukraine, the S&P 500 entered correction territory. Importantly, the Dow Jones Euro Stoxx 50 is now down 10% since its January 5th high, which validates our repeated call over the past four weeks to hedge risk asset portfolios by selling EUR/CHF and EUR/JPY. An international conflict has begun and a human tragedy is unfolding; but, at the time of writing, it looks like the worst-case scenario for markets will be avoided. Germany is folding Nord Stream 2 indeterminably and Western allies have imposed painful economic sanctions on Russia. However, an expulsion of the SWIFT payment system is not in the cards. This is crucial because it greatly limits the risk that Russia will stop sending natural gas and oil to the EU. Ultimately, neither Russia nor the EU wants this outcome, since it imposes an enormous loss of revenues on the former (which needs hard currency to finance its war) and guarantees a recession for the latter (Chart 1). The war will still cost Europe. European natural gas prices surged again on Thursday, rising by more than 60% intraday. While a spike above EUR200/MWh is unlikely in the absence of an oil embargo, 20% of European natural gas imports pass through Ukraine. The conflict suggests that these flows will remain disrupted for now and that natural gas prices will remain between EUR80/MWh and EUR100/MWh for the next few months. This translates into elevated energy and electricity costs for the EU (Chart 2). Chart 1A European Recession Averted
Fallout From Ukraine
Fallout From Ukraine
Chart 2Peaking But Elevated
Fallout From Ukraine
Fallout From Ukraine
Chart 3Ebbing Energy Inflation
Fallout From Ukraine
Fallout From Ukraine
Oil markets are set to peak soon. The run-up in Brent prices in recent weeks was largely driven by geopolitical concerns. With the odds of an oil embargo declining, the pressure on Brent will also recede. Bob Ryan, BCA’s commodity and energy strategist, believes that Saudi Arabia, the UAE, and Kuwait will increase their own production in coming weeks to burnish their credentials as reliable oil producers, especially if oil experiences more turmoil. Bob expects crude prices to drop to $85/bbl by the second half of 2022. These dynamics are important because they imply that European headline inflation will soon peak. Yes, the recent spike in natural gas prices will keep energy inflation higher for a few more months, but, ultimately, ebbing base effects will bring down energy CPI. As Chart 3 highlights, even if Brent and natural gas prices stay at today’s levels for the remainder of the year, their year-on-year inflation rates will collapse, which will drive HICP lower. Near-Term Market Dynamics In this context, what to do with European assets? It is probably still too early to abandon our hedges, but we will likely do so next week or soon after. While the market has probably bottomed, prudence remains of prime consideration as a war is taking place and the situation on the ground may deteriorate. Chart 4A Buying Opportunity
Fallout From Ukraine
Fallout From Ukraine
The clearest near-term investment implication comes for European peripheral bonds. Italian spreads have widened significantly in the wake of the hawkish pivot by the ECB (Chart 4). However, we argued that, when interest rate expectations priced in 50bps of the hike for 2022, the move was excessive and that only one ECB hike in the fourth quarter was likely this year. Now that the Ukrainian crisis is reaching a climax, even some of the ECB’s most hawkish members, such as Robert Holzmann, Governor of the Austrian National Bank, indicate that the removal of liquidity will be slower than originally anticipated. This means that the ECB is likely to continue to backstop the European peripheral bond markets. Italian and Greek bonds, which offer spreads of 165bps and 249bps over German bunds, are appealing in light of this explicit backstop. European financials are another attractive buy. Investors should buy banks outright. As Chart 5 highlights, all the major Eurozone countries’ banking stocks have suffered widespread selloffs. However, the exposure to Russian debt is limited at $67 billion (Chart 6). Additionally, the European yield curve slope is unlikely to flatten significantly from here. The ECB will limit the upside in the German 2-year yields by not hiking until Q4 2022, while the terminal rate proxy in Europe has significant upside from here. A steeper yield curve will boost the appeal of banks, especially in a context in which peripheral spreads are likely to narrow. Chart 5Too Much Of A Dive
Fallout From Ukraine
Fallout From Ukraine
Chart 6Limited Russian Exposure
Fallout From Ukraine
Fallout From Ukraine
The outlook for the euro is more complex. Narrower peripheral spreads would boost the euro’s appeal, a cheap currency currently trading at a 17% discount to its PPP fair value. EUR/USD also trades at a 5% discount to the BCA Intermediate-Term Timing Model, which suggests that considerable bad news is already embedded in the exchange rate (Chart 7). The fact that the EUR/USD did not close below its January 27th low in the face of a major war on European soil adds to the notion that the euro already embeds a significant risk premium. However, there are still ample reasons to worry about additional volatility in the coming week or so. The ECB is sounding less hawkish, while the Fed is not changing its tone. Meanwhile, 1-month and 3-month risk reversals are not at levels consistent with a bearish capitulation, which suggests that the euro could suffer one last wave of liquidation (Chart 8). Thus, we are not buying the euro yet and are willing to forego the first few cents of gains for a clearer signal. Chart 7EUR/USD Is Cheap
Fallout From Ukraine
Fallout From Ukraine
Chart 8Sentiment Could Get More Negative
Fallout From Ukraine
Fallout From Ukraine
Circling back to the equity front, European equities had become very oversold after the 14-day RSI fell below 30. The diminishing risk of an energy crisis will also help. However, global equities face more risks than just Ukraine. As we wrote earlier this week, the transition away from consumer durable goods as the driver of global growth to services will involve some adjustments for stocks, especially in an environment in which the Fed is allowing global monetary conditions to deteriorate (Chart 9). Thus, the window of volatility in stocks is unlikely to close in the near term. The relative performance of European equities vis-a-vis the US is complex as well. European equities have undone most of the relative gains accrued so far in 2022 (Chart 10). On the one hand, the global growth transition will hurt European equities more than US ones, as a result of their greater exposure to manufacturing activity. Additionally, high energy costs are more of a problem for Europe right now than the US. On the other hand, the continued hawkishness of the Fed is likely to limit the ability of tech stocks to extend the rebound that began last Thursday. As a result, the most likely pattern is for some churning in the relative performance of Europe and the US in the coming week. Chart 10Vanishing Outperformance
Fallout From Ukraine
Fallout From Ukraine
Chart 9Tightening US Liquidity Conditions
Fallout From Ukraine
Fallout From Ukraine
For the remainder of the year, we expect the European equity outperformance to re-establish itself in view of the favorable relative profits picture for 2022, a topic that we will explore more deeply in the coming weeks. Bottom Line: The near-term outlook for European assets remains extremely murky. Not only is a war in Ukraine a major threat that can hurt sentiment further, but European assets still have to handle the short-term implications of a change in global growth leadership away from goods consumption. Nonetheless, the dovish message of the ECB in the wake of the Ukrainian invasion suggests that the collapse in Italian bonds and European banks in recent weeks is overdone. European stocks will likely continue to churn against US stocks in the near term but outperform for the remainder of the year. The sell-off in the euro is advanced, but prudence prevents us from buying EUR/USD today. Keep short EUR/CHF and short EUR/JPY hedges in place for now. Longer-Term Implications The crisis in Ukraine heightens Europe’s need to diversify its energy sourcing away from Russia. However, this is not a transition that can be executed on a dime. It will take years. For now, Europe remains dependent on Russian energy, which greatly limits the EU’s options. However, time offers many more possibilities. First, kicking Russia out of SWIFT will become feasible, because it will increase the robustness of the SPFS payment system, allowing Russia to receive funds for its energy, even if it is out of SWIFT. Second, and most importantly, time will allow Europe to find new energy sources. For example, Qatari LNG is often mentioned as a potential replacement for Russian natural gas. Qatar currently does not have the capacity to service Europe extensively, while fulfilling its previous contractual obligations, but the expansion of the production in its North Field East will increase capacity to 126MTPA by 2027. The LNG export capacity of the US may also increase over the coming years. Even if Qatar and the US could send enough LNG to satisfy the hole left by Russia tomorrow, Europe would not be able to accept delivery, as it does not have enough terminals to accommodate these shipments. Thus, investments in that sector will expand. Chart 11The Renewables Envelope Will Expand
Fallout From Ukraine
Fallout From Ukraine
Chart 12Nuclear Skepticism Remains
Fallout From Ukraine
Fallout From Ukraine
Most importantly, Europe will accelerate its transition toward renewable energy. Renewables are already a major focus of the NGEU program (Chart 11). However, we expect that, for the remainder of the decade, the NGEU program will be enlarged to allow greater investments in that space. Not only does it fit European green goals, but this policy would also increase the region energy security. More investment in nuclear electricity production is also possible but lacks popular support (Chart 12). The main message of these observations is that European infrastructure spending is likely to remain elevated in the coming years. As a result, industrial stocks may face some near-term headwinds as the global economy transitions away from the consumer goods-buying binge of COVID-19, but they will ultimately benefit greatly from an expansion of the capital stock around the world. Another long-term theme derived from the current crisis is that European defense stocks will fare well on a structural basis. The current crisis will force greater European unity. The presence of a common enemy will incentivize European nations to increase military spending, especially as the US continues to pivot toward Asia. Investors should overweight these stocks. In terms of bond market developments, more military spending and investment in energy infrastructures means that European budget deficits will be wider than if the Ukrainian crisis had not emerged. More accommodative fiscal policy will support aggregate demand, which will feed through greater capex (Chart 13). Thus, the experience of the last decade, whereby aggregate demand was curtailed by unnecessarily stringent European fiscal policy, will not be repeated. This confirms our expectation that the neutral rate of interest will rise in Europe and that Europe will escape an environment of zero rates (Chart 14). Therefore, German bunds yields have upside, the yield curve can steepen, and the outlook for European financials is positive on a long-term basis, not just on a near-term one. Chart 13Stronger Capex Than Last Decade...
Fallout From Ukraine
Fallout From Ukraine
Chart 14...Means Higher Yields And A steeper Curve
Fallout From Ukraine
Fallout From Ukraine
Chart 15Ebbing Fixed-Income Outflows?
Fallout From Ukraine
Fallout From Ukraine
Finally, the picture for the euro is murky. On the one hand, its inexpensiveness is a major advantage while a higher neutral rate of interest will limit the European fixed-income outflows that have plagues the Euro for the past decade (Chart 15). However, if we are correct that European capex will increase and that budget deficits will remain wider than in the last decade, this also means that the European current account surplus will narrow as excess savings recede. This implies that one of the key underpinnings of the euro will dissipate. In the end, productivity will be the long-term arbiter of the exchange rate. Europe still lags behind the US on this front, which augurs poorly for the performance of the euro (Chart 16). Reforms and capex may save the day, but it is too early to make this call. Chart 16The Productivity Handicap
Fallout From Ukraine
Fallout From Ukraine
Bottom Line: The events in Ukraine portend a structural shift in European capex. Europe will need to ween itself off its Russian energy dependency, which will require major investments in LNG facilities and renewable power. Moreover, European defense spending will rise. These will continue to support fiscal and infrastructure spending. As a result, industrials will benefit from a structural tailwind, as will European defense stocks. These same forces will put upward pressure on European risk-free yields, which will benefit beleaguered European financials and banks. The long-term outlook for the euro is murkier. More research must be conducted before making a definitive directional bet. Mathieu Savary, Chief European Strategist Mathieu@bcaresearch.com Tactical Recommendations Cyclical Recommendations Structural Recommendations
Dear client, In addition to this weekly report, we sent you a Special Report from our Geopolitical Strategy service, highlighting the risk from the Russo-Ukrainian conflict. Kind regards, Chester Executive Summary The Ukraine crisis will lead to a period of strength for the DXY. Countries requiring foreign capital will be most at risk from an escalation in tensions. Portfolio flows have reaccelerated into the US, on the back of a rise in Treasury yields. This will be sustained in the near term. The euro area on the other hand has already witnessed significant portfolio outflows, on the back of Russo-Ukrainian tensions and an energy crisis. Countries with balance of payment surpluses like Switzerland and Australia are good havens amidst the carnage. Oil-producing countries such as Norway and Canada have also seen an improvement in their balance of payments, on the back of a strong terms-of-trade tailwind. This will be sustained in the near term. Balance Of Payments Across The G10
The Ukraine Crisis And Balance Of Payments
The Ukraine Crisis And Balance Of Payments
Bottom Line: The dollar is king in a risk-off environment. That said, the US and the UK sport the worst balance of payments backdrops, while Norway, Switzerland, and Sweden have the best. This underpins our long-term preference for Scandinavian currencies in an FX portfolio. In the near term, we think the DXY will peak near 98-100, but volatility will swamp fundamental biases. Feature Chart 1The US Runs A Sizeable Deficit
The Ukraine Crisis And Balance Of Payments
The Ukraine Crisis And Balance Of Payments
The Russia-Ukraine conflict continues to dictate near-term FX movements. With Russia’s invasion of Ukraine, the risk of escalation and/or a miscalculation has risen. FX volatility is increasing sharply, and with it, the risk of a further selloff in currencies dependent on foreign capital inflows. As a reserve currency, the dollar has also been strong. It is difficult to ascertain how this imbroglio will end. However, in this week’s report, we look at which currencies are most vulnerable (and likely to stay vulnerable) from a balance of payments standpoint. Chart 1 plots the basic balance – the sum of the current account balance and foreign investment – across G10 countries. It shows that at first blush, Norway, Switzerland, Sweden, and Australia are the most resilient from a funding standpoint, while New Zealand, the UK, and the US are the most vulnerable. In Chart 2, we rank G10 currencies on eight different criteria: The basic balance, which we highlighted above. Real interest rate differentials, using the 10-year tenor and headline inflation. Relative growth fundamentals, as measured by the Markit manufacturing PMI. Three fair value models which we use in-house. The first is our Purchasing Power Parity model, which adjusts consumption basket weights across the G10 to reflect a more apples-to-apples comparison. The second is our long-term fair value model (LTFV), which adjusts for productivity differentials between countries; and the final is our intermediate-term timing model (ITTM), which separates procyclical from safe-haven currencies by including a risk factor such as corporate spreads. All three models are equally weighted in our rankings. The net international investment position (NIIP), which highlights currencies that are most likely to witness either repatriation flows or a positive income balance in the current account. Finally, net speculative positioning, which tells us which currencies have crowded long positions, and which ones sport a consensus sell. Chart 2The Scandinavian Currencies Are Attractive
The Ukraine Crisis And Balance Of Payments
The Ukraine Crisis And Balance Of Payments
The conclusions from this chart are similar to our basic balance scenario – NOK, SEK, AUD, CHF, and JPY stand out as winners while GBP, NZD, and USD are the least attractive. The US dollar is a special case given its reserve currency status, with a persistent balance of payments deficit. The rise in the greenback amidst market volatility is a case in point. However, portfolio flows into the dollar also tend to be cyclical, so a resolution in the Ukraine/Russia conflict will put a cap on inflows. Equity portfolio flows had dominated financing of the US current account deficit but are relapsing (Chart 3). Bond portfolio flows have rebounded on the back of rising US yields, but US TIPS yields remain very low by historical standards (Chart 4). If they do not improve much further, specifically relative to other developed markets, it will be tough to justify further inflows into US Treasurys. Chart 3Equity Portfolio Flows Into The US Are Relapsing
Equity Portfolio Flows Into The US Are Relapsing
Equity Portfolio Flows Into The US Are Relapsing
Chart 4Bond Portfolio Flows Into The US Are Strong
Bond Portfolio Flows Into The US Are Strong
Bond Portfolio Flows Into The US Are Strong
In this week’s report, we look at the key drivers of balance of payments dynamics across the G10, starting with the US, especially amidst a scenario where the forfeit of foreign capital could come to the fore. United States Chart 5US Balance Of Payments
US Balance Of Payments
US Balance Of Payments
The US trade deficit continues to hit record lows at -$80.7 billion for the month of December. Over the last few years, it has become increasingly difficult to fund this widening trade deficit via foreign purchases of US Treasurys. A positive net income balance has allowed a slower deterioration in the US current account balance, though at -$214.8 billion for Q3, it remains close to record lows. The overall picture for both the trade and current account balance is more benign as a share of GDP, given robust GDP growth (Chart 5). That said, as a share of GDP, the trade balance stands at -3.5%, the worst in over a decade. Foreign direct investment into the US has been improving of late. This probably reflects an onshoring of manufacturing, triggered by the Covid-19 crisis. That said, despite this improvement, the US still sports a negative net FDI backdrop. In a nutshell, the basic balance in the US (the sum of the current account and foreign direct investment) is still deteriorating. The dollar tends to decline on a multi-year basis when the basic balance peaks and starts worsening. Euro Area Chart 6Euro Area Balance Of Payments
Euro Area Balance Of Payments
Euro Area Balance Of Payments
The trade balance in the euro area has significantly deteriorated in recent quarters, on the back of an escalating energy crisis. Russia’s invasion of Ukraine marks the cherry on top. On a rolling 12-month basis, the trade surplus has fallen to 1% of GDP (Chart 6). This is particularly telling since for the month of December, the trade balance came in at €-4.6 billion, the worst since the euro area debt crisis. The current account continues to post a surplus of 2.6% of GDP, on the back of a positive income balance. However, FDI inflows are relapsing. After about two decades of underinvestment in the euro area, FDI inflows were at their highest level, to the tune of about 2% of GDP in 2021. Those have now completely reversed on the back of uncertainty. The combination of an energy crisis and dwindling FDI is crushing the euro area’s basic balance surplus. A rising basic balance surplus has been one of the key pillars underpinning a bullish euro thesis. Should the deterioration continue, it will undermine our longer-term bullish stance on the euro. It is encouraging that portfolio investments have turned less negative in recent quarters, as bond yields in the euro area are rising. Should this continue, it will be a good offset to the deterioration in FDI. Japan Chart 7Japan Balance Of Payments
Japan Balance Of Payments
Japan Balance Of Payments
Like the euro area, the trade balance in Japan continues to be severely hampered by rising energy imports. The trade deficit in January deteriorated to a near record of ¥2.2 trillion, even though export growth remained very robust. Income receipts from Japan’s large investment positions abroad continue to buffer the current account, but a resolution to the energy crisis will be necessary to stem Japan’s basic balance from deteriorating (Chart 7). The process of offshoring has sharply reversed since the Covid-19 crisis. While FDI is still deteriorating, it now stands at -2.4% of GDP, compared to -4.3% just before the pandemic. Net portfolio investments are also accelerating, especially given the rise in long-term interest rates in Japan, positive real rates, and the value bias of Japanese equities. We are buyers of the yen over the long term, but a further rise in global yields and energy prices are key risks to our view. United Kingdom Chart 8UK Balance Of Payments
UK Balance Of Payments
UK Balance Of Payments
The UK has the worst trade balance in the G10, and the picture has not improved much since the pandemic (currently at -6.7% of GDP). Similar to both the euro area and Japan, much of the drag on the trade balance has been due to rising import costs from energy and fuels. This puts the UK at risk of an escalation in the conflict between Ukraine and Russia. Meanwhile, the improvement in the income balance over the last few years has started to deteriorate, as transfer payments under the Brexit withdrawal agreement kick in. As a result, the current account balance is deteriorating anew (Chart 8). Both portfolio and direct investment in the UK were robust in the post-Brexit environment but have started to deteriorate. This is critical since significant foreign investment is necessary to boost productivity in the UK and prevent the pound from adjusting much lower. With bond yields in the UK rising, and the FTSE heavy in cyclical stocks, this should limit further deterioration in the UK’s financial account. A significant drop in the estimated path of settlement payments for Brexit will also boost the income balance. The key for the pound over the coming years remains how fast the UK can improve productivity, which will convince foreign investors that the return on capital for UK assets will increase. Canada Chart 9Canada Balance Of Payments
Canada Balance Of Payments
Canada Balance Of Payments
Canada’s domestic economy has been relatively insulated from the geopolitical shock in Europe, but its export sector is benefiting tremendously from it. Rising oil prices are boosting Canadian terms of trade. As a result, the current account has turned into a surplus for the first time since 2009, in part driven by an improving trade balance (Chart 9). Outside of trade, part of the improvement in the Canadian current account balance is specifically driven by income receipts from Canada’s positive net international investment position. At C$1.5 trillion, income receipts are becoming an important component of the current account balance. Foreign direct investment into Canada continues to remain robust, given strong commodity prices. This is boosting our basic balance measure, which today sits at a surplus of 2.4% of GDP and should continue to improve. Finally, because of Canada’s improving balance-of-payments backdrop, it is no longer reliant on foreign capital as it had been in the past, which supports the loonie. Australia Chart 10Australia Balance Of Payments
Australia Balance Of Payments
Australia Balance Of Payments
Australia continues to sport the best improvement in both its trade and current account balances over the last few years. As a result, the basic balance has eclipsed 4% of GDP for the first time since we have been measuring this series (Chart 10). The story for Australia remains improving terms of trade, specifically in the most desirable commodities – copper, high-grade iron ore, liquefied natural gas, and to a certain extent, high-grade coal. Foreign direct investment in Australia has eased significantly. Investment in projects in the resource space are now bearing fruit, easing the external funding constraint. Meanwhile, domestic savings can now be easily recycled for sustaining capital investment. In fact, foreign direct investment turned negative in Q4 2021. This also explains the drop in net portfolio investment since Australians now need to build a positive net international investment position. We have a limit buy on the Aussie dollar at 70 cents, as we are bullish the currency over a medium-term horizon. New Zealand Chart 11New Zealand Balance Of Payments
New Zealand Balance Of Payments
New Zealand Balance Of Payments
For the third quarter of 2021, New Zealand’s current account balance hit record lows, despite robust commodity (agricultural) prices. Imports of fertilizers, crude oil, and vaccines have led to a widening trade deficit. A drop in the exports of wood also affected the balance. With a negative net international investment position of about 48% of GDP, the income balance also subtracted from the current account total (Chart 11). From a bigger-picture perspective, New Zealand’s basic balance has been negative for many years, as coupon and dividend payments to foreign investors, as well as valuation adjustments from net foreign liabilities, have kept the current account in structural deficit. However, as the prices of key agricultural goods head higher, New Zealand can begin to benefit from a terms-of-trade boom that will limit its external funding requirement. In that respect, portfolio investments are also improving. New Zealand has the highest bond yield in the G10, on the back of the highest policy rate so far (the RBNZ raised interest rates again this week). New Zealand’s defensive equity market has also corrected sharply amidst the general market riot. As such, foreign investors could begin to favor this market again based on high yields and a reset in valuations. Going forward, New Zealand should continue to see further improvement in its basic balance relative to the US, supporting the kiwi. Switzerland Chart 12Switzerland Balance Of Payments
Switzerland Balance Of Payments
Switzerland Balance Of Payments
The Swiss trade balance remains in a structural surplus, with a post Covid-19 boom that has led a new high as a share of GDP (Chart 12). Global trade has been rather resilient due to high demand for goods. While Switzerland has a large net international investment position, income flows this quarter were hampered by servicing costs for foreign direct investments. The net international investment position did improve by CHF27 billion on a quarter-over-quarter basis in Q3, on the back of a net increase in foreign asset purchases. Currency movements also had little impact on the portfolio in Q3, which is atypical. The SNB will always have to contend with a structural trade surplus that puts upward pressure on the currency. This will keep the Swiss franc well bid, especially in times of crisis when the positive balance-of-payments backdrop makes the CHF a safe haven. Norway Chart 13Norway Balance Of Payments
Norway Balance Of Payments
Norway Balance Of Payments
Q3 2021 saw a strong recovery in Norway’s trade account that is likely to carry over to this year. A recovery in crude oil and natural gas prices was a welcome boon. The lack of tourism also boosted the services account (Norwegians travel and spend less abroad than foreigners visiting Norway). The ongoing electricity crisis in Europe was also an opportune export channel for Norway, which for the first time, opened its 450-mile-long, 1400-megawatt North Sea cable link to the UK. Positive income flows also benefit the current account and the krone (Chart 13). With one of the largest NIIPs in the world heavily skewed towards equity dividends, the NOK benefits when yields rise, even though the domestic fixed-income market is highly illiquid. While a resolution of the Russian-Ukrainian crisis could sap the geopolitical risk premium from oil, the reopening of the global economy will benefit Norwegian exports of oil and gas. Tepid investment in global oil and gas exploration will also ensure Norway’s terms of trade remain robust. Sweden Chart 14Sweden Balance Of Payments
Sweden Balance Of Payments
Sweden Balance Of Payments
The Swedish current account balance has deteriorated slightly in the last few quarters, on the back of supply-side bottlenecks. Particularly, exports of cars have been hampered amidst a semiconductor shortage. That said, the primary income surplus remains a key pillar of the current account, keeping the basic balance at a healthy surplus of about 6% of GDP (Chart 14). Portfolio inflows into Sweden have dwindled, like most other European economies. If this has been due to geopolitical tensions in Europe, it will eventually prove to be fleeting. That said, the Riksbank remains one of the most dovish in the G10 and the OMX is also one of the most cyclical stock markets, which may have spooked short-term foreign investments. The Swedish krona has been the weakest G10 currency year-to-date. Given that we expect most of the headwinds to be temporary, and the basic balance backdrop remains solid, we will go long SEK versus both the euro and the US dollar. Chester Ntonifor Foreign Exchange Strategist chestern@bcaresearch.com Trades & Forecasts Strategic View Cyclical Holdings (6-18 months) Tactical Holdings (0-6 months) Limit Orders Forecast Summary
Highlights The buildup of excessive household debt in Canada over the past two decades has occurred because of outsized demand for housing, not because of the impact of constrained housing supply on house prices. Outsized demand for housing has occurred because interest rates have been persistently too low, pointing to the need for the Bank of Canada to tighten monetary policy in order to prevent even further leveraging. The burden of Canada’s household sector debt may exceed its pre-pandemic level next year given current market expectations for the path of rate hikes. This implies that the prior peak in the Canadian policy rate (1.75%) likely reflects a high-end estimate of the neutral rate of interest in Canada. Regulatory changes have occurred in recognition of Canada’s extreme levels of household debt. Although a massive decline in Canadian house prices would cause a very severe recession, it would not likely precipitate a Lehman-style collapse of the Canadian financial system. Over the next twelve months, investors should position favorably toward CAD-USD. As the Canadian policy rate approaches our estimate of the neutral rate, a short CAD position and an overweight stance towards long-maturity Canadian bonds versus US Treasurys will likely be warranted. Within a global equity portfolio, exposure to relatively high-yielding Canadian banks should not be reduced until hard evidence of a significant slowdown in the housing market emerges. Feature The outlook for monetary policy in advanced economies has shifted rapidly in a hawkish direction over the past few months. While we believe that the Fed and other central banks will end up raising interest rates this year fewer times than investors currently expect, it is clear that monetary policy will tighten in the DM world over the coming 12-18 months. This has raised the question of how high policy rates may rise before monetary policy begins to restrict economic activity. Some investors have specifically focused this question on countries like Canada, which has a highly indebted household sector and has seen house prices rise at a 7% average annual pace for the past 20 years. In this report, we explore the root cause of Canada’s extreme household debt and argue against the constrained housing supply view. Instead, we conclude that persistently low interest rates have fueled excessive housing demand and that the prior peak in the Canadian policy rate (1.75%) probably reflects a high-end estimate of the neutral rate of interest in Canada – in contrast with that of the US. Finally, we note that the regulatory changes that have occurred in recognition of the risk from excessive household debt suggest that a massive decline in Canadian house prices would not likely precipitate a Lehman-style collapse of the Canadian financial system – it would, however, clearly cause a severe recession. Over the next twelve months, investors should position favorably toward CAD-USD. As the Canadian policy rate approaches our estimate of the neutral rate, a short CAD position and an overweight stance towards long-maturity Canadian bonds versus US Treasurys will likely be warranted. Within a global equity portfolio, exposure to relatively high-yielding Canadian banks should not be reduced until hard evidence of a significant slowdown in the housing market emerges. The Root Cause Of Canada’s Extreme Household Debt Chart II-1Canadian Households Are Massively Indebted
Canadian Households Are Massively Indebted
Canadian Households Are Massively Indebted
Relative to disposable income, Canadian household debt has risen substantially over the past two decades. Chart II-1 highlights that Canada’s household debt to disposable income ratio has risen by 180% since 2000, and is currently over 50 percentage points higher than that in the US, even when nonfinancial noncorporate debt is included in the latter.1 Rising Canadian household indebtedness is a problem that is well known to investors, policymakers, regulators, banks, and consumers themselves. Organizations such as the IMF have repeatedly warned that excess household debt poses a potential economic stability risk. In the years prior to the pandemic, policymakers have responded with a series of macroprudential measures designed to limit speculation and foreign ownership in the housing market and to reduce the incremental risk to the economy posed by new borrowers. When asked why Canadian households have leveraged themselves so significantly over the past 20 years, most market commentators in Canada point to insufficient housing supply as the main driver of excessive house prices. Given normal ongoing demand for housing, they argue, persistent supply-side pressure on housing prices will naturally lead to a rising stock of debt relative to income. According to this narrative, the solution to Canada’s housing crisis is centered squarely on incentives to build more homes. Raising interest rates to cool mortgage demand will simply exacerbate the housing affordability problem, while simultaneously discouraging additional residential investment needed to decrease home prices structurally. Chart II-2The Supply Of Non-Apartment Dwellings Has Indeed Declined Over Time...
The Supply Of Non-Apartment Dwellings Has Indeed Declined Over Time...
The Supply Of Non-Apartment Dwellings Has Indeed Declined Over Time...
We hold a different perspective. We do agree that there are some limitations on the supply side that likely are unduly boosting prices of certain dwelling types. For example, the Greenbelt that surrounds Ontario’s Golden Horseshoe region - a permanently protected area of land - has likely constrained some housing activity, and Chart II-2 highlights that single detached, semi-detached, and row/townhouses have fallen significantly as a share of overall housing completions. Apartments and other dwellings now account for a clear majority of new housing construction in Canada. However, there is a great deal of evidence positioned against the view that supply-side factors are the primary cause of outsized housing inflation and, by extension, a massive increase in Canadian household debt to GDP: Based on real residential investment, the pace of housing construction in Canada has not fallen relative to GDP or the population. Chart II-3 highlights that, compared with the US, residential investment has trended higher over the past 20 years. Based on Canadian housing completion data, Chart II-4 highlights that the number of completions has generally kept pace with half of the change in Canada’s population, a ratio that is easily consistent with two or more people per household. In addition, the chart highlights that the periods when houses were completed at a below-average rate relative to population growth have not been the same as when Canadian household debt has increased relative to disposable income. Chart II-3...But Overall Real Residential Investment Has Kept Pace With Canada's GDP And Population
...But Overall Real Residential Investment Has Kept Pace With Canada's GDP And Population
...But Overall Real Residential Investment Has Kept Pace With Canada's GDP And Population
Chart II-4Housing Supply Has Not Been The Main Driver Of Rising Canadian Indebtedness
Housing Supply Has Not Been The Main Driver Of Rising Canadian Indebtedness
Housing Supply Has Not Been The Main Driver Of Rising Canadian Indebtedness
Chart II-5Prices For All Canadian Property Types Have Surged Over The Past Two Decades
Prices For All Canadian Property Types Have Surged Over The Past Two Decades
Prices For All Canadian Property Types Have Surged Over The Past Two Decades
If the rise in Canadian household indebtedness has been caused by the increasing scarcity of single-detached, semi-detached, and row/townhouses, then we would expect to see a persistent and growing divergence between overall Canadian house prices and those of apartment/condominiums. Chart II-5 highlights that this is not the case: while apartment/condo prices have at times grown at a slower rate than overall home prices over the past 15 years (as in the period from 2011 to 2016), they have also at times grown at a faster rate. The chart clearly highlights that the Canadian housing market is driven by a common factor, and that average house price gains have not been significantly different across property types over time. Similarly, if a scarcity of housing supply was the main driver of rising house prices and household debt, we would not expect to see a significant increase in the homeownership rate. Chart II-6 highlights that the Canadian homeownership rate did rise substantially from the mid-1990s to 2016 (the last available datapoint). While it is not clear what the sustainable or “equilibrium” homeownership rate is, it is notable that the most recent datapoint was not significantly lower than the peak rate reached in the US following that country’s massive housing bubble. Finally, Chart II-7 reiterates a point we made in our June 2021 Special Report: in several economies (including Canada), interest rates have remained well below levels that macroeconomic theory would traditionally consider to be in equilibrium over the past two decades. This has occurred alongside significant household sector leveraging. Chart II-7Too-Low Interest Rates Have Fueled Rising Household Indebtedness In Canada (And Other DM Economies)
Too-Low Interest Rates Have Fueled Rising Household Indebtedness In Canada (And Other DM Economies)
Too-Low Interest Rates Have Fueled Rising Household Indebtedness In Canada (And Other DM Economies)
Chart II-6The Canadian Homeownership Rate Has Risen Significantly, Pointing To Excess Housing Demand
March 2022
March 2022
These factors strongly point to rising household debt levels as being driven by demand-side rather than supply-side factors – demand that has been fueled by persistently low interest rates. How High Can The Bank Of Canada Raise Interest Rates? Over the next 12 months, investors expect the Bank of Canada (BoC) to raise interest rates by 180 basis points, in line with the Fed (Chart II-8). Over the longer term, the BoC believes that interest rates will average between 1.75% and 2.75%. In the US, the 2/10 yield curve has flattened significantly in response to the Fed’s hawkish shift, and neither the explosion in headline consumer price inflation nor the Fed’s about face have significantly raised the market’s longer-term expectations for interest rates (which are even below the Fed’s estimates). In Canada, investors expect essentially the same long-term interest rate outlook, as evidenced by 5-year / 5-year forward government bond yields (Chart II-9). Chart II-8Investors Expect A Similar Magnitude Of Tightening In Canada And The US Over The Next Year...
Investors Expect A Similar Magnitude Of Tightening In Canada And The US Over The Next Year...
Investors Expect A Similar Magnitude Of Tightening In Canada And The US Over The Next Year...
Chart II-9...And A Similar Average Interest Rate Over The Longer Term
...And A Similar Average Interest Rate Over The Longer Term
...And A Similar Average Interest Rate Over The Longer Term
As in the case in the US, the hawkish shift among major central banks has left investors asking how high the BoC can raise interest rates, and what implications that might have for Canadian assets – especially the CAD and long-maturity Canadian government bonds. In our view, the best way for investors to assess the impact of rising interest rates on the private sector – especially a highly indebted one – is to project the impact that an increase in interest rates will have on the debt service ratio (DSR). The burden of servicing debt, rather than the stock of debt relative to income, is the right way to measure the impact of shifting monetary policy because it considers the combined effect of changes in leverage, income, and interest rates. The primary drawback of debt service ratio analysis is that the question of sustainability must be answered empirically. In countries experiencing an ever-rising debt service ratio, it can be difficult for investors to judge where the breaking point will be. Cross-country comparisons may sometimes be helpful in this respect, but Chart II-10 highlights that BIS estimates for household debt service ratios vary widely even among advanced economies. However, in Canada, the 2017-2019 tightening cycle provides a useful framework. As we anticipated in a 2017 Special Report,2 the rise in Canadian interest rates during that period caused the household debt service ratio to exceed the level reached in 2007, which contributed to a collapse in Canadian house price appreciation to its lowest level since the global financial crisis (Chart II-11). The decline in house prices during this period was also caused by the introduction of new macroprudential measures (particularly the introduction of a minimum qualifying rate for mortgages, more commonly referred to as a mortgage “stress test” rule), but the impact of higher interest rates was likely significant. Chart II-11The Last Tightening Cycle In Canada Contributed Significantly To A Major Slowdown In Canadian House Prices
The Last Tightening Cycle In Canada Contributed Significantly To A Major Slowdown In Canadian House Prices
The Last Tightening Cycle In Canada Contributed Significantly To A Major Slowdown In Canadian House Prices
Chart II-10Private Sector Debt Service Ratios Vary Significantly Across DM Countries
Private Sector Debt Service Ratios Vary Significantly Across DM Countries
Private Sector Debt Service Ratios Vary Significantly Across DM Countries
Chart II-11 highlights that the Canadian household debt service ratio collapsed during the pandemic, which seems to suggest that the Bank of Canada has ample room to raise interest rates. However, the decline in the DSR occurred not only because of falling interest rates, but also because of the significant excess savings amassed as a result of the pandemic. As in the US, excess savings in Canada were the result of reduced spending on services and the generation of significant excess income from government transfers (see Chart I-20 from Section 1 of this month’s report). These fiscal transfers will eventually disappear, implying that the Canadian household DSR is artificially low. Chart II-12 shows our estimate of the evolution of the overall Canadian household sector DSR based on the following assumptions: Mortgage rates rise in line with market expectations for the change in the policy rate Government transfers fall back to their pre-pandemic trend Disposable income growth ex-transfers grows in line with consensus expectations for nominal GDP growth The overall debt-to-disposable income ratio, using our estimate for total disposable income, remains flat. The chart highlights that the Canadian household sector DSR may exceed its pre-pandemic level next year, and that a 1.75% policy rate is the threshold at which the DSR will hit a new high. The implication of our projection is that the re-acceleration in household sector debt that has occurred during the pandemic, shown in Chart II-13, will again contribute to a significant slowdown in the Canadian housing market as the BoC begins to raise interest rates as in 2018/2019. It also implies that the prior peak in the Canadian policy rate probably reflects a high-end estimate of the neutral rate of interest in Canada. Chart II-12Market Expectations For The Canadian Policy Rate Imply A Record High Debt Burden
Market Expectations For The Canadian Policy Rate Imply A Record High Debt Burden
Market Expectations For The Canadian Policy Rate Imply A Record High Debt Burden
Chart II-13Canadian Household Loan Growth Has Reaccelerated During The Pandemic
Canadian Household Loan Growth Has Reaccelerated During The Pandemic
Canadian Household Loan Growth Has Reaccelerated During The Pandemic
As we discuss below, this is likely to lead to significant implications for CAD-USD and an allocation to long-maturity Canadian government bonds, once investors begin to upwardly revise their expectations for the US neutral rate. Extreme Household Debt And Canadian Financial Stability The question of financial stability is often posed by investors when discussing Canada’s extreme household debt burden. Some investors view the US subprime financial crisis as the likely template for the Canadian economy, given the fact that the US credit bubble also focused on the housing market. Despite our pessimistic assessment of the capacity of the Canadian economy to tolerate higher interest rates (unlike the US today), we do not share the view that the Canadian financial system faces a potential insolvency risk, like the US banking system did in 2008. We see two potential arguments in favor of the instability view. The first is related to the sheer concentration of debt in Canada relative to other countries. Chart II-14 highlights that the median debt-to-income ratio of indebted Canadian households is currently the second highest in the world (after Norway) among the 29 countries that the OECD tracks. This concentration measure has worsened considerably since we published our 2017 Special Report. The combination of a very high average level of debt and extremely high leverage among those who are indebted suggests that Canadian banks may be exposed to significant credit losses in the event of a serious housing market crash. Chart II-14The Degree Of Concentration In Canadian Household Debt Is A Potential Financial Stability Risk
March 2022
March 2022
Chart II-15A Decline In The CMHC's Footprint In The Mortgage Insurance Market Is Also Concerning
A Decline In The CMHC's Footprint In The Mortgage Insurance Market Is Also Concerning
A Decline In The CMHC's Footprint In The Mortgage Insurance Market Is Also Concerning
The second argument relates to the declining share of mortgages insured by the Canada Mortgage and Housing Corporation (CMHC). The CMHC is a Crown corporation that provides mortgage-default insurance to Canadian banks. Banks must purchase such insurance when a borrower’s loan-to-value ratio exceeds 80%. The CMHC has seen increased competition from two private mortgage insurers, and Chart II-15 highlights that the number of mortgages with CHMC insurance has been steadily falling over time. In order for the CMHC to be able to reduce systemic risk during a crisis, it must be present enough in the mortgage market to be able to replace private insurers in the event of a shock that causes them to leave the market. In effect, the CMHC should be able to act as a ballast to prevent a sharp tightening in Canadian mortgage lending standards and credit provision, which could occur if banks find themselves unable to purchase mortgage insurance to cover borrowers with relatively small down payments. In this respect, the reduced footprint of the CMHC is concerning. However, these risks have to be weighed against two key structural changes that legitimately lower the systemic risk facing the Canadian banking system (or lower the impact of a major adverse housing event). The first of these changes is the introduction of the minimum qualifying rate for mortgages in Canada (the mortgage stress test), which we regard as one of the most important macroprudential policies that Canada has enacted to reduce the systemic risk of rising household debt. The stress test rules – which apply to all borrowers – force mortgage borrowers to pass the CMHC’s gross debt and total debt service ratio thresholds under the assumption of higher interest rates than borrowers will actually pay: either the contracted mortgage rate plus 2 percentage points, or 5.65% – whichever is higher. Given prevailing mortgage rates in Canada, this effectively means that new borrowers will not exceed the CMHC’s debt service thresholds until the Bank of Canada’s policy rate exceeds 2.5%. That is positive from a financial stability perspective, although it does not rule out the slowdown in household spending that we would expect if the aggregate household debt service ratio hits a new high next year in response to BoC tightening. The second important risk-reducing structural change is a significant improvement in Canadian bank capital levels. Chart II-16 highlights that Tier 1 capital has risen significantly relative to risk-weighted assets for Canadian depository institutions, and is now on par with US levels (in contrast to a typically lower level over the past decade). The IMF stress tested Canadian banks in 2019, when capital levels were lower than they are today. They found that most Canadian banks would run down conservation capital buffers in the adverse economic scenario that they modeled, subjecting them to dividend restrictions for a period of time following the adverse event. However, Canadian banks would not breach their minimum capital requirements in the scenario modeled by the IMF, which involved a 40% decline in house prices and a 2% cumulative decline in Canadian real GDP over a two year period – which is essentially what occurred in the US and Canada in 2008 and 2009 (Chart II-17). Chart II-16Canadian Bank Capital Appears Sufficient To Weather A Storm
Canadian Bank Capital Appears Sufficient To Weather A Storm
Canadian Bank Capital Appears Sufficient To Weather A Storm
Chart II-17The IMF's Stress Tests Modeled A Repeat Of The 2008/2009 Crisis
The IMF's Stress Tests Modeled A Repeat Of The 2008/2009 Crisis
The IMF's Stress Tests Modeled A Repeat Of The 2008/2009 Crisis
To conclude on the question of financial stability, it is clear that the magnitude and concentration of household debt implies that the impact of a serious housing market crash on the Canadian economy would be severe. But the fact that regulatory changes have occurred in recognition of this risk suggests that although a massive decline in Canadian house prices would cause a very severe recession, it would not likely precipitate a Lehman-style collapse of the Canadian financial system. Investment Conclusions Three conclusions emerge from our report. First, when considering the total experience of the past two decades, it is clear that the buildup of excessive household debt in Canada has occurred because of outsized demand for housing, not because of the impact of constrained housing supply on house prices. Outsized demand for housing has occurred because interest rates have been persistently below what traditional monetary policy rules such as the Taylor Rule would prescribe, pointing to the need for the Bank of Canada to tighten monetary policy in order to prevent even further leveraging. While US interest rates were also below what the Taylor Rule would have suggested for several years following the global financial crisis, the US household sector did not leverage itself significantly during that period because of the multi-year impact of the 2008/2009 financial crisis on US household balance sheets (Chart II-18). Canadian households did not suffer the same type of balance sheet impairment, and yet the Bank of Canada wrongly imported hyper-accommodative US monetary policy in an attempt to prevent a significant further increase in the exchange rate (which was still persistently strong for several years following the crisis). Through its actions, the Bank of Canada succeeded in staving off “Dutch Disease”, but at the cost of fueling a substantial housing and credit market bubble. Second, the fact that the Bank of Canada is likely to struggle to raise interest rates above 1.75% implies that a sizeable divergence may emerge between Canadian and US monetary policy over the coming few years if we are correct in our view that the US neutral rate is higher than the Fed currently expects. While such a divergence is not likely to occur over the coming year, Chart II-19 highlights that a 125 basis point policy rate spread – consistent with a nominal neutral rate of 1.75% in Canada and 3% in the US – last occurred in the mid-to-late 1990s, when CAD-USD ultimately declined to 0.65. Chart II-18The Bank Of Canada Staved Off "Dutch Disease", At The Cost Of Fueling A Major Housing And Credit Bubble
The Bank Of Canada Staved Off "Dutch Disease", At The Cost Of Fueling A Major Housing And Credit Bubble
The Bank Of Canada Staved Off "Dutch Disease", At The Cost Of Fueling A Major Housing And Credit Bubble
Chart II-19Some Potentially Large Downside For CAD If US Neutral Rate Expectations Move Higher
Some Potentially Large Downside For CAD If US Neutral Rate Expectations Move Higher
Some Potentially Large Downside For CAD If US Neutral Rate Expectations Move Higher
Over the coming year, we expect Canadian dollar strength rather than weakness: we are generally bearish toward the US dollar on the expectation of above-trend global growth, and our fundamental intermediate-term model suggests that CAD should strengthen. Thus, while it is too early to short the Canadian dollar, we would be inclined to turn bearish in response to rising long-term US interest rate expectations. We would draw similar conclusions for Canadian government bonds: investors should raise exposure to long-dated Canadian government bonds versus similar maturity US Treasurys as the Bank of Canada raises its policy rate toward our estimate of the neutral rate. Chart II-20Relative ROE Justifies A Valuation Premium For Canadian Banks
Relative ROE Justifies A Valuation Premium For Canadian Banks
Relative ROE Justifies A Valuation Premium For Canadian Banks
Finally, the improvements that have been made over the past several years to dampen the impact of a housing market crash on the Canadian financial system suggests that exposure to Canadian banks should not be reduced until hard evidence of a significant slowdown in the housing market emerges. Chart II-20 highlights that the valuation premium of Canadian banks appears to be supported by a sizeable ROE advantage relative to global banks. Panel 2 highlights how composite relative valuation indicator for Canadian banks suggests that they have been persistently expensive for some time, but not extremely so. Canadian banks would certainly underperform their global peers should the adverse scenario modeled by the IMF’s 2019 stress test of the banking system to occur, especially if it implied that Canadian banks would be forced to restrict dividends for a time to bolster capital adequacy. However, we would advise investors against shorting relatively high-yielding Canadian banks as Canadian interest rates rise, until they see clear signs of Canada-specific slowdown in housing demand in response to higher rates. Jonathan LaBerge, CFA Vice President The Bank Credit Analyst Gabriel Di Lullo Research Associate Footnotes 1 For an explanation of why we add US nonfinancial noncorporate debt to the numerator of the US household sector debt to disposable income ratio when comparing Canada to the US, please see: “Reconciling Canadian-U.S. measures of household disposable income and household debt: Update”. 2 Please see Global Investment Strategy "Canada: A (Probably) Happy Moment In An Otherwise Sad Story," dated July 14, 2017, available at gis.bcaresearch.com
Executive Summary From Nixon-Mao To Putin-Xi
From Nixon-Mao To Putin-Xi
From Nixon-Mao To Putin-Xi
The geopolitical “big picture” of Russia’s invasion of Ukraine is the deepening of the Russo-Chinese strategic partnership. While Russia’s economic and military constraints did not prohibit military action in Ukraine, they are still relevant. Most likely they will prevent a broader war with NATO or a total energy embargo of Europe. Still, volatility will persist in the near term as saber-rattling, aftershocks, and spillover incidents will occur this year. Russo-Chinese relations are well grounded. Russia needs investment capital and resource sales, while China needs overland supply routes and supply security. Both seek to undermine the US in a new game of Great Power competition that will prevent global politics and globalization from normalizing. Tactically we remain defensive but buying opportunities are emerging. We maintain a cyclically constructive view. Favor equity markets of US allies and partners that are geopolitically secure. Trade Recommendation Inception Date Return Long Gold (Strategic) 2019-12-06 32.7% Bottom Line: Tactically investors should remain defensive but cyclically they should look favorably on cheap, geopolitically secure equity markets like those of Australia, Canada, and Mexico. Feature To understand the Russian invasion of Ukraine and the likely consequences, investors need to consider three factors: 1. Why Russia’s constraints did not prohibit war and how constraints must always be measured against political will. 2. Why Russia’s constraints will grow more relevant going forward, as the costs of occupation and sanctions take hold, the economy weakens, and sociopolitical pressures build. 3. Why the struggle of the Great Powers will drive a Russo-Chinese alliance, whose competition with the US-led alliance will further destabilize global trade and investment. Russia’s Geopolitical Will Perhaps the gravest national security threat that Russia can face, according to Russian history, is a western military power based in the Ukraine. Time and again Russia has staged dramatic national efforts at great cost of blood and treasure to defeat western forces that try to encroach on this broad, flat road to Moscow. Putin has been in power for 22 years and his national strategy is well-defined: he aims to resurrect Russian primacy within the former Soviet Union, carve out a regional sphere of influence, and reduce American military threats in Russia’s periphery. He has long aimed to prevent Ukraine from becoming a western defense partner. Chart 1Russia Structured For Conflict
From Nixon-Mao To Putin-Xi
From Nixon-Mao To Putin-Xi
While Moscow faced material limitations to military action in Ukraine, these were not prohibitive, as we have argued. Consider the following constraints and their mitigating factors: Costs of war: The first mistake lay in assuming that Russia was not willing to engage in war. Russia had already invaded Ukraine in 2014 and before that Georgia in 2008. The modern Russian economy is structured for conflict: it is heavily militarized (Chart 1). Military spending accounts for 4.3% of GDP, comparable to the United States, also known for waging gratuitous wars and preemptive invasions. Financial burdens: The second mistake was to think that Moscow would avoid conflict for fear of the collapse of the ruble or financial markets. Since Putin rose to power in 2000, the ruble has depreciated by 48% against the dollar and the benchmark stock index has fallen by 57% against EMs. Each new crackdown on domestic or foreign enemies has led to a new round of depreciation and yet Putin remains undeterred from his long-term strategy (Chart 2). Chart 2Putin Doesn't Eschew Conflict For Sake Of Ruble Or Stocks
Putin Doesn't Eschew Conflict For Sake Of Ruble Or Stocks
Putin Doesn't Eschew Conflict For Sake Of Ruble Or Stocks
Economic health: Putin’s foreign policy is not constrained by the desire to make the Russian economy more open, complex, advanced, or productive. While China long practiced a foreign policy of lying low, so as to focus on generating wealth that could later be converted into strategic power (which it is doing now), Russia pursued a hawkish foreign policy for the past twenty years despite the blowback on the economy. Russia is still an undiversified petro-state and total factor productivity is approaching zero (Chart 3). Chart 3Putin Doesn't Eschew Conflict For Sake Of Productivity
Putin Doesn't Eschew Conflict For Sake Of Productivity
Putin Doesn't Eschew Conflict For Sake Of Productivity
Chart 4Putin Doesn’t Eschew Conflict For Fear Of Sanctions
From Nixon-Mao To Putin-Xi
From Nixon-Mao To Putin-Xi
Western sanctions: Western sanctions never provided a powerful argument against Russian intervention into Ukraine. Russia knew all along that if it invaded Ukraine, the West would impose a new round of sanctions, as it has done periodically since 2014. The 2014 oil crash had a much greater impact on Russia than the sanctions. Of course, Russia’s overall economic competitiveness is suffering, although it is capable of gaining market share in exporting raw materials, especially as it depreciates its currency (Chart 4). Chart 5Putin Doesn't Eschew Conflict For Sake Of Popular Opinion
Putin Doesn't Eschew Conflict For Sake Of Popular Opinion
Putin Doesn't Eschew Conflict For Sake Of Popular Opinion
Public opinion: Surely the average Russian is not interested in Ukraine and hence Putin lacks popular support for a new war? True. But Putin has a strong record of using foreign military adventures as a means of propping up domestic support. Of course, opinion polls, which confirm this pattern, are manipulated and massaged (Chart 5). Nevertheless Russians like all people are highly likely to side with their own country in a military confrontation with foreign countries, at least in the short run. Over the long haul, the public will come to rue the war. Moscow believes that it can manage the domestic fallout when that time comes because it has done so since 2014. We doubt it but that is a question for a later time. Investors also need to consider Putin’s position if he did not stage ever-escalating confrontations with the West. Russia is an autocracy with a weak economy – it cannot win over the hearts and minds of its neighboring nations in a fair, voluntary competition with the West, the EU, and NATO. Russia’s neighbors are made up of formerly repressed Soviet ethnic minorities who now have a chance at national self-determination. But to secure their nationhood, they need economic and military support, and if they receive that support, then they inherently threaten Russia and help the US keep Russia strategically contained. Russia traditionally fights against this risk. Bottom Line: Investors and the media focused on the obstacles to Russian military intervention without analyzing whether there was sufficient political will to surmount the hurdles. Constraints Eroded None of the above suggests that Putin can do whatever he wants. Economic and military constraints are significant. However, constraints erode over time – and they may not be effective when needed. Europe did not promise to cancel all energy trade if Russia invaded: Exports make up 27% of Russian GDP, and 51% of exports go to advanced economies, especially European. Russia is less exposed to trade than the EU but more exposed than the US or even China (Chart 6). However, Russia trades in essential goods, natural resources, and the Europeans cannot afford to cut off their own energy supply. When Russia first invaded Ukraine in 2014, the Germans responded by building the Nord Stream pipeline, basically increasing energy cooperation. Russia concluded that Europeans, not bound to defend Ukraine by any treaty, would continue to import energy in the event of a conflict limited to Ukraine. Chart 6Putin Limits Conflict For Sake Of EU Energy Trade
From Nixon-Mao To Putin-Xi
From Nixon-Mao To Putin-Xi
Chart 7Putin Limits Conflict For Sake Of Chinese Trade
From Nixon-Mao To Putin-Xi
From Nixon-Mao To Putin-Xi
Russia substitutes China for Europe: As trade with the West declines, Russia is shifting toward the Far East, especially China (Chart 7). China is unlikely to reduce any trade and investment for the sake of Ukraine – it desperately needs the resources and the import-security that strong relations with Russia can provide. It cannot replace Europe – but Russia does not expect to lose the European energy trade entirely. (Over time, of course, the EU/China shift to renewables will undermine Russia’s economy and capabilities.) Ukraine is right next door: Aside from active military personnel, the US advantage over Iraq in 2002-03 was greater than the Russian advantage over Ukraine in 2022 (Chart 8). And yet the US got sucked into a quagmire and ultimately suffered political unrest at home. However, Ukraine is not Afghanistan or Iraq. Russia wagers that it can seize strategic territory, including Kiev, without paying the full price that the Soviets paid in Afghanistan and the US paid in Afghanistan and Iraq. This is a very risky gamble. But the point is that the bar to invading Ukraine was lower than that of other recent invasions – it is not on the opposite side of the world. Chart 8Putin Limits Conflict For Fear Of Military Overreach
From Nixon-Mao To Putin-Xi
From Nixon-Mao To Putin-Xi
Chart 9Putin Limits Conflict For Fear Of Military Weakness
From Nixon-Mao To Putin-Xi
From Nixon-Mao To Putin-Xi
NATO faces mutually assured destruction: NATO’s conventional military weight far surpasses Russia’s. For example, Russia, with its Eurasian Union, does not have enough air superiority to engage in offensive initiatives against Europe, even assuming that the United States is not involved. Even if we assume that China joins Russia in a full-fledged military alliance under the Shanghai Cooperation Organization (SCO), NATO’s military budget is more than twice as large (Chart 9). However, this military constraint is not operable in the case of Ukraine, which is not a NATO member. Indeed, Russia’s aggression toward Ukraine stems from its fear that Ukraine will become a real or de facto member of NATO. It is the fear of NATO that prompted Russia to attack rather than deterring it, precisely because Ukraine was not a member but wanted to join. Bottom Line: Russia’s constraints did not prohibit military action because several of them had eroded over time. NATO was so threatening as to provoke rather than deter military action. Going forward, Russia’s economic and military constraints will prevent it from expanding the war beyond Ukraine. Isn’t Russia Overreaching? Yes, Russia is overreaching – the military balances highlighted in Charts 8 and 9 above should make that plain. The Ukrainian insurgency will be fierce and Russia will pay steep costs in occupation and economic sanctions. These will vitiate the economy and popular support for Putin’s regime over the long run. Chart 10The West Is Politically Divided And Vulnerable
From Nixon-Mao To Putin-Xi
From Nixon-Mao To Putin-Xi
The West is also vulnerable, however, which has given rise to a fiscal and commodity cycle that helps to explain why Putin staged his risky invasion at this juncture in time: The US and West are politically divided. Western elites see themselves as surrounded by radical parties that threaten to throw them out and overturn the entire political establishment. Their tenuous grip on power is clear from the thin majorities they hold in their legislatures (Chart 10). Nowhere is this clearer than in the United States, where Democrats cannot spare a single seat in the Senate, five in the House of Representatives, in this fall’s midterm elections, yet are facing much bigger losses. Russia believes that its hawkish foreign policy can keep the democracies divided. Elites are turning to populist spending: Governments have adopted liberal fiscal policies in the wake of the global financial crisis and the pandemic. They are trying to grow their way out of populist unrest, debt, and various strategic challenges, from supply chains to cyber security to research and development (Chart 11). China is also part of this process, despite its mixed economic policies. The result is greater demand for commodities, which benefits Russia. Elites are turning to climate change to justify public spending: Governments, particularly in Europe and China, are using fears of climate change to increase their political legitimacy and launch a new government “moonshot” that justifies more robust public investment and pump-priming. The long-term trend toward renewable energy is fundamentally threatening to Russia, although in the short term it makes Russian natural gas and metals all the more necessary. Germany especially envisions natural gas as the fossil-fuel bridge to a green future as it has turned against both nuclear power and coal (Chart 12). Russian aggression will provoke a rethink in some countries but Germany, as a manufacturing economy, is unlikely to abandon its goals for green industrial innovation. Chart 11Politically Vulnerable States Need Fiscal Stimulus
Politically Vulnerable States Need Fiscal Stimulus
Politically Vulnerable States Need Fiscal Stimulus
Chart 12The West Reluctant To Abandon Climate Goals
From Nixon-Mao To Putin-Xi
From Nixon-Mao To Putin-Xi
Proactive fiscal and climate policy motivate new capex and commodity cycle: The West’s attempt to revive big government and strategic spending will require vast resource inputs – resources that Russia can sell at higher prices. The new commodity cycle gives Russia maximum leverage over Europe, especially Germany, at this point in time (Chart 13). Later, as inflation and fiscal fatigue halt this cycle, Russia will lose leverage. Chart 13Commodity Cycle Gives Russia Advantage (For Now)
Commodity Cycle Gives Russia Advantage (For Now)
Commodity Cycle Gives Russia Advantage (For Now)
Meanwhile Russia’s economic and hence strategic power will subside over time. Russia’s potential GDP growth has fallen since the Great Recession as productivity growth slows and the labor force shrinks (Chart 14). Chart 14Future Will Not Yield Strategic Opportunities For Russia
Future Will Not Yield Strategic Opportunities For Russia
Future Will Not Yield Strategic Opportunities For Russia
Chart 15Younger Russians Not Calling The Shots (But Will Someday)
From Nixon-Mao To Putin-Xi
From Nixon-Mao To Putin-Xi
In short, the Kremlin has chosen the path of economic austerity and military aggression as a means of maintaining political legitimacy and achieving national security objectives. Western divisions, de-carbonization, the commodity cycle, and Russia’s bleak economic outlook indicated that 2022 was the opportunity to achieve a pressing national security objective, rather than some future date when Russia will be less capable relative to its opponents. In the worst-case scenario – not our base case – the invasion of Ukraine will trigger an escalation of European sanctions that will lead to Russia cutting off Europe’s energy and producing a global energy price shock. And yet that outcome would upset US and European politics in Russia’s favor, while Putin would maintain absolute control at home in a society that is already used to economic austerity and that benefits from high commodity prices. Note that Putin’s strategy will not last forever. Ukraine will mark another case of Russian strategic overreach that will generate a social and political backlash in coming years. While Putin has sufficient support among older, more Soviet-minded Russians for his Ukraine adventure, he lacks support among the younger and middle-aged cohorts who will have to live with the negative economic consequences (Chart 15). The entire former Soviet Union is vulnerable to social unrest and revolution in the coming decade and Russia is no exception. The Russo-Chinese Geopolitical Realignment Chart 16From Nixon-Mao To Putin-Xi
From Nixon-Mao To Putin-Xi
From Nixon-Mao To Putin-Xi
From a broader, geopolitical point of view, Russia’s invasion of Ukraine drives another nail into the coffin of the post-Cold War system and hyper-globalization. Russia is further divorcing itself from the western economy, with even the linchpin European energy trade falling victim to renewables and diversification. The US and its allies are imposing export controls on critical technologies such as semiconductors against Russia to cripple any attempts at modernization. The US is already restricting China’s access to semiconductors and from now on is locked into a campaign to try to enforce these export controls via secondary sanctions, giving rise to proxy battles in countries that Russia and China use to circumvent the sanctions. Russia will be forced to link its austere, militarized, resource-driven economy to the Chinese economy. Hence a major new geopolitical realignment is taking place between the US, Russia, and China, on the order of previous realignments since World War II. When the Sino-Soviet communist bloc first arose it threatened to overwhelm the US in economic heft and dominate Eurasia. This communist threat drove the US to undertake vast expeditionary wars, such as in South Korea and Vietnam. These were too costly, so the US sought economic engagement with China in 1972, which isolated the Soviet Union and ultimately helped bring about its demise. Yet China’s economic boom predictably translated into a strategic rise that began to threaten US preeminence, especially since the Great Recession. Today Russia and China have no option other than to cooperate in the face of the US’s increasingly frantic attempts to preserve its global status – and China’s economic growth and technological potential makes this alliance formidable (Chart 16). In short, the last vestiges of the “Nixon-Mao” moment are fading and the “Putin-Xi” alignment is already well-established. Russia cannot accept vassalage to China but it can make many compromises for the sake of strategic security. Their economies are much more complimentary today than they were at the time of the Sino-Soviet split. And Russia’s austere economy will not collapse as long as it retains some energy trade with Europe throughout the pivot to China. In turn the US will attempt to exploit Russian and Chinese regional aggression as a basis for a revitalization of its alliances. But Europe will dampen US enthusiasm by preserving economic engagement with Russia and China. The EU is increasingly an independent geopolitical actor and a neutral one at that. This environment of multipolarity – or Great Power Struggle – will define the coming decades. It will ensure not only periodic shocks, like the Ukraine war, but also a steady undercurrent of growing government involvement in the global economy in pursuit of supply security, energy security, and national security. Competition for security is not stabilizing but destabilizing. Hyper-globalization has given way to hypo-globalization, as regional geopolitical blocs take the place of what once promised to be a highly efficient and thoroughly interconnected global economy. Investment Takeaways Tactically, Geopolitical Strategy believes it is too soon to go long emerging markets. Russia is at war, China is reverting to autocracy, and Brazil is still on the path to debt crisis. Multiples have compressed sharply but the bad news is not fully priced (Chart 17). The dollar is likely to be resilient as the Fed hikes rates and a major European war rages. Europe’s geopolitical and energy insecurity will weigh on investment appetite and corporate earnings. American equities are likely to outperform in the short run. Chart 17Investors Should Not Bet On Russian And European Equities In This Context
Investors Should Not Bet On Russian And European Equities In This Context
Investors Should Not Bet On Russian And European Equities In This Context
Chart 18Investors Find Value, Minimize Risk In Geopolitically Secure Equity Markets
Investors Find Value, Minimize Risk In Geopolitically Secure Equity Markets
Investors Find Value, Minimize Risk In Geopolitically Secure Equity Markets
Cyclically, global equities outside the US, and pro-cyclical assets offer better value, as long as the war in Ukraine remains contained, a Europe-wide energy shock is averted, and China’s policy easing secures its economic recovery. While European equities will snap back, Europe still faces structural challenges and eastern European emerging markets face a permanent increase in geopolitical risk due to Russian geopolitical decline and aggression. Investors should seek markets that are both cheap and geopolitically secure – namely Australia, Canada, and Mexico (Chart 18). We are also bullish on India over the long run. Matt Gertken Chief Geopolitical Strategist mattg@bcaresearch.com Strategic Themes Open Tactical Positions (0-6 Months) Open Cyclical Recommendations (6-18 Months)
Executive Summary EU-Russia Energy Trade To Persist
Russia Takes Ukraine: What Next?
Russia Takes Ukraine: What Next?
Russia invaded Ukraine to prevent it from becoming a defense partner of the US and its allies. It is not likely to attack NATO members, which share a mutual defense treaty, so the war is limited in scope. Spillovers can occur but the US and Russia have 73 years of experience avoiding direct war. The US and EU will levy sweeping sanctions but they will not halt Russian energy exports, as that would cause a recession in Europe. European political leaders would likely fall from power in the coming years if there were a full-scale energy crisis. European nations will leverage Russian aggression to strengthen their popular support at home, while diversifying away from Russian energy over the long run. Europe will impose tough sanctions on Russia’s non-energy sectors, including finance and technology, to hobble the regime. China will consolidate power at home and strengthen ties with Russia but a war over Taiwan is a medium-to-long term risk. Bottom Line: Investors should be cautious over the very near term but should prepare to buy the dip of a geopolitical incident that is generally limited to Ukraine and the Black Sea area. Supply responses from oil producers will remove the risk premium from oil prices and send the price of Brent crude to $85 per barrel by the end of the year. EU-Russia energy flows are the key risk to monitor. Feature Russia launched an invasion of Ukraine on February 24. The invasion was not limited to the far eastern corner of the country but involved attacks in the capital Kiev and in the far west and the coastline. Hence investors should proceed on the assumption that Russia will invade all of Ukraine even if it ends up limiting its invasion, as we expect (Map 1). Map 1Russian Invasion Of Ukraine 2022
Russia Takes Ukraine: What Next?
Russia Takes Ukraine: What Next?
It is critical for investors to understand the cause of the war in order to gauge its scope and adjust their risk appetite accordingly. Consider: Ukraine does not have mutual defense treaties that automatically trigger a broader war. Russia is attacking Ukraine to prevent it from becoming a defense partner of the US and its allies. Russia does not have the military capacity to attack the North Atlantic Treaty Organization (NATO) members, which have a mutual defense pact. Russia is attacking Ukraine because it does not have a mutual defense pact but was seeking one. Russia aims to neutralize Ukraine. If Moscow sacks Kiev and sets up a puppet state, then Ukraine will not seek western defense cooperation for the foreseeable future. If Russia conquers key territories to strengthen its control over Ukraine, then future Ukrainian governments will limit relations with the West for fear of Russian absorption. Russia is likely to seize coastal territory to ensure the long-term ability to blockade Ukraine. Russia will not withdraw troops until it has changed the government and seized key territories. Russia and NATO have no interest in war with each other. In the immediate fog of war, global financial markets will experience uncertainty about whether fighting will expand into a broader war between Russia and NATO. Such an expansion is unlikely because of mutually assured destruction (MAD) due to nuclear weapons. The US and Europe have already pledged that they will not send troops to fight in Ukraine. They will send troops and arms to support neighboring NATO states in central Europe, such as the Baltic states, Poland, Slovakia, Hungary, and others. This will serve as a deterrent to Russia to keep its operations limited. Spillover incidents can and will occur, such as with Malaysian Airlines Flight 17 in 2014, but the US and Russia have 73 years of experience avoiding direct war, including when Russia invaded Hungary in 1956, Czechoslovakia in 1968, and Afghanistan in 1979. The US and EU will levy sweeping sanctions but the EU will not halt Russian energy exports. When Russia first invaded Ukraine and seized territory in 2014, Germany responded by working with Russia to build the Nord Stream II pipeline so as to import energy directly from Russia and circumvent Ukraine. This historical fact over the past eight years reveals Germany’s true interests. Thus energy cooperation increased as a result of Russian aggression. Of course, Germany has suspended the certification of that pipeline in light of today’s invasion, but it was not yet operating, so energy flows are not impeded, and it still physically exists for future operation when Germany finds it politically expedient. Hungary, Italy, Finland, the Czech Republic and others will also need to keep up Russian energy flows. Chart 1EU-Russia Energy Trade To Persist
Russia Takes Ukraine: What Next?
Russia Takes Ukraine: What Next?
Nevertheless, a cessation of energy flows is still the most important risk for investors to monitor, whether triggered by European boycott or Russian embargo. That would cause a recession in Europe. Recession would cause European political leaders to fall from power in the coming years, which explains why they will not pursue that objective in face of Russian aggression. Even the US is vulnerable to a global price shock (during a midterm election year) and hence will allow the EU to keep importing Russian energy, whatever its sanctions package may contain. True, Russia may cut off natural gas flows via Ukraine, which account for nearly 20% of Europe’s imports (Chart 1). Moreover, Europe may threaten or claim that they will sanction the energy sector. But most flows will likely continue. Europe will diversify away from Russian energy over the long run. Instead of cutting off their own vital energy supplies, European nations will leverage Russian aggression to strengthen their popular support at home, while initiating emergency state-led efforts to diversify away from Russian energy over the long run through renewables and imports from the US and its allies. This will be advantageous to European democracies that were already struggling to increase political legitimacy amid nascent populism – they will now have a crusade with which to rally their people and maintain fiscal support for their economy: energy security. Europe will sanction Russia’s non-energy sector. Europe will impose tough sanctions on Russia’s non-energy sectors, including finance and technology, to hobble the regime. Russia will eventually be cut off from the SWIFT banking communications network, since it already has a rudimentary alternative that it developed in recent years, but Germany will not agree to cut it off until the payment alternate to continue energy flows can be arranged, which is ultimately possible. China will take advantage of the moment but is probably not ready to invade Taiwan. China could seize the opportunity to consolidate power at home and it may increase pressure on Taiwan through rhetoric, sanctions, or cyber-attacks, but it is not likely to invade Taiwan. An amphibious invasion of the globally critical territory of Taiwan is far riskier for China than a land invasion of the non-critical territory of Ukraine is for Russia. Russia’s strategic calculations and timing are separate from China’s, despite their growing de facto alliance. But a war in the Taiwan Strait is at risk over the long run, as the situation is geopolitically unsustainable, for reasons similar to that of Ukraine. The situation in Ukraine is likely to get worse before it gets better, implying that investors should expect further volatility in risk assets in the near term. Structurally, the shift to a less geopolitically stable multipolar world will favor defense and cybersecurity stocks. “Great Power Struggle” is our top geopolitical investment theme over the long run and Russia’s invasion of Ukraine highlights its continuing relevance. Bottom Line: A buying opportunity for heavily discounted, pro-cyclical or high-beta assets is emerging rapidly, given our assessment, and we will monitor events over the coming weeks to identify when such a shift is prudent. A wholesale energy cutoff to Europe is the chief risk, as it would justify downgrading global equities relative to long-maturity bonds on a six-to-12 month horizon. Investment Takeaways Global Investment Strategy: With real rates coming down, owning gold remains an attractive hedge. As a fairly cheap and defensive currency, a long yen position is advisable. Assuming the conflict remains contained to Ukraine, equities and other risk assets should recover over the remainder of the year. The geopolitical premium in oil prices should also come down. Consistent with our Commodity & Energy Strategy views, our Global Investment Strategy service is closing its long Brent trade recommendation today for a gain of 24.0%. Commodities & Energy Strategy: While oil exports from Russia are not expected to diminish as a result of the invasion, it will prompt increased production from core OPEC producers – Saudi Arabia, the UAE, and Kuwait – to take the elevated risk premium out of Brent crude oil prices and allow refiners to rebuild inventories. The US and Iran may rejoin the 2015 nuclear deal, which would add about 1.0mm b/d of production to the market – Russia’s 2014 invasion of Crimea did not prevent the original nuclear deal. These production increases would take prices from the current $105 per barrel level to $85 per barrel by the second half of 2022 and keep it there throughout 2023, according to our base case view. This change marks an increase on our earlier expectation of an average $79.75 per barrel in 2023 in our previous forecast. European Investment Strategy: European equities are likely to continue to underperform in the near-term. Even if Russia and Europe avoid a full embargo of Russian energy shipments to the West, the disruption caused by a rupture of natural gas flows via Ukraine will keep European gas prices at elevated levels. Additionally, investors will continue to handicap the needed risk premia to compensate for the low but real threat of an energy crisis, which would prove particularly debilitating for Hungary, Poland, Germany, Czechia and Italy (Chart 2). Moreover, European equities sport a strong value and cyclical profile with significant overweight positions in financial and industrial equities. Industrials will suffer from higher input costs. European financials will suffer from a decline in yields as hawks in the European Central Bank are already softening their rhetoric on the need to tighten policy. However, due to the likely temporary nature of the dislocation, we do not recommend selling Europe outright and instead will stick with our current hedges, such as selling EUR/JPY and EUR/CHF. The evolution of the military situation on the ground will warrant a re-valuation of this hedging strategy next week. The euro will soon become a buy. Chart 2EU Economy Highly Vulnerable To Any Large Energy Cutoff
Risk Premium Will Fade From Oil Price
Risk Premium Will Fade From Oil Price
Foreign Exchange Strategy: The Ukraine crisis will lead to a period of strength for the US dollar (DXY). Countries requiring foreign capital will be most at risk from an escalation in tensions. We still suspect the DXY will peak near 98-100, but volatility will swamp fundamental biases. Geopolitical Strategy: On a strategic basis, stick with our long trades in gold, arms manufacturers, UK equities relative to EU equities, and the Japanese yen. On a tactical basis, stick with long defensive sectors, large caps, Japanese equities relative to German, and Mexican equities relative to emerging markets. We will revisit these trades next week, after the European energy question becomes clearer, to determine whether to book profits on our bearish tactical trades. – The BCA Research Team
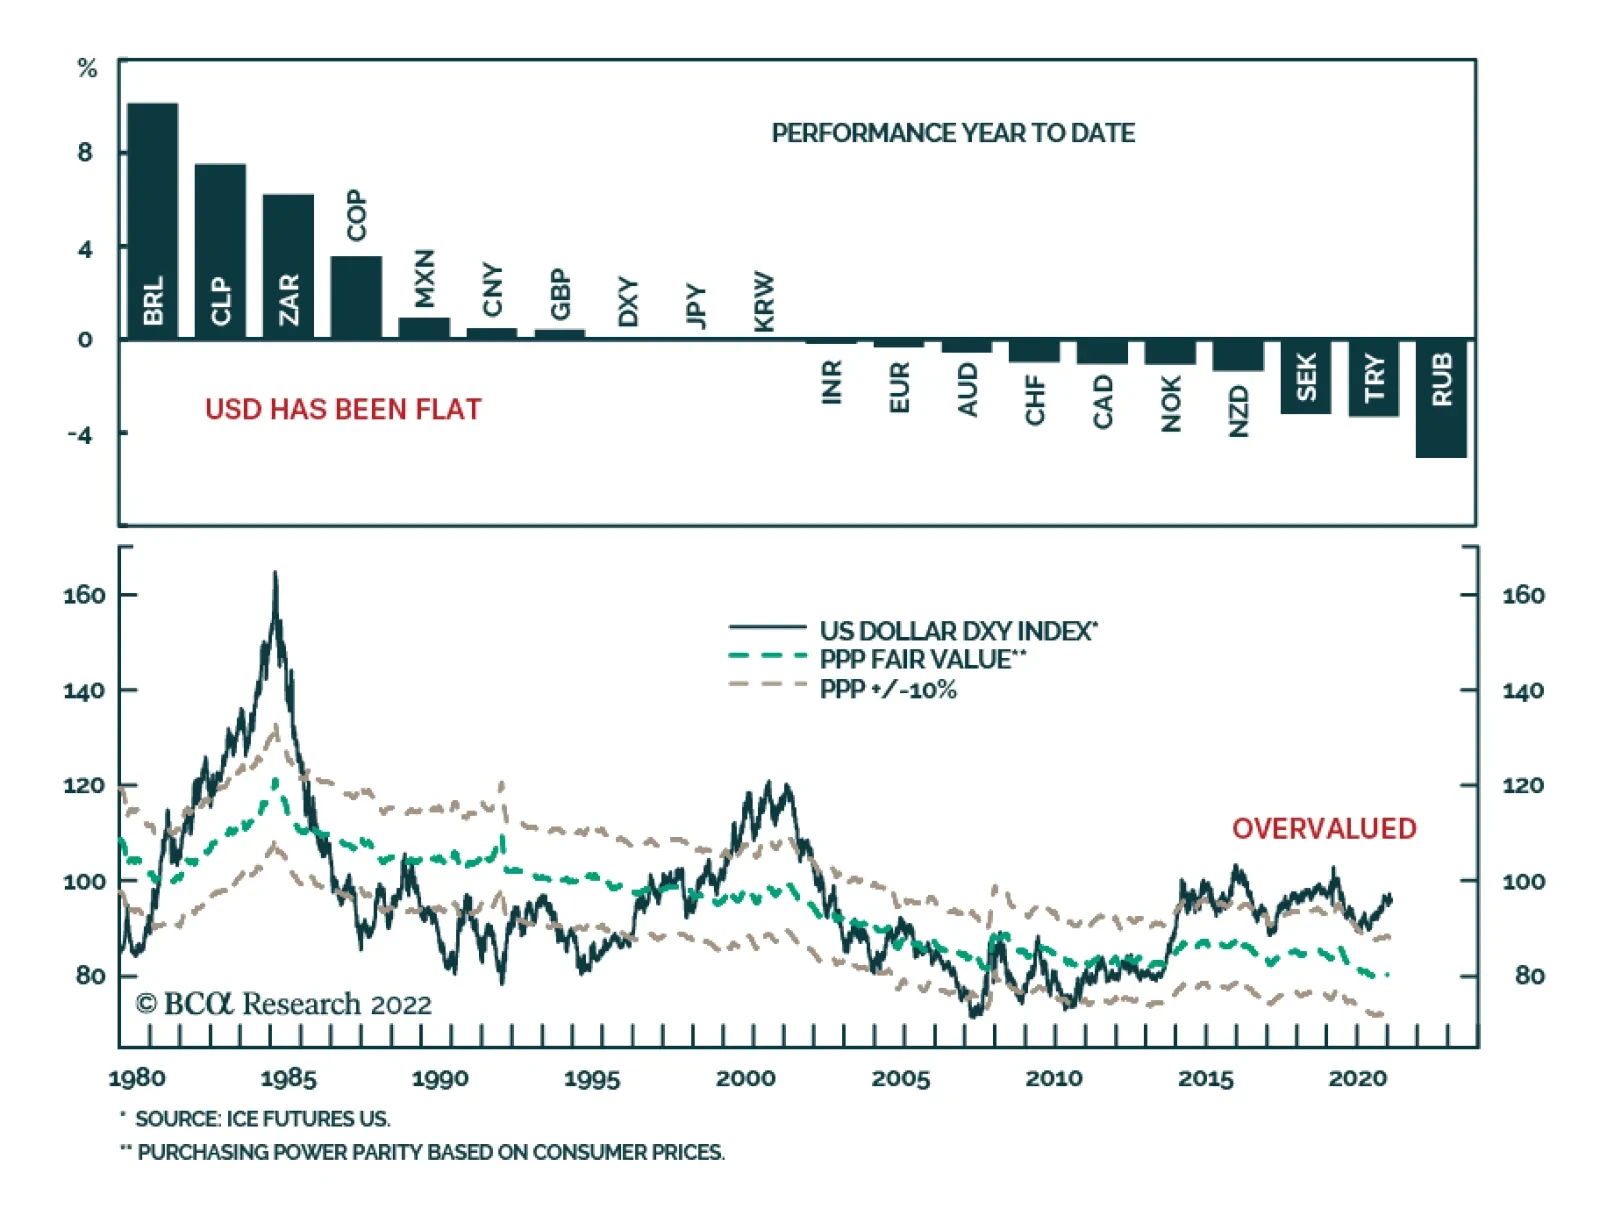
The greenback typically benefits from a flight to safety amid periods of elevated geopolitical tensions. We recently showed that the dollar strengthens when global uncertainty increases. However, the latest bout of geopolitical tensions on the back of the…
Executive Summary Lots Of Pent-Up Demand
Lots Of Pent-Up Demand
Lots Of Pent-Up Demand
The yen is unlikely to meaningfully appreciate until global bond yields stabilize. That said, very cheap valuations and a large net short position provide ample ammunition for an explosive rebound should macroeconomic conditions fall into place. The macro catalyst is likely to come from a domestic growth rebound. Unlike other developed economies, private consumption in Japan has been rather anemic on the back of cascading lockdowns. Inflation in Japan will remain contained in 2022, meaning the Bank of Japan will stay dovish. That said, the Japanese economy is also one of the best candidates for generating non-inflationary growth, a bullish backdrop for the currency. Our 2022 target for the yen is 104. Our sense is that most of the downside risks are well understood by markets, while upside surprises are much underappreciated. Recommendations Inception Level Inception Date Return Short CHF/JPY 125.05 2022-02-17 - Bottom Line: Real rates are likely to remain quite attractive in Japan. While that has not been a key driver of the currency in the short term, it remains an anchor over a longer horizon. According to our in-house PPP models, an investor who buys the yen today can expect to make 6% a year over the next decade, based on the historical correlation between valuation and subsequent currency returns. Feature Chart 1Anemic Passenger Volumes
Anemic Passenger Volumes
Anemic Passenger Volumes
The Japanese economy grew by 1.7% in 2021. For an economy with a potential growth rate of only 0.5%, this is an impressive feat. Even more remarkable is that this growth occurred within the context of very anemic domestic demand. The external sector in Japan has been benefiting from a global trade boom, while the domestic sector has been under siege from the pandemic. Anecdotally, the situation on the ground remains rather dire. Shinkansen passenger volumes are still down 35% this year after an even bigger collapse last year. According to Nikkei Asia, the waiting list to enter Japan continues to grow, as border restrictions are enforced. Of the 626,000 individuals approved for residence in Japan since January 2020, only 35% have filtered through. More broadly, at the peak, tourist arrivals (a meaningful source of demand) represented 25% of the overall Japanese population. Today, that number remains near zero (Chart 1). Amidst the gloom, pockets of Japanese financial markets are beginning to suggest a turnaround in economic conditions. The yield curve in Japan is steepening, usually a sign that monetary conditions remain very conducive to growth. Historically, that has been a bullish signal for the yen (Chart 2). Meanwhile, despite the surge in global bond yields, Japanese bank stocks are outperforming. The banking sector is usually one of the first to sniff out an improvement in economic fortunes (Chart 3). Chart 2The Yen And The Japanese Yield Curve
The Yen And The Japanese Yield Curve
The Yen And The Japanese Yield Curve
Chart 3Japanese Banks Are Outperforming
Japanese Banks Are Outperforming
Japanese Banks Are Outperforming
Outside financials, with inflation surging around the world, the Japanese economy is one of the best candidates for generating non-inflationary growth. This is bullish for the currency as real rates rise. Our bias is that while it might be too early to go long the yen today, conditions are gradually falling into place for a coiled spring rebound. The Case For Japanese Growth While the manufacturing PMI in Japan hit an 8-year high of 55.4 in January, the services PMI sits at 47.6, the lowest in the G10. The number of daily new COVID-19 cases breached 100,000 this month, the highest since the pandemic began two years ago. Hospitalizations and deaths are also rising acutely. However, there is rising evidence that Japan is beginning to put the worst of the pandemic behind it. 79.5% of the population is fully vaccinated, versus just about 50% six months ago. Booster shots are being ramped up quickly. The effective reproduction rate of the virus has dropped sharply, from 2.29 at the end of last year to 1.19 currently. According to government officials, there will be sufficient progress made on the virus front to begin relaxing border requirements and restrictions by next month. Optimism on the COVID-19 front will be a welcome fillip to much subdued consumer and business sentiment. Consumption outlays in Japan remain well below the pre-pandemic trend, especially towards services (Chart 4). As the economy reopens, and the labor market recovery continues, the war chest of Japanese savings that have been built in recent years should be modestly unwound. The job-to-applicants ratio is inflecting higher and workers’ propensity to consume has been improving (Chart 5). Chart 5A Labor Market Recovery Will Boost Spending
A Labor Market Recovery Will Boost Spending
A Labor Market Recovery Will Boost Spending
Chart 4Lots Of Pent-Up Demand
Lots Of Pent-Up Demand
Lots Of Pent-Up Demand
Wage increases remain very modest in Japan. Fumio Kishida, the Japanese prime minister has called for wage increases above 3%. His government also wants to raise the minimum wage from ¥930 to ¥1000, after a 3% increase last year. As the Shuntō (spring wage negotiations) begin, unions are likely to become more vocal in demanding wage increases. However, with a large share of temporary workers in Japan, and company preferences for one-time bonuses versus permanent pay increases, overall wage growth in Japan should remain in the 1-2% range, in line with BoJ forecasts. This puts Japan miles away from a wage inflation price spiral. From a contrarian perspective, it also means that falling unit labor costs are making the currency extremely competitive (Chart 6). Chart 6Japanese Workers Are Both Productive And Competitive
Japanese Workers Are Both Productive And Competitive
Japanese Workers Are Both Productive And Competitive
Chart 7A Smaller Fiscal Drag In 2022
A Smaller Fiscal Drag In 2022
A Smaller Fiscal Drag In 2022
In a nutshell, Japan has had cascading shocks from the consumption tax hike in 2019 to six waves of COVID-19 over the last two years. These have led to a massive build in pent-up demand, which should be unleashed in the coming quarters. Government outlays will also go a long way towards boosting aggregate demand. A supplementary budget of ¥36tn was put together last year and approved for the fiscal year that ends this April. The even bigger 2022 budget of ¥107.6tn should also help ease the fiscal drag in 2022 (Chart 7). For a low-growth economy like Japan, with ultra-loose monetary settings, the fiscal multiplier tends to be much larger. The Export Machine Continues To Hum A boom in external demand has been a much welcome cushion for Japanese growth. Rising energy prices are hurting the nominal trade balance, but real net exports remain firm. Foreign machinery orders are still rising over 30% year on year, boosting industrial production in Japan (Chart 8). Demand from China has been an important component of foreign sales. As monetary policy is eased in Beijing, domestic demand should start to improve, preventing Japanese exports from collapsing. One of the most cyclical components of Japanese exports is machine tool orders, which remain firm (Chart 9). Chart 9A Chinese Recovery Will Cushion Export Growth
A Chinese Recovery Will Cushion Export Growth
A Chinese Recovery Will Cushion Export Growth
Chart 8Machinery Orders Remain Robust
Machinery Orders Remain Robust
Machinery Orders Remain Robust
Monetary Policy And Inflation The Bank of Japan is unlikely to adjust monetary settings aggressively, amidst a recovery in demand. It could widen the target band for yield curve control, while bringing short rates back to zero, but this will require a vigorous rebound in demand and inflation. It could also scrap its 0% bank loan scheme but given these are targeted (especially towards renewable industries, and small/medium-sized firms), that is unlikely. Remarkably, the BoJ has not had to increase its holdings of government securities over the last year, as markets have viewed its policy as credible (Chart 10). Doing little is likely the best path of action for the BoJ in 2022. Chart 112% Inflation = Mission Impossible?
2% Inflation = Mission Impossible?
2% Inflation = Mission Impossible?
Chart 10Not Much QE By The BoJ
Not Much QE By The BoJ
Not Much QE By The BoJ
The key variable for the BoJ remains its 2% inflation target, which seems elusive for the time being. Inflation does not tend to accelerate in Japan until the output gap is fully closed. That has yet to occur. Meanwhile, the political push to cut mobile phone prices has been a drag on CPI. Mobile phone charges alone have cut around 1.2%-1.5% from the core core measure of Japanese inflation, according to the BoJ (Chart 11). Moreover, the decline in phone charges has been structural, even though it is usually touted as a one-off. A falling yen would allow some pass-through inflation, but this is unlikely to be sticky. The yen needs to fall 20% every year to generate 2% inflation in Japan (Chart 12). The pass-through is likely to be much higher for price-volatile items such as food and energy, which is likely to create angst among the rapidly ageing population. Chart 122% Inflation = 20% Yen Depreciation
2% Inflation = 20% Yen Depreciation
2% Inflation = 20% Yen Depreciation
Putting it all together, real rates are unlikely to fall very much in Japan. This is very positive for the yen in a world with deeply negative real rates. As demand recovers, and the Japanese economy generates non-inflationary growth, the currency should find a solid footing. The Yen And Portfolio Flows It will be very difficult for the yen to rally if global yields continue to rise aggressively (Chart 13). With yield curve control in Japan, the nominal spread with foreign yields has been narrowing. However, the cost of hedging those foreign yields has also risen dramatically, which has prevented Japanese investors from aggressively flocking to overseas fixed income markets (Chart 14). That said, the weakness in the yen also suggests speculators have been borrowing in JPY to bet on carry strategies. Chart 13Global Yields Need To Stabilize To Cushion The Yen
Global Yields Need To Stabilize To Cushion The Yen
Global Yields Need To Stabilize To Cushion The Yen
Chart 14No Massive Outflows From Japan Yet
No Massive Outflows From Japan Yet
No Massive Outflows From Japan Yet
The rise in Treasury yields has yet to hit exhaustion from a technical perspective. Our bond strategists expect the 10-year yield to reach 2.25%, which will also enter the zone where we have historically seen some consolidation. The J.P. Morgan survey shows that most of its clients are short duration, but speculators are only modestly short 10-year or 30-year Treasurys (Chart 15). Chart 16USD/JPY And DXY Tend To Move Together
USD/JPY And DXY Tend To Move Together
USD/JPY And DXY Tend To Move Together
Chart 15Modest Upside In Treasury Yields?
Modest Upside In Treasury Yields?
Modest Upside In Treasury Yields?
Once yields stabilize, and the dollar starts to weaken, the positive real rate spread between Japan and the US should attract yen inflows, or at least nudge speculators to start liquidating massive short positions. As a counter-cyclical currency, the yen usually weakens against other developed market currencies, but USD/JPY tends to fall, on broad dollar weakness (Chart 16). Finally, the recent turbulence in markets has seen the yen begin to shine as a safe haven, more so than the US dollar and the Swiss franc (Chart 17). In the near term, this is a catalyst for long yen positions. With US interest rates having risen significantly versus almost all G10 countries in recent quarters, the dollar has become a carry currency. It is difficult for any currency to act as both a safe haven and carry currency, due to opposing driving forces. A rise in volatility will be a boost for the yen. Chart 17The Yen Is The Better Hedge
The Yen Is The Better Hedge
The Yen Is The Better Hedge
Valuations And A Trade Idea In a report titled “A Short Note On US Dollar Valuations,” we suggested that the yen was the most undervalued G10 currency. According to our in-house PPP models, an investor who buys the yen today can expect to make 6% a year over the next decade, based on the historical correlation between valuation and subsequent currency returns (Chart 18). This will especially be the case if Japanese inflation keeps lagging inflation in the US. As a play on rising volatility, cheaper valuations, and a positive carry, we suggest investors short CHF/JPY today, with a stop at 127, and a target of 115. Historically, these currencies have tended to move together. However, more recently, CHF has risen substantially versus JPY, suggesting some mean reversion is due (Chart 19). Chart 18The Yen Is Very Cheap
The Yen Is Very Cheap
The Yen Is Very Cheap
Chart 19Sell CHF/JPY
Sell CHF/JPY
Sell CHF/JPY
Housekeeping We are closing our long AUD/NZD trade for a modest profit of 2.5%. We introduced this tactical trade over 6 months ago and are now cognizant of the negative carry as global yields rise. As a reminder we usually hold tactical trades for 6 months, and cyclical trades for 6-18 months. Chester Ntonifor Foreign Exchange Strategist chestern@bcaresearch.com Trades & Forecasts Strategic View Tactical Holdings (0-6 months) Limit Orders Forecast Summary