Emerging Markets
Investors do not need to wait for the US election verdict to assess the general trajectory of US-Russia relations, according to a Special Report released on Friday by BCA Research’s Geopolitical Strategy and Emerging Markets Strategy services. Whether…
BCA Research's China Investment Strategy service is upgrading Chinese stocks on a tactical horizon and bringing it in line with its cyclical overweight stance. Chinese stocks have fewer downside risks compared to their global counterparts, which were…
June was the second month in a row to be characterized by expectations of global growth. A cross-sectional review of asset returns shows that the US dollar and treasuries performed the worst, while Brent crude oil, industrial metals, and emerging market…

Highlights A clear U-turn in markets could make investors more conscious of losses, making them likely to sell. Hence, the fear-of-missing-out (FOMO) rally could turn into a fear-of-losing-out, or FOLO selloff. The P/E ratio is negatively correlated to the discount rate and the latter is the sum of the risk-free rate and the equity risk premium (ERP). Enormous lingering uncertainty warrants using an ERP that is at the upper end of its historical range. By using the average equity risk premium in their equity valuation models, investors are underpricing risks that are presently exceptionally high. Several market-based indicators and technical configurations point to a relapse in the global equity rally and renewed US dollar strength. Feature For some time, we have been arguing that the global equity advance since late March can best be described as a fear-of-missing-out, or FOMO, rally. During a FOMO rally, investors are forced to chase share prices higher due to fear of missing out on gains. A clear U-turn in markets and falling share prices could make investors more conscious of losses, and they would likely resort to selling stocks. This will turn the FOMO rally into a fear-of-losing-out, or FOLO, selloff. Marginal investors trade with momentum during both FOMO and FOLO scenarios. This is why we argued in our June 18 note that current investment strategies should be placing more emphasis on momentum than would normally be the case. In a nutshell, if FOMO forces subside, investors – which are facing enormous uncertainty on several fronts – will likely require higher risk premiums to commit money to stocks. For now, the momentum of the equity rally has stalled, but it has not yet reversed (Chart I-1). Our momentum indicator for global share prices is struggling to break above the zero line. In the past, the indicator being above or below zero often differentiated bull versus bear markets, respectively (Chart I-1, bottom panel). Chart I-1Global Share Prices Are Facing An Important Resistance
Global Share Prices Are Facing An Important Resistance
Global Share Prices Are Facing An Important Resistance
In this report, we examine the bullish narrative behind the rally and offer our interpretation of those arguments. Then, we present our assessment of the fundamentals. Finally, we highlight the signs we are looking for to confirm that a major selloff will soon occur. The Bull Case: Climbing A Wall Of Worries? The bull case rests on the thesis that risk assets are climbing a wall of worries, i.e., investors are correct to look through many apparent negatives. The following are the key bullish arguments that have supported the rally: Policymakers around the world will do whatever it takes. The US, China and Europe will continue to augment stimulus to prevent another relapse in economic activity. We have never doubted the willingness of policymakers around the world to provide stimulus to their economies amid the pandemic. Where we have had reservations and questions is in whether policymakers will be capable of limiting the bear market in stocks to only one month amid the pandemic and the worst global recession in decades. There is plenty of cash on the sidelines looking to be invested. We agree with the lots-of-cash-on-the-sidelines thesis. Our measure of US dollar cash that might be deployed in financial assets is illustrated in Chart I-2. It plots the ratio of the US broad money supply to the market value of all US dollar-denominated securities. The US broad money supply represents all US dollars in the world – in cash and in electronic bank deposits. The denominator is the market capitalization of US dollar-denominated stocks and all types of bonds held by non-bank investors. If the market shows resilience and the pandemic situation and corporate profits ameliorate, cash on the sidelines will leak into assets, lifting their prices. The counterargument is as follows: If and when the equity momentum reverses, FOMO will be followed by a FOLO phase. In such a case, investors will sell to avoid losses or protect profits, and cash on the sidelines might not matter for a period of time. The global economy reached a bottom in April-May. We agree that the worst of the contraction in economic activity globally was in April and May, when major economies were in lockdown. Nevertheless, it is also plausible that global share prices could relapse even if the bottom in economic output has already been reached. Interestingly, in the 2001-2002 recession, global stocks made a major new low in late 2002/early 2003 even though global growth bottomed in 2001 (Chart I-3). Chart I-2The US: Broad Money Supply Relative To US Equity And Bond Markets Capitalization
The US: Broad Money Supply Relative To US Equity And Bond Markets Capitalization
The US: Broad Money Supply Relative To US Equity And Bond Markets Capitalization
Chart I-3Global Stocks And The Business Cycle In 2000-2003
Global Stocks And The Business Cycle In 2000-2003
Global Stocks And The Business Cycle In 2000-2003
This recession is different from the perspective of the magnitude of the drop in business activity. Many businesses are still operating below their breakeven points and will likely continue to do so for some time. As such, a marginal increase in the level of activity or slower annual contraction might not be sufficient to enable them to service their debt and resume hiring and business investment. Therefore, the recovery will be stumbling and hesitant and relapses are quite likely, especially in the context of the ongoing pandemic. Finally, one of the pervasive arguments dominating the current investment landscape is that equities are cheap given very low interest rates. Unlike some of our colleagues, we are not in accord with this valuation thesis on global stocks in general and US equities in particular. One consideration that is missing in this argument is the equity risk premium. The P/E ratio is negatively correlated to the discount rate.1 The discount rate is the sum of the risk-free rate and the equity risk premium (ERP). Presently, one should use an ERP that is materially higher than its historical mean (Chart I-4, top panel). Investors are currently facing record-high uncertainty related to the pandemic and the business cycle, as well as the structural trends in the economic, political and geopolitical spheres. This warrants using an ERP that is at the upper end of its historical range. Chart I-4Exceptionally High Uncertainty Warrants A Higher Equity Risk Premium
Exceptionally High Uncertainty Warrants A Higher Equity Risk Premium
Exceptionally High Uncertainty Warrants A Higher Equity Risk Premium
Critically, the ERP is not a static variable. Yet many equity valuation models assume that the ERP is constant, and therefore compare equity multiples with risk-free rates. Such models are wrong-headed because a change in the ERP can in and of itself cause large fluctuations in share prices. The bottom panel of Chart I-4 plots the US ERP and the global policy uncertainty index. The latter is at an all-time high while US ERP is well below its highs. In a nutshell, if FOMO forces subside, investors – which are facing enormous uncertainty on several fronts – will likely require higher risk premiums to commit money to stocks. Bottom Line: By using the average ERP in their equity valuation models, investors are underpricing risks that are presently exceptionally high. Bear Markets (Like Pandemics) Occur In Waves The duration and magnitude of the rally from the late-March lows admittedly has taken us by surprise. Nevertheless, it is hard to believe that the bear market associated with the worst recession and pandemic in a century was confined to only one down leg (albeit a vicious one) and lasted just one month. Just as corrections are inherent parts of bull markets, bear market rallies are an integral part of bear markets. It would be unprecedented if this bear market did not have at least one bear market rally. We do not mean EM or DM share prices will drop to new lows. Our point is that global stocks and EM currencies will likely experience a setback large enough to make investors feel that the bear market is back. Like pandemics, bear markets occur in waves. The timing, duration and magnitude of the second wave of the equity selloff is as impossible to predict as that of the second wave of COVID-19. Just as corrections are inherent parts of bull markets, bear market rallies are an integral part of bear markets. Our fundamental case for a relapse in EM equities and currencies is as follows: First, a downturn in US equities will dampen EM risk assets. The former are vulnerable due to the second wave of the pandemic that is already underway in a considerable portion of the US. Even if the second COVID-19 wave does not produce simultaneous shutdowns across the entire country, rolling lockdowns in parts of the US and lingering general uncertainty will hinder business investment and hiring. This will delay the profit recovery that the market has priced in. Second, global equities have rallied too fast and too far, as evidenced by the unprecedented gap that has opened up between stock prices and forward EPS (Chart I-5). The 12-month forward P/E ratio is 19.5 for global equities, 22.5 for the US and 14 for EM. Rising share prices amid falling projected EPS levels has been one of the key reasons behind our argument that the equity advance of the past three months has been a FOMO rally. Third, retail participation in this equity rally has been unprecedented. This has been true not only in North America but also in many Asian markets. Specifically, Chart I-6 demonstrates increased retail participation in equity markets in Korea, Thailand, and Malaysia. These are corroborated by numerous media articles such as: Amateur Traders Pile Into Asian Stocks, Making Pros Nervous Small India Investors Are Latest to Snag Beaten-Down Stocks Fear of Missing Historic Rally Has Koreans Borrowing to Invest Retail Investors Are Driving Record Turnover in Thai Stocks Singapore’s Retail Investors Load Up On What Institutions Dump Chart I-5The Global Forward P/E Ratio Is At Its Highest Since 2002
The Global Forward P/E Ratio Is At Its Highest Since 2002
The Global Forward P/E Ratio Is At Its Highest Since 2002
Chart I-6A Stampede By Asian Retail Investors Into Local Equities
A Stampede By Asian Retail Investors Into Local Equities
A Stampede By Asian Retail Investors Into Local Equities
Chart I-7Oil Inventories Are Rising In The US And OECD
Oil Inventories Are Rising In The US And OECD
Oil Inventories Are Rising In The US And OECD
Retail investors chasing share prices higher is another fact leading us to term this advance as a FOMO rally. If share prices relapse meaningfully, retail investors may well turn from net buyers to net sellers – i.e. FOMO will turn into FOLO. Fourth, oil prices have had a nice run, despite crude inventories in the US and OECD countries continuing to mushroom (Chart I-7). Rising inventories signify that demand remains deficient relative to supply. Hence, the oil price rally can also be qualified as a FOMO rally, driven by investors rather than demand-supply dynamics. Interestingly, global energy stocks have a higher correlation with forward oil prices rather than the spot rate. Both share prices of oil producers and three-year forward oil prices have already rolled over (Chart I-8). Finally, geopolitical tensions between the US and China are set to escalate as President Trump attempts to save his re-election campaign by rallying the nation behind the flag against foreign adversaries. China would certainly respond. As part of China’s response, North Korea will likely be “allowed” by Beijing to test a strategic weapon, undermining President Trump’s foreign policy achievements. The resulting geopolitical uncertainty will further weigh on the confidence of investors in Asian markets. Critically, share prices in north Asia – China, Korea and Taiwan – that account for 60% of the MSCI EM equity benchmark will come under selling pressure. Excluding these three bourses, EM shares prices have already rolled over (Chart I-9). Chart I-8Global Oil Stock Prices Move With Forward Oil Prices
Global Oil Stock Prices Move With Forward Oil Prices
Global Oil Stock Prices Move With Forward Oil Prices
Chart I-9Diverging Equity Performance: North Asia Versus The Rest Of EM
Diverging Equity Performance: North Asia Versus The Rest Of EM
Diverging Equity Performance: North Asia Versus The Rest Of EM
In short, the key risk to Chinese, Korean and Taiwanese stocks is geopolitics. The rest of the EM universe is suffering from the acute COVID-19 crisis and numerous economic challenges. Bottom Line: The overarching message from our fundamental analysis is that the rally in global and EM share prices has ignored many negatives and is at a risk of a meaningful relapse. Gauging The Second Selling Wave: Technical Observations Chart I-10The US Dollar And VIX Have Not Yet Broken Below Their Supports
The US Dollar And VIX Have Not Yet Broken Below Their Supports
The US Dollar And VIX Have Not Yet Broken Below Their Supports
We constantly monitor numerous market indicators. We highlight below some of the most important ones that we feel are pointing to a second sell-off wave occurring sooner than later. The broad trade-weighted US dollar and the VIX index have not yet entered a bear market (Chart I-10). In fact, it seems they are finding support at their 200-day moving averages and respective horizontal lines - shown on Chart I-10. A rebound in both the trade-weighted dollar and VIX will coincide with an air pocket in global stocks. Our Risk-On/Safe-Haven Currency ratio has rolled over (Chart I-11). It correlates with EM shares prices, and points to a relapse in EM stocks. Chart I-11The Risk-On/Safe-Haven Currency Ratio Heralds A Pullback In EM Stocks
The Risk-On/Safe-Haven Currency Ratio Heralds A Pullback In EM Stocks
The Risk-On/Safe-Haven Currency Ratio Heralds A Pullback In EM Stocks
Finally, credit spreads of riskier parts (CAA rated) of the US high-yield corporate bond universe have commenced widening versus the aggregate US high-yield benchmark. These relative spreads are shown inverted in Chart I-12. Chart I-12US Credit Markets Internals Point To A Relapse In US Small Cap Stocks
US Credit Markets Internals Point To A Relapse In US Small Cap Stocks
US Credit Markets Internals Point To A Relapse In US Small Cap Stocks
Underperformance of riskier parts of the US corporate credit market often coincides with lower US small-cap share prices (Chart I-12). Bottom Line: Several critical market-based indicators and technical configurations point to a relapse in global equities and renewed US dollar strength. The odds of a selloff in EM share prices, currencies and credit markets are considerable. Investment Recommendations In our June 18 report, we contended that a breakout of global share prices and a breakdown in the trade-weighted US dollar would indicate that this rally might persist for a while. Conversely, a drawdown in global equities and a rebound in the greenback could be considerable. Since then, neither global stocks have broken out nor the US dollar broken down. Hence, the jury is still out. At the moment, the risk-reward profile of EM stocks remains unattractive. Within a global equity portfolio, we continue underweighting EM. Within a global credit portfolio, we are neutral on EM sovereign credit versus US corporate credit. The rationale is as follows: the low odds of public debt defaults among mainstream developing countries and the Federal Reserve’s purchases of US corporate bonds has channeled flows to EM credit, possibly precluding relative EM underperformance. We continue shorting the following basket of EM currencies versus the US dollar: BRL, CLP, ZAR, TRY, IDR, PHP and KRW. Structurally, we are also short the RMB and SAR. Finally, we continue receiving rates in Mexico, Colombia, India, China, Malaysia, Korea, Russia, Ukraine, Pakistan and Egypt. Central banks in the majority of EM countries will continue cutting rates, but we find better value in these fixed-income markets. Arthur Budaghyan Chief Emerging Markets Strategist arthurb@bcaresearch.com Footnotes 1 The P/E ratio inversely correlates to the discount rate: P/E ratio = (Payout rate x (1 + Growth rate))/ (Discount rate – Growth rate) Equities Recommendations Currencies, Credit And Fixed-Income Recommendations
Highlights Recommended Allocation
Quarterly Portfolio Outlook: Cash Injections Versus COVID Infections
Quarterly Portfolio Outlook: Cash Injections Versus COVID Infections
The coronavirus pandemic is not over. Enormous fiscal and monetary stimulus will soften the blow to the global economy, but there remain significant risks to growth over the next 12 months. The P/E ratio for global equities is near a record high. This suggests that the market is pricing in a V-shaped recovery, and ignoring the risks. We can, therefore, recommend no more than a neutral position on global equities. But government bonds are even more expensive, with yields having largely hit their lower bound. Stay underweight government bonds, and hedge downside risk via cash. The US dollar is likely to depreciate further: It is expensive, US liquidity has risen faster than elsewhere, interest-rate differentials no longer favor it, and momentum has swung against it. A weakening dollar – plus accelerating Chinese credit growth – should help commodities. We raise the Materials equity sector to neutral, and put Emerging Market equities on watch to upgrade from neutral. Corporate credit selectively remains attractive where central banks are providing a backstop. We prefer A-, Baa-, and Ba-rated credits, especially in the Financials and Energy sectors. Defensive illiquid alternative assets, such as macro hedge funds, have done well this year. But investors should start to think about rotating into private equity and distressed debt, where allocations are best made mid-recession. Overview Cash Injections Vs. COVID Infections The key to where markets will move over the next six-to-nine months is (1) whether there will be a second wave of COVID-19 cases and how serious it will be, and (2) how much appetite there is among central banks and fiscal authorities to ramp up stimulus to offset the damage the global economy will suffer even without a new spike in cases. A new wave of COVID-19 in the northern hemisphere this fall and winter is probable. It is not surprising, after such a sudden stop in global activity between February and May, that economic data is beginning to return to some sort of normality. PMIs have generally recovered to around 50, and in some cases moved above it (Chart 1). Economic data has surprised enormously to the upside in the US, although it is lagging in the euro zone and Japan (Chart 2). Chart 1Data Is Rebounding Sharply
Data Is Rebounding Sharply
Data Is Rebounding Sharply
Chart 2US Data Well Above Expectations
US Data Well Above Expectations
US Data Well Above Expectations
New COVID-19 cases continue to rise alarmingly in some emerging economies and in parts of the US, but in Europe and Asia the pandemic is largely over (for now) and lockdown regulations are being eased, allowing economic activity to resume (Chart 3). Nonetheless, consumers remain cautious. Even where economies have reopened, people remain reluctant to eat in restaurants, to go on vacation, or to visit shopping malls (Chart 4). While shopping and entertainment activities are now no longer 70-80% below their pre-pandemic levels, as they were in April and May, they remain down 20% or more (Chart 5). Chart 3Few COVID-19 Cases Now In Europe And Asia
Few COVID-19 Cases Now In Europe And Asia
Few COVID-19 Cases Now In Europe And Asia
Chart 4Consumers Still Reluctant To Go Out
Quarterly Portfolio Outlook: Cash Injections Versus COVID Infections
Quarterly Portfolio Outlook: Cash Injections Versus COVID Infections
Chart 5Spending Well Below Pre-Pandemic Levels
Quarterly Portfolio Outlook: Cash Injections Versus COVID Infections
Quarterly Portfolio Outlook: Cash Injections Versus COVID Infections
So how big is the risk of further spikes in COVID-19 cases? Speaking on a recent BCA Research webcast, the conclusion of Professor Peter Doherty, a Nobel prize-winning immunologist connected to the University of Melbourne, was that, “It’s not unlikely we’ll see a second wave.”1 But experts can’t be sure. It seems that the virus spreads most easily when people group together indoors. That is why US states where it is hot at this time of the year, such as Arizona, have seen rising infections. This suggests that a new wave in the northern hemisphere this fall and winter is probable. Offsetting the economic damage caused by the coronavirus has been the staggering amount of liquidity injected by central banks, and huge extra fiscal spending. Major central bank balance-sheets have grown by around 5% of global GDP since March, causing a spike in broad money growth everywhere (Chart 6). Fiscal spending programs also add up to around 5% of global GDP (Chart 7), with a further 5% or so in the form of loans and guarantees. Chart 6Remarkable Growth In Money Supply...
Remarkable Growth In Money Supply...
Remarkable Growth In Money Supply...
Chart 7...And Unprecedented Fiscal Spending
Quarterly Portfolio Outlook: Cash Injections Versus COVID Infections
Quarterly Portfolio Outlook: Cash Injections Versus COVID Infections
But is it enough? Considerable damage has been done by the collapse in activity. Bankruptcies are rising (Chart 8) and, with activity still down 20% in consuming-facing sectors, pressure on companies’ business models will not ease soon – particularly given evidence that banks are tightening lending conditions. Household income has been buoyed by government wage-replacement schemes, handout checks, and more generous unemployment benefits (Chart 9). But, when these run out, households will struggle if the programs are not topped up. Central banks are clearly willing to inject more liquidity if need be. But the US Congress is prevaricating on a second fiscal program, and the Merkel/Macron proposed EUR750 billion spending package in the EU is making little progress. It will probably take a wake-up call from a sinking stock market to push both to take action. Chart 8Companies Feeling The Pressure
Quarterly Portfolio Outlook: Cash Injections Versus COVID Infections
Quarterly Portfolio Outlook: Cash Injections Versus COVID Infections
Considerable damage has been done by the collapse in activity. We lowered our recommendation for global equities to neutral from overweight in May. We are still comfortable with that position. Given the high degree of uncertainty, this is not a market in which to take bold positioning in a portfolio. When you have a high conviction, position your portfolio accordingly; but when you are unsure, stay close to benchmark. With stocks up by 36% since their bottom on March 23rd, the market is pricing in a V-shaped recovery and not, in our view, sufficiently taking into account the potential downside risks. P/E ratios for global stocks are at very stretched levels (Chart 10). Chart 9Households Dependent On Handouts
More Stimulus Forthcoming? Households Dependent On Handouts
More Stimulus Forthcoming? Households Dependent On Handouts
Chart 10Global Equities Are Expensive...
Global Equities Are Expensive...
Global Equities Are Expensive...
Nonetheless, we would not bet against equities. Simply, there is no alternative. Most government bond yields are close to their effective lower bound. Gold looks overbought (in the absence of a significant spike in inflation which, while possible, is unlikely for at least 12 months). No sensible investor in, say, Germany would want to hold 10-year government bonds yielding -50 basis points. Assuming 1.5% average annual inflation over the next decade, that guarantees an 18% real loss over 10 years. The only investors who hold such positions have them because their regulators force them to. Chart 11...But They Are Cheap Against Bonds
...But They Are Cheap Against Bonds
...But They Are Cheap Against Bonds
The Sharpe ratio on 10-year US Treasurys, which currently yield 70 BPs, will be 0.16 (assuming volatility of 4.5%) over the next 10 years. A simple calculation of the likely Sharpe ratio for US equities (earnings yield of 4.5% and volatility of 16%) comes to 0.28. One would need to assume a disastrous outlook for the global economy to believe that stocks will underperform bonds in the long run. Though equities are expensive, bonds are even more so. The equity risk premium in most markets is close to a record high (Chart 11). With such mathematics, it is hard for a long-term oriented investor to be underweight equities. Garry Evans, Senior Vice President Chief Global Asset Allocation Strategist garry@bcaresearch.com What Our Clients Are Asking Chart 12Premature Opening Of The Economy Is Risky
Quarterly Portfolio Outlook: Cash Injections Versus COVID Infections
Quarterly Portfolio Outlook: Cash Injections Versus COVID Infections
COVID-19: How Risky Is Reopening? Countries around the world are rushing to reopen their economies, claiming victory over the pandemic. It is hard to be sure whether a second wave of COVID-19 will hit. What is certain, however, is that a premature relaxation of measures is as risky as a tardy initial response. That was the lesson from our Special Report analyzing the Spanish Flu of 1918. The risk is certainly still there: Herd immunity will require around 70% of the population to get sick, and a drug or vaccine will (even in an optimistic scenario) not be available until early next year. China and South Korea, for example, after reporting only a handful of daily new cases in early May, were forced to impose new restrictions over the past few weeks as COVID-19 cases spiked again (Chart 12, panel 1). We await to see if other European countries, such as Italy, Spain, and France will be forced to follow. Some argue that even if a second wave hits, policy makers – to avoid a further hit to economic output – will favor the “Swedish model”: Relying on people’s awareness to limit the spread of the virus, without imposing additional lockdowns and restrictions. This logic, however, is risky since Sweden suffered a much higher number of infections and deaths than its neighboring countries (panel 2). The US faces a similar fate. States such as Florida, Arizona, and Texas are recording a sharp rise in new infections as lockdowns are eased. In panel 3, we show the daily number of new infections during the stay-at-home orders (the solid lines) and after they were lifted (dashed lines). To an extent, increases in infections are a function of mass testing. However, what is obvious is that the percentage of positive cases per tests conducted has started trending upwards as lockdown measures were eased (panel 4). Our base case remains that new clusters of infections will emerge. Eager citizens and rushed policy decisions will fuel further contagion. If the Swedish model is implemented, lives lost are likely to be larger than during the first wave. Chart 13W Or U, Says The OECD
Quarterly Portfolio Outlook: Cash Injections Versus COVID Infections
Quarterly Portfolio Outlook: Cash Injections Versus COVID Infections
What Shape Will The Recovery Be: U, V, W, Or Swoosh? The National Bureau of Economic Research (NBER) Business Cycle Dating Committee has already declared that the US recession began in March. The economists’ consensus is that Q2 US GDP shrank by 35% QoQ annualized. But, after such a momentous collapse and with a moderate move back towards normalcy, it is almost mathematically certain that Q3 GDP will show positive quarter-on-quarter growth. So does this mean that the recession lasted only one quarter, i.e. a sharp V-shape? And does this matter for risk assets? The latest OECD Economic Outlook has sensible forecasts, using two “equally probable” scenarios: One in which a second wave of coronavirus infections hits before year-end, requiring new lockdowns, and one in which another major outbreak is avoided.2 The second-wave scenario would trigger a renewed decline in activity around the turn of 2020-21: a W-shape. The second scenario looks more like a U-shape or swoosh, with an initial rebound but then only a slow drawn-out recovery, with OECD GDP not returning to its Q4 2019 level before the end of 2021 (Chart 13). Chart 14Unemployment Will Take A Long Time To Come Down
Unemployment Will Take A Long Time To Come Down
Unemployment Will Take A Long Time To Come Down
Why is it likely that, in even the absence of a renewed outbreak of the pandemic, recovery would be faltering? After an initial period in which many furloughed workers return to their jobs, and pent-up demand is fulfilled, the damage from the sudden stop to the global economy would kick in. Typically, unemployment rises rapidly in a recession, but recovers only over many years back to its previous low (Chart 14). This time, many firms, especially in hospitality and travel, will have gone bust. Capex plans are also likely to be delayed. Chart 15Sub-Potential Output Can Be Good For Risk Assets
Sub-Potential Output Can Be Good For Risk Assets
Sub-Potential Output Can Be Good For Risk Assets
However, a slow recovery is not necessarily bad for risk assets. Periods when the economy is recovering but remains well below potential (such as 2009-2015) are typically non-inflationary, which allows central banks to continue accommodation (Chart 15). Is This Sharp Equity Rebound A Retail Investor Frenzy? The answer to this question is both Yes and No. From a macro fundamental perspective, the answer is No, because coordinated global reflationary policies and medical developments to fight the coronavirus have been the key drivers underpinning this equity rebound. “COVID-on” and “COVID-off” have been the main determinants for equity rotations. Chart 16Active Retail Participation Lately
Retail Investors Have Driven Up Trading Volumes Active Retail Participation Lately
Retail Investors Have Driven Up Trading Volumes Active Retail Participation Lately
But at the individual stock level, the answer is Yes. Some of the unusual action in beaten-down stocks over the past few weeks may have its origin in an upsurge of active retail participation (Chart 16). Retail investors on their own are not large enough to influence the market direction. Many online brokerages do not charge any commission for trades, but make money by selling order flows to hedge funds. As such, the momentum set in motion by retail investors may have been amplified by fast-money pools of capital. Retail participation in some beaten-down stocks has also provided an opportunity for institutions to exit. BCA’s US Investment Strategy examined the change in institutional ownership of 12 stocks in three stressed groups between February 23 and June 14, as shown in Table 1. In the case of these stocks, retail investors have served as liquidity providers to institutional sellers seeking to exit their holdings. The redeployment of capital by institutions into large-cap and quality names may have pushed up the overall equity index level. Table 1Individuals Have Replaced Institutions
Quarterly Portfolio Outlook: Cash Injections Versus COVID Infections
Quarterly Portfolio Outlook: Cash Injections Versus COVID Infections
How Will Inflation Behave After COVID? Some clients have asked us about the behavior of inflation following the COVID epidemic. Over the very short term, inflation could have more downside. However, this trend is likely to reverse rapidly. Headline inflation is mainly driven by changes in the oil price and not by its level. Thus, even if oil prices were to stay at current low levels, the violent recovery of crude from its April lows could bring headline inflation near pre-COVID levels by the beginning of 2021 (Chart 17, top panel). This effect could become even larger if our Commodity strategist price target of 65$/barrel on average in 2021 comes to fruition. Chart 17Rising Oil Prices And Fiscal Stimulus Will Boost Inflation
Rising Oil Prices And Fiscal Stimulus Will Boost Inflation
Rising Oil Prices And Fiscal Stimulus Will Boost Inflation
But will this change in inflation be transitory or will it prove to be sustainable? We believe it will be the latter. The COVID crisis may have dramatically accelerated the shift to the left in US fiscal policy. Specifically, programs such as universal basic income may now be within the Overton window3 of acceptable fiscal policy, thanks to the success of the CARES Act in propping up incomes amid Depression-like levels of unemployment (middle panel). Meanwhile there is evidence that this stimulus is helping demand to recover rapidly: Data on credit and debit card trends show that consumer spending in the US has staged a furious rally, particularly among low-income groups, where spending has almost completely recovered (bottom panel). With entire industries like travel, restaurants and lodging destroyed for the foreseeable future, the political will to unwind these programs completely is likely to be very low, given that most policymakers will be queasy about an economic relapse, even after the worst of the crisis has passed. Such aggressive fiscal stimulus, coupled with extremely easy monetary policy will likely keep inflation robust on a cyclical basis. Global Economy Overview: March-May 2020 will probably prove to be the worst period for the global economy since the 1930s, as a result of the sudden stop caused by the coronavirus pandemic and government-imposed restrictions on movement. As the world slowly emerges from the pandemic, data has started to improve. But there remain many risks, and global activity is unlikely to return to its end-2019 level for at least another two years. That means that further fiscal and monetary stimulus will be required. The speed of the recovery will be partly determined by how much more aggressively central banks can act, and by how much appetite there is among fiscal authorities to continue to bail out households and companies which have suffered a catastrophic loss of income. US: The economy has shown signs of a strong rebound from the coronavirus slump in March and April. Q2 GDP probably fell around 35% quarter-on-quarter annualized, but Q3 will almost certainly show positive growth. The Economic Surprise Index (Chart 18, panel 1) has bounced to a record high, after stronger-than expected May data, for example the 16% month-on-month growth in durable goods orders, and 18% in retail sales. But the next stage of the recovery will be harder: continuing unemployment claims in late June were still 19.5 million. Bankruptcies are rising, and banks are tightening lending conditions. One key will be whether Congress can pass a further fiscal program before the emergency spending runs out in July. Euro Area: Although pandemic lockdowns ended in Europe earlier than in the US, recovery has been somewhat slower. The euro zone PMI rebounded to close to 50 in June but, given that activity had collapsed in February-May, it is surprising (since the PMI measures month-on-month change) that it is not well above 50 (Chart 19, panel 1). Fiscal and monetary stimulus, while large, has not been as aggressive as in the US. The ECB remains circumscribed (as least psychologically) by the German constitutional court’s questioning the justification for previous QE. Germany and France have agreed a EUR750 billion additional package to help the periphery, but this has still to be finalized, due to the opposition of some smaller northern EU members. Chart 18Economic Data Has Started To Surprise To The Upside...
Economic Data Has Started To Surprise To The Upside...
Economic Data Has Started To Surprise To The Upside...
Chart 19...But From Dramatically Low Levels
...But From Dramatically Low Levels
...But From Dramatically Low Levels
Japan: Although Japan escaped relatively easily from pandemic deaths and lockdowns, its economy remains notably weak. New machinery orders in April were still falling 18% YoY, and exports in May were down 28% YoY. The poor economic performance is due to its dependence on overseas demand, distrust in the government, the lingering effects of the ill-timed consumption tax rise last October, and limited room for manoeuvre by the Bank of Japan. The government has announced fiscal stimulus equal to a barely credible 40% of GDP, but much of this is double-counting, and less than half of the household and small-company income-replacement handouts announced in March have so far been paid out. Emerging Markets: India, Brazil, and other Latin American countries are now bearing the brunt of the coronavirus pandemic. Economies throughout Emerging Markets have weakened dramatically as a result. Two factors may come to their aid, though. China is again ramping up monetary stimulus, with a notable acceleration of credit growth over the past three months. Its economy has stabilized as a result, as PMIs show (panel 3). And the US dollar has begun to depreciate, which will take pressure off EM borrowers in foreign currencies, and boost commodities prices. The biggest risk is that many EM central banks have now resorted to printing money, which could result in currency weakness and inflation at a later stage. Interest Rates: Central banks in advanced economies have lowered policy rates to their effective lower bound. It is unlikely the Fed will cut into negative territory, having seen the nefarious effects of this on the banking systems in Japan and the euro zone, and particularly due to the large money-market fund industry in the US, which is unviable with negative rates. Reported inflation everywhere, both headline and core, has fallen sharply, but this is somewhat misleading since the price of items that households in lockdown have actually been buying has risen sharply. Markets have started to sniff out the possibility of inflation once the pandemic is over, and inflation expectations have begun to rise (panel 4). For now, deflation is likely to be the bigger worry and so we do not expect long-term rates to rise much this year. But a sharp pickup in inflation is a definite risk on the 18-24 month time horizon. Global Equities Chart 20Stretched Valuation
Has Earnings Growth Bottomed?
Has Earnings Growth Bottomed?
Valuation Concern: Global equities staged an impressive rebound of 18% in Q2 after the violent selloff in Q1, thanks to the “whatever-it-takes” support from central banks, and massive fiscal stimulus packages around the globe. Within equities, our country allocation worked well, as the US outperformed both the euro Area and Japan. Our sector performance was mixed: The overweight in Info Tech and underweight in Utilities and Real Estate generated good profits, but the overweights in Industrials and Healthcare and the underweight in Materials suffered losses. As shown in Chart 20, even before the pandemic-induced profit contraction, forward earnings were already only flattish in 2019. The sharp selloff in Q1 brought the valuation multiple back down only to the same level as at the end of 2018. Currently, this valuation measure stands at the highest level since the Great Financial Crisis after a 37% increase in Q2 2020 alone. Such a rapid multiple expansion was one of the key reasons why we downgraded equities to Neutral in May at the asset-class level. Going forward, BCA’s house view is that easy monetary policies and stimulative fiscal policies globally will help to revive economic activity, and that a weakening US dollar will give an additional boost to the global economy, especially Emerging Markets. Consequently, we upgrade global Materials to neutral from underweight and put Emerging Market equities (currently neutral) on an upgrade watch (see next page). Warming To Reflation Plays Chart 21EM On Upgrade Watch
EM On Upgrade Watch
EM On Upgrade Watch
Taking risk where risks will most likely be rewarded has been GAA’s philosophy in portfolio construction. As equity valuation reaches an extreme level, the natural thing to do is to rotate into less expensive areas within the equity portfolio. As shown in panel 2 of Chart 21, EM equities are trading at a 31% discount to DM equities based on forward P/E, which is 2 standard deviations below the average discount of past three years. Valuation is not a good timing tool in general, but when it reaches an extreme, it’s time to pay attention and check the fundamental and technical indicators. We are putting EM on upgrade watch (from our current neutral stance, and also closing the underweight in Materials given the close correlation of the two (Chart 21, panel 1). Three factors are on our radar screen: First, reflation efforts in China. The change in China’s total social financing as a % of GDP has been on the rise and BCA’s China Investment Strategy Team expects it to increase further. This bodes well for the momentum of the EM/DM performance, which is improving, albeit still in negative territory (panel 3). Second, a weakening USD is another key driver for EM/DM and the Materials sector relative performance as shown in panel 4. According to BCA’s Foreign Exchange Strategy, the US dollar is likely to churn on recent weakness before a cyclical bear market fully unfolds.4 Last but not least, the recent surge in the number of the coronavirus infections in EM economies, especially Brazil and India, has increased the likelihood of a second wave of lockdowns. Government Bonds Chart 22Bottoming Bond Yields
Bottoming Bond Yields
Bottoming Bond Yields
Maintain Neutral Duration. Global bond yields barely moved in Q2 as the global economy rebounded from the COVID-induced recession low (Chart 22, panel 1). The upside surprise in economic data releases implies that global bond yields will likely go up in the near term (panel 2). For the next 9-12 months, however, the upside in global bond yields might be limited given the increasing likelihood of a new set of COVID-19 lockdowns due to the recent surge in new infections globally, especially in the US, Brazil, and India. As such, a neutral duration stance is still appropriate (Chart 22). Chart 23Inflation Expectations On The Rise
Inflation Expectations On The Rise
Inflation Expectations On The Rise
Favor Linkers Vs. Nominal Bonds. To fight off the risk of an extended recession, policymakers around the world are determined to continue to use aggressive monetary and fiscal stimulus to boost the global economy. The combined effect of extremely accommodative policy settings and the rebound in global commodity prices, especially oil prices, will push up inflation expectations (Chart 23). Higher inflation expectations will no doubt push up nominal bond yields somewhat, but according to BCA’s Global Fixed Income Strategy (GFIS), positioning for wider inflation breakevens remains the “cleaner” way to profit for the initial impact of policy reflation.5 According to GFIS valuation models, inflation-linked bonds in Canada, Italy, Germany, Australia, France, and Japan should be favored over their respective nominal bonds. Corporate Bonds Chart 24Better Value In A-rated and Baa-rated Credit
Better Value In A-rated and Baa-rated Credit
Better Value In A-rated and Baa-rated Credit
Investment-grade: Since we moved to overweight on investment-grade credit within the fixed-income category, it has produced 8.8% in excess returns over duration-matched government bonds. We remain overweight, given that the Federal Reserve has guaranteed to rollover debt for investment-grade issuers, essentially eliminating the left tail of returns. Moreover, the Fed has begun buying both ETFs and individual bond issues, in an effort to keep financial stress contained during the pandemic. However, there are some sectors within the investment-grade space that are more attractive than others. Specifically, our Global Fixed Income Strategy team has shown that A-rated and Baa-rated bonds are more attractive than higher-rated credits (Chart 24). Meanwhile, our fixed-income strategist are overweight Energy and Financials at the sector level.6 High-yield: High-yield bonds – where we have a neutral position - have delivered 11.5% of excess return since April. We are maintaining our neutral position. At current levels, spreads no longer offer enough value to justify an overweight position, specially if one considers that defaults in junk credits could be severe, since the Fed doesn’t offer the same level of support that it provides for investment-grade issuers. Within the high-yield space, we prefer Ba-rated credit. Fallen angels (i.e. bonds which fell to junk status) are particularly attractive given that most qualify for the Fed’s corporate buying program, since issuers which held at least a Baa3 rating as of March 22 are eligible for the Fed’s lending facilities.7 Commodities Chart 25Commodity Prices Will Rise As Growth Revives
Commodity Prices Will Rise As Growth Revives
Commodity Prices Will Rise As Growth Revives
Energy (Overweight): A near-complete lack of storage led WTI prices to go into freefall and trade at -$40 in mid-April: The largest drawdown in oil prices over the past 30 years (Chart 25, panel 1). Since then, oil prices have picked up, reaching their pre-“sudden stop” levels, as the OPEC 2.0 coalition slashed production. Nevertheless, excess supply remains a key issue. Crude inventories have been on the rise as global crude demand weakens. Year-to-date inventories have increased by over 100 million barrels, and current inventories cover over 40 days of supply (panel 2). As long as the OPEC supply cuts hold and demand picks up over the coming quarters, the excess inventories are likely to be worked off. BCA’s oil strategists expect Brent crude to rise back above $60 by year-end. Industrial Metals (Neutral): Last quarter, we flagged that industrial metals face tailwinds as fiscal packages get rolled out globally – particularly in China where infrastructure spending is expected to increase by 10% in the latter half of the year. Major industrial metals have yet to recover to their pre-pandemic levels but, as lockdown measures are lifted and activity is restored, prices are likely to start to rise strongly (panel 3). Precious Metals (Neutral): The merits of holding gold were not obvious during the first phase of the equity sell-off in February and March. Gold prices tumbled as much as 13%, along with the decline in risk assets. Since the beginning of March, however, there have been as many positive return days as there has been negative (panel 4). However, given the uncertainty regarding a second wave of the pandemic, and the rise in geopolitical tensions between the US and China, as well as between India and China, we continue to recommend holding gold as a hedge against tail risks. Currencies Chart 26Momentum For The Dollar Has Turned Negative
Momentum For The Dollar Has Turned Negative
Momentum For The Dollar Has Turned Negative
US Dollar: The DXY has depreciated by almost 3% since the beginning of April. Currently, there are multiple forces pushing the dollar lower: first, interest-rate differentials no longer favor the dollar Second, liquidity conditions have improved substantially thanks to the unprecedented fiscal and monetary stimulus, as well as coordinated swap lines between the Fed and other central banks to keep USD funding costs contained. Third, momentum in the DXY – one of the most reliable indicators for the dollar – has turned negative (Chart 26– top & middle panel). Taking all these factors into account, we are downgrading the USD from neutral to underweight. Euro: The euro should benefit in an environment where the dollar weakens, and global growth starts to rebound. Moreover, outperformance by cyclical sectors as well as concerns about over-valuation in US markets should bring portfolio flows to the Euro area. Therefore, we are upgrading the euro from neutral to overweight. Australian dollar: Last quarter we upgraded the Australian dollar to overweight due to its attractive valuations, as well as the effect of the monetary stimulus coming out of China. This proved to be the correct approach: AUD/USD has appreciated by a staggering 13% since our upgrade – the best performance of any G10 currency versus the dollar this quarter (bottom panel). Overall, while we believe that Chinese stimulus should continue to prop up the Aussie dollar, valuations are no longer attractive with AUD/USD hovering around PPP fair value. This means that the risk-reward profile of this currency no longer warrants an overweight position. Thus, we are downgrading the AUD to neutral. Alternatives Chart 27Opportunities Will Emerge In Private Equity
Opportunities Will Emerge In Private Equity
Opportunities Will Emerge In Private Equity
Return Enhancers: Over the past year, we have flagged that hedge funds, particularly macro funds, will outperform other risk assets during recessions and periods of high market stress. This played out as we expected: macro hedge funds’ drawdown from January to March 2020 was a mere 1.4%, whereas other hedge funds’ drawdown ranged between 9% and 19% and global equities fell as much as 35% from their February 2020 peak. (Chart 27, panel 1). However, unlike other recessions, the unprecedented sum of stimulus should place a floor under global growth. Given the time it takes to move allocations in the illiquid space, investors should prepare for new opportunities within private equity as global growth bottoms in the latter half of this year. In an earlier Special Report, we stressed that funds raised in late-cycle bull markets tend to underperform given their high entry valuations. If previous recessions are to provide any guidance, funds raised during recession years had a higher median net IRR than those raised in the latter year of the preceding bull market (panel 2). Inflation Hedges: Over the past few quarters, we have been highlighting commodity futures as a better inflation hedge relative to other assets (e.g. real estate). Within the asset class, assuming a moderate rise in inflation over the next 12-18 months as we expect, energy-related commodities should fare best (panel 3). This corroborates with our overweight stance on oil over the next 12 months (see commodities section). Volatility Dampeners: We have been favoring farmland and timberland since Q1 2016. While both have an excel track record of reducing volatility, farmland’s inelastic demand during slowdowns will be more beneficial. Investors should therefore allocate more to farmland over timberland (panel 4). Risks To Our View The risks are skewed to the downside. After such a big economic shock, damage could appear in unexpected places. Banking systems in Europe, Japan, and the Emerging Markets (but probably not the US) remain fragile. Defaults are growing in sub-investment grade debt; mortgage-backed securities are experiencing rising delinquencies; student debt and auto loans are at risk. Emerging Market borrowers, with $4 trn of foreign-currency debt, are particularly vulnerable. The length and depth of recessions and bear markets are determined by how serious are the second-round effects of a cyclical slowdown. If the current recession really lasted only from March to July, and the bear market from February to March, this will be very unusual by historical standards (Chart 28). Chart 28Can The Recession And Bear Market Really Be All Over Already?
Can It Really Be Over Already?
Can It Really Be Over Already?
Upside surprises are not impossible. A vaccine could be developed earlier than the mid-2021 that most specialists predict. But this is unlikely since the US Food and Drug Administration will not fast-track approval given the need for proper safety testing. If economies continue to improve and newsflow generally remains positive over the coming months, more conservative investors could be sucked into the rally. Evidence suggests that the rebound in stocks since March was propelled largely by hedge funds and individual day-traders. More conservative institutions and most retail investors remain pessimistic and have so far missed the run-up (Chart 29). One key, as so often, is the direction of US dollar. Further weakness in the currency would be a positive indicator for risk assets, particularly Emerging Market equities and commodities. In this Quarterly, we have moved to bearish from neutral on the dollar (see Currency section for details). Momentum has turned negative, and both valuation and relative interest rates suggest further downside. But it should be remembered that the dollar is a safe-haven, counter-cyclical currency (Chart 30). Any rebound in the currency would not only signal that markets are entering a risk-off period, but would cause problems for Emerging Market borrowers that need to service debt in an appreciating currency. Chart 29Many Investors Are Still Pessimistic
Many Investors Are Still Pessimistic
Many Investors Are Still Pessimistic
Chart 30Dollar Direction Is Key
Dollar Direction Is Key
Dollar Direction Is Key
Footnotes 1 Please see BCA Webcast, "The Way Ahead For COVID-19: An Expert's Views," available at bcaresearch.com. 2 OECD Economic Outlook, June 2020, available at https://www.oecd-ilibrary.org/economics/oecd-economic-outlook/volume-2020/issue-1_0d1d1e2e-en 3 The Overton window, named after Joseph P. Overton, is the range of policies politically acceptable to the mainstream population at a given time. It frames the range of policies that a politician can espouse without appearing extreme. 4 Please see Foreign Exchange Strategy Weekly Report, “DXY: False Breakdown Or Cyclical Bear Market?” dated June 5, 2020 available at fes.bcaresearch.com 5 Please see Global Fixed Income Strategy Weekly Report, “How To Play The Revival Of Global Inflation Expectations” dated June 23, 2020 available at gfis.bcaresearch.com 6 Please see Global Fixed Income Strategy, "Hunting For Alpha In The Global Corporate Bond Jungle," dated May 27, 2020, available at gfis.bcaresearch.com. 7 Fallen angels also outperform during economic recoveries. Please see Global Asset Allocation Special Report, "Even Fallen Angels Have A Place In Heaven," dated November 15, 2020, available at gaa.bcaresearch.com. GAA Asset Allocation
Highlights We are moving our tactical call on Chinese stocks from neutral to overweight, bringing it inline with our cyclical stance on Chinese equities. Our cyclical overweight stance is supported by several factors: the rate of recovery in China’s economy and corporate profits should outpace the rest of the world in the next 9-12 months and valuations in Chinese stocks are relatively cheap. In the near term, compared with the tug-of-war in the US between resuming business activities and containing a second COVID-19 wave, China has a lower risk of a major second wave and re-lockdown of its economy. The recent request by China’s central government for banks to forgo a large portion of this year’s profits should have very limited effect on China’s overall stock performance. Feature Chinese stocks have fewer downside risks compared to their global counterparts, which were buffeted this past week by escalating COVID-19 case counts in the US and a slower global economy recovery according to IMF estimates. Chart 1Overweight Chinese Stocks
Overweight Chinese Stocks
Overweight Chinese Stocks
We have been tactically neutral on Chinese stocks since early April, due to heightened uncertainties about the path of the global pandemic and geopolitical tensions between the US and China.1 These uncertainties remain in place. Nevertheless, against the backdrop of a bleak outlook in normalizing global economic activity, the pandemic containment in China has been relatively successful and the nation’s economic outlook is slightly more positive. This argues for overweighting Chinese stocks in a global equity portfolio, on both tactical (0-3 months) and cyclical (6-12 months) time horizons (Chart 1). We are initiating two new trades: long Chinese stocks versus global benchmarks, in both onshore and offshore equity markets. At its June 17th State Council meeting, China’s central government asked that commercial banks give up 1.5 trillion yuan in profits and cap profit growth below 10% this year to support the real economy. While this rare government request may further depress the banking sector’s stock performance, we think its negative impact on China’s overall stock market will be minimal. Furthermore, the request should help to lower corporate financing costs - including the private sector and small businesses – and, therefore, help bolster corporate marginal propensity to invest. The net result will be positive on both China’s economic recovery and overall stock performance in the medium term. Better Than The Rest Compared to the rest of the world, Chinese stocks should be supported by a more positive economic outlook and relatively cheaper valuations in the next 9 to 12 months. Chart 2China May Return To Its Trend Growth In 2021
Upgrading Chinese Stocks To Overweight
Upgrading Chinese Stocks To Overweight
The IMF has downgraded its 2020 global economic growth projection to -4.9% from April’s -3%. According to the IMF’s baseline scenario, China is the only major economy that will still register positive growth this year, albeit very modest. This contrasts with an 8% growth contraction in developed nations and a 4.6% retrenchment in emerging economies excluding China. The IMF estimate also suggests that China’s level of economic output in 2021 will rise above its 2019 level, whereas the US and European GDP levels will remain below their pre-COVID 19 levels (Chart 2). If the global economy recovers at a slower-than-expected rate in the second half of this year, then there will be spillover effects on China through reduced demand for its goods. The IMF projected that global trade will shrink by nearly 12% this year (Chart 3). However, compared with Europe and a majority of EM economies, China’s economy is dominated by domestic rather than external demands (Chart 4). Moreover, a weaker external environment means that Chinese authorities will have to press on the stimulus pedal to avoid an outright growth contraction this year. Chart 3Global Trade Will Remain Depressed This Year...
Global Trade Will Remain Depressed This Year...
Global Trade Will Remain Depressed This Year...
Chart 4...But The Chinese Economy Has Become Less Reliant On External Demand
...But The Chinese Economy Has Become Less Reliant On External Demand
...But The Chinese Economy Has Become Less Reliant On External Demand
Industrial profit growth turned positive in May, the first year-over-year increase in 2020. On a year-to-date basis, industrial profits remain in deep contraction (Chart 5). As aggressive credit and fiscal stimulus works its way into the economy, however, we expect China’s industrial profits and GDP to turn modestly positive for the entire year of 2020. Positive annual expansion in China’s industrial profits, even if small, supports a recovery in corporate earnings and stock prices. Chart 5Industrial Profit Growth Should Pick Up Along With The Economy
Industrial Profit Growth Should Pick Up Along With The Economy
Industrial Profit Growth Should Pick Up Along With The Economy
Valuations in Chinese stocks have also become less expensive. Similar to the US and elsewhere, Chinese stock prices have trended upwards ahead of a corporate earnings recovery. Nevertheless, compared with other major economies, Chinese stocks have not diverged from its economic fundamentals as drastically as other major economies (Chart 6). Moreover, Chinese stocks are not traded at extreme multiples as experienced in previous cycles (Chart 7). Chart 6China's Stock Market Rally Less Decoupled From Economic Fundamentals
China's Stock Market Rally Less Decoupled From Economic Fundamentals
China's Stock Market Rally Less Decoupled From Economic Fundamentals
Chart 7Valuations in Chinese Stocks Are Not As Extended As In Previous Cycles
Valuations in Chinese Stocks Are Not As Extended As In Previous Cycles
Valuations in Chinese Stocks Are Not As Extended As In Previous Cycles
Bottom Line: China’s economic outlook for this year and next is better than the rest of the world, while its stocks are currently less overbought. This supports our positive view on Chinese stocks on a cyclical time frame. Lower Near-Term Risks China has been relatively successful in controlling its domestic infection rate compared with the uncertain path of virus containment in the US and most EM economies (Chart 8). China’s steady return to normalcy in business activities warrants a change in our tactical investment call on Chinese stocks from neutral to overweight. Chart 8Mind The Gap
Upgrading Chinese Stocks To Overweight
Upgrading Chinese Stocks To Overweight
China has seen a flare up in domestically transmitted cases since June 11, after successfully containing the virus and reporting only single-digit new cases for nearly two months. However, the new cases have not had any meaningful impact on China’s returning to normalcy in domestic business or consumer activities. This is in sharp contrast with the US where a resurgence in infection rates last week threatened a potential rollback in economic re-openings and the need to increase social distance measures (Chart 9). Indeed, several states in the US have responded to the second wave of virus spread by slowing or stalling reopening efforts. The ongoing tug-of-war between normalizing economic activities and containing the pandemic challenges the sustainability of the US stock rally that started in late March. China’s new COVID cases are concentrated in Beijing and the number of daily new infections has been limited to double digits (Chart 10). Instead of imposing a blanket lockdown as was done in late January and February, the Beijing government has only locked down a few high-risk districts. In the past two weeks the municipal government has also drastically expanded its testing to more than one-third of its 21 million residents, and promptly traced and isolated close contacts of infected people. Chart 9Running Ahead Of Itself?
Running Ahead Of Itself?
Running Ahead Of Itself?
Chart 10Beijing Quickly Brought New Case Numbers Down To Low Double-Digits
Upgrading Chinese Stocks To Overweight
Upgrading Chinese Stocks To Overweight
China’s authoritative style of containing the pandemic leaves little room for error. The chance is slim that the Chinese government will allow the number of infections, if any were to pop up, to manifest into a major second wave and derail its economic recovery. However, the US will undoubtedly experience some hiccups in the near term as it struggles to contain the virus and reopen its economy. Bottom Line: The near-term risk to China’s economic recovery due to a second wave of infections is lower relative to the rest of the world. A Few Words On Chinese Banks The central government’s request that commercial banks “sacrifice” 1.5 trillion yuan in profits this year will likely further depress the banking sector’s stock performance. However, it should have a limited negative impact on the performance of aggregate Chinese equities for the following reasons: The banking sector currently accounts for around 10% of market caps in both China's onshore and offshore equity markets, limiting the downside risks to the broad market from the sector’s price declines. The tech sector2 has been driving the overall stock performance in both China’s onshore and offshore equity markets (Chart 11). Chinese banks’ market capitalization as a share of the total broad market caps has declined in recent years, while the share of the tech sector has risen substantially (Chart 12). Chart 11The Tech Sector Has Been Driving Chinese Stock Performance Since 2016
The Tech Sector Has Been Driving Chinese Stock Performance Since 2016
The Tech Sector Has Been Driving Chinese Stock Performance Since 2016
Chart 12Banking Sector's Share Of Broad Market Has Been Declining
Banking Sector's Share Of Broad Market Has Been Declining
Banking Sector's Share Of Broad Market Has Been Declining
Unlikely its global peers, banking sector's relative performance in both China’s domestic and offshore equity markets are countercyclical; periods of outperformance in banking stocks have been negatively related to rising economic activity and broad market stock prices.3 In other words, China’s banking sector underperforms during an economic recovery. It has been underperforming the broad indexes in both the domestic and investable markets since mid-2018, regardless the sector’s profit growth (Chart 13A and 13B). Chart 13ARegardless Of Profit Growth...
Regardless Of Profit Growth...
Regardless Of Profit Growth...
Chart 13B...The Banking Sector Underperformed During Economic Recoveries
...The Banking Sector Underperformed During Economic Recoveries
...The Banking Sector Underperformed During Economic Recoveries
Banks will give up a large portion of this year's profits by offering lower lending rates, cutting fees, deferring loan repayments and granting more unsecured loans to small businesses. Based on our calculations, banks will achieve the 1.5 trillion yuan goal by either lowering their average lending rate by 20bps and/or by expanding loan growth by 15% in the 2nd half of 2020 from last year (Table 1). Both measures will benefit China’s real economy and corporate profits, as well as help to bolster corporate marginal propensity to invest. The net result will be positive on overall stock performance in the medium term. Table 1Scenarios On How Banks Will Make Up For The 1.5 Trillion Profit “Sacrifice”
Upgrading Chinese Stocks To Overweight
Upgrading Chinese Stocks To Overweight
Bottom Line: China’s banking sector will continue to underperform, but the impact from a profit reduction this year should have a limited negative impact on Chinese equities. The benefit of a “wealth transfer” from banks to the real economy, however, should more than offset the banking sector’s drag on Chinese stocks. Jing Sima China Strategist jings@bcaresearch.com Footnotes 1 Please see China Investment Strategy Weekly Report "Investing During A Global Pandemic," dated April 1, 2020, available at cis.bcaresearch.com 2 Please see the footnote in Chart 12 for the tech-related sectors included in China's offshore market and the TMT Index in the A-share market. 3 Please see China Investment Strategy Special Report "A Guide To Chinese Domestic Equity Sector Performance," dated November 27, 2019, available at cis.bcaresearch.com Cyclical Investment Stance Equity Sector Recommendations
Highlights Economic shocks in recent decades have led to surges in nationalism and the COVID-19 crisis is unlikely to be different. Nationalism adds to the structural challenges facing globalization, which is already in retreat. Investors face at least a 35% chance that President Trump will be reelected and energize a nationalist and protectionist agenda that is globally disruptive. China is also indulging in nationalism as trend growth slows, raising the probability of a clash with the US even if Trump does not win. US-China economic decoupling will present opportunities as well as risks – primarily for India and Southeast Asia. Feature Since the Great Recession, investors have watched the US dollar and US equities outperform their peers in the face of a destabilizing world order (Chart 1). Chart 1US Outperformance Amid Global Disorder
US Outperformance Amid Global Disorder
US Outperformance Amid Global Disorder
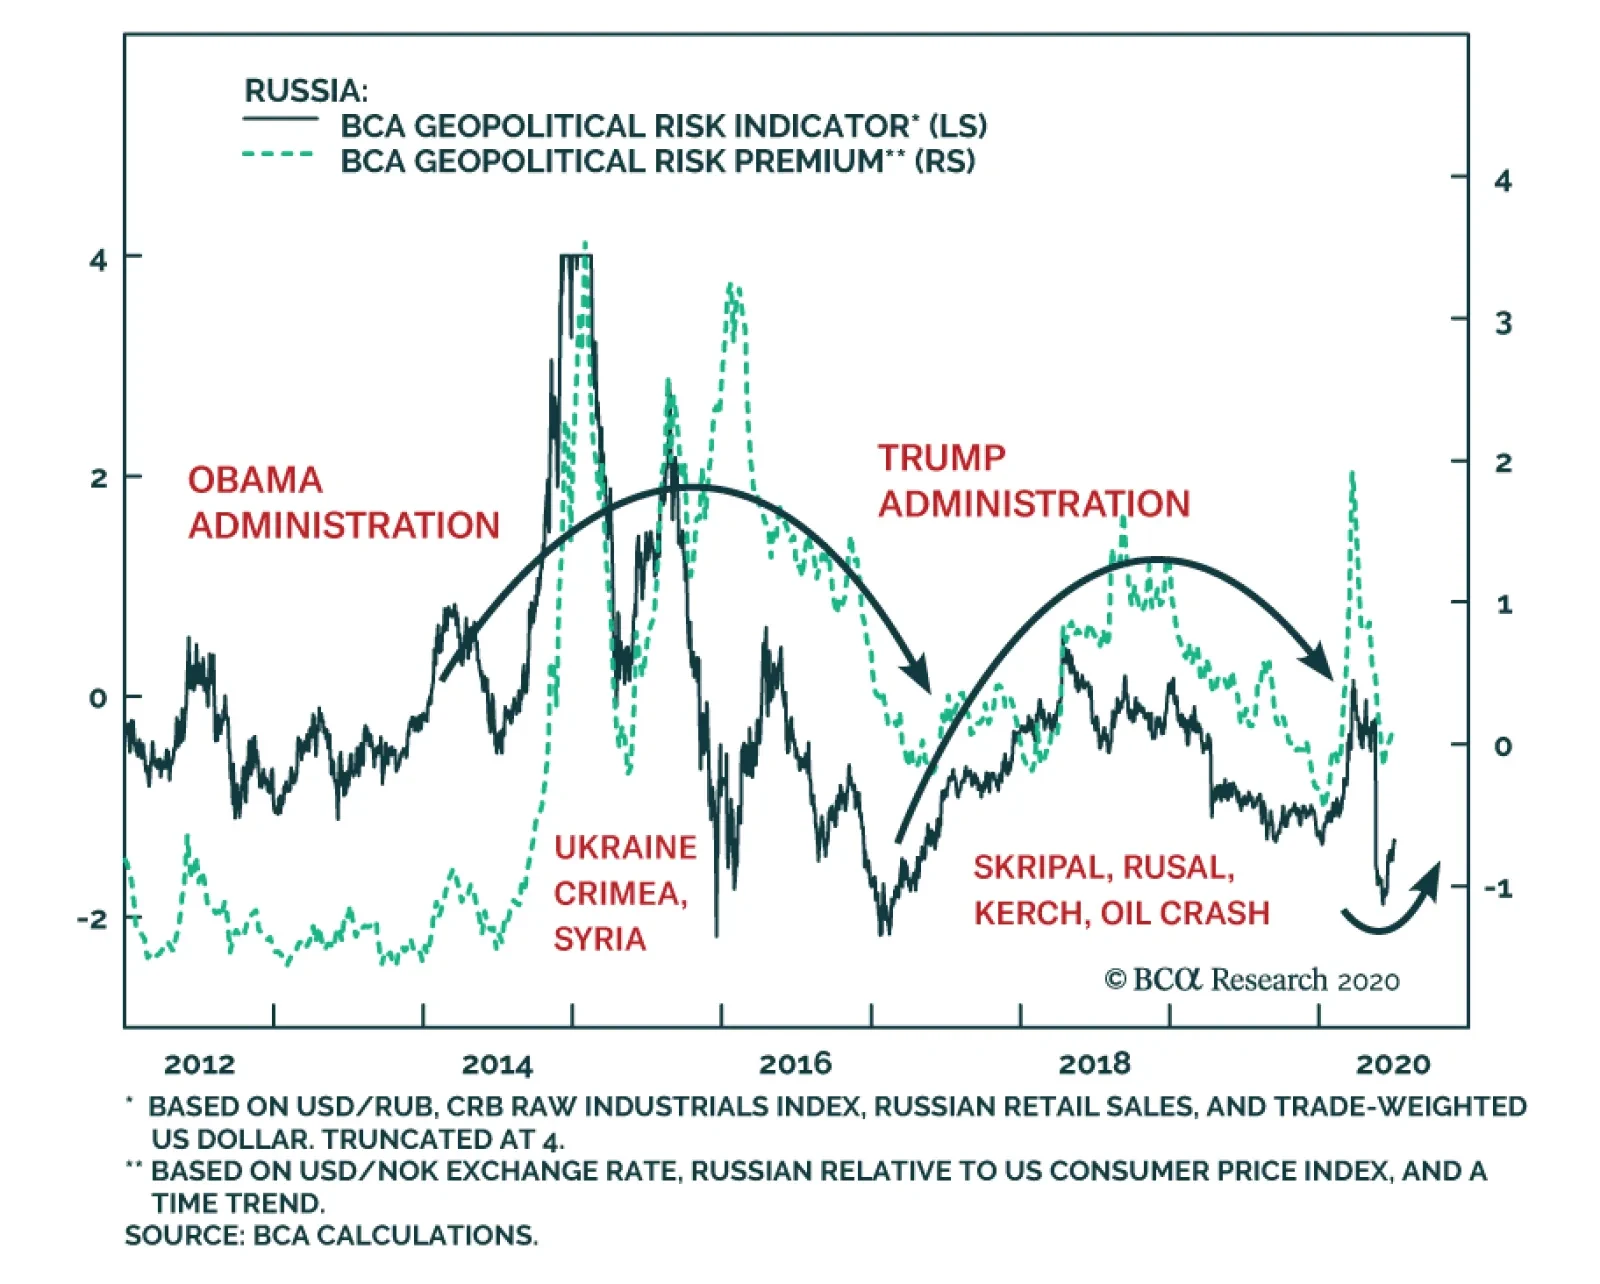
Global and American economic policy uncertainty has surged to the highest levels on record. Investors face political and geopolitical power struggles, trade wars, a global pandemic and recession, and social unrest. How will these risks shape up in the wake of COVID-19? First, massive monetary and fiscal stimulus ensure a global recovery but they also remove some of the economic limitations on countries that are witnessing a surge in nationalism. Second, nationalism creates a precarious environment for globalization – namely the wave of “hyper-globalization” since 2000. Nationalism and de-globalization do not depend on the United States alone but rather have shifted to the East, which means that geopolitical risks will remain elevated even if the US presidential election sees a restoration of the more dovish Democratic Party. Economic Shocks Fuel Nationalism’s Revival Nationalism is the idea that the political state should be made up of a single ethnic or cultural community. While many disasters have resulted from this idea, it is responsible for the modern nation-state and it has enabled democracies to take shape across Europe, the Americas, and beyond. Industrialization is also more feasible under nationalism because cultural conformity helps labor competitiveness.1 At the end of the Cold War, transnational communist ideology collapsed and democratic liberalism grew complacent. Each successive economic shock or major crisis has led to a surge in nationalism to fill the ideological gaps that were exposed. For instance, various nationalists and populists emerged from the financial crises of the late 1990s. Russian President Vladimir Putin sought to restore Russia to greatness in its own and other peoples’ eyes (Chart 2). Not every Russian adventure has mattered for investors, but taken together they have undermined the stability of the global system and raised barriers to exchange. The invasion of Crimea in 2014 and the interference in the US election in 2016 helped to fuel the rise in policy uncertainty, risk premiums in Russian assets, and safe havens over the past decade. The September 11, 2001 terrorist attacks in the United States created a surge in American nationalism (Chart 3). This surge has since collapsed, but while it lasted the US destabilized the Middle East and provided Russia and China with the opportunity to pursue a nationalist path of their own. Investors who went long oil and short the US dollar at this time could have done worse. Chart 2The Resurgence Of Russian Nationalism
Nationalism And Globalization After COVID-19
Nationalism And Globalization After COVID-19
Chart 3USA: From Nationalism To Anti-Nationalism
Nationalism And Globalization After COVID-19
Nationalism And Globalization After COVID-19
The 2008 crisis spawned new waves of nationalist feeling in countries such as China, Japan, the UK, and India (Chart 4). Conservatives of the majority cultural group rose to power, including in China, where provincial grassroots members of the elite reasserted the Communist Party’s centrality. Japan and India became excellent equity investment opportunities in their respective spheres, while the UK and China saw their currencies weaken. The rising number of wars and conflicts across the world since 2008 reflects the shift toward nationalism, whether among minority groups seeking autonomy or nation-states seeking living space (Chart 5). Chart 4Nationalist Trends Since The Great Recession
Nationalism And Globalization After COVID-19
Nationalism And Globalization After COVID-19
Chart 5World Conflicts Rise After Major Crises
Nationalism And Globalization After COVID-19
Nationalism And Globalization After COVID-19
COVID-19 is the latest economic shock that will feed a new round of nationalism. At least 750 million people are extremely vulnerable across the world, mostly concentrated in the shatter belt from Libya to Turkey, Iran, Pakistan, and India.2 Instability will generate emigration and conflict. Once again the global oil supply will be at risk from Middle Eastern instability and the dollar will eventually fall due to gargantuan budget and trade deficits. Today’s shock will differ, however, in the way it knocks against globalization, a process that has already begun to slow. Specifically, this crisis threatens to generate instability in East Asia – the workshop of the world – due to the strategic conflict between the US and China. This conflict will play out in the form of “proxy battles” in Greater China and the East Asian periphery. The dollar’s recent weakness is a telling sign of the future to come. In the short run, however, political and geopolitical risks are acute and will support safe havens. Globalization In Retreat Nationalism is not necessarily at odds with globalization. Historically there are many cases in which nationalism undergirds a foreign policy that favors trade and eschews military intervention. This is the default setting of maritime powers such as the British and Dutch. Prior to WWII it was the American setting, and after WWII it was the Japanese. Over the past thirty years, however, the rise of nationalism has generally worked against global trade, peace, and order. That’s because after WWII most of the world accepted internationalist ideals and institutions promoted by the United States that encouraged free markets and free trade. Serious challenges to that US-led system are necessarily challenges to global trade. This is true even if they originate in the United States. Globalization has occurred in waves continuously since the sixteenth century. It is not a light matter to suggest that it is experiencing a reversal. Yet the best historical evidence suggests that global imports, as a share of global output, have hit a major top (Chart 6).3 The line in this chart will fall further in 2020. American household deleveraging, China’s secular slowdown, and the 2014 drop in oil and commodities have had a pervasive impact on the export contribution to global growth. Chart 6Globalization Hits A Major Top
Globalization Hits A Major Top
Globalization Hits A Major Top
The next upswing of the business cycle will prompt an increase in trade in 2021. Global fiscal stimulus this year amounts to 8% of GDP and counting. But will the import-to-GDP ratio surpass previous highs? Probably not anytime soon. It is impossible to recreate America’s consumption boom and China’s production boom of the 1980s-2000s with public debt alone. Global trend growth is slowing. Isn’t globalization proceeding in services, if not goods? The world is more interconnected than ever, with nearly half of the population using the Internet – almost 30% in Sub-Saharan Africa. One in every two people uses a smartphone. Eventually the pandemic will be mitigated and global travel will resume. Nevertheless, the global services trade is also facing headwinds. And it requires even more political will to break down barriers for services than it does for goods (Chart 7). The desire of nations to control and patrol cyber space has resulted in separate Internets for authoritarian states like Russia and China. Even democracies are turning to censorship and content controls to protect their ideologies. Chart 7Both Goods And Services Face Headwinds
Both Goods And Services Face Headwinds
Both Goods And Services Face Headwinds
Political demands to protect workers and industries are gaining ground. Policymakers in China and Russia have already shifted back toward import substitution; now the US and EU are joining them, at least when it comes to strategic sectors (health, defense). Nationalists and populists across the emerging world will follow their lead. Regional and wealth inequalities are driving populations to be more skeptical of globalization. GDP per capita has not grown as fast as GDP itself, a simple indication of how globalization does not benefit everyone equally even though it increases growth overall (Chart 8). Inequality is a factor not only because of relatively well-off workers in the developed world who resent losing their job or earning less than their neighbors. Inequality is also rife in the developing world where opportunities to work, earn higher wages, borrow, enter markets, and innovate are lacking. Over the past decade, emerging countries like Brazil, Indonesia, Mexico, and South Africa have seen growing skepticism about whether foreign openness creates jobs or lifts wages.4 Immigration is probably the clearest indication of the break from globalization. The United States and especially the European Union have faced an influx of refugees and immigrants across their southern borders and have resorted to hard-nosed tactics to put a stop to it (Chart 9). Chart 8Global Inequality Fuels Protectionism
Nationalism And Globalization After COVID-19
Nationalism And Globalization After COVID-19
Chart 9US And EU Crack Down On Immigration
Nationalism And Globalization After COVID-19
Nationalism And Globalization After COVID-19
There is zero chance that these tough tactics will come to an end anytime soon in Europe, where the political establishment has discovered a winning combination with voters by promoting European integration yet tightening control of borders. This combination has kept populists at bay in France, Italy, the Netherlands, Spain, and Germany. A degree of nationalism has been co-opted by the transnational European project. In the US, extreme polarization could cause a major change in immigration policy, depending on the election later this year. But note that the Obama administration was relatively hawkish on the border and the next president will face sky-high unemployment, which discourages flinging open the gates. Reduced immigration will weigh on potential GDP growth and drive up the wage bill for domestic corporations. If nationalism continues to rise and to hinder the movement of people, goods, capital, and ideas, then it will reduce the market’s expectations of future earnings. American Nationalism Still A Risk The United States is experiencing a “Civil War Lite” that may take anywhere from one-to-five years to resolve. The November 3 presidential election will have a major impact on the direction of nationalism and globalization over the coming presidential term. If President Trump is reelected – which we peg at 35% odds – then American nationalism and protectionism will gain a new lease on life. Other nations will follow the US’s lead. If Trump fails, then nationalism will likely be driven by external forces, but protectionism will persist in some form. Chart 10Trump Is Not Yet Down For The Count
Nationalism And Globalization After COVID-19
Nationalism And Globalization After COVID-19
Investors should not write Trump off. If the election were held today, Trump would lose, but the election is still four months away. His national approval rating has troughed at a higher level than previous troughs. His disapproval rating has spiked but has not yet cleared its early 2019 peak (Chart 10).5 This is despite an unprecedented deluge of bad news: universal condemnation from Democrats and the media, high-profile defections from fellow Republicans and cabinet members, stunning defeats at the Supreme Court, and scathing rebukes from top US army officers. If Trump’s odds are 35% then this translates to a 35% chance that the United States will continue pursuing globally disruptive “America First” foreign and trade policies in the 2020-24 period. First Trump will attempt to pass a Reciprocal Trade Act to equalize tariffs with all trading partners. Assuming Democrats block it in the House of Representatives, he will still have sweeping executive authority to levy tariffs. He will launch the next round in the trade war with China to secure a “Phase Two” trade deal, which will be tougher because it will be focused on structural reforms. He could also open new fronts against the European Union, Mexico, and other trade surplus countries. By contrast, these risks will melt away if Biden is elected. Biden would restore the Obama administration’s approach of trade favoritism toward strategic allies and partners, such as Europe and the members of the Trans-Pacific Partnership, but only occasional use of tariffs. Biden would work with international organizations like the World Trade Organization. His foreign policy would also open up trade with pariah states like Iran, reducing the tail-risk of a war to almost zero. Biden would be tougher on China than Presidents Obama or Bill Clinton, as the consensus in Washington is now hawkish and Biden would need to keep the blue-collar voters he won back from Trump. He may keep Trump’s tariffs in place as negotiating leverage. But he is less likely to expand these tariffs – and there is zero chance he will use them against Europe. At the same time, it will take a year or more to court the allies and put together a "coalition of the willing" to pressure China on structural reforms and liberalization. China would get a reprieve – and so would financial markets. Thus investors have a roughly 65% chance of seeing US policy “normalize” into an internationalist (not nationalist) approach that reduces the US contribution to trade policy uncertainty and geopolitical risk over the next few years at minimum. But there are still four months to go before the election; these odds can change, and equity market volatility will come first. Moreover a mellower US would still need to react to nationalism in Asia. European Nationalism Not A Risk (Yet) European nationalism has reemerged in recent years but has greatly disappointed the prophets of doom who expected it to lead to the breakup of the European Union. The southern European states suffered the most from COVID-19 but many of them have made their decision regarding nationalism and the supra-national EU. Greece underwent a depression yet remained in the union. Italians could easily elect the right-wing anti-establishment League to head a government in the not-too-distant future. But there is no appetite for an Italian exit. Brexit is the grand exception. If Trump wins, then the UK and British Prime Minister Boris Johnson will be seen as the vanguard of the revival of nationalism in the West. If Trump loses, English nationalism will appear an isolated case that is constrained by its own logic given the response of Scottish nationalism (Chart 11). The trend in the British Isles would become increasingly remote from the trends in continental Europe and the United States. The majority of Europeans identify both as Europeans and as their home nationality, including majorities in countries like Greece, Italy, France, and Austria where visions of life outside the union are the most robust (Chart 12). Even the Catalonians are focused on options other than independence, which has fallen to 36% support. Eastern European nationalists play a careful balancing game of posturing against Brussels yet never drifting so far as to let Russia devour them. Chart 11English Versus Scottish Nationalism
English Versus Scottish Nationalism
English Versus Scottish Nationalism
Chart 12European Nationalism Is Limited (For Now)
European Nationalism Is Limited (For Now)
European Nationalism Is Limited (For Now)
Europeans have embraced the EU as a multi-ethnic confederation that requires dual allegiances and prioritizes the European project. COVID-19 has so far reinforced this trend, showing solidarity as the predominant force, and much more promptly than during the 2011 crisis. It will take a different kind of crisis to reverse this trend of deeper integration. European nationalists would benefit from another economic crash, a new refugee wave from the Middle East, or conflict with Turkish nationalism. The latter is already burning brightly and will eventually flame out, but not before causing a regional crisis of some kind. European policymakers are containing nationalism by co-opting some of its demands. The EU is taking steps to guard against globalization, particularly on immigration and Chinese mercantilism. The lack of nationalist uprisings in Europe do not overthrow the contention that globalization is slowing down. Europe can become more integrated at home while maintaining the higher barriers against globalization that it has always maintained relative to the UK and United States. Chinese Nationalism The Biggest Risk The nationalist risk to globalization is most significant in East Asia and the Pacific, where Chinese nationalism continues the ascent that began with the Great Recession. China’s slowdown in growth rates has weakened the Communist Party’s confidence in the long-term viability of single-party rule. The result has been a shift in the party line to promote ideology and quality of life improvements to compensate for slower income gains. Xi Jinping’s governing philosophy consists of nationalist territorial gains, promoting “the China Dream” for the middle class, and projecting ambitious goals of global influence by 2035 and 2049. The result has been a clash between mainland Chinese and peripheral Chinese territories – especially Hong Kong and Taiwan (Chart 13). The turn away from Chinese identity in these areas runs up against their economic interest. It is largely a reaction to the surge in mainland nationalist sentiment, which cannot be observed directly due to the absence of reliable opinion polling. Chart 13Chinese Nationalism On The Mainland, Anti-Nationalism In Periphery
Nationalism And Globalization After COVID-19
Nationalism And Globalization After COVID-19
The conflict over identity in Greater China is perhaps the world’s greatest geopolitical risk. While Hong Kong has no conceivable alternative to Beijing’s supremacy, Taiwan does. The US is interested in reviving its technological and defense relationship with Taiwan now that it seeks to counterbalance China. Chart 14Taiwan: Epicenter Of US-China Cold War
Nationalism And Globalization After COVID-19
Nationalism And Globalization After COVID-19
Beijing may be faced with a technology cordon imposed by the United States, and yet have the option of circumventing this cordon via Taiwan’s advanced semiconductor manufacturing. Taiwan’s “Silicon Shield” used to be its security guarantee. Now that the US is tightening export controls and sanctions on China, Beijing has a greater need to confiscate that shield. This makes Taiwan the epicenter of the US-China struggle, as we have highlighted since 2016. The risk of a fourth Taiwan Strait crisis is as pertinent in the short run as it is over the long run, given that the US and China have already intensified their saber-rattling in the Strait (Chart 14), including in the wake of COVID-19 specifically. China’s secular slowdown is prompting it to encroach on the borders of all of its neighbors simultaneously, creating a nascent balance-of-power alliance ranging from India to Australia to Japan. If China fails to curb its nationalism, then eventually US political polarization will decline as the country unites in the face of a peer competitor. If American divisions persist, they could drive the US to instigate conflict with China. Thus a failure of either side to restrain itself is a major geopolitical risk. The US and China ultimately face mutually assured destruction in the event of conflict, but they can have a clash in the near term before they learn their limits. The Cold War provides many occasions of such a learning process – from the Berlin airlift to the Cuban missile crisis. Such crises typically present buying opportunities for financial markets, but the consequences could be more far reaching if the Asian manufacturing supply chain is permanently damaged or if the shifting of supply chains out of China is too rapid. Globalization will also suffer as a result of currency wars. The US has not been successful in driving the dollar down, a key demand of the US-China trade war. It is much harder to force China to reform its labor and wage policies than it is to force it to appreciate its currency. But unlike Japan in 1985, China will not commit to unilateral appreciation for fear of American economic sabotage. Punitive measures will remain an American tool. Contrary to popular belief, the US is not attempting to eliminate its trade deficit. It is attempting to reduce overreliance on China. Status quo globalization is intolerable for US strategy. But autarky is intolerable for US corporations. The compromise is globalization-ex-China, i.e., economic decoupling. Investment Implications Chart 15Favor International Stocks As Growth Revives
Favor International Stocks As Growth Revives
Favor International Stocks As Growth Revives
US stock market capitalization now makes up 58% of global capitalization (Chart 15), reflecting the strength and innovation of American companies as well as a worldwide flight to safety during a decade of rising policy uncertainty and geopolitical risk. The revival of global growth amid this year’s gargantuan stimulus will prompt a major rotation out of US equities and into international and emerging market equities over the long run. As mentioned, the US greenback would also trend downward. However, there will be little clarity on the pace of nationalism and the fate of globalization until the US election is decided. Moreover the fate of globalization does not depend entirely on the United States. It mostly depends on countries in the east – Russia, China, and India, all of which are increasingly nationalistic. A miscalculation over Taiwan, North Korea, the East China Sea, the South China Sea, trade, or technology could ignite into tariffs, sanctions, boycotts, embargoes, saber-rattling, proxy battles, and potentially even direct conflict. These risks are elevated in the short run but will persist in the long run. As the US decouples from China it will have to deepen relations with other trading partners. The trade deficit will not go away but will be redistributed to Asian allies. Southeast Asian nations and India – whose own nationalism has created a shift in favor of economic development – will be the long-run beneficiaries. Matt Gertken Vice President Geopolitical Strategist mattg@bcaresearch.com Footnotes 1 Ernest Gellner, Nations and Nationalism (Ithaca, NY: Cornell University Press, 1983). 2 Neli Esipova, Julie Ray, and Ying Han, “750 Million Struggling To Meet Basic Needs With No Safety Net,” Gallup News, June 16, 2020. 3 Christopher Chase-Dunn et al, “The Development of World-Systems,” Sociology of Development 1 (2015), pp. 149-172; and Chase-Dunn, Yukio Kawano, Benjamin Brewer, “Trade globalization since 1795: waves of integration in the world-system,” American Sociological Review 65 (2000), pp. 77-95. 4 Bruce Stokes, “Americans, Like Many In Other Advanced Economies, Not Convinced Of Trade’s Benefits,” September 26, 2018. 5 In other words, the mishandling of COVID-19 and the historic George Floyd protests of June 2020 have not taken as great of a toll on Trump’s national approval, thus far, as the Ukraine scandal last October, the government shutdown in January-February 2019, the near-failure to pass tax cuts in December 2017, or the Charlottesville incident in August 2017. This is surprising and points once more to Trump’s very solid political base, which could serve as a springboard for a comeback over the next four months.
Dear Client, This week, we are publishing a Special Report on the geopolitical implications of COVID-19 from Matt Gertken, BCA Research’s Chief Geopolitical Strategist. Matt discusses the rise of nationalism with each successive global crisis and the negative implications for globalization. I hope you find his report insightful. Next week, we will publish our quarterly Strategy Outlook. Best regards, Peter Berezin, Chief Global Strategist Highlights Economic shocks in recent decades have led to surges in nationalism and the COVID-19 crisis is unlikely to be different. Nationalism adds to the structural challenges facing globalization, which is already in retreat. Investors face at least a 35% chance that President Trump will be reelected and energize a nationalist and protectionist agenda that is globally disruptive. China is also indulging in nationalism as trend growth slows, raising the probability of a clash with the US even if Trump does not win. US-China economic decoupling will present opportunities as well as risks – primarily for India and Southeast Asia. Feature Since the Great Recession, investors have watched the US dollar and US equities outperform their peers in the face of a destabilizing world order (Chart 1). Chart 1US Outperformance Amid Global Disorder
US Outperformance Amid Global Disorder
US Outperformance Amid Global Disorder
Global and American economic policy uncertainty has surged to the highest levels on record. Investors face political and geopolitical power struggles, trade wars, a global pandemic and recession, and social unrest. How will these risks shape up in the wake of COVID-19? First, massive monetary and fiscal stimulus ensure a global recovery but they also remove some of the economic limitations on countries that are witnessing a surge in nationalism. Second, nationalism creates a precarious environment for globalization – namely the wave of “hyper-globalization” since 2000. Nationalism and de-globalization do not depend on the United States alone but rather have shifted to the East, which means that geopolitical risks will remain elevated even if the US presidential election sees a restoration of the more dovish Democratic Party. Economic Shocks Fuel Nationalism’s Revival Nationalism is the idea that the political state should be made up of a single ethnic or cultural community. While many disasters have resulted from this idea, it is responsible for the modern nation-state and it has enabled democracies to take shape across Europe, the Americas, and beyond. Industrialization is also more feasible under nationalism because cultural conformity helps labor competitiveness.1 At the end of the Cold War, transnational communist ideology collapsed and democratic liberalism grew complacent. Each successive economic shock or major crisis has led to a surge in nationalism to fill the ideological gaps that were exposed. For instance, various nationalists and populists emerged from the financial crises of the late 1990s. Russian President Vladimir Putin sought to restore Russia to greatness in its own and other peoples’ eyes (Chart 2). Not every Russian adventure has mattered for investors, but taken together they have undermined the stability of the global system and raised barriers to exchange. The invasion of Crimea in 2014 and the interference in the US election in 2016 helped to fuel the rise in policy uncertainty, risk premiums in Russian assets, and safe havens over the past decade. The September 11, 2001 terrorist attacks in the United States created a surge in American nationalism (Chart 3). This surge has since collapsed, but while it lasted the US destabilized the Middle East and provided Russia and China with the opportunity to pursue a nationalist path of their own. Investors who went long oil and short the US dollar at this time could have done worse. Chart 2The Resurgence Of Russian Nationalism
Nationalism And Globalization After COVID-19
Nationalism And Globalization After COVID-19
Chart 3USA: From Nationalism To Anti-Nationalism
Nationalism And Globalization After COVID-19
Nationalism And Globalization After COVID-19
The 2008 crisis spawned new waves of nationalist feeling in countries such as China, Japan, the UK, and India (Chart 4). Conservatives of the majority cultural group rose to power, including in China, where provincial grassroots members of the elite reasserted the Communist Party’s centrality. Japan and India became excellent equity investment opportunities in their respective spheres, while the UK and China saw their currencies weaken. The rising number of wars and conflicts across the world since 2008 reflects the shift toward nationalism, whether among minority groups seeking autonomy or nation-states seeking living space (Chart 5). Chart 4Nationalist Trends Since The Great Recession
Nationalism And Globalization After COVID-19
Nationalism And Globalization After COVID-19
Chart 5World Conflicts Rise After Major Crises
Nationalism And Globalization After COVID-19
Nationalism And Globalization After COVID-19
COVID-19 is the latest economic shock that will feed a new round of nationalism. At least 750 million people are extremely vulnerable across the world, mostly concentrated in the shatter belt from Libya to Turkey, Iran, Pakistan, and India.2 Instability will generate emigration and conflict. Once again the global oil supply will be at risk from Middle Eastern instability and the dollar will eventually fall due to gargantuan budget and trade deficits. Today’s shock will differ, however, in the way it knocks against globalization, a process that has already begun to slow. Specifically, this crisis threatens to generate instability in East Asia – the workshop of the world – due to the strategic conflict between the US and China. This conflict will play out in the form of “proxy battles” in Greater China and the East Asian periphery. The dollar’s recent weakness is a telling sign of the future to come. In the short run, however, political and geopolitical risks are acute and will support safe havens. Globalization In Retreat Nationalism is not necessarily at odds with globalization. Historically there are many cases in which nationalism undergirds a foreign policy that favors trade and eschews military intervention. This is the default setting of maritime powers such as the British and Dutch. Prior to WWII it was the American setting, and after WWII it was the Japanese. Over the past thirty years, however, the rise of nationalism has generally worked against global trade, peace, and order. That’s because after WWII most of the world accepted internationalist ideals and institutions promoted by the United States that encouraged free markets and free trade. Serious challenges to that US-led system are necessarily challenges to global trade. This is true even if they originate in the United States. Globalization has occurred in waves continuously since the sixteenth century. It is not a light matter to suggest that it is experiencing a reversal. Yet the best historical evidence suggests that global imports, as a share of global output, have hit a major top (Chart 6).3 The line in this chart will fall further in 2020. American household deleveraging, China’s secular slowdown, and the 2014 drop in oil and commodities have had a pervasive impact on the export contribution to global growth. Chart 6Globalization Hits A Major Top
Globalization Hits A Major Top
Globalization Hits A Major Top
The next upswing of the business cycle will prompt an increase in trade in 2021. Global fiscal stimulus this year amounts to 8% of GDP and counting. But will the import-to-GDP ratio surpass previous highs? Probably not anytime soon. It is impossible to recreate America’s consumption boom and China’s production boom of the 1980s-2000s with public debt alone. Global trend growth is slowing. Isn’t globalization proceeding in services, if not goods? The world is more interconnected than ever, with nearly half of the population using the Internet – almost 30% in Sub-Saharan Africa. One in every two people uses a smartphone. Eventually the pandemic will be mitigated and global travel will resume. Nevertheless, the global services trade is also facing headwinds. And it requires even more political will to break down barriers for services than it does for goods (Chart 7). The desire of nations to control and patrol cyber space has resulted in separate Internets for authoritarian states like Russia and China. Even democracies are turning to censorship and content controls to protect their ideologies. Chart 7Both Goods And Services Face Headwinds
Both Goods And Services Face Headwinds
Both Goods And Services Face Headwinds
Political demands to protect workers and industries are gaining ground. Policymakers in China and Russia have already shifted back toward import substitution; now the US and EU are joining them, at least when it comes to strategic sectors (health, defense). Nationalists and populists across the emerging world will follow their lead. Regional and wealth inequalities are driving populations to be more skeptical of globalization. GDP per capita has not grown as fast as GDP itself, a simple indication of how globalization does not benefit everyone equally even though it increases growth overall (Chart 8). Inequality is a factor not only because of relatively well-off workers in the developed world who resent losing their job or earning less than their neighbors. Inequality is also rife in the developing world where opportunities to work, earn higher wages, borrow, enter markets, and innovate are lacking. Over the past decade, emerging countries like Brazil, Indonesia, Mexico, and South Africa have seen growing skepticism about whether foreign openness creates jobs or lifts wages.4 Immigration is probably the clearest indication of the break from globalization. The United States and especially the European Union have faced an influx of refugees and immigrants across their southern borders and have resorted to hard-nosed tactics to put a stop to it (Chart 9). Chart 8Global Inequality Fuels Protectionism
Nationalism And Globalization After COVID-19
Nationalism And Globalization After COVID-19
Chart 9US And EU Crack Down On Immigration
Nationalism And Globalization After COVID-19
Nationalism And Globalization After COVID-19
There is zero chance that these tough tactics will come to an end anytime soon in Europe, where the political establishment has discovered a winning combination with voters by promoting European integration yet tightening control of borders. This combination has kept populists at bay in France, Italy, the Netherlands, Spain, and Germany. A degree of nationalism has been co-opted by the transnational European project. In the US, extreme polarization could cause a major change in immigration policy, depending on the election later this year. But note that the Obama administration was relatively hawkish on the border and the next president will face sky-high unemployment, which discourages flinging open the gates. Reduced immigration will weigh on potential GDP growth and drive up the wage bill for domestic corporations. If nationalism continues to rise and to hinder the movement of people, goods, capital, and ideas, then it will reduce the market’s expectations of future earnings. American Nationalism Still A Risk The United States is experiencing a “Civil War Lite” that may take anywhere from one-to-five years to resolve. The November 3 presidential election will have a major impact on the direction of nationalism and globalization over the coming presidential term. If President Trump is reelected – which we peg at 35% odds – then American nationalism and protectionism will gain a new lease on life. Other nations will follow the US’s lead. If Trump fails, then nationalism will likely be driven by external forces, but protectionism will persist in some form. Chart 10Trump Is Not Yet Down For The Count
Nationalism And Globalization After COVID-19
Nationalism And Globalization After COVID-19
Investors should not write Trump off. If the election were held today, Trump would lose, but the election is still four months away. His national approval rating has troughed at a higher level than previous troughs. His disapproval rating has spiked but has not yet cleared its early 2019 peak (Chart 10).5 This is despite an unprecedented deluge of bad news: universal condemnation from Democrats and the media, high-profile defections from fellow Republicans and cabinet members, stunning defeats at the Supreme Court, and scathing rebukes from top US army officers. If Trump’s odds are 35% then this translates to a 35% chance that the United States will continue pursuing globally disruptive “America First” foreign and trade policies in the 2020-24 period. First Trump will attempt to pass a Reciprocal Trade Act to equalize tariffs with all trading partners. Assuming Democrats block it in the House of Representatives, he will still have sweeping executive authority to levy tariffs. He will launch the next round in the trade war with China to secure a “Phase Two” trade deal, which will be tougher because it will be focused on structural reforms. He could also open new fronts against the European Union, Mexico, and other trade surplus countries. By contrast, these risks will melt away if Biden is elected. Biden would restore the Obama administration’s approach of trade favoritism toward strategic allies and partners, such as Europe and the members of the Trans-Pacific Partnership, but only occasional use of tariffs. Biden would work with international organizations like the World Trade Organization. His foreign policy would also open up trade with pariah states like Iran, reducing the tail-risk of a war to almost zero. Biden would be tougher on China than Presidents Obama or Bill Clinton, as the consensus in Washington is now hawkish and Biden would need to keep the blue-collar voters he won back from Trump. He may keep Trump’s tariffs in place as negotiating leverage. But he is less likely to expand these tariffs – and there is zero chance he will use them against Europe. At the same time, it will take a year or more to court the allies and put together a "coalition of the willing" to pressure China on structural reforms and liberalization. China would get a reprieve – and so would financial markets. Thus investors have a roughly 65% chance of seeing US policy “normalize” into an internationalist (not nationalist) approach that reduces the US contribution to trade policy uncertainty and geopolitical risk over the next few years at minimum. But there are still four months to go before the election; these odds can change, and equity market volatility will come first. Moreover a mellower US would still need to react to nationalism in Asia. European Nationalism Not A Risk (Yet) European nationalism has reemerged in recent years but has greatly disappointed the prophets of doom who expected it to lead to the breakup of the European Union. The southern European states suffered the most from COVID-19 but many of them have made their decision regarding nationalism and the supra-national EU. Greece underwent a depression yet remained in the union. Italians could easily elect the right-wing anti-establishment League to head a government in the not-too-distant future. But there is no appetite for an Italian exit. Brexit is the grand exception. If Trump wins, then the UK and British Prime Minister Boris Johnson will be seen as the vanguard of the revival of nationalism in the West. If Trump loses, English nationalism will appear an isolated case that is constrained by its own logic given the response of Scottish nationalism (Chart 11). The trend in the British Isles would become increasingly remote from the trends in continental Europe and the United States. The majority of Europeans identify both as Europeans and as their home nationality, including majorities in countries like Greece, Italy, France, and Austria where visions of life outside the union are the most robust (Chart 12). Even the Catalonians are focused on options other than independence, which has fallen to 36% support. Eastern European nationalists play a careful balancing game of posturing against Brussels yet never drifting so far as to let Russia devour them. Chart 11English Versus Scottish Nationalism
English Versus Scottish Nationalism
English Versus Scottish Nationalism
Chart 12European Nationalism Is Limited (For Now)
European Nationalism Is Limited (For Now)
European Nationalism Is Limited (For Now)
Europeans have embraced the EU as a multi-ethnic confederation that requires dual allegiances and prioritizes the European project. COVID-19 has so far reinforced this trend, showing solidarity as the predominant force, and much more promptly than during the 2011 crisis. It will take a different kind of crisis to reverse this trend of deeper integration. European nationalists would benefit from another economic crash, a new refugee wave from the Middle East, or conflict with Turkish nationalism. The latter is already burning brightly and will eventually flame out, but not before causing a regional crisis of some kind. European policymakers are containing nationalism by co-opting some of its demands. The EU is taking steps to guard against globalization, particularly on immigration and Chinese mercantilism. The lack of nationalist uprisings in Europe do not overthrow the contention that globalization is slowing down. Europe can become more integrated at home while maintaining the higher barriers against globalization that it has always maintained relative to the UK and United States. Chinese Nationalism The Biggest Risk The nationalist risk to globalization is most significant in East Asia and the Pacific, where Chinese nationalism continues the ascent that began with the Great Recession. China’s slowdown in growth rates has weakened the Communist Party’s confidence in the long-term viability of single-party rule. The result has been a shift in the party line to promote ideology and quality of life improvements to compensate for slower income gains. Xi Jinping’s governing philosophy consists of nationalist territorial gains, promoting “the China Dream” for the middle class, and projecting ambitious goals of global influence by 2035 and 2049. The result has been a clash between mainland Chinese and peripheral Chinese territories – especially Hong Kong and Taiwan (Chart 13). The turn away from Chinese identity in these areas runs up against their economic interest. It is largely a reaction to the surge in mainland nationalist sentiment, which cannot be observed directly due to the absence of reliable opinion polling. Chart 13Chinese Nationalism On The Mainland, Anti-Nationalism In Periphery
Nationalism And Globalization After COVID-19
Nationalism And Globalization After COVID-19
The conflict over identity in Greater China is perhaps the world’s greatest geopolitical risk. While Hong Kong has no conceivable alternative to Beijing’s supremacy, Taiwan does. The US is interested in reviving its technological and defense relationship with Taiwan now that it seeks to counterbalance China. Chart 14Taiwan: Epicenter Of US-China Cold War
Nationalism And Globalization After COVID-19
Nationalism And Globalization After COVID-19
Beijing may be faced with a technology cordon imposed by the United States, and yet have the option of circumventing this cordon via Taiwan’s advanced semiconductor manufacturing. Taiwan’s “Silicon Shield” used to be its security guarantee. Now that the US is tightening export controls and sanctions on China, Beijing has a greater need to confiscate that shield. This makes Taiwan the epicenter of the US-China struggle, as we have highlighted since 2016. The risk of a fourth Taiwan Strait crisis is as pertinent in the short run as it is over the long run, given that the US and China have already intensified their saber-rattling in the Strait (Chart 14), including in the wake of COVID-19 specifically. China’s secular slowdown is prompting it to encroach on the borders of all of its neighbors simultaneously, creating a nascent balance-of-power alliance ranging from India to Australia to Japan. If China fails to curb its nationalism, then eventually US political polarization will decline as the country unites in the face of a peer competitor. If American divisions persist, they could drive the US to instigate conflict with China. Thus a failure of either side to restrain itself is a major geopolitical risk. The US and China ultimately face mutually assured destruction in the event of conflict, but they can have a clash in the near term before they learn their limits. The Cold War provides many occasions of such a learning process – from the Berlin airlift to the Cuban missile crisis. Such crises typically present buying opportunities for financial markets, but the consequences could be more far reaching if the Asian manufacturing supply chain is permanently damaged or if the shifting of supply chains out of China is too rapid. Globalization will also suffer as a result of currency wars. The US has not been successful in driving the dollar down, a key demand of the US-China trade war. It is much harder to force China to reform its labor and wage policies than it is to force it to appreciate its currency. But unlike Japan in 1985, China will not commit to unilateral appreciation for fear of American economic sabotage. Punitive measures will remain an American tool. Contrary to popular belief, the US is not attempting to eliminate its trade deficit. It is attempting to reduce overreliance on China. Status quo globalization is intolerable for US strategy. But autarky is intolerable for US corporations. The compromise is globalization-ex-China, i.e., economic decoupling. Investment Implications Chart 15Favor International Stocks As Growth Revives
Favor International Stocks As Growth Revives
Favor International Stocks As Growth Revives
US stock market capitalization now makes up 58% of global capitalization (Chart 15), reflecting the strength and innovation of American companies as well as a worldwide flight to safety during a decade of rising policy uncertainty and geopolitical risk. The revival of global growth amid this year’s gargantuan stimulus will prompt a major rotation out of US equities and into international and emerging market equities over the long run. As mentioned, the US greenback would also trend downward. However, there will be little clarity on the pace of nationalism and the fate of globalization until the US election is decided. Moreover the fate of globalization does not depend entirely on the United States. It mostly depends on countries in the east – Russia, China, and India, all of which are increasingly nationalistic. A miscalculation over Taiwan, North Korea, the East China Sea, the South China Sea, trade, or technology could ignite into tariffs, sanctions, boycotts, embargoes, saber-rattling, proxy battles, and potentially even direct conflict. These risks are elevated in the short run but will persist in the long run. As the US decouples from China it will have to deepen relations with other trading partners. The trade deficit will not go away but will be redistributed to Asian allies. Southeast Asian nations and India – whose own nationalism has created a shift in favor of economic development – will be the long-run beneficiaries. Matt Gertken Vice President Geopolitical Strategist mattg@bcaresearch.com Footnotes 1 Ernest Gellner, Nations and Nationalism (Ithaca, NY: Cornell University Press, 1983). 2 Neli Esipova, Julie Ray, and Ying Han, “750 Million Struggling To Meet Basic Needs With No Safety Net,” Gallup News, June 16, 2020. 3 Christopher Chase-Dunn et al, “The Development of World-Systems,” Sociology of Development 1 (2015), pp. 149-172; and Chase-Dunn, Yukio Kawano, Benjamin Brewer, “Trade globalization since 1795: waves of integration in the world-system,” American Sociological Review 65 (2000), pp. 77-95. 4 Bruce Stokes, “Americans, Like Many In Other Advanced Economies, Not Convinced Of Trade’s Benefits,” September 26, 2018. 5 In other words, the mishandling of COVID-19 and the historic George Floyd protests of June 2020 have not taken as great of a toll on Trump’s national approval, thus far, as the Ukraine scandal last October, the government shutdown in January-February 2019, the near-failure to pass tax cuts in December 2017, or the Charlottesville incident in August 2017. This is surprising and points once more to Trump’s very solid political base, which could serve as a springboard for a comeback over the next four months.
Highlights In the short run, extreme policy uncertainty is problematic for risk assets. In the long run, gargantuan fiscal and monetary stimulus continues to support cyclical trades. Equity volatility always increases in the lead-up to US presidential elections. Trump has a 35% chance of reelection. The US-China trade deal is intact for now but the risk of a strategic crisis or tariffs is about 40%. Our Turkish GeoRisk Indicator is lower than it should be based on Turkey’s regional escapades. Feature US equities fell back by 2.6% on June 24 as investors took notice of rising near-term risks to the rally. With gargantuan global monetary and fiscal stimulus, we expect the global stock-to-bond ratio to rise over the long run (Chart 1). However, we still see downside risks prevailing in the near term related to the pandemic, US politics, geopolitics, and the rollout of additional stimulus this summer. Chart 1Risk-On Phase Continues - But Risks Mounting
Risk-On Phase Continues - But Risks Mounting
Risk-On Phase Continues - But Risks Mounting
Chart 2Policy Uncertainty Hitting Extremes
Policy Uncertainty Hitting Extremes
Policy Uncertainty Hitting Extremes
Global economic policy uncertainty is skyrocketing – particularly due to the epic the November 3 US election showdown. Yet Chinese policy uncertainty remains elevated and will rise higher given that the pandemic epicenter now faces an unprecedented challenge to its economic and political order. China’s economic instability will increase emerging market policy uncertainty (Chart 2). Only Europe is seeing political risk fall, yet Trump’s threats of tariffs against Europe this week highlight that he will resort to protectionism if his approval rating does not benefit from stock market gains, which is currently the case. The COVID-19 outbreak is accelerating in the US in the wake of economic reopening and insufficient public adherence to health precautions and distancing measures. The divergence with Europe is stark (Chart 3). Authorities will struggle to institute sweeping lockdowns again, but some states are tightening restrictions on the margin and this will grow. Chart 3US COVID-19 Outbreak
Volatility And Mediterranean Quarrels (GeoRisk Update)
Volatility And Mediterranean Quarrels (GeoRisk Update)
The divergence between daily new infection cases and new deaths in the US, as well as countries as disparate as Sweden and Iran, is not entirely reassuring. The US is effectively following Sweden’s “light touch” model. Ultimately COVID is not much of a risk if deaths are minimized – but tighter social restrictions will frighten the markets regardless (Chart 4). President Trump’s election chances have fallen under the weight of the pandemic – followed by social unrest and controversy over race relations. But net approval on handling the economy is holding up well enough (Chart 5). Chart 4Divergence In New Cases Versus New Deaths
Volatility And Mediterranean Quarrels (GeoRisk Update)
Volatility And Mediterranean Quarrels (GeoRisk Update)
Chart 5Trump’s Lifeline Is The Economy
Volatility And Mediterranean Quarrels (GeoRisk Update)
Volatility And Mediterranean Quarrels (GeoRisk Update)
Our subjective 35% odds of reelection still seem appropriate for now – but we will upgrade Trump if the financial and economic rebound is sustained while his polling improves. His approval should pick up in the face of a collapse of law and order, not to mention left-wing anarchists removing or vandalizing historical monuments to America’s Founding Fathers and some great public figures who had nothing to do with the Confederacy in the Civil War. Equity volatility will increase ahead of the US election. Chart 6Volatility Always Rises Before US Elections
Volatility Always Rises Before US Elections
Volatility Always Rises Before US Elections
Equity volatility always increases in the lead up to modern American elections (Chart 6) and this year’s extreme polarization, high unemployment, and precarious geopolitical environment suggest that negative surprises could be worse than usual, notwithstanding the tsunami of stimulus. So far this year the S&P 500 is tracing along the lower end of its historical performance during presidential election years. This is consistent with a change of government in November, unless it continues to power upward over the next four months – typically a change of ruling party requires a technical correction on the year. Our US Equity Strategist, Anastasios Avgeriou, also expects the market to begin reacting to political risk – and he precisely timed the market’s peak and trough over the past year (Chart 7). We suspect that the positive correlation between the S&P and the Democratic Party’s odds of a full sweep of government is spurious. The reason the S&P has recovered is because of the economic snapback from the lockdowns and the global stimulus. The reason the odds of a Blue Wave election have surged is because the pandemic and recession decimated Trump and the Republicans. Going forward, the market needs to do more to discount a Democratic sweep. At 35%, this scenario is underrated in Chart 8, which considers all possible presidential and congressional combinations. Standalone bets put the odds of a Blue Wave at slightly above 50%. We have always argued that the party that wins the White House in 2020 is highly likely to take the Senate. Chart 7Market At Risk Of Election Cycle
Market At Risk Of Election Cycle
Market At Risk Of Election Cycle
Chart 8Market Will Soon Worry About 'Blue Wave'
Market Will Soon Worry About 'Blue Wave'
Market Will Soon Worry About 'Blue Wave'
True, the US is monetizing debt and this will push risk assets higher regardless over the long run. But if former Vice President Joe Biden wins the presidency, he will create a negative regulatory shock for American businesses, and if his party takes the Senate, then corporate taxes, capital gains taxes, federal minimum wages, liability insurance, and the cost of carbon (implicitly or explicitly) will all rise. The market must also reckon with the possibility that Trump is reelected or that he becomes firmly established as a “lame duck” and thus takes desperate measures prior to the election. His threat to impose tariffs on Europe this week underscores our point that if Trump’s approval rating stays low, despite a rising stock market, then the temptation to spend financial capital in pursuit of political capital will rise. This will involve a hard line on immigration and trade. Bottom Line: Tactically, there is more downside. Strategically, we remain pro-cyclical. Stimulus Hiccups This Summer One reason we have urged investors to buy insurance against downside risks this month is because of hurdles in rolling out the next round of fiscal stimulus. The four key drivers of the global growth rebound are liquidity, fiscal easing (Chart 9), an enthusiastic private sector response, and the large cushion of household wealth prior to the crisis. This is according to Mathieu Savary – author of our flagship Bank Credit Analyst report. Mathieu argues that it will be harder for investors to overlook policy uncertainty after the stimulus slows, i.e. the second derivative of liquidity turns negative. Chart 9Gargantuan Fiscal Stimulus
Volatility And Mediterranean Quarrels (GeoRisk Update)
Volatility And Mediterranean Quarrels (GeoRisk Update)
The massive increase in budget deficits and the quick recovery in activity amid reopening have reduced politicians’ sense of urgency. We fear that the stock market will have to put more pressure on lawmakers to force them to provide more largesse. Ultimately they will do so – but if they delay, and if delay looks like it is turning into botching the job, then markets will temporarily panic. Why are we confident stimulus will prevail? In the United States, fiscal bills have flown through Congress despite record polarization. Democrats cannot afford to obstruct the stimulus just to hurt the economy and the president’s reelection chances. Instead they have gone hog wild – promoting massive spending across the board to demonstrate their fundamental proposition that government can play a larger and more positive role in Americans’ lives. Their latest proposal is worth $3 trillion, plus an infrastructure bill that nominally amounts to $500 billion over five years. President Trump, for his part, was always fiscally profligate and now wants $2 trillion in stimulus to fuel the economic recovery, thus increasing his chances of reelection as voters grow more optimistic in the second half of the year. He also wants $1 trillion in new infrastructure spending over five years. Yet Republican Senators are dragging their feet and offering only a $1 trillion package. In the end they will adopt Trump’s position because if they do not hang together, they will all hang separately in November. The debate will center on whether the extra $600 in monthly unemployment benefits will be continued (at a cost of $276bn in the previous Coronavirus Aid, Relief, and Economic Security Act). Republicans want to tie benefits to returning to work, since this generous subsidy created perverse incentives and made it more economical for many to stay on the dole. There will also be a debate over whether to issue another round of direct cash checks to citizens ($290bn in the CARES Act). Republicans want to prioritize payroll tax cuts, again focusing on reducing unemployment (Chart 10). Chart 10US Fiscal Stimulus Breakdown
Volatility And Mediterranean Quarrels (GeoRisk Update)
Volatility And Mediterranean Quarrels (GeoRisk Update)
Our US bond strategist, Ryan Swift, has shown that the cash handouts present a substantial fiscal “cliff.” Without the original one-time stimulus checks, real personal income would have fallen 5% since February, instead of rising 9% (Chart 11). If Republicans refuse to issue a new round of checks, yet the extra unemployment benefits stay, then over $1 trillion in income will be needed to fill the gap so that overall personal income will end up flat since February. In other words, an ~8% increase in income less transfers from current levels is necessary to prevent overall personal income from falling below its February level. China and the EU will eventually provide more largesse. Republican Senators will capitulate, but the process could be rocky and the market should see volatility this summer. China may also be forced to provide more stimulus in late July at its mid-year Politburo meeting – any lack of dovishness at that meeting will disappoint investors. European talks on the Next Generation recovery fund could also see delays (though they are progressing well so far). Brexit trade deal negotiations pose a near-term risk. There is also a non-negligible chance that the German Constitutional Court will raise further obstructions with the European Central Bank’s quantitative easing programs on August 5. European risks are manageable on the whole, but the market is not discounting much (Chart 12). Chart 11Will Congress Takeaway The Money Tree?
Will Congress Takeaway The Money Tree?
Will Congress Takeaway The Money Tree?
Bottom Line: We expect the S&P 500 to trade in a range between 2800 and 3200 points during this period of limbo in which risks over pandemic response and political risks will come to the fore while the market awaits new stimulus measures, which may not be perfectly timely. Chart 12European Risks Are Getting Priced
European Risks Are Getting Priced
European Risks Are Getting Priced
Has The Phase One China Deal Failed Yet? President Trump’s threat this week to slap Europe with tariffs, if it imposes travel restrictions on the US over the coronavirus, points to the dynamic we have highlighted on the more consequential issue of whether Trump hikes broad-based tariffs on China, and/or nullifies the “Phase One” trade deal. Our sense is that if Trump is doing extremely poorly, or extremely well, in terms of opinion polls and the stock market, then the roughly 40% odds of sweeping punitive measures of some kind will go up (Diagram 1). Cumulatively we see the chance of a major tariff hike at 40%. Diagram 1Decision Tree: Risk Of Significant Trump Punitive Measures On China In 2020
Volatility And Mediterranean Quarrels (GeoRisk Update)
Volatility And Mediterranean Quarrels (GeoRisk Update)
White House trade czar Peter Navarro’s comments earlier this week, suggesting that the Phase One trade deal was already over, prompted Trump to tweet that he still fully supports the deal. Negotiations between Secretary of State Mike Pompeo and Chinese Politburo member Yang Jiechi also nominally kept the lid on tensions. However, China may need to depreciate the renminbi to ease deflationary pressures on its economy – and this would provoke Trump to retaliate (Chart 13). Chart 13Chinese Depreciation Would Provoke Trump
Chinese Depreciation Would Provoke Trump
Chinese Depreciation Would Provoke Trump
We have always argued against the durability of the Phase One trade deal. Investors should plan for it to fall apart. Judging by our China GeoRisk Indicator, investors are putting in a higher risk premium into Chinese equities (Chart 14). They are also doing so with Korean equities, which are ultimately connected with US-China tensions. Only Taiwan is pricing zero political risk, which is undeserved and explains why we are short Taiwanese equities. After China’s imposition of a controversial national security law in Hong Kong and America’s decision to prepare retaliatory sanctions, reports emerged that Chinese authorities ordered state-owned agricultural traders to halt imports of soybean and pork – and potentially corn and cotton. These reports were swiftly followed by others that highlighted that state-owned Chinese firms purchased at least three cargoes of US soybeans on June 1, in spite of China’s decision to stop imports.1 Thus this aspect of the deal has not yet collapsed. But we would emphasize that the constraints against a failure of the deal are not prohibitive this year. The $200 billion worth of additional Chinese imports over 2020-2021 promised in the deal included $32 billion worth of additional US farm purchases – with at least $12.5 billion in 2020 and $19.5 billion in 2021 over 2017 imports of $24 billion. However, to date, US agricultural exports to China suggest that China may not even meet 2017 levels (Chart 15). Chart 14GeoRisk Indicators Show Rising Risk
GeoRisk Indicators Show Rising Risk
GeoRisk Indicators Show Rising Risk
Chart 15Trade Deal Durability Still Shaky
Volatility And Mediterranean Quarrels (GeoRisk Update)
Volatility And Mediterranean Quarrels (GeoRisk Update)
Soybeans account for roughly 60% of US agricultural exports to China. While Chinese imports are up so far this year relative to 2019, they remain well below pre-trade war levels. Although lower hog herds on the back of the African Swine Flu and disruptions caused by COVID-19 may be blamed, they are not the only cause of subdued purchases. The share of Chinese soybean imports coming from the US is also still below pre-trade war levels (Chart 16). Chart 16China Still Substituting Away From US
Volatility And Mediterranean Quarrels (GeoRisk Update)
Volatility And Mediterranean Quarrels (GeoRisk Update)
New Chinese regulation requiring documents assuring food shipments to China are COVID-19 free adds another hurdle – China already banned poultry imports from Tyson Foods Inc. plants. Although the US’s share of China’s pork imports has picked up significantly, it will not go far toward meeting the trade deal requirements. China’s pork purchases from the US were valued at $0.3 billion in 2017, while soybean imports came in at $14 billion. Bottom Line: Trump’s only lifeline at the moment is the economy which pushes against canceling the US-China deal. But if he becomes a lame duck – or if exogenous factors humiliate him – then all bets are off. The passage of massive stimulus in the US and China removes economic constraints to conflict. Will Erdogan Overstep In Libya? We have long been bearish on Turkey relative to other emerging markets due to President Tayyip Erdogan’s populist policies, which erode monetary and fiscal responsibility and governance. Turkey’s intervention in Libya has marked a turning point in the Libyan civil war. The offensive to seize Tripoli on the part of General Khalifa Haftar of the Tobruk-based Libyan National Army (LNA) has been met with defeat (Map 1). Map 1Libya’s Battlefront Is Closing In On The Oil Crescent
Volatility And Mediterranean Quarrels (GeoRisk Update)
Volatility And Mediterranean Quarrels (GeoRisk Update)
Foreign backing has enabled the conflict. Egypt, the UAE, Saudi Arabia, and Russia are the Libyan National Army’s main supporters, while Turkey and Qatar support Prime Minister Fayez al-Sarraj of the UN recognized Government of National Accord (GNA). The GNA’s successes this year can be credited to Turkey, which ramped up its intervention in Libya, even as oil prices collapsed, hurting Haftar and his supporters. Now the battlefront has shifted to Sirte and the al-Jufra airbase – the largest in Libya – and is closing in on the eastern oil-producing crescent, which contains over 60% of Libya’s oil. The victor in Sirte will also have control over the oil ports of Sidra, Ras Lanuf, Marsa al-Brega, and Zuwetina. With all parties eying the prize, the conflict is intensifying. Tripoli faces greater resistance as its forces move east. Egyptian President Abdel Fattah al-Sisi’s June 6 ceasefire proposal, dubbed the Cairo Initiative, was rejected by al-Sarraj and Turkey. Instead, the Tripoli-based government wants to capture Sirte and al-Jufra before coming to the table. The recapturing of oil infrastructure would bring back some of Libya's lost output (Chart 17). Nevertheless, OPEC 2.0 is committed to keeping oil markets on track to rebalance, reducing the net effect of a Libyan production increase on global supplies. However, the GNA’s swift successes in the West may not be replicable as it moves further East, where support for Haftar is deeper and where the stakes are higher for both sides. This is demonstrated by the GNA’s failed attempt to capture Sirte on June 6. The battlefront is now at Egypt’s red line – GNA control of al-Jufra would pose a direct threat to Egypt and is thus considered a border in Egypt’s national security strategy. A push eastward risks escalating the conflict further by drawing in Egypt militarily. In a televised speech on June 20, al-Sisi threatened to deploy Egypt’s military if the red line is crossed. The statement was interpreted by Ankara as a declaration of war, raising the possibility that Egypt will go to war with Turkey in Libya. On paper, Egypt’s military is up to the task. Its recent upgrades have pulled up its ranking to ninth globally according to the Global Fire Power Index, surpassing Turkey’s strength in land and naval forces (Chart 18). However, while Turkey’s military has been active in other foreign conflicts such as in Syria, Egypt’s army is untested on foreign soil. Its most recent military encounter was the 1973 Yom Kippur War. Even after years of fighting, it has yet to declare victory against terrorist cells in the Sinai Peninsula. Thus Egypt’s rusty forces could face a protracted conflict in Libya rather than a swift victory. Chart 17GNA/Turkish Success Would Revive Libyan Oil Production
Volatility And Mediterranean Quarrels (GeoRisk Update)
Volatility And Mediterranean Quarrels (GeoRisk Update)
Chart 18Egypt Is Militarily Capable … On Paper
Volatility And Mediterranean Quarrels (GeoRisk Update)
Volatility And Mediterranean Quarrels (GeoRisk Update)
Other constraints may also deter al-Sisi from following through on his threat: Other Arab backers of the Libyan National Army – the UAE and Saudi Arabia – are unlikely to provide much support as their economies have been hammered by low oil prices. Egypt’s own economy is in poor shape to withstand a protracted war, with public debt on an unsustainable path. Not coincidentally, Egypt faces another potential military escalation to its south where it has been clashing with Ethiopia over the construction of the Grand Ethiopian Renaissance Dam on the Blue Nile. The dam will control Egypt’s water supply. The latest round of negotiations failed last week. While Cairo is hoping to obtain a bilateral agreement over the schedule for filling the dam, Addis Ababa has indicated that it will begin filling the dam in July regardless of whether an agreement is reached. Al-Sisi’s response to the deadlocked situation has been to request an intervention by the UN Security Council. However, as the July filling date nears, the Egypt-Ethiopia standoff risks escalating into war. For Egypt, there is an urgency to secure its future water supplies now before Ethiopia begins filling the dam. And while resolving the Libyan conflict is also a matter of national security – Egypt sees the Libyan National Army as a buffer between its porous western border and the extremist elements of the GNA – the risks are not as pressing. Thus a military intervention in Libya would distract Egypt from the Ethiopian conflict and risk drawing it into a war on two fronts. Moreover, Egypt generally, and al-Sisi in particular, risk losing credibility in case of a defeat. That said, Egypt has high stakes in Libya. A GNA defeat could annul the recent Libya-Turkey maritime demarcation agreement – a positive for Egypt’s gas ambitions – and eliminate the presence of unfriendly militias on its Western border. Thus, if the GNA or GNA-allied forces kill Egyptian citizens, or look as if they are capable of utterly defeating Haftar on his own turf, then it would be a prompt for intervention. Meanwhile Turkey’s regional influence and foreign policy assertiveness is growing – and at risk of over-extension. Erdogan’s interests in Libya stem from both economic and strategic objectives. In addition to benefitting from oil and gas rights and rebuilding contracts, Ankara’s strategy is in line with its pursuit of greater regional influence as set out in the Mavi Vatan, its current strategic doctrine.2 There are already rumors of Turkish plans to establish bases in the recently captured al-Watiya air base and Misrata naval base. This would be in addition to Ankara’s bases in Somalia and in norther Iraq. Erdogan is partly driven into these foreign policy adventures to distract from his domestic challenges and keep his support level elevated ahead of the 2023 general election (Chart 19). However, his growing assertiveness threatens to alienate European neighbors and NATO allies, which have so far played a minimal role in the Libyan conflict yet have important interests there. For now, the western powers seem focused on countering Russian intervention in Libya and the broader Mediterranean. Prime Minister al-Sarraj and General Stephen Townsend, head of US Africa Command (AFRICOM), met earlier this week and reiterated the need to return to the negotiating table and respect Libyan sovereignty and the UN arms embargo, with a focus on stemming Russian interference. However, Turkish relations with the West may take a turn for the worse if Erdogan oversteps. Turkey continues to threaten Europe with floods of refugees and immigrants if its demands are not met. This pressure will grow due to the COVID-19 crisis, which will ripple across the Middle East, Africa, and South Asia. Ankara also continues to press territorial claims in the Mediterranean Sea, ostensibly for energy development.3 Turkey has recently clashed with Greece and France on the seas. In sum, the Libyan conflict is intensifying as it moves into the oil crescent. The Turkey-backed GNA will face greater resistance in Sirte and al-Jufra, even assuming that Egypt does not follow through on its threat of intervening militarily. Erdogan’s foreign adventurism will provoke greater opposition in Libya and elsewhere among key western powers, Russia, and the Gulf Arab states. Bottom Line: The implication is that a deterioration in Turkey’s relationship with the West, military overextension, and continued domestic economic mismanagement will push up our Turkey GeoRisk Indicator, which is a way of saying that it will weigh on the currency (Chart 20). Chart 19Erdogan’s Fear Of Opposition Drives Bold Policy
Volatility And Mediterranean Quarrels (GeoRisk Update)
Volatility And Mediterranean Quarrels (GeoRisk Update)
Chart 20Foreign And Domestic Factors Will Push Up Turkish Risk
Foreign And Domestic Factors Will Push Up Turkish Risk
Foreign And Domestic Factors Will Push Up Turkish Risk
Stay short our “Strongman Basket” of emerging market currencies, including the Turkish lira. Investment Takeaways We entered the year by going strategically long EUR-USD, but closed the trade upon the COVID-19 lockdowns. We have resisted reinitiating it despite the 5% rally over the past three months due to extreme political risks this year, namely the US election and trade risks. Trump’s threat of tariffs on Europe this week highlights our concern. We will wait until the election outcome before reinstituting this trade, which should benefit over time as global and Chinese growth recover and the US dollar drops on yawning twin deficits. Throughout this year’s crisis we have periodically added cyclical and value plays to our strategic portfolio. We favor stocks over bonds and recommend going long global equities relative to the US 30-year treasuries. We are particularly interested in commodities that will benefit from ultra-reflationary policy and supply constraints due to insufficient capital spending. This month we recommend investors go long our BCA Rare Earth Basket, which features producers of rare earth elements and metals that can substitute for Chinese production (Chart 21). This trade reflects our macro outlook as well as our sense that the secular US-China strategic conflict will heat up before it cools down. Chart 21Position For An Escalation In The US-China Conflict
Position For An Escalation In The US-China Conflict
Position For An Escalation In The US-China Conflict
Matt Gertken Vice President Geopolitical Strategist mattg@bcaresearch.com Roukaya Ibrahim Editor/Strategist Geopolitical Strategy RoukayaI@bcaresearch.com Footnotes 1 Please see Karl Plume et al, "China buys U.S. soybeans after halt to U.S. purchases ordered: sources," Reuters, June 1, 2020. 2 The Mavi Vatan or “Blue Homeland Doctrine” was announced by Turkish Admiral Cem Gurdeniz in 2006 and sets targets to Turkish control in two main regions. The first region is the three seas surrounding it – the Mediterranean Sea, Aegean Sea, and Black Sea with the goal of securing energy supplies and supporting Turkey’s economic growth. The second region encompasses the Red Sea, Caspian Sea and Arabian Sea where Ankara has strategic objectives. 3 Ankara’s gas drilling activities off Cyprus have been a form of frequent provocation for Greece and Cyprus. Ankara has also stated that it may begin oil exploration under a controversial maritime deal with Libya as early as August. Section II: Appendix : GeoRisk Indicator China
China: GeoRisk Indicator
China: GeoRisk Indicator
Russia
Russia: GeoRisk Indicator
Russia: GeoRisk Indicator
UK
UK: GeoRisk Indicator
UK: GeoRisk Indicator
Germany
Germany: GeoRisk Indicator
Germany: GeoRisk Indicator
France
France: GeoRisk Indicator
France: GeoRisk Indicator
Italy
Italy: GeoRisk Indicator
Italy: GeoRisk Indicator
Canada
Canada: GeoRisk Indicator
Canada: GeoRisk Indicator
Spain
Spain: GeoRisk Indicator
Spain: GeoRisk Indicator
Taiwan
Taiwan: GeoRisk Indicator
Taiwan: GeoRisk Indicator
Korea
Korea: GeoRisk Indicator
Korea: GeoRisk Indicator
Turkey
Turkey: GeoRisk Indicator
Turkey: GeoRisk Indicator
Brazil
Brazil: GeoRisk Indicator
Brazil: GeoRisk Indicator
Section III: Geopolitical Calendar
BCA Research's Emerging Markets Strategy and China Investment Strategy services published a joint Special Report illustrating that China has become a major global innovation center. The country overtook the US as the new world leader last year in terms of the…