Emerging Markets

Highlights The economic and health crises since Q1 2020 have accelerated the breakdown in the US-China relationship. Although the US is in a much weaker economic position this year than in 2019, President Trump may have fewer political constraints to an escalation in the trade war. President Xi Jinping is fueling provocations with the US, adding instability and unpredictability to the geopolitical equation. The Phase One trade deal may be collapsing. We recommend a defensive stance on Chinese risk assets and the RMB during the summer. Feature The outbreak of COVID-19 this year has sparked the worst economic contraction in China and the US in decades. Economic calamities and social unrest should have tied the hands of leaders in both countries. However, as our Geopolitical Strategist Matt Gertken reminds us, this is an atypical election year in the US and some constraints that previously deterred both sides from taking aggressive actions may be diminishing.1 We agree that the economic and health crises have likely accelerated the possibility of a breakdown in the relationship between the US and China. The risk will likely reach a new height in the summer, when pressure on Trump’s election campaign intensifies leading up to the vote in November. While there is a growing bipartisan hawkish view on China in Washington, China is also playing a part in fanning the flames. The USD/CNY exchange rate will be extremely volatile during this episode of heightened geopolitical turbulence. We continue to hold a long USD-CNH position, with the expectation that the RMB will likely weaken further in the summer. Trump Facing Fewer Constraints Whether Trump’s chances of reelection increase through a strong recovery in the US stock market and economy, or decrease through an economic recession and/or weak public support, either scenario could remove constraints preventing Trump from confronting China. Trump’s current priority may be to secure a recovery in the equity market and improve his polling, which will require economic improvement. Ironically, the US stock market has been on fire despite the battered real economy. The S&P 500 Index has gone up by 44% since its trough on March 23, nearly erasing its losses for the year. The higher the market rises, the more Trump may believe that the market can sustain a shock even if he resorts to imposing tariffs on Chinese export goods - particularly if his approval rating does not rise along with the market. The market’s reaction in 2018 and 2019 provides a good example of how the US financial markets shrugged off any negative impact from a trade war between the US and China (Chart 1). If the pandemic prevents the US economy from fully reopening and/or recovering in the summer, then an equity market correction could send a negative signal about Trump’s reelection prospects. In this case, Trump may not be as enslaved by financial constraints as he would have been if the economy was in an expansionary state. A falling approval rating, coupled with domestic social unrest, would make Trump a “lame duck” President (Chart 2). Therefore, he may try to divert attention away from the economy and adopt an aggressive foreign and trade policy. China is already perceived negatively by a majority of American voters and certain political communities, thus there could be a political upside for Trump to escalate his confrontation with China. Chart 1US Stocks Kept Reaching New Highs In 2019 Despite An Ongoing Trade War
US Stocks Kept Reaching New Highs In 2019 Despite An Ongoing Trade War
US Stocks Kept Reaching New Highs In 2019 Despite An Ongoing Trade War
Chart 2Trump’s Polling Drops Below Average
Watch Out For A Second Wave (Of US-China Frictions)
Watch Out For A Second Wave (Of US-China Frictions)
All bets are off if Trump’s approval rating continues to trend downwards, regardless of whether the US equity market continues to rally and/or if the US economy is mired in recession. Our Geopolitical Strategy illustrates the scenarios as follows (Diagram 1). If Trump’s approval rating is high and the market is up, then Trump is “winning” and the only risk of a tariff hike would come from overconfidence or Chinese provocation. If his approval is up but the market falls, then he may become more inclined to use tariffs. If his approval rating is low but the market is up, then he has ammunition to get tougher on China. If his approval and the market are collapsing, then he is a “lame duck president” and all bets are off. Combined, these scenarios imply there is a 59% probability that Trump refrains from large tariffs, and a 41% chance that he reverts to large tariffs. Diagram 1Odds President Trump Will Hike Tariffs On China Before US Election
Watch Out For A Second Wave (Of US-China Frictions)
Watch Out For A Second Wave (Of US-China Frictions)
Bottom Line: All bets are off if Trump’s approval rating continues to trend downwards, regardless of whether the US equity market continues to rally and/or if the US economy is mired in recession. Both scenarios would remove financial and economic constraints that Trump faced in 2019. If Trump's polling is weak, he may spend financial ammunition to shore up his “America First” credentials. Adding China To The Geopolitical Instability Equation China itself may be an independent source of geopolitical instability and unpredictability. While President Xi Jinping does not have any electoral constraints, he needs to restore the confidence of Chinese people in the wake of the worst public health crisis and economic performance in decades. Like Trump, the pandemic gives President Xi an incentive to distract his populace from domestic crises by adopting hawkish foreign policies. This hawkish approach was demonstrated when a new Hong Kong SAR national security law was proposed and approved at this year’s National People’s Congress (NPC). The new law would give Beijing greater direct control over Hong Kong, in contravention of its promise of 50 years of substantial autonomy enshrined in the Sino-British Joint Declaration of 1984. China’s foreign policy tone recently shifted to a more combative one. This “wolf warrior diplomacy" has gained popularity among Chinese diplomats.2 During a news conference at this year’s NPC, China’s Foreign Minister Wang Yi defended the “wolf warrior diplomacy” by stating that the country will stand firm in defending its national interest and combating “smears.” Chart 3Chinese Imports Of American Goods Are Falling Far Short Of The Target Set By The Trade Deal
Chinese Imports Of American Goods Are Falling Far Short Of The Target Set By The Trade Deal
Chinese Imports Of American Goods Are Falling Far Short Of The Target Set By The Trade Deal
The response from the Trump administration has been lukewarm. While Secretary of State Mike Pompeo will strip Hong Kong of its autonomous status, President Trump is taking limited sanctions on mainland China and eschewing more drastic punitive measures. China may see the timid response as a sign that Trump is reluctant to take action on China and tip the bilateral relationship into an outright confrontation. This perception is, in itself, a risk that may lead to more provocation on both sides. Lastly, the Phase One trade deal is tenuous. US Trade Representative Robert Lighthizer last week stated that "China has done a pretty good job" at meeting its trade-deal quotas,3 but we have long argued China was never going to honor the commitment to its full extent.4 The latest data shows that Chinese purchases of American exports in the first four months of 2020, from manufacturing goods to agricultural produce and energy, have fallen far short of the huge expansion agreed in the deal (Chart 3). The recent depreciation in the RMB may be another sign that China is abandoning the Phase One trade deal.5 Weakness in economic fundamentals and renewed tensions between the US and China may have contributed to the RMB’s recent depreciation. However, the decline was reinforced by the PBoC’s move to set the CNY/USD fixing rate to its lowest point since 2008 (Chart 4). Given that the RMB has become an anchor for emerging market currencies, a rapid drop in the RMB would lead to selloffs in emerging Asian and Latin American currencies and, in turn, would strengthen the USD (Chart 5). The Trump administration may see a swift RMB depreciation as China is deliberately violating the Phase One trade deal, which will prompt Trump to seek retaliatory actions against China. Chinese purchases of American goods in the first four months of 2020 have fallen far short of the Phase One trade agreement. Chart 4Is The PBoC Sending A Warning Signal To Trump?
Is The PBoC Sending A Warning Signal To Trump?
Is The PBoC Sending A Warning Signal To Trump?
Chart 5The RMB Has Been The Anchor Currency In EM
The RMB Has Been The Anchor Currency In EM
The RMB Has Been The Anchor Currency In EM
Bottom Line: While China is prioritizing its own economic recovery, its foreign policy stance has decisively swung to a more combative one. Additionally, the Phase One trade deal is on the verge of collapsing. Investment Conclusions The USD/CNY exchange rate will likely be extremely volatile in the next quarter amid heightened geopolitical turbulence, with more downside risks to the RMB. As such, we continue to recommend that investors hedge their RMB exposure in Chinese stocks by holding a long USD-CNH position. We remain neutral on Chinese stocks in relative terms in view of the non-trivial, near-term vulnerability of risk assets. As in 2019, investable stocks are particularly exposed to an escalation in the US-China conflict (Chart 6). Chart 6Large Divergence In Onshore Versus Offshore Stock Performance During The Trade War
Large Divergence In Onshore Versus Offshore Stock Performance During The Trade War
Large Divergence In Onshore Versus Offshore Stock Performance During The Trade War
Chart 7Stocks In Some Domestic Demand-Oriented Sectors Are Still Relatively Safe Bets
Stocks In Some Domestic Demand-Oriented Sectors Are Still Relatively Safe Bets
Stocks In Some Domestic Demand-Oriented Sectors Are Still Relatively Safe Bets
Price corrections in both China’s onshore and offshore aggregate equity markets are likely to occur during the summer. Nevertheless, cyclical plays that closely track Chinese stimulus are relatively safe bets, especially for China’s domestic investors and in absolute terms (Chart 7). Jing Sima China Strategist jings@bcaresearch.com Footnotes 1Please see Geopolitical Strategy Weekly Report "Spheres Of Influence (GeoRisk Update)," dated May 29, 2020, available at gps.bcaresearch.com 2South China Morning Post, “Chinese Foreign Minister Wang Yi defends ‘wolf warrior’ diplomats for standing up to ‘smears’”, May 24, 2020 3Bloomberg, “Lighthizer Says He Feels ‘Very Good’ About Phase One China Deal”, June 4, 2020 4Please see China Investment Strategy Weekly Report "Managing Expectations," dated January 22, 2020, available at cis.bcaresearch.com 5The Phase One trade deal prohibits both the US and China from manipulating exchange rates to devalue their currencies for competitive purposes. Cyclical Investment Stance Equity Sector Recommendations
Highlights Egypt’s balance of payments have deteriorated materially due to both the crash in oil prices and the global pandemic. The country’s foreign funding requirements in 2020 are high and the currency is under depreciation pressures. Unless domestic interest rates are brought considerably lower, the nation’s public debt is on an unsustainable trajectory. Hence, Egypt needs to reduce local interest rates substantially and rapidly. And in so doing, the central bank cannot control or defend the exchange rate. The latter is set to depreciate. Investors should buy Egyptian local currency bonds while hedging their currency exposure. Feature The Central Bank of Egypt (CBE) is depleting its foreign exchange (FX) reserves to defend the currency (Chart I-1). As the CBE’s foreign exchange reserves diminish, so will its ability to support the currency. As such, the Egyptian pound will likely depreciate in the next 6-9 months. Interestingly, despite being a net importer of energy, many of Egypt’s critical macro parameters are positively correlated with oil prices (Chart I-2). Egypt is in fact deeply integrated in the Gulf oil-economy network via trade and capital flows. In other words, Egypt is a veiled play on oil. Chart I-1The CBE Has Been Defending The Currency
The CBE Has Been Defending The Currency
The CBE Has Been Defending The Currency
Chart I-2Egypt: A Veiled Play On Oil
Egypt: A Veiled Play On Oil
Egypt: A Veiled Play On Oil
Although oil prices have rallied sharply recently, the Emerging Markets Strategy team believes upside is limited and that oil prices will average about $40 over the next three years.1 In addition, local interest rates that are persistently above 10% are disastrous for both Egypt’s domestic demand and public debt sustainability. Egypt’s current account balance strongly correlates with oil prices because of the strong interlinkages that exist between Egypt and the oil-exporting Gulf countries. To preclude a vicious cycle in both the economy and public debt, the CBE should reduce interest rates materially and rapidly. Therefore, higher interest rates cannot be used to defend the exchange rate. Balance Of Payments Strains Egypt’s balance of payments (BoP) dynamics have deteriorated and the probability of a currency devaluation has risen: Current Account: The current account deficit – which stood at $9 billion and 3% of the GDP as of December 2019 – is widening significantly due to the plunge in oil prices this year (Chart I-2, top panel). Egypt’s current account balance strongly correlates with oil prices because of the strong interlinkages that exist between Egypt and the oil-exporting Gulf countries. The latter have been hard hit by the twin shocks of the coronavirus pandemic and the oil crash. First, Egypt’s $27 billion in annual remittances are drying up (Chart I-2, bottom panel). The majority of these transmittals come from Egyptian workers working in Gulf countries. Second, Egypt’s tourism industry – which brings in $13 billion in annual revenues or 4% of GDP – has collapsed due to the pandemic. Tourist arrivals from Middle Eastern countries – which makeup 20% of total tourist arrivals into Egypt – will diminish substantially due to both the pandemic and the negative income shock that the Gulf economies have experienced (Chart I-3). Third, Egyptian exports are in freefall (Chart I-4, top panel). Not only is this due to the freeze in global trade, but also because the country’s exports to the oil-leveraged Arab economies have taken a massive hit. The latter make up 25% of Egypt’s total goods shipments. Chart I-3Egypt: Tourism Is Linked To Oil Prices
Egypt: Tourism Is Linked To Oil Prices
Egypt: Tourism Is Linked To Oil Prices
Chart I-4Exports Revenues Swing With Oil Prices
Exports Revenues Swing With Oil Prices
Exports Revenues Swing With Oil Prices
Furthermore, since 2019 Egypt has been increasingly exporting natural gas. The collapse in gas prices has probably already wiped out a large of chunk its natural gas export revenues (Chart I-5). Chart 6 exhibits the structure of Egypt’s exports of goods and services. Energy, tourism and transportation constituted 67% of total exports in 2019. Chart I-5Gas Export Revenues Are At Risk
Gas Export Revenues Are At Risk
Gas Export Revenues Are At Risk
Chart I-6Egypt: Structure Of Goods & Services Exports
Egypt: A Veiled Oil Play
Egypt: A Veiled Oil Play
Chart I-7Exports Are Shrinking Amid Resilient Imports
Exports Are Shrinking Amid Resilient Imports
Exports Are Shrinking Amid Resilient Imports
Finally, while export revenues have plunged, imports remain resilient (Chart I-7). Critically, 26% of Egypt’s imports are composed of essential and basic items such as consumer non-durable goods, wheat and maize. Consumption of these staples and goods are less sensitive to business cycle oscillations. Therefore, the nation’s current account deficit has ballooned. A wider current account deficit needs to be funded by foreign inflows. With foreign investors reluctant to provide funds, the CBE has lately been financing BoP by depleting its foreign exchange reserves (Chart I-1, on page 1). Foreign Funding Requirements: Not only is Egypt facing a massively deteriorating current account deficit, but the country also carries large foreign funding debt obligations (FDO). FDOs are the sum of debt expiring in the next 12 months, and interest as well as amortization payments over the next 12 months. FDOs due in 2020 were $24 billion.2 In turn, Egypt’s total foreign funding requirements (FFR) – which is the sum of FDOs and the country’s current account deficit – has risen to $33 billion.3 Importantly, this FFR amount is based on the current account for 2019 and, thereby, does not take Egypt’s deteriorating current account deficit into consideration – as discussed above. Meanwhile, the central bank has net FX reserves of only $8 billion.4 If the monetary authorities continue to fund FFR of $33 billion in 2020 to prevent the pound from depreciating, the CBE will soon run out of its net FX reserves. Overall, Chart I-8 compares Egypt to the rest of the EM universe: with respect to (1) exports-to-FDO on the x-axis and (2) foreign exchange reserves-to-FFR on the y-axis. Based on these two measurements, Egypt is among the most vulnerable EM countries in terms of the balance of payments as it has the lowest FX reserves-to-FFR ratio and a low export-to-FDO ratio as well. Chart I-8Egypt Is One Of The Most Exposed EM Countries To Currency Depreciation
Egypt: A Veiled Oil Play
Egypt: A Veiled Oil Play
Chart I-9FDI Inflows Are Set To Diminish
FDI Inflows Are Set To Diminish
FDI Inflows Are Set To Diminish
Foreign Funding of Private Sector: Egypt will struggle to attract private-sector foreign inflows to meet its large FFR amid this adverse regional economic environment and the likely renewed relapse in oil prices in the months ahead. FDI inflows are set to drop (Chart I-9). The oil & gas sector has been the largest recipient of FDI inflows recently (around 55% in 2019 according to the central bank). The crash in both crude oil and natural gas prices will therefore ensure that FDIs into this sector will dry up. Besides, overall FDI inflows emanating from Gulf countries are poised to shrink substantially.5 Chart I-10The Egyptian Pound Is Once Again Expensive
The Egyptian Pound Is Once Again Expensive
The Egyptian Pound Is Once Again Expensive
Foreign Funding of Government: With FDI inflows diminishing, the Egyptian government has once again been forced to approach the IMF for assistance. The country managed to secure $8 billion in assistance from the IMF ($2.8 billion in May and $5.2 in June). This has ameliorated international investor confidence in Egypt. Indeed, the country raised $5 billion by issuing US dollar-denominated sovereign bonds in May. Egypt is now seeking another $4 billion from other international lenders. Crucially, assuming Egypt manages to get the $4 billion loan, which would allow it to raise a total of $17 billion, Egypt would still be short on foreign funding to finance its $33 billion in FFR. Therefore, the currency will come under pressure of devaluation. As we argue below, the nation’s public debt sustainability is in jeopardy unless local currency interest rates are brought down substantially. This can only happen if the currency is allowed to depreciate. Consistently, foreign investors might be unwilling to lend to Egypt until interest rates are pushed lower and the country’s public debt trajectory is placed back on a sustainable path. Finally, the Egyptian pound has once again become expensive according to the real effective exchange rate (REER) which is based on both consumer and producer prices (Chart I-10). Bottom Line: Egypt is facing sharply slowing foreign inflows due to both the crash in oil prices and the global pandemic. This is occurring amid increased FFRs. Meanwhile, the CBE’s net FX reserves are insufficient to defend the exchange rate. Public Debt Sustainability The BoP strains discussed above are forcing the CBE to keep interest rates high to prevent the currency from depreciating. Yet the country’s public debt is on a dangerous path due to elevated interest rates. In turn, without currency devaluation that ultimately allows local interest rates to drop dramatically, the sustainability of Egypt’s public debt will worsen considerably. The BoP strains discussed above are forcing the CBE to keep interest rates high to prevent the currency from depreciating. Yet the country’s public debt is on a dangerous path due to elevated interest rates. To start, Egypt’s public debt stands at 97% of GDP – local currency and foreign currency debt account for 79% and 18% of GDP respectively (Chart I-11, top panel). Chart I-12 illustrates that interest payments on public debt is already using up 60% of government revenue and stands at 10% of GDP. Chart I-11Egypt: Public Debt Profile
Egypt: Public Debt Profile
Egypt: Public Debt Profile
Chart I-12The Government's Interest Payments Are Unsustainable
The Government's Interest Payments Are Unsustainable
The Government's Interest Payments Are Unsustainable
Therefore, if the CBE keeps interest rates at the current level, then the government will continue to pay high interest on its debt. Generally, two conditions need to be met to ensure public debt sustainability in any country (i.e., to ensure that the public debt-to-GDP ratio does not to surge). Nominal GDP growth needs to be higher than government borrowing costs. The government needs to run persistently large primary fiscal surpluses. Chart I-13Egypt: Nominal GDP Growth And Government Borrowing Costs
Egypt: Nominal GDP Growth And Government Borrowing Costs
Egypt: Nominal GDP Growth And Government Borrowing Costs
Regarding the first condition, nominal GDP growth was already dangerously close to the level of Egypt’s government borrowing costs even before the pandemic hit Egypt (Chart I-13). With the pandemic, both domestic demand and exports have plunged. Consequently, nominal GDP is likely close to zero while local currency borrowing costs are above 10%. So long as nominal GDP growth remains below borrowing costs, the public debt sustainability will continue to deteriorate. As to the second condition, Egypt only started running primary fiscal surpluses in 2018 as it implemented extremely tight fiscal policy by cutting non-interest expenditures (Chart I-14). However, that was only possible because economic growth was then strong. As growth has slumped, government revenue is most likely shrinking. Chart I-14Egypt Only Recently Started Running A Primary Fiscal Surplus
Egypt Only Recently Started Running A Primary Fiscal Surplus
Egypt Only Recently Started Running A Primary Fiscal Surplus
Tightening fiscal policy amid the economic downturn will be ruinous. Cutting non-interest expenditures further will depress the already weak economy, drying up both nominal GDP and government revenues even more. This will bring about a vicious economic cycle. Needless to say, the latter option is politically unviable. The most feasible option to ensure sustainability of public debt dynamics is to bring down domestic interest rates considerably. Lower local interest rates will reduce interest expenditures on its domestic debt and will either narrow overall fiscal deficit or free up space for the government to spend elsewhere, boosting much needed economic growth. Meanwhile lower interest rates will boost demand for credit and revive private-sector domestic demand. Provided Egypt’s public debt has a short maturity profile, lower interest rates will reasonably quickly feed into lower interest payments for the government. This means that lower interest rates could reasonably quickly feed to lower interest payments for the government. Importantly, there is a trade-off between the exchange rates and interest rates. Lowering interest rates entail currency depreciation. According to the impossible trinity theory, a central bank facing an open capital needs to choose between controlling interest rates or the exchange rate, it cannot control both simultaneously. As such, if the Central Bank of Egypt opts to bring down local interest rates, while keeping the capital account reasonably open, it needs to tolerate a weaker currency amid its ongoing BoP strains. Bottom Line: Public debt dynamics are treading on a dangerous path. Egypt needs to bring down local interest rates down substantially and rapidly. And in so doing, the CBE cannot control and defend the exchange rate. Devaluation Is Needed All in all, the Egyptian authorities are facing a tight tradeoff: (1) either they continue to defend the currency at the expense of depressing the economy and worsening public debt dynamic, or (2) they tolerate a one-off currency devaluation which would allow the monetary authorities reduce interest rates aggressively. The latter will help stimulate economic growth and make public debt sustainable. Specifically, if the Central Bank of Egypt opts for defending the currency from depreciation, it will need to tolerate much higher interest rates for a long period of time. The CBE would essentially need to deplete whatever little net FX reserves it currently has to fund BoP deficits. This would simultaneously shrink local banking system liquidity, pushing domestic interbank rates higher. All in all, the Egyptian authorities are facing a tight tradeoff: (1) either they continue to defend the currency at the expense of depressing the economy and worsening public debt dynamic, or (2) they tolerate a one-off currency devaluation which would allow the monetary authorities reduce interest rates aggressively. Worryingly, not only would high interest rates devastate the already shaky Egyptian economy, but higher domestic interest rates carry major ramifications for Egypt’s public debt sustainability as discussed earlier. A one-off currency devaluation is painful and carries some political risks yet, it is still the least worst choice for Egypt from a longer-term perspective. Although inflation will spike due to pass-through from currency devaluation, it will be a transitory one-off increase (Chart I-15). Besides, the pertinent risk to the Egyptian economy currently is low inflation and high real interest rates (Chart I-16). Chart I-15Egypt: Currency-Induced Inflation Is A One-Off
Egypt: Currency-Induced Inflation Is A One-Off
Egypt: Currency-Induced Inflation Is A One-Off
Chart I-16Egypt: Real Interest Rates Are High
Egypt: Real Interest Rates Are High
Egypt: Real Interest Rates Are High
In turn, currency depreciation will ultimately provide the CBE with scope to reduce its policy rate which will help stimulate the ailing economy as well as make public debt trajectory more sustainable. Finally, odds are high that Egyptian authorities might choose to devalue the currency sooner rather than later. The basis for this is that the government’s foreign public debt is still relatively small at 18% of the GDP and 19% of the total government debt (Chart I-11, on page 8). Further, the majority (70%) of Egypt’s foreign public debt remains linked to international and bilateral government loans making it easier to renegotiate their terms than in the case of publicly traded sovereign US dollar bonds (Chart I-11, bottom panel). This means that currency depreciation will not materially deteriorate the government’s debt servicing ability. Furthermore, Egypt has experience managing and tolerating currency depreciation. The currency depreciated against the US dollar by 50% in 2016 and before that by 12% in 2013. Bottom Line: The Central Bank of Egypt will not hike interest rates or sell its foreign currency reserves for too long to defend the pound. Odds are high that it will allow the currency to depreciate and will cut interest rates materially. Investment Recommendations Chart I-17Egyptian Pound In The Forward Market
Egyptian Pound In The Forward Market
Egyptian Pound In The Forward Market
Investors should buy Egyptian 3-year local currency bonds while hedging their currency exposure. The basis is that low inflation and a depressed economy in Egypt will lead the CBE to cut rates by several hundred basis points over the next 12 months while allowing currency to depreciate. Forward markets are pricing 5% depreciation in the EGP in the next 6 months and 10% in the next 12 months (Chart I-17). We would assign a higher probability of depreciation. For now, EM credit portfolios should have a neutral allocation on Egyptian sovereign credit. While another potential drop in oil prices and the currency devaluation could push sovereign spreads wider (Chart I-18), eventually large rate cuts by the CBE will make public debt dynamics more sustainable. Absolute return investors should wait for devaluation to go long on Egypt’s US dollar sovereign bonds. Chart I-18Remain Neutral On Egypt's Sovereign Credit
Remain Neutral On Egypt's Sovereign Credit
Remain Neutral On Egypt's Sovereign Credit
Chart I-19Remain Neutral On Egyptian Equities
Remain Neutral On Egyptian Equities
Remain Neutral On Egyptian Equities
Equity investors should keep a neutral allocation on Egyptian stocks with an EM equity portfolio (Chart I-19). Lower interest rates ahead will eventually boost this stock market. Ayman Kawtharani Editor/Strategist ayman@bcaresearch.com 1 This is the view of BCA’s Emerging Markets Strategy service and it differs from the view of BCA’s Commodities and Energy Strategy service. 2 We exclude the Central Bank’s foreign liabilities due in 2020 as they are mostly deposits at the Central Bank of Egypt owed to Gulf countries. It is highly likely that Gulf lenders will agree to extend these deposits given the difficulties Egypt is experiencing. 3 Excluding the Central Bank’s foreign liabilities due in the next 12 months. Please refer to above footnote. 4 The amount of net foreign exchange reserves currently at the Central Bank – i.e. excluding the Bank’s foreign liabilities– are now low at $8 billion. 5 Gulf Co-operation Countries (GCC) are in no position to provide much financial assistance due to the pandemic and oil crash as they are under severe financial strain themselves. Also, GCC countries run strict currency pegs and need to preserve their dwindling foreign exchange reserves to defend their currency pegs to the US dollar.
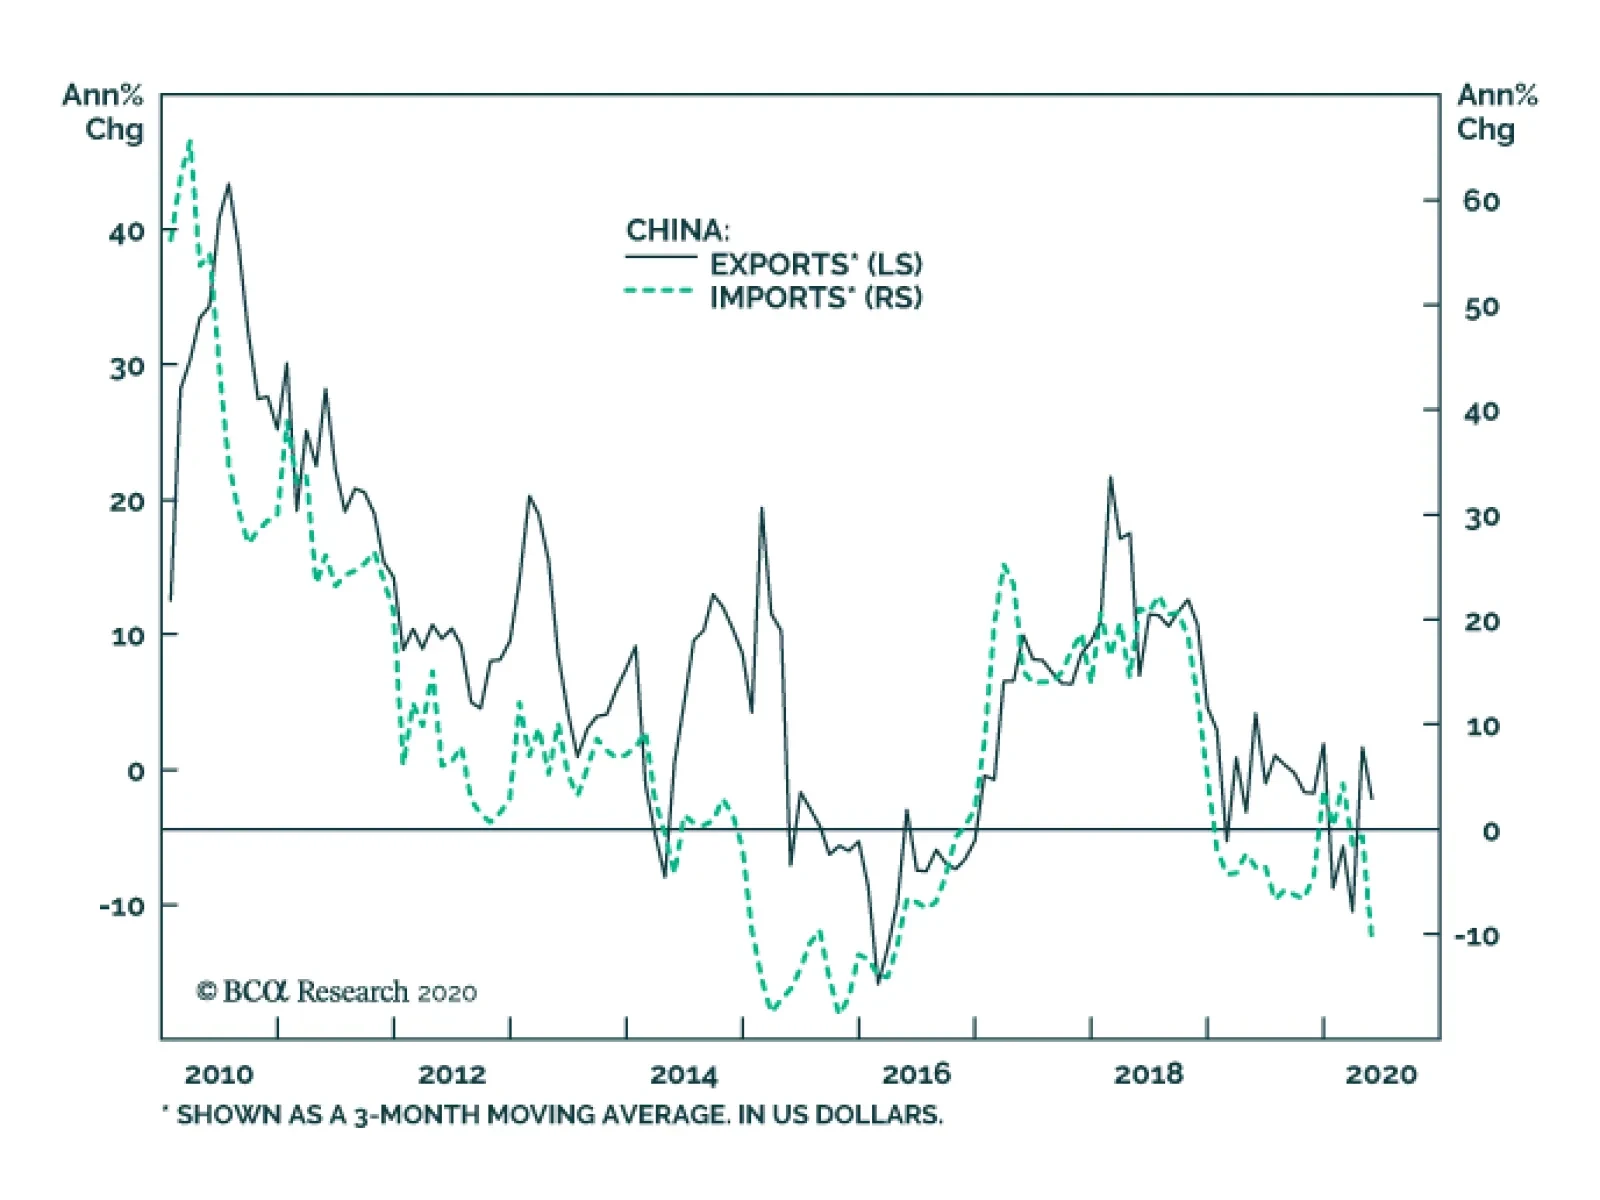
Chinese economic data continue to reflect the evolution of the global economy. In USD-term Chinese exports contracted 3.3% on a year-on-year basis and imports fell 16.7%. Chinese exports remain more resilient than feared. However, exports of medical…
Highlights Our base case reflects our view that China’s strong fiscal and monetary stimulus, combined with a weaker US dollar, will provide a favorable backdrop for copper markets in 2H20. Supply factors are for the most part reflected in current copper prices. In 2H20, the speed of the demand recovery will be the determining factor for prices. Global policy uncertainty remains high. Assessing the joint effects of global monetary and fiscal stimulus, along with consumers’ willingness to spend once lockdowns are lifted will keep uncertainty at relatively high levels. A possible second wave of COVID-19 returning large economies to lockdown status looms large for copper markets, and for commodity markets generally. The combination of safe-haven demand and a continued dollar shortage for borrowers without access to US swap lines could keep the dollar well bid, suppressing foreign flows to EM economies and commodity demand at the margin. Tactically, we remain on the sidelines until the fog clears around these known and unknown unknowns. A $3/lb COMEX refined copper price is likely in 2H20, but the risks to this outlook remain high. Feature Copper prices will end the year higher vs. current levels in our base case. But uncertainty remains elevated. Copper prices will end the year higher vs. current levels in our base case. But uncertainty remains elevated. Assessing the synchronicity of EM recoveries and the joint effects of global monetary and fiscal stimulus, along with consumers’ willingness to spend once lockdowns are lifted is extremely difficult. Looming over all of these considerations: A possible second wave of COVID-19 returning large economies to lockdown status loom large. Tactically, we remain on the sidelines as the fog clears around some of these known and unknown unknowns. Importantly, our positive view rests on our expectation of a robust recovery in China’s economic activity and, to a lesser extent, in its main export destinations, which were hit later by the pandemic. A weak recovery in China would slow the rate at which the current copper supply surplus subsides. At ~ $2.50/lb, copper prices have recovered significantly since bottoming in March at $2.11/lb on the COMEX. Still, clearing the $3.30/lb double top reached in June 2018 will require either a significant increase in global demand or a sharp contraction in supply, which we do not expect. Copper markets were severely hit by the global pandemic: Prices fell 10% in January, as the case count grew in China – the largest copper-consuming market – followed by another 19% decline as the virus spread globally (Chart of the Week). The intensification of lockdowns globally pushed copper markets to a 60k MT surplus as of March – the latest data reported by the World Bureau of Metal Statistics (WBMS) – from a 20k MT deficit in 2019. Bearish sentiment moved our Tactical Composite Indicator – which captures sentiment, positioning, and momentum dynamics – to oversold territories on in March (Chart 2). Chart of the WeekCopper Prices Were Severely Hit By The Pandemic
Speed Of Demand Recovery Remains Key To Copper Prices
Speed Of Demand Recovery Remains Key To Copper Prices
Chart 2Bearish Sentiment Crushes Copper Prices
Bearish Sentiment Crushes Copper Prices
Bearish Sentiment Crushes Copper Prices
After reaching a low of $2.11/lb on March 23, COMEX copper prices surged 18% with few interruptions as the Chinese economy reopened, and global monetary and fiscal authorities supplied unprecedented economic support (Chart 3). This prompted a wave of short-covering by money managers, releasing some of the downward pressure on prices (Chart 4). Chart 3Unprecedented Fiscal Response
Speed Of Demand Recovery Remains Key To Copper Prices
Speed Of Demand Recovery Remains Key To Copper Prices
Chart 4Money Managers Neutral For Now
Money Managers Neutral For Now
Money Managers Neutral For Now
Still, hedge funds have not yet entered bullish positions on the metal. And, importantly, inventory levels are not drawing sharply. China’s Economy Bottomed, World ex-China Still Contracting Our outlook hinges primarily on our assessment of China’s policy-driven copper demand – both from domestic usage perspective, and, to a lesser extent, from copper-intensive exported goods. Since the end of the Global Financial Crisis (GFC), copper prices have mostly shadowed China’s economic cycles (Chart 5). China’s importance for copper markets now dominates that of major DM countries (Chart 5, panel 3). The influence of global supply-demand fundamentals on copper prices has declined. Prices are increasingly policy-driven with supply adjusting to demand as dictated by Chinese policymakers’ decisions on the allocation of total social financing funds in that economy. Thus, our outlook hinges primarily on our assessment of China’s policy-driven copper demand – both from domestic usage perspective, and, to a lesser extent, from copper-intensive exported goods. According to the International Copper Study Group (ICSG), around 17% of Chinese copper demand comes from exports of products containing copper.1 In “normal” times, we rely heavily on our monthly indicators to gauge economic and commodity cycles. However, the speed with which the COVID-19 pandemic evolves – and the associated fiscal and monetary responses to it – makes short-term forecasting of cyclical commodities a perilous task. Chart 5DM Consumption Pales Vs. China
DM Consumption Pales Vs. China
DM Consumption Pales Vs. China
High-frequency data suggest Chinese economic growth bottomed in March and is rapidly recovering (Chart 6). Chart 6Chinese Economy Returning To Normal
Speed Of Demand Recovery Remains Key To Copper Prices
Speed Of Demand Recovery Remains Key To Copper Prices
Meanwhile in China’s major export destinations, the number of confirmed COVID-19 cases appear to be flattening, containment measures are gradually easing, and mobility is improving (Chart 7, panel 1 and 2). Globally, the copper- and oil-to-gold ratios have stabilized, and stock prices for nine of the largest copper producers have trended up since March 23 (Chart 7, panel 3 and 4). That said, we believe it is still too early to adopt a high-conviction view about a price recovery trajectory. For one, China recently reintroduced containment measures in certain regions, as clusters of coronavirus cases were detected, highlighting the fragility of the current recovery.2 Chart 7China's Major Export Partners Could Rebound Soon
China's Major Export Partners Could Rebound Soon
China's Major Export Partners Could Rebound Soon
Chart 8Strong Domestic Demand, Weak Export Growth
Strong Domestic Demand, Weak Export Growth
Strong Domestic Demand, Weak Export Growth
Moreover, the rebound in overall Chinese demand hasn’t fully offset the collapse in its exports. As a result, the reopening of the supply side of the economy outpaced demand growth (Chart 8). Extrapolating this to its copper market: Chinese refined copper production (40% share of world output) is facing robust domestic demand but weak export demand for copper (44% and 9% of world demand), leaving its market with a supply surplus. Nonetheless, absent a severe second wave of COVID-19 cases, the infrastructure-focused stimulus and market-friendly real estate policies in the country will allow internal demand to overtake production in 2H20, despite limited external demand (more on this below). China’s Credit Growth To Drive Copper Demand Higher The key message emerging from the NPC is that policymakers are willing to do whatever it takes – including abandoning their deleveraging objectives – to reflate the economy. Markets were unimpressed by the fiscal package announced during China’s National People’s Congress (NPC) last month, which, for the first time in decades, did not contain an annual economic growth target in the Government Work Report (Table 1). Even so, the key message emerging from the NPC is that policymakers are willing to do whatever it takes – including abandoning their deleveraging objectives – to reflate the economy. Broad money and total social financing growth will accelerate relative to last year and notably exceed nominal GDP growth. Our Emerging Markets strategists expect China’s fiscal and credit impulse will reach 15.5% this year (Chart 9).3 Table 1No Economic Growth Target In The Government Work Report
Speed Of Demand Recovery Remains Key To Copper Prices
Speed Of Demand Recovery Remains Key To Copper Prices
Additionally, China pledged to stabilize employment and targeted the creation of 9 million new jobs in urban areas. This is an ambitious target amidst the massive layoffs induced by the COVID-19 pandemic this year. Chart 9Chinese Credit Growth Will Surge
Chinese Credit Growth Will Surge
Chinese Credit Growth Will Surge
Policymakers also reserved policy space to be used – without the approval of the NPC at the Politburo’s mid-year review – in the event the shock from the pandemic proves persistent.4 Past episodes of Chinese stimulus resulted in strong rallies in base metals prices. Given China now represents more than half of global copper consumption (vs. 43% in 2009 following the GFC, and 32% in 2012 following the euro area debt crisis), we expect this new round of stimulus will lead to a sharp increase in copper prices.5 By and large, refined copper prices are highly sensitive to growth in EM imports – particularly China’s – which are closely tied to income growth. The latest CPB World Trade Monitor data for March shows EM ex-China imports have been resilient suggesting the rebound in China’s economic activity might be spilling over to other EMs highly leveraged to China (Chart 10). Still, our main cyclical commodity demand indicators were declining as of April. We expect stimulus-driven EM income and investment growth will show up in our indicators in 2H20 (Chart 10). Chart 10Awaiting A Rebound In Our Cyclical Indicators
Speed Of Demand Recovery Remains Key To Copper Prices
Speed Of Demand Recovery Remains Key To Copper Prices
Stalling Primary And Secondary Supply Growth In addition to the demand implications, lockdowns also resulted in restrictions – and few complete shutdowns – in mining activities in copper-producing countries. The ICSG revised down its global mine and refined copper output by 950k MT and 1.1mm MT, respectively, for this year on the back of the COVID-19 pandemic.6 The group now expects 2020 mine supply to decline by 3% this year and refined production to remain flat y/y, for a second consecutive year. While important, these adjustments were insufficient to completely offset the large negative demand shock in 1Q and 2Q20.7 In 2H20, the supply-side outlook rests on the evolution of COVID-19 cases and associated governments’ responses in major ore and refined copper-producing countries (i.e. Chile, Peru, US, DRC, China, Russia, and Japan). So far, mining activities were mostly treated as essential and allowed to operate at reduced capacity under additional sanitary and social distancing guidelines. Confirmed cases in these countries appears to be slowing, this could allow activity to slowly return to normal (Chart 11). Chart 11Further Supply Disruptions Are Unlikely
Speed Of Demand Recovery Remains Key To Copper Prices
Speed Of Demand Recovery Remains Key To Copper Prices
Supply factors are for the most part reflected in current prices. Going forward the speed of the demand recovery will be the determining factor for copper prices. While mining and refining of copper concentrates were often classified as essential, scrap activities were not. According to the ICSG, copper scrap supplied decreased significantly as trade flows and generation, collection, and disassembling activities were disrupted by the pandemic. China’s import of scrap copper – a key input for Chinese refiners – declined 37% in 1Q20. This prompted the government to allow more scrap imports to fill the gap, but it might struggle to find suppliers. Globally, scrap makes up ~ 25% of total refined copper supply, thus, it usually plays a non-negligible role in the rebalancing of global markets. Supply factors are for the most part reflected in current prices. Going forward the speed of the demand recovery will be the determining factor for copper prices. In addition, the crisis began at an abnormally low inventory level. Thus, despite the temporary build in 1Q20, inventories are still below their 2010 to 2019 average. The rebound in demand, combined with flat supply and limited scrap availability, will move Chinese inventory down in 2H20 and offset any builds at the LMEX and COMEX warehouses, supporting copper prices this year (Chart 12). Chart 12Inventories Still Low Despite Builds In 1Q20
Inventories Still Low Despite Builds In 1Q20
Inventories Still Low Despite Builds In 1Q20
USD Depreciation Leads To EM Economic Growth Uncertainty over the duration of lockdowns globally continues to fuel safe-haven demand for USD. As the COVID-19 shock abates we expect a weaker US dollar to be more supportive to copper demand. Uncertainty over the duration of lockdowns globally continues to fuel safe-haven demand for USD (Chart 13). The shortage of USD experienced by EM debtors servicing dollar-denominated debt continues to hamper their recovery. The combination of safe-haven demand and a continued dollar shortage for borrowers without access to US swap lines is keeping the dollar well bid, suppressing foreign flows to EM economies and commodity demand at the margin (Chart 14, panel 1). Chart 13Global Financial Cycles Hurting EM Economies
Speed Of Demand Recovery Remains Key To Copper Prices
Speed Of Demand Recovery Remains Key To Copper Prices
Chart 14Uncertainty Keeps USD Well Bid
Uncertainty Keeps USD Well Bid
Uncertainty Keeps USD Well Bid
The Fed will continue to accommodate USD demand, in an ongoing attempt to reverse a tightening of global financial conditions. EM economies – the bulk of base metals demand growth – are facing dual domestic demand and global financial shocks.8 These economies have become more dependent on foreign portfolio inflows, both in debt and equity markets (Chart 14, panel 2). Thus, global financial cycles now have a significant impact on their growth. The main factors influencing these flows are risk appetite, EM exchange rates, and DM interest rates.9 We expect all factors to support inflows to emerging markets as the COVID-19 shock abates. The Fed will continue to accommodate USD demand, in an ongoing attempt to reverse a tightening of global financial conditions. A lower USD will decrease the local-currency cost of consuming commodities ex-US. Metals producers' ex-US will face higher local-currency operating costs, reducing supply growth at the margin. A depreciating USD is a necessary factor for our bullish cyclical commodities view (Chart 15). The risk to this view is a severe second wave of COVID-19 infection which would cause safe assets to spike anew. Chart 15Metals Inversely Correlated With The US Dollar
Metals Inversely Correlated With The US Dollar
Metals Inversely Correlated With The US Dollar
$3.00/lb Copper Price Likely; Geopolitical Risks Mounting Over the short term, geopolitical risks – chiefly mounting Sino-US tensions – could derail the rally in copper prices and other risk assets. For April, our copper demand model suggested prices were at equilibrium relative to underlying demand trends (Chart 16). Chart 16Copper Prices Will Rise As The USD Depreciates
Copper Prices Will Rise As The USD Depreciates
Copper Prices Will Rise As The USD Depreciates
When simulating a 10% decline in the USD and a rebound in EM import growth in 2H20, our model suggests COMEX copper prices could move 25% higher, holding everything else constant. In reality, the USD’s path and the extent of the EM import rebound are among the key known unknowns we confront in estimating a model for copper prices. We do not have a precise view on these variables, which is why we run simulations. Theory would suggest the stimulus we are seeing globally points to a lower USD and a pick-up in EM imports, however, and these factors will create a more supportive environment for metals prices. Over the short term, geopolitical risks – chiefly mounting Sino-US tensions – could derail the rally in copper prices and other risk assets. With the US election now only 5 months away, President Trump’s odds of being reelected on the back of a strong economy are fading amidst the COVID-19 pandemic. According to our Geopolitical strategists, Trump is the underdog and will need to double down on foreign and trade policies to prop-up his chances of winning. Meanwhile, China is seeking to solidify its sphere of influence.10 This is causing US-China tensions to intensify. Depending on the nature of the actions taken by the Trump administration (i.e. increasing tariffs on US imports of Chinese goods vs. cutting China’s access to foreign technology), metals prices could suffer, as was the case in 2018. With these geopolitical risks in mind, we maintain that China’s strong fiscal and monetary stimulus, combined with a falling US dollar will provide a favorable backdrop for copper markets in 2H20. Hugo Bélanger Senior Analyst Commodity & Energy Strategy HugoB@bcaresearch.com Robert P. Ryan Chief Commodity & Energy Strategist rryan@bcaresearch.com Commodities Round-Up Energy: Overweight Doubts about OPEC 2.0’s commitment to extending their deepest-ever production cuts expiring this month to July, perhaps August, took some of the steam out of crude-oil rally earlier in the week. In our modeling, we do not see the need to extend the massive voluntary cuts announced by the Kingdom of Saudi Arabia (KSA) and its Gulf allies: KSA’s cuts of ~ 4.5mm b/d vs. its April output level of 12mm b/d starting this month will take the Kingdom’s output to ~ 7.5mm b/d. The UAE and Kuwait also voluntarily added cuts of 100k and 80k b/d, respectively, to their agreed quotas. We continue to believe the current schedule of production cuts will result in a physical supply deficit in 3Q20, which will require OPEC 2.0 to begin raising production to keep prices from getting too high going into a US presidential election. We expect Brent prices to average $40/bbl this year and $68/bbl next year, with WTI trading $2 - $4/bbl below that (Chart 17).11 Base Metals: Neutral Iron ore prices breached $100/MT this week, as COVID-19-induced supply disruptions in Brazil – the largest exporter of high-grade ore – and South Africa leave the seaborne market open to Australian suppliers to meet higher Chinese demand as port inventories are rebuilt. FastMarkets MB, a sister company of BCA Research, reported May exports to China from Brazil were down 28% y/y to 21.5mm MT from just under 30mm MT the year prior. Iron ore exports from Australia are expected to exceed A$100 billion this year, according to government estimates reported by the Financial Times.12 Precious Metals: Neutral As we go to press, gold prices retreated to $1,700/oz from ~ $1,740/oz last week, exhibiting a positive correlation with the dollar. This is a result of rising risk appetite globally as economies exit lockdowns. In the US, interest rates are continuing to support gold. Going forward, the probability of negative rates is remains low, but the Fed will continue to buy more debt from the public and private sectors to push the shadow rate further down. This supports gold prices (Chart 18). Chart 17Crude Prices Will Rebound
Crude Prices Will Rebound
Crude Prices Will Rebound
Chart 18Fed Buying Supports Gold Prices
Fed Buying Supports Gold Prices
Fed Buying Supports Gold Prices
Footnotes 1 Please see “The Impact of the COVID-19 Pandemic on World Copper Supply,” published by the International Copper Study Group on May 21, 2020. 2 A resurgence of infection triggered renewed lockdowns over a region of 100 million people in May. Please see More than 100 million people in China's northeast back under lockdown to thwart potential second wave published by the National Post on May 19, 2020. 3 Please see BCA's Emerging Markets Strategy Weekly Report "EM Stocks Are At A Critical Resistance Level," published May 28, 2020. It is available at ems.bcaresearch.com. 4 Please see BCA's China Investment Strategy Weekly Report "Taking The Pulse Of The People’s Congress," published May 28, 2020. It is available at cis.bcaresearch.com. 5 There remains a risk global monetary stimulus fails to ignite strong consumer and business consumption. The unprecedented shock could raise precautionary savings and keep risk aversion elevated for an extended period. Based on the Quantity Theory of Money, money supply times velocity (the rate at which money changes hands) equals nominal GDP. Low confidence translates to a low velocity of money limiting the reach of monetary policy. This value is extremely difficult to forecast. 6 Please see “The Impact of the COVID-19 Pandemic on World Copper Supply,” published by the International Copper Study Group on May 21, 2020. 7 According to BGRIMM Lilan Consulting, China’s real demand for refined copper declined by ~22% in 1Q20. This implies a ~11% decline in global copper consumption. Please see footnote 6 for more details. 8 Global financial cycles capture how global financial conditions affect individual economies. The analysis of these cycles stressed the importance of common factors in global risk asset prices which are driven by risk appetite and US monetary policy. These factors are mainly explained by developments in advanced economies but have a drastic effect on emerging markets. Please see Iñaki Aldasoro, Stefan Avdjiev, Claudio Borio and Piti Disyatat (2020). “Global and domestic financial cycles: variations on a theme,” BIS Working Papers, No 864. 9 Please see Chapter 3 of the Global Financial Stability Report titled “Managing Volatile Portfolio Flows,” published by IMF. 10 Please see BCA's Geopolitical Strategy Weekly Report "Spheres Of Influence (GeoRisk Update)," published May 29, 2020. It is available at gps.bcaresearch.com. 11 Please see our May 21, 2020 report entitled US Politics Will Drive 2H20 Oil Prices for our latest view on oil fundamentals and prices, available at ces.bcaresearch.com. 12 Please see Australia’s iron ore miners exploit supply gap as Covid-19 hobbles rivals published by the Financial Times June 3, 2020. Investment Views and Themes Recommendations Strategic Recommendations Tactical Trades Trade Recommendation Performance In 2020 Q1
Speed Of Demand Recovery Remains Key To Copper Prices
Speed Of Demand Recovery Remains Key To Copper Prices
Commodity Prices and Plays Reference Table Trades Closed in 2020 Summary of Closed Trades
Speed Of Demand Recovery Remains Key To Copper Prices
Speed Of Demand Recovery Remains Key To Copper Prices
Highlights Risks assets have entered a FOMO-driven mania phase that could last for a few more weeks. Markets are ignoring the particularities of this recession and are treating the post-lockdown activity snapback as a V-shaped recovery. A weaker than expected global recovery and rising geopolitical tensions between the US and China are the two primary risks that will weigh on EM risk assets after this mania phase runs out of steam. We are upgrading EM sovereign and corporate credit from underweight to neutral within a global credit portfolio. Within EM, local rates will perform well in both risk-on and risk-off phases. Feature The recovery in global risk assets has entered a fear-of-missing-out, or FOMO, mania phase. Like any mania, this one could last longer and go further than any fundamental analysis could presume. Investors who are long or cannot afford to stay on the sidelines should play this rally with tight stop points. Investors with longer time horizon should wait for a pullback in EM equities and currencies to buy. Within EM, local rates offer the best risk-reward profile. A recovery in global trade and mainland industrial sectors is necessary for EM equities and currencies to rally on a sustainable basis. The global equity rally has taken place amid a shrinking forward EPS. The top panel of Chart I-1 demonstrates that even the ever-bullish bottom-up analysts have been cutting their expectations of the level of corporate 12-month forward earnings per-share. As a result, the global forward P/E ratio has spiked to a 18-year high (Chart I-1, bottom panel). Chart I-1An Unprecedented Divergence: Surging Stocks Prices Amid Plunging Forward EPS Levels
An Unprecedented Divergence: Surging Stocks Prices Amid Plunging Forward EPS Levels
An Unprecedented Divergence: Surging Stocks Prices Amid Plunging Forward EPS Levels
Chart I-2EM Forward EPS Level Has Been Falling
EM Forward EPS Level Has Been Falling
EM Forward EPS Level Has Been Falling
Chart I-2 illustrates that the same phenomenon is true for EM equities. Their forward EPS has been contracting and their forward P/E has jumped to a decade high. Any overdrive in asset prices without supporting fundamentals can last for a while but typically ends with a crash. This FOMO-driven mania is unlikely to be any different. It is fair to say that during the March carnage, many investors operated on a “sell now, think later” principle. Since the rally began, they have switched to a “buy now, ask questions later” attitude. As this rally persists, global stocks and credit will become overbought and expensive. At that point, any negative shock could produce a sharp pullback that would likely devolve into another nasty selloff as investors shift back to a “sell now, think later” mentality. The Narratives Driving The Rally The narratives supporting this mania are simple and seem to be both accepted and embraced by a growing number of investors. We agree with some and disagree with others: Economies around the world are opening, which will ensure that an economic recovery will follow. Our interpretation: Surely as confinement policies are eased, activity will improve. However, in our opinion, this should not come as a surprise to investors. This is especially pertinent for the trend-setting US stock market. With US equity valuations not particularly cheap, the market was never pricing in extended lockdowns. Hence, it appears strange to us that markets have so exuberantly cheered the reopening of the economy. Looking forward, the key to the medium-term (six-month) equity outlook is the shape of the recovery following the initial partial normalization. The latter presently looks V-shaped because as stores and businesses reopen economic activity is bound to improve. Yet the odds are that following this initial normalization, the shape of the recovery is most likely to be U-shaped. For what it’s worth, manufacturing PMIs in export-oriented economies like Korea, Japan and Taiwan made new lows in May (Chart I-3). We are not suggesting these indicators will not improve in the months ahead; they surely will. Nevertheless, a marginal rise in diffusion indexes like PMIs from extraordinary depressed levels do not signify a profit recovery. This recession differs from previous ones as the level of business activity has dropped below breakeven points for more businesses than it did in other recessions. When a company operates below its breakeven level, a marginal rise in sales may not be sufficient to improve its debt-servicing capacity, hiring and capital spending intentions. However, it seems markets are ignoring the particularities of this recession and are treating the post-lockdown activity snapback as a V-shaped recovery. This is why we feel risk assets are in a FOMO-driven mania phase, where fundamentals do not matter. Authorities around the world are stimulating, with the US pumping enormous amounts of fiscal and credit stimulus into the economy (Chart I-4, top panel). Chart I-3Asian Manufacturing PMIs Made New Lows In May
Asian Manufacturing PMIs Made New Lows In May
Asian Manufacturing PMIs Made New Lows In May
Chart I-4An Unparalleled Global Money Boom
An Unparalleled Global Money Boom
An Unparalleled Global Money Boom
Chart I-5China Is Ramping Up Stimulus
China Is Ramping Up Stimulus
China Is Ramping Up Stimulus
China has finally embarked on aggressive stimulus. The National People’s Congress has set the monetary policy objective for 2020 as follows: Substantially accelerate the growth of broad money supply and total social financing (Chart I-4, bottom panel). Our interpretation: Indeed, government stimulus worldwide is massive. Yet, it is hard to know if it will be sufficient to produce a V-shaped recovery. The rise in money supply at the moment is being offset by the drop in the velocity of money. As a result, nominal GDP levels are extremely low. That said, last week we upgraded our growth outlook for China because of the above-mentioned aggressive policy stimulus. It is possible that China’s credit and fiscal impulse will reach about 15% of GDP before year-end (Chart I-5). What presently deters us from recommending outright long positions in China-related plays is the escalating US-China confrontation and the risk of a relapse in global stocks. Central banks around the world both in DM and EM are monetizing debt and injecting immense liquidity into the system. Our interpretation: Correct, but equally relevant is investors’ animal spirits. The latter will determine whether and when these liquidity injections leak into risk assets. For now, it seems that once again central banks’ actions have been successful in lifting asset prices, despite poor fundamentals. Equity valuations are cheap, especially outside the US. This is especially true given the low risk-free rate. Our interpretation: We agree that EM equities are cheap, something we have been highlighting since mid-March (Chart I-6). Yet valuations are not a good timing tool, as they can stay depressed so long as profits are not worsening. Meanwhile, US equities are expensive (Chart I-7). Critically, we argued in a recent report that equity multiples depend not only on the risk-free rate but also on the equity risk premium (ERP). Chart I-6EM Equities Are Cheap
EM Equities Are Cheap
EM Equities Are Cheap
Chart I-7US Stocks Are Expensive
US Stocks Are Expensive
US Stocks Are Expensive
Given the immense ambiguities investors are facing with respect to both the business cycle and economic, political and geopolitical trends, the ERP should be at the upper end of its historical range. Hence, the discount factor – the sum of the risk-free rate and the ERP – should be reasonably high. In this context, US equity valuations are rather expensive, despite the very low risk-free rate. In short, the expensive US stock market has until very recently been the locomotive of this rally. If US share prices had not rallied hard in the past two months, EM and other international bourses would not have caught a bid. The Fed’s public debt monetization is a structural, not near-term negative for the greenback. The US dollar is expensive and will depreciate a lot due to unrestrained fiscal and monetary stimulus in the US. Our interpretation: The US dollar is one standard deviation expensive (Chart I-8) and EM currencies have become cheap (Chart I-9). Chart I-8US Dollar Valuations Are Elevated
US Dollar Valuations Are Elevated
US Dollar Valuations Are Elevated
Chart I-9EM Currencies Are Cheap
EM Currencies Are Cheap
EM Currencies Are Cheap
Chart I-10EM Currencies And Stocks Correlate With Industrial Metals
EM Currencies And Stocks Correlate With Industrial Metals
EM Currencies And Stocks Correlate With Industrial Metals
We do not disagree with the view that the US dollar is vulnerable in the long term due to the Federal Reserve’s aggressive debt monetization and that the Fed will eventually fall behind the inflation curve. Yet inflation is not imminent, and the Fed’s public debt monetization is a structural, not near-term negative for the greenback. As such, these potholes for the US dollar may not be pertinent in the next several months. Critically, Chart I-10 illustrates that EM currencies move with industrial metals prices, and EM stocks correlate with global materials stocks. The common driver of all of these markets is global growth in general and China’s industrial sectors in particular. In short, a recovery in global trade and mainland industrial sectors is necessary for EM equities and currencies to rally on a sustainable basis. Investors are underinvested in global equities in general and cyclical plays in particular. Our interpretation: Indeed, we showed last week that institutional equity investors had been skeptical of this rally. What has driven or supercharged this equity rally since late March has been unsophisticated retail investors. They have been opening up broker accounts worldwide and aggressively trading since March lockdowns. We cited a few pieces of anecdotal evidence confirming this phenomenon in last week’s report. However, it seems that institutional investors in recent weeks have capitulated by raising their risk exposure in general and their exposure to cyclical plays in particular. This explains the recent surge in cyclical equities and currencies. Bottom Line: The narratives driving this rally are only partially correct. Markets are ignoring the particularities of this recession and are treating the post-lockdown activity snapback as a V-shaped recovery. A weaker than expected global recovery and rising geopolitical tensions between the US and China are the two primary risks that will weigh on EM risk assets after this FOMO-driven mania phase runs out of steam. Nuances To Beware Of There are several nuances about the market’s internals and characteristics that we would like to draw investors’ attention to: There is mixed evidence as to whether China’s economy in general and its industrial sectors in particular have entered a sustainable recovery. First, examining the Taiwanese manufacturing PMI data could help in assessing the growth outlook for both the mainland economy and for global trade. The basis is that Taiwan has done extremely well by avoiding COVID-19 outbreaks and lockdowns. Therefore, there are no domestic reasons for weak output growth. In addition, its manufacturing sector is very export-oriented, with about 40% of exports destined for mainland China. PMI export orders for Taiwan's aggregate manufacturing and its three key sectors plunged to new lows in May (Chart I-11). This includes both the electronic optical (semiconductor) and basic materials sectors. The latter correlates well with global materials stocks. There has so far not been a bullish signal from this indicator (Chart I-11, second panel). Second, China’s domestic A-share market in general and its cyclical sectors in particular have not yet broken out (Chart I-12). Given China was the first nation to exit from lockdowns, its share prices should be the first to signal a sustainable economic recovery. Yet onshore share prices have been rather subdued. China’s economy will eventually stage a recovery later this year. Our point is that global cyclicals might have run ahead of themselves by pricing in a recovery too early. Chart I-11Taiwanese Manufacturing PMIs In May: New Lows Across All Industries
Taiwanese Manufacturing PMIs In May: New Lows Across All Industries
Taiwanese Manufacturing PMIs In May: New Lows Across All Industries
Chart I-12Chinese Onshore Share Prices Are Not Flagging An Imminent Recovery
Chinese Onshore Share Prices Are Not Flagging An Imminent Recovery
Chinese Onshore Share Prices Are Not Flagging An Imminent Recovery
Equity market and sector leadership changes occur during selloffs or at the inception of rallies. Chart I-13 illustrates EM relative stock prices versus DM along with the global equity index. Over the past 25 years, there have been several major leadership changes between EM and DM. And all of them occurred during selloffs in global share prices. Chart I-13EM Versus DM Equity Leadership Rotations Took Place During Selloffs
EM Versus DM Equity Leadership Rotations Took Place During Selloffs
EM Versus DM Equity Leadership Rotations Took Place During Selloffs
Similarly, the relative performance of global growth versus value stocks experiences trend reversals during global bear markets (Chart I-14). Chart I-14Global Growth Versus Value Leadership Rotations Occurred During Bear Markets
Global Growth Versus Value Leadership Rotations Occurred During Bear Markets
Global Growth Versus Value Leadership Rotations Occurred During Bear Markets
Chart I-15EM Could Outperform DM For A Few Weeks
EM Could Outperform DM For A Few Weeks
EM Could Outperform DM For A Few Weeks
Leadership of US equities and global growth stocks did not change during the March crash nor during the following two-month rally from the bottom. Only in the past week or so have US equities and global growth stocks begun to lag EM bourses and global value, respectively (Chart I-15). In brief, the latest leadership rotation from US to EM did not occur during the selloff or at inception of the rally – i.e., it does not fit the typical profile of sustainable leadership reversal. As such, it may not be enduring. The internals of this rally are consistent with the fact that it might already be at a late stage. During rallies, laggards are the last to catch a bid. Contrarily, during selloffs, outperformers are the last to be liquidated. For example, US growth stocks were the last ones to be liquidated in both the 2015-early-2016 and 2018 selloffs. When the decade-long leaders – US growth stocks – were finally stamped out, it marked the bottom of those selloffs. We are upgrading EM sovereign and corporate credit from underweight to neutral within a global credit portfolio. The Fed’s purchases of US bonds will likely continue pushing investors into EM credit markets. Using an analogous framework for this rally, the latest extraordinary spike in the laggards such as EM, Europe and both value and cyclical stocks could be a sign of bear capitulation, and could signify the final phase of this equity rally. Bottom Line: There are several nuances to the current equity market rally, but investors seem reluctant to consider them amid a FOMO-driven mania. Investment Considerations The FOMO-driven rally could last for several more weeks. Afterwards it will be followed by a major setback. Investors who are long or cannot afford to stay on the sidelines should play this rally with tight stop points. Investors with longer time horizon should wait for a pullback in EM equities and currencies to buy. Chart I-16EM Local Rates Offer Value
EM Local Rates Offer Value
EM Local Rates Offer Value
We are making the following adjustments and changes to our strategy and trade recommendations: In regard to our EM versus DM asset allocation strategy, we are making one change: we are upgrading EM sovereign and corporate credit from underweight to neutral within a global credit portfolio. The Fed’s purchases of US bonds will likely continue pushing investors into EM credit markets. Consistently, we are closing two positions: (1) our short EM corporate and sovereign credit / long US investment-grade corporate bond trade; and (2) our long Asian investment-grade /short high-yield corporate bond trade. Within the EM credit space, we continue to favor sovereigns versus corporates – a strategy recommended on April 23. We are still reluctant to strategically upgrade EM stocks versus DM ones even though odds of EM outperforming DM stocks are high in the coming weeks. In light of the potential FOMO-driven rally, to protect profits we are closing the following two currency positions: Take profits on short BRL/long USD trade. It was initiated on November 29, 2019 and has produced a 19% gain. Book profits on short SGD/long JPY position. This recommendation has generated a 2.3% gain since its initiation on June 8, 2018. We are still maintaining shorts in the following EM currencies: CLP, ZAR, TRY, IDR, PHP and KRW. They could continue rallying in the near term but will relapse afterwards. We are also structurally short low beta currencies: the RMB and the Saudi riyal. Within EM, local rates offer the best risk-reward profile: they will perform well in both risk-on and risk-off phases. Real bond yields remain somewhat elevated in many EMs, as shown in Chart I-16. We continue to receive long-term rates in Mexico, Colombia, Russia, Ukraine, India, Pakistan, Malaysia, China and Korea, as well as 2-year rates in South Africa. Their central banks will reduce policy rates much further. In addition, several of these local bond markets will benefit from ongoing quantitative easing by their central banks. Arthur Budaghyan Chief Emerging Markets Strategist arthurb@bcaresearch.com Equities Recommendations Currencies, Credit And Fixed-Income Recommendations
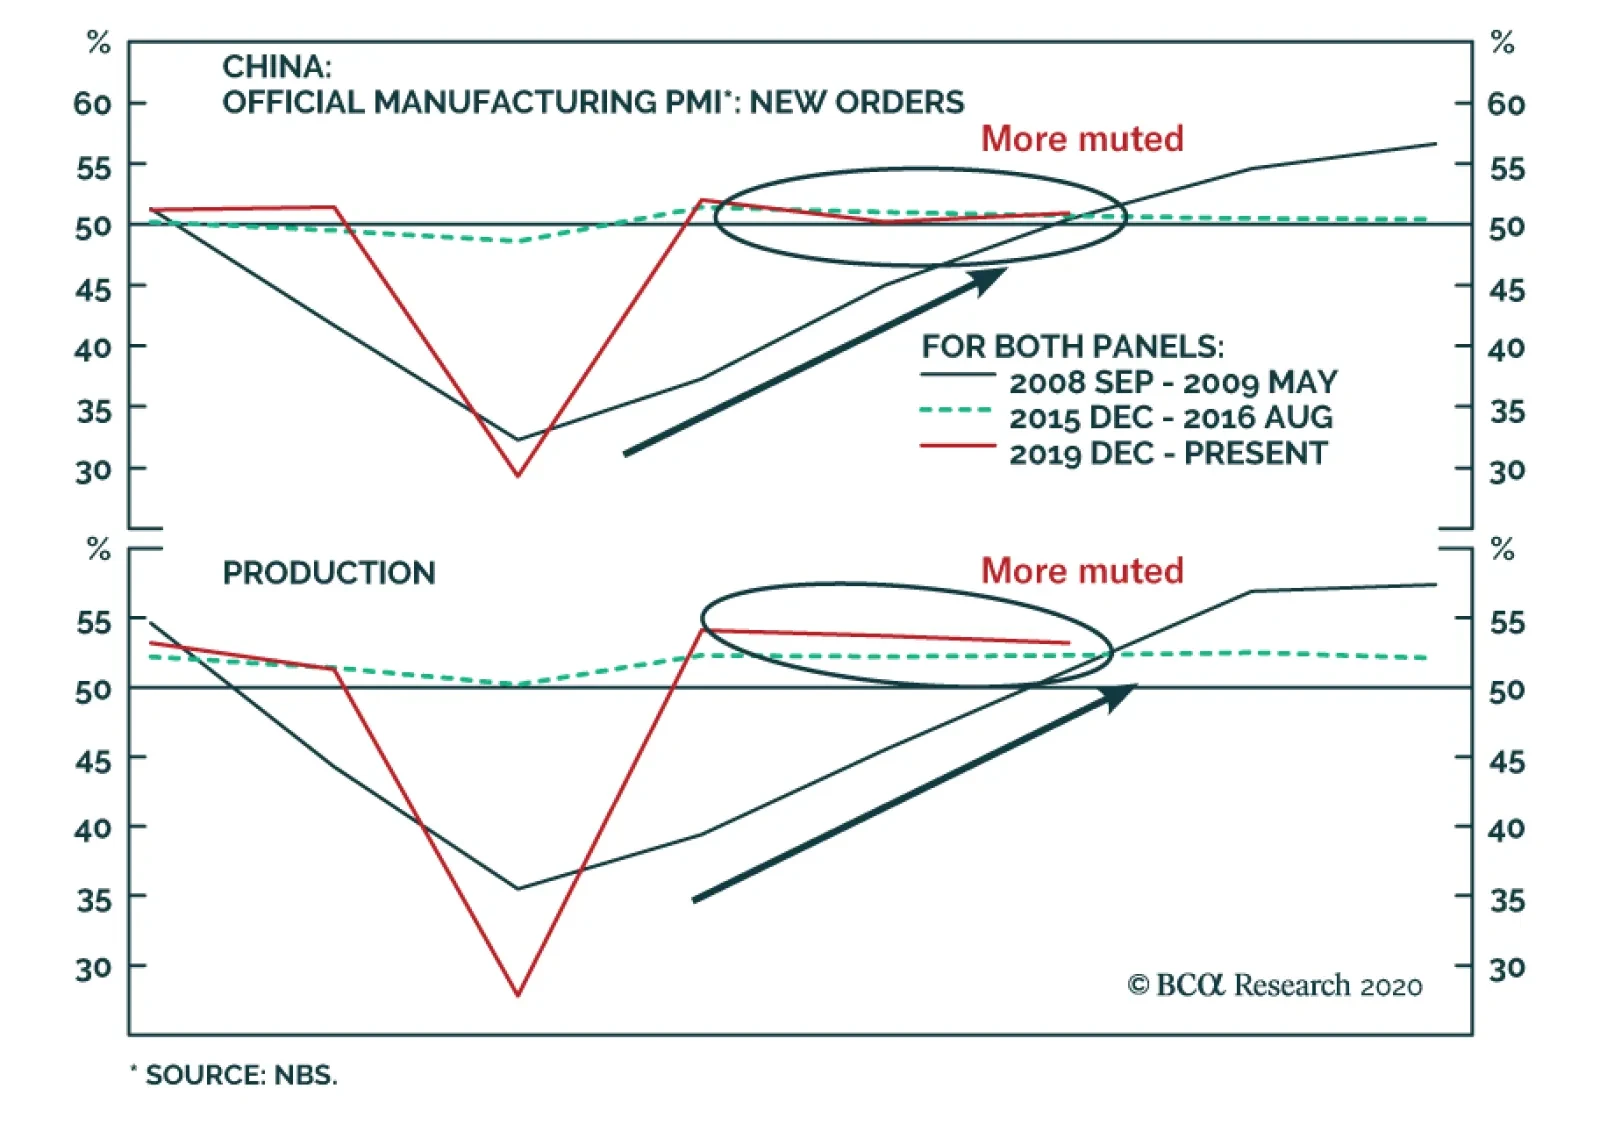
BCA Research's China Investment Strategy service shows that demand is struggling to outpace supply. China’s official manufacturing PMI slipped to 50.6 in May from 50.8 a month earlier. While the reading suggests that manufacturing activities are still in an…
Highlights The Chinese economy continues to recover, albeit less quickly than the first two months following a re-opening of the economy. The demand side of the Chinese economic recovery in May marginally outpaced the supply side, with a notable improvement concentrated in the construction sector. We are initiating two new trades: long material sector stocks versus the broad indices, in both onshore and offshore equity markets. Feature The recovery in China’s economy and asset prices has entered a “tapering phase”, in which the speed of the recovery is normalizing from a rapid rebound two months after the economy re-opened. The direction of the ultra-accommodative monetary and fiscal stance has not changed, but the aggressiveness in the stimulus impulse is abating as the recovery continues. As we highlighted in last week’s report, the announced stimulus at this year's NPC was less than meets the eye of investors.1 Chart 1A Quick Reversal In The Outperformance Of Chinese Stocks
A Quick Reversal In The Outperformance Of Chinese Stocks
A Quick Reversal In The Outperformance Of Chinese Stocks
Near-term downside risks in Chinese stocks were highlighted by last week’s quick reversal in the outperformance of Chinese equities relative to global benchmarks (Chart 1). As the US and European economies re-open and the stimulus impulse in major developed markets (DMs) is at peak intensity, Chinese stocks will underperform those in DMs, particularly US stocks. The re-escalation in Sino-US tensions will also add to the near-term volatility in Chinese equities. Therefore, we maintain our tactical (0-3 months) neutral view on aggregate Chinese equity indexes, in both domestic and offshore markets. Beyond Q2, however, our baseline view still supports an outperformance in Chinese stocks. The stepped-up stimulus measures since March should start to trickle down into the broader economy. Global business activities and demand will slowly normalize in the summer, helping to revive China’s exports. Moreover, an intensified pressure on employment, indicated in this month’s employment subcomponents in manufacturing and non-manufacturing PMIs, should prompt policymakers to roll out more growth-supporting measures in Q3. Tables 1 and 2 below highlight key developments in China’s economic and financial market performance in the past month. Table 1China Macro Data Summary
China Macro And Market Review
China Macro And Market Review
Table 2China Financial Market Performance Summary
China Macro And Market Review
China Macro And Market Review
Chart 2ASpeed Of Manufacturing Activity Recovery Has Moderated
Speed Of Manufacturing Activity Recovery Has Moderated
Speed Of Manufacturing Activity Recovery Has Moderated
China’s official manufacturing PMI slipped to 50.6 in May from 50.8 a month earlier (Chart 2A). While the reading suggests that manufacturing activities are still in an expansionary mode, the speed of the expansion has moderated compared with April and March. The supply side of manufacturing activities and employment were the biggest drags on May’s official PMI. The production subcomponent in the PMI decelerated whereas new orders increased from April (Chart 2A, bottom panel). The net result is an improved supply-demand balance in the manufacturing sector, however, the improvement is marginal. It also differs from the V-shaped recovery in 2008/09, when both new orders and production subcomponents grew simultaneously (Chart 2B). The demand side of the economy is still concentrated in the policy-driven construction sector. The rebound in construction PMI continues to significantly outpace that in manufacturing and non-manufacturing PMIs (Chart 2C, top panel). The construction employment sub-index ticked up by 1.7 percentage points in May, compared with a slowdown of 0.8 percentage points in manufacturing and 0.1 percentage points in non-manufacturing employment PMIs (Chart 2C, bottom panel). Chart 2BDemand Struggles To Outpace Supply
Demand Struggles To Outpace Supply
Demand Struggles To Outpace Supply
Chart 2CDemand Recovery Is Concentrated In Construction
Demand Recovery Is Concentrated In Construction
Demand Recovery Is Concentrated In Construction
While a buoyant construction sector should provide a strong tailwind to raw material prices and related machinery sales, a laggard recovery from other sectors means the upside potential in aggregate producer prices (PPI) will be limited in the current quarter. In May, there was a rebound in the PMI sub-indices measuring raw material purchase prices and ex-factory prices, which heralds easing in the contraction of PPI in Q2 (Chart 3). However, neither of the PMI price sub-indices has returned to levels reached in January, when PPI growth was last positive. Moreover, weaker readings in the purchases and raw material inventory subcomponents suggest that manufacturers may be reluctant to restock due to sluggish global trade and a lagging rebound in domestic demand (Chart 3, bottom panel). This month’s PMI shows that the employment subcomponents in both the manufacturing and non-manufacturing PMIs are contracting (Chart 4). Because demand for Chinese export goods remains sluggish, we expect unemployment in China’s labor-intensive export manufacturing sector to rise in Q2 and even into Q3. The intensified pressure on employment will likely prompt Chinese policymakers to roll out more demand-supporting measures. Chart 3PPI Contraction Will Ease But Upside Limited In Q2/Q3
PPI Contraction Will Ease But Upside Limited In Q2/Q3
PPI Contraction Will Ease But Upside Limited In Q2/Q3
Chart 4Employment In Trouble, A Catalyst For More Easing
Employment In Trouble, A Catalyst For More Easing
Employment In Trouble, A Catalyst For More Easing
The BCA Li Keqiang Leading Indicator rose moderately in April. A plunge in the Monetary Conditions Index (MCI) limited the magnitude of the indicator's increase, offsetting an uptick in money supply and credit growth (Chart 5). A rapid disinflation in headline consumer prices (CPI) since the beginning of this year has pushed up the real savings deposit rate, which contributed to the MCI’s nose-dive. In our view, the MCI’s sharp drop is idiosyncratic and does not signify a tightening in the PBoC’s monetary stance or overall monetary conditions. Huge fluctuations in food prices have been driving the headline CPI since March 2019, while the core CPI remains stable. While food prices historically have very little correlation with the PBoC's monetary policy actions, a disinflationary environment will provide the central bank more room for easing. Odds are high that the PBoC will cut the savings deposit rate for the first time since 2015. Chart 5Monetary Conditions Are Not As Tight As The Indicator Suggests
Monetary Conditions Are Not As Tight As The Indicator Suggests
Monetary Conditions Are Not As Tight As The Indicator Suggests
The yield curve in Chinese government bonds quickly flattened around the time of the National People’s Congress (NPC), with the short end of the curve rising faster than the long end (Chart 6). This is in keeping with our assessment that while the market is expecting the recovery to continue in China, it is unimpressed with the intensity of upcoming stimulus and monetary easing. Monetary easing seems to be taking a pause, but we do not think this indicates a change in the PBoC’s policy stance (Chart 7). Instead, weak global demand, slow recovery in the domestic economy and intensified pressure on domestic employment, all will incentivize policymakers to up their game by mid-year. As such, we expect the yield curve to steepen again in H2, with the short-end of the curve fluctuating at a low level and the 10-year government bond yield picking up when the economy gains traction. Chart 6The Bond Market May Be Incorrectly Pricing In A Monetary Tightening
The Bond Market May Be Incorrectly Pricing In A Monetary Tightening
The Bond Market May Be Incorrectly Pricing In A Monetary Tightening
Chart 7A Pause Before More Easing In June
A Pause Before More Easing In June
A Pause Before More Easing In June
The spread in Chinese corporate bond yields has dropped by more than 30bps from its peak in April. This is in line with that of major DM countries and a reflection of the easier liquidity conditions globally (Chart 8). We anticipate that the yield spreads in Chinese corporate bonds will continue to normalize. However, a flare in US-China tensions will put upward pressure on the financing costs of lower-rated corporations (Chart 8, bottom panel). The default rate among Chinese corporate bonds is unlikely to rise meaningfully this year, in light of ultra-accommodative monetary conditions and the Chinese government’s bailout programs to backstop corporate defaults. Chinese corporate bond defaults and non-performing loans historically have correlated with periods of financial sector de-leveraging and de-risking, other than during economic downturns. We continue to recommend investors hold China’s corporate bonds in the coming 6-12 months in a USD-CNH hedged term. Chart 8Financing Costs May Rise For Lower-Rated Corporations
Financing Costs May Rise For Lower-Rated Corporations
Financing Costs May Rise For Lower-Rated Corporations
Chart 9Cyclicals Are Struggling To Break Out
Cyclicals Are Struggling To Break Out
Cyclicals Are Struggling To Break Out
Among Chinese equities, cyclical sectors have struggled to outperform defensives in both onshore and offshore markets (Chart 9). This reflects investors’ concerns over the slow recovery in domestic demand and heightened geopolitical risk between the US and China. As such, we continue to favor domestic, demand-driven sectors among the cyclical stocks, such as consumer discretionary and construction-related materials. We upgraded consumer discretionary stocks from neutral to overweight on May 20, and we are now initiating two trades to long material sector stocks versus the broad markets in both the domestic and investable markets. The constituents of both China’s investable and domestic material sectors are highly concentrated in the metal and mining subsectors, which roughly account for half of the material sectors’ weight in the MSCI and MSCI A Onshore Indexes, respectively. Chart 10 highlights that the material sectors’ relative performance is highly correlated with CRB raw materials in both domestic and investable markets. Given that China’s credit cycles historically lead the CRB material index by about six months, China’s massive credit stimulus will boost CRB raw materials by end-Q2 and thus, the outperformance of the material sectors. The RMB has depreciated by almost 3% in the wake of a re-escalation in US-China frictions. The CNY/USD spot rate is approaching its weakest point reached in September 2019 (Chart 11). Furthermore, on May 29, the PBoC set the CNY/USD reference rate at its lowest level since 2008, a move that suggests defending the RMB is no longer in China’s interest. Downward pressure on the RMB will persist in the months leading up to the November US presidential election. The US economy is in a much more fragile state than in 2018/19, which may hinder President Trump’s willingness to resort to tariffs between now and November. However, we cannot completely roll out the probability that Trump will impose further tariffs on Chinese exports, if he is losing the election through weak public support and is removed from his financial and economic constraints. In any case, in the coming months CNY/USD exchange rate will likely continue to decouple from the economic fundamentals such as interest rate differentials (Chart 11, bottom panel). Instead, the exchange rate will be largely driven by market sentiment surrounding the US-China frictions. Volatility in CNY/USD will increase, but the overall trend in the CNY/USD will continue downwards as long as the escalation in US-China tensions persists. On a 6- to 12-month horizon, however, we expect that the depreciation trend in the RMB to moderately reverse as the Chinese economy continues to strengthen. Chart 10Material Sectors Should Benefit From The Stimulus And Construction Boom
Material Sectors Should Benefit From The Stimulus And Construction Boom
Material Sectors Should Benefit From The Stimulus And Construction Boom
Chart 11The CNY/USD Will Continue To Decouple From Interest Rate Differentials
The CNY/USD Will Continue To Decouple From Interest Rate Differentials
The CNY/USD Will Continue To Decouple From Interest Rate Differentials
Qingyun Xu, CFA Senior Analyst qingyunx@bcaresearch.com Jing Sima China Strategist jings@bcaresearch.com Footnotes 1 Please see China Investment Strategy Weekly Report "Taking The Pulse Of The People’s Congress," dated May 28, 2020, available at cis.bcaresearch.com Cyclical Investment Stance Equity Sector Recommendations
Feature The key to how markets will move over the coming 12 months is whether the coronavirus pandemic turns out to be a short-term (albeit severe) disruption to the world economy, or something more fundamentally damaging. Markets currently – with global equities up by 34% since March 23 – are clearly pricing in the former. They seem to be saying that the sudden stop to the economy – with US employment, for example, rising to a post-war high in just two months (Chart 1) – is not a problem, since most of the unemployed are furloughed and will quickly return to work once businesses reopen. Enormous stimulus (direct fiscal spending in G20 countries of 4.6% of GDP, even if loans and guarantees are excluded – Chart 2) and aggressive monetary policy (major central banks’ balance sheets have ballooned by $4.7trn since March – Chart 3) will tide us over until normality returns, and then provide a big boost to risk assets. Unprecedented efforts by drugs companies will soon produce a vaccine against COVID-19. Recommended Allocation
Monthly Portfolio Update: Disruptive Or Damaging?
Monthly Portfolio Update: Disruptive Or Damaging?
Chart 1Can Unemployment Come Down As Quickly?
Can Unemployment Come Down As Quickly?
Can Unemployment Come Down As Quickly?
Chart 2Unprecedented Fiscal…
Monthly Portfolio Update: Disruptive Or Damaging?
Monthly Portfolio Update: Disruptive Or Damaging?
Chart 3...And Monetary Stimulus
...And Monetary Stimulus
...And Monetary Stimulus
All this is possible. Certainly, the amount of excess liquidity being pumped into the economy by central banks (Chart 4) could dramatically boost economic activity and asset prices once the world returns to normal. The newsflow over coming months may largely be positive, with a gradual easing of lockdowns, a rebound in economic data (it cannot mathematically get any worse), and an abatement of the pandemic during the northern hemisphere summer. Many investors remain pessimistic (Chart 5) and so may be pulled into markets if stocks continue to rise. In this environment – and with the alternatives so unattractive (10-year US Treasurys at 0.6% anyone?) – we wouldn’t want to take a bet against equities. Chart 4Liquidity Will Boost Assets - Eventually
Liquidity Will Boost Assets - Eventually
Liquidity Will Boost Assets - Eventually
But is the market ignoring the risks? Easing of lockdown could lead to a flare-up of new COVID-19 cases: China has already had to reintroduce some containment measures when this happened (Chart 6). Chart 5Retail Investors Remain Bearish
Retail Investors Remain Bearish
Retail Investors Remain Bearish
Chart 6What Happens When Lockdowns Are Eased?
Monthly Portfolio Update: Disruptive Or Damaging?
Monthly Portfolio Update: Disruptive Or Damaging?
While COVID-19 cases have peaked in Asia, Europe, and North America, there is a new wave in Emerging Markets, particularly those such as Brazil which were lax in implementing containment measures (Chart 7). Even where the pandemic has waned, consumers seem highly reluctant to go to restaurants (Chart 8) or fly on airplanes (Chart 9). Chart 7The Pandemic Is Shifting To Emerging Economies
The Pandemic Is Shifting To Emerging Economies
The Pandemic Is Shifting To Emerging Economies
Consumer-facing companies may no longer see revenues down by 70% or 80% over the next few months, but they could still be 10% or 20% below normal levels. How many business models are robust enough to survive that? As for a vaccine, it is worth remembering that no vaccine has ever been developed for a coronavirus in humans. We may have to learn to live with the disease. Chart 8Consumers Are Not Yet Going To Restaurants...
Consumers Are Not Yet Going To Restaurants...
Consumers Are Not Yet Going To Restaurants...
Chart 9…Or On Planes
Monthly Portfolio Update: Disruptive Or Damaging?
Monthly Portfolio Update: Disruptive Or Damaging?
The longer the pandemic lasts, the more damaging will be its second-round effects. Already banks are turning more cautious about lending (Chart 10), and rating agencies are rapidly downgrading companies (Chart 11). We are likely to see a wave of corporate defaults, Emerging Market borrowers struggling to service their foreign-currency debts, and banks getting into trouble as a result – though monetary and fiscal bridging programs may defer these problems for a while. Chart 10Banks Are Turning More Cautious...
Banks Are Turning More Cautious...
Banks Are Turning More Cautious...
Chart 11...And Companies Are Being Downgraded
...And Companies Are Being Downgraded
...And Companies Are Being Downgraded
The US/China relationship is also a concern in the run-up to November’s US presidential election. It will be tempting for President Trump to turn tough on China, a policy that could be popular with the US electorate, which has become more anti-China in recent months (Chart 12). Problems over Hong Kong, China failing to hit the import targets it promised in January’s trade agreement, and action against Huawei (whose license expires in mid-August) mean that the conflict could escalate quickly. China would also much prefer Joe Biden as US president, and will do nothing to help President Trump get reelected. Chart 12Being Tough On China Is Popular In The US
Monthly Portfolio Update: Disruptive Or Damaging?
Monthly Portfolio Update: Disruptive Or Damaging?
Chart 13The Dollar Has Not Reacted To The Risk-On Rally
The Dollar Has Not Reacted To The Risk-On Rally
The Dollar Has Not Reacted To The Risk-On Rally
In this environment of unusual uncertainty, we continue to leaven our benchmark-weight position in global equities with relatively cautious tilts: overweight the lower-beta US market and structural-growth sectors such as Healthcare and Tech. We maintain our large position in cash, and would continue to hold gold as a hedge against tail risks. The risk to this view is that over coming months – if the environment continues to stabilize – there is a vicious rotation into pure cyclical plays, perhaps driven by a fall in the US dollar (which has until recently been surprisingly stable during the past two months’ risk-on rally – Chart 13), a rise in commodity prices, and higher long-term interest rates. This scenario would trigger outperformance by Emerging Markets and eurozone stocks, and value-oriented sectors such as Materials and Financials. This might be possible for a short period but, given the risks highlighted above, we would not recommend long-term investors to shift their portfolios in this direction. Equities: Our “minimum volatility” approach has worked well: US equities and structural growth sectors such as Healthcare and Tech continued to outperform both during the sell-off in February and March and in the subsequent rebound (Chart 14). For now, we prefer to stick to this cautious stance on a 12-month investment horizon. It is possible, though, that there could be some short-term rotation into value and small cap stocks if the environment improves further over the next couple of months (Chart 15). We are partially hedged against this sort of upside surprise through our overweight in Industrials (which would benefit from a ramp-up in Chinese infrastructure spending, in particular) and neutral on Emerging Markets and Australia. Chart 14"Min Vol" Equities Have Outperformed
"Min Vol" Equities Have Outperformed
"Min Vol" Equities Have Outperformed
Chart 15Could There Be A Shift To Value And Small Caps?
Could There Be A Shift To Value And Small Caps?
Could There Be A Shift To Value And Small Caps?
Fixed Income: Government bond yields have not risen despite the risk-on rally, and we expect this to remain the case. Continuing uncertainty, central bank insistence that easy monetary policies will stay in place for a long time, and deflationary pressures over coming months warrant a neutral stance on duration – though returns from high-quality government bonds will be around zero. In the longer-run, however, the pandemic is likely to prove inflationary: like in a post-war environment, excess liquidity, supply constraints, and pent-up demand could push up consumer prices in 12 months’ time. Consumers are already noticing that the goods they are actually buying now (as opposed to the weightings in the consumption basket used to measure inflation) are rising in price (Chart 16). We recommend TIPS as a hedge, particularly given how cheap they are (with the 10-year breakeven at only 1.2%). Corporate credits that are supported by central bank buying remain attractive, although with spreads having already contracted the easy money has been made (Chart 17). BCA Research’s fixed-income strategists prefer US and UK investment-grade and BB-rated corporate bonds in the Media, Financials and Energy sectors.1 Chart 16Consumers Are Sniffing Out Inflation
Consumers Are Sniffing Out Inflation
Consumers Are Sniffing Out Inflation
Chart 17The Easy Money Has Been Made In Credit
The Easy Money Has Been Made In Credit
The Easy Money Has Been Made In Credit
Currencies: It will pay to watch the US dollar. It is overvalued and no longer supported by interest rate differentials, but as a safe haven currency has seen inflows given global economic uncertainty. For now, we remain neutral. Emerging Market currencies are likely to remain under pressure, particularly since EM central banks have followed the example of their Developed Market counterparts and for the first time embarked on QE to boost their economies (Chart 18). This could lead to rising inflation in some EMs, as central banks essentially monetize government debt. Chart 18EM Central Banks Are Starting QE Too
EM Central Banks Are Starting QE Too
EM Central Banks Are Starting QE Too
Commodities: China has quietly been ramping up its credit growth, and this will eventually have a positive impact on industrial metals prices, which have showed tentative signs of bottoming (Chart 19). The rebound in oil prices has further to run. OPEC oil production is likely to fall by around 4 million barrels/day from its Q4 2019 level, with further output drops from capital-constrained North American shale producers (Chart 20). Chart 19Industrial Commodities Bottoming?
Industrial Commodities Bottoming?
Industrial Commodities Bottoming?
Harder to predict is how quickly demand – currently down around 15% year-on-year – will recover. BCA Research’s oil strategists, based on an assumption of a strong demand revival in H2, forecast Brent crude to rise above $50 a barrel by end-2020. Chart 20Oil Supply Has Fallen Significantly
Oil Supply Has Fallen Significantly
Oil Supply Has Fallen Significantly
Garry Evans, Senior Vice President Global Asset Allocation garry@bcaresearch.com Footnotes 1 Please see Global Fixed Income Strategy, "Hunting For Alpha In The Global Corporate Bond Jungle," dated May 27, 2020, available at gfis.bcaresearch.com. Recommended Asset Allocation
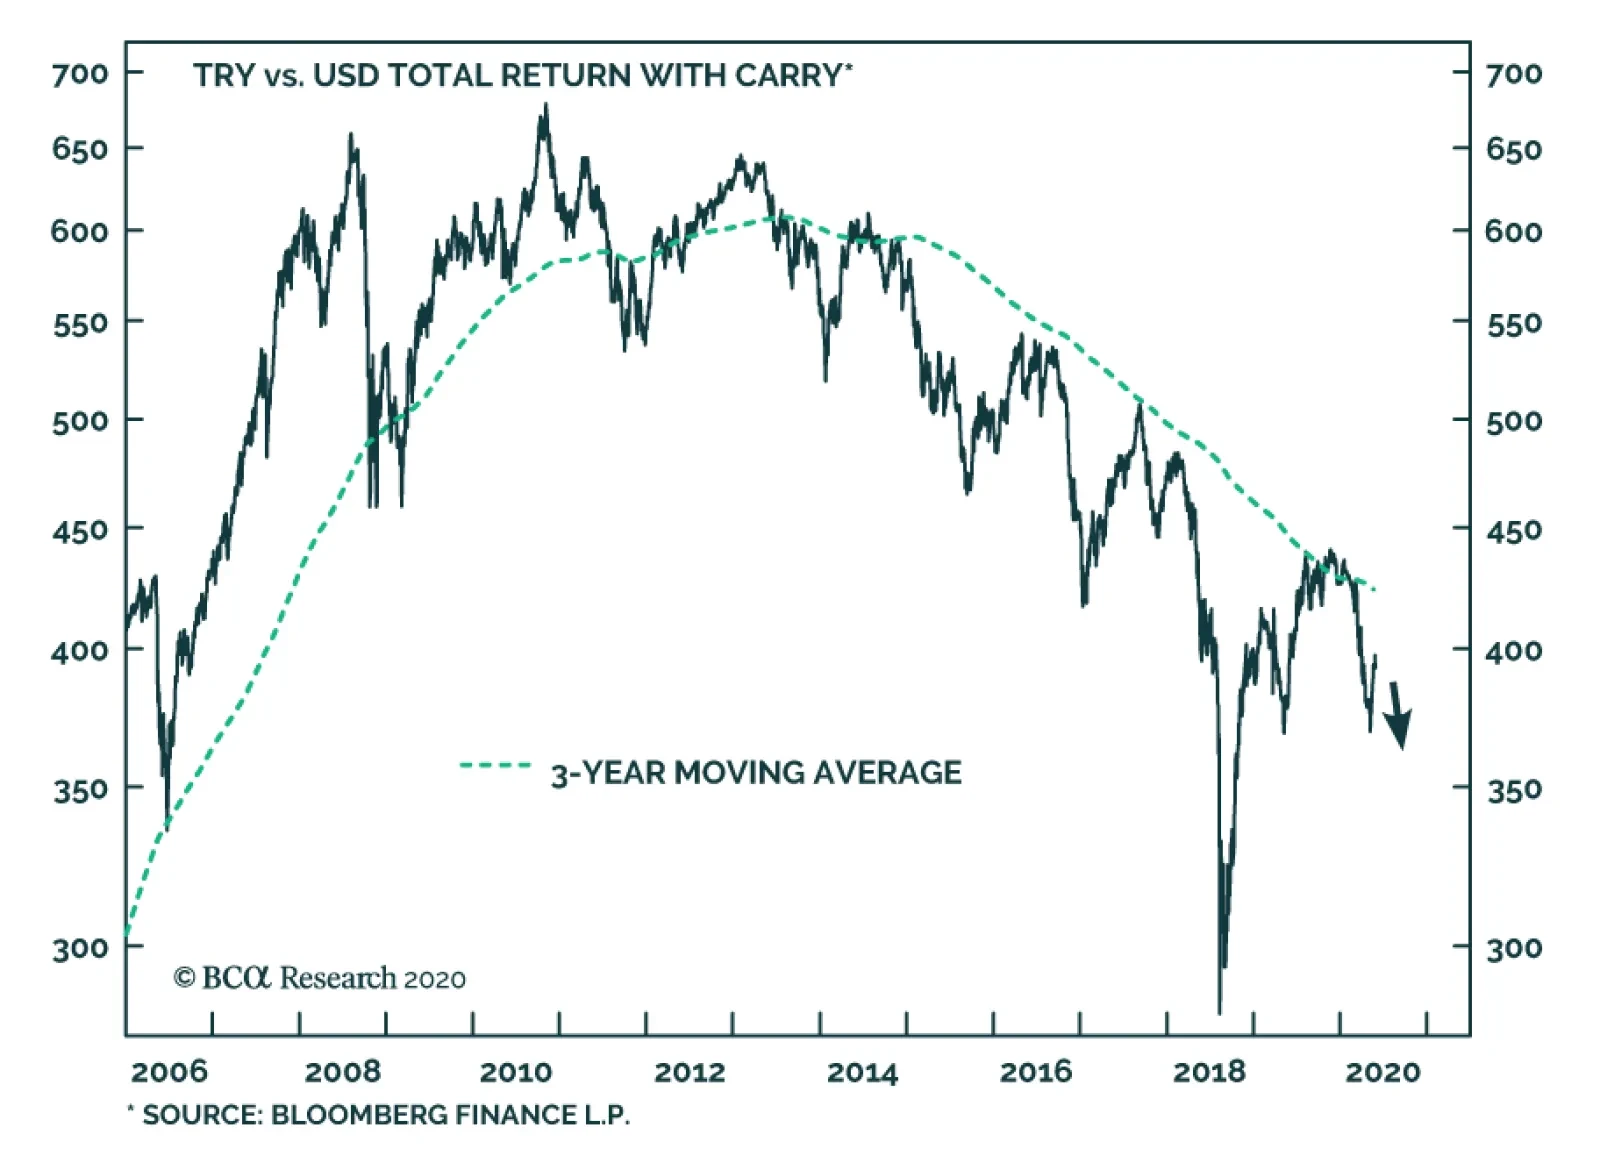
BCA Research's Emerging Markets Strategy service recommends that investors short the Turkish lira versus the US dollar and equity investors underweight Turkish equities and credit relative to their respective benchmarks. The culprit of a potential down leg…
Highlights China is taking advantage of global chaos to solidify its sphere of influence – beginning with Hong Kong. The crisis is also motivating the European Union to link arms more tightly through a symbolic step toward fiscal solidarity and transfers. US, Chinese, and European stimulus measures are cyclically positive but near-term risks abound. Hiccups in stimulus rollout are to be expected – and China’s disappointing stimulus thus far may cause market turmoil before policymakers do what we expect and add greater oomph. US-China relations are breaking down as we outlined, as renminbi depreciation coincides with Trump approval depreciation. The risks of the UK failing to agree to a trade deal with the EU are higher than prior to COVID-19. Stay defensive tactically – the risk-on rally is not yet confirmed by major reflation indicators yet geopolitical risks are spiking. Feature Chart 1Will Geopolitics Stunt The Early Bull's Growth?
Will Geopolitics Stunt The Early Bull's Growth?
Will Geopolitics Stunt The Early Bull's Growth?
After wavering at the 2,900 level, the S&P 500 broke above 3,000. As we go to press, it is holding the line, despite a surge in geopolitical risk emanating from the efforts of the Great Powers to consolidate their spheres of influence at the expense of globalization. Key cyclical indicators are on the verge of breaking out. Our “China Play Index,” which consists of the Australian dollar, Swedish equities, Brazilian equities, and iron ore prices, is reviving smartly. The copper-to-gold ratio, however, is not really confirming the rally (Chart 1). Nor are Asian currencies. We recommend a tactically defensive stance. We are not dogmatic, but are not convinced that the rally will overcome near-term risks. We expect explosive political and geopolitical events throughout the summer. Near-Term Geopolitical Risks To The Rally Our reasons for near-term caution are as follows: Global stimulus hiccups: China’s National People’s Congress over the weekend disappointed expectations on the size of economic stimulus. This is a short-term risk, we argue below, but nevertheless a risk. The US Congress may not pass stimulus until July 2 and the final law will fall short of the House bill of $3 trillion. The European “Next Generation EU” recovery fund is only 750 billion euros in size and may not be agreed until July, or even September if the financial market does not impose urgency. We elaborate below. Ultimately policymakers will keep doing “whatever it takes” but there will be hiccups first and they will trouble the market in the near term (Chart 2). Chart 2Stimulus Tsunami Will Peak This Summer
Spheres Of Influence (GeoRisk Update)
Spheres Of Influence (GeoRisk Update)
Sino-American conflict: The “phase one” trade deal was never going to bring durable comfort to markets about US-China cooperation, and the outbreak of COVID-19 prompted our March 13 argument that US-China tensions would erupt sooner than we thought. So far the market is grinding higher despite the materialization of this risk. Mega-stimulus and the equity rally enable the US and China to clash. At some point escalation will upset the market. Domestic stimulus is substituting for a collapse in globalization and risk markets are cheering. But increased domestic support will enable political leaders to clash with each other and keep upping the ante. The higher the market goes the more willing President Trump will be to expend some ammunition on China and other political targets. But if you play with sticks, somebody always gets hurt. The market is betting that Trump is a typical US president, typically bashing China in an election year. We are arguing that he is atypical, that this is an atypical election year, and that China’s own ambition cannot be left out of the equation. Wild cards: Jokers, one-eyed jacks, suicidal kings, and aces are all wild in this deck. Emerging markets like Russia (Chart 3) – and rogue regimes like Iran – pose non-negligible risks of upsetting the global rebound this year. Chart 3ARussian Risk To Rise Further On Libya, US Tensions
Russian Risk To Rise Further On Libya, US Tensions
Russian Risk To Rise Further On Libya, US Tensions
Chart 3BRussian Risk To Rise Further On Libya, US Tensions
Russian Risk To Rise Further On Libya, US Tensions
Russian Risk To Rise Further On Libya, US Tensions
Chart 4Equity Investors Wise To Erdogan's Mischief
Equity Investors Wise To Erdogan's Mischief
Equity Investors Wise To Erdogan's Mischief
Investors cannot focus on tail risks all the time, but not all geopolitical risks are tail risks. This is particularly the case because of the US election, which heightens Washington’s willingness to retaliate to any provocations. Geopolitics in the Mediterranean are verifiably unstable, particularly in Libya where Russia looks to make a major intervention yet Turkey is also involved (Chart 4). This affects North African and European security. Iran is under historic stress and will attempt to undermine the Trump administration as it has no downside to Democratic victory in November. In a recent event we hosted with the CFA Institute in India and Asia Pacific, only 4% of participants highlighted Russia and 2% Iran as a significant source of political risk this year, while 93% highlighted the US and China. Clearly the US-China competition is the great game. But other risks are underrated, especially Russia. Stimulus hiccups this summer are likely to be overcome in the US, EU, and China, so perhaps the market will look through this risk while economies reopen and leading indicators inevitably improve. US-China tensions could remain bound within Trump’s desire to keep the stock market up during his election campaign and China’s desire not to incur Trump’s unmitigated wrath if he happens to be reelected. Russian, Iranian, and emerging market risks, if they materialize, may have merely localized and ephemeral market effects. However, Trump’s falling approval rating and executive decree to open the social media companies to litigation supports our thesis that he is not enslaved by the stock market. The market is expecting “the Art of the Deal” to lead to positive outcomes but that assumption is not as reliable in a recessionary context as it is in an economic boom. The Atlanta Fed’s second quarter real GDP growth estimate stands at -40.4%. Any state that provokes the US over the next five months risks a massive or unpredictable retaliation. China will ultimately bring stimulus to 15.5% of GDP. Deflation and unemployment are a massive constraint. We do not mention the well-known risks of weak consumer activity and business investment amid the pandemic, which itself is expected to revive in the fall with no guarantee of a vaccine by then. Bottom Line: In the near term, maintain safe haven trades such as long Japanese yen, US Treasuries, and defensive equity sectors. China Stimulus Hiccups Won’t Last, But Will Sow Doubt The most important question in China is the implication of the National People’s Congress with regard to the size of stimulus. After the stimulus blowout of 2015-16, Xi Jinping consolidated power and launched a deleveraging campaign. His administration is determined to keep a lid on systemic risks, especially the money and credit bubble. Chart 5China's Stimulus Faces Doubts But Will Prove Huge In The End
China's Stimulus Faces Doubts But Will Prove Huge In The End
China's Stimulus Faces Doubts But Will Prove Huge In The End
Beijing’s targets for central and local government spending disappointed market observers. In Chart 2 above, we revised Beijing’s fiscal stimulus from 11% of GDP to 4.3% of GDP as a result of lower-than-expected targets for local government special bonds and central government special treasury bonds, as well as a corrected calculation of the fiscal relief for small and-medium-sized enterprises. This 4.3% understates the real size of China’s stimulus because it includes only fiscal elements. Since the Communist Party and state bureaucracy control the banks and many large enterprises, one must also include credit growth – it is a quasi-fiscal factor. Total social financing (total private credit) is usually the biggest element of China’s periodic bouts of stimulus. While Chinese authorities showed restraint in their fiscal measures, they announced that credit growth would “significantly” exceed nominal GDP growth, which has collapsed due to the virus lockdowns. Our Emerging Markets Strategy estimates that credit growth will accelerate to 14% this year, making for an 11.2% of GDP increase in total credit, and a combined fiscal and credit impulse that will reach 15.5% of GDP (Chart 5). The dramatic global economic shock and the hit to China’s labor market ensure that additional stimulus will be applied as needed to plug the output gap. Soaring unemployment is a fundamental risk to social stability and hence to single-party rule. This means that the fiscal impulse will in the end likely exceed 4.3% as new measures are rolled out later this year. It also means that credit growth will surprise to the upside, as the regime loosens the reins on shadow banks as well as state-controlled lenders. Nevertheless, accepting our Emerging Market Strategy’s base case of 15.5% of GDP fiscal and credit impulse, we would note that China’s economy is much larger as a share of the global economy today than it was in previous rounds of stimulus. Thus while the stimulus may be smaller than that in 2008 as a proportion of China’s economy, it is larger as a proportion of the world’s (Table 1). China-linked asset prices, such as industrial metals, will see rising demand over time. Table 1China Fiscal+Credit Impulse Will Be Big Relative To World
Spheres Of Influence (GeoRisk Update)
Spheres Of Influence (GeoRisk Update)
The Xi administration’s preference is not to overstimulate and exacerbate its problems of imbalanced growth, falling productivity, and excessive indebtedness. But its constraint is deflation, unemployment, and social instability. Insufficiently loose policy in the midst of a very deep global recession could prove to be the biggest policy mistake of all time. To refuse to loosen as needed, or to re-tighten policy too soon, would be to make a cruel joke out of the new policy slogan, “the Six Stabilities and Six Guarantees” and jeopardize Xi Jinping’s ability to reconsolidate power ahead of the twentieth National Party Congress in 2022. Rather the constraint will force policymakers to alter any hawkish preferences if growth looks to relapse. Bottom Line: Doubts about the sufficiency of China’s fiscal and monetary stimulus pose a near-term risk to global risk assets since investors face disappointing stimulus promises on the surface, combined with lack of certainty about Beijing’s willingness to increase stimulus going forward. We are confident that Beijing will ultimately do whatever it takes to stabilize employment and try to ensure social stability. But this implies near-term challenges and possibly a market riot prior to resolution. Before then, many market participants, including in China, will believe that the Xi Jinping administration will be hawkish and resistant to re-leveraging. China’s Sphere Of Influence Global geopolitical risk stems from the Xi Jinping regime at least as much as from the Donald Trump regime, as we have long pointed out. The scenario unfolding as we go to press is precisely the one we outlined back in March in which Beijing depreciates its currency to ease its economic woes while President Trump’s approval rating falls due to his own woes, prompting him to retaliate. The CNY-USD exchange rate is largely pricing out the phase one trade deal, which is marked by the peak in renminbi strength in Chart 6. Chart 6Phase One Trade Deal Priced Out Of Renminbi Already
Phase One Trade Deal Priced Out Of Renminbi Already
Phase One Trade Deal Priced Out Of Renminbi Already
Chart 7China's Warning To Trump Could Scrap Trade Deal
China's Warning To Trump Could Scrap Trade Deal
China's Warning To Trump Could Scrap Trade Deal
This depreciation is not merely the effect of market moves – though weakness in global and Asian trade and manufacturing certainly reinforce it. The People’s Bank of China’s fixing rate has been guiding the currency to its lowest point since 2008 amid the spike in US-China tensions over the past month (Chart 7). China says it will adhere to the phase one deal as long as it is mutual. It is buying more soybeans, cotton, pork, and beef from the United States relative to last year. Demand has collapsed. Unless China decides to dictate purchases as a subsidy to keep the agreement alive, its purchases will fall short of the huge expansion envisioned in the deal. US actions could nullify the deal anyway. President Trump and his Economic Director Larry Kudlow have both suggested that the administration no longer cares about maintaining the deal. China was fast becoming unpopular in the US and this trend has skyrocketed as a result of COVID-19. China’s other notable decision at the National People’s Congress was to state that it would impose a new national security law on Hong Kong SAR, after the autonomous financial center’s long reluctance to do so. Beijing has sought greater direct control of the city since early in Xi’s term, in contravention of the promise of 50 years of substantial autonomy enshrined in the Sino-British Joint Declaration of 1984. Beijing’s action comes after Hong Kong’s widespread civil unrest last year and ahead of the city’s Legislative Council elections in September, which will likely become a major geopolitical flashpoint. The United States is retaliating by removing Hong Kong’s designation as an autonomous region. This entails higher tariffs, tougher export controls, stricter visa requirements, and likely sanctions directed at mainland entities that will enforce the national security law in various ways, including eventually some Chinese banks. The US also accelerated sanctions against China for its civil rights abuses in Xinjiang – sanctions that target tech and security companies – and is moving forward with a bill to threaten Chinese companies that hold American Depository Receipts (ADRs) with delisting from American stock exchanges if they do not meet the same auditing requirements as other foreign companies. This potentially affects $1.8 trillion in market capitalization over a 3-4 year period. China’s power grab in Hong Kong initiates a market-negative Sino-American dynamic that will last all year. It cannot be assumed that Trump will accept Beijing’s implicit offer of swapping phase one trade deal implementation for China’s historic encroachment on Hong Kong’s autonomy. The imposition of legislative dependency on Hong Kong should not have been a surprise to investors given recent trends, but it was, as Hong Kong equities fell by 6% at first blush. There is more downside, judging by our China GeoRisk Indicator, which is in a clear uptrend for all of these reasons and correlates reasonably well with the Hang Seng index (Chart 8). Chart 8Hong Kong Equities Face More Downside From Geopolitics
Hong Kong Equities Face More Downside From Geopolitics
Hong Kong Equities Face More Downside From Geopolitics
While the US will retaliate over Hong Kong, the question for global investors is whether the conflict spills over into the rest of China’s periphery. This would highlight the systemic nature of the geopolitical risk and make it harder for the market to swallow the new cold war. Our Taiwan Strait GeoRisk Indicator (Chart 9) is pricing zero political risk despite the clear risk that Beijing will eventually resort to economic sanctions to penalize the mainland-skeptic government there; that the US will seek to shore up the diplomatic and defense relationship in significant ways in what may be the final five months of the Trump administration; and that Taiwan may seek to draw the US into granting greater economic and security assurances. Chart 9Taiwan Equities Pricing ZERO Geopolitical Risk ... Huge Mispricing
Taiwan Equities Pricing ZERO Geopolitical Risk ... Huge Mispricing
Taiwan Equities Pricing ZERO Geopolitical Risk ... Huge Mispricing
Our Korea GeoRisk Indicator (Chart 10) has also fallen drastically. This risk indicator deviates from Korean equities frequently due to North Korean risks, which equity investors tend (usually correctly) to ignore. This year is different, however, because Kim Jong Un’s decision whether to give Trump a diplomatic win, or frustrate him with the test of a nuclear device or intercontinental ballistic missile, actually has a bearing on Trump’s election odds and the pace of US-China escalation. If Kim humiliates Trump then we expect Trump to make a major show of force in the region that would draw China into a strategic standoff. Chart 10North Korea Is Relevant In 2020 Due To Trump
North Korea Is Relevant In 2020 Due To Trump
North Korea Is Relevant In 2020 Due To Trump
China is attempting to solidify its sphere of influence, first in Hong Kong but later in Taiwan and the Korean peninsula. The United States is pushing back and the US election cycle combined with massive stimulus means that push will come to shove. Bottom Line: Investors should steer clear of Chinese, Taiwanese, and Korean currencies and risk assets in the near term. We recommend playing the cyclical China recovery via Korean equities over the long run. The European Sphere Of Influence The European Union is also attempting to strengthen and expand its sphere of influence – namely with steps in the direction of a fiscal union. Our GeoRisk Indicators are generally flagging a huge drop in political risk for Germany, France, Italy, and Spain (Charts 11A & 11B). The reason is that the economies have collapsed yet the equity market has bounded back on ECB quantitative easing and huge promises of fiscal support. In the coming months these risk indicators will rise even as economies reopen because the debate over fiscal and monetary policies is heating up. Our base case is that both the debate over EU recovery funds and the German constitutional court’s objections to QE will resolve in dovish compromises. Chart 11AEurope’s Not-Quite Hamiltonian Moment
Europe's Not-Quite Hamiltonian Moment
Europe's Not-Quite Hamiltonian Moment
Chart 11BEurope’s Not-Quite Hamiltonian Moment
Europe's Not-Quite Hamiltonian Moment
Europe's Not-Quite Hamiltonian Moment
At issue on the fiscal front is the EU Commission’s “Next Generation EU” recovery fund. Commission President Ursula von der Leyen is offering to create a 750 billion euro relief fund (500 billion in grants, 250 billion in loans). The decision is contentious because it would entail the EU Commission issuing bonds – essentially joint bonds among the EU states – to raise funds that would then be distributed through the EU Commission seven-year budget (2021-7). Joint issuance would be a symbolic step toward greater solidarity. This proposal began with an agreement between French President Emmanuel Macron and German Chancellor Angela Merkel to launch the 500 billion in grants. Merkel signaled earlier this year that she was prepared to accept joint bond issuance focused on the immediate crisis. When more fiscally hawkish or euroskeptic states objected that loans should be used instead of grants, von der Leyen simply added their proposal to the total, despite the fact that the ECB and European Stability Mechanism (ESM) already offer emergency loans to help states through the global crisis. The proposal marks a victory of the fiscally dovish Mediterranean states (once called “Club Med”) over the frugal Germans, with Macron prevailing on Merkel to foist yet another major compromise onto her conservative German power base in the name of European integration and solidarity before she exits the chancellorship in 2021. But it is not as if German elites like Merkel and von der Leyen are running amok: German public opinion is Europhile and supportive of bolder actions to share burdens, save the union, and shore up the continental economy. The market is not pricing any political risk in Taiwan despite clear dangers. Stay short Taiwanese equities. The recovery fund itself is limited in size, relative to overall stimulus actions thus far. But it would plug an important gap for states like Italy and Spain, which are constrained by large public debt loads and have not provided enough stimulus as yet. The “Frugal Four,” the Netherlands, Austria, Sweden, and Denmark, are leading the opposition to the use of grants rather than loans and any effort to establish a track leading to European fiscal union. But they are also willing to negotiate. Estonia and other nations are also objecting, with the eastern Europeans seeking to ensure that southern Europe does not take the lion’s share of the funds, while the core European states will use the funds to pressure populist and euroskeptic eastern states that have defied the European Court of Justice and other institutions (Chart 12). Chart 12Europe: Distribution Of ‘NextGen EU’ Fund
Spheres Of Influence (GeoRisk Update)
Spheres Of Influence (GeoRisk Update)
A final decision may not be settled by the time of a special summit in July but some compromise should be expected by the fall or (latest) end of year. The proposal would do the very thing that its opponents resist: pave the way toward jointly issued bonds in future that do not have a time limit or a single purpose (today’s sole purpose being pandemic relief). Hence the negotiations will be intense and it will likely require a return of financial instability to bring them to a conclusion. The global financial crisis and its aftermath provoked a higher degree of integration among the EU member states despite the tendency of the mainstream media to assume that the dissonance between monetary and fiscal policy would create an unbridgeable rupture. COVID-19 is now supporting this pattern of Brussels not letting a good crisis go to waste. Chart 13Europe Fends Off Latest Doubts About Solidarity
Europe Fends Off Latest Doubts About Solidarity
Europe Fends Off Latest Doubts About Solidarity
The reason is that the EU is a geopolitical project. As Russia revived, the US began to act unilaterally and unpredictably, and China emerged as a global heavyweight, European powers were forced to huddle together ever more tightly to create economies of scale and improve their security against various external and unconventional threats. Influential German Finance Minister Olaf Scholz has compared the new recovery fund to the work of American founding father Alexander Hamilton in mutualizing the early American states’ war debt so as to create a tighter fiscal union among the states. For that very reason the more Euroskeptic member states oppose the proposal – long rejecting the idea of a “United States of Europe.” Today’s proposals are more symbolic, less substantial, than Hamilton’s famous Compromise of 1790. Nevertheless we would not underrate them as they highlight the way the European states continually turn crisis moments that worry the markets about European break-up into new opportunities to combine more closely. As such it is fitting that the European break-up risk premium has fallen, signifying a drop in peripheral bond spreads (Chart 13). The battle over debt mutualization is not over yet so spreads could widen again, but the trend will be down as the bloc develops new tools to combat the latest crisis. The United Kingdom obviously marks a major exception to this reinforcement of the European sphere of influence. The Brits are historically and geopolitically opposed to a unified continental political power. Having decided to leave, they lack the ability to obstruct from within. But they are also not necessarily more likely to yield in their trade negotiations. British political risks are understandably low because Prime Minister Boris Johnson and his Conservative Party won a strong mandate in December and technically do not have to face voters again until 2024. The major limitation on a “no trade deal” outcome in talks with Brussels was a recession – yet that has already occurred. London could ultimately bite the bullet and accept that outcome if the trade talks turn acrimonious. The GBP/EUR is not pricing a full “no deal” exit. Stimulus and economic recovery suggest that it is a good time to go long sterling but we will pass on this trade in the short run due to resilient dollar strength and the reduced barrier to exiting without a trade deal (Charts 14A & 14B). Chart 14ABrexit Trade Talks Not Globally Relevant
Brexit Trade Talks Not Globally Relevant
Brexit Trade Talks Not Globally Relevant
Chart 14BBrexit Trade Talks Not Globally Relevant
Brexit Trade Talks Not Globally Relevant
Brexit Trade Talks Not Globally Relevant
Bottom Line: We do not yet recommend reinstituting our long EUR/USD trade, which we initiated late last year as part of our annual forecast. The COVID-19 crisis has created such a spike in geopolitical and political risk that we expect the US dollar to remain surprisingly strong throughout the coming months and for US equities to outperform global equities beyond expectation. Nevertheless we will look to reinitiate this long-term trade at an appropriate time, as it fits squarely with our “European Integration” theme since 2012. Investment Takeaways Our contention that “geopolitics is the next shoe to drop” has materialized. This has negative near-term implications for global risk assets. However, thus far, market positives have outweighed negatives for global investors faced with the reopening of economies and wartime-magnitude fiscal and monetary stimulus. Buying risky assets makes sense for investors with a long-term investment horizon – and we recommend cyclical plays like commodities, corporate bonds, infrastructure stocks, and defense stocks in our strategic portfolio. We also recognize that if key cyclical and reflation indicators break out from here, then a cyclical bull market could take shape. Yet our analytical framework reveals that recession and mega-stimulus have diminished the financial and economic constraints that would normally deter geopolitical actors from ambitious actions on the international stage. Most notably, the US election dynamic has turned upside-down. President Trump is the underdog and will need to develop a reelection bid that does not hinge on the economy. Doubling down on “America First” foreign policy and trade policy makes the most sense and the ramifications are negative for the markets over the next five months. This is the key dynamic that makes US-China, US-North Korea, US-Russia, and US-Iran tensions more market-relevant than they would otherwise be. It also will dampen an otherwise positive story for the euro, in the short run. Matt Gertken Vice President Geopolitical Strategist mattg@bcaresearch.com Section II: Appendix : GeoRisk Indicator China:
China: GeoRisk Indicator
China: GeoRisk Indicator
Russia:
Russia: GeoRisk Indicator
Russia: GeoRisk Indicator
UK:
UK: GeoRisk Indicator
UK: GeoRisk Indicator
Germany:
Germany: GeoRisk Indicator
Germany: GeoRisk Indicator
France:
France: GeoRisk Indicator
France: GeoRisk Indicator
Italy:
Italy: GeoRisk Indicator
Italy: GeoRisk Indicator
Canada:
Canada: GeoRisk Indicator
Canada: GeoRisk Indicator
Spain:
Spain: GeoRisk Indicator
Spain: GeoRisk Indicator
Taiwan:
Taiwan: GeoRisk Indicator
Taiwan: GeoRisk Indicator
Korea:
Korea: GeoRisk Indicator
Korea: GeoRisk Indicator
Turkey:
Turkey: GeoRisk Indicator
Turkey: GeoRisk Indicator
Brazil:
Brazil: GeoRisk Indicator
Brazil: GeoRisk Indicator
Section III: Geopolitical Calendar