Emerging Markets
BCA Research's China Investment Strategy service underlines that while developments in the pandemic remain fluid, their baseline view suggests that the wealth effect will have a limited but positive impact on Chinese middle-class consumers. Housing is the…

Dear Client, Next week we will be sending you a Special Report providing our insights on the much-anticipated China National People’s Congress. We think the messages sent from the conference will be highly relevant to both the global economy and financial markets. Please note: instead of Wednesday, the Special Report will be published on Thursday the 28th of May. Best regards, Jing Sima China Strategist Highlights Insert HiEarly signs suggest a renewed appetite among Chinese consumers for real assets and durable goods. China’s discretionary consumption will likely benefit greatly from pro-growth measures, and recover much faster than the aggregate consumption. The unemployment rate has been rising and largely concentrated in lower-income workers. Elevated unemployment will be a drag on China’s overall consumption, but its impact on discretionary consumption is limited. We are initiating two trades: long investable consumer discretionary/short investable consumer staples and long domestic consumer discretionary/broad A-share market. Feature Chart 1Sectors Directly Benefiting From Stimulus Are Recovering Faster
Sectors Directly Benefiting From Stimulus Are Recovering Faster
Sectors Directly Benefiting From Stimulus Are Recovering Faster
Economic data released last week showed that China’s economy continued to recover, particularly the infrastructure, construction and high-tech sectors (Chart 1). On the other hand, household consumption, which accounts for nearly 40% of the country’s economy, remained in a deep contraction in April. While we think the annual growth in China’s aggregate household demand will remain muted this year, the breakdown in April’s retail sales data suggests that the speed in consumer discretionary spending is already accelerating (Chart 2). During economic recoveries, consumer discretionary spending usually rebounds ahead of a recovery in overall consumption. Even though the current economic downturn is extra-ordinary, we believe that China’s discretionary consumption growth will pick up faster and stronger than the aggregate household consumption. Consumer discretionary stocks, an early cyclical sector in China’s equity market, troughed about 3 months ahead of a bottoming in Chinese investable and domestic stock prices in previous cycles. In line with our constructive view on Chinese stocks in the next 6 to 12 months, we recommend investors overweight Chinese consumer discretionary stocks relative to the benchmarks. In addition, we are initiating a long position in investable consumer discretionary versus investable consumer staples, and a long position in domestic consumer discretionary versus A-share market. Chart 2Discretionary Consumption Is Rebounding Faster Than Staples
A Consumption Recovery On Two Tracks
A Consumption Recovery On Two Tracks
China’s Stimulus-Driven Consumption Cycles Chinese consumption cycles since 2008 have mostly reflected the effectiveness of China’s pro-consumption and stimulus policies. So far, the Chinese government’s stimulus measures have been concentrated in the corporate sector rather than households. Nevertheless, government pro-growth measures, flush liquidity in the market and global travel restrictions should provide a lift to domestic sales of durable and luxury goods. Chart 3 illustrates how, in contrast to the US, China’s retail sales have grown faster than nominal GDP during every economic downturn since 2008. A reason for this counter-cyclicality in China’s consumption is that the monthly retail sales data consists of household, government and business purchases. Since the Chinese government tends to increase its expenditures during economic downturns, the increases in government purchases help to offset the declines in household and business consumption. Chart 3Retail Sales In China Have Become 'Countercyclical' Since 2008
Retail Sales In China Have Become 'Countercyclical' Since 2008
Retail Sales In China Have Become 'Countercyclical' Since 2008
Chart 4China's Post-GFC Consumption Cycles Largely Driven By Stimulus
China's Post-GFC Consumption Cycles Largely Driven By Stimulus
China's Post-GFC Consumption Cycles Largely Driven By Stimulus
A more important contributor to the faster retail sales growth during economic down cycles is government stimulus. Direct pro-consumption policies, such as sales tax cuts and subsidies, helped to boost auto sales in every cycle since 2008, whereas stimulus measures to enhance home sales indirectly led to an upcycle in the sales of home appliances in 2015-2016 (Chart 4). April’s retail sales data showed a sharp rebound in Chinese household consumption in autos, appliances and furniture (Chart 5). The strong comeback in durable goods purchases in April was driven by a release of pent-up demand and government pro-consumption measures. Since March, local governments have handed out subsidies, vouchers and tax reductions on consumer durable goods purchases and discretionary spending, such as travel and restaurant dining. By end-April, an estimate of 40 billion yuan worth of consumption vouchers were issued by provincial and city-level governments, with more than 90 percent of them targeted at discretionary goods and services. We think the government will announce further policies to support consumption at the May 22-23 National People’s Congress. Chart 5A Strong Comeback In Durable Goods Sales
A Consumption Recovery On Two Tracks
A Consumption Recovery On Two Tracks
Chinese consumers took on more medium- and long-term loans in March and April, indicating a renewed appetite for purchasing real assets and durable goods (Chart 6). This is partially because consumers want to take advantage of lower interest rates and easier monetary conditions. Moreover, Chinese households may also be seeking real assets to hedge future inflation and financial market uncertainties. Housing in China in the past two decades has been perceived as countercyclical and a low-risk asset that holds value. Early signs indicate a renewed Chinese consumers’ appetite for real assets and durable goods. Both land sales and real estate investment growth returned to positive territory in April, while the contraction in floor space started, completed, and sold all narrowed. The upward cycle in the property market should continue to support a recovery in household appliances and furniture (Chart 7). Chart 6Appetite For Real Asset Purchases May Be Returning
Appetite For Real Asset Purchases May Be Returning
Appetite For Real Asset Purchases May Be Returning
Chart 7A Recovering Property Market Should Help Boost Home Appliance Sales
A Recovering Property Market Should Help Boost Home Appliance Sales
A Recovering Property Market Should Help Boost Home Appliance Sales
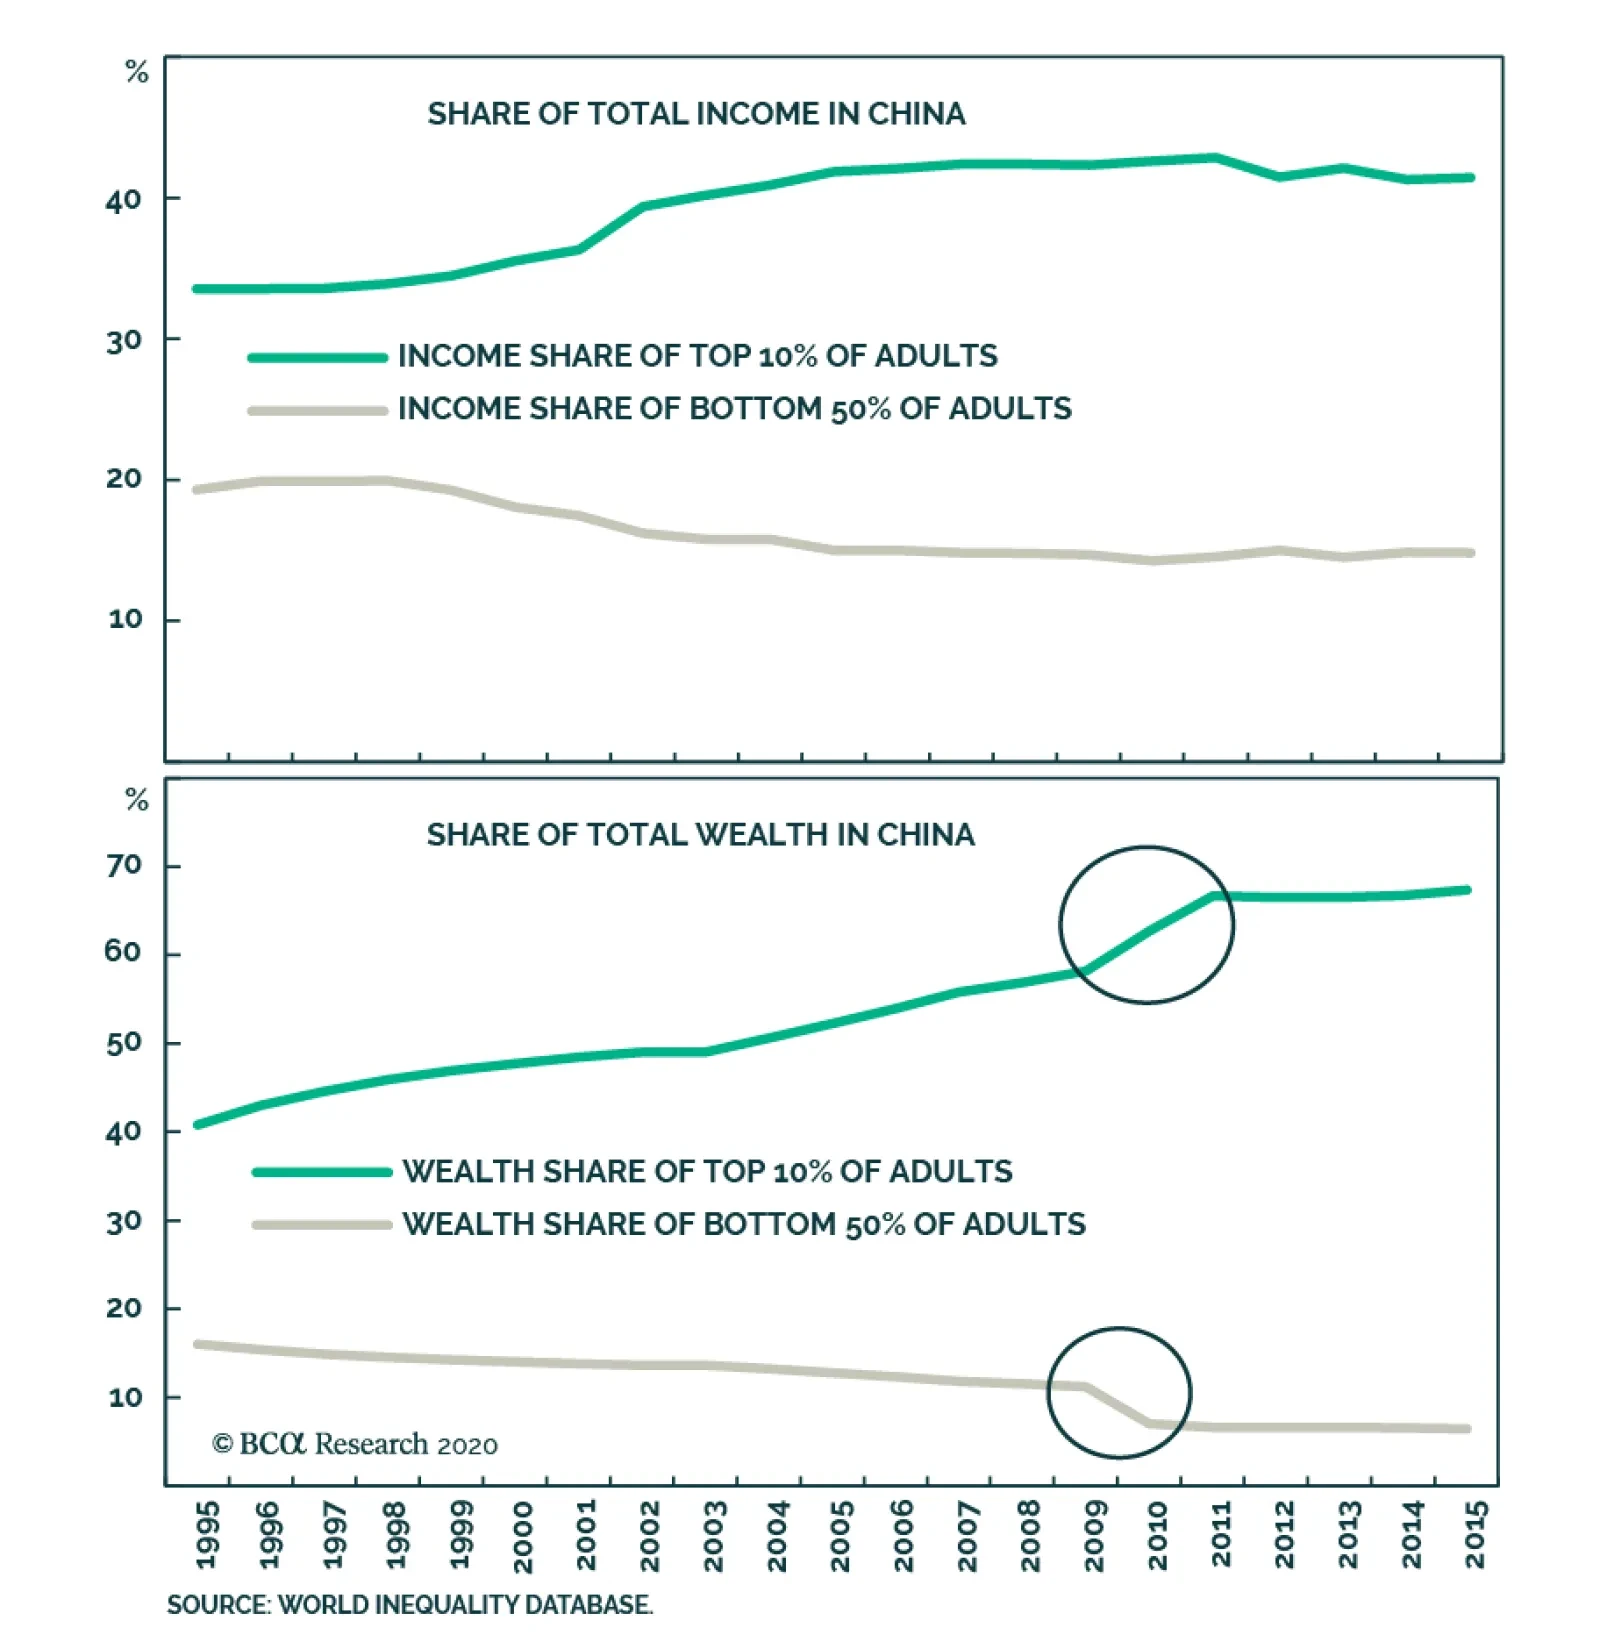
In addition, global travel restrictions will likely remain in place through this year. This may prompt Chinese consumers to allocate a larger portion of their discretionary spending budgets to domestic, high-end consumer goods and services. Bottom Line: Early signs indicate a renewed consumer appetite for real assets and durable goods. The government’s pro-consumption and pro-growth measures should further boost discretionary spending. The Wealth Effect The consumption behavior of Chinese households will likely be driven by both the change in the value of their assets, and their expectations of the immediate or perceived future loss of employment and income. Housing is the largest part of Chinese households’ net worth.1 At the same time, financial assets account for a much lower share of Chinese households’ net worth versus their American peers.2 Home prices are much less volatile than stock prices, and we expect home prices in China to grow faster this year than in 2019. Hence the wealth effect of housing on Chinese consumers should remain positive. The unemployment rate has been elevated, but job losses so far are concentrated in the labor-intensive, lower-skilled manufacturing and service sectors (Chart 8). While lower-income workers account for more than half of China’s total population, their share of the country’s total household wealth and income is dismal compared with households in the top 10 percentile earnings3 (Chart 9). In fact, households in the bottom 40 percentile essentially have no discretionary spending capacity.4 Households in the top 40 group (middle- and upper middle-class urbanites) are the main driver of China’s discretionary and luxury goods market.5 Chart 8Job Losses So Far Concentrated In Lower-Skilled, Lower-Wage Manufacturing & Service Sectors
A Consumption Recovery On Two Tracks
A Consumption Recovery On Two Tracks
Chart 9Higher-Income Chinese Households Will Drive Recovery In Discretionary Consumption
A Consumption Recovery On Two Tracks
A Consumption Recovery On Two Tracks
Because poorer households tend to have a higher marginal propensity to consume than the richer ones, China’s high income inequality may reduce the aggregate demand and has the potential to structurally stagnate its household consumption growth. This is a topic we hope to provide insights on in our future research. Cyclically, however, accommodative monetary conditions and outsized stimulus during economic downturns often help augment richer households’ net worth as well as increase their discretionary purchasing power. Our constructive view on China’s discretionary consumption could change if a second wave of Covid-19 infections is virulent enough to trigger another round of global lockdowns. In this case unemployment may expand from lower-income to middle-class Chinese consumers and extend from temporary to permanent job losses. Consumption will also be constrained by more widespread income declines and renewed physical lockdowns. Bottom Line: Job losses are concentrated in the lower-income household group so far. While developments in the pandemic remain fluid, our baseline view suggests that the wealth effect will have a limited impact on Chinese middle-class consumers. Investment Conclusions The recovery is still in its early stages, but government stimulus is bearing fruit in discretionary consumption. Furthermore, the elevated unemployment rate should prompt the government to roll out more consumption and growth-supporting measures at this week’s NPC conference, which will help further boost Chinese consumers’ appetite for discretionary spending. China’s investable consumer discretionary sector has consistently outperformed both the broad market and consumer staples during previous economic recoveries. China’s investable consumer discretionary sector has consistently outperformed both the broad market and consumer staples during previous economic recoveries (Chart 10). The overwhelming shares of China’s online tech titans in the investable market, such as Alibaba and JD, make a strong case to overweight the consumer discretionary sector given that both online platforms will continue to benefit from the Chinese government’s pro-consumption schemes. On the other hand, the behavior of consumer discretionary versus consumer staples in China’s A-share market has been atypical. Chart 11 shows domestic consumer discretionary stocks have consistently underperformed consumer staples since 2015, even during the 2016/2017 upcycle in broad market stock prices. We think a few underlying factors may be at play: Chart 10The CD Sector Has Consistently Outperformed CS In Offshore Market Upcycles...
The CD Sector Has Consistently Outperformed CS In Offshore Market Upcycles...
The CD Sector Has Consistently Outperformed CS In Offshore Market Upcycles...
Chart 11...It Is Not The Case In The Onshore Market
...It Is Not The Case In The Onshore Market
...It Is Not The Case In The Onshore Market
Food and beverage companies in mainland China have one of the highest ROAs and the lowest financial leverages, which is preferred by Chinese domestic investors; Chinese liquor brands such as Kweichow Moutai and Wuliangye, which are listed on the A-share market and within the consumer staples group, have become collectable luxury goods. They have helped driving up the prices of consumer staple equities (Chart 12); Soaring food prices since 2017 have helped to widen profit margins among food processing firms (Chart 13). Chart 12Some 'Consumer Staples' Have Become Luxury Goods
Some 'Consumer Staples' Have Become Luxury Goods
Some 'Consumer Staples' Have Become Luxury Goods
Chart 13Soaring Food Prices Also A Contributing Factor
Soaring Food Prices Also A Contributing Factor
Soaring Food Prices Also A Contributing Factor
For investors with a time horizon longer than a 12 months, consumer discretionary sector is a winner. However, for investors with a time horizon longer than 12 months, average returns in consumer discretionary stocks still beat staples in the past three market recoveries (Table 1). This is true for both onshore and offshore markets. As such, we recommend investors go long on consumer discretionary versus consumer staples in the investable market, and also go long on domestic consumer discretionary versus the broad domestic market. We are initiating these two trades today. Table 1CD Sector Still A Winner On A 12-18 Month Horizon
A Consumption Recovery On Two Tracks
A Consumption Recovery On Two Tracks
Jing Sima China Strategist jings@bcaresearch.com Footnotes 1 Housing accounts for 59.1% in Chinese households’ net worth, compared with 30% in the US. PBoC, “2019 Chinese Urban Households Assets And Liabilities Survey”. 220.4% of Chinese households’ total net worth is in financial assets. In the US, the share is 42.5%. PBoC, “2019 Chinese Urban Households Assets And Liabilities Survey”. 3China’s low-income households account for about 60% of China’s population as of 2015. “How well-off is China’s middle class?” Center For Strategy & International Studies. https://chinapower.csis.org/china-middle-class/ 4 “Can China Avoid the Middle Income Trap?” Damien Ma, Foreign Policy, March 2016 5China Consumer Report 2020, McKinsey & Company, December 2019 Cyclical Investment Stance Equity Sector Recommendations
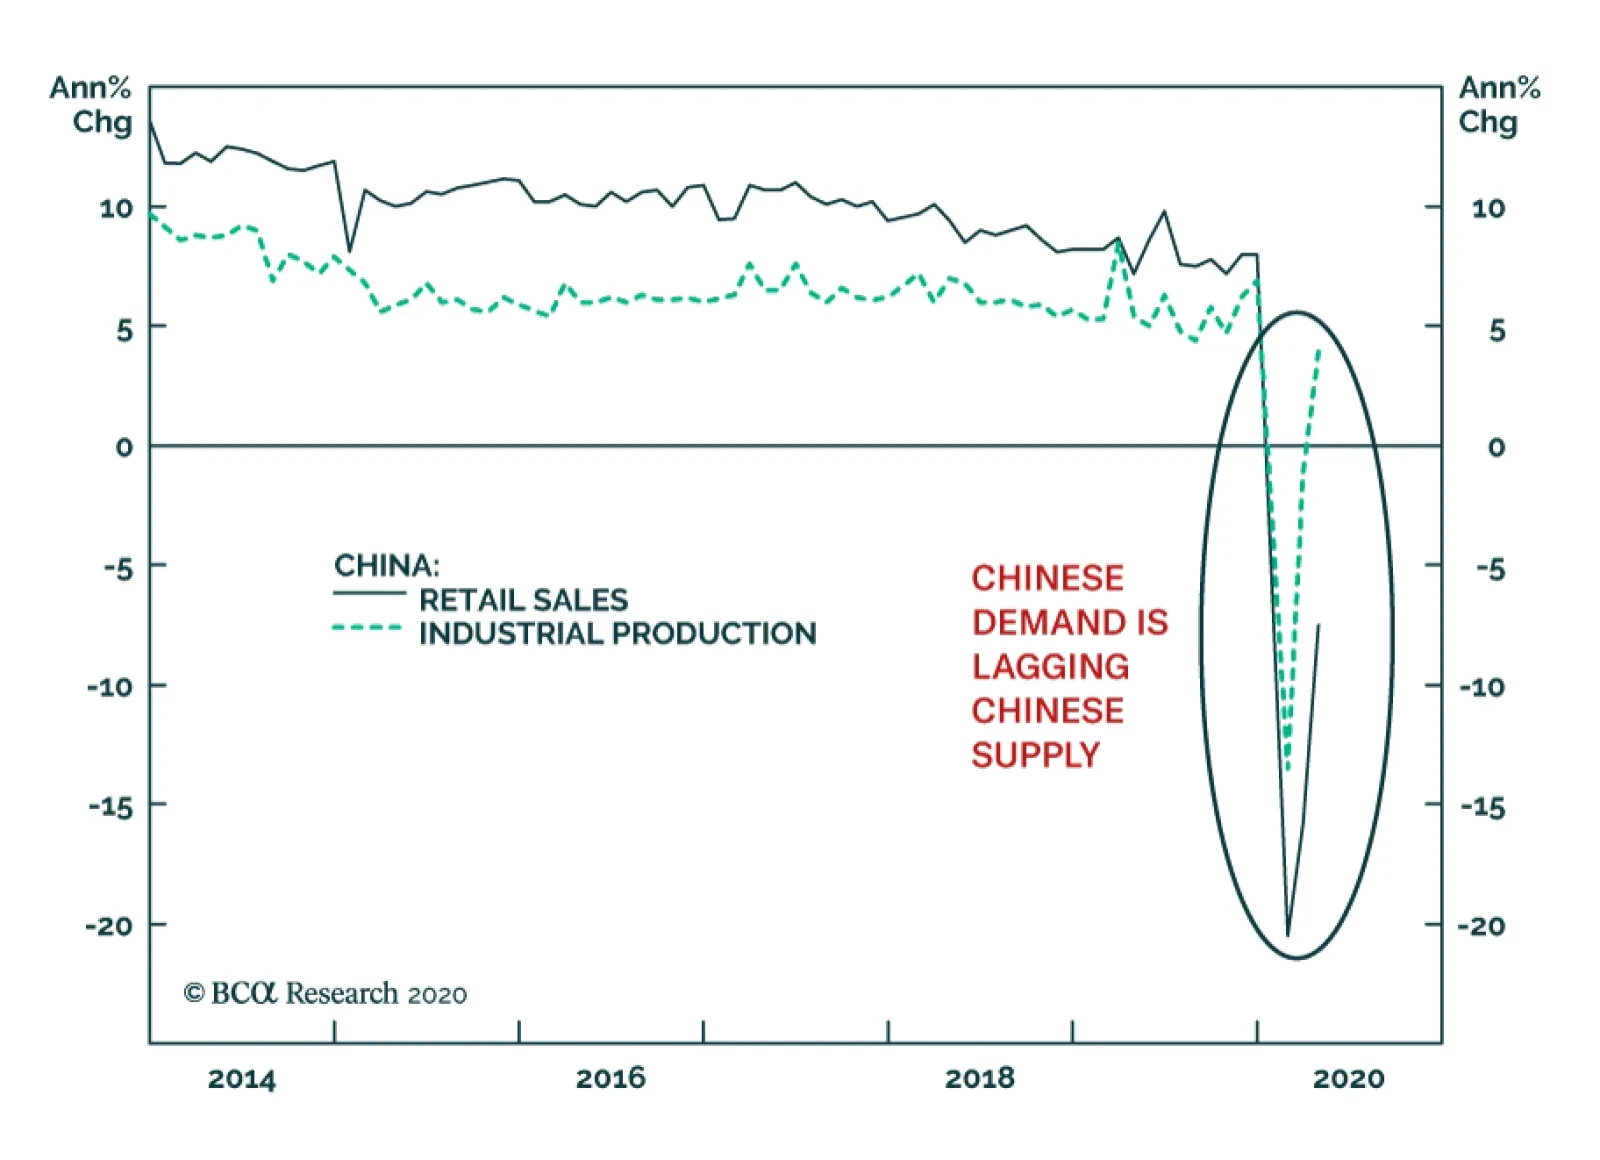
China’s data releases on Friday were mixed, at best. On the positive side, industrial production rebounded to a 3.9% annual growth rate in April. However, retail sales remain weak as they contracted at a 7.5% annual rate. This dichotomy between the supply…
Feature Analysis on Korea & South Africa are available on pages 6 and 10, respectively. Mexico: Balancing Pros And Cons We have been overweight Mexican sovereign credit and local currency bonds as well as equities relative to the respective EM benchmarks. Our rationale for this stance has been the fact that Mexico’s macro risk premium relative to other EMs has been, in our opinion, wider than it should have been. However, the COVID-19 outbreak has introduced new dimensions into this analysis. On one hand, there are a number of positives that still warrant a lower macro risk premium on Mexican assets: The nation’s public debt burden is rising sharply but is not yet at an unsustainable level. We estimate that assuming (1) a nominal GDP contraction of 7% in 2020, (2) an overall fiscal deficit of 4.7% of GDP this year, and (3) the peso’s exchange rate versus the US dollar at 26, the gross public debt-to-GDP ratio will rise to 49% from 37% currently (Table I-1). If we assume the government takes over all SOE debt, including that of Pemex, total gross public debt will rise to 62% of GDP (Table I-1). While non-trivial, Mexico’s public debt burden is considerably lower than those in large EM countries like Brazil and South Africa. Table I-1Mexico's Public Debt Burden
Mexico, Korea & South Africa
Mexico, Korea & South Africa
Chart I-1Mexico: Real And Nominal Rates Are Too High
Mexico: Real And Nominal Rates Are Too High
Mexico: Real And Nominal Rates Are Too High
Despite widespread investor concerns, President AMLO has been running a very tight fiscal policy. At the end of 2019, the government had a primary surplus of 1% of GDP, and the overall deficit stood at 1.6%. In fact, given AMLO’s ideological approach to fiscal frugality, his government’s fiscal response to the COVID-19 pandemic to date has actually been less than what it can or should be. Similarly, monetary policy has been very tight. This is positive for creditors but negative for growth. The central bank has erred on the hawkish side and has a lot of room to reduce interest rates. Nominal and real interest rates in Mexico are among the highest in the EM universe (Chart I-1). Very tight fiscal policy means that monetary policy can be relaxed considerably. Interest rates in Mexico have a lot of downside. Finally, the peso is reasonably cheap, according to the real effective exchange rate based on CPI and PPI measures (Chart I-2). Mexico’s macro risk premium relative to other EMs has been, in our opinion, wider than it should have been. On the other hand, there are considerable negatives, especially regarding the growth outlook: A year and a half into his mandate, president AMLO has not been able to secure the corporate sector’s confidence in his administration’s policies. The government was attempting to reverse this trend in the months leading up to the COVID-19 outbreak by announcing a public-private infrastructure package and improving relations with the US. Nevertheless, the decision to shun large corporations from the national fiscal response has once again weighed on business confidence. This will further reduce capital spending and hiring, prolonging the recession (Chart I-3). Chart I-2The Mexican Peso Is Cheap
The Mexican Peso Is Cheap
The Mexican Peso Is Cheap
Chart I-3Business Confidence Plummets Again
Business Confidence Plummets Again
Business Confidence Plummets Again
The government’s fiscal response to the COVID-19 pandemic has been insufficient. The central government announced measures to increase funding for social and infrastructure programs and loans for households as well as small and medium businesses, amounting to a mere 3% of GDP. This is one of the lowest stimulus packages among major economies worldwide (Chart I-4). Chart I-4Mexico's Fiscal Response Is Poor
Mexico, Korea & South Africa
Mexico, Korea & South Africa
Mexico is highly levered to the US economy. A deep contraction in American demand for consumer discretionary goods and international travel will suffocate Mexico’s export revenues. Exports of automobiles and tourism revenues together account for 37% of total goods and services exports, and 13% of GDP (Chart I-5). Balancing pros and cons, we recommend the following strategy for Mexican markets: Continue to overweight local currency bonds and sovereign credit within their respective EM benchmarks (Chart I-6). Orthodox fiscal and monetary policies warrant an overweight stance on fixed-income plays. Chart I-5Autos And Tourism Revenues Are Significant
Autos And Tourism Revenues Are Significant
Autos And Tourism Revenues Are Significant
Chart I-6Mexico Versus EM: Domestic Bonds And Sovereign Credit
Mexico Versus EM: Domestic Bonds And Sovereign Credit
Mexico Versus EM: Domestic Bonds And Sovereign Credit
We reiterate our trade to receive Mexican 10-year swap rates. The only reason we are reluctant to be long cash domestic bonds is the potential for further currency depreciation. Finally, we are maintaining an overweight stance on equities, even though we acknowledge the very bad profit outlook. However, historically whenever Mexican interest rates have fallen relative to EM, Mexican stocks have typically outperformed the EM equity benchmark (Chart I-7). This is the primary rationale behind our equity overweight stance. Chart I-7Mexico vs. EM: Government Bond Yields Are Inversely Correlated To Stock Prices
Mexico vs. EM: Government Bond Yields Are Inversely Correlated To Stock Prices
Mexico vs. EM: Government Bond Yields Are Inversely Correlated To Stock Prices
Juan Egaña Research Associate juane@bcaresearch.com South Korea: Bonds Offer Value Amid Looming Deflation The South Korean economy is facing strong deflationary pressures, requiring significant and additional rate cuts. Meanwhile, 10-year government bonds yield are still at 1.4%, 75 basis points over 10-year US Treasurys (Chart II-1). Hence, Korea’s bond yields offer good value for fixed-income investors and have considerable downside. We have been receiving 10-year swap rates in Korea since 2011 and are reiterating this recommendation: Chart II-2 shows that the GDP deflator has been negative since 2018, and core and trimmed mean consumer prices are flirting with deflation. Chart II-1Korean Government Bonds Yields: More Room To Fall
Korean Government Bonds Yields: More Room To Fall
Korean Government Bonds Yields: More Room To Fall
Chart II-2The Korean Economy Is Flirting With Deflation
The Korean Economy Is Flirting With Deflation
The Korean Economy Is Flirting With Deflation
Falling prices amid elevated corporate and household debt levels – at 102% and 96% of GDP respectively – is toxic. The basis is price deflation increases real debt burdens. Notably, the debt service ratio for businesses and households is very high at 19.9% of GDP. There is no reason why Korea’s policy rate should not be reduced close to zero as is the case in advanced economies. Exports – which account for some 40% of GDP – are plunging. The business survey from Bank of Korea suggests exporters’ business sentiment plunged by a record in May and is close to 2008 levels, pointing to a dreadful export outlook. (Chart II-3) Domestic demand will remain weak, despite the large fiscal response to the COVID-19 outbreak. Business investment and hiring will be depressed for a while, undercutting consumer spending (Chart II-4). Chart II-3Exports In Freefall
Exports In Freefall
Exports In Freefall
Chart II-4Less Investment Plan And Poor Employment Outlook
Less Investment Plan And Poor Employment Outlook
Less Investment Plan And Poor Employment Outlook
Chart II-5Falling Residential Construction Permits
Falling Residential Construction Permits
Falling Residential Construction Permits
Finally, residential investment was in the doldrums even before the COVID-19 outbreak. Chart II-5 illustrates that declining residential construction permits preclude lower residential construction for the rest of the year. The Bank of Korea will have to cut interest rates considerably this year. From a big-picture perspective, there is no reason why Korea’s policy rate should not be reduced close to zero as is the case in advanced economies. Korea’s economy shares many similarities with advanced economies like high debt levels and persistent deflationary pressures. On top of this, Korea is much more exposed to global trade, which makes its cyclical outlook worse, heralding substantial monetary easing. Exchange Rate Low interest rates could undermine the Korean won, even though the exchange rate has not historically been driven by interest rate differentials. The key driver of the won – shrinking global trade volumes and deflating tradable goods prices – warrants a cheaper currency to mitigate the negative impact on corporate profitability (Chart II-6). Chart II-6Deflating Export Prices Herald Currency Depreciation
Deflating Export Prices Herald Currency Depreciation
Deflating Export Prices Herald Currency Depreciation
Chart II-7Deflating Semiconductor Prices...
Deflating Semiconductor Prices...
Deflating Semiconductor Prices...
Besides, deflation in DRAM prices (Chart II-7) as well as DRAM sales point to further currency depreciation and lower Korean tech stock prices (Chart II-8). Chart II-8...Does Not Bode Well For Tech Stocks
Semiconductor Prices Are Still Deflating ...Does Not Bode Well For Tech Stocks
Semiconductor Prices Are Still Deflating ...Does Not Bode Well For Tech Stocks
Overall, a weak currency is needed to alleviate deflationary pressures currently present in the economy. Stocks We are negative on the KOSPI in absolute terms but continue to recommend that EM-dedicated equity portfolio investors overweight this bourse. Despite being a highly cyclical market, we believe the KOSPI’s outperformance will be due to its large weight in tech stocks. The latter will benefit from China’s ambitious tech-related infrastructure plan in the coming years. The plan includes construction of Information Transmission, Software and Information Technology Services, such as 5G networks, industrial internet and data centers. We expect total investment will reach between US$182 billion and $266 billion by the end of 2020, an increase of 30-50% over last year. Importantly, 40% of Korea’s semiconductor exports are purchased by China. We have been playing the semiconductor theme via Korea rather than Taiwan because the latter is a wild card amid escalating geopolitical tensions between the US and China. Our geopolitical team expects a flare up in US-China tensions ahead of US elections this year, and Taiwan could become one of the focal points. Bottom Line: Continue receiving 10-year swap rates, shorting the won against the US dollar and overweighting the KOSPI within an EM dedicated equity portfolio. Lin Xiang, CFA Research Analyst linx@bcaresearch.com South Africa: A Point Of No Return On Public Debt South Africa’s public debt is bound to surge to unsustainable levels: from 62% of GDP in 2019 to 95% of GDP by the end of 2021. If the government is forced to take over unsustainable debt from state-owned enterprises, which is very likely, it will push up the public debt-to-GDP ratio further by another nine percentage points to 104% of GDP. Table III-1 summarizes South Africa’s public debt projections using the following parameters and assumptions: To fight the COVID-19-induced economic crunch, President Cyril Ramaphosa recently announced a fiscal stimulus package of $26 billion (R500 billion), or 10% of GDP. Using recent government and central bank projections for 2020 and 2021, nominal GDP growth is expected to contract by 2.5% and expand 6.7%, respectively. Notably, fiscal revenue growth is expected to fall by 32% in nominal terms, according to recent comments by the Minister of Finance.1 Meanwhile, government spending will grow by 15%,2 and the primary fiscal deficit is expected to widen to 15.4% of GDP in 2020. Given that government forecasts often tend to be optimistic, chances are that both the primary deficit and public debt-to-GDP ratio will overshoot these forecasts. Finally, the sharp drop in domestic demand will increase the odds of a default among state-owned enterprises, with Eskom likely being a case in point. Current government guidelines require at least two thirds of Eskom’s R450 billion debt to be transferred to government balances in the event of default or anticipated default. In such a case, this increases the government debt-to-GDP ratio by an additional R350 billion, or 7% of GDP. Table III-1Projections For South Africa Fiscal Position And Public Debt
Mexico, Korea & South Africa
Mexico, Korea & South Africa
Altogether, the public debt-to-GDP ratio will surge to 104% of GDP by the end of 2021 (Chart III-1). With public debt above 100% of GDP, interest rates well above nominal GDP and the government running large primary deficits, debt dynamics will become unsustainable. To avoid a public debt crisis, the government should either run large primary surpluses, which is unfeasible anytime soon, or bring down government borrowing costs to push up nominal GDP above interest rates (Chart III-2). Chart III-1Public Debt-To-GDP Will Balloon To 104%!
Public Debt-To-GDP Will Balloon To 104%!
Public Debt-To-GDP Will Balloon To 104%!
Chart III-2Unsustainable Gap Between Local Yields And Nominal Growth
Unsustainable Gap Between Local Yields And Nominal Growth
Unsustainable Gap Between Local Yields And Nominal Growth
The latter option is the only one that is politically feasible. But to do so, the central bank needs to resort to the monetization of public debt. The central bank (SARB) has already taken the first step to bring down bond yields by buying government bonds in the secondary market. While the rationale of that was to cover foreign investors’ selling of local currency bonds, it amounts to nothing else but quantitative easing, or public debt monetization. Ultimately, the outcome of large fiscal deficits and public debt monetization is a weaker currency. As such, debt monetization is a fait accompli in South Africa. Monetizing part of the government’s debt will help reduce real borrowing costs and at the same time reflate nominal GDP growth, thereby boosting government revenues. Ultimately, the outcome of large fiscal deficits and public debt monetization is a weaker currency. If foreigners continue to sell the local currency bond market, the SARB and commercial banks will need to buy more government debt, creating even more money. This is why we expect the rand to continue depreciating. Investment Recommendations Chart III-3The Rand Could Drop Further Given Public Debt Dynamics
The Rand Could Drop Further Given Public Debt Dynamics
The Rand Could Drop Further Given Public Debt Dynamics
The currency will likely get cheaper provided the rising odds of outright public debt monetization (Chart III-3). Continue shorting the rand versus the US dollar. We are initiating a new position of receiving 2-year swap rates. Odds are that the central bank will cut rates further in the months to come. Remain underweight local currency bonds in an EM-dedicated portfolio. Even though local domestic rates will likely fall, South African bonds will not outperform the EM benchmark on a total return in US dollar basis, mostly due to chronic currency depreciation. Finally, investors should underweight sovereign credit (government US dollar bonds) due to the unsustainable public debt dynamics. Dedicated EM equity portfolio investors should maintain a below-benchmark allocation to this bourse. Andrija Vesic Associate Editor andrijav@bcaresearch.com Footnotes 1 The Minister of Finance made remarks about tax revenue falling by 32% in nominal terms. Tax revenues represent almost 100% of overall revenue. 2 Overall fiscal package is estimated to be 3% of GDP. This excludes reprioritization in 2020 around R130 billion & loan guarantee scheme of R200 billion. Overall total additional spending amounts to R170 billion in 2020 fiscal year. Equities Recommendations Currencies, Credit And Fixed-Income Recommendations
EM versus S&P 500: Three Conditions For A Reversal
…
Highlights Even though EM equities appear cheap, the key near-term threats to them are their poor fundamentals and a renewed sell off in the S&P 500. Given the immense uncertainty, the current equity risk premium (ERP) should be at the upper end of its historical range. Hence, the discount rate – the sum of the risk-free rate and the ERP – should be reasonably high. This makes US equity valuations rather expensive. The key risk to our defensive strategy is that the rally in global growth stocks evolves into a full-fledged mania. Feature Every investor is aware that global corporate profits have collapsed due to nationwide lockdowns and profits will eventually recover as the lockdowns are gradually eased. This thesis, though, is not helpful for equity investors. To price equities properly, investors need to know how low corporate profits will fall and how fast and strong the eventual recovery will be. Currently, visibility on the magnitude and speed of the decline in profits and the subsequent recovery is factually nil. In fact, very few companies are providing any guidance. There is enormous uncertainty surrounding the pace at which economies will be reopened, the possibility of secondary infection outbreaks and the discovery of a remedy or a vaccine for this virus. Besides, it is hard to forecast how fast animal spirits will revive among consumers and businesses worldwide. Thus, it is impossible to reliably forecast the magnitude and pace of both the decline in corporate profits and the subsequent recovery. What framework should investors use to value stocks when facing extremely low visibility? The CAPE Ratio Presently, the best method for valuing stocks is the Cyclically-Adjusted P/E (CAPE) ratio. This is a structural valuation measure that looks beyond the profit cycle, i.e., removes the cyclicality of earnings per share (EPS) from P/E ratio calculations. When the profit outlook is as muddy as it is today and the possible range of outcomes is very wide, it is safe to assume that in the next 12-18 months corporate profits will revert to their historical trend, i.e., drop below and then recover to their structural trend. This is a better conjecture than any attempt to forecast the magnitude and speed of both the profit plunge and subsequent recovery. Hence, the appropriate question for investors at this time is: what is the forward P/E multiple on equities assuming that EPS will plummet and then recover to their historical trend over the next 12 to 18 months? The CAPE model provides the answer to this question. Presently, the best method for valuing stocks is the Cyclically-Adjusted P/E (CAPE) ratio. Chart I-1 illustrates our EM CAPE model, showing EM equities as cheap as they were at previous major bear market bottoms. The EM CAPE is presently 12.5 assuming EM EPS plunge further in the coming months but recover to their long-run trend in 12-18 months from now (Chart I-1, bottom panel). Our measure for US CAPE presently stands in high 20s, well above its historical average of 18 (Chart I-2). Chart I-1EM Equity Valuations Are Low
EM Equity Valuations Are Low
EM Equity Valuations Are Low
Chart I-2US Equity Valuations Are Expensive
US Equity Valuations Are Expensive
US Equity Valuations Are Expensive
Box I-1 on page 3 elaborates how our CAPE model is built and how it differs from Shiller’s CAPE ratio. Even though EM equities are very cheap, the key near-term threats to them are two-fold: (1) EM fundamentals remain downbeat, which is creating a near-term risk to share prices; and (2) a renewed sell off in the S&P 500 would drag EM stocks lower, despite cheap EM equity valuations. In the next section, we explore US equity valuations in a bit more detail. BOX I-1 Our CAPE Versus The Shiller CAPE: Differences In Methodologies Due to the lack of historical data for EM, we were unable to use Robert Shiller's methodology for constructing the CAPE ratio for developing markets. The Shiller method uses a 10-year moving average of EPS to calculate the cyclically adjusted EPS. However, in the case of EM aggregate EPS, data only goes back to 1986. If we were to calculate a 10-year moving average for EM EPS, we would lose 10 years of data, and the valuation indicator would only start in 1996. This is too short a time-frame for a structural valuation indicator. Chart I-3Comparing Two CAPE Methodologies
Comparing Two CAPE Methodologies
Comparing Two CAPE Methodologies
Instead, we used the following methodology to construct the CAPE ratio for EM: We deflated EM EPS and EM equity prices (both in US dollar terms) by US consumer price inflation to get EM EPS and EM share prices in real (inflation-adjusted) US dollar terms. Then we ran a regression of EM EPS in real US dollar terms against a time trend. The resulting trend line represents the cyclically adjusted or structural EPS in real US dollar terms (Chart I-1, bottom panel on page 1). Finally, we divided EM stock prices in real US dollar terms by the cyclically-adjusted real US dollar EM EPS trend line. The outcome is the EM CAPE ratio (Chart I-1, top panel on page 1). To be sure that our methodology produced a reasonable outcome, we computed a CAPE ratio using our methodology for the US stock market and compared it with the Shiller CAPE ratio. Chart I-3 illustrates that our methodology generated a CAPE ratio that is similar to Shiller’s CAPE ratio. We are therefore confident that the results generated by our CAPE methodology are robust and sensible. Low Visibility = High Equity Risk Premium Chart I-4CAPE Ratio Negatively Correlates With Corporate Bond Yields
CAPE Ratio Negatively Correlates With Corporate Bond Yields
CAPE Ratio Negatively Correlates With Corporate Bond Yields
It is a well-known fact that US equity multiples are very high. However, a common narrative in the investment community often justifies currently high US equity multiples by very low interest rates. One consideration that is missing in this argument is the equity risk premium. The P/E ratio is negatively correlated to the discount rate.1 The discount rate is the sum of the risk-free rate and the equity risk premium (ERP). Chart I-4 demonstrates that US CAPE ratio has been inversely correlated with corporate bond (BAA) yields. The latter includes both risk-free government bond yields and corporate credit spreads. Presently, one should use an ERP that is materially higher than its historical mean. Investors are currently facing record high uncertainty related to the business cycle as well as the structural trends in economic, political and geopolitical spheres. In short, enormous lingering uncertainty warrants using an ERP that is at the upper range of its historical trend. Critically, ERP is not a static variable. Yet, many equity valuation models assume that the ERP is constant and, therefore, compare equity multiples with risk-free rates. Such models are wrong-headed because a change in the ERP can in itself cause large fluctuations in share prices. Chart I-5Estimated US Equity Risk Premium
Estimated US Equity Risk Premium
Estimated US Equity Risk Premium
Going forward, visibility on both the evolution of the virus containment measures and the global business cycle will eventually improve and, thereby, decrease ERPs that investors require. This will produce a lower discount rate heralding higher equity multiples. As of today, however, the tremendous uncertainty about the outlook still warrants a higher ERP. Chart I-5 illustrates that the US ERP based on our CAPE model is presently 270 basis points. It is elevated but still below historic peaks recorded in 2008 and 2011. Provided we face extremely limited visibility about the global outlook, we contend that the US ERP will likely rise in the short run. The latter will depress US equity valuations and prices. Bottom Line: Given the immense ambiguities investors are facing in regard to the business cycle and to economic, political and geopolitical trends, the ERP should be at the upper end of its historical range. Hence, the discount factor – the sum of the risk-free rate and the ERP – should be reasonably high. We conclude that US equity valuations are rather expensive despite the very low risk-free rate. Falling US stocks will drag EM share prices lower. EM Versus The S&P 500: Three Conditions For A Reversal Chart I-6Relative CAPE Ratio: EM Versus US
Relative CAPE Ratio: EM Versus US
Relative CAPE Ratio: EM Versus US
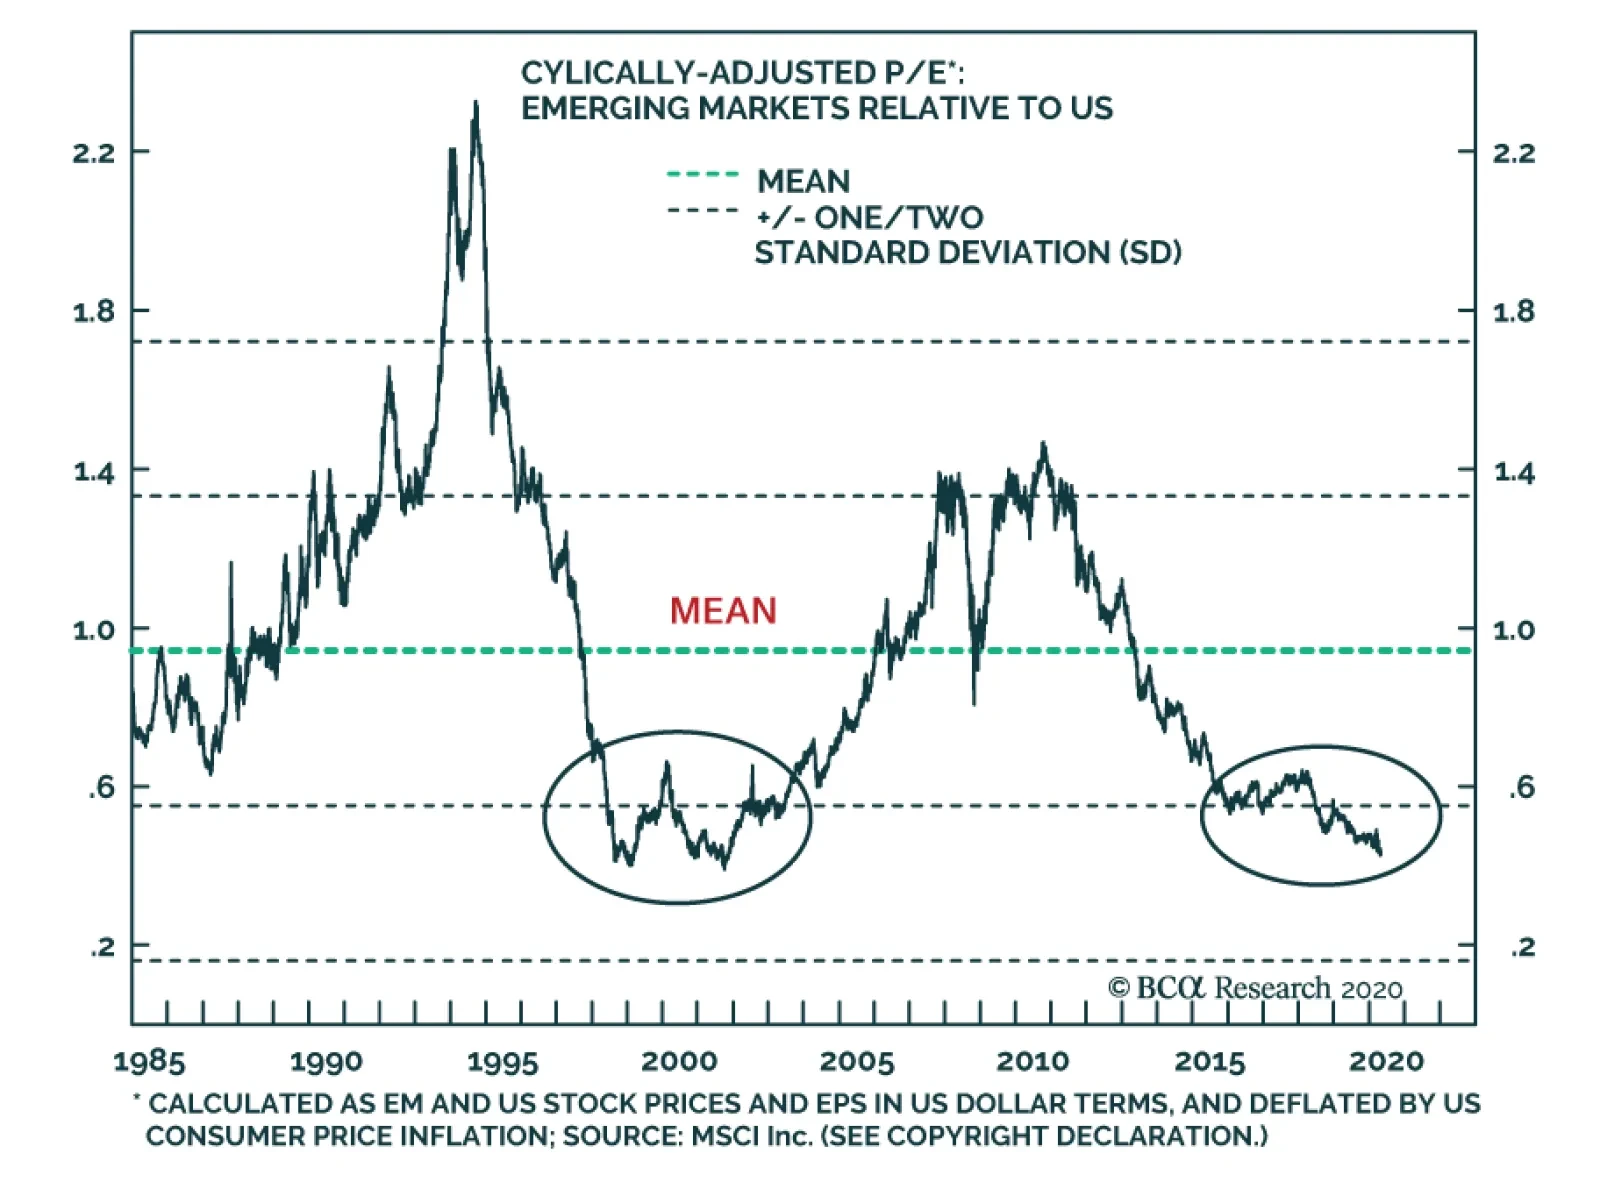
The relative EM versus US CAPE ratio is shown on Chart I-6. According to it, EM equities relative to their US counterparts are as cheap as they were at their previous major bottom in 2001. Nevertheless, valuation is not a good timing tool. For EM to start outperforming the S&P 500, three conditions are required: 1. China’s economy should embark on a cyclical recovery that is greater than the natural snapback in activity that it has been experiencing in the wake of the end of its lockdown. So far, the mainland economy is still in a snapback phase rather than in an expansion mode. 2. Global equity sector leadership should rotate from growth to value stocks, such as resource-related and banks. This has not occurred yet. The EM equity index is more sensitive to the performance of financials than the S&P 500 is. Table I-1 and I-2 represents individual EM and US sector weights in terms of both market cap and total corporate earnings in their respective equity benchmark. Financials account for 36.6% of EM total earnings and 20.9% of EM market cap. The same ratios for US financials in America’s broad equity index are 22.2% for earnings and 10.5% for the market cap. Table I-1EM Equity Sector Earnings And Market Cap Weights
Equity Valuations Amid Low Visibility
Equity Valuations Amid Low Visibility
Table I-2US Equity Sector Earnings And Market Cap Weights
Equity Valuations Amid Low Visibility
Equity Valuations Amid Low Visibility
Further, EM equity prices remain highly correlated to global materials stocks (Chart I-7). As we discussed in our October 10, 2019 report, the rationale is as follows: both industrial metal prices and EM equities are driven primarily by China. Enormous lingering uncertainty warrants using an ERP that is at the upper range of its historical trend. 3. The US dollar should enter an extended bear market. The greenback has been resilient despite the Federal Reserve’s outright debt monetization and the general risk-on mood in global equity and credit markets. Further, the EM ex-China currency index has failed to rebound despite the noteworthy rally in the S&P 500 since late March (Chart I-8). Chart I-7EM Stocks Correlate With Global Materials
EM Stocks Correlate With Global Materials
EM Stocks Correlate With Global Materials
Chart I-8EM Currencies Have Failed To Rally
EM Currencies Have Failed To Rally
EM Currencies Have Failed To Rally
For the greenback to depreciate, US dollars should be recycled overseas via augmented US imports or capital outflows from the US. It seems that none of this is currently taking place. The dollar is probably experiencing the last leg of its structural bull market that commenced in 2011. In financial markets, the final phase of a structural trend can last longer and run further than many investors expect. Odds are that the greenback will overshoot before topping out. Chart I-9 presents the real effective exchange rate for the US dollar, the euro and the Japanese yen, based on unit labor costs. This is our favored currency valuation measure. It reveals that the greenback is already expensive, but that its valuation can become even more expensive and reach two standard deviations above fair value before the US dollar peaks. In turn, according to the same measure, valuations of commodity currencies like NZD, AUD and CAD have downshifted considerably (Chart I-10). Nevertheless, they are not yet very cheap. Therefore, further undershoots cannot be ruled out. Chart I-9G3 Currency Valuations
G3 Currency Valuations
G3 Currency Valuations
Chart I-10Commodity Currencies Valuations
Commodity Currencies Valuations
Commodity Currencies Valuations
Bottom Line: The conditions for EM stocks to begin outperforming the S&P 500 have not yet been satisfied. EM outperformance is not imminent. The Key Risk The key risk to our strategy of not chasing the recent equity rebound is as follows: The rally in expensive global growth stocks could evolve into a full-fledged mania. The latter would then lift the broader equity index, including value stocks. The average retail investor in any corner of the world can now make the case for an exponential rise in growth stocks: major central banks are printing money, risk-free interest rates are at zero, businesses in “new economy” are relatively immune to COVID shutdowns and, moreover, they represent the future. All conditions for a bubble formation are present: a concept that captures the average person’s imagination, good fundamentals and solid past performance, as well as liquidity overflow. Growth companies that are leading this rally are very expensive and over-owned while the laggards – the value stocks – have a ruinous profit outlook. The only problem with this thesis is that these stocks have already rallied massively over the past decade and are consequently expensive and over-owned (Chart I-11). Chart I-11Each Decade Had A Mania
Each Decade Had A Mania
Each Decade Had A Mania
Can they still go higher, dragging up overall equity indexes? They can, as the human imagination has no limits. If retail investors continue piling up on stocks – and there is some evidence they have been doing so – share prices will rise despite the expensive valuation of growth companies and the disastrous profit outlook for value stocks. Like any bubble, this mania, if it occurs, will eventually culminate with a crash. Investment Conclusions Chart I-12Growth And Value Stocks
Growth And Value Stocks
Growth And Value Stocks
EM equities have become cheap and oversold, which is why we closed our short position in EM stocks on March 19. Nevertheless, we have not yet recommended buying or overweighting EM stocks. The near-term outlook remains risky and EM valuations could remain depressed for a while given that investors currently face zero visibility. Consistently, the risk-reward of global and EM equities is yet not attractive. The basis is as follows: Growth companies that are leading this rally are very expensive and over-owned while the laggards – the value stocks – have a ruinous profit outlook (Chart I-12). For now, we continue recommending underweighting EM versus DM equities. Arthur Budaghyan Chief Emerging Markets Strategist arthurb@bcaresearch.com Footnote 1 The P/E ratio inversely correlates to the discount rate: P/E ratio = (Payout rate x (1 + Growth rate)) / (Discount rate – Growth rate)
Dear Client, With this weekly update on the Chinese economy, we are sending you a Special Report published by BCA Geopolitical Strategy team and authored by my colleague Matt Gertken. Lately we have been getting numerous questions from our clients, on the risk of a significant re-escalation in the US-China conflict. Matt’s report provides timely insights on the topic, and we trust you will find the report very helpful. Best regards, Jing Sima, China Strategist Feature An Update On The Chinese Economy Since mid-April, the speed of resumption in China’s domestic business activity has accelerated. Industrial enterprises appear to be operating at 87% of normal activity levels as of May 11, up from 81.8% one month ago. Small to medium-sized enterprise (SMEs) are estimated to now operate at 87.3% of their normal activity, a vast improvement from 82.3% just two weeks ago. Chart 1Pickup In M1 Still Modest
Pickup In M1 Still Modest
Pickup In M1 Still Modest
The material easing in monetary conditions and strong flows of local government special-purpose bond issuance in the past two months helped jump start a recovery in the construction sector. But at this early stage of a domestic economic rebound and in the middle of a deep global economy recession, China’s corporate marginal propensity to invest remains muted (Chart 1). Household consumption showed some resilience during last week’s “Golden Week” holiday. The strength in big-ticket item purchases, however, was highly concentrated among consumers in China’s wealthiest urban areas (Chart 2). The COVID-19 pandemic has created a situation resembling a combination of SARS and the global financial crisis. Now the physical constraints on consumption have largely been lifted, consumers’ willingness to spend, after a brief period of compensatory spending, will be suppressed if their expectations of the medium-term job and income security remain pessimistic (Chart 3). Chart 2A Compensatory Rebound In Big-Ticket Item Sales
A Compensatory Rebound In Big-Ticket Item Sales
A Compensatory Rebound In Big-Ticket Item Sales
Chart 3The Average Chinese Consumer Remains Cautious
The Average Chinese Consumer Remains Cautious
The Average Chinese Consumer Remains Cautious
Next week we will publish a report, focusing on China’s consumption in a post-pandemic environment. Looking forward, we maintain the view that China’s business activity will pick up momentum in H2, when the massive monetary and fiscal stimuli continue working its way into the economy. Downside risks to employment and income loom large, which makes it highly unlikely that the authorities will tighten their policy stance any time soon. As such, while we maintain our defensive tactical positioning due to near-term economic and geopolitical uncertainties, our view remains constructive on both the economy and Chinese financial asset prices in the next 6 to 12 months. (Chart 4). Chart 4Recovery To Gain Traction In H2
Recovery To Gain Traction In H2
Recovery To Gain Traction In H2
Jing Sima China Strategist jings@bcaresearch.com #WWIII The phrase “World War III” or #WWIII went viral earlier this year in response to a skirmish between the US and Iran (Chart 1). Only four months later, the US and China are escalating a strategic rivalry that makes the Iran conflict look paltry by comparison (Chart 2). Chart 1US-Iran Tensions Were Just A Warm-Up
#WWIII
#WWIII
Chart 2The Thucydides Trap
The Thucydides Trap
The Thucydides Trap
Fortunately, the two great powers are constrained by the same mutually assured destruction that constrained the US and the Soviet Union during the Cold War. They are also constrained by the desire to prevent their economies from collapsing further. Unfortunately, the intensity of their rivalry can escalate dramatically before reaching anything truly analogous to the Berlin Airlift or Cuban Missile Crisis – and these kinds of scenarios are not out of the question. Safe haven assets will catch a bid and the recovery in US and global risk assets since the COVID selloff will be halted. We maintain our defensive tactical positioning and will close two strategic trades to book profits and manage risk. In the wake of the pandemic and recession, geopolitics is the next shoe to drop. The War President Over the past 24 hours the White House has taken several steps indicating that President Trump is adopting the “war president” posture in the run-up to the US election: Export controls: Trump has gone forward with new export controls on “dual-purpose” technologies – those that have military as well as civilian applications, in a delayed reaction to China’s policy of civil-military technological fusion. The Commerce Department has wide leeway in whether to grant export licenses under the rule – but it is a consequential rule and would be disruptive if enforced strictly. Supply chain de-risking: Trump is also going forward with new restrictions on the import of foreign parts for US power plants and electricity grid. The purpose is to remove risks from critical US infrastructure. COVID investigation: Trump has hinted that the novel coronavirus that causes the COVID-19 disease may have originated in the Wuhan Institute of Virology. The Director of National Intelligence issued a statement indicating that the Intelligence Community does not view the virus as man-made (not a bio-weapon), but is investigating the potential that the virus transferred to humans at the institute. The State Department had flagged the institute for risky practices long before COVID. Trump avoided the bio-weapon conspiracy theory and is focused on the hypothesis that the laboratory’s investigations into rare coronaviruses led to the outbreak. New tariffs instead of reparations: Director of the National Economic Council Larry Kudlow denied that the US would stop making interest and principal payments on some Chinese holdings of US treasuries. He said that the “full faith and credit of the United States’ debt obligation is sacrosanct. Absolutely sacrosanct.” Trump denied that this form of reparations, first floated by Republican Senator Marsha Blackburn of Tennessee, was under consideration. Instead he suggested that new tariffs would be much more effective, raising the threat for the first time since the Phase One trade deal was agreed in principle in December. Strategic disputes: Tensions have flared up in specific, concrete ways across the range of US-Chinese relations – in the cyber-realm, psychological warfare, Korean peninsula, Taiwan Strait, and South China Sea. These could lead to sanctions. The war president posture is one in which President Trump recognizes that reelection is extremely unlikely in an environment of worse than -4.8% economic growth and likely 16% unemployment. Therefore he shifts the basis of his reelection to an ongoing crisis and appeals to Americans’ patriotism and desire for continuity amid crisis. Bottom Line: Protectionism is not guaranteed to work, and therefore it was not ultimately the path Trump took last year when he still believed a short-term trade deal could boost the economy. Now the bar to protectionism has been lowered. The Decline Of US-China Relations President Trump may still be bluffing, China may take a conciliatory posture, and a massive cold war-style escalation may be avoided. However, it is imprudent to buy risk assets on these reasons today, when the S&P 500’s forward price-to-earnings ratio stands at 20.15. It is more prudent to prepare for a historic escalation of tensions first, buy insurance, then reassess. Why? Because the trajectory of US-China relations is empirically worsening over time. US household deleveraging and the Chinese shift away from export-manufacturing (Chart 3) broke the basis of strong relations during the US’s distractions in Iraq and Afghanistan and China’s “peaceful rise” in the early 2000s. US consumers grew thriftier while Chinese wages rose. Not only has China sought economic self-sufficiency as a strategic objective since General Secretary Xi Jinping took power in 2012, but the Great Recession, Trump trade war, and global pandemic have accelerated the process of decoupling between the two economies. Decoupling is an empirical phenomenon, and it has momentum, however debatable its ultimate destination (Chart 4). Obviously policy at the moment is accelerating decoupling. Chart 3The Great Economic Divorce
The Great Economic Divorce
The Great Economic Divorce
Chart 4Decoupling Is Empirical
Decoupling Is Empirical
Decoupling Is Empirical
The US threat to cease payments on some of China’s Treasury holdings is an inversion of the fear that prevailed in the wake of 2008, that China would sell its treasuries to diversify away from dependence on the US and the greenback. China did end up selling its treasuries, but the US was not punished with higher interest rates because other buyers appeared. The US remains the world’s preponderant power and ultimate safe haven (Chart 5). By the same token, Trump and Kudlow naturally poured water on the threat of arbitrarily stopping payments because that would jeopardize America’s position. Instead Trump is threatening a new round of trade tariffs. Since the US runs a large trade deficit with China, and China is more exposed to trade generally, the US has the upper hand on this front. But it is important to notice that US tariff collections as a share of imports bottomed under President Obama (Chart 6). Chart 5Treasuries Can't Be Weaponized By Either Side...
Treasuries Can't Be Weaponized By Either Side...
Treasuries Can't Be Weaponized By Either Side...
Chart 6... But Tariffs Can And Will Be
... But Tariffs Can And Will Be
... But Tariffs Can And Will Be
The US shift away from free trade toward protectionism occurred in the wake of the 2008 financial crisis. President Trump then popularized and accelerated this policy option in an aggressive and unorthodox way. Trade tariffs are a tool of American statecraft, not the whim of a single person, who may exit the White House in January 2021 anyway. The retreat from globalization is not a passing fancy. Today’s recession also marks the official conclusion of China’s historic 44 year economic boom – and hence a concrete blow to the legitimacy of the ruling Communist Party (Chart 7). The more insular, autarkic shift in the Communist Party’s thinking is not irreversible, but there are no clear signs that Xi Jinping is pivoting toward liberalism after eight years in power. Chart 7Recession Destabilizes The 'G2' Powers
Recession Destabilizes The 'G2' Powers
Recession Destabilizes The 'G2' Powers
China’s unemployment rate has been estimated as high as 20.5% by Zhongtai Securities, which then retracted the estimate (!). It is at least at 10%. Moreover 51 million migrant workers vanished from the job rolls in the first quarter of the year. Maximum employment is the imperative of East Asian governments, especially the Communist Party, which has not dealt with joblessness since the late 1990s. The threat to social and political stability is obvious. The party will take extraordinary measures to maintain stability – not only massive stimulus but also social repression and foreign policy distraction to ensure that people rally around the flag. Xi Jinping has tried to shift the legitimacy of the party from economic growth to nationalism and consumerism, the “China Dream.” But the transition to consumer growth was supposed to be smooth. Financial turmoil, the trade war, and now pandemic and recession have forced the Communist Party off the training wheels well before it intended. Xi’s communist ideology, economic mercantilism, and assertive foreign policy have created an international backlash. The US is obviously indulging in nationalism as well. A stark increase in inequality and political polarization exploded in President Trump’s surprise election on a nationalist and protectionist platform in 2016 (Chart 8). All candidates bashed China on the campaign trail, but Trump was an anti-establishment leader who disrupted corporate interests and followed through with his tariff threats. The result is that the share of Americans who see China’s power and influence as a “major threat” to the United States has grown from around 50% during the halcyon days of cooperation to over 60% today. Those who see it as a minor threat have shrunk to about a quarter of the population (Chart 9). Chart 8A Measure Of Inequality In The US
A Measure Of Inequality In The US
A Measure Of Inequality In The US
Chart 9US Nationalism On The Rise
#WWIII
#WWIII
Chart 10Broad-Based Anti-China Sentiment In US
#WWIII
#WWIII
As with US tariff policy, the bipartisan nature of US anger toward China is significant. More than 60% of Democrats and more than 50% of young people have an unfavorable view of China. College graduates have a more negative opinion than the much-discussed non-college-educated populace (Chart 10). Already it is clear, in Joe Biden’s attack ads against Trump, that this election is about who can sound tougher on China. The debate is over who has the better policy to put “America first,” not whether to put America first. Biden will try to steal back the protectionist thunder that enabled Trump to break the blue wall in the electorally pivotal Rust Belt in 2016 (Map 1). Biden will have to win over these voters by convincing them that he understands and empathizes with their Trumpian outlook on jobs, outsourcing, and China’s threats to national security. He will emphasize other crimes – carbon emissions, cyber attacks, human rights violations – but they will still be China’s crimes. He will return to the “Pivot to Asia” foreign policy of his most popular supporter, former President Barack Obama. Map 1US Election: Civil War Lite
#WWIII
#WWIII
Bottom Line: Economic slowdown and autocracy in China, unprecedented since the Cultural Revolution, is clashing with the United States. Broad social restlessness in the US that is resolving into bipartisan nationalism against a peer competitor, unprecedented since the struggle with the Soviets in the 1960s, is clashing with China. Now is not the time to assume global stability. Constraints Still Operate, But Buy Insurance The story outlined above is by this time pretty well known. But the “Phase One” trade deal allowed global investors to set aside this secular story at the beginning of the year. Now, as Trump threatens tariffs again, the question is whether he will resort to sweeping, concrete, punitive measures against China that will take on global significance – i.e. that will drive the financial markets this year. Trump is still attempting to restore his bull market and magnificent economy. As long as this is the case, a constraint on conflict operates this year. It is just not as firm or predictable. Therefore we are looking for three things. First, will President Trump’s approval rating benefit so much from his pressure tactics on China that he finds himself driven into greater pressure tactics? This raises the risk of policy mistakes. Second, will Trump’s approval rating fall into the doldrums, stuck beneath 43%, as the toll of the recession wears on him and popular support during the health crisis fades? “Lame duck” status would essentially condemn him to electoral loss and incentivize him to turn the tables by escalating the conflict with China. Chart 11Trump May Seek A Crisis ‘Bounce’ To Popularity
#WWIII
#WWIII
Presidents are not very popular these days, but a comparison with Trump’s two predecessors shows that while he can hardly obtain the popularity boost that Obama received just before the 2012 election, he could hope for something at least comparable to what George W. Bush received amid the invasion of Iraq (Chart 11). (Trump has generally been capped at 46% approval, the same as his share of the popular vote in 2016.) The reason this is a real risk, not a Shakespearean play, is outlined above: however cynical Trump’s political calculus, he would be reasserting US grand strategy in the face of a great power that is attempting to set up a regional empire from which, eventually, to mount a global challenge. Thus if he is convinced he cannot win the election anyway, this risk becomes material. Investors should take seriously any credible reports suggesting that Trump is growing increasingly frustrated with his trailing Biden in head-to-head polls in the swing states. Third, will China, under historic internal stress, react in a hostile way that drives Trump down the path of confrontation? China has so far resorted to propaganda, aircraft carrier drills around the island of Taiwan, and maritime encroachments in the South China Sea – none of which is intolerably provocative to Trump. A depreciation of the renminbi, a substantial change to the status quo in the East or South China Seas, or an attempt to vitiate US security guarantees regarding US allies in the region, could trigger a major geopolitical incident. A fourth Taiwan Strait crisis is fully within the realm of possibility, especially given that Taiwan’s “Silicon Shield” is fundamentally at stake. While we dismissed rumors of Kim Jong Un’s death in North Korea, any power vacuum or struggle for influence there is of great consequence in today’s geopolitical context. Aggressive use of tariffs always threatened to disrupt global trade and financial markets, but tariffs function differently in the context of a global economic expansion and bull market, as in 2018-19, than they do in the context of a deep and possibly protracted recession. Trump has a clear political incentive to be tough on China, but an equally clear financial and economic incentive to limit sweeping punitive measures and avoid devastating the stock market and economy. If events lower the economic hurdle, then the political incentive will prevail and financial markets will sell. Bottom Line: However small the risk of Trump enacting sweeping tariffs, the downside is larger than in the 2018-19 period. The stock market might fall by 40%-50% rather than 20% in an all-out trade war this year. Investment Takeaways Go tactically long US 10-year treasuries. Book a 9.7% profit on our long 30-year US TIPS trade. Close long global equities (relative to US) for a loss of 3.8%. Matt Gertken Vice President Geopolitical Strategist mattg@bcaresearch.com Footnotes Cyclical Investment Stance Equity Sector Recommendations
BCA Research's US Bond Strategy service recommends that US bond investors should avoid USD-denominated EM sovereign debt and focus instead on US corporate credit-rated Ba and higher. Of the EM countries with large USD bond markets, Mexican debt looks most…
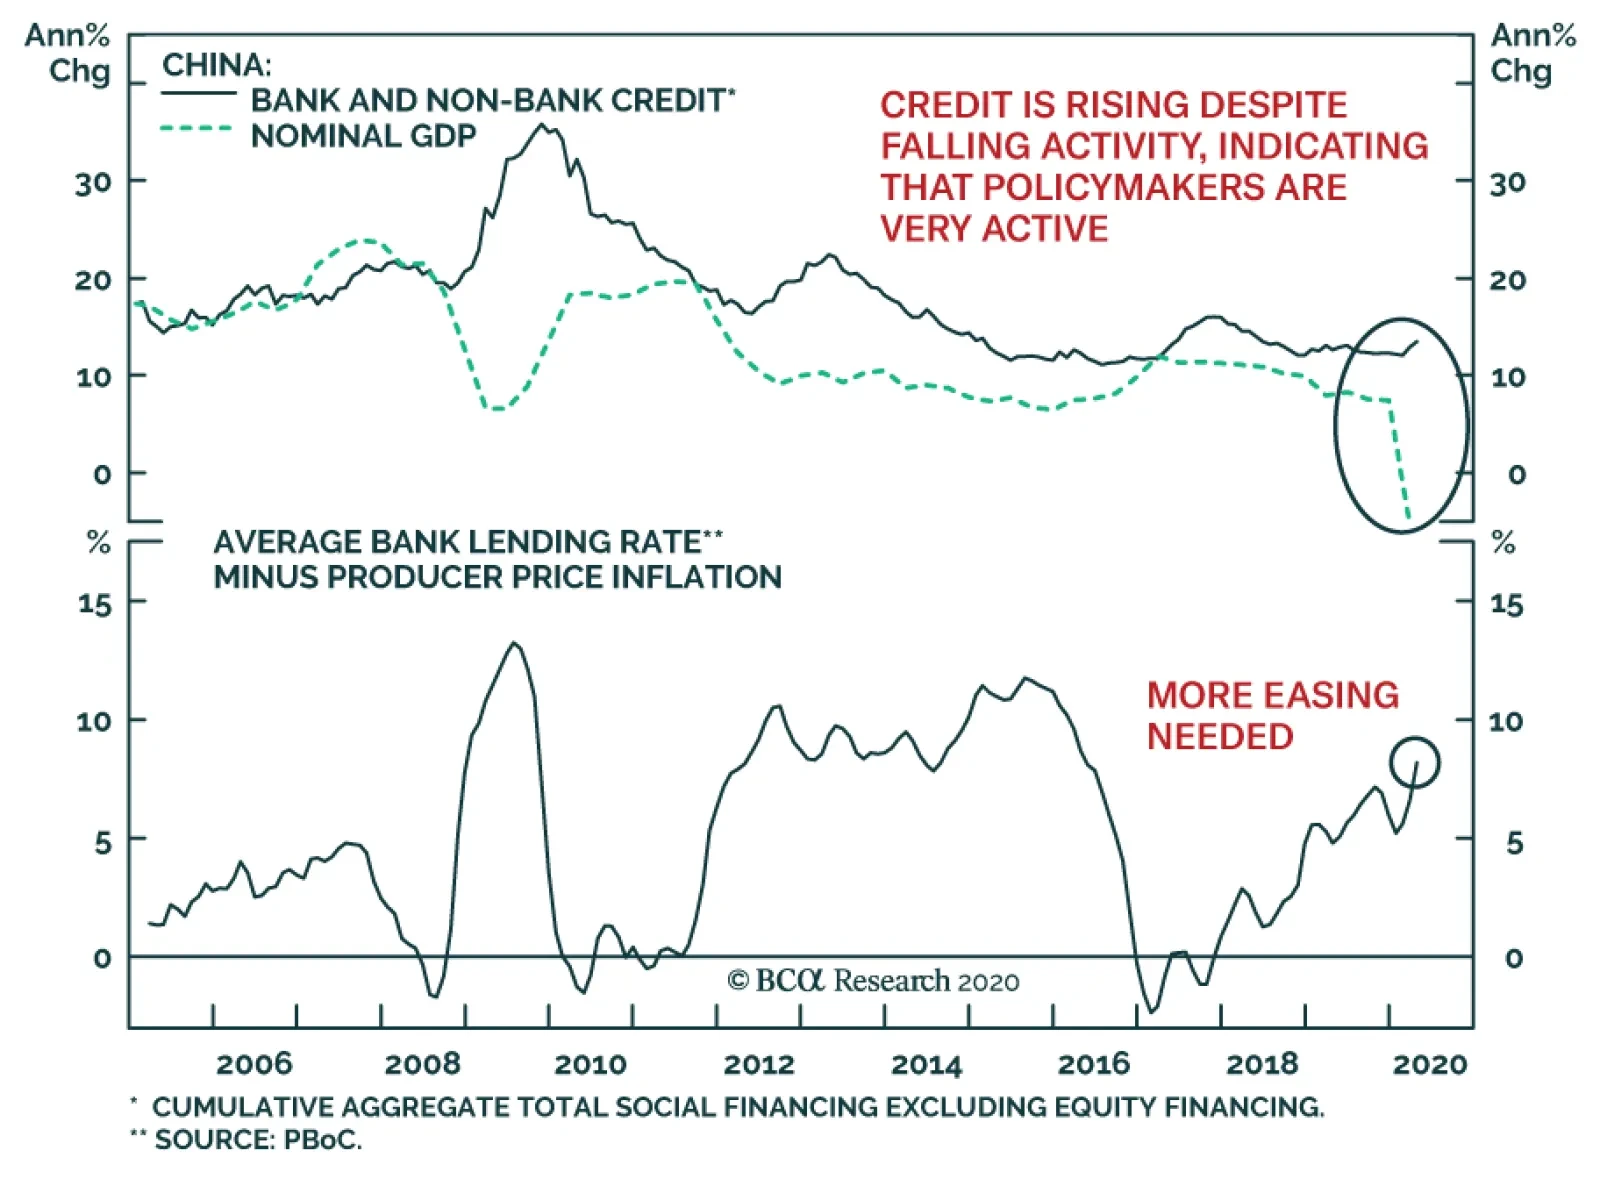
BCA Research’s China Investment and Geopolitical strategists strongly expect that Chinese authorities will continue to add large amounts of stimulus in the Chinese economy. While the rhetorical focus on employment is a crucial clue, the behavior of credit…
Highlights Treasuries: Despite surging issuance, long-dated Treasury yields will move only slightly higher this year, driven by a modest recovery in global demand. There is also a risk that a second wave of COVID infections will send yields to new lows. We recommend keeping portfolio duration close to benchmark while hedging the risk of higher yields by entering duration-neutral curve steepeners. Negative Rates: The Fed will not cut rates into negative territory any time soon. Investors who are able to do so should go short fed funds futures contracts that are priced for negative rates. EM Sovereigns: US bond investors should avoid USD-denominated EM sovereign debt and focus instead on US corporate credit rated Ba and higher. Of the EM countries with large USD bond markets, Mexican debt looks most attractive on a risk/reward basis. Don’t Expect A Taper Tantrum The big announcement in bond markets last week was the Treasury department detailing its plans for note and bond issuance in the second and third quarters. Of course, with the CARES act injecting $2.8 trillion into the economy, investors were already prepared for a big step up in issuance.1 But the numbers are striking nonetheless, particularly at the long-end of the curve. Overall note and bond issuance will reach $910 billion in Q3, roughly equal to the 2010 peak as a percent of GDP (Chart 1). Issuance beyond the 10-year point of the curve (i.e. the 30-year bond and new 20-year bond) will far exceed its financial crisis highpoint (bottom panel). Many bond investors are understandably worried that surging issuance will put significant upward pressure on yields in the coming months. Long-maturity Treasury yields jumped after the Treasury’s announcement on Wednesday before reversing all of that bounce the following day. But despite the mild market reaction, many bond investors are understandably worried that surging issuance will put significant upward pressure on yields in the coming months, especially with the Fed paring its pace of Treasury purchases (Chart 2). Chart 1Gross Treasury Issuance
Gross Treasury Issuance
Gross Treasury Issuance
Chart 2Fed Buying Fewer Treasuries
Fed Buying Fewer Treasuries
Fed Buying Fewer Treasuries
Our base case outlook is that Treasury yields will be marginally higher by the end of the year, and the yield curve will be steeper.2 However, we do not foresee a Taper Tantrum-style bond market rout. Treasury supply will continue to expand in the months ahead. But on the flipside, the Fed’s forward rate guidance will remain very dovish. If investors believe that short-dated interest rates will stay pinned near zero for a long time, fear of significant losses will remain low and Treasury demand will keep pace with supply, even at the long-end of the curve. Chart 3No Taper Tantrum In 2020
No Taper Tantrum In 2020
No Taper Tantrum In 2020
Yes, the Fed has scaled back its pace of Treasury purchases during the past few weeks, removing a significant source of demand from the market. However, it has also given no indication that it intends to lighten up on monetary stimulus broadly speaking. Based on the Fed’s dovish posture, we can be sure that if surging issuance leads to undesirably high term premiums at the long-end of the Treasury curve, the Fed will quickly ramp purchases back up to squash them. In general, our view is that all dramatic bond sell-offs are caused by the market suddenly pricing in a much more hawkish Fed reaction function. This can be driven by surprisingly strong economic growth and inflation, or by investors collectively changing their assessments of how the Fed will react. In this regard, the 2013 Taper Tantrum is an interesting case study. The Treasury curve bear-steepened dramatically in 2013 after Fed Chair Ben Bernanke laid out the Fed’s plan for winding down asset purchases. But this is not a simple story of bond yields rising because the market reacted to less demand in the form of Fed purchases. Rather, yields rose so much because Bernanke signaled to investors that the overall stance of monetary policy was much less accommodative than they had previously thought. Notice that gold fell sharply during this period (Chart 3), not because of less direct demand for Treasuries but because a more hawkish Fed meant less long-run inflation risk. The dynamic is illustrated very clearly by the CRB Raw Industrials / Gold ratio (Chart 3, bottom panel). The ratio is highly correlated with long-dated Treasury yields, meaning that for yields to shoot higher we need to see either a surge in global demand (i.e. CRB commodity prices) or a hawkish shift in the Fed’s reaction function (i.e. a drop in the gold price). If, as we expect, global demand improves only modestly this year and the Fed remains steadfastly dovish, upside in both the CRB/Gold ratio and long-maturity Treasury yields will be limited. Bottom Line: Despite surging issuance, long-dated Treasury yields will move only slightly higher this year, driven by a modest recovery in global demand. There is also a risk that a second wave of COVID infections will send yields to new lows. We recommend keeping portfolio duration close to benchmark while hedging the risk of higher yields by entering duration-neutral curve steepeners. Don’t Bet On Negative Rates Table 1Fed Funds Futures
The Treasury Market Amid Surging Supply
The Treasury Market Amid Surging Supply
The massive amount of new issuance was not the only exciting development in fixed income markets last week. Short-dated yields also started to price-in the possibility of negative interest rates in the US! Table 1 shows the price of different fed funds futures contracts (as of Monday morning) and what funds rate those prices imply for each contract’s maturity month. We also show the return you would earn by taking an unlevered short position in each contract and holding to maturity, assuming that the actual fed funds rate remains unchanged. We assume that the fed funds rate will stay at its current level (0.05%) because the Fed has made it very clear that a negative policy rate is not an option that will be considered. As evidence, we present some excerpts from recent Fed communications. Fed Chair Jerome Powell from his March 15 press conference:3 So, as I’ve noted on several occasions, really, the Committee – as you know, we did a year-plus-long study of our tools and strategies and communications. And we, really, at the end of that, and also when we started out, we view forward guidance and asset purchases – asset purchases and also different variations and combinations of those tools as the basic elements of our toolkit once the federal funds rate reaches the effective lower bound – so, really, forward guidance, asset purchases, and combinations of those. You know, we looked at negative policy rates during the Global Financial Crisis, we monitored their use in other jurisdictions, we continue to do so, but we do not see negative policy rates as likely to be an appropriate policy response here in the United States. The Fed staff’s assessment of negative interest rates from the October 2019 FOMC minutes:4 The briefing also discussed negative interest rates, a policy option implemented by several foreign central banks. The staff noted that although the evidence so far suggested that this tool had provided accommodation in jurisdictions where it had been employed, there were also indications of possible adverse side effects. Moreover, differences between the US financial system and the financial systems of those jurisdictions suggested that the foreign experience may not provide a useful guide in assessing whether negative interest rates would be effective in the United States. FOMC participants’ assessment of negative interest rates from the October 2019 minutes:5 All participants judged that negative interest rates currently did not appear to be an attractive monetary policy tool in the United States. Participants commented that there was limited scope to bring the policy rate into negative territory, that the evidence on the beneficial effects of negative interest rates abroad was mixed, and that it was unclear what effects negative interest rates might have on the willingness of financial intermediaries to lend and on the spending plans of households and businesses. Participants noted that negative interest rates would entail risks of introducing significant complexity or distortions to the financial system. In particular, some participants cautioned that the financial system in the United States is considerably different from those in countries that implemented negative interest rate policies, and that negative rates could have more significant adverse effects on market functioning and financial stability here than abroad. Notwithstanding these considerations, participants did not rule out the possibility that circumstances could arise in which it might be appropriate to reassess the potential role of negative interest rates as a policy tool. It is always possible that the Fed’s view of negative interest rates will change in the future. However, this won’t happen any time soon. The Fed still has other zero-lower-bound policy options it can deploy before it gets desperate enough to re-consider negative rates. The Fed still has other zero-lower-bound policy options it can deploy before it gets desperate enough to re-consider negative rates. For example, one logical next step would be to bring back the Evans Rule. That is, specify economic targets (related to unemployment and inflation) that must be met before the Fed will consider lifting rates. If that sort of forward guidance is deemed insufficient, the Fed could adopt a plan recently advocated by Governor Lael Brainard and start to cap short-maturity bond yields.6 If it wants more stimulus after that it could gradually move further out the curve, capping bond yields for longer and longer maturities. According to the FOMC minutes, this sort of Yield Curve Control policy had more support among participants at the October 2019 FOMC meeting than did negative interest rates:7 A few participants saw benefits to capping longer-term interest rates that more directly influence household and business spending. In addition, capping longer-maturity interest rates using balance sheet tools, if judged as credible by market participants, might require a smaller amount of asset purchases to provide a similar amount of accommodation as a quantity-based program purchasing longer-maturity securities. However, many participants raised concerns about capping long-term rates. Some of those participants noted that uncertainty regarding the neutral federal funds rate and regarding the effects of rate ceiling policies on future interest rates and inflation made it difficult to determine the appropriate level of the rate ceiling or when that ceiling should be removed; that maintaining a rate ceiling could result in an elevated level of the Federal Reserve’s balance sheet or significant volatility in its size or maturity composition; or that managing longer-term interest rates might be seen as interacting with the federal debt management process. By contrast, a majority of participants saw greater benefits in using balance sheet tools to cap shorter-term interest rates and reinforce forward guidance about the near-term path of the policy rate. Bottom Line: The Fed will not cut rates into negative territory any time soon. Investors who are able to do so should go short fed funds futures contracts that are priced for negative rates. For example, a short position in the June 2021 fed funds futures contract will earn an unlevered 6.5 bps if the fed funds rate remains unchanged and the position is held to maturity. No Buying Opportunity Yet In EM Sovereigns When assessing the outlook for the US dollar denominated sovereign debt of emerging markets we consider two main factors: Valuation, relative to both US Treasuries and US corporate credit. The outlook for EM currencies versus the dollar. Ideally, we want to move into EM sovereign debt when spreads look attractive relative to the domestic investment alternatives and when EM currencies are on the cusp of rallying versus the dollar. Valuation At first blush, value looks like it has improved considerably for EM sovereigns. The average spread on the Bloomberg Barclays EM Sovereign index is 167 bps wider than it was at the beginning of the year and the spread differential with the duration-matched Ba-rated US corporate bond index is elevated compared to the recent past (Chart 4). However, widening has been driven by a select few distressed countries (e.g. Ecuador, Argentina and Lebanon). When we strip those out and look only at the investment grade EM sovereign index (Chart 4, panels 3 & 4), the average spread looks relatively tight compared to a duration-matched position in Baa-rated US corporate credit. Chart 4Only A Few EMs Look Cheap
Only A few EMs Look Cheap
Only A few EMs Look Cheap
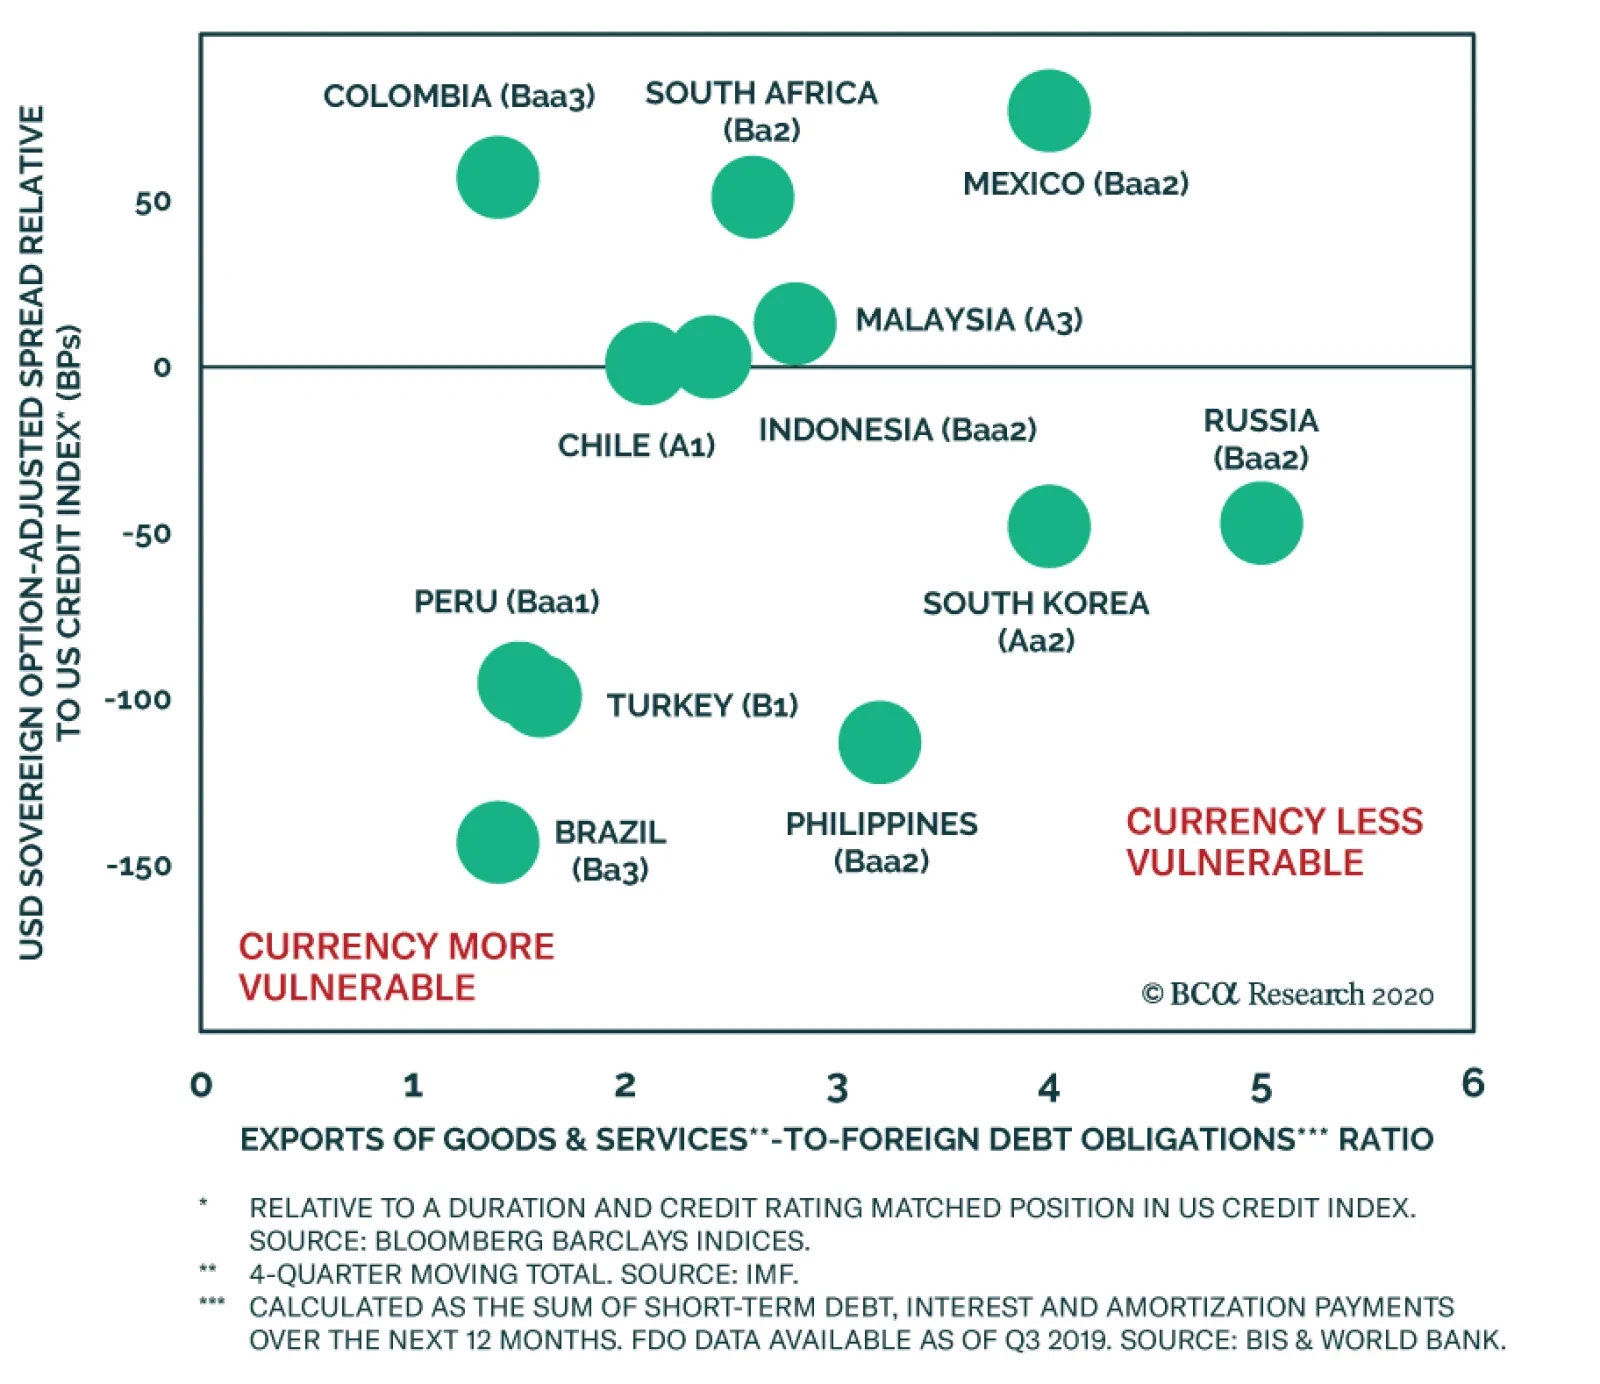
Because country-specific trends often exert undue influence on the overall index, we find it helpful to look at value on a country-by-country basis. Chart 5A shows the average option-adjusted spread for major countries included in the Bloomberg Barclays EM Sovereign index. This chart makes no adjustments for credit rating or duration, and as such we see the lower-rated nations (Turkey, South Africa, Brazil) offering the widest spreads. Chart 5B shows each country’s spread relative to a duration and credit rating matched position in US corporate credit. Viewed this way, the most attractive opportunities lie in Mexico, Saudi Arabia, UAE, Colombia, Qatar and South Africa. Chart 5AUSD-Denominated EM Sovereign Debt By Country: Spread Versus Treasuries
The Treasury Market Amid Surging Supply
The Treasury Market Amid Surging Supply
Chart 5BUSD-Denominated EM Sovereign Debt By Country: Spread Versus US Credit
The Treasury Market Amid Surging Supply
The Treasury Market Amid Surging Supply
Currency Outlook Chart 6EM Currencies Are Linked To Global Growth
EM Currencies Are Linked To Global Growth
EM Currencies Are Linked To Global Growth
Currency is important for EM sovereign spreads because a stronger local currency literally makes US dollars cheaper for the EM nation to acquire. This, in turn, makes its USD-denominated debt easier to service, leading to tighter spreads. Chart 6 shows that EM Sovereign excess returns versus US Treasuries closely track EM currency performance. We also observe a strong link between EM currencies and high-frequency global growth indicators like the CRB Raw Industrials commodity price index (Chart 6, bottom panel). Based on this, we would only expect EM currencies to strengthen when global demand starts to pick up. Further, as our Emerging Market strategists wrote in a recent report, EM central banks are behaving differently during this recession than they have in past downturns.8 In the past, EMs would often run relatively tight monetary policies in order to fend off currency depreciation in the hopes of preventing capital outflows. This time, EM central banks are cutting rates aggressively, allowing their currencies to depreciate but supporting domestic demand. This is bearish for EM currencies and sovereign spreads in the near-term, but will probably lead to stronger economic recovery down the road. At the country level, we assess how vulnerable each country’s currency is to further depreciation by looking at its ratio of exports to foreign debt obligations.9 This ratio is a measure of US dollars coming in over a 12-month period relative to 12-month US dollar debt obligations. It has a relatively tight correlation with the dollar-denominated sovereign spread (Chart 7A). Low-rated countries, like Turkey and South Africa, have relatively low export coverage of foreign debt obligations, while Russia and South Korea have relatively strong debt coverage. Combining Valuation & Currency Outlook Chart 7B shows the same measure of currency vulnerability on the horizontal axis, but shows EM spreads relative to duration and credit rating matched US corporate credit on the vertical axis. Here, we see that Russia offers poor valuation, but a relatively safe currency. Meanwhile, Colombia offers an attractive spread but has a poor currency outlook. In this chart, Mexico stands out as the most attractive on a risk/reward basis. Chart 7AEM Sovereign Spread Versus Currency Vulnerability
The Treasury Market Amid Surging Supply
The Treasury Market Amid Surging Supply
Chart 7BEM Sovereign Spread Over US Credit Versus Currency Vulnerability
The Treasury Market Amid Surging Supply
The Treasury Market Amid Surging Supply
You will notice that the three Middle Eastern countries that stood out as having attractive spreads in Chart 5B are not shown in Charts 7A and 7B. This is because some data are unavailable, and also because those countries operate with currency pegs. Despite attractive spreads in those countries, we would not advise long-run positions in the USD-denominated sovereign debt of Saudi Arabia, Qatar or UAE. As our EM strategists wrote in a recent Special Report, if oil prices remain structurally low in the coming years (~$40 range), pressure will grow for Saudi Arabia to break its currency peg and allow some depreciation.10 The same holds true for Qatar and UAE. A bet on those countries’ sovereign spreads today amounts to a bet on higher oil prices. Despite attractive spreads, we would not advise long-run positions in the USD-denominated sovereign debt of Saudi Arabia, Qatar or UAE. Bottom Line: US bond investors should avoid USD-denominated EM sovereign debt and focus instead on US corporate credit rated Ba and higher. Of the EM countries with large USD bond markets, Mexican debt looks most attractive on a risk/reward basis. Appendix: Buy What The Fed Is Buying The Fed rolled out a number of aggressive lending facilities on March 23. These facilities focused on different specific sectors of the US bond market. The fact that the Fed has decided to support some parts of the market and not others has caused some traditional bond market correlations to break down. It has also led us to adopt a strategy of “Buy What The Fed Is Buying”. That is, we favor those sectors that offer attractive spreads and that benefit from Fed support. Right now, that means we are overweight corporate bonds rated Ba and higher, Aaa-rated Agency and non-agency CMBS, Aaa-rated consumer ABS and municipal bonds. We are underweight residential mortgage-backed securities and corporate bonds rated B and lower. The below Table tracks the performance of these different bond sectors since the Fed’s March 23 announcement. We will use this Table to monitor bond market correlations and evaluate our strategy's success. Table 2Performance Since March 23 Announcement Of Emergency Fed Facilities
The Treasury Market Amid Surging Supply
The Treasury Market Amid Surging Supply
Ryan Swift US Bond Strategist rswift@bcaresearch.com Footnotes 1 For more details on the size and potential efficacy of the CARES act please see Bank Credit Analyst Special Report, “The Global COVID-19 Fiscal Response: Is It Enough?”, dated April 30, 2020, available at bca.bcaresearch.com 2 Please see US Bond Strategy Portfolio Allocation Summary, “The Policy-Driven Bond Market”, dated May 5, 2020, available at usbs.bcaresearch.com 3 https://www.federalreserve.gov/mediacenter/files/FOMCpresconf20200315.pdf 4 https://www.federalreserve.gov/monetarypolicy/files/fomcminutes20191030.pdf 5 https://www.federalreserve.gov/monetarypolicy/files/fomcminutes20191030.pdf 6 https://www.federalreserve.gov/newsevents/speech/brainard20191126a.htm 7 https://www.federalreserve.gov/monetarypolicy/files/fomcminutes20191030.pdf 8 Please see Emerging Markets Strategy Weekly Report, “EM Domestic Bonds And Currencies”, dated April 23, 2020, available at ems.bcaresearch.com 9 For more information on this ratio please see Emerging Markets Strategy Special Report, “EM: Foreign Currency Debt Strains”, dated April 22, 2020, available at ems.bcaresearch.com 10 Please see Emerging Markets Strategy Special Report, “Saudi Riyal Devaluation: Not Imminent But Necessary”, dated May 7, 2020, available at ems.bcaresearch.com Fixed Income Sector Performance Recommended Portfolio Specification