Equities
In lieu of all the geopolitical and economic news in media, this report looks at where next the dollar is likely to trend in the next one-to-three months. Our view is down, though on a cyclical horizon (six-to-twelve months), we would not be short the dollar, for now.
This week, our three screeners cover equity plays on the run-up in gold prices, a hotter-than-expected US inflation print, and calling the top in Bitcoin.
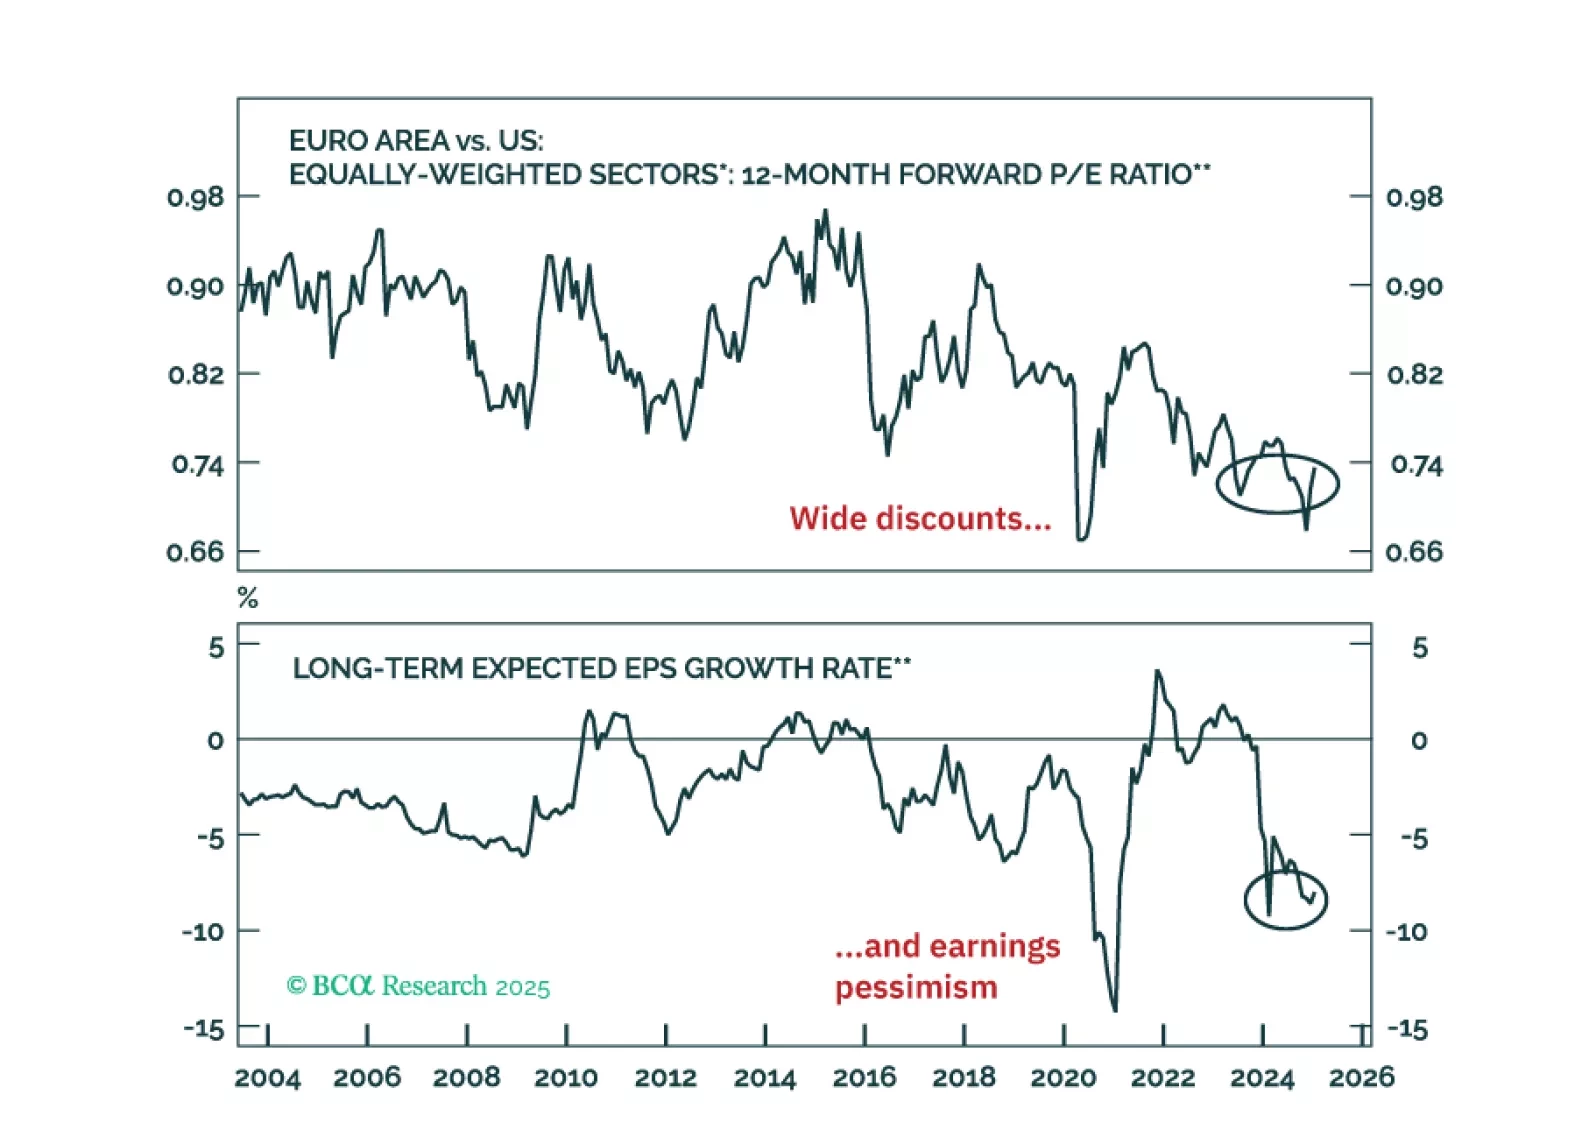
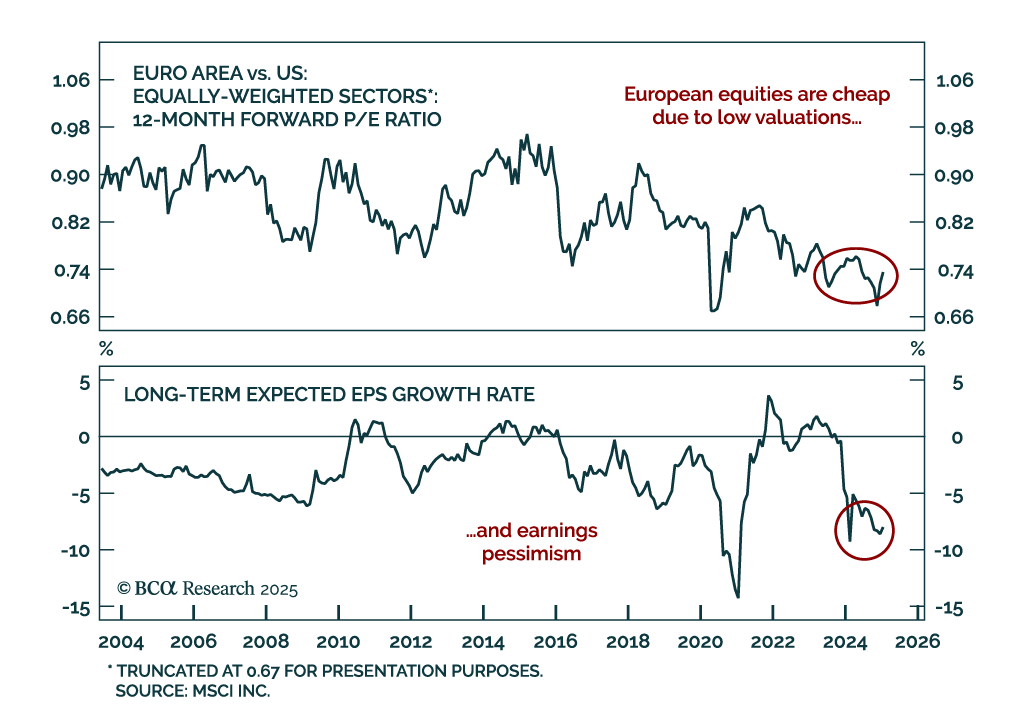
Thanks to their attractive valuations, European equities are piquing the interest of global investors. Is there more to the appeal of European stocks or do they remain a mere value trap?
Thanks to their attractive valuations, European equities are piquing the interest of global investors. Is there more to the appeal of European stocks or do they remain a mere value trap?
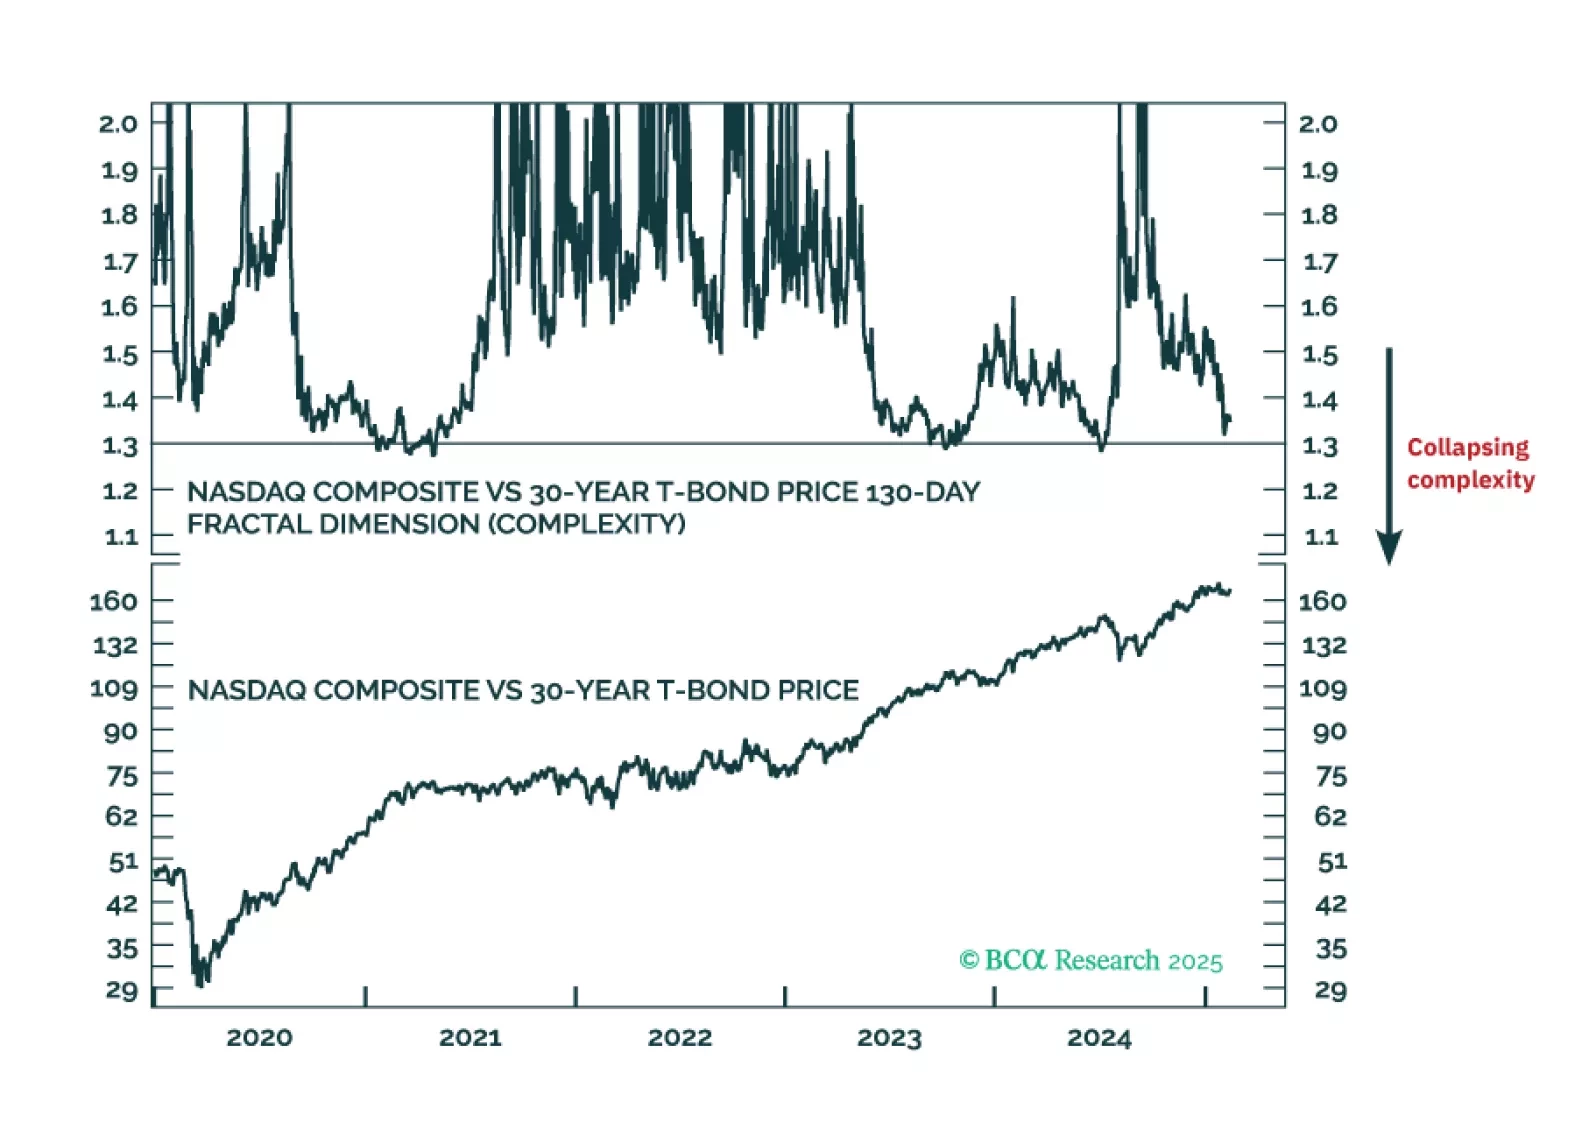
If the 130-day complexity of the Nasdaq versus 30-year T-bond collapsed to 1.30, it would signal the risk of a -20 percent market slump. This indicator, at 1.37, is not yet at critical, but we recommend that you keep a close eye on it on our website. Plus: an update on our recent trades.