Euro Area

Highlights The fourth quarter will be volatile as China still poses a risk of overtightening policy and undermining the global recovery. US political risks are also elevated. A debt default is likely to be averted in the end. Fiscal stimulus could be excessive. There is a 65% chance that taxes will rise in the New Year. A crisis over Iran’s nuclear program is imminent. Oil supply disruptions are likely. A return to diplomacy is still possible but red lines need to be underscored. European political risks are comparatively low, although they cannot go much lower, Russia still poses threats to its neighbors, and China’s economic wobbles will weigh on European assets. Our views still support Mexican equities and EU industrials over the long run but we are booking some gains in the face of higher volatility. Feature Our annual theme for 2021 was “No Return To Normalcy” and events have borne this out. The pandemic has continued to disrupt life while geopolitics has not reverted to pre-Trump norms. Going forward, the pandemic may subside but the geopolitical backdrop will be disruptive. This is primarily due to Chinese policy, unfinished business with Iran, and the struggle among various nations to remain stable in the aftermath of the pandemic. Chart 1Delta Recedes With Vaccinations
Delta Recedes With Vaccinations
Delta Recedes With Vaccinations
Chart 2Global Recovery Marches On
Global Recovery Marches On
Global Recovery Marches On
Chart 3Global Labor Markets On The Mend
Global Labor Markets On The Mend
Global Labor Markets On The Mend
The underlying driver of markets in the fourth quarter will be the fact that the COVID-19 pandemic is waning as vaccination campaigns make progress (Chart 1). New cases of the Delta variant have rolled over in numerous countries and in US states that are skeptical toward vaccines. Global growth will still face crosswinds. US growth rates are unlikely to be downgraded further while Europe’s growth has been upgraded. However, forecasters are likely to downgrade Chinese growth expectations in the face of the government’s regulatory onslaught against various sectors and property sector instability (Chart 2). Barring a Chinese policy mistake, the global composite PMI is likely to stabilize. Labor markets will continue healing (Chart 3). The tug of war between unemployment and inflation will continue to give way in favor of inflation, given that wage pressures will emerge, stimulus-fueled household demand will be strong, and supply shortages will persist. Central banks will try to normalize policy but will not move aggressively in the face of any new setbacks to the recovery. Will China Spoil The Recovery? Maybe. Chinese policy and structural imbalances pose the greatest threat to the global economic recovery both in the short and the long run. The immediate risk to the recovery is clear from our market-based Chinese growth indicator, which has not yet bottomed (Chart 4). The historic confluence of domestic political and geopolitical risks in China is our key view for the year. China is attempting to make the economic transition that other East Asian states have made – away from the “miracle” manufacturing phase of growth toward something more sustainable. But there are two important differences: China is making its political and economic system less open and free (the opposite of Taiwan and South Korea) and it is confronting rather than befriending the United States. The Xi administration is focused on consolidating power ahead of the twentieth national party congress in fall 2022. Xi is attempting to stay in power beyond the ten-year limit that was in place when he took office. On one hand he is presenting a slate of socioeconomic reforms – dubbed “common prosperity” – to curry popular favor. This agenda represents a tilt from capitalism toward socialism within the context of the Communist Party’s overarching idea of socialism with Chinese characteristics. On the other hand, Xi is cracking down on the private sector – Big Tech, property developers – which theoretically provides the base of power for any political opposition. The crackdowns have caused Chinese equities to collapse relative to global and have reaffirmed the long trend of underperformance of cyclical sectors relative to defensives within Chinese investable shares (Chart 5, top panel). Chart 4China Threatens To Spoil The Party
China Threatens To Spoil The Party
China Threatens To Spoil The Party
In terms of financial distress, so far only high-yield corporate bonds have seen spreads explode, not investment grade. But current policies force property developers to liquidate their holdings, pay off debts, and raise cash while forcing banks to cut bank on loans to property developers and homebuyers. (Not to mention curbs on carbon emissions and other policies squeezing industrial and other sectors.) Chart 5Beijing Could Easily Trigger Global Market Riot
Beijing Could Easily Trigger Global Market Riot
Beijing Could Easily Trigger Global Market Riot
If these policies are not relaxed then property developers will continue to struggle, property prices will fall, credit tightening will intensify, and local governments will be starved of revenue and forced to cut back on their own spending. Yet the government’s signals of policy easing are so far gradual and behind the curve. If policy is not relaxed, then onshore equities will sell off (as well as offshore) and credit spreads will widen more generally (Chart 5, bottom panel). Broad financial turmoil cannot be ruled out in the fourth quarter. Ultimately, however, China will be forced to do whatever it takes to try to secure the post-pandemic recovery. Otherwise it will instigate a socioeconomic crisis ahead of the all-important political reshuffle in fall 2022. That would be the opposite of what Xi Jinping needs as he tries to consolidate power. Chinese households have stored their wealth, built up over decades of economic success, in the housing sector (Chart 6). Economic instability could translate to political instability. Chart 6Beijing Will Provide Bailouts And Stimulus … Or Face Political Instability
Fourth Quarter Outlook: So Much For Normalcy!
Fourth Quarter Outlook: So Much For Normalcy!
Investors often ask how the government can ease policy if doing so will further inflate housing prices, which hurts the middle class and is the opposite of the common prosperity agenda. High housing prices are the biggest of the three “mountains” that are said to be crushing the common folks and weighing on Chinese birthrates and fertility (the other two are high education and medical costs). The answer is that while policymakers want to cap housing prices and encourage fertility, they must prevent a general collapse in prices and economic and financial crisis. There is no evidence that suppressing housing prices will increase fertility or birthrates – if anything, falling fertility is hard to reverse and goes hand in hand with falling prices. Rather, evidence from the US, Japan, South Korea, Thailand, and other countries shows that a bursting property bubble certainly does not increase fertility or birthrates (Charts 7A and 7B). Chart 7AEconomic Crash Not A Recipe For Higher Fertility
Economic Crash Not A Recipe For Higher Fertility
Economic Crash Not A Recipe For Higher Fertility
Chart 7BEconomic Crash Not A Recipe For Higher Fertility
Economic Crash Not A Recipe For Higher Fertility
Economic Crash Not A Recipe For Higher Fertility
Bringing it all together, investors should not play down negative news and financial instability emerging from China. There are no checks and balances on autocrats. Our China Investment Strategy has a high conviction view that policy stimulus is not forthcoming and regulatory curbs will not be eased. The implication is that China’s government could make major policy mistakes and trigger financial instability in the near term before changing its mind to try to preserve overall stability. At that point it could be too late. Will Countries Add More Stimulus? Yes. Chart 8Global Monetary Policy Challenges
Global Monetary Policy Challenges
Global Monetary Policy Challenges
With China’s stability in question, investors face a range of crosswinds. Central banks are struggling with a surge in inflation driven by stimulus-fueled demand and supply bottlenecks. The global output gap is still large but rapid economic normalization will push inflation up further if kinks are not removed (Chart 8). A moderating factor in this regard is that budget deficits are contracting in 2022 and coming years – fiscal policy will shift from thrust to drag (Chart 9). However, the fiscal drag is probably overstated as governments are also likely to increase deficit spending on the margin. The US is certainly likely to do so. But before considering US fiscal policy we must address the immediate question: whether the US will default on national debt. Treasury Secretary Janet Yellen has designated October 18 as the “X-date” at which the Treasury will run out of extraordinary measures to make debt payments if Congress does not raise the statutory debt ceiling. There is presumably a few weeks of leeway after this date but markets will grow very jittery and credit rating agencies will start to downgrade the United States, as Standard & Poor’s did in 2011. Chart 9Global Fiscal Drag Rears Its Head
Fourth Quarter Outlook: So Much For Normalcy!
Fourth Quarter Outlook: So Much For Normalcy!
Democrats have full control of Congress and can therefore suspend the debt ceiling through a party-line vote. They can do this through regular legislation, if Republicans avoid raising a filibuster, though that requires Democrats to make concessions in a back-room deal with Republicans. Or they can compromise the filibuster, though that requires convincing moderate Democrats who support the filibuster that they need to make an exception to preserve the faith and credit of the US. Or they can raise the debt ceiling via budget reconciliation, though this would run up against the time limit and so far Senate Leader Chuck Schumer claims to refuse this option. While the odds of a debt default are not zero, the Democrats have the power to avoid it and will also suffer the most in public opinion if it occurs. Therefore the debt limit will likely be suspended at the last minute in late October or early November. Investors should expect volatility but should view it as short-term noise and buy on dips – i.e. the opposite of any volatility that stems from Chinese financial turmoil. Congress is likely to pass Biden’s $550 billion bipartisan infrastructure bill (80% subjective odds). It is also likely to pass a partisan social welfare reconciliation bill over the coming months (65% subjective odds). The full impact on the deficit of both bills should range from $1.1-$1.6 trillion over ten years. This will not be enough to prevent the fiscal drag in 2022 but it will provide for a gradually expanding budget deficit over the course of the decade (Chart 10). Chart 10New Fiscal Stimulus Will Reduce Fiscal Drag On Margin
Fourth Quarter Outlook: So Much For Normalcy!
Fourth Quarter Outlook: So Much For Normalcy!
The reconciliation package will be watered down and late in coming. Investors will likely buy the rumor and sell the news. If reconciliation fails, markets may cheer, as it will also include tax hikes and pose the risk of pushing up inflation and hastening Fed rate hikes. Elsewhere governments are also providing “soft budgets.” The German election results confirmed our forecast that the government will change to left-wing leadership that will be able to boost domestic investment but not raise taxes. This is due to the inclusion of at least one right-leaning party, most likely the Free Democrats. Fiscal deficits will go up. Germany has a national policy consensus on most matters of importance and thus can pass some legislation. But the new coalition will be ideologically split and barely have a majority in the Bundestag, so controversial or sweeping legislation will be unlikely. This outcome is positive for German markets and the euro. Looking at popular opinion toward western leaders and their ruling coalitions since the outbreak of COVID-19, the takeaway is that the Europeans have the strongest political capital (Chart 11). Governments are either supported by leadership changes (Italy, Germany) or likely to be supported in upcoming elections (France). The UK does not face an election until 2024, unless an early election is called. This seems doubtful to us given the government’s strong majority. Chart 11DM Shifts In Popular Opinion Since COVID-19
Fourth Quarter Outlook: So Much For Normalcy!
Fourth Quarter Outlook: So Much For Normalcy!
Chart 12EM Shifts In Popular Opinion Since COVID-19
Fourth Quarter Outlook: So Much For Normalcy!
Fourth Quarter Outlook: So Much For Normalcy!
After all, Canada called an early election and it became a much riskier affair than the government intended and did not increase the prime minister’s political capital. Spain is far more likely to see tumult and an early election. Japan’s election in November will not bring any surprises: as we have written, Kishidanomics will be Abenomics by a different name. The implication is that after November, most developed markets will be politically recapitalized and fiscal policy will continue to be accommodative across the board. In emerging markets, popular opinion has been much more damning for leaders, calling attention to our expectation that the aftershocks of the global pandemic will come in the form of social and political instability (Chart 12). Russia has a record of pursuing more aggressive foreign policy to distract from its domestic ills. The next conflict could already be emerging, with allegations that it is deliberately pushing up natural gas prices in Europe to try to force the new German government to certify and operate the NordStream II pipeline. The Americans are already brandishing new sanctions. Chart 13Stary Neutral Dollar For Now
Stary Neutral Dollar For Now
Stary Neutral Dollar For Now
Brazil and Turkey both face extreme social instability in the lead-up to elections in 2022 and 2023. India has been the chief beneficiary of today’s climate but it also faces an increase in political and geopolitical risk due to looming state elections and its increasing alliance with the West against China. Putting it all together, the US is likely to stimulate further and pump up inflation expectations. Europe is politically stable but Russia disrupt it. Other emerging markets, including China, will struggle with economic, political, and social instability. This is an environment in which the US dollar will remain relatively firm and the renminbi will depreciate – with negative effects on EM currencies more broadly (Chart 13). Annual Views On Track Our three key views for 2021 are so far on track but face major tests in the fourth quarter: 1. China’s internal and external headwinds: If China overtightens policy and short-circuits the global economic recovery, then its domestic political risks will have exceeded even our own pessimistic expectations. We expect China to ease fiscal policy and do at least the minimum to secure the recovery. Investors should be neutral on risky assets until China provides clearer signals that it will not overtighten policy (Chart 14). 2. Iran is the crux of the US pivot to Asia: A crisis over Iran is imminent since Biden did not restore the 2015 nuclear deal promptly upon taking office. Any disruption of Middle Eastern energy flows will add to global supply bottlenecks and price pressures. Brent crude oil prices will see upside risks relative both to BCA forecasts and the forward curve (Chart 15). Chart 14Wait For China To Relax Policy
Wait For China To Relax Policy
Wait For China To Relax Policy
Chart 15Expect A Near-Term Crisis Over Iran
Expect A Near-Term Crisis Over Iran
Expect A Near-Term Crisis Over Iran
The reason is that Iran is expected to reach nuclear “breakout” capability by November or December (i.e. obtain enough highly enriched uranium to make a nuclear device). The Biden administration is focused on diplomacy and so far hesitant to impose a credible threat of war to halt Iranian advances. Israel’s new government has belatedly admitted that it would be a good thing for the US and Iran to rejoin the 2015 nuclear deal – if not, it supports a global coalition to impose sanctions, and finally a military option as a last resort. Biden will struggle to put together a global coalition as effective as Obama did, given worse relations with China and Russia. The US and Israel are highly likely to continue using sabotage and cyberattacks to slow Iran’s nuclear and missile progress. Chart 16Pivot To Asia Runs Through Iran
Pivot To Asia Runs Through Iran
Pivot To Asia Runs Through Iran
Chart 17Europe: A Post-Trump Winner? Depends On China
Europe: A Post-Trump Winner? Depends On China
Europe: A Post-Trump Winner? Depends On China
Thus the Iranians are likely to reach breakout capability at which point a crisis could erupt. The market is not priced for the next Middle East crisis (Chart 16). Incidentally, any additional foreign policy humiliation on top of Afghanistan could undermine the Biden administration more broadly, in both domestic and foreign policy. 3. Europe benefits most from a post-pandemic, post-Trump world: Europe is a cyclical economy and is also relatively politically stable in a world of structurally rising policy uncertainty and geopolitical risk. We thought it stood to benefit most from the global recovery and the passing of the Trump administration. However, China’s policy tightening has undermined European assets and will continue to do so. Therefore this view is largely contingent on the first view (Chart 17). Investment Takeaways Strategically we maintain a diversified portfolio of trades based on critical geopolitical themes: long gold, short China/Taiwan, long developed markets, long aerospace/defense, long rare earths, and long value over growth stocks. Taiwanese equities have continued to outperform despite bubbling geopolitical tensions. We maintain our view that Taiwan is overpriced and vulnerable to long-term semiconductor diversification as well as US-China conflict. Our rare earths basket, which focuses on miners outside China, has been volatile and stands to suffer if China’s growth decelerates. But global industrial, energy, and defense policy will continue to support rare earths and metals prices. Russian tensions with the West have been manageable over the course of the year and emerging European stocks have outperformed developed European peers, contrary to our recommendation. However, fundamental conflicts remain unresolved and the dispute over the recently completed Nord Stream II pipeline to Germany could still deal negative surprises. We will reassess this recommendation in a future report. We are booking gains on the following trades: long Mexico (8%), long aerospace and defense in absolute terms (4%), long EU industrials relative to global (4%), and long Italian BTPs relative to bunds (0.2%). Matt Gertken Vice President Geopolitical Strategy mattg@bcaresearch.com Appendix: GeoRisk Indicator China
China: GeoRisk Indicator
China: GeoRisk Indicator
Russia
Russia: GeoRisk Indicator
Russia: GeoRisk Indicator
United Kingdom
UK: GeoRisk Indicator
UK: GeoRisk Indicator
Germany
Germany: GeoRisk Indicator
Germany: GeoRisk Indicator
France
France: GeoRisk Indicator
France: GeoRisk Indicator
Italy
Italy: GeoRisk Indicator
Italy: GeoRisk Indicator
Canada
Canada: GeoRisk Indicator
Canada: GeoRisk Indicator
Spain
Spain: GeoRisk Indicator
Spain: GeoRisk Indicator
Taiwan
Taiwan: GeoRisk Indicator
Taiwan: GeoRisk Indicator
Korea
Korea: GeoRisk Indicator
Korea: GeoRisk Indicator
Turkey
Turkey: GeoRisk Indicator
Turkey: GeoRisk Indicator
Brazil
Brazil: GeoRisk Indicator
Brazil: GeoRisk Indicator
Australia
Australia: GeoRisk Indicator
Australia: GeoRisk Indicator
Appendix: Geopolitical Calendar
HighlightsThe power shortage in China due to depleted coal inventories and low hydro availability will push copper and aluminum inventories lower, as refineries there – which account for roughly one-half of global capacity – are shut to conserve power (Chart of the Week).Given the critical role base metals will play in the decarbonization of the global economy, alternative capacity will have to be incentivized ex-China by higher prices to reduce refining-concentration risk in the future.Unexpectedly low renewable-energy output in the EU and UK following last year's cold winter will keep competition with China for LNG cargoes elevated this winter. It also highlights the unintended consequences of phasing down fossil-fuel generation without sufficient back-up.The US Climate Prediction Center kept its expectation for a La Niña at 70-80%, which raises the odds of a colder-than-normal winter for the Northern Hemisphere. Normal-to-warmer temps cannot be entirely dismissed, however.Increased production of highly efficacious COVID-19 vaccines globally – particularly in EM economies – will stoke economic growth and release pent-up demand among consumers.We remain long 1Q22 natgas exposure via call spreads; long commodity index exposure (S&P GSCI and COMT ETF) to benefit from increasing backwardation as inventories of industrial commodities fall; and long the PICK ETF to benefit from expected tightening of base metals markets.FeatureNatgas prices are surging in the wake of China's and Europe's scramble to cover power shortages arising from depleted coal inventories and low hydroelectric generation in the former, and unexpectedly low output from renewables in the latter (Chart 2).1Given all the excitement of record-high gas prices in the EU and surging oil prices earlier this week, it is easy to lose sight of the longer-term implications of these developments for the global decarbonization push. Chart of the WeekBase Metals Refining Concentrated In China
La Niña And The Energy Transition
La Niña And The Energy Transition
Chart 2Surge In Gas Prices Continues
La Niña And The Energy Transition
La Niña And The Energy Transition
Global copper inventories have been tightening (Chart 3) along with aluminum balances (Chart 4).2 Power shortages in China- which accounts for ~40% of global refined copper output and more than 50% of refined aluminum - are forcing shutdowns in production by authorities seeking to conserve energy going into winter. In addition, the upcoming Winter Olympics in February likely will keep restrictions on steel mills, base-metals refiners, and smelters in place, so as to keep pollution levels down and skies blue. Chart 3Supply-Demand Balance Tightening In Copper
Supply-Demand Balance Tightening In Copper
Supply-Demand Balance Tightening In Copper
Chart 4Along With Aluminum Balances...
Along With Aluminum Balances...
Along With Aluminum Balances...
This will keep prices well supported and force manufacturers to draw on inventories, which will keep forward curves for copper (Chart 5) and aluminum (Chart 6) backwardated. Higher costs for manufactured goods can be expected as well, which will exacerbate the cost-push inflation coming through from clogged global supply chains. This slowdown in global supply chains is largely the result of global aggregate demand improving at a faster rate than supply.3 Chart 5Copper Prices And Backwardation
Copper Prices And Backwardation
Copper Prices And Backwardation
Chart 6...Will Increase Along With Aluminum
...Will Increase Along With Aluminum
...Will Increase Along With Aluminum
The pressures on base metals markets highlight the supply-concentration risks associated with the large share of global refining capacity located in China. This makes refined base metals supplies and inventories globally subject to whatever dislocations are impacting China at any point in time. As the world embarks on an unprecedented decarbonization effort, this concentration of metals refining capacity becomes increasingly important, given the centrality of base metals in the build-out of renewable-energy and electric-vehicles (EVs) globally (Chart 7).In addition, increasing tension between Western states and China supports arguments to diversify supplies of refined metals in the future (e.g., the US, UK and Australia deal to supply US nuclear-powered submarine technology to Australia, and the tense Sino-Australian trade relationship that led to lower Chinese coal inventories).4 Chart 7The Need For Refined Metals Grows
La Niña And The Energy Transition
La Niña And The Energy Transition
EU's Renewables Bet SoursUnlike China, which gets ~ 11% of its electricity from renewables and ~ 63% of its power from coal-fired generation (Chart 8), the EU gets ~ 26% of its power from renewables and ~ 13% from coal (Chart 9). In fact, the EU's made a huge bet on renewables, particularly wind power, which accounts for ~55% of its renewables supply. Chart 8China's Dependence On Coal …
La Niña And The Energy Transition
La Niña And The Energy Transition
Chart 9… Greatly Exceeds The EU's
La Niña And The Energy Transition
La Niña And The Energy Transition
Unexpectedly low renewable-energy output in the EU and UK this summer – particularly wind power – forced both to scramble for natgas and coal supplies to cover power needs.5 As can be seen in Chart 9, the EU has been winding down its fossil-fuel-fired electric generation in favor of renewables. When the wind stopped blowing this year the EU was forced into an intense competition with China for LNG cargoes in order to provide power and rebuild storage for the coming winter (Chart 10). Chart 10The Scramble For Natgas Continues
La Niña And The Energy Transition
La Niña And The Energy Transition
The current heated – no pun intended – competition for natgas going into the coming winter is the result of two policy errors, which will be corrected by Spring of next year. On China's side, coal inventories were allowed to run down due to diplomacy, which left inventories short going into winter. In the EU, wind power availability fell far short of expectations, another result of a policy miscalculation: Nameplate wind capacity is meaningless if the wind stops blowing. Likewise for sun on a cloudy day.Natgas Price Run-Up Is TransitoryThe run-up in natgas prices occasioned by China's and the EU's scramble for supplies is transitory. Still, uncertainty as to the ultimate path global gas prices will take is at its maximum level at present.The US Climate Prediction Center kept its expectation for a La Niña at 70-80%, which raises the odds of a colder-than-normal winter for the Northern Hemisphere. Even so, this is a probabilistic assessment: Normal-to-warmer temps cannot be dismissed, given this probability. A normal to warmer winter would leave US inventories and the availability to increase LNG exports higher, which would alleviate much of the pricing pressure holding Asian and European gas prices at eye-watering levels presently.Going into 1Q22, we expect increased production of highly efficacious COVID-19 vaccines globally – particularly in EM economies – will stoke economic growth and release pent-up demand among consumers as hospitalization and death rates continue to fall (Chart 11).6 At that point, we would expect economic activity to pick up significantly, which would be bullish for natgas. We also expect US and Russian natgas production to pick up, with higher prices supporting higher rig counts in the US in particular. Chart 11Expect Continued COVID-19 Progress
La Niña And The Energy Transition
La Niña And The Energy Transition
Investment ImplicationsAs the world embarks on an unprecedented decarbonization effort, it is important to follow the supply dynamics of base metals, which will provide the materials needed to build out renewable generation and EVs.The current price pressure in natural gas markets resulting from policy miscalculations cannot be ignored. Still, this pressure is more likely to be addressed quickly and effectively than the structural constraints in base metals markets.On the base metals side, producers remain leery of committing to large capex projects at the scale implied by policy projections for the renewables buildout.7In addition, current market conditions highlight concentration risks in these markets – particularly on the refining side in base metals, where much of global capacity resides in China. On the production and refining side of EV materials, battery technology remains massively concentrated to a few countries (e.g., cobalt mining and refining in the Democratic Republic of Congo and China, respectively).This reinforces our view that oil and gas production and consumption likely will not decay sharply unless and until these capex issues and concentration risks are addressed. For this reason, we remain bullish oil and gas. Robert P. Ryan Chief Commodity & Energy Strategistrryan@bcaresearch.comAshwin ShyamResearch AssociateCommodity & Energy Strategyashwin.shyam@bcaresearch.com Commodities Round-UpEnergy: BullishDelegates at OPEC 2.0's Ministerial Meeting on Monday likely will agree to increase the amount of oil being returned to markets by an additional 100-200k b/d. This would take the monthly production rate of production being restored from 400k b/d to 500-600k b/d. Depending on how quickly mRNA vaccine production in large EM markets is rolled out, this incremental increase could remain in place into 2Q22. This would assuage market concerns prices could get to the point that demand is destroyed just as economic re-opening is beginning in EM economies. Our view remains that the producer coalition led by Saudi Arabia and Russia will continue to balance the need for higher revenues of member states with the fragile recovery in EM economies. We continue to expect prices in 2022 to average $75/bbl and $80/bbl in 2023 (Chart 12). This allows OPEC 2.0 states to rebuild their balance sheets and fund their efforts to diversify their economies without triggering demand destruction.Base Metals: BullishA power crunch and decarbonization policies in China are supporting aluminum prices at around 13-year highs, after reaching a multi-year peak earlier this month (Chart 13). The energy-intensive electrolytic process of converting alumina to metal makes aluminum production highly sensitive to fluctuations in power prices. High power prices and electricity shortages are impacting aluminum companies all over China, one of which is Yunnan Aluminium. According to the Financial Times, the company accounts for 10% of total aluminum supply in the world’s largest producer.Precious Metals: BullishGold prices dipped following a hawkish FOMC meeting last week. More Fed officials see a rate hike in 2022, compared to the previous set of projections released in June. Fed Chair Jay Powell also hinted at a taper in the asset purchase program on the back of a rebounding US economy, provided a resurgence in COVID-19 does not interrupt this progress. A confirmation of what markets were expecting – i.e., paring asset purchases by year-end – and possible rate hikes next year have buoyed the US dollar and Treasury yields. The USD competes directly with gold for safe-haven investment demand. Higher interest rates will increase the opportunity cost of holding the yellow metal. As a result, gold prices will be subdued when the USD is strengthening. We remain bearish the USD, and, therefore, bullish gold. Chart 12Oil Forecasts Hold Steady
Oil Forecasts Hold Steady
Oil Forecasts Hold Steady
Chart 12Aluminum Prices Recovering
Aluminum Prices Recovering
Aluminum Prices Recovering
Footnotes1 Please see China's Yunnan imposes output curbs on aluminium, steel, cement makers published by reuters.com on September 13, 2021.2 NB: Global aluminum inventory data are unreliable and we do not publish them.3 Please see, e.g., Supply Chains, Global Growth, and Inflation, published by gspublishing.com on September 20, 2021.4 Please see US-China: War Preparation Pushes Commodity Demand, a Special Report we published on August 26, 2021, for further discussion.5 We discuss this in last week's report entitled Natgas Markets Continue To Tighten, which is available at ces.bcaresearch.com.6 Please see Upside Price Risk Rises For Crude, which updated our oil-price balances and forecasts. We highlight the recent agreements to mass produce the highly effective mRNA COVID-19 vaccines globally as bullish for oil prices. It also will be bullish for natgas and other commodities.7 Please see Assessing Risks To Our Commodity Views, which we published on July 8, 2021, for additional discussion. Investment Views and ThemesStrategic RecommendationsTactical TradesCommodity Prices and Plays Reference TableTrades Closed in 2021Summary of Closed Trades
US and Euro Area measures of consumer confidence are diverging. According to the Conference Board survey, US consumer sentiment declined for the third consecutive month to a seven-month low of 109.3 in September. The nearly six-point drop is well below…
According to BCA Research’s European Investment Strategy service, the tactical environment is dangerous for European cyclicals in general, and materials in particular. The fallout from Evergrande’s problem will extend to the performance of European equity…
Highlights The Evergrande crisis is not China’s Lehman moment. Nonetheless, Chinese construction activity will decelerate further in response to this shock. Global equities are frothy enough that a weaker-than-expected Chinese construction sector will remain a near-term risk to stocks prices. European markets are more exposed to this risk than US ones. Tactically, this creates a dangerous environment for cyclicals in general and materials in particular. Healthcare and Swiss stocks would be the winners. Despite these near-term hurdles, we maintain a pro-cyclical portfolio stance, which we will protect with some temporary hedges. We will lift these hedges if the EURO STOXX corrects into the 430-420 zone. A busy week for European central banks confirms our negative stance on EUR/GBP, EUR/SEK, and EUR/NOK. While EUR/CHF has upside, Swiss stocks should outperform Euro Area defensives. Stay underweight UK Gilts in fixed-income portfolios. Feature The collapse of property developer Evergrande creates an important risk for European markets. It threatens to slow Chinese construction activity further, which affects European assets that are heavily exposed to the Chinese real estate sector, directly and indirectly. This risk is mostly frontloaded, as Chinese authorities cannot afford a complete meltdown of the domestic property sector. Moreover, this economy has slowed significantly and more policy support is bound to take place. Additionally, forces outside China create important counterweights that will allow Europe to thrive despite the near-term clouds. While we see more short-term risk for European stocks and cyclical sectors, the 18-month cyclical outlook remains bright. Similarly, European stocks will not outperform US ones when Chinese real estate activity remains a source of downside surprise; but they will afterward. China’s Construction Slowdown Is Not Over The Evergrande crisis is not China’s Lehman moment. Beijing has the resources to prevent a systemic meltdown and understands full well what is at stake. At 160% of GDP, China’s nonfinancial corporate debt towers well above that of other major emerging markets and even that of Japan in the 1980s (Chart 1). If an Evergrande bankruptcy were allowed to topple this debt mountain, China would experience the kind of debt-deflation trap that proved so disastrous in the 1930s. A further deterioration of conditions in Chinese real estate activity is nonetheless in the cards, even if the country avoids a global systemic financial shock. First, the inevitable restructuring of Evergrande will result in losses for bond holders, especially foreign ones. Consequently, risk premia in the Chinese off-shore corporate bonds market will remain wide following the resolution of the Evergrande debacle. While Chinese banks are likely to recover a large proportion of the funds they lent to the real estate giant, they too will face higher risk premia. At the margin, the rising cost of capital will curtail the number of projects real estate developers take on over the coming two to three years. Second, the eventual liquidation of Evergrande will hurt confidence among real estate developers. This process may take many forms, but, as we go to press, the most discussed outcome is a breakup and restructuring where state-owned enterprises and large local governments absorb Evergrande’s operations. Evergrande’s employees, suppliers, and clients who have deposited funds while pre-ordering properties will be made whole one way or the other. However, shareholders and management will not. Wiping out shareholders and senior management will send a message to the operators of other developers, which will negatively affect their risk taking (Chart 2). Chart 1China Cannot Afford A Lehman Moment
China Cannot Afford A Lehman Moment
China Cannot Afford A Lehman Moment
Chart 2Downside To Chinese Construction Activity
Downside To Chinese Construction Activity
Downside To Chinese Construction Activity
Third, one of President Xi Jinping’s key policy objectives is to tame rampant income inequality in the Chinese economy. Rapidly rising real estate prices and elevated unaffordability only worsen this problem. Hence, Beijing wants to avoid blind stimulus that mostly pushes house prices higher but that would have also boosted construction activity. Thus, if credit growth is pushed through the system, the regulatory tightening in real estate will not end. This process is likely to result in further contraction in floor space sold and started. Bottom Line: The Evergrande crisis is unlikely to morph into China’s Lehman moment. However, its fallout on the real estate industry means that Chinese construction activity will continue to contract in the coming six to twelve months or so. Chinese Construction Matters For European Equities The risk of further contraction in Chinese construction activity implies a significant near-term risk for European equities, especially relative to US ones. Even after the volatility of the past three weeks, global equities remain vulnerable to more corrective action. Speculative activity continues to grip the bellwether US market. Our BCA Equity Speculation Index is still around two sigma. Previous instances of high readings did not necessarily herald the end of bull markets; however, they often resulted in sideways and volatile trading, until the speculative excesses dissipated (Chart 3). The case for such volatile trading is strong. The Fed is set to begin its taper at its November meeting. Moreover, an end of the QE program by the middle of next year and the upcoming rotation of regional Fed heads on the FOMC will likely result in a first rate hike by the end of 2022. Already, the growth rate of the global money supply has declined, and the real yield impulse is not as supportive as it once was. Therefore, the deterioration in our BCA Monetary Indicator should perdure (Chart 4), which will heighten the sensitivity of global stocks to bad news out of China. Chart 3Rife With Speculation
Rife With Speculation
Rife With Speculation
Chart 4Liquidity Deterioration At The Margin
Liquidity Deterioration At The Margin
Liquidity Deterioration At The Margin
Chart 5Still Too Happy
Still Too Happy
Still Too Happy
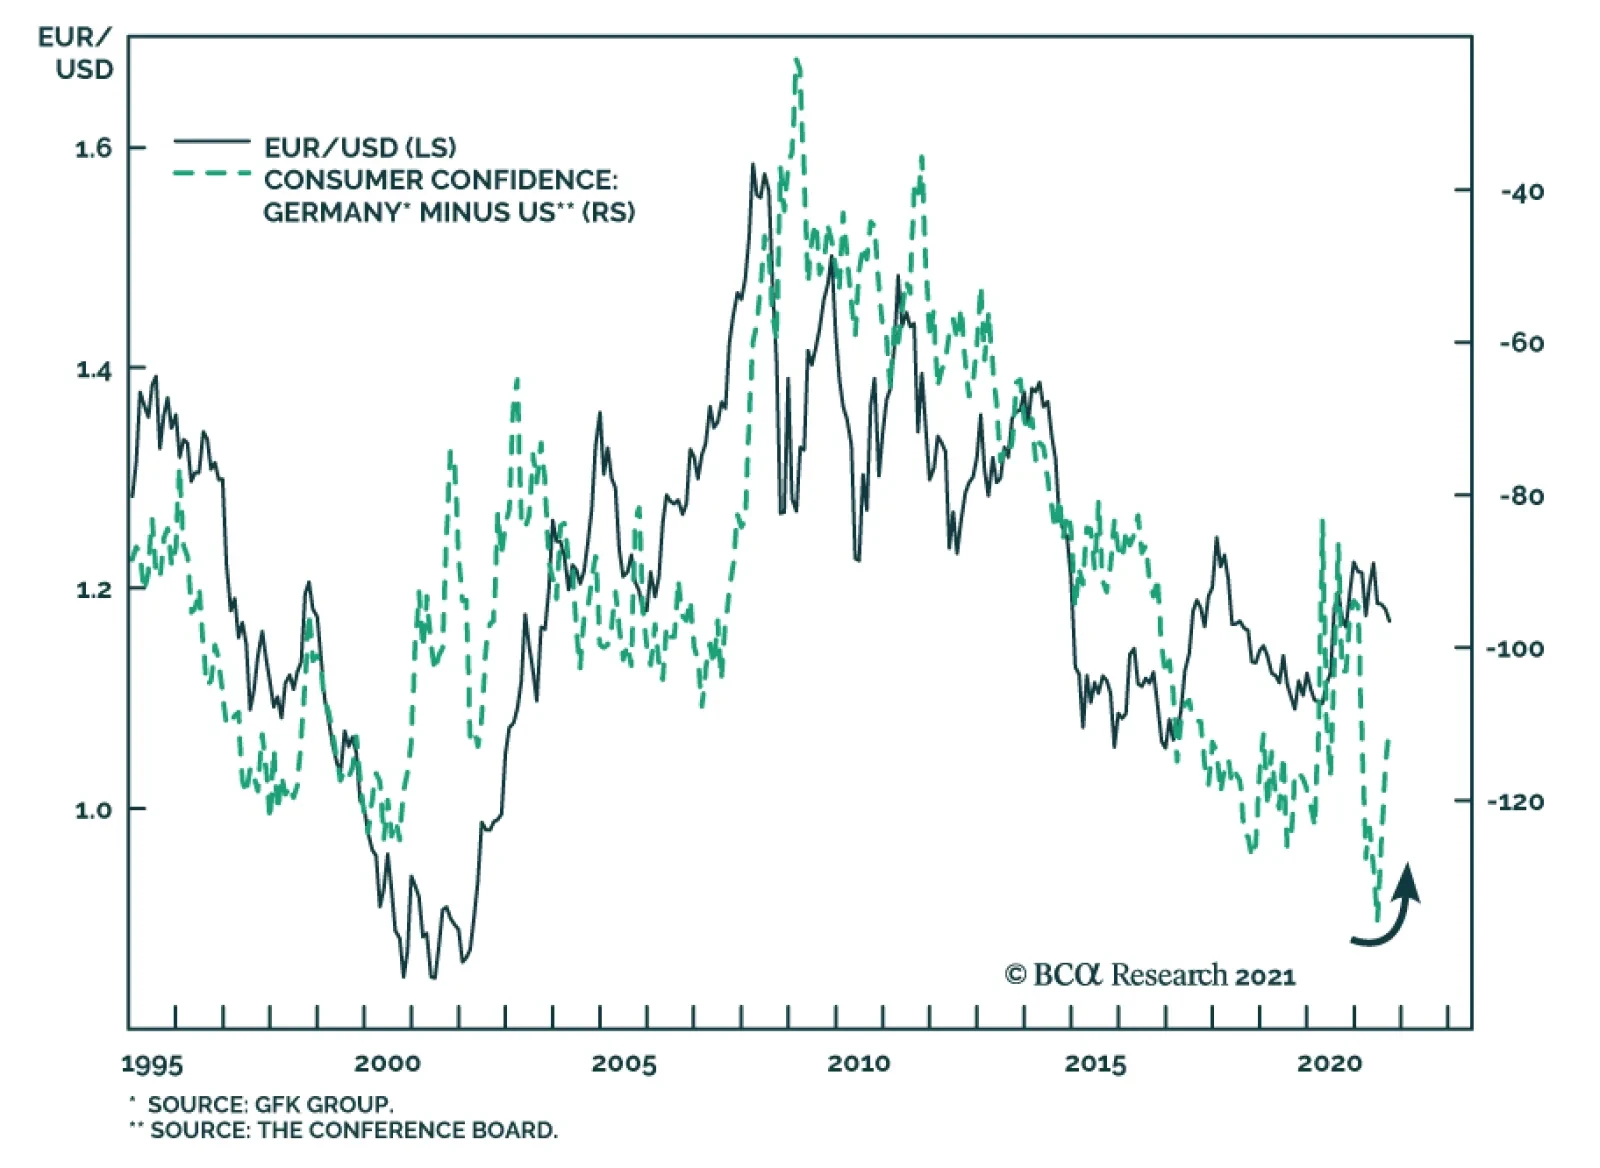
Investor sentiment is also not as washed out as many news stories ascertain. The AAII survey shows that the number of equity bulls has fallen sharply, but BCA’s Complacency-Anxiety Index, Equity Capitulation Indicator and Sentiment composite are still inconsistent with durable market bottoms. Moreover, the National Association of Active Investment Managers’ Exposure Index is still very elevated. When this gauge is combined with the AAII bulls minus bears indicator, it often detects floors in the US dollar-price of the European MSCI index (Chart 5). For now, this composite sentiment measure is flashing further vulnerability for European equities, especially if China remains a source of potential bad news in the coming months. Economic linkages reinforce the tactical risk to European stocks. Chinese construction activity affects the Euro Area industrial production because machinery and transportation goods represent 50% of Europe’s export to China (Chart 6). This category is very sensitive to Chinese real estate activity. Moreover, Europe’s exports to other nations are also indirectly affected by the demand from Chinese construction. Financial markets bear this footprint. Excavator sales in China are a leading indicator of construction activity. Historically, they correlate well with both the fluctuations of EUR/USD and the performance of Eurozone stocks relative to those of the US (Chart 7). Hence, if we anticipate that the problems Evergrande faces will weigh on excavator sales in the coming months, then the euro will suffer and Euro Area stocks could continue to underperform. Chart 6Europe's Exports To China Are Sensitive To Construction Activity
Europe's Exports To China Are Sensitive To Construction Activity
Europe's Exports To China Are Sensitive To Construction Activity
Chart 7A Near-Term Risk To European Assets
A Near-Term Risk To European Assets
A Near-Term Risk To European Assets
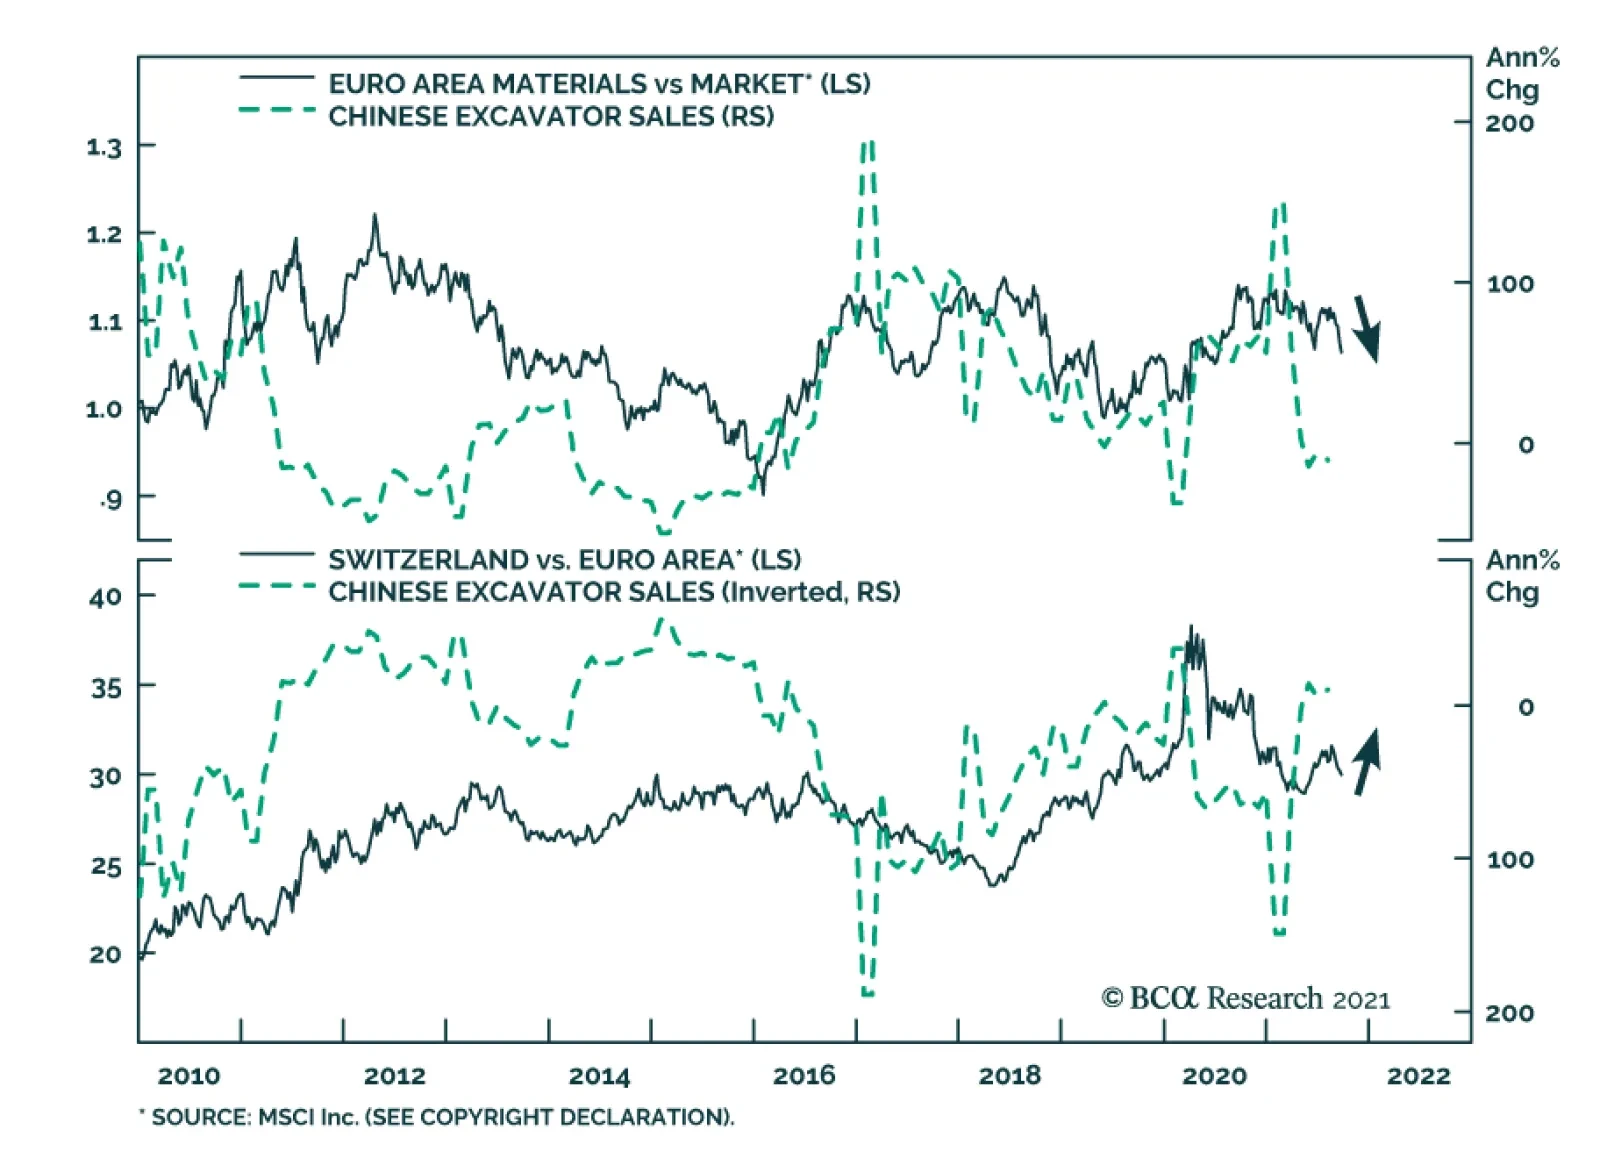
Similarly, the fallout from Evergrande’s problem will extend to the performance of European equity sectors. The sideways corrective episode in cyclical relative to defensive shares is likely to continue in the near term. This sector twist remains frothy, and often declines when Chinese credit origination is soft (Chart 8). Materials stocks are the most likely to suffer due to their tight correlation with Chinese excavator sales (Chart 9); meanwhile, healthcare equities will reap the greatest benefit as a result of their appealing structural growth profile and their strong defensive property. Geographically, Swiss stocks should perform best (Chart 9, bottom panel), because they strongly overweigh healthcare and consumer staple names. Moreover, as we recently argued, the SNB’s monetary policy is an advantage for Swiss stocks compared to Eurozone defensives.1 Additionally, Dutch equities, with their 50% weighting in tech and their small 12% combined allocation to industrials and materials, could also enjoy a near-term outperformance as investors digest the sectoral impact of weaker Chinese construction activity. Chart 8The Vulnerability Of Cyclicals/Defensives Remains
The Vulnerability Of Cyclicals/Defensives Remains
The Vulnerability Of Cyclicals/Defensives Remains
Chart 9Responses To Weaker Construction
Responses To Weaker Construction
Responses To Weaker Construction
Bottom Line: No matter how the Evergrande story unfolds, its consequence on Chinese construction activity may still cause market tremors. Global equity benchmarks may be rebounding right now, but, ultimately, they remain vulnerable to this slowdown. Any negative surprise out of China is likely to cause Europe to underperform because of its greater exposure to Chinese construction activity. Investment Conclusion: This Too Shall Pass The risks to the European equity market and its cyclicals sectors will prove transitory and will finish by the end of the year. Beijing will tolerate some pain to the real estate sector, but the stakes are too high to let the situation fester for long. The main problem is China’s large debt. Already sequential GDP growth in the first half of 2021 was worse than the same period in 2020, and credit accumulation is just as weak as in early 2018 (Chart 10). In this context, if real estate activity deteriorates too much, aggregate profits will contract and, in turn, will hurt the corporate sector’s ability to service its debt. Employment and social tensions create another stress point that will force Beijing’s hand. At 47, the non-manufacturing PMI employment index is already well into the contraction zone (Chart 11). Weakness in construction activity will hurt the labor market further. In an environment where protests have been springing up all over China, the Communist Party does not want to see more stress applied to workers. Chart 10In The End, Stimulus Will Come
In The End, Stimulus Will Come
In The End, Stimulus Will Come
Chart 11Worsening Chinese Employment Conditions
Worsening Chinese Employment Conditions
Worsening Chinese Employment Conditions
These two constraints will force Beijing to alleviate the pain caused by a weaker construction sector. As a result, we still expect the Chinese credit and fiscal impulse to re-accelerate by Q2 2022. Developments outside of China will create another important offset that will allow risk assets to thrive once their immediate froth has receded. Strong DM capex will be an important driver of global activity next year. As Chart 12 shows, capex intentions in the US and the Euro Area are rapidly expanding, which augurs well for global investments. Moreover, re-building depleted inventories (Chart 13) will be a crucial component of the solution to global supply bottlenecks. Both activities will add to global demand. As an example, ship orders are already surging. Chart 12DM Capex Intentions Are Firming
DM Capex Intentions Are Firming
DM Capex Intentions Are Firming
Chart 13Don't Forget About Inventories
Don't Forget About Inventories
Don't Forget About Inventories
We maintain a pro-cyclical stance in European markets after weighing the near-term negatives against the underlying positive forces. For now, hedging the tactical risk still makes sense and our long telecommunication / short consumer discretionary equities remain the appropriate vehicle – so does being long Swiss stocks versus Euro Area defensives. However, we will use any correction in the EURO STOXX (Bloomberg: SXXE Index) to the 430-420 zone to unload this protection. Bottom Line: The potential market stress created by a slowdown in Chinese construction activity will be a temporary force. Beijing will not tolerate a much larger hit to the economy, especially as tensions are rising across the country. Thus, even if the stimulus response to the Evergrande crisis will not be immediate, it will eventually come, which will support Chinese economic activity. Additionally, the capex upside and inventory rebuilding in advanced economies will create an offset for slowing Chinese growth. Consequently, while we maintain a pro-cyclical bias over the medium term, we are also keeping in place our hedges in the near term, looking to shed them if SXXE hits the 430-420 zone. A Big Week For Central Banks Chart 14The BoE's Is Listening To The UK's Economic Conditions...
The BoE's Is Listening To The UK's Economic Conditions...
The BoE's Is Listening To The UK's Economic Conditions...
Last week, four European central banks held their policy meetings: The Riksbank, the Swiss National Bank, the Norges Bank, and the Bank of England. No major surprises came out of these meetings, with central banks discourses and policy evolving in line with their respective economies. The BoE veered on the hawkish side, highlighting that rates could rise before its QE program is over. This implies a small possibility of a rate hike by the end of 2021. However, our base case remains that the initial hike will be in the first half of 2022. The BoE is behaving in line with the message from our UK Central Bank Monitor (Chart 14). Moreover, the combination of rapid inflation and strong house price appreciation is incentivizing the BoE to remove monetary accommodation, especially because UK financial conditions are extremely easy (Chart 14, bottom panel). One caution advanced by the MPC is the uncertainty surrounding the impact of the end of the job furlough scheme this month. However, the global economy will be strong enough next spring to mitigate the risks to the UK. The results of last week’s MPC meeting and our view on the global and UK business cycles support the short EUR/GBP recommendation of BCA’s foreign exchange strategist,2 as well as the underweight allocation to UK Gilts of our Global Fixed Income Strategy group.3 The Norges Bank is the first central bank in the G-10 to hike rates and is likely to do so again later this year. While Norwegian core inflation remains low, house prices are strong, monetary conditions are extremely accommodative, and our Norway Central Bank Monitor is surging (Chart 15). The Norwegian central bank will continue to focus on these positives, especially in light of our Commodity and Energy team’s view that Brent will average more than $80/bbl by 2023.4 In this context, we anticipate the NOK to outperform the euro over the coming 24 months. Nonetheless, the near-term outlook for Norwegian stocks remains fraught with danger. Materials account for 17% of the MSCI Norway index and are the sector most vulnerable to a deterioration in Chinese construction activity. The Riksbank continues to disregard the strength of the Swedish economy. Relative to economic conditions, it is one of the most dovish central banks in the world. The Swedish central bank is completely ignoring the message from our Sweden Central Bank Monitor, which has never been as elevated as it is today (Chart 16). Moreover, the inexpensiveness of the SEK means that Swedish financial conditions are exceptionally accommodative. At first glance, this picture is bearish for the SEK. However, easy monetary conditions will cause Sweden’s real estate bubble to expand. Expanding real estate prices and transaction volumes will boost the profits of Swedish financials, which account for 27% of the MSCI Sweden index. Moreover, Swedish industrials remain one of our favorite sectors in Europe, and they represent 38% of the same index. As a result, equity flows into Sweden should still hurt the EUR/SEK cross. Chart 15...And The Norges Bank, To Norway's
...And The Norges Bank, To Norway's
...And The Norges Bank, To Norway's
Chart 16The Riksbank Is Blowing Real Estate Bubbles
The Riksbank Is Blowing Real Estate Bubbles
The Riksbank Is Blowing Real Estate Bubbles
Chart 17The CHF Still Worries The SNB
The CHF Still Worries The SNB
The CHF Still Worries The SNB
Finally, the SNB proved reliably dovish. Our Switzerland Central Bank Monitor is rising fast as inflation and house prices improve (Chart 17). However, the SNB is rightfully worried about the expensiveness of the CHF, which generates tight Swiss financial conditions (Chart 17, bottom panel). Consequently, the SNB will keep fighting off any depreciation in EUR/CHF. Thus, the SNB will be forced to expand its balance sheet because the ECB is likely to remain active in asset markets longer than many of its peers. This process will be key to the outperformance of Swiss stocks relative to other European defensive equities. Mathieu Savary, Chief European Strategist Mathieu@bcaresearch.com Footnotes 1 Please see European Investment Strategy “The ECB’s New Groove,” dated July 19, 2021, available at eis.bcarsearch.com 2 Please see Foreign Exchange Strategy “Why Are UK Interest Rates Still So Low?,” dated March 10, 2021, available at fes.bcarsearch.com 3 Please see European Investment Strategy “The UK Leads The Way,” dated August 11, 2021, available at eis.bcarsearch.com 4 Please see Commodity & Energy Strategy “Upside Price Risk Rises For Crude,” dated September 16, 2021, available at fes.bcarsearch.com Tactical Recommendations
Europe’s Evergrande Problem
Europe’s Evergrande Problem
Cyclical Recommendations
Europe’s Evergrande Problem
Europe’s Evergrande Problem
Structural Recommendations
Europe’s Evergrande Problem
Europe’s Evergrande Problem
Closed Trades
Europe’s Evergrande Problem
Europe’s Evergrande Problem
Currency Performance Fixed Income Performance Equity Performance
The German IFO’s Business Climate Index softened for the third consecutive month in September, falling to 98.8 from 99.6. The weakness was led by the Current Assessment number which lost 1-point versus expectations of a minor improvement. Meanwhile, the…
Highlights Asian and European natural gas prices will remain well bid as the Northern Hemisphere winter approaches. An upgraded probability of a second La Niña event this winter will keep gas buyers scouring markets for supplies (Chart of the Week). The IEA is pressing Russia to make more gas available to European consumers going into winter. While Russia is meeting contractual commitments, it is also trying to rebuild its inventories. Gas from the now-complete Nord Stream 2 pipeline might not flow at all this year. High natgas prices will incentivize electric generators to switch to coal and oil. This will push the level and costs of CO2 emissions permits higher, including coal and oil prices. Supply pressures in fossil-fuel energy markets are spilling into other commodity markets, raising the cost of producing and shipping commodities and manufactures. Consumers – i.e., voters – experiencing these effects might be disinclined to support and fund the energy transition to a low-carbon economy. We were stopped out of our long Henry Hub natural gas call spread in 1Q22 – long $5.00/MMBtu calls vs short $5.50/MMBtu calls in Jan-Feb-Mar 2022 – and our long PICK ETF positions with returns of 4.58% and -10.61%. We will be getting long these positions again at tonight's close. Feature European natural gas inventories remain below their five-year average, which, in the event of another colder-than-normal winter in the Northern Hemisphere, will leave these markets ill-equipped to handle a back-to-back season of high prices and limited supply (Chart 2).1 The probability of a second La Niña event this winter was increased to 70-80% by the US Climate Prediction Center earlier this week.2 This raises the odds of another colder-than-average winter. As a result, markets will remain focused on inventories and flowing natgas supplies from the US, in the form of Liquified Natural Gas (LNG) cargoes, and Russian pipeline shipments to Europe as winter approaches. Chart of the WeekSurging Natural Gas Prices Intensify Competition For Supplies
Natgas Markets Continue To Tighten
Natgas Markets Continue To Tighten
Chart 2Natgas Storage Remains Tight
Natgas Markets Continue To Tighten
Natgas Markets Continue To Tighten
US LNG supplies are being contested by Asian buyers, where gas storage facilities are sparse, and European buyers looking for gas to inject into storage as they prepare for winter. US LNG suppliers also are finding ready bids in Brazil, where droughts are reducing hydropower availability. In the first six months of this year, US natgas exports averaged 9.5 bcf/d, a y/y increase of more than 40%. Although Russia's Nord Stream 2 pipeline has been completed, it still must be certified to carry natgas into Germany. This process could take months to finish, unless there is an exemption granted by EU officials. Like the US and Europe, Russia is in the process of rebuilding its natgas inventories, following a colder-than-normal La Niña winter last year.3 Earlier this week, the IEA called on Russia to increase natgas exports to Europe as winter approaches. The risk remains no gas will flow through Nord Stream 2 this year.4 Expect Higher Coal, Oil Consumption As other sources of energy become constrained – particularly UK wind power in the North Sea, where supplies went from 25% of UK power in 2020 to 7% in 2021 – natgas and coal-fired generation have to make up for the shortfall.5 Electricity producers are turning more towards coal as they face rising natural gas prices.6 Increasing coal-fired electric generation produces more CO2 and raises the cost of emission permits, particularly in the EU's Emissions Trading System (ETS), which is the largest such market in the world (Chart 3). Prices of December 2021 ETS permits, which represent the cost of CO2 emissions in the EU, hit an all-time high of €62.75/MT earlier this month and were trading just above €60.00/MT as we went to press. Chart 3Higher CO2 Emissions Follow Lower Renewables Output
Higher CO2 Emissions Follow Lower Renewables Output
Higher CO2 Emissions Follow Lower Renewables Output
Going into winter, the likelihood of higher ETS permit prices increases if renewables output remains constrained and natgas inventories are pulled lower to meet space-heating needs in the EU. This will increase the price of power in the EU, where consumers are being particularly hard hit by higher prices (Chart 4). The European think tank Bruegel notes that even though natgas provides about 20% of Europe's electricity supply, it now is setting power prices on the margin.7 Chart 4EU Power Price Surge Is Inflationary
Natgas Markets Continue To Tighten
Natgas Markets Continue To Tighten
Elevated natgas prices are inflationary, according to Bruegel: "On an annual basis, a doubling of wholesale electricity prices from about €50/megawatt hour to €100/MWh would imply that EU consumers pay up to €150 billion (€50/MWh*3bn MWh) more for their electricity. … Drastic increases in energy spending will shrink the disposable income of the poorest households with their high propensity to consume." This is true in other regions and states, as well. Is the Natgas Price Surge Transitory? The odds of higher natgas and CO2 permit prices increase as the likelihood of a colder-than-normal winter increases. Even a normal winter likely would tax Europe's gas supplies, given the level of inventories, and the need for Russia to replenish its stocks. However, at present, even with the odds of a second La Niña event this winter increasing, this is a probable event, not a certainty. The global natgas market is evolving along lines similar to the crude oil market. Fungible cargoes can be traded and moved to the market with the highest netback realization, after accounting for transportation. High prices now will incentivize higher production and a stronger inventory-injection season next year. That said, prices could stay elevated relative to historical levels as this is occurring. Europe is embarked on a planned phase-out of coal- and nuclear-powered electricity generation over the next couple of years, which highlights the risks associated with the energy transition to a low-carbon future. China also is attempting to phase out coal-fired generation in favor of natgas turbines, and also is pursuing a buildout of renewables and nuclear power. Given the extreme weather dependence on prices for power generated from whatever source, renewables will remain risky bets for modern economies as primary energy sources in the early stages of the energy transition. When the loss of wind, for example, must be made up with natgas generation and that market is tight owing to its own fundamental supply-demand imbalance, volatile price excursions to high levels could be required to destroy enough demand to provide heat in a cold winter. This would reduce support for renewables if it became too-frequent an event. This past summer and coming winter illustrate the risk of too-rapid a phase out of fossil-fueled power generation and space-heating fuels (i.e., gas and coal). Frequent volatile energy-price excursions, which put firms and households at risk of price spikes over an extended period of time, are, for many households, material events. We have little doubt the commodity-market effects will be dealt with in the most efficient manner. As the old commodity-market saw goes, "High prices are the best cure for high prices, and vice versa." All the same, the political effects of another very cold winter and high energy prices are not solely the result of economic forces. Inflation concerns aside, consumers – i.e., voters – may be disinclined to support a renewable-energy buildout if the hits to their wallets and lifestyles become higher than they have been led to expect. Investment Implications The price spike in natgas is highly likely to be a transitory event. Another surge in natgas prices likely would be inflationary while supplies are rebuilding – so, transitory. Practically, this could stoke dissatisfaction among consumers, and add a political element to the transition to a low-carbon energy future. This would complicate capex decision-making for incumbent energy suppliers – i.e., the fossil-fuels industries – and for the metals suppliers, which will be relied upon to provide the literal building blocks for the renewables buildout. Robert P. Ryan Chief Commodity & Energy Strategist rryan@bcaresearch.com Ashwin Shyam Research Associate Commodity & Energy Strategy ashwin.shyam@bcaresearch.com Commodities Round-Up Energy: Bullish US crude oil inventories fell 3.5mm barrels in the week ended 17 September 2021, according to the US EIA. Product inventories built slightly, led by a 3.5mm-build in gasoline stocks, which was offset by a 2.6mm barrel draw in distillates (e.g., diesel fuel). Cumulative average daily crude oil production in the US was down 7% y/y, and stood at 10.9mm b/d. Cumulative average daily refined-product demand – what the EIA terms "Product Supplied" – was estimated at 19.92mm b/d, up almost 10% y/y. Brent prices recovered from an earlier sell-off this week and were supported by the latest inventory data (Chart 5). Base Metals: Bullish Iron ore prices have fallen -55.68% since hitting an all-time high of $230.58/MT in May 12, 2021 (Chart 6). This is due to sharply reduced steel output in China, as authorities push output lower to meet policy-mandated production goals and to conserve power. Even with the cuts in steel production, overall steel output in the first seven months of the year was up 8% on a y/y basis, or 48mm MT, according to S&P Global Platts. Supply constraints likely will be exacerbated as the upcoming Olympic Games hosted by China in early February approach. Authorities will want blue skies to showcase these events. Iron ore prices will remain closer to our earlier forecast of $90-$110/MT than not over this period.8 Precious Metals: Bullish The Federal Open Market Committee is set to publish the results of its meeting on Wednesday. In its last meeting in June, more hawkish than expected forecasts for interest rate hikes caused gold prices to drop and the yellow metal has been trading significantly lower since then. Our US Bond Strategy colleagues expect an announcement on asset purchase tapering in end-2021, and interest rate increases to begin by end-2022.9 Rate hikes are contingent on the Fed’s maximum employment criterion being reached, as expected and actual inflation are above the Fed criteria. Tapering asset purchases and increases in interest rates will be bearish for gold prices. Chart 5
BRENT PRICES BEING VOLATILE
BRENT PRICES BEING VOLATILE
Chart 6
BENCHMARK IRON ORE 62% FE, CFR CHINA (TSI)RECOVERING
BENCHMARK IRON ORE 62% FE, CFR CHINA (TSI)RECOVERING
Footnotes 1 Equinor, the Norwegian state-owned energy-supplier, estimates European natgas inventories will be 70-75% of their five-year average this winter. Please see IR Gas Market Update, September 16, 2021. 2 Please see "ENSO: Recent Evolution, Current Status and Predictions," published by the US Climate Prediction Center 20 September 2021. Earlier this month, the Center gave 70% odds to a second La Niña event in the Northern Hemisphere this winter. Please see our report from September 9, 2021 entitled NatGas: Winter Is Coming for additional background. 3 Please see IEA calls on Russia to send more gas to Europe before winter published by theguardian.com, and Big Bounce: Russian gas amid market tightness. Both were published on September 21, 2021. 4 Please see Nord Stream Two Construction Completed, but Gas Flows Unlikely in 2021 published 14 September 2021 by Jamestown.org. 5 Please see The U.K. went all in on wind power. Here’s what happens when it stops blowing, published by fortune.com on 16 September 2021. Argus Media this week reported wind-power output fell 56% y/y in September 2021 to just over 2.5 TWh. 6 Please see UK power firms stop taking new customers amid escalating crisis, published by Aljazeera; Please see UK fires up coal power plant as gas prices soar, published by BBC. 7 Please see Is Europe’s gas and electricity price surge a one-off?, published by Bruegel 13 September 2021. 8 Please see China's Recovery Paces Iron Ore, Steel, which we published on November 5, 2020. 9 Please see 2022 Will Be All About Inflation and Talking About Tapering, published on September 22, 2021 and on August 10, 2021 respectively. Investment Views and Themes Recommendations Strategic Recommendations Commodity Prices and Plays Reference Table Trades Closed in 2021 Summary of Closed Trades
BCA Research’s European Investment Strategy & Geopolitical Strategy services conclude that German stocks are a bargain. During the past 5 months, the German MSCI index has underperformed the rest of the Eurozone by 6.2%. The poor performance of German…
Highlights Germany’s election on September 26 is more of an opportunity than a risk for global investors. Coalition formation will prolong uncertainty but the key takeaway is that early or aggressive fiscal tightening is off the table for Germany … and hence the EU. Germany’s left wing is surprising to the upside as predicted, but it is the Social Democrats rather than the Greens who have momentum in the polls. This is a market-positive development. A coalition of only left-wing parties is entirely possible, but there is a 65% chance that the Christian Democrats (or Free Democrats) will take part in the next coalition to get a majority government. This would constrain business unfriendly outcomes. The German economy is likely to slow for the remainder of 2021, but the outlook for 2022 remains bright as the current headwinds facing the country will dissipate, especially if the risk of an aggressive fiscal drag is low. The underperformance of German equities relative to their Eurozone counterparts is long in the tooth. A combination of valuation, earnings momentum and technical factors suggests that German stocks will beat their peers next year. German equities will also outperform Bunds, which offer particularly unattractive prospective returns. Feature Germany’s federal election will be held on September 26. Our forecast that the left wing will surprise to the upside remains on track, albeit with the Social Democrats rather than the Greens surging to the forefront of opinion polls (Chart 1). However, the precise composition of the next government is very much in the air. Chart 1German Election: Social Democrats Take The Lead
German Election: Social Democrats Take The Lead
German Election: Social Democrats Take The Lead
Our quantitative German election model – which we introduce in this special report – predicts that the ruling Christian Democratic Union will outperform their current 21% standing in opinion polls, winning as much as 33% of the popular vote. Subjectively, this seems like an overestimation, but it goes to show that outgoing Chancellor Angela Merkel’s popularity, a historically strong voting base, and the economic recovery will help the party pare its losses this year. This finding, combined with the strong momentum for the Social Democrats, suggests that the election outcome will not be decisive. Germany will end up with either a grand coalition that includes Merkel’s Christian Democrats or a left-wing coalition that lacks a majority in parliament.1 Investors should note that none of the election outcomes are hugely disruptive to domestic or foreign policy. The status quo is unexciting but not market-negative, while a surprise left-wing victory would mean more reflation in the short run but a roll back of some pro-business policies in the long run. More broadly Germany has established a national consensus that rests on European integration, looser fiscal policy, renewable energy, and qualified engagement with autocratic powers like Russia and China. The chief takeaway is that fiscal policy will not be tightened too soon – and could be loosened substantially. Germany’s Fiscal Question Outgoing Chancellor Angela Merkel is stepping down after ruling Germany since 2005. The Christian Democratic Union, and its Bavarian sister party the Christian Social Union, together form the “Union” that is hard to beat in German elections, having occupied the chancellor’s office for 57 out of 72 years. However, both the Christian Democrats and the Social Democrats, their main rivals, have been shedding popular vote share since 1990, as other parties like the Greens, Free Democrats, the Left, and Alternative for Germany have gained traction (Table 1). Table 1Germany: Traditional Parties Lose Vote Share Over Time
German Election: Winds Of Change
German Election: Winds Of Change
The Great Recession and European sovereign debt crisis ushered in a new geopolitical and macroeconomic context that Merkel reluctantly helped Germany and the EU navigate. Germany’s clashes with the European periphery ultimately resulted in deeper EU integration, in accordance with Germany’s grand strategy and Merkel’s own strategy. But just as the euro crisis receded, a series of shocks elsewhere threatened to upend Germany’s position as one of the biggest economic winners of the post-Cold War world. The sluggish aftermath of the financial crisis, the Russian invasion of Crimea, the Syrian refugee crisis, the Brexit referendum, and President Trump’s election in the US sparked a retreat from globalization, a direct threat to an export-oriented manufacturing economy like Germany. In the 2017 election the Union lost 13.4 percentage points compared to the 2013 election. Minor parties have gradually gained ground since then. However, through a coalition with the Social Democrats, Merkel and her party managed to retain control of the government. This grand coalition eased the country’s fiscal belt in response to the trade war and global slowdown in 2019, signaling Germany’s own shift away from fiscal austerity. Then COVID-19 struck, prompting a much larger fiscal expansion to tide over the economy amid social lockdowns. Germany was not the largest EU member in terms of fiscal stimulus but nor was it the smallest (Chart 2). It joined with France to negotiate a mutual debt plan to rescue the broader EU economy and deepen integration. Chart 2Germany’s Fiscal Stimulus Ranks In The Middle Of Major Countries
German Election: Winds Of Change
German Election: Winds Of Change
Germany’s pro-EU perspective has been reinforced by Brexit and is not on the ballot in 2021. Immigration and terrorism have temporarily subsided as voter concerns. The focus of the 2021 election is how to get through the pandemic and rebuild the German economy for the future. For investors the chief question is whether conservatives will have enough sway in the next government to try to semi-normalize policy and consolidate budgets in the coming years, or whether a left-wing coalition will take charge, expanding on Germany’s proactive fiscal turn. The latter has consequences for broader EU fiscal normalization as well since Germany is traditionally the prime enforcer of deficit limits. The latest opinion polls point to more proactive fiscal policy. The country’s left-leaning ideological bloc has taken the lead (Chart 3A) and the Social Democratic leader Olaf Scholz has sprung into first place among the chancellor candidates (Chart 3B). Chart 3AGermany: Voting Intentions Favor Left-Leaning Parties
Germany: Voting Intentions Favor Left-Leaning Parties
Germany: Voting Intentions Favor Left-Leaning Parties
Chart 3BSocial Democrats Likely To Take Chancellery
German Election: Winds Of Change
German Election: Winds Of Change
Scholz has served as finance minister and is the face of the country’s recent fiscal stimulus efforts. Public opinion is clearly rewarding him for this stance as well as his party, which was previously in the doldrums.2 The Social Democrats and Greens are calling for more fiscal expansion as well as wage hikes and tax hikes (wealth redistribution) in pursuit of social equality and a greener economy (Table 2). If the Christian Democrats retain a significant role in the future coalition, these initiatives will be blunted – not to say halted entirely. But if the left parties put together a ruling coalition without the Christian Democrats, then they will be able to launch more ambitious tax-and-spend policies. Opinion polls show that voters still slightly favor coalitions that include the Christian Democrats, although momentum has shifted sharply in favor of a left-wing coalition (Chart 4). Table 2German Party Platforms
German Election: Winds Of Change
German Election: Winds Of Change
Chart 4Voters Evenly Split On Whether Next Coalition Should Include CDU
German Election: Winds Of Change
German Election: Winds Of Change
This shift is what we forecast in previous reports but now the question is whether the left-wing parties can actually win enough seats to put together a majority coalition. That is a tall order. Our quantitative election model suggests that the Christian Democrats, having suffered a long overdue downgrade in expectations, will not utterly collapse when the final vote is tallied. While we do not expect them to retain the chancellorship, momentum will have to shift even further in the opposition’s favor over the next two weeks to produce a majority coalition that excludes the Union. Our Quantitative German Election Model Our model is based off the work of Norpoth and Geschwend, who created a simple linear model to predict the vote share that incumbent governing parties or coalitions will obtain in impending elections.3 Their model utilizes three explanatory variables and has a sample size of 18 previous elections, covering elections from 1953 to 2017. Our model updates their original work to make estimates for the 2021 election. Unlike our US Political Strategy Presidential Model, which makes use of both political and economic explanatory variables in real time, our German election model makes predictions based solely on historical political variables, all of which display a high degree of correlation with popular vote share. We will look at economic factors that may affect the election later in this report. The Three Explanatory Variables 1. Chancellor Approval Rating: This variable captures the short-term support rate of the incumbent chancellor. A positive relationship exists between chancellor approval and vote share: higher approval equates to higher vote share for the incumbent party. Merkel’s approval stands at 64% today which is a boon for the otherwise beleaguered Christian Democrats (Chart 5). Chart 5Merkel's Coattails A Boon But Not Enough To Save Her Party
Merkel's Coattails A Boon But Not Enough To Save Her Party
Merkel's Coattails A Boon But Not Enough To Save Her Party
2. Long-term partisanship: This variable shows the long-term support rate of voters for specific parties or coalitions in past elections. It is measured as the average vote share of the incumbent party over the past three elections. A positive relationship with vote share exists here too: higher historical partisanship equates to a higher share of votes in forthcoming elections, and vice versa. This variable clearly gives a boost to the Christian Democrats – although it could overrate them based on past performance, as occurred in 2017 when they underperformed the model’s prediction.4 3. “Time For Change”: This is a categorical variable measured by how many terms the parties or coalition have held office leading into an election. This variable has a negative relationship with vote share outcomes. The longer an incumbent party or coalition holds office, the less vote share they will receive. Effectively, our model punishes parties that hold office for long periods of time. In this case that would be the long-ruling Christian Democrats. Model Estimation And Results Our model is estimated by the following simple equation: Popular Vote Share = constant + ßChancellor Approval Rating + ßLong-Term Partisanship + ßTime For Change Estimating the above model for the 2021 election predicts that the Union will win 32.7% of the vote share (Table 3). If this prediction came true, it would suggest that the ruling party performed almost exactly the same as in 2017. In other words, the party’s strong voter base combined with Merkel’s long coattails are expected to shore up the party. This flies in opinion polling, however, so we think the model is overestimating the Christian Democrats. Table 3Our German Election Quant Model Says CDU Will Not Collapse
German Election: Winds Of Change
German Election: Winds Of Change
Note that even if the Union performs this well, it still will not win enough seats to govern on its own. Potential Union-led coalitions are shown in Table 3, excluding the Social Democrats (see below). For a majority government, a coalition with the Free Democrats and the Greens would need to be formed. This coalition would equate to 53% of the vote share. Otherwise, to obtain a majority, the Union would have to team up with the Social Democrats, which is today’s status quo. We can use the same methodology to predict the vote share for the Social Democrats. We use the support rate of Social Democratic chancellor-candidate Olaf Scholz and calculate the long-term partisanship variable using past Social Democratic vote shares. In this case our model predicts that the Social Democrats will win 22.1% of the vote. If this result were to come true, it would not be enough for the party to govern own its own. Potential Social Democratic-led coalitions are shown in Table 4. The best coalition would be with the Greens and either the Left or the Free Democrats. But in this case the Social Democrats cannot form a government with a vote share above 50%, unless it pairs up with the Christian Democrats. Table 4Our German Election Quant Model Says SPD Has Not Yet Won It All
German Election: Winds Of Change
German Election: Winds Of Change
In other words, either the left-wing parties must build on their current momentum and outperform their historical record in the final election tally, or they will need to form a coalition with the Christian Democrats. This kind of left-wing surge is precisely what we have predicted. But the model helps put into perspective how difficult it will be for the left-leaning parties to get a majority. Scholz is single-handedly trying to overcome the long downtrend of the Social Democrats. His party is rising at the expense of the Greens, and the Left, which puts a lid on the total left-wing coalition size. If these three parties all beat the model and slightly surpass their top vote share in recent memory (SPD at 26%, Greens at 11%, and the Left at 12%), they still only have 49% of the vote. While our model is reliant on historical political data, it is a robust predictor for past election results (Chart 6). The average vote share error between the predicted and realized outcomes over from 1953 to 2013 is 1.7 percentage points. The problem with relying on the model is that the Christian Democrats have broken down from their long-term trend in opinion polls. And while Merkel’s approval is strong, she is no longer on the ballot and her hand-picked successor, Armin Laschet, is floundering in the polls (see Chart 3B above). Chart 6Our German Election Quant Model Has Solid Track Record, But Merkel’s High Approval Rating Caused Overestimate In 2017 And May Do So In 2021
German Election: Winds Of Change
German Election: Winds Of Change
In short, the model is probably overrating the Union but it is also calling attention to the extreme difficulty of the left-wing parties forming a majority coalition. Scholz may have to form a coalition with the Free Democrats or pursue another grand coalition. And if the Social Democrats fail to get the largest vote share, German President Frank-Walter Steinmeier may ask Armin Laschet to try to form a government first. Still, Scholz is the most likely chancellor when all is said and done. Election Model Takeaway Our German election model predicts that the Union will receive 32.9% of the popular vote, while the Social Democrats will receive 22.1%. At the same time, the left-leaning parties, specifically the Social Democrats, clearly have the momentum. Therefore the model may be overrating the incumbent party. But it still calls attention to a high level of uncertainty, the likelihood of a messy election outcome, and a tricky period of coalition formation. The Social Democrats will have to pull off a major surprise, outperforming both history and our model, to lead a majority government without the Christian Democrats.5 We still think this is possible. But we will stick with our earlier subjective probabilities: 65% odds that the Christian Democrats take part in the next coalition, 35% odds that they do not. Bottom Line: The chancellorship will go to the Social Democrats but the coalition will constrain the business unfriendly aspects of their agenda. This is positive for Germany’s corporate earnings outlook. Macro Outlook: A Temporary Economic Dip Our election model does not account for the economic backdrop and hence ignores the “pocketbook voter.” Germany is recovering from the pandemic, which is marginally supportive for an otherwise faltering ruling party. However, the economic data is only good enough to suggest that the Union will not utterly collapse. A rise in unemployment, inflation, and the combination of the two (the “Misery Index”) is a tell-tale sign that the incumbent party will suffer a substantial defeat (Chart 7). However the German economy’s loss of momentum is temporary. Growth will re-accelerate in early 2022. The timing is politically inconvenient for the ruling party but positive news for investors. German economic confidence is deteriorating. The Ifo Business Climate survey has rolled over, lowered by a meaningful decline in the Expectations Survey. Additionally, consumer confidence is turning south, despite already being low (Chart 8). Chart 7Spike In German Misery Index A Tell-Tale Sign Of Poor Election For Incumbent Party
Spike In German Misery Index A Tell-Tale Sign Of Poor Election For Incumbent Party
Spike In German Misery Index A Tell-Tale Sign Of Poor Election For Incumbent Party
Chart 8Deteriorating German Confidence
Deteriorating German Confidence
Deteriorating German Confidence
A combination of factors weighs on German confidence: First, global supply chain bottlenecks are hurting growth. The automotive industry, which is paralyzed by a global chip shortage, accounts for about 20% of industrial production, and its output is once again declining after a sharp but short-lived rebound last year (Chart 9). Similarly, inventories of finished goods are collapsing, which is hurting growth today (Chart 9, second panel). Second, the Delta variant of COVID-19 is causing a spike in infections. The rise in cases prevents containment measures from easing as much as expected, while it also hurts the willingness of households to go out and spend their funds (Chart 9, third panel). Third, German real wages are weak. Negotiated wages are only growing at a 1.7% annual rate, and wages and salaries are expanding at 2.1% annually. Meanwhile, German headline CPI runs at 3.9%. The declining purchasing power of German households accentuates their current malaise. Three crucial forces counterbalance these negatives: First, German house prices are growing at a 9.4% annual rate, which is creating a potent, positive wealth effect (Chart 10). Chart 9Germany's Headwinds
Germany's Headwinds
Germany's Headwinds
Chart 10A Strong Wealth Effect
A Strong Wealth Effect
A Strong Wealth Effect
Second, German household credit remains robust. According to the Bundesbank, the strength in household credit mostly reflects the strong demand for mortgages. Historically, a healthy housing sector is an excellent leading indicator of economic vigor. Third, the Chinese credit impulse is too depressed for Beijing’s political security. The recent decline in the credit impulse to -2.4% of GDP reflects a policy decision in the fall of 2020 to trim down the credit expansion. As a result, Chinese economic growth is slowing. For example, both the Caixin Manufacturing and Services PMIs stand below 50, at post-pandemic lows of 49.2 and 46.7, respectively. In July authorities became uncomfortable and cut the Reserve Requirement Ratio as well as interbank rates to free liquidity and stabilize the economy. A boom is not forthcoming, but the drag on global activity will ebb by next year. Including the headwinds and tailwinds to the economy, German activity will slow down for the remainder of the year before improving anew in 2022. Our election case outlined above – that the conservatives will lose the chancellorship and either be excluded from power or greatly diminished in the Bundestag – means that fiscal policy will not be tightened abruptly and will not create a material risk to this outlook. Chart 11Vaccines Work
Vaccines Work
Vaccines Work
Many of the headwinds will dissipate. The Delta-wave of COVID-19 will diminish. Already, Germany’s R0 is tentatively peaking, which normally precedes a drop in daily new cases. Moreover, Germany’s vaccination campaign is progressing, which limits the impact of the current wave on hospitalization and intensive care-unit usage (Chart 11). Inflation will peak in Germany, which will salvage real wages. As European Investment Strategy wrote last Monday,6 European inflation remains concentrated in sectors linked to commodity prices or directly affected by bottlenecks. Instead, trimmed-mean CPI is muted (Chart 12), which implies that underlying inflationary pressures are small, especially as wage gains are still well contained. Moreover, the one-off impact of the end of the German VAT rebate will also pass. Finally, a stabilization and eventual revival of the Chinese credit impulse will put a floor under German exports, industrial production, and capex (Chart 13). For now, the previous decline in the Chinese credit impulse is consistent with slower German output growth for the remainder of 2021. However, next year, the German industrial sector will start to feel the effect of the current efforts to improve Chinese liquidity conditions. Chart 12Narrow European Inflation
Narrow European Inflation
Narrow European Inflation
Bottom Line: The German economy is set to deteriorate for the remainder of 2021. However, as the current wave of COVID-19 infections ebbs, real wages recover, and China’s credit impulse stabilizes, Germany’s economic activity will re-accelerate in 2022, especially if the upcoming election does not generate a meaningful fiscal shock. We do not think it will. Chart 13China: From Headwinds To Tailwind?
China: From Headwinds To Tailwind?
China: From Headwinds To Tailwind?
Market Implications: German Stocks To Shine German equities are set to outperform their European counterparts and will significantly beat Bunds over the coming 18 months. During the past 5 months, the German MSCI index has underperformed the rest of the Eurozone by 6.2%. The poor performance of German equities is worse than meets the eye. If we adjust for sectoral differences by building equal sector-weight indexes, Germany has underperformed the Euro Area by 22% since early 2017 (Chart 14). Chart 14Not Delivering The Goods
Not Delivering The Goods
Not Delivering The Goods
This underperformance is long in the tooth and should reverse because of four important dynamics. First, German equities are cheap relative to the European benchmark. As Chart 15 highlights, the relative performance of German stock prices has lagged that of profits. This underperformance is also true once we account for the different sectoral composition of the German market. As a result, Germany is cheap on a forward price-to-earnings, price-to-sales, and price-to-book basis versus the Euro Area. Additionally, analysts embed significantly lower long-term and one-year expected growth rates of earnings in Germany than in the rest of the Eurozone, which depresses the German PEG ratios. Second, German operating metrics do not justify the valuation discount of German equities. The return on equity of German stocks stands at 11.39%, which is similar to that of the Euro Area. Profit margins are also comparable, at 5.91% and 5.74%, respectively. However, German firms utilize their capital more efficiently, and their asset turnover stands at 0.3 times compared to 0.2 times for the Eurozone average. Meanwhile, German non-financial firms are less indebted than their Eurozone competitors, which implies that Germany’s return on assets is greater than that of Europe at large (Chart 16). Chart 15Lagging Prices, Not Earnings
Lagging Prices, Not Earnings
Lagging Prices, Not Earnings
Chart 16Why The Discount?
Why The Discount?
Why The Discount?
Third, the drivers of earnings support a German outperformance. Over the past thirty years, commodity prices led the performance of German stocks relative to that of the rest of the Eurozone (Chart 17). While the near-term outlook for natural resource prices is muddy, BCA’s commodity strategists expect Brent prices to average more than $80/bbl in 2023 and industrial metals to outperform energy over the coming years.7 Additionally, German Services PMI are bottoming compared to that of the Eurozone. Over the past decade, this process preceded periods of outperformance by German stocks (Chart 18). Similarly, the collapse in the Chinese credit impulse relative to the robust domestic economic activity in Europe is well reflected in the underperformance of German shares. The Eurozone’s Service PMI is near all-time highs and unlikely to improve further; however, the Chinese credit impulse should recover in the coming quarters. This phenomenon will help German stocks (Chart 19). Chart 17Commodity Bulls Pull Germany
Commodity Bulls Pull Germany
Commodity Bulls Pull Germany
Chart 18German Vs European Activity Matters
German Vs European Activity Matters
German Vs European Activity Matters
Chart 19German Vs Chinese Activity Matters
German Vs Chinese Activity Matters
German Vs Chinese Activity Matters
The German MSCI index is also oversold. The 52-week rate of change of its performance compared to the rest of the Eurozone plunged to its lowest reading since the introduction of the euro in 1999 (Chart 20). Meanwhile, the 13-week rate of change remains low but has begun to improve (not shown). This combination usually heralds a forthcoming rebound in German relative performance. In relation to equities, German Bunds remain an unappealing investment. Based on historical experience, the current yield of -0.36% offered by German 10-year bonds condemns investors to negative returns over the next five years (Chart 21). Chart 20Oversold!
Oversold!
Oversold!
Chart 21Bounded Bunds' Returns
Bounded Bunds' Returns
Bounded Bunds' Returns
Even if realized inflation ebbs in Germany and Europe, inflation expectations remain low and an eventual return to full employment will force CPI swaps higher, especially if the ECB maintains easy monetary conditions and invites further risk-taking in the Eurozone. The global economic cycle will also move from a friend to a foe for Bunds. As Chart 22 illustrates, the recent deceleration in global export growth was consistent with the fresh uptick in the returns of German paper. However, if Chinese credit flows stabilize by year-end and reaccelerate in 2022 while supply-chain bottlenecks dissipate, global export growth will improve. This should hurt Bund prices, especially as the long-term terminal rate proxy embedded in the German curve remains too low. As a result, not only should Bunds underperform German equities, but the German yield curve will also steepen further relative to that of the US, where the Fed will lift the short-end of the curve faster than the ECB. Chart 22Economic Momentum And Bunds Prices
Economic Momentum And Bunds Prices
Economic Momentum And Bunds Prices
Bottom Line: The underperformance of German equities relative to those of the rest of the Eurozone is well advanced, which makes German stocks a bargain. The current deceleration in global and German growth will not extend beyond 2021, which suggests that German stocks prices should converge toward their earnings outperformance next year. Our political forecast suggests that the odds of an early or aggressive fiscal retrenchment are very low. Additionally, German equities will outperform Bunds, which offer particularly poor prospective returns. Matt Gertken Vice President Geopolitical Strategy mattg@bcaresearch.com Mathieu Savary Senior Vice President Mathieu@bcaresearch.com Guy Russell Research Analyst GuyR@bcaresearch.com Jingnan Liu Research Associate JingnanL@bcaresearch.com Footnotes 1 Note that minority governments are rare and have a bad reputation in Germany, partly as a result of the series of weak governments leading up to the 1932 election and Nazi rule. 2 In addition, while the center-left parties can work with the far-left in the Bundestag, the center-right parties cannot work with the far-right Alternative for Germany. Indeed the slightest imputation of a willingness to work with Alternative for Germany cost Merkel’s first pick for successor, Annegret Kramp-Karrenbauer, her job. 3 See: Norpoth, Helmut & Gschwend, Thomas (2010) The chancellor model: Forecasting German elections, International Journal of Forecasting. 26. 42-53. 4 Our model performs well in back-testing but 2017 was an outlier. It correctly predicted the Union to win the highest share of the popular vote but overestimated that vote by seven percentage points. Our only short-term variable, the chancellor’s approval rate, caused a deviation from long-term voting trends. Our other two variables capture medium and long-term effects, which clearly favored the Union. The implication is that Merkel’s high approval rating today could give a misleading impression about the Christian Democrats’ prospects. 5 If they are forced to rely on the Free Democrats instead, that will also constrain the most anti-business elements of their agenda. 6 Please see BCA Research European Investment Strategy Weekly Report, "The ECB Taper Dilemma", dated September 6, 2021, available at eis.bcareseach.com. 7 Please see BCA Research Commodity & Energy Strategy Weekly Report, "Permian Output Approaches Pre-Covid Peak", dated August 19, 2021, available at ces.bcareseach.com.
Highlights The US Climate Prediction Center gives ~ 70% odds another La Niña will form in the August – October interval and will continue through winter 2021-22. This will be a second-year La Niña if it forms, and will raise the odds of a repeat of last winter's cold weather in the Northern Hemisphere.1 Europe's natural-gas inventory build ahead of the coming winter remains erratic, particularly as Russian flows via Ukraine to the EU have been reduced this year. Russia's Nord Stream 2 could be online by November, but inventories will still be low. China, Japan, South Korea and India – the four top LNG consumers in Asia – took in 155 Bcf of the fuel in June. A colder-than-normal winter would boost demand. Higher prices are likely in Europe and Asia (Chart of the Week). US storage levels will be lower going into winter, as power generation demand remains stout, and the lingering effects from Hurricane Ida reduce supplies available for inventory injections. Despite spot prices trading ~ $1.30/MMBtu above last winter's highs – currently ~ $4.60/MMBtu – we are going long 1Q22 NYMEX $5.00/MMBtu natgas calls vs short NYMEX $5.50/MMBtu natgas calls expecting even higher prices. Feature Last winter's La Niña was a doozy. It brought extreme cold to Asia, North America and Europe, which pulled natural gas storage levels sharply lower and drove prices sharply higher as the Chart of the Week shows. Natgas storage in the US and Europe will be tight going into this winter (Chart 2). Europe's La Niña lingered a while into Spring, keeping temps low and space-heating demand high, which delayed the start of re-building inventory for the coming winter. In the US, cold temps in the Midwest hampered production, boosted demand and caused inventory to draw hard. Chart of the WeekA Return Of La Niña Could Boost Global Natgas Prices
A Return Of La Niña Could Boost Global Natgas Prices
A Return Of La Niña Could Boost Global Natgas Prices
Chart 2Europe, US Gas Stocks Will Be Tight This Winter
NatGas: Winter Is Coming
NatGas: Winter Is Coming
Summer in the US also produced strong natgas demand, particularly out West, as power generators eschewed coal in favor of gas to meet stronger air-conditioning demand. This is partly due to the closing of coal-fired units, leaving more of the load to be picked up by gas-fired generation (Chart 3). The EIA estimates natgas consumption in July was up ~ 4 Bcf/d to just under 76 Bcf/d. Hurricane Ida took ~ 1 bcf/d of demand out of the market, which was less than the ~ 2 Bcf/d hit to US Gulf supply resulting from the storm. As a result, prices were pushed higher at the margin. Chart 3Generators Prefer Gas To Coal
NatGas: Winter Is Coming
NatGas: Winter Is Coming
US natgas exports (pipeline and LNG) also were strong, at 18.2 Bcf/d in July (Chart 4). We expect US LNG exports, in particular, to resume growth as the world recovers from the COVID-19 pandemic (Chart 5). This strong demand and exports, coupled with slightly lower supply from the Lower 48 states – estimated at ~ 98 Bcf/d by the EIA for July (Chart 6) – pushed prices up by 18% from June to July, "the largest month-on-month percentage change for June to July since 2012, when the price increased 20.3%" according to the EIA. Chart 4US Natgas Exports Remain Strong
US Natgas Exports Remain Strong
US Natgas Exports Remain Strong
Chart 5US LNG Exports Will Resume Growth
NatGas: Winter Is Coming
NatGas: Winter Is Coming
Chart 6US Lower 48 Natgas Production Recovering
US Lower 48 Natgas Production Recovering
US Lower 48 Natgas Production Recovering
Elsewhere in the Americas, Brazil has been a strong bid for US LNG – accounting for 32.3 Bcf of demand in June – as hydroelectric generation flags due to the prolonged drought in the country. In Asia, demand for LNG remains strong, with the four top consumers – China, Japan, South Korea, and India – taking in 155 Bcf in June, according to the EIA. Gas Infrastructure Ex-US Remains Challenged A combination of extreme cold weather in Northeast Asia, and a lack of gas storage infrastructure in Asia generally, along with shipping constraints and supply issues at LNG export facilities, led to the Asian natural gas price spike in mid-January.2 Very cold weather in Northeast Asia, drove up LNG demand during the winter months. In China, LNG imports for the month of January rose by ~ 53% y-o-y (Chart 7).3 The increase in imports from Asia coincided with issues at major export plants in Australia, Norway and Qatar during that period. Chart 7China's US LNG Exports Surged Last Winter, And Remain Stout Over The Summer
NatGas: Winter Is Coming
NatGas: Winter Is Coming
Substantially higher JKM (Japan-Korea Marker) prices incentivized US exporters to divert LNG cargoes from Europe to Asia last winter. The longer roundtrip times to deliver LNG from the US to Asia – instead of Europe – resulted in a reduction of shipping capacity, which ended up compounding market tightness in Europe. Europe dealt with the switch by drawing ~ 18 bcm more from their storage vs. the previous year, across the November to January period. Countries in Asia - most notably Japan – however, do not have robust natural gas storage facilities, further contributing to price volatility, especially in extreme weather events. These storage constraints remain in place going into the coming winter. In addition, there is a high probability the global weather pattern responsible for the cold spells around the globe that triggered price spikes in key markets globally – i.e., a second La Niña event – will return. A Second-Year La Niña Event The price spikes and logistical challenges of last winter were the result of atmospheric circulation anomalies that were bolstered by a La Niña event that began in mid-2020.4 The La Niña is characterized by colder sea-surface temperatures that develops over the Pacific equator, which displaces atmospheric and wind circulation and leads to colder temperatures in the Northern Hemisphere (Map 1). Map 1La Niña Raises The Odds Of Colder Temps
NatGas: Winter Is Coming
NatGas: Winter Is Coming
The IEA notes last winter started off without any exceptional deviations from an average early winter, but as the new year opened "natural gas markets experienced severe supply-demand tensions in the opening weeks of 2021, with extremely cold temperature episodes sending spot prices to record levels."5 In its most recent ENSO update, the US Climate Prediction Center raised the odds of another La Niña event for this winter to 70% this month. If similar conditions to those of the 2020-21 winter emerge, US and European inventories could be stretched even thinner than last year, as space-heating demand competes with industrial and commercial demand resulting from the economic recovery. Global Natgas Supplies Will Stay Tight JKM prices and TTF (Dutch Title Transfer Facility) prices are likely to remain elevated going into winter, as seen in the Chart of the Week. Fundamentals have kept markets tight so far. Uncertain Russian supply to Europe will raise the price of the European gas index (TTF). This, along with strong Asian demand, particularly from China, will keep JKM prices high (Chart 8). The global economic recovery is the main short-term driver of higher natgas demand, with China leading the way. For the longer-term, natural gas is considered as the ideal transition fuel to green energy, as it emits less carbon than other fossil fuels. For this reason, demand is expected to grow by 3.4% per annum until 2035, and reach peak consumption later than other fossil fuels, according to McKinsey.6 Chart 8BCAs Brent Forecast Points To Higher JKM Prices
BCAs Brent Forecast Points To Higher JKM Prices
BCAs Brent Forecast Points To Higher JKM Prices
Spillovers from the European natural gas market impact Asian markets, as was demonstrated last winter. Russian supply to Europe – where inventories are at their lowest level in a decade – has dropped over the last few months. This could either be the result of Russia's attempts to support its case for finishing Nord Stream 2 and getting it running as soon as possible, or because it is physically unable to supply natural gas.7 A fire at a condensate plant in Siberia at the beginning of August supports the latter conjecture. The reduced supply from Russia, comes at a time when EU carbon permit prices have been consistently breaking records, making the cost of natural gas competitive compared to more heavy carbon emitting fossil fuels – e.g., coal and oil – despite record breaking prices. With Europe beginning the winter season with significantly lower stock levels vs. previous years, TTF prices will remain volatile. This, and strong demand from China, will support JKM prices. Investment Implications Natural gas prices are elevated, with spot NYMEX futures trading ~ $1.30/MMBtu above last winter's highs – currently ~ $4.60/MMBtu. Our analysis indicates prices are justifiably high, and could – with the slightest unexpected news – move sharply higher. Because natgas is, at the end of the day, a weather market, we favor low-cost/low-risk exposures. In the current market, we recommend going long 1Q22 NYMEX $5.00/MMBtu natgas calls vs short NYMEX $5.50/MMBtu natgas calls expecting even higher prices. This is the trade we recommended on 8 April 2021, at a lower level, which was stopped out on 12 August 2021 with a gain of 188%. Robert P. Ryan Chief Commodity & Energy Strategist rryan@bcaresearch.com Ashwin Shyam Research Associate Commodity & Energy Strategy ashwin.shyam@bcaresearch.com Commodities Round-Up Energy: Bullish Earlier this week, Saudi Aramco lowered its official selling price (OSP) by more than was expected – lowering its premium to the regional benchmark to $1.30/bbl from $1.70/bbl – in what media reports based on interviews with oil traders suggest is an attempt to win back customers electing not to take volumes under long-term contracts. This is a marginal adjustment by Aramco, but still significant, as it shows the company will continue to defend its market share. Pricing to Northwest Europe and the US markets is unchanged. Aramco's majority shareholder, the Kingdom of Saudi Arabia (KSA), is the putative leader of OPEC 2.0 (aka, OPEC+) along with Russia. The producer coalition is in the process of returning 400k b/d to the market every month until it has restored the 5.8mm b/d of production it took off the market to support prices during the COVID-19 pandemic. We expect Brent crude oil prices to average $70/bbl in 2H21, $73/bbl in 2022 and $80/bbl in 2023. Base Metals: Bullish Political uncertainty in Guinea caused aluminum prices to rise to more than a 10-year high this week (Chart 9). A coup in the world’s second largest exporter of bauxite – the main ore source for aluminum – began on Sunday, rattling aluminum markets. While iron ore prices rebounded primarily on the record value of Chinese imports in August, the coup in Guinea – which has the highest level of iron ore reserves – could have also raised questions about supply certainty. This will contribute to iron-ore price volatility. However, we do not believe the coup will impact the supply of commodities as much as markets are factoring, as coup leaders in commodity-exporting countries typically want to keep their source of income intact and functioning. Precious Metals: Bullish Gold settled at a one-month high last Friday, when the US Bureau of Labor Statistics released the August jobs report. The rise in payrolls data was well below analysts’ estimates, and was the lowest gain in seven months. The yellow metal rose on this news as the weak employment data eased fears about Fed tapering, and refocused markets on COVID-19 and the delta variant. Since then, however, the yellow metal has not been able to consolidate gains. After falling to a more than one-month low on Friday, the US dollar rose on Tuesday, weighing on gold prices (Chart 10). Chart 9
Aluminum Prices Recovering
Aluminum Prices Recovering
Chart 10
Weaker USD Supports Gold
Weaker USD Supports Gold
Footnotes 1 Please see the US Climate Prediction Center's ENSO: Recent Evolution, Current Status and Predictions report published on September 6, 2021. 2 Please see Asia LNG Price Spike: Perfect Storm or Structural Failure? Published by Oxford Institute for Energy Studies. 3 Since China LNG import data were reported as a combined January and February value in 2020, we halved the combined value to get the January 2020 amount. 4 Please see The 2020/21 Extremely Cold Winter in China Influenced by the Synergistic Effect of La Niña and Warm Arctic by Zheng, F., and Coauthors (2021), published in Advances in Atmospheric Sciences. 5 Please see the IEA's Gas Market Report, Q2-2021 published in April 2021. 6 Please see Global gas outlook to 2050 | McKinsey on February 26, 2021. 7 Please see ICIS Analyst View: Gazprom’s inability to supply or unwillingness to deliver? published on August 13, 2021. Investment Views and Themes Recommendations Strategic Recommendations Tactical Trades Commodity Prices and Plays Reference Table Trades Closed in 2021 Summary of Closed Trades