Euro Area

Highlights UK Interest Rates: A series of rolling shocks dating back to the 2008 financial crisis has prevented the Bank of England (BoE) from normalizing crisis-era levels of interest rates, even during years when inflation was overshooting the BoE 2% target. Brexit and COVID-19 were the last of those two shocks, but the growth- and inflation-dampening effects of both are fading fast. Implications for Gilts & GBP: The BoE’s dovish rhetoric, including hints that negative policy rates are still a viable option, looks increasingly inappropriate. The surge in real UK bond yields seen over the past month is just the beginning of a medium-term process of interest rate normalization. Maintain below-benchmark duration on Gilts, while downgrading UK allocations within dedicated global fixed income portfolios to neutral. The pound has upside in this environment, especially if depressed UK productivity starts to recover. Feature Chart 1UK Real Yields: Deeply Negative
Why Are UK Interest Rates Still So Low?
Why Are UK Interest Rates Still So Low?
The UK has become one of the more peculiar corners of the global fixed income universe. The outright level of longer-term Gilt yields is in the middle of the pack among the major advanced economies. The story is much different, however, when breaking those nominal UK yields into the real and inflation expectations components. The deeply negative real yields on UK inflation-linked Gilts are the lowest among the majors, even in a world where sub-0% real yields are prevalent in most countries (Chart 1). The flipside of that deeply negative real yield is a high level of inflation expectations. The breakeven inflation rate derived from the difference between the nominal and real 10-year Gilt yields is 3.3%, the highest in the developed “linkers” universe. Inflation expectations in UK consumer surveys are at similar levels, well above the 2% inflation target of the Bank of England (BoE), suggesting little confidence in the central bank’s ability or willingness to hit its own inflation goals. In this Special Report, jointly published by BCA Research Global Fixed Income Strategy and Foreign Exchange Strategy, we investigate why UK real interest rates have remained so persistently negative and assess the possibility of a shift in the low interest rate regime in a post-Brexit, post-pandemic UK – a move that could be quite bearish for UK fixed income markets and bullish for the British pound. Can The BoE Ignore Cyclical Upward Pressure On UK Bond Yields? The UK has suffered from a series of shocks, starting with the 2008 crisis, that have limited the ability of the BoE to attempt to tighten monetary policy. The 2011/12 European debt crisis hurt the UK’s most important trading partners, while the 2016 Brexit vote began a multi-year process of uncertainty over the future of those trading relationships. The COVID-19 pandemic is the latest shock, triggering a recession of historic proportions. The UK economy contracted by -10% in 2020, the largest decline since “The Great Frost” downturn of 1709. UK bond yields collapsed in response as the BoE cut rates to near-0% and reinforced that easy stance with aggressive quantitative easing and promises to keep rates unchanged over at the next few years. Today, UK financial markets are waking up to a world beyond the current COVID-19 lockdowns. The UK is running one of the world’s most successful vaccination rollouts, with 23 million jabs, or 35 per 100 people, already having been administered. UK Prime Minister Boris Johnson recently unveiled a bold plan to fully reopen the UK economy from the current severe lockdowns by mid-year. The UK government’s latest budget called for additional spending measures over the next year, including maintaining the work furlough scheme that has supported household incomes during the pandemic. As a result, UK growth expectations have exploded higher. According to the Bloomberg consensus economics survey, UK nominal GDP growth is expected to surge to 8.4% over calendar year 2021, an annual pace not seen since 1990 (Chart 2). Nominal Gilt yields have begun to reprice higher to reflect those surging growth expectations, with the 5-year/5-year forward Gilt yield climbing 67bps so far in 2021. Real Gilt yields are also moving higher with the 10-year inflation-linked Gilt climbing 38bps year to date, providing additional interest rate support that has fueled a surge in the pound versus the dollar (bottom panel). Our own BoE Monitor - containing growth, inflation and financial variables that typically lead to pressure on the central bank to adjust monetary policy – is signaling a reduced need for additional policy easing (Chart 3). The momentum of changes in longer-maturity UK Gilts and the trade-weighted UK currency index are usually correlated to the ebbs and flows of the BoE Monitor. The latest surge higher in yields and the currency suggests that the markets are anticipating the type of recovery that will put pressure on the BoE to tighten. Chart 2A Growth-Driven Repricing Of Gilts & GBP
A Growth-Driven Repricing Of Gilts & GBP
A Growth-Driven Repricing Of Gilts & GBP
Chart 3Gilts & GBP Sniffing Out A Less Dovish BoE?
Gilts & GBP Sniffing Out A Less Dovish BoE?
Gilts & GBP Sniffing Out A Less Dovish BoE?
It may take a while to see the BoE turn more hawkish, however. The BoE has become one of least active central banks in the world over the past decade. After the BoE cut its official policy interest rate, the Bank Rate, by 500bps during the 2008 financial crisis and 2009 recession, rates were kept in a range between 0.25% and 0.75% for ten consecutive years. The BoE cut rates aggressively in response to the COVID-19 pandemic, lowering the Bank Rate in March 2020 from 0.75% to 0.1%, where it still stands. The BoE has used quantitative easing (QE) and forward guidance to try and limit movements in bond yields whenever cyclical surges in inflation could have justified tighter monetary policy. That has led to an extended period of a negative BoE Bank Rate, something not seen since the inflationary 1970s (Chart 4). Back then, the BoE was lagging the surge in UK inflation, but still hiking nominal interest rates. Today, the central bank is keeping nominal rates near 0% with much lower levels of inflation. Chart 4Over A Decade Of Negative Real UK Interest Rates
Over A Decade Of Negative Real UK Interest Rates
Over A Decade Of Negative Real UK Interest Rates
Short-term interest rate markets are still pricing in a very slow response from the BoE to the current growth optimism. Only 36bps of rate hikes over the next two years are discounted in the UK overnight index swap (OIS) curve. This go-slow response is in line with the BoE’s guidance on future rate hikes which, similar to the language used by other central banks like the Fed, calls for no pre-emptive rate hikes before inflation has sustainably returned to the BoE target. That combination would be consistent with current forward market pricing on both short-term interest rates and inflation. Chart 5BoE Keeping Real Rates Well Below R*
BoE Keeping Real Rates Well Below R*
BoE Keeping Real Rates Well Below R*
In Chart 5, we show the real BoE Bank Rate, constructed by subtracting UK core CPI inflation from the Bank Rate. We also show a forward real rate calculated using the forward UK OIS and CPI swap curves. The market-implied path of the real Bank Rate shows very little change over the next decade, with the real Bank Rate expected to average around -2.5%. This is far below the estimates of a neutral UK real rate (or “r-star”) of just under 2%, as calculated by the New York Fed or recent academic studies. The neutral UK real rate has likely dipped because of the pandemic. The UK Office For Budget Responsibility (OBR) estimates that there has been a long-term “scarring” of the UK economy from COVID-19 through supply-side factors like weaker investment spending, lower productivity growth and diminished labor force participation – equal to three percentage points of the level of potential GDP.1 The BoE estimates a smaller “scarring” of 1.75 percentage points of potential output, but coming with a 6.5% reduction in the size of the UK capital stock. While these are significant reductions in the supply-side of the UK economy, they are not enough to account for the 4.5 percentage point difference between pre-pandemic estimates of the UK r-star and the market-implied path of the real BoE Bank Rate over the next decade. The implication is that the markets are not expecting the BoE to deviate from its strategy of doing very little with interest rates, even as growth recovers from the pandemic shock. That can be seen in the recent upturn in UK inflation expectations that is evident in both market-implied and survey-based measures. Chart 6UK Inflation Expectations Reflect BoE Policy, Not Actual Inflation
UK Inflation Expectations Reflect BoE Policy, Not Actual Inflation
UK Inflation Expectations Reflect BoE Policy, Not Actual Inflation
The 5-year/5-year forward UK CPI swap rate now sits at 3.6%, not far off the 3.3% level of 5-10 year consumer inflation expectations from the latest YouGov/Citigroup survey (Chart 6). The fact that inflation expectations can remain so elevated at a time when headline CPI inflation is struggling to avoid deflation is striking. This indicates a belief that the BoE will do very little in the future to stop a booming UK economy that is expected to put sustained downward pressure on the UK unemployment rate over the next few years (bottom panel). This is from a relatively low starting point of the unemployment rate given the massive government support programs that have limited the amount of pandemic-related layoffs over the past year. The BoE should have reasons to be more concerned about a resurgence of UK inflation. In its latest Monetary Policy Report, the BoE published estimates showing that the entire collapse in UK inflation in 2020 was attributable to weaker demand for goods and services – especially the latter (Chart 7). This suggests that UK inflation could rebound by a similar amount as the UK economy reopens from pandemic lockdowns. According to the UK OBR, 21% of UK household spending is on items described as “social consumption”, like restaurants and hotels (Chart 8). This is a much larger proportion than seen in other major developed economies (excluding Spain) and explains why consumer spending plunged so much more dramatically in the UK during 2020 than in other countries. Chart 7Only A Temporary Drag On UK Inflation From COVID-19
Why Are UK Interest Rates Still So Low?
Why Are UK Interest Rates Still So Low?
Chart 8UK Households More Focused On “Social Consumption”
Why Are UK Interest Rates Still So Low?
Why Are UK Interest Rates Still So Low?
If the UK pandemic-related restrictions are eased as planned over the next few months, the potential for a sharp snapback in UK consumer spending is significant. The BoE estimates that UK households now have £125bn of “excess” savings thanks to government income support and reduced spending on discretionary items like dining out and vacations. This is the fuel to support a rapid recovery in consumption over the next 6-12 months, especially as personal income growth will get a boost as furloughed workers begin returning to work (Chart 9). Chart 9UK Economy On The Mend
UK Economy On The Mend
UK Economy On The Mend
Chart 10Big Boost To UK Growth From Housing & Government Spending
Big Boost To UK Growth From Housing & Government Spending
Big Boost To UK Growth From Housing & Government Spending
A similar argument can be made for investment spending – the BoE estimates that UK businesses have amassed £100bn pounds of excess cash, and the latest reading on the BoE’s Agents' Survey of UK firms shows a slight increase after months of decline (bottom panel). With a Brexit deal with the EU finally reached at the start of 2021, UK businesses can also look to increase investment spending that had been delayed because of the years of Brexit uncertainty. The UK economy is already getting a boost from a recovery in the housing market fueled by low interest rates, high household savings and improving consumer confidence. Mortgage approvals have soared to the highest level since 2007, while house prices are now expanding at a 6.4% annual rate (Chart 10). Add it all up, and the economic momentum in the UK is positive and likely to accelerate further in the coming months as a greater share of the population becomes vaccinated. The BoE’s dovish policy stance is likely to appear increasingly inappropriate relative to accelerating UK growth and inflation trends over the next several months. Thus, on a cyclical basis, UK bond yields, both nominal and real, have more upside potential even after the recent increase. Bottom Line: A series of rolling shocks dating back to the 2008 financial crisis has prevented the Bank of England (BoE) from normalizing crisis-era levels of interest rates, even during years when inflation was overshooting the BoE 2% target. Brexit and COVID-19 were the last of those two shocks, but the growth- and inflation-dampening effects of both are fading fast. Structural Forces Keeping UK Interest Rates Low Are Fading Looking beyond the cyclical drivers, the structural factors that have held down UK interest rates in recent years are also starting to fade. The supply side of the UK economy has suffered because of Brexit uncertainty. The OECD’s estimate of potential UK GDP growth fell from 1.75% in 2015 to 1.0% in 2020 (Chart 11). This was mostly due to declining productivity growth – a consequence of years of very weak business investment. The 5-year annualized growth rate of real UK investment spending fell to -3% in 2020, a contraction only matched during the past 30 years after the 1992 ERM crisis and 2008 financial crisis. That plunge in investment coincided with almost no growth in UK labor productivity over that same 5-year window. Chart 11The Road To Faster Potential UK Growth Starts With Investment
The Road To Faster Potential UK Growth Starts With Investment
The Road To Faster Potential UK Growth Starts With Investment
Slowing population growth also weighed on UK potential growth, slowing to the lowest level in 15 years in 2019 as immigration from EU countries to the UK fell sharply. COVID-19 also hurt immigration flows into the UK last year. The UK Office for National Statistics estimated that the non-UK born population in the UK fell by 2.7% between June 2019 and June 2020. Diminished potential GDP growth is a factor that would structurally reduce the equilibrium real UK interest rate. We are likely past the worst for that downward pressure on potential growth and real rates. Population growth should also stabilize as the UK borders open up again and pandemic travel restrictions are loosened. Measured productivity is already starting to see a cyclical recovery, while investment spending is likely to improve as cash-rich UK companies began to ramp up capital spending plans deferred by Brexit and COVID-19. While the process leading from faster investment spending into speedier productivity growth is typically slow, the key point is that the worst of downtrend is likely over. This is an important development that has implications for UK fixed income markets. When looking at an international comparison of real central bank policy rates within the developed economies, the UK has fallen into the grouping of countries with persistently negative policy rates, namely Japan, the euro area, Switzerland, Sweden and Norway (Chart 12). We have dubbed that group the “Secular Stagnation 5”, after the term made famous by former US Treasury Secretary Lawrence Summers describing a state where the “natural” real rate of interest (r-star) that equates savings with investment is structurally negative. Chart 12Does The UK Belong In The 'Secular Stagnation 5'?
Does The UK Belong In The 'Secular Stagnation 5'?
Does The UK Belong In The 'Secular Stagnation 5'?
Does the UK belong in the “Secular Stagnation 5”? As a way to assess this, we made some comparisons of selected UK data with the same data for those five countries. When looking at potential GDP growth and population growth, the UK sits right in the middle of the range of those growth rates for the five countries (Chart 13). UK productivity growth has underperformed the others recently but, prior to the 2016 Brexit shock, UK productivity was also in the middle of the Secular Stagnation 5 range. Chart 13Brexit Became A Major Hit To UK Potential Growth
Brexit Became A Major Hit To UK Potential Growth
Brexit Became A Major Hit To UK Potential Growth
Chart 14UK Economy Less Focused On Investment & Exports
UK Economy Less Focused On Investment & Exports
UK Economy Less Focused On Investment & Exports
On other measures, the UK is nothing like those other countries. The UK’s economy is far less geared towards exports and investment (Chart 14) and is more tilted towards consumer spending. That can be seen most clearly when looking at the data on savings/investment balances. The UK continuously runs a current account deficit, as opposed to the persistent surpluses seen in the Secular Stagnation 5 (Chart 15). Put another way, the UK is not a “surplus” country that saves more than it invests on a structural basis, a condition that typically depresses real interest rates. Chart 15The UK Is Not A Surplus Country
The UK Is Not A Surplus Country
The UK Is Not A Surplus Country
Chart 16Gilts Will Not Become A Low-Beta Market
Gilts Will Not Become A Low-Beta Market
Gilts Will Not Become A Low-Beta Market
Based on these cross-country comparisons, it is unusual for the UK to have such persistently low real interest rates. This has implications for UK bond yields. Over the past few years, Gilts have been transitioning from a status as a “high yield beta” market – whose yield movements are more correlated to swings in the overall level of global bond yields. The lower beta markets are in countries like Germany, France and Japan – all members of the Secular Stagnation club (Chart 16). The UK does not appear to warrant a permanent membership in that low-yielding group, based on structural factors. That is evident when looking at how Gilt yields are rising even with the BoE absorbing an increasing share of the stock of outstanding Gilts (bottom panel). We conclude that the transition of the UK to a low-beta market is related to the Brexit uncertainty post 2016 and the pandemic shock that has hit the consumer-focused UK economy exceptionally hard – both factors that are set to fade over the next year. Bottom Line: The BoE’s dovish rhetoric, including hints that negative policy rates are still a viable option, looks increasingly inappropriate. The surge in real UK bond yields seen over the past month is just the beginning of a medium-term process of interest rate normalization. Investment Conclusions Chart 17Downgrade Gilts To Underweight
Downgrade Gilts To Underweight
Downgrade Gilts To Underweight
Our assessment of the cyclical and structural drivers of UK interest rates leads us to the following conclusions on UK fixed income and currency strategy: Duration: Maintain a below-benchmark exposure to UK interest rate movements. Gilt yields will rise by more than is discounted in the forwards over the next 6-12 months (Chart 17), coming more through rising real yields as the UK economy continues its post-Brexit, post-pandemic recovery. Country Allocation: Downgrade strategic allocations to UK Gilts to neutral from overweight in dedicated fixed income portfolios. Our long-standing view that Brexit uncertainty would lead to the outperformance of Gilts versus other developed bond markets is no longer valid. It is still too soon to move to a full underweight stance on Gilts – a better opportunity will develop by mid-year once it is more evident that the current success on UK vaccinations leads to a faster reopening of the UK economy. Yield Curve: Maintain positioning for a bearish steepening of the UK Gilt yield curve. While there is limited scope for more steepening through an even larger increase in inflation breakevens from current elevated levels, the long end of the Gilt curve can move higher by more than the front end as the market re-rates Gilts to a higher-beta status with a higher future trajectory for UK interest rates. Corporate Credit: Downgrade UK investment grade corporate bond exposure to neutral from overweight in dedicated fixed income portfolios. UK corporate spreads have returned to the 2017 lows and, while an improving growth dynamic is not overly bearish for credit, there is no longer a compelling valuation-based case for staying overweight UK investment grade corporates. This move brings our recommended UK allocation in line with our neutral stance on US and euro area investment grade corporates. Chart 18GBP/USD Appears Cheap On A PPP Basis
GBP/USD Appears Cheap On A PPP Basis
GBP/USD Appears Cheap On A PPP Basis
Chart 19Low Productivity Is Weighing On The Pound
Low Productivity Is Weighing On The Pound
Low Productivity Is Weighing On The Pound
Currency: A growth-driven path towards interest rate normalization should be positive for the British pound, which remains undervalued versus the US dollar on a purchasing power parity basis (Chart 18).2 A move to 1.45 on GBP/USD is possible within the next six months. A broader move towards pound strength will require an improvement in business investment, as the trade-weighted pound looks fairly valued on our productivity-based model (Chart 19). We do maintain our view that EUR/GBP can approach 0.80 by year-end based on a relatively stronger cyclical improvement in UK growth versus the euro area. Robert Robis, CFA Chief Fixed Income Strategist rrobis@bcaresearch.com Footnotes 1 For further details on the OBR estimates of UK growth, inflation and fiscal policy, please see the March 2021 OBR Economic & Financial Outlook, which can be found here: https://obr.uk/ 2 Please see BCA Research Foreign Exchange Strategy Report, "Thoughts On The British Pound", dated December 18, 2020, available at fes.bcaresearch.com.
Highlights Rising Global Yields: The increased turbulence in global bond markets is part of the adjustment process to a more positive outlook for global economic growth. Rising real yields are now the main driver of nominal yield movements, with stable inflation expectations indicating that investors are not overly concerned about a sustained inflation overshoot. Duration: Central bankers will eventually be forced to shift to less dovish interest rate guidance to reflect the new reality of faster growth and increased inflation pressures, but this is likely to not occur until much later in 2021, starting with the Fed. Maintain a below-benchmark cyclical duration stance in global bond portfolios. UST Yields & Spreads: The selloff in US Treasuries has pushed US yields to levels that are starting to look a bit stretched relative to yields from other major developed economies like Germany and Japan. This is especially true on a volatility-adjusted basis. As a result, we are closing our tactical US-Germany spread widening trade in bond futures at a profit of 1.8%. Feature Chart of the WeekBond Yields Are Rising Because Of Growth
Bond Yields Are Rising Because Of Growth
Bond Yields Are Rising Because Of Growth
The rapid surge in global bond yields seen so far in 2021 has led some commentators to declare that the dreaded “bond vigilantes” have returned to dole out punishment for overly stimulative fiscal and monetary policies (most notably in the US). The rapid pace of the bond selloff, with the 10-year US Treasury yield reaching 1.6% on an intraday basis last week, has raised fears that spiking yields could damage a fragile global economic recovery. This logic is backwards – it is surging growth expectations that are driving bond yields sustainably higher from deeply depressed levels. Global growth is projected to accelerate at a very rapid pace over the rest of this year and 2022. The combination of the Bloomberg consensus real GDP growth and inflation forecasts for the major developed economies suggest that nominal year-over-year GDP growth is expected to climb to 7.2% in the US, 8.4% in the UK and 6.4% in the euro area by year-end (Chart of the Week). Nominal growth in 2022 is expected to grow by another 5-7% across the same regions, suggesting a return to a slightly faster pace than prevailed during the pre-pandemic years of 2017-19 - even after a boom in 2021. Nominal longer-term global government bond yields, which had been priced for a pandemic-stricken economic backdrop, are now playing catch-up to the new reality of a post-pandemic, vaccinated world. Bond investors understand that the need for extreme monetary accommodation is ebbing, especially in the US where there will be an enormous fiscal impulse to growth in 2021 (and beyond). As a result, interest rate expectations are moving higher, fueling a repricing towards higher bond yields around the world. This process has more room to run. A Global Move Higher In Yields, For The Right Reasons Chart 2Reflationary Bear-Steepening Of Global Yield Curves
Reflationary Bear-Steepening Of Global Yield Curves
Reflationary Bear-Steepening Of Global Yield Curves
The cyclical rise in developed market bond yields that began last summer was initially focused on longer-maturity yields boosted by rising inflation expectations (Chart 2). The very front-ends of bond yield curves – which are more sensitive to expectations of changes in central bank policy rates – have remained subdued. The upward pressure on global bond yields is starting to infect some shorter maturities, however. 5-year government bonds yields in the UK, Canada and Australia rose 44bps, 42bps and 35bps, respectively, during the month of February. The latter two represented a near doubling of the level of the 5-year yield. In the case of the UK, the surge in 5-year Gilt yields came from a starting point of negative yields at the end of January. Last week, the 5-year US Treasury yield jumped a massive 22bps on a single day due to a poorly received US Treasury auction. Year-to-date, longer-term global bond yields have been rising more through the real yield component than higher inflation expectations (Charts 3A & 3B). This is a change in the dynamics from the latter half of 2020 when inflation expectations were the dominant force pushing global yields higher. Chart 3AReal Yields Are Driving The Recent Bond Selloff …
Real Yields Are Driving The Recent Bond Selloff...
Real Yields Are Driving The Recent Bond Selloff...
Chart 3B… Even In The Lower-Yielding Markets
...Even In The Lower-Yielding Markets
...Even In The Lower-Yielding Markets
This shift in “leadership” of the global bond market selloff has been broad-based. 10-year real yields from inflation-linked bonds have surged higher in the US (+35bps year-to-date), UK (+40bps), Australia (+44bps) and Canada (+25bps). Real 10-year yields have even inched up in France (+9bps), despite euro area growth suffering because of COVID-19 lockdowns. This coordinated rise in real bond yields comes on the heels of a sharp improvement in overall global economic momentum and improving expectations for future growth. Manufacturing PMIs, a reliable leading indicator of real yields in the developed markets, began a cyclical improvement in the middle of last year and, right on cue, global bond yields bottomed out toward the end of 2020 (Chart 4). The link between that strong growth momentum and real bond yields comes from expected changes in central bank policies. Our Central Bank Monitors for the US, euro area, UK, Japan, Canada and Australia – designed to measure cyclical pressures on monetary policy - have all moved significantly higher since mid-2020 (Chart 5). This suggests a diminished need for additional monetary stimulus because of rebounding economic growth and intensifying inflation pressures. The Monitors have climbed to above pre-pandemic levels in the US and Australia. Chart 4Real Yields Starting To Catch Up To Solid Growth
Real Yields Starting To Catch Up To Solid Growth
Real Yields Starting To Catch Up To Solid Growth
Chart 5Markets Starting To Discount Rate Hikes In 2023
Markets Starting To Discount Rate Hikes In 2023
Markets Starting To Discount Rate Hikes In 2023
Interest rate markets are responding to this cyclical pressure to tighten monetary policies by repricing the expected timing and pace of the next rate hiking cycle. Our 24-month discounters, which derive the amount of interest rate changes priced into overnight index swap (OIS) curves up to two years in the future, are now pricing in higher policy rates in the US (+40bps), the UK (+32bps), Australia (+36bps) and Canada (a whopping +82bps) by the first quarter of 2023. This repricing of interest rate expectations does conflict with current central bank forward guidance, to varying degrees. For example, the Fed continues to signal that there will not be any rate hikes until at least the end of 2023. Policymakers will not be overly concerned about higher government bond yields and shifting interest rate expectations, however, if there is limited spillover into broader financial market performance. In the US, the latest increase in real Treasury yields to date has had minimal impact on US equity market valuations or corporate bond yields (Chart 6A), suggesting no tightening of financial conditions that could impact future US economic growth. A similar situation is playing out in Europe, where higher longer-term real yields have had little impact on equity market valuations or the borrowing rates that the ECB is most concerned about, like Italian BTP yields (Chart 6B). Chart 6ANo Tightening Of Financial Conditions In The US...
No Tightening Of Financial Conditions In The US...
No Tightening Of Financial Conditions In The US...
Chart 6B...Or Europe
...Or Europe
...Or Europe
Currency valuations are a more important indicator of financial conditions for other central banks. For example, the Reserve Bank of Australia (RBA) has been explicit that its current policies – near-zero policy rates, yield curve control to anchor the level of 3-year bond yields and quantitative easing (QE) to moderate the level of longer-term yields – are intended to not only keep borrowing costs low but also dampen the value of the Australian dollar. At the moment, the US dollar is being pulled in different directions by the typical fundamental drivers. Real rate differentials between the US and other major developed economies remain unattractive for the greenback, even with the latest rise in US real yields (Chart 7). At the same time, growth differentials between the US and the other major economies are turning more USD-positive. For now, rate differentials are the more dominant factor for the US dollar and will remain so until the Fed begins to shift to a less dovish policy stance – an outcome that we do not expect until much later this year when the Fed will begin to prepare the market for a tapering of asset purchases in 2022. A sustainable bottoming of the US dollar, fueled by a shift to a less accommodative Fed, will also likely mark the end of the rising trend for global inflation expectations, given the links between the dollar, commodity prices and inflation breakevens (bottom panel). Central banks outside the US will continue to resist any unwelcome appreciation of their own currencies versus the US dollar. That means doing more QE when bond yields rise too quickly, as the RBA did this week and the ECB has threatened to do in recent comments from senior policymakers (Chart 8). Increasing the size of asset purchases is unlikely to sustainably drive non-US bond yields lower, however, in an environment of improving global growth that is causing investors to reassess the future path of interest rates. All more QE can hope to do at this point in the global business cycle is limit how fast bond yields can increase. Chart 7The USD Remains The Critical Reflationary Variable
The USD Remains The Critical Reflationary Variable
The USD Remains The Critical Reflationary Variable
Chart 8More QE Is Less Effective At Capping Bond Yields
More QE Is Less Effective At Capping Bond Yields
More QE Is Less Effective At Capping Bond Yields
Chart 9Markets With A Lower Yield Beta To USTs Are Outperforming
Markets With A Lower Yield Beta To USTs Are Outperforming
Markets With A Lower Yield Beta To USTs Are Outperforming
From an investment strategy perspective, the current growth-fueled move higher in global real bond yields does not change any of our suggested tilts. We continue to recommend a below-benchmark overall duration stance within global bond portfolios. Within our recommended country allocation among developed market government bonds, we continue to prefer a large underweight to US Treasuries and overweights to markets that are less susceptible to changes in US Treasury yields like Germany, France, Japan and the UK (Chart 9). We also continue to recommend only neutral allocations to Canadian and Australian government bonds (with below-benchmark duration exposure within those allocations), although we are on “downgrade alert” for both given their status as higher-beta bond markets with central banks more likely follow the Fed down a less dovish path later this year. Bottom Line: Rising real yields are now the main driver of nominal yield movements, with stable inflation expectations indicating that investors are not overly concerned about a sustained inflation overshoot. Central bankers will eventually be forced to shift to less dovish interest rate guidance to reflect the new reality of faster growth and increased inflation pressures, but this is likely to not occur until much later in 2021, starting with the Fed. Maintain a below-benchmark cyclical duration stance in global bond portfolios, with a large underweight allocation to US Treasuries. The UST-Bund Spread Widening Looks Stretched Chart 10Yield Chasing Has Been A Losing Strategy In 2021
Yield Chasing Has Been A Losing Strategy In 2021
Yield Chasing Has Been A Losing Strategy In 2021
Last August, we published a report discussing how “yield chasing” – a strategy of consistently favoring the highest yielding government bond markets – had become the default strategy for bond investors during the early months of the pandemic.1 We concluded that yield chasing would be a successful strategy for only as long as central banks stuck to their promises to maintain very loose monetary policy for the next few years. Investors would be forced to chase scarce yields in that environment, while worrying less about cyclical economic and inflation factors that could push up bond yields. Yield chasing has performed quite poorly so far in 2021. A basket of higher-yielding markets like the US, Canada and Australia has underperformed a basket of low-yielders like Germany, France and Japan by -1.4 percentage points (Chart 10). Obviously, such a carry-driven strategy would be expected to perform poorly during an environment of rising bond volatility as is currently the case. Markets that have been offering relatively enticing yields, like the US or Australia (Table 1), are actually generating the largest total return losses. Those higher-yielders have suffered more aggressive repricing of interest rate expectations, as discussed in the previous section of this report, leading to losses from duration that are dwarfing the higher yields. This is especially true in the US, where there remains the greater scope for an upward repricing of interest rate and inflation expectations. Table 1Government Bond Yields: Unhedged & Hedged Into USD
Are Central Banks Losing Control Of Bond Yields? No.
Are Central Banks Losing Control Of Bond Yields? No.
This suggests that investors must be cautious on determining when to consider increasing exposure to higher yielders like the US, even after Treasury yields have increased substantially. One way to evaluate that is to look at the spreads between US Treasuries and low yielders like Germany and Japan, relative to US bond volatility. In Chart 11, we show the spread of 10-year US Treasuries to 10-year German Bunds. To facilitate a fair comparison between the two, we hedge the Treasury yield into euros while adjusting the spread for duration difference between the two bonds. The currency-hedged and duration-matched Treasury-Bund spread is shown in the middle panel of the chart. In the bottom panel, we adjust that spread for US interest rate volatility by dividing the spread by the level of the MOVE index of US Treasury option volatility. On an unadjusted basis, the 10-year yield gap now sits at 175bps, +70bps higher than the lows seen in August 2020. That spread is narrower on a currency hedged basis, with the 10-year US Treasury yield hedged into euros +73ps higher than the 10-year German bund yield. Two conclusions stand out from the chart: The currency-hedged and duration-matched spread is still well below the prior peaks dating back to 2000; The volatility-adjusted spread is already one standard deviation above the mean value since 2000. In other words, there is scope for US Treasuries yields to continue rising relative to German Bund yields based on levels reached in past cycles. Yet at the same time, the spread provides a reasonable level of compensation compared to the riskiness (volatility) of Treasuries, also based on past cycles. We show the same chart for the spread between 10-year US Treasuries and 10-year Japanese government bonds (JGBs) in Chart 12. In this case, there is also scope for additional spread widening although the volatility-adjusted spread is still not as attractive as at previous peaks since 2000. Chart 11UST-Bund Spread Looking Stretched Vs UST Vol
UST-Bund Spread Looking Stretched Vs UST Vol
UST-Bund Spread Looking Stretched Vs UST Vol
Chart 12UST-JGB Spread Getting Stretched Vs UST Vol
UST-JGB Spread Getting Stretched Vs UST Vol
UST-JGB Spread Getting Stretched Vs UST Vol
The message from the volatility-adjusted Treasury-Bund spread lines up with that of the momentum measures of the unadjusted spread. The latter is historically stretched relative to its 200-day moving average, while the change in the spread over the past six months has been as rapid as any of the moves seen since the 2008 financial crisis (Chart 13). Adding it all up, positioning for additional widening of the Treasury-Bund spread is a much poorer bet from a risk versus reward perspective than it was even a few months ago. On a fundamental medium-term basis, however, there is still room for the Treasury-Bund spread to widen further. Relative inflation and unemployment (spare capacity) trends both argue for relatively higher US bond yields (Chart 14). In addition, the Fed is almost certainly going to start tightening monetary policy well before the ECB, thus policy rate differentials will underpin a wider bond spread – although that is already largely discounted in the spread on a forward basis (top panel). Chart 13UST-Bund Spread Momentum Looks Stretched
UST-Bund Spread Momentum Looks Stretched
UST-Bund Spread Momentum Looks Stretched
Chart 14Fundamentals Still Support A Wider UST-Bund Spread
Fundamentals Still Support A Wider UST-Bund Spread
Fundamentals Still Support A Wider UST-Bund Spread
Chart 15Stay Underweight US Vs. Germany On A Strategic Basis
Stay Underweight US Vs. Germany On A Strategic Basis
Stay Underweight US Vs. Germany On A Strategic Basis
Our fundamental fair value model of the 10-year Treasury-Bund spread shows that the spread is still cheap relative to fair value, which is rising (Chart 15). This suggests more medium-term upside in the spread, perhaps even by more than currently priced into the forwards over the next year. Based on this analysis, we see a case for maintaining a core strategic (6-12 month holding period) underweight position for the US versus Germany in our recommended country allocation within our model bond portfolio. At the same time, with the spread looking a bit stretched on some of the momentum and volatility-adjusted measures, we are taking profits on our tactical (0-6 month holding period) 10-year Treasury-Bund spread widening trade using bond futures, realizing a 1.8% return (see the Tactical Overlay table on page 18). Bottom Line: The selloff in US Treasuries has pushed US yields to levels that are starting to look a bit stretched relative to yields from other major developed economies like Germany and Japan. This is especially true on a volatility-adjusted basis. As a result, we are taking profits on our tactical US-Germany spread widening trade. However, we are maintaining our strategic overweight for Germany versus the US in our model bond portfolio, as fundamentals argue for a wider Treasury-Bund spread on a cyclical and strategic basis. Robert Robis, CFA Chief Fixed Income Strategist rrobis@bcaresearch.com Footnotes 1 Please see BCA Research Global Fixed Income Strategy Report, "We’re All Yield Chasers Now", dated August 11, 2020, available at gfis.bcaresearch.com. Recommendations The GFIS Recommended Portfolio Vs. The Custom Benchmark Index
Are Central Banks Losing Control Of Bond Yields? No.
Are Central Banks Losing Control Of Bond Yields? No.
Duration Regional Allocation Spread Product Tactical Trades Yields & Returns Global Bond Yields Historical Returns
Highlights Market-based geopolitical analysis is about identifying upside as well as downside risk. So far this year upside risks include vaccine efficacy, coordinated monetary and fiscal stimulus, China’s avoidance of over-tightening policy, and Europe’s stable political dynamics. Downside risks include vaccine rollout problems, excessive US stimulus, a Chinese policy mistake, and traditional geopolitical risks in the Taiwan Strait and Persian Gulf. Financial markets may see more turmoil in the near-term over rising bond yields and the dollar bounce. But the macro backdrop is still supportive for this year. We are initiating and reinitiating a handful of trades: EM currencies ex-Brazil/Turkey/Philippines, the BCA rare earth basket, DM-ex-US, and the Trans-Pacific Partnership markets, and global value plays. Feature Chart 1Bond Yield Spike Threatens Markets In Near Term
Bond Yield Spike Threatens Markets In Near Term
Bond Yield Spike Threatens Markets In Near Term
Investors hear a lot about geopolitical risk but the implication is always “downside risk.” What about upside risks? Where are politics and geopolitics creating buying opportunities? So far this year, on the positive side, the US fiscal stimulus is overshooting, China is likely to avoid overtightening policy, and Europe’s political dynamics are positive. However, global equity markets are euphoric and much of the good news is priced in. On the negative side, the US stimulus is probably too large. The output gap will be more than closed by the Biden administration’s $1.9 trillion American Rescue Plan yet the Democrats will likely pass a second major bill later this year with a similar amount of net spending, albeit over a longer period of time and including tax hikes. The countertrend bounce in the dollar and rising government bond yields threaten the US and global equity market with a near-term correction. The global stock-to-bond ratio has gone vertical (Chart 1). Meanwhile Biden faces immediate foreign policy tests in the Taiwan Strait and Persian Gulf. These two are traditional geopolitical risks that are once again underrated by investors. The near term is likely to be difficult for investors to navigate. Sentiment is ebullient and likely to suffer some disappointments. In this report we highlight a handful of geopolitical opportunities and offer some new investment recommendations to capitalize on them. Go Long Japan And Stay Long South Korea China’s stimulus and recovery matched by global stimulus and recovery have led to an explosive rise in industrial metals and other China-sensitive assets such as Swedish stocks and the Australian dollar that go into our “China Play Index” (Chart 2). Chart 2China Plays Looking Stretched (For Now)
China Plays Looking Stretched (For Now)
China Plays Looking Stretched (For Now)
While a near-term pullback in these assets looks likely, tight global supplies will keep prices well-bid. Moreover long-term strategic investment plans by China and the EU to accelerate the technology race and renewable energy are now being joined by American investment plans, a cornerstone of Joe Biden’s emerging national policy program. We are long silver and would buy metals on the dips. Chinese President Xi Jinping’s “new era” policies will be further entrenched at the March National People’s Congress with the fourteenth five-year plan for 2021-25 and Xi’s longer vision for 2035. These policies aim to guide the country through its economic transition from export-manufacturing to domestic demand. They fundamentally favor state-owned enterprises, which are an increasingly necessary tool for the state to control aggregate demand as potential GDP growth declines, while punishing large state-run commercial banks, which are required to serve quasi-fiscal functions and swallow the costs of the transition (Chart 3). Xi Jinping’s decision to promote “dual circulation,” which is fundamentally a turn away from Deng Xiaoping’s opening up and liberal reform to a more self-sufficient policy of import substitution and indigenous innovation, will clash with the Biden administration, which has already flagged China as the US’s “most serious competitor” and is simultaneously seeking to move its supply chains out of China for critical technological, defense, and health goods. Chart 3Xi Jinping Leans On The Banks To Save The SOEs
Xi Jinping Leans On The Banks To Save The SOEs
Xi Jinping Leans On The Banks To Save The SOEs
Chinese political and geopolitical risks are almost entirely priced out of the market, according to our GeoRisk Indicator, leaving Chinese equities exposed to further downside (Chart 4). Hong Kong equities have traded in line with GeoRisk Indicator for China, which suggests that they also have downside as the market prices in a rising risk premium due to the US’s attempt to galvanize its allies in a great circumvention of China’s economy in the name of democracy versus autocracy. Chart 4China/HK Political Risk Priced Out Of Market
China/HK Political Risk Priced Out Of Market
China/HK Political Risk Priced Out Of Market
China has hinted that it will curtail rare earth element exports to the US if the US goes forward with a technological blockade. Biden’s approach, however, is more defensive rather than offensive – focusing on building up domestic and allied semiconductor and supply chain capacity rather than de-sourcing China. President Trump’s restrictions can be rolled back for US designed or manufactured tech goods that are outdated or strictly commercial. Biden will draw the line against American parts going into the People’s Liberation Army. Biden has a chance in March to ease the Commerce Department’s rules implementing Trump’s strictures on Chinese software apps in US markets as a gesture of engagement. Supply constraints and shortages cannot be solved quickly in either semiconductors or rare earths. But both China and the US can circumvent export controls by importing through third parties. The problem for China is that it is easier for the US to start pulling rare earths from the ground than it is for China to make a great leap forward in semiconductor production. Given the US’s reawakening to the need for a domestic industrial policy, strategic public investments, and secure supply chains, we are reinitiating our long rare earth trade, using the BCA rare earth basket, which features producers based outside of China (Chart 5). The renminbi is starting to rolling over, having reached near to the ceiling that it touched in 2017 after Trump’s arrival. There are various factors that drive the currency and there are good macro reasons for the currency to have appreciated in 2016-17 and 2020-21 due to strong government fiscal and monetary reflation. Nevertheless the People’s Bank allowed the currency to appreciate extensively at the beginning of both Trump’s and Biden’s terms and the currency’s momentum is slowing as it nears the 2017 ceiling. We are reluctant to believe the renminbi will go higher as China will not want to overtighten domestic policy but will want to build some leverage against Biden for the forthcoming strategic and economic dialogues. For mainland-dedicated investors we recommend holding Chinese bonds but for international investors we would highlight the likelihood that the renminbi has peaked and geopolitical risk will escalate. There is no substantial change on geopolitical risk in the Taiwan Strait since we wrote about it recently. A full-scale war is a low-probability risk. Much more likely is a diplomatic crisis – a showdown between the US and China over Taiwan’s ability to export tech to the mainland and the level of American support for Taiwan – and potentially a testing of Biden’s will on the cybersecurity, economic security, or maritime security of Taiwan. While it would make sense to stay long emerging markets excluding Taiwan, there is not an attractive profile for staying long emerging markets excluding all of Greater China. Therefore investors who are forced to choose should overweight China relative to Taiwan (Chart 6). Chart 5Rare Earth Miners Outside China Can Go Higher
Rare Earth Miners Outside China Can Go Higher
Rare Earth Miners Outside China Can Go Higher
Market forces have only begun to register the fact that Taiwan is the epicenter of geopolitical risk in the twenty-first century. The bottleneck for semiconductors and Taiwan’s role as middleman in the trade war have supported Taiwanese stocks. It will take a long time for China, the US, and Europe to develop alternative suppliers for chips. But geopolitical pressures will occasionally spike and when they do Taiwanese equities will plunge (Chart 7). Chart 6EM Investors Need Either China Or Taiwan ... Taiwan Most At Risk
EM Investors Need Either China Or Taiwan ... Taiwan Most At Risk
EM Investors Need Either China Or Taiwan ... Taiwan Most At Risk
South Korean geopolitical risk is also beneath the radar, though stocks have corrected recently and emerging market investors should generally favor Korea, especially over Taiwan. The first risk to Korea is that the US will apply more pressure on Seoul to join allied supply chains and exclude shipments of sensitive goods to China. The second risk is that North Korea – which Biden is deliberately ignoring in his opening speeches – will demand America’s attention through a new series of provocations that will have to be rebuked with credible threats of military force. Chart 7Markets Starting To Price Taiwan Strait Geopolitical Risk
Markets Starting To Price Taiwan Strait Geopolitical Risk
Markets Starting To Price Taiwan Strait Geopolitical Risk
Chart 8South Korea Favored In EM But Still Faces Risks Over Chips, The North
South Korea Favored In EM But Still Faces Risks Over Chips, The North
South Korea Favored In EM But Still Faces Risks Over Chips, The North
Chart 9Don't Worry About Japan's Revolving Door
Don't Worry About Japan's Revolving Door
Don't Worry About Japan's Revolving Door
The North Korean risk is usually very fleeting for financial markets. The tech risk is more serious but the Biden administration is not seeking to force South Korea to stop trading with China, at least not yet. The US would need to launch a robust, multi-year diplomatic effort to strong-arm its allies and partners into enforcing a chip and tech ban on China. Such an effort would generate a lot of light and heat – shuttle diplomacy, leaks to the press, and public disagreements and posturing. Until this starts to occur, US export controls will be a concern but not an existential threat to South Korea (Chart 8). Japan is the geopolitical winner in Asia Pacific. Japan is militarily secure, has a mutual defense treaty with the US, and stands to benefit from the recovery in global trade and growth. Japan is a beneficiary of a US-driven tech shift away from excess dependency on China and is heavily invested in Southeast Asia, which stands to pick up manufacturing share. Higher bond yields and inflation expectations will detract from growth stocks more than value stocks, and value stocks have a larger market-cap weight in European and Japanese equity markets. Japanese politics are not a significant risk despite a looming election. While Prime Minister Yoshihide Suga is unpopular and likely to revive the long tradition of a “revolving door” of short-lived prime ministers, and while the Liberal Democratic Party will lose the super-majorities it held under Shinzo Abe, nevertheless the party remains dominant and the national policy consensus is behind Abe’s platform of pro-growth reforms, coordinated dovish monetary and fiscal policy, and greater openness to trade and immigration (Chart 9). Favor EU And UK Over Russia And Eastern Europe Russian geopolitical risk appears to be rolling over according to our indicator but we disagree with the market’s assessment and expect it to escalate again soon (Chart 10). Not only will Russian social unrest continue to escalate but also the Biden administration will put greater pressure on Russia that will keep foreign investors wary. Chart 10Russia Geopolitical Risk Will Not Roll Over
Russia Geopolitical Risk Will Not Roll Over
Russia Geopolitical Risk Will Not Roll Over
While geopolitics thus poses a risk to Russian equities – which are fairly well correlated (inversely) with our GeoRisk indicator – nevertheless they are already cheap and stand to benefit from the rise in global commodity prices and liquidity. Russia is also easing fiscal policy to try to quiet domestic unrest. The pound and the euro today are higher against the ruble than at any time since the invasion of Ukraine. It is possible that Russia will opt for outward aggressiveness amidst domestic discontent, a weak and relapsing approval rating for Vladimir Putin and his government, and the Biden administration’s avowed intention to prioritize democracy promotion, including in Ukraine and Belarus (Chart 11). The ruble will fall on US punitive actions but ultimately there is limited downside, at least as long as the commodity upcycle continues. Chart 11Ruble Can Fall But Probably Not Far
Ruble Can Fall But Probably Not Far
Ruble Can Fall But Probably Not Far
Biden stated in his second major foreign policy speech, “we will not hesitate to raise the cost on Russia.” There are two areas where the Biden administration could surprise financial markets: pipelines and Russian bonds. Biden could suddenly adopt a hard line on the Nordstream 2 pipeline between Russia and Germany, preventing it from completion. This would require Biden to ask the Germans to put their money where their mouths are when it comes to trans-Atlantic solidarity. Biden is keen to restore relations with Germany, and is halting the withdrawal of US troops from there, but pressuring Germany on Russia is possible given that it lies in the US interest and Biden has vowed to push back against Russia’s aggressive regional actions and interference in American affairs. The US imposed sanctions on Russian “Eurobonds” under the Chemical and Biological Weapons Control and Warfare Elimination Act of 1991 (CBW Act) in the wake of Russia’s poisoning of secret agent Sergei Skripal in the UK in 2018. Non-ruble bank loans and non-ruble-denominated Russian bonds in primary markets were penalized, which at the time accounted for about 23% of Russian sovereign bonds. This left ruble-denominated sovereign bonds to be sold along with non-ruble bonds in secondary markets. The Biden administration views Russia’s poisoning of opposition leader Alexei Navalny as a similar infraction and will likely retaliate. The Defending American Security from Kremlin Aggression Act is not yet law but passed through a Senate committee vote in 2019 and proposed to halt most purchases of Russian sovereign debt and broaden sanctions on energy projects and Kremlin officials. Biden is also eager to retaliate for the large SolarWinds hack that Russia is accused of conducting throughout 2020. Cybersecurity stocks are an obvious geopolitical trade in contemporary times. Authoritarian nations have benefited from the use of cyber attacks, disinformation, and other asymmetric warfare tactics. The US has shown that it does not have the appetite to fight small wars, like over Ukraine or the South China Sea, whereas the US remains untested on the question of major wars. This incentivize incremental aggression and actions with plausible deniability like cyber. Therefore the huge run-up in cyber stocks is well-supported and will continue. The world’s growing dependency on technology during the pandemic lockdowns heightened the need for cybersecurity measures but the COVID winners are giving way to COVID losers as the pandemic subsides and normal economic activity resumes. Traditional defense stocks stand to benefit relative to cyber stocks as the secular trend of struggle among the Great Powers continues (Chart 12). Specifically a new cycle of territorial competition will revive military tensions as commodity prices rise. Chart 12Back To Work' Trade: Long Defense Versus Cyber
Back To Work' Trade: Long Defense Versus Cyber
Back To Work' Trade: Long Defense Versus Cyber
By contrast with Russia, western Europe is a prime beneficiary of the current environment. Like Japan, Europe is an industrial, trade-surplus economy that benefits from global trade and growth. It benefits as the geopolitical middleman between the US and its rivals, China and Russia, especially as long as the Biden administration pursues consultation and multilateralism and hesitates to force the Europeans into confrontational postures against these powers. Chart 13Political Risk Still Subsiding In Continental Europe
Political Risk Still Subsiding In Continental Europe
Political Risk Still Subsiding In Continental Europe
Meanwhile Russia and especially China need to court Europe now that the Biden administration is using diplomacy to try to galvanize a western bloc. China looks to substitute European goods for American goods and open up its market to European investors to reduce European complaints of protectionism. European domestic politics will become more interesting over the coming year, with German and French elections, but the risks are low. The rise of a centrist coalition in Italy under Mario Draghi highlights how overstated European political risk really is. In the Netherlands, Mark Rutte’s center-right party is expected to remain in power in March elections based on opinion polling, despite serious corruption scandals and COVID blowback. In Germany, Angela Merkel’s center-right party is also favored, and yet an upset would energize financial markets because it would result in a more fiscally accommodative and pro-EU policy (Chart 13). The takeaway is that there is limit to how far emerging European countries can outperform developed Europe, given the immediate geopolitical risk emanating from Russia that can spill over into eastern Europe (Chart 14). Developed European stocks are at peak levels, comparable to the period of Ukraine’s election, but Ukraine is about to heat up again as a battleground between Russia and the West, as will other peripheral states. Chart 14Favor DM Europe Over EM Europe
Favor DM Europe Over EM Europe
Favor DM Europe Over EM Europe
Chart 15GBP: Watch For Scottish Risk Revival In May
GBP: Watch For Scottish Risk Revival In May
GBP: Watch For Scottish Risk Revival In May
Finally, in the UK, the pound continues to surge in the wake of the settlement of a post-Brexit trade deal, notwithstanding lingering disagreements over vaccines, financial services, and other technicalities. British equities are a value play that can make up lost ground from the tumultuous Brexit years. There is potentially one more episode of instability, however, arising from the unfinished business in Scotland, where the Scottish National Party wants to convert any victory in parliamentary elections in May into a second push for a referendum on national independence. At the moment public opinion polls suggest that Prime Minister Boris Johnson’s achievement of an EU trade deal has taken the wind out of the sails of the independence movement but only the election will tell whether this political risk will continue to fall in the near term (Chart 15). Hence the pound’s rally could be curtailed in the near term but unless Scottish opinion changes direction the pound and UK domestic-oriented stocks will perform well. Short EM Strongmen Throughout the emerging world the rise of the “Misery Index” – unemployment combined with inflation – poses a persistent danger of social and political instability that will rise, not fall, in the coming years. The aftermath of the COVID crisis will be rocky once stimulus measures wane. South Africa, Turkey, and Brazil look the worst on these measures but India and Russia are also vulnerable (Chart 16). Brazilian geopolitical risk under the turbulent administration of President Jair Bolsonaro has returned to the 2015-16 peaks witnessed during the impeachment of President Dilma Rousseff amid the harsh recession of the middle of the last decade. Brazilian equities are nearing a triple bottom, which could present a buying opportunity but not before the current political crisis over fiscal policy exacts a toll on the currency and stock market (Chart 17). Chart 16EM Political Risk Will Bring Bad Surprises
EM Political Risk Will Bring Bad Surprises
EM Political Risk Will Bring Bad Surprises
Chart 17Brazil Risk Hits Impeachment Peaks On Bolso Fiscal Populism
Brazil Risk Hits Impeachment Peaks On Bolso Fiscal Populism
Brazil Risk Hits Impeachment Peaks On Bolso Fiscal Populism
Bolsonaro’s signature pension reform was an unpopular measure whose benefits were devastated by the pandemic. The return to fiscal largesse in the face of the crisis boosted Bolsonaro’s support and convinced him to abandon the pretense of austere reformer in favor of traditional Brazilian fiscal populist as the 2022 election approaches. His attempt to violate the country’s fiscal rule – a constitutional provision passed in December 2016 that imposes a 20-year cap on public spending growth – that limits budget deficits is precipitating a shakeup within the ruling coalition. Our Emerging Market Strategists believe the Central Bank of Brazil will hike interest rates to offset the inflationary impact of breaking the fiscal cap but that the hikes will likely fall short, prompting a bond selloff and renewed fears of a public debt crisis. The country’s political crisis will escalate in the lead up to elections, not unlike what occurred in the US, raising the odds of other negative political surprises. Chart 18Reinitiate Long Mexico / Short Brazil
Reinitiate Long Mexico / Short Brazil
Reinitiate Long Mexico / Short Brazil
While Latin America as a whole is a shambles, the global cyclical upturn and shift in American policy creates investment opportunities – particularly for Mexico, at least within the region. Investors should continue to prefer Mexican equities over Brazilian given Mexico’s fundamentally more stable economic policy backdrop and its proximity to the American economy, which will be supercharged with stimulus and eager to find ways to use its new trade deal with Mexico to diversify its manufacturing suppliers away from China (Chart 18). In addition to Brazil, Turkey and the Philippines are also markets where “strongman leaders” and populism have undercut economic orthodoxy and currency stability. A basket of emerging market currencies that excludes these three witnessed a major bottom in 2014-16, when Turkish and Brazilian political instability erupted and when President Rodrigo Duterte stormed the stage in the Philippines. These three currencies look to continue underperforming given that political dynamics will worsen ahead of elections in 2022 (possibly 2023 for Turkey) (Chart 19). Chart 19Keep Shorting The Strongmen
Keep Shorting The Strongmen
Keep Shorting The Strongmen
Investment Takeaways We closed out some “risk-on” trades at the end of January – admittedly too soon – and since then have hedged our pro-cyclical strategic portfolio with safe-haven assets, while continuing to add risk-on trades where appropriate. The Biden administration still faces one or more major foreign policy tests that can prove disruptive, particularly to Taiwanese, Chinese, Russian, and Saudi stocks. Biden’s foreign policy doctrine will be established in the crucible of experience but his preferences are known to favor diplomacy, democracy over autocracy, and to pursue alliances as a means of diversifying supply chains away from China. We will therefore look favorably upon the members of the Comprehensive and Progressive Trans-Pacific Partnership (CPTPP) and recommend investors reinitiate the long CPTPP equities basket. These countries, which include emerging markets with decent governance as well as Japan, Australia, New Zealand, and Canada all stand to benefit from the global upswing and US foreign policy (Chart 20). Chart 20Reinitiate Long Trans-Pacific Partnership
Reinitiate Long Trans-Pacific Partnership
Reinitiate Long Trans-Pacific Partnership
Chart 21Reinitiate Long Global Value Over Growth
Reinitiate Long Global Value Over Growth
Reinitiate Long Global Value Over Growth
The Biden administration will likely try to rejoin the CPTPP but even if it fails to do so it will privilege relations with these countries as it strives to counter China and Russia. The UK, South Korea, Thailand and others could join the CPTPP over time – though an attempt to recruit Taiwan would exacerbate the geopolitical risks highlighted above centered on Taiwan. The dollar is perking up, adding a near-term headwind to global equities, but the cyclical trend for the dollar is still down due to extreme monetary and fiscal dovishness. Tactically, go long Mexican equities over Brazilian equities. From a strategic point of view we still favor value stocks over growth stocks and recommend investors reinitiate this global trade (Chart 21). Strategically, wait to overweight UK stocks in a global portfolio until the result of the May local elections is known and the risk of Scottish independence can be reassessed. Strategically, favor developed Europe over emerging Europe stocks as a result of Russian geopolitical risks that are set to escalate. Strategically go long global defense stocks versus cyber security stocks as a geopolitical “back to work” trade for a time when economic activity resumes and resource-oriented territorial, kinetic, military risks reawaken. Strategically, favor EM currencies other than Brazil, Turkey, and the Philippines to minimize exposure to economic populism, poor macro fundamentals, and election risk. Strategically, go long the BCA Rare Earths Basket to capture persistent US-China tensions under Biden and the search for alternatives to China. Matt Gertken Vice President Geopolitical Strategy mattg@bcaresearch.com We Read (And Liked) … Supply-Side Structural Reform Supply-Side Structural Reform, a compilation of Chinese economic and policy research, discusses several aspects of Chinese economic reform as it is practiced under the Xi Jinping administration, spanning the meaning and importance of supply-side structural reform in China as well as five major tasks.1 The book consists of contributions by Chinese scholars, financial analysts, and opinion makers in 2015, so we have learned a lot since it was published, even as it sheds light on Beijing’s interpretation of reform. 2015 was a year of financial turmoil that saw a dramatic setback for China’s 2013 liberal reform blueprint. It also saw the launch of a new round of reforms under the thirteenth Five Year Plan (2016-20), which aimed to push China further down the transition from export-manufacturing to domestic and consumer-led growth. Beijing’s renewed reform push in 2017, which included a now infamous “deleveraging campaign,” ultimately led to a global slowdown in 2018-19 that was fatefully exacerbated by the trade war with the United States – only to be eclipsed by the COVID-19 pandemic in 2020. Built on fundamental economic theory and the social background of China, the book’s authors examine the impact of supply-side reform on the Chinese financial sector, industrial sector, and macroeconomic development. The comprehensive analysis covers short-term, mid-term and long-term effects. From the perspective of economic theory, there is consensus that China's supply-side structural reform framework did not forsake government support for the demand side of the economy, nor was it synonymous with traditional, liberal supply-side economics in the Western world. In contrast to Say’s Law, Reaganomics, and the UK’s Thatcherite privatization reforms, China's supply-side reform was concentrated on five tasks specific to its contemporary situation: cutting excessive industrial capacity, de-stocking, deleveraging, cutting corporate costs, and improving various structural “weaknesses.” The motives behind the new framework were to enhance the mobility and efficiency of productive factors, eliminate excess capacity, and balance effective supply with effective demand. Basically, if China cannot improve efficiencies, capital will be misallocated, corporations will operate at a loss, and the economy’s potential will worsen over the long run. The debt buildup will accelerate and productivity will suffer. Regarding implementation, the book sets forth several related policies, including deepening the reform of land use and the household registration (hukou) system, and accelerating urbanization, which are effective measures to increase the liquidity of productive factors. Others promote the transformation from a factor-driven economy to efficiency and innovation-driven economy, including improving the property rights system, transferring corporate and local government debt to the central government, and encouraging investment in human capital and in technological innovation. The book also analyzes and predicts the potential costs of reform on the economy in the short and long term. In the short run, authors generally anticipated that deleveraging and cutting excessive industrial capacity would put more pressure on the government’s fiscal budget. The rise in the unemployment rate, cases of bankruptcy, and the negative sentiment of investors would slow China’s economic growth. In the medium and long run, this structural reform was seen as necessary for a sustainable medium-speed economic growth, leading to more positive expectations for households and corporates. The improved efficiency in capital allocation would provide investors with more confidence in the Chinese economy and asset market. Authors argued that overall credit risk was still controllable in near-term, as the corresponding policies such as tax reduction and urbanization would boost private investment and consumption in the short run. These policies increased demand in the labor market and created working positions to counteract adverse impacts. Employment in industries where excessive capacity was most severe only accounted for about 3% of total urban employment in 2013. Regarding the rise in credit risk during de-capacity, the asset quality of banks had improved since the 1990s and the level of bad debt was said to be within a controllable range, given government support. Moreover, in the long run, the merger and reorganization of enterprises would increase the efficient supply and have a positive effect on economic innovation-driven transformation. We know from experience that much of the optimism about reform would confront harsh realities in the 2016-21 period. The reforms proceeded in a halting fashion as the US trade war interrupted their implementation, prompting the government to resort to traditional stimulus measures in mid-2018, only to be followed by another massive fiscal-and-credit splurge in 2020 in the face of the pandemic. Yet investors could be surprised to find that the Politburo meeting on April 17, 2020 proclaimed that China would continue to focus on supply-side structural reform even amid efforts to normalize the economy and maintain epidemic prevention and control. Leaders also pledged to maintain the supply-side reform while emphasizing demand-side management during annual Central Economic Work Conference in December 2020. In other words, Xi administration’s policy preferences remain set, and compromises forced by exogenous events will soon give way to renewed reform initiatives. This is a risk to the global reflation trade in 2021-22. There has not been a total abandonment of supply-side reform. The main idea of demand-side reform – shifts in the way China’s government stimulates the economy – is to fully tap the potential of the domestic market and call for an expansion of consumption and effective investment. Combined with the new concept of “dual circulation,” which emphasizes domestic production and supply chains (effectively import substitution), the current demand-side reforms fall in line with the supply-side goal of building a more independent and controllable supply chain and produce higher technology products. These combined efforts will provide “New China” sectors with more policy support, less regulatory constraint, and lead to better economic and financial market performance. Despite the fluctuations in domestic growth and the pressure from external demand, China will maintain the focus on reform in its long-term planning. The fundamental motivation is to enhance efficiency and innovation that is essential for China’s productivity and competitiveness in the future. Thus, investors should not become complacent over the vast wave of fiscal and credit stimulus that is peaking today as we go to press. Instead they should recognize that China’s leaders are committed to restructuring. This means that the economic upside of stimulus has a cap on it– a cap that will eventually be put in place by policymakers, if not by China’s lower capacity for debt itself. It would be a colossal policy mistake for China to overtighten monetary and fiscal policy in 2021 but any government attempts to tighten, the financial market will become vulnerable. A final thought: it is unclear whether there is potential for an improvement in China’s foreign relations contained in this conclusion. What the western world is demanding is for China to rebalance its economy, open up its markets, cut back on the pace of technological acquisition, reduce government subsidies for state-owned companies, and conform better to US and EU trade rules. There is zero chance that China will provide all of these things. But its own reform program calls for greater intellectual property protections, greater competition in non-strategic sectors (which the US and EU should be able to access under recent trade deals), and targeted stimulus for sustainable energy, where the US and EU see trade and investment opportunities. Thus there is a basis for an improvement in cooperation. What remains to be seen is how protectionist dual circulation will be in practice and how aggressively the US will pursue international enforcement of technological restrictions on China under the Biden administration. Jingnan Liu Research Associate JingnanL@bcaresearch.com Footnotes 1 Yifu L, et al. Supply-Side Structural Reform (Beijing: Democracy & Construction Publishing House, 2016). 351 pages. Appendix: GeoRisk Indicator China
China: GeoRisk Indicator
China: GeoRisk Indicator
Russia
Russia: GeoRisk Indicator
Russia: GeoRisk Indicator
UK
UK: GeoRisk Indicator
UK: GeoRisk Indicator
Germany
Germany: GeoRisk Indicator
Germany: GeoRisk Indicator
France
France: GeoRisk Indicator
France: GeoRisk Indicator
Italy
Italy: GeoRisk Indicator
Italy: GeoRisk Indicator
Canada
Canada: GeoRisk Indicator
Canada: GeoRisk Indicator
Spain
Spain: GeoRisk Indicator
Spain: GeoRisk Indicator
Taiwan
Taiwan: GeoRisk Indicator
Taiwan: GeoRisk Indicator
Korea
Korea: GeoRisk Indicator
Korea: GeoRisk Indicator
Turkey
Turkey: GeoRisk Indicator
Turkey: GeoRisk Indicator
Brazil
Brazil: GeoRisk Indicator
Brazil: GeoRisk Indicator
Section III: Geopolitical Calendar
Highlights This week, we present the second edition of the BCA Research Global Fixed Income Strategy (GFIS) Global Credit Conditions Chartbook—a review of central bank surveys of bank lending standards and loan demand. Feature The data on lending standards during the last quarter of 2020 are decidedly mixed. Credit standards for business loans continued to tighten in most countries (Chart 1). On the positive side, the pace of that tightening slowed, or is expected to slow, going into 2021. Importantly, the survey data for consumer loan demand in many countries paints a more optimistic picture for household spending than consumer confidence indices. In sum, the lending surveys indicate that the panoply of global fiscal and monetary stimulus measures introduced over the past year to help offset the financial shock of the pandemic have passed through, to some degree, into easier credit standards. This should help sustain the current trends of rising global bond yields and narrowing corporate credit spreads. Chart 1Mixed Data On Lending Standards
Mixed Data On Lending Standards
Mixed Data On Lending Standards
An Overview Of Global Credit Condition Surveys Chart 2Credit Standards And Spreads Are Correlated
Credit Standards And Spreads Are Correlated
Credit Standards And Spreads Are Correlated
After every quarter, major central banks compile surveys to assess prevailing credit conditions. The purpose is to obtain from banks an assessment of how their lending standards and demand for loans, for both firms and consumers, changed over the previous quarter. Most surveys also ask questions about the key factors driving these changes and expectations for the next quarter.1 For fixed income investors, these surveys are valuable for a few reasons. Firstly, data on consumer lending is a window into consumer health while business loan demand sheds light on the investment picture. These help derive a view on the path of future economic growth and interest rates and thus, the appropriate duration stance of a bond portfolio. Also, credit standards can tell us about the pass-through from fiscal and monetary policy measures to realized financial conditions (i.e. corporate borrowing rates). Most importantly, credit standards exhibit a direct correlation with corporate bond spreads (Chart 2). As they have access to detailed, non-public information on a large number of borrowers, loan officers are uniquely positioned to evaluate corporate health. When banks are tightening standards, they see an issue with the credit quality of either current or future loans, which impacts borrowing costs in the corporate bond market. Tightening standards indicate a worsening borrowing backdrop and weaker growth, which then pushes up corporate spreads. Vice versa, easing standards imply a favorable backdrop and plentiful liquidity—both bullish signs for spread product. US In the US, the net percent of domestic respondents to the Fed’s Senior Loan Officer survey that tightened standards for commercial and industrial (C&I) loans (measured as an average of small, middle-market, and large firms) fell significantly in Q4/2020 (Chart 3). The key issue, both for lenders that tightened and eased standards, was the economic outlook, with those that eased taking a more sanguine view and vice-versa. Chart 3US Credit Conditions
US Credit Conditions
US Credit Conditions
Chart 4Corporate Borrowing Costs Are Driving Easy Financial Conditions
Corporate Borrowing Costs Are Driving Easy Financial Conditions
Corporate Borrowing Costs Are Driving Easy Financial Conditions
The ad-hoc questions, asked in every instalment of the survey, discussed the outlook for 2021. On this front, US lenders expect easier lending standards over the course of the year, driven by an increase in risk tolerance and expected improvement in the credit quality of their loan portfolios. There was a marked improvement in demand for C&I loans in Q4/2020 although, on net, a small number of lenders still reported weaker demand over Q4/2020. Those that reported stronger loan demand cited financing for mergers and acquisitions as the biggest driver. Meanwhile, lenders reporting weaker demand primarily cited decreased fixed asset investment. However, the reasons for weaker demand were not all bad—many cited a reduced need for precautionary cash and liquidity. Over 2021, the outlook is quite bullish, with demand expected to hit all-time highs in net balance terms. The picture on the consumer side was buoyant in Q4 and that trend is expected to continue in 2021. A net +7% of banks increased credit limits on credit cards, while a moderately smaller share charged a narrower spread over cost of funds. However, in a trend we will continue to note for other regions in this report, there is a seeming divergence between consumer lending behavior and the sentiment numbers. This indicates a pent-up ability to spend that will likely be realized in full as pandemic restrictions begin to lift. After the economic outlook, increased competition from other banks and non-bank lenders was another leading factor behind easing standards. This is in line with our view that plummeting corporate borrowing costs are the primary driver of easy financial conditions in the US (Chart 4). We have shown that credit standards lead the US high-yield default rate by a one-year period; easier credit standards will further improve the default outlook, creating a virtuous cycle for as long as the Fed maintains monetary support. Euro Area In the euro area, lending standards continued to tighten at a faster pace in Q4/2020 even though that number had been expected to fall (Chart 5). The key reason was a worsening in risk perceptions due to continued uncertainty about the recovery. Persistently low risk tolerance also contributed to the tightening of standards. The tightening was somewhat worse for small and medium-sized enterprises than for large enterprises, and was also more pronounced in longer-term loans. This pessimistic outlook on credit standards is in line with an elevated high-yield default rate that has not shown signs of rolling over as it has in the US. Going into Q1/2021, standards are expected to continue tightening, albeit at a slightly slower rate. Chart 5Euro Area Credit Conditions
Euro Area Credit Conditions
Euro Area Credit Conditions
Chart 6Credit Standards For Major Euro Area Economies
Credit Standards For Major Euro Area Economies
Credit Standards For Major Euro Area Economies
Business credit demand was grim as well, weakening at a faster pace in Q4. This was driven by falling demand for fixed investments. Chart 7ECB Support Will Bring Down The Italy-Germany Spread
ECB Support Will Bring Down The Italy-Germany Spread
ECB Support Will Bring Down The Italy-Germany Spread
Inventory and working capital financing needs, which spiked dramatically in Q2/2020 due to acute liquidity needs, continued to contribute positively to loan demand - albeit to a much lesser extent than previous quarters as firms had already built up significant liquidity buffers. The decline in credit demand was also significantly larger for longer-term financing. Taken together with fixed investment demand, which has been in significant and persistent decline since Q1/2020, this is an extremely troubling trend for the euro area economy, confirming the ECB’s fears that the capital stock destruction wreaked by Covid-19 has permanently lowered potential long-term growth. After staging a tentative recovery in Q3/2020, consumer credit demand once again weakened in Q4/2020, attributable to declining consumer confidence and spending on durable goods as renewed pandemic lockdowns swept through Europe. However, low interest rates did contribute slightly to lifting credit demand on the margin. The divergence between consumer credit and confidence is not as dramatic in the euro area as in other regions. With demand expected to pick up in Q1, any narrowing in this gap is largely dependent on whether the EU can recover from what is already being called a botched vaccine rollout. Looking individually at the four major euro area economies, standards continued to tighten at a slow pace in Germany while remaining flat in Italy (Chart 6). Standards tightened more slowly in Spain due to an improvement in risk perceptions but tightened at a faster pace in France for the very same reason. Elevated risk perceptions in France could reflect concern about high debt levels among French firms. Going forward, firms expect the pace of tightening to slow in France and Spain, while picking up in Germany. Meanwhile, standards are expected to tighten outright in Italy in Q1/2021. Bank lending, however, continues to grow at the strongest pace since the 2008 financial crisis, reflecting the extent of the extraordinary pandemic-related measures (Chart 7). The ECB’s cheap bank funding through LTROs is helping support loan growth in the more fragile economies of Italy and Spain. In the face of this, investors should fade concern about an expected tightening in credit conditions in Italy that could drive up the risk premia on Italian government bonds. UK Chart 8UK Credit Conditions
UK Credit Conditions
UK Credit Conditions
In the UK, overall corporate credit standards remained mostly unchanged, with corporate credit availability deteriorating very slightly (Chart 8). The increased reticence to lend to small businesses is justified by small business default rates, which saw the worst developments since Q2/2020. The demand side, meanwhile, has been volatile. The massive demand spike in Q2/2020 to meet liquidity needs was followed by a commensurate decline in the following quarter. The picture now appears to be stabilizing, with demand recovering to a stable level and expected to grow moderately in Q1/2021. Household credit demand strengthened, while credit standards for secured and unsecured loans to consumers eased in last quarter of 2020. While the recovery in consumer confidence has been muted, expect the divergence between credit demand and sentiment to fade as the UK moves towards lifting restrictions and households look to satisfy pent-up demand. The two predominant narratives of Q4/2020 in the UK were positive developments on the vaccine and the Brexit deal, both contributing to a massive reduction in uncertainty. This is reflected in the survey data, with lenders reporting that the economic outlook and improving risk appetites will contribute to easier credit standards in Q1/2021. The UK is currently leading developed market peers in terms of cumulative vaccinations per capita. In addition, Prime Minister Johnson will be unveiling next week a roadmap out of lockdown, another positive sign for the heavily services-weighted economy. Japan Chart 9Japan Credit Conditions
Japan Credit Conditions
Japan Credit Conditions
After decades of perma-QE and ultra-low rates, the Japanese credit market behaves in a contrary way to most other markets. In Q2/2020 at the height of the pandemic, while other lenders were tightening standards, Japanese lenders were actually easing standards (Chart 9). Since then, there has been a significant drop in the number of firms reporting easier standards. More importantly, none of the firms in the Q4/2020 survey reported tightening, meaning that borrowing conditions have not changed significantly since the massive liquidity injection in response to the pandemic. So, it appears that demand is the primary driver of the Japanese credit market. On balance, firms reported weaker demand for loans in Q4, citing decreased fixed investment, an increase in internally generated funds, and availability of funding from other sources. As we discussed in our last Credit Conditions chartbook,2 business lending demand in Japan is typically countercyclical, meaning that firms usually seek funds for precautionary or restructuring reasons. Going into Q1, survey respondents expect an increase in loan demand, which is in line with the recent deterioration in business sentiment. On the consumer side, loan demand rebounded strongly in Q4. Leading factors were an increase in housing investment and consumption. As in the UK, there has been a divergence between consumer credit demand and sentiment which will likely resolve as the recent resurgence in Covid-19 cases is brought under control. Canada & New Zealand In Canada, business lending standards eased slightly in Q4/2020, coinciding with a rebound in business confidence (Chart 10). As in other developed markets, the recovery was driven by vaccine optimism and hopes of reopening in 2021. The more important story for the Bank of Canada (BoC), however, is the overheating housing market. As we discussed last week in a Special Report published jointly with our colleagues at BCA Research Foreign Exchange Strategy,3 ultra-low rates have helped fuel another upturn in the Canadian housing market, with housing the most affordable it has been in five years, according to the BoC’s indicator. The strength in the housing market was supported by easing standards on mortgage lending, indicating that monetary and regulatory measures to bolster the market have seen quick and efficient pass-through. Although we expect the BoC to remain relatively dovish, a frothy housing market, and the resulting financial stability issues, are a key risk to that view. In New Zealand, fewer lenders reported a tightening in business loan standards, while standards for residential mortgages continued to tighten at an unchanged pace from the previous survey (Chart 11). Decreased risk tolerance and worsening risk perceptions were the key factors behind reduced credit availability; these were partly offset by changes in regulation and a falling cost of funds. Standards are expected to ease, and business loan demand is expected to pick up remarkably, by the end of Q1/2021. Chart 10Canada Credit Conditions
Canada Credit Conditions
Canada Credit Conditions
Chart 11New Zealand Credit Conditions
New Zealand Credit Conditions
New Zealand Credit Conditions
On the consumer side, while standards for residential mortgages continued to tighten at an unchanged pace during the survey period, they are expected to ease going forward. As in Canada, house prices are at the forefront of the monetary policy discussion in New Zealand, which means that the expected easing in standards might actually pose a problem for the Reserve Bank of New Zealand. Meanwhile, although consumer loan demand did weaken over the survey period, it is expected to stage a recovery this quarter. This view is bolstered by a strong recovery in consumer confidence, which is working its way up to pre-pandemic levels. Shakti Sharma Research Associate ShaktiS@bcaresearch.com Appendix: Where To Find The Bank Lending Surveys A number of central banks publish regular surveys of bank lending conditions in their domestic economies. The surveys, and the details on how they are conducted, can be found on the websites of the central banks: US Federal Reserve: https://www.federalreserve.gov/data/sloos.htm European Central Bank: https://www.ecb.europa.eu/stats/ecb_surveys/bank_lending_survey/html/index.en.html Bank of England: https://www.bankofengland.co.uk/credit-conditions-survey/2020/2020-q4 Bank of Japan: https://www.boj.or.jp/en/statistics/dl/loan/loos/index.htm/ Bank of Canada: https://www.bankofcanada.ca/publications/slos/ Reserve Bank of New Zealand: https://www.rbnz.govt.nz/statistics/c60-credit-conditions-survey Footnotes 1 The weblinks to each individual survey for the US, euro area, UK, Japan, Canada and New Zealand can be found in the Appendix on page 12. 2 Please see BCA Research Global Fixed Income Strategy Report, "Introducing The GFIS Global Credit Conditions Chartbook", dated September 8, 2020, available at gfis.bcaresearch.com. 3 Please see BCA Research Foreign Exchange Strategy Special Report, "Will The Canadian Recovery Lead Or Lag The Global Cycle?", dated February 12, 2021, available at fes.bcaresearch.com. Recommendations The GFIS Recommended Portfolio Vs. The Custom Benchmark Index
GFIS Global Credit Conditions Chartbook Q1/2021: A Tentative Recovery
GFIS Global Credit Conditions Chartbook Q1/2021: A Tentative Recovery
Duration Regional Allocation Spread Product Tactical Trades Yields & Returns Global Bond Yields Historical Returns
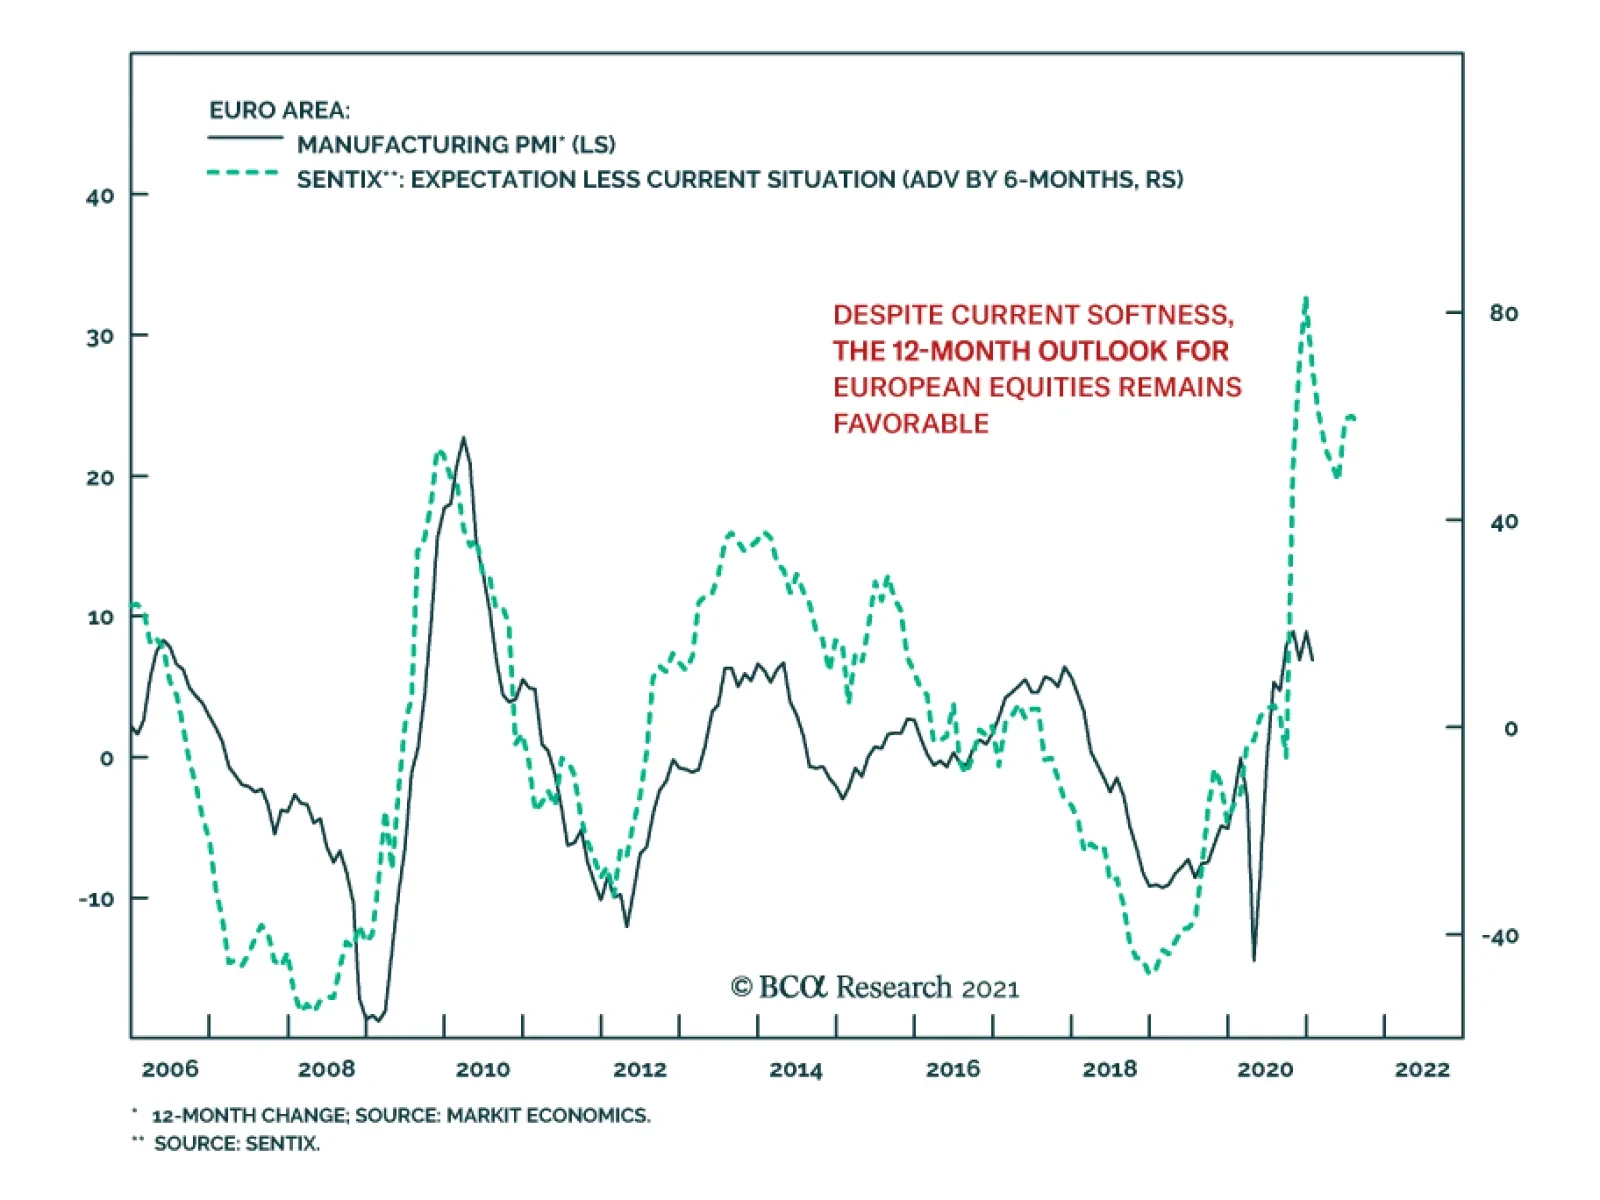
The February Sentix investor confidence index for the euro area was a miss. The headline index fell back below zero following its first positive reading in 10 months in November. At -0.2, the headline index disappointed consensus hopes of a rise further into…
Highlights For the month of February, our trading model recommends shorting the US dollar versus the euro and Swiss franc. While we agree a barbell strategy makes sense, we would rather hold the yen and the Scandinavian currencies. In the near term, we recommend trades at the crosses, given the potential for the dollar rally to run further. An opportunity has opened up to short the AUD/MXN cross. We are tightening the stop on our short EUR/GBP position to protect profits. We believe EUR/CHF still has upside. While the US has been labelling Switzerland a currency manipulator, the real culprit is Europe. Precious metals remain a buy. We are placing a limit sell on the gold/silver ratio at 70, after our initial target of 65 was touched. Platinum should also outperform in 2021. Remain long AUD/NZD, as the key drivers (relative terms of trade and cheap valuation) remain intact. Feature Currency markets are at a crossroads. On the one hand, news on the vaccine front continues to progress, raising the specter that we might return to normalcy sometime in the second half of this year. On the other hand, the current lockdowns are slowing down economic activity across the developed world, which is bullish for the dollar. With the DXY index up 1.4% this year, it appears near-term economic weakness is dominating the currency market narrative. Our long-term trade basket is centered on a dollar-bearish theme, but we have been shifting much focus in the near term to non-US dollar opportunities. Central to this has been our conviction that the dollar is due for a countertrend bounce, in an order of magnitude of 2%-4%.1 It appears we are already halfway there (Chart I-1). For the month of January, our trade recommendations outperformed the model allocation. Notable trades were being short gold versus silver and being short EUR/GBP. Silver in particular was a big winner in January (Chart I-2). Most emerging market currencies saw weakness, especially the Korean won, Russian ruble, and Brazilian real Chart I-1The Dollar Has Been Strong In 2021
Portfolio And Model Review
Portfolio And Model Review
Chart I-2Our FX Portfolio Did Well In January
Portfolio And Model Review
Portfolio And Model Review
For the month of February, our trading model recommends shorting the US dollar, mostly versus the euro and Swiss franc (Chart I-3 and Chart I-4). The model gets its signal from three variables: Relative interest rates (both levels and rates of change), valuation, and sentiment.2 While some of these variables have moved in favor the dollar, the magnitude of these moves has not been sufficient to trigger a model shift. We agree a barbell strategy makes sense. That said, we would rather hold the yen (as the safe haven, compared to the CHF) and the Scandinavian currencies (compared to the EUR). These are our two strategic positions, and we made the case for yen long positions last week. Chart I-3Our FX Model Remains ##br##Short USD...
Our FX Model Remains Short USD...
Our FX Model Remains Short USD...
Chart I-4...Especially Versus The Euro And Swiss Franc
...Especially Versus The Euro And Swiss Franc
...Especially Versus The Euro And Swiss Franc
Circling back to our trades at the crosses, we maintain that they should continue to perform well in February and beyond. We revisit the rationale behind these trades, as well as introduce a new idea: Short the AUD/MXN cross. Go Short AUD/MXN A tactical opportunity has opened up to go short the AUD/MXN cross. Central to this thesis are three catalysts: relative economic activity, valuation, and sentiment. The Australian PMI has rebounded quite strongly relative to that in Mexico, driven by the performance of the Chinese economy, versus that of the US economy. Australia exports mostly to China, while Mexico is heavily tied to the US economy. With the Chinese credit impulse rolling over, the US economy has been outperforming of late. If past is prologue, this will herald a lower AUD/MXN exchange rate (Chart I-5). Correspondingly, oil prices are outperforming metals prices. China is the biggest consumer of metals, while the US is the biggest consumer of oil. A higher oil-to-metal ratio is negative for AUD/MXN. Terms of trade between Australia and Mexico have been an important driver of the exchange rate (Chart I-5). China had a massive restocking of metals last year, much more than oil and natural gas. This implies that the destocking phase (should it occur) will be most acute among metal inventories (Chart I-6), suggesting oil imports into China could fare better than metals. On a real effective exchange rate basis, the Aussie is expensive relative to the Mexican peso. Historically, this has heralded a lower exchange rate (Chart I-7). Chart I-5AUD/MXN And Terms Of Trade
Portfolio And Model Review
Portfolio And Model Review
Chart I-6Chinese Destocking: From Crude Oil To Metals?
Chinese Destocking: From Crude Oil To Metals?
Chinese Destocking: From Crude Oil To Metals?
Chart I-7AUD/MXN Is ##br##Expensive
AUD/MXN Is Expensive
AUD/MXN Is Expensive
Back in 2020, when everyone was short the Aussie and long the MXN, being a contrarian paid off handsomely. Now, speculators are roughly neutral both crosses. Should the trends we are highlighting carry on into the next few months, this will be a powerful catalyst for speculators to jump on the bandwagon. We recommend opening a short AUD/MXN trade today, with a stop loss at 16.50 and an initial target of 13. Stay Short EUR/GBP Chart I-8An Asymmetry In Pricing
An Asymmetry In Pricing
An Asymmetry In Pricing
Our short EUR/GBP position is performing well, amidst a more hawkish Bank of England this week. Technically, there remains room for much downside on the cross. Real interest rates in the UK are rising relative to those in the euro area. The Brexit discount has not been fully priced out of the EUR/GBP cross, whereas broad US dollar weakness has eroded the discount in cable (Chart I-8). From a technical perspective, speculators are still very long the EUR/GBP, even though our intermediate-term indicator is nearing bombed-out levels (Chart I-9). Chart I-9EUR/GBP Still Has Downside
EUR/GBP Still Has Downside
EUR/GBP Still Has Downside
Finally, short EUR/GBP tends to benefit from an outperformance of oil prices. We will be revisiting the fair value of the pound in upcoming reports given the fundamental shifts that are happening in the post-EU relationship. For now, we are tightening stops on our short EUR/GBP position to 0.89, in order to protect profits. Remain Long NOK And SEK Chart I-10NOK Follows Oil Prices
NOK Follows Oil Prices
NOK Follows Oil Prices
The Scandinavian currencies are extremely cheap and an attractive bet for 2021. As such, we believe the recent relapse in their performance provides an opportunity for fresh long positions. For the NOK, a rising oil price is bullish, both against the EUR and USD (Chart I-10). Meanwhile, superior handling of the pandemic has buoyed domestic economic data in Norway. Both retail sales and domestic inflation have been perking up, pushing the Norges Bank to dial forward expectations of a rate lift-off. Sweden is also holding up relatively well this year. Part of the reason for this is that over the years, the drop in the Swedish krona, both against the US dollar and euro, has made Sweden very competitive. With our models showing the Swedish krona as undervalued by 13% versus the USD, there is much room for currency appreciation before financial conditions tighten significantly. The bottom line is that both Norway and Sweden are well positioned to benefit from a global economic recovery, with much undervalued currencies that will bolster their basic balances. We expect both the SEK and NOK to remain the best performers versus the USD in the coming year. Stay Long EUR/CHF While the US has been labelling Switzerland a currency manipulator, the real culprit is the euro area. To be clear, the SNB has been actively intervening in the currency markets. However, when one looks at relative monetary policy, the expansion in the ECB’s balance sheet far outpaces that of the SNB (Chart I-11). With the correlation between balance sheet policy and the exchange rate shifting, it may embolden Switzerland to intervene even more strongly in currency markets. Historically, the Swiss franc was buffeted by the global environment (improving global trade) and rising productivity in Switzerland. As a result, the SNB had no alternative but to try to recycle those excess savings abroad by lifting its FX reserves, or see even stronger appreciation of its currency. With global trade much more muted, intervention in the FX market could be a more potent headwind for the franc. Chart I-11The SNB Is More Hawkish Than The ECB
The SNB Is More Hawkish Than The ECB
The SNB Is More Hawkish Than The ECB
Chart I-12EUR/CHF And The Global Cycle
EUR/CHF And The Global Cycle
EUR/CHF And The Global Cycle
In the near-term, the risk to this trade is that safe-haven flows reaccelerate, as investors re-price risk. However, this will be a short-term hiccup. EUR/CHF is a procyclical cross and will benefit from improvement in the Eurozone economy relative to the rest of the world (Chart I-12). Meanwhile, by many measures, the Swiss franc remains expensive versus the euro. Stay Long AUD/NZD Chart I-13RBA QE Will Hurt AUD/NZD
RBA QE Will Hurt AUD/NZD
RBA QE Will Hurt AUD/NZD
The rally in the kiwi has provided an exploitable opportunity to lean against it. We remain long the AUD/NZD cross, despite the RBA stepping up the pace of QE at its latest meeting. The rationale is as follows: The balance sheet of the RBA was already lagging that of the RBNZ, so the latest move is simply catch up (Chart I-13). It has no doubt been negative for the cross, as Australia-New Zealand rates have compressed. However, when the program expires, the AUD will be subject to external forces once again. The Australian bourse is heavy in cyclical stocks, notably banks and commodity plays, while the New Zealand stock market is the most defensive in the G10. Should value outperform growth, this will favor the AUD/NZD cross. The kiwi has benefited from rising terms of trade, as agricultural prices have catapulted higher. Should a correction ensue, as we expect, this will favor NZD short positions. Our conviction on long AUD/NZD has clearly been hit with the RBA’s latest move. As such, we are tightening stops to 1.05 for risk management purposes. Stay Long Precious Metals, Especially Silver And Platinum We are placing a limit sell on the gold/silver ratio at 70, after our initial 65 target was hit. The rationale for the trade remains intact: In a world of ample liquidity and a falling US dollar, gold and precious metals are bound to benefit. However, silver has underperformed the rise in gold. The long-term mean for the gold/silver ratio is 50, providing ample alpha for this trade (Chart I-14). Chart I-14The Case For Short Gold Versus Silver
The Case For Short Gold Versus Silver
The Case For Short Gold Versus Silver
Silver is heavily used in the electronics and renewable energy industries, which are capturing the new manufacturing landscape. Silver faced resistance near $30/oz. However, this will be a temporary hiccup. The next important level for silver will be the 2012 highs near $35/oz. After this, silver could take out its 2011 highs that were close to $50/oz, just as gold did. Chester Ntonifor Foreign Exchange Strategist chestern@bcaresearch.com Footnotes 1 Please see our Foreign Exchange Strategy report, "Sizing A Potential Dollar Bounce," dated January 15, 2021. 2 Please see our Foreign Exchange Strategy report, "Introducing An FX Trading Model," dated April 24, 2020. Trades & Forecasts Forecast Summary Core Portfolio Tactical Trades Limit Orders Closed Trades
Highlights Italy looks like it will form a national unity coalition under Super Mario Draghi – though it is not yet a done deal. A snap election is still our base case, whether in 2021 or 2022, but the ECB will do “whatever it takes,” as will Draghi if he becomes Italy’s prime minister. Even if the right-wing populist parties win power in a snap election, their goal is to expand fiscal spending, not exit the Euro Area. And they would rule in a world where even Germany and Brussels concede the need for soft budgets. Go long BTPs versus German bunds, and Italian stocks versus Spanish stocks, on a tactical 3-6 month horizon. The structural outlook for Italy is still bearish until Italy can secure its recovery and launch structural reforms. Feature In 2016-17 we wrote two special reports on Italy under the heading of “Europe’s Divine Comedy.” In “Inferno” we focused on Italy’s structural flaws and in “Purgatorio” we explained why Italy would stay in the European Union. We have long awaited the chance to write the third installment, which must be called “Paradiso” in honor of Dante Alighieri. But the tragedy of the pandemic makes this title sadly inappropriate. The new government that is tentatively taking shape is not the solution to the country’s long-term problems either. Former European Central Bank President Mario Draghi is an excellent policymaker and would ensure that Italy does not add political chaos to its pandemic woes this year. A unity government under Draghi – which is not yet a done deal as we go to press – would be a tactical and even cyclical positive for Italian equity and bond prices but not a structural positive. The paradise of national revival will have to wait for a later date. In the meantime Italy’s performance will be dictated by its surroundings. The Black Death Italy suffered worse than the rest of Europe from COVID-19, judging both by deaths and the economic slump (Chart 1). It was the first western country to suffer a major outbreak. Outgoing Prime Minister Giuseppe Conte was the first western leader to impose a Chinese-style lockdown – which came as a shock for democratic populations unfamiliar with such draconian measures. Few will forget the terrifying moment in March when the military was deployed in Bergamo to help dispose of the bodies.1 Chart 1Italy's National Crisis
Italy's National Crisis
Italy's National Crisis
Chart 2Italy’s Unemployment Problem – Especially In The South
Europe's Divine Comedy III: Paradiso? Or Paradise Lost?
Europe's Divine Comedy III: Paradiso? Or Paradise Lost?
The crisis struck at an awkward time in Italian politics as well. Like the US and UK, Italy saw a surge of populism in the 2010s. Hostility toward the political elite arose largely in reaction to hyper-globalization, the adoption of the euro, and deep structural flaws that have engendered a sluggish and unequal economy: Poor demographics: Italy’s population peaked in 2017 and is expected to fall from 61 million to 31 million by the year 2100. Its fertility rate is 1.3, the lowest in the OECD except South Korea. It has the third smallest youth share of population (13%) and stands second only to Japan in elderly share of population (23%).2 North-South division: Southern Italy, the Mezzogiorno, is poorer, less educated, less efficient, and less well governed than northern Italy. Unemployment is 7 percentage points higher in the south than in Italy on average (Chart 2). In our “Inferno” report we concluded that regional divisions discourage exiting the Eurozone and EU, since southern Italy benefits from EU transfers and northern Italy would refuse to subsidize southern Italy without EU support (Chart 3). Chart 3EU Budget Allocations Favor Italy
Europe's Divine Comedy III: Paradiso? Or Paradise Lost?
Europe's Divine Comedy III: Paradiso? Or Paradise Lost?
Low productivity: Italy’s real output per hour has lagged that of its European peers as the country has struggled to adjust to globalization, digitization, aging, and emerging technologies (Chart 4). Chart 4Italy's Lagging Productivity
Italy's Lagging Productivity
Italy's Lagging Productivity
High debt: Italy’s debt-to-GDP ratio is expected to rise from to 134.8% to 152.6% by the year 2025, putting it on a higher-debt trajectory than even the worst case projections prior to the pandemic (Chart 5). Normally Italy runs a current account surplus and primary budget surplus, although the pandemic has pushed the country down the road of budget deficits (Chart 6). The debt problem is manageable as long as inflation is low and the ECB purchases Italian government bonds – which it will do in the interest of financial stability. But it sucks away growth and investment over time, a problem that will revive whenever the EU Commission tries to return to semi-normal fiscal policy restraints. Chart 5Italy’s Debt Pile
Europe's Divine Comedy III: Paradiso? Or Paradise Lost?
Europe's Divine Comedy III: Paradiso? Or Paradise Lost?
Chart 6Italy’s Budget Surplus Destroyed By COVID-19
Europe's Divine Comedy III: Paradiso? Or Paradise Lost?
Europe's Divine Comedy III: Paradiso? Or Paradise Lost?
Italy’s predicament can be illustrated simply by comparing the growth of GDP per capita over the past decade to that of Spain, which is a structurally comparable Mediterranean European economy and yet has generated a lot more wealth for its people after having slashed government spending and reformed the labor market and pension system in the wake of the debt crisis (Chart 7). Chart 7Spain Reformed, Italy Didn't
Spain Reformed, Italy Didn't
Spain Reformed, Italy Didn't
Structural reforms undertaken by the technocratic Mario Monti government in the wake of the sovereign debt crisis proved insufficient. Subsequent reform efforts went up in a puff of smoke when Matteo Renzi’s pro-reform constitutional referendum failed in 2016. Italy’s government is congenitally gridlocked because the lower and upper houses of the legislature have equal powers, like in the US, but its parliamentary governments can be easily toppled by either house. The 2016 constitutional reforms would have given the central government historic new powers to force through painful yet necessary structural changes – but centrist voters of different stripes hesitated to grant these new powers since they looked likely to go to populist parties on the brink of victory in the looming 2017 elections. The populists – the right-wing League in the north and the left-wing Five Star Movement in the south – did indeed come to power in 2017 but Italian’s political establishment subsequently restrained them from pursuing either serious euroskepticism or massive fiscal spending. Pro-establishment President Sergio Mattarella rejected any cabinet members who would attack the monetary union. Subsequent battles with Brussels and Germany prevented Italy from passing a blowout stimulus that challenged EU fiscal orthodoxy and threatened to precipitate a solvency crisis in the banking system. In 2019 the ambitious League broke with the Five Star Movement, which collaborated with the center-left Democratic Party to form a new coalition. But the resulting compromise government, its populism diluted, only managed one structural reform – to reduce the size of parliament – plus a moderate increase in government spending. The populist parties ended up being right about the need for more proactive fiscal policy, as Germany conceded in late 2019 and as COVID-19 lockdowns made absolutely necessary in early 2020. French President Emmanuel Macron and German Chancellor Angela Merkel agreed to launch a €750 billion EU Recovery Fund that enabled jointly issued debt for EU members, solidifying a proactive fiscal turn in the bloc. Italy now has €209 billion coming its way. This is a boon for the recovery, though it is also the origin of the politicking that brought down the ruling coalition last month. With central banks monumentally dovish, European and American fiscal engines firing on all cylinders, and China’s 2020 stimulus still coursing through the world’s veins, the macro backdrop is positive for Italy. But with Italy’s economy still shackled by fundamental flaws, it will not be a lead actor or an endogenous growth story. Bottom Line: Italy missed the chance in the 2010s to undertake structural reforms that could lift productivity and potential growth. Now it is struggling to maintain political order in the wake of a devastating pandemic and recession. The vaccine and global recovery will lift Italian assets but the future remains extremely uncertain, given the eventual need to climb down from extreme stimulus and impose painful structural reforms. Paradiso? Or Paradiso Perduto? The latest political turmoil arose over the EU Recovery Fund and how Italy will spend the €209 billion allotted to it, as well as the €38.6 billion allotted to the country under the EU’s structural budget for 2021-28. Ostensibly Matteo Renzi pulled his Italia Viva party out of the ruling coalition because he feared that former Prime Minister Conte, together with his economy and industry ministers, would spend the funds on short-term vote-winning handouts rather than long-term structural fixes in health, education, and culture. But Renzi was not appeased when Conte offered to spend more on health and education as requested. Renzi’s party fares poorly in opinion polls and the recent electoral reforms were not favorable to it, so he can hardly have wanted a new election. He wanted Italy to tap €36 billion from the European Stability Mechanism in addition to taking EU recovery funds, since this would come with strings attached in the form of structural reform. He apparently wanted to precipitate a new pro-establishment coalition. President Mattarella’s appointment of Mario Draghi to lead a national unity coalition is the solution. But as we go to press it is not certain that Draghi will be able to command a majority in parliament. Chart 8Salvini's League Lost Steam But Populist Right Still Powerful
Salvini's League Lost Steam But Populist Right Still Powerful
Salvini's League Lost Steam But Populist Right Still Powerful
Matteo Salvini and the League are the pivotal players now. Salvini and his party suffered loss of popular support in 2019 as a result of his ambitious attempt to break from the government, force new elections, and rule on its own. The party especially suffered from the pandemic, which hit its base of voters in Lombardy hard and sent voters in support of the central government as well as the political establishment (Chart 8). Salvini must now decide whether to try to rebuild his status by joining Draghi in the national interest, to show he can be a team player, albeit at risk of being seen as an institutional politician. If so, he would cede the right-wing anti-establishment space to his partner Giorgia Meloni, who leads the Brothers of Italy, which has eaten up all the support Salvini has lost since the European parliament election of 2019. What is clear is that his current strategy is not working, and he played ball with the big boys during the 2017-19 period, so we would not rule him out of a Draghi government. If Draghi does not win over Salvini and the League, he would need to win the support of the Five Star Movement to form a coalition. The party’s leaders initially said they would not join Draghi, who epitomizes the establishment of which they are sworn enemies. Yet Five Star has not lost any popular support for working with the conventional Democratic Party, in stark contrast with the League, which stayed ideologically pure but lost supporters. Some Five Star members, including Foreign Minister Luigi Di Maio, former leader of the party, want to work with Draghi and stay in government. Hence the party could still join Draghi, or it could break apart with some members defecting. It would require 33% of Five Star members in the Chamber of Deputies and 28% of Five Star members in the Senate to join Draghi to give him a majority, assuming the League and Brothers of Italy refuse to cooperate (Table 1). Interestingly, if the League is absent from the vote, and all parties other than the Brothers and Five Star join Draghi, then he could also form a government. This would give cover to the League under the pretense of COVID vigilance, without being seen as actively preventing a government formation. Table 1'Whatever It Takes' To Build A National Unity Coalition Under Super Mario Draghi
Europe's Divine Comedy III: Paradiso? Or Paradise Lost?
Europe's Divine Comedy III: Paradiso? Or Paradise Lost?
We have favored an early election and this could still occur. If there is an election it will happen before June because an election cannot happen within the last six months of the current president’s term, as per Article 88 of the Constitution. If Italy avoids a snap election till June, political stability is ensured at least till January. The pandemic was the justification for avoiding a snap election but the pandemic did not prevent the regional elections or constitutional referendum in September. The referendum was a hurdle that needed to be cleared before the next election, so now the way is open. All of the parties are greedily eying the presidency, with President Mattarella’s seven-year term set to expire next January. Mattarella has emerged as a staunch defender of the establishment and a check on anti-establishment parties. If the populists gain a plurality prior to January, then they can try to get a more sympathetic or neutral policymaker in that position. By contrast, the pro-establishment parties are hoping that a Draghi coalition can last long enough to ensure that one of their own holds that post. Since the latter need either the League or Five Star to govern, they would have to compromise on the next president – which is a very big concession. In distributing EU recovery funds, there is little doubt that a unity government under Draghi would be a credible way of proceeding. Draghi has joined other central bankers, like the Fed’s Janet Yellen, in voicing strong support for fiscal policy to get the developed democracies out of their current low-growth morass. He would have the authority and expertise to direct spending to productivity-enhancing projects at home while working with Brussels to allow Italy the greatest possible flexibility. Italy’s portion of EU recovery funds is shown in Chart 9, with the black bar indicating the part consisting of loans. The sector breakdown of total EU recovery fund is shown in Table 2. Chart 9Italy’s Fiscal Stimulus To Receive EU Top-Up
Europe's Divine Comedy III: Paradiso? Or Paradise Lost?
Europe's Divine Comedy III: Paradiso? Or Paradise Lost?
Table 2Composition Of EU Recovery Fund By Economic Sector
Europe's Divine Comedy III: Paradiso? Or Paradise Lost?
Europe's Divine Comedy III: Paradiso? Or Paradise Lost?
Yet a Draghi government is not a permanent solution to Italy’s political crisis or its economic malaise. Currently the political parties are squabbling over how to distribute a windfall of special funds – Italy is benefiting from a more pragmatic EU policy as it emerges from a crisis. But in future the parties will be fighting over what to do when the funds are spent. Even if the EU continues to be generous the stimulus will decelerate, while structural reforms will have to be attempted yet again. A technocratic Draghi government would be well positioned to institute the reforms that Italy needs but the economic medicine could sow the seeds for another voter backlash – in which case the anti-establishment right would be in prime position. This would set up a giant clash with Germany and Brussels. Italy, The EU, And Global Power Politics Geopolitically, Italy matters because it is a test of whether the European Union will continue consolidating power within its sphere of influence. If Draghi can form a unity government, oversee economic recovery and long-delayed structural reforms, and survive to reap the benefits at the voting booth, it would mark a historic victory for the EU as it lurches from crisis to crisis in pursuit of deeper integration and ever closer union. The Italian question would effectively be resolved and the EU would have the capacity to handle other challenges elsewhere. Europe’s geopolitical coherence is critical for global geopolitics as well. Europe is the prime beneficiary of US-China competition – at least until such time as it is forced to choose sides. Since Europe is a great power, it can remain neutral for a long time, using America as a stick against Chinese technology theft while expanding market share in China as it diversifies away from the United States (Chart 10). Chancellor Merkel has already signaled to Biden that she is not eager to join any “bloc” against China. Biden will have to devote a massive diplomatic effort to convince the Europeans, who are not as concerned about China’s military and strategic threat, that it is necessary to form a grand alliance toward containing China’s rise. Chart 10EU Balances Between US And China
Europe's Divine Comedy III: Paradiso? Or Paradise Lost?
Europe's Divine Comedy III: Paradiso? Or Paradise Lost?
The EU’s efforts to carve out a sphere of influence have momentum. The German and EU approach to fiscal policy has become more dovish and proactive, a concession to the southern European economies that will improve their support for the European project. Across the Atlantic the EU states see President Trump’s rise and fall as a story of America’s declining influence, which improves the EU’s authority over its own populace, and yet has not resulted in an American-imposed trade war that would undermine the recovery. To the east, EU states see Russian authoritarianism and its discontents, which reinforce the public’s commitment to democratic values and the single market. To the north, they see the negative example of Brexit, which continues to plague the UK, with Scotland pushing for independence again. To the south, Europeans have become less concerned about illegal immigration, having watched the inflow of migrants from Turkey, the Middle East, and North Africa fall sharply – at least until the next major regime failure in these regions causes a new wave of refugees (Chart 11). These events have encouraged various countries to fall in line behind the consensus of European solidarity and geopolitical independence. A technocratic government in Italy would reinforce these trends but a populist government would not be able to avoid or override them. Chart 11Europe Less Concerned About Refugees (For Now)
Europe Less Concerned About Refugees (For Now)
Europe Less Concerned About Refugees (For Now)
Chart 12Italian Euroskeptics Constrained By Public Opinion
Europe's Divine Comedy III: Paradiso? Or Paradise Lost?
Europe's Divine Comedy III: Paradiso? Or Paradise Lost?
The Italian populist parties are still in the ascent but they do not seek to exit the EU or monetary union (Chart 12). We fully expect Italy to see snap elections in 2022 if not 2023, given the fragility of any new coalition to emerge today. If the right-wing League and Brothers should win control of government, and clash with Germany and Brussels, they would still operate within an environment circumscribed by these geopolitical limitations. Otherwise greater solidarity gives the EU greater room for maneuver among the US, China, and Russia. Investment Takeaways In the short run, the Draghi government is bullish for Italian assets. If Draghi fails and snap elections are called, the downside to European equities and the euro is limited, since any risk of an Italian exit from the EU dissipated back in 2016-18. Past turmoil resulted in higher Italian bond yields and wider spreads between BTPs and German bunds because markets had to price in the risk that the Euro Area would break up. We have long highlighted that this risk was overstated and markets are well aware of that by now. The market’s muted reaction to this latest kerfuffle proves the point (Chart 13). Chart 13Markets Unimpressed By Italian Political Turmoil
Markets Unimpressed By Italian Political Turmoil
Markets Unimpressed By Italian Political Turmoil
On overweight stance toward Italian government bonds has been one of the highest conviction calls of our fixed income strategist, Rob Robis, over the past year. He expects that Italian bond yields (and spreads over German debt) will converge to Spanish levels, thus restoring a relationship last seen sustainably in 2016. He also notes that the ECB is willing to use quantitative easing to support Italy when its politics inject a risk premium into government bonds and spreads widen. The central bank is also providing additional support to Italy via cheap bank funding (TLTROs) that helps limit Italian risk premia at a time when underlying credit growth is exceedingly weak. During the height of the COVID lockdowns last year, the ECB increased its buying of Italian bonds higher than levels implied by its Capital Key weighting scheme, which officially governs bond purchases. Once Italian yields fell back to pre-pandemic levels, the ECB slowed the pace of purchases to levels at or below the Capital Key weights. As long as the pandemic lingers, the ECB will have the ability and pretext to ensure that Italian spreads do not rise too high (Chart 14). Chart 14Overweight Italian Government Bonds
Overweight Italian Government Bonds
Overweight Italian Government Bonds
True, investors may be more reluctant to drive Italian yields and spreads to new lows as long as there is a risk of elections this year or next that could bring anti-establishment leaders to power and trigger an increase in Italian political risk premia. But this trap between politics and QE still justifies an overweight stance within global bond portfolios, as Italian yields will remain too attractive for investors to ignore given the puny levels of alternative sovereign bond yields available elsewhere in the Euro Area. Go tactically long Italian BTPs relative to German bunds. Italian stocks have seen a long and dreary downtrend versus global stocks, whether relative to developed or emerging markets, including or excluding the US and China. However, they are trading at a heavy discount in terms of price-to-book and price-to-sales metrics and a Draghi government to direct stimulus funding is doubly good news. Italian stocks have rebounded against Spanish equities since 2017 – as have Italian banks versus Spanish banks. Italian non-performing loans declined from a peak of €178 billion in 2015 to €63 billion in 2020. The banks raised enough equity capital to cover these NPLs. Since banks form a significant part of the Italian bourse, an improvement in bank balance sheets would be positive for the overall market. A Draghi government would reinvigorate this tendency, especially if it credibly commits to structural reforms that elevate potential growth. Spain’s structural reforms are priced in and it is next in line for a post-COVID political shakeup (Chart 15). Go tactically long Italian stocks relative to Spanish. While a Draghi coalition is marginally positive for the euro there are several factors motivating the dollar’s counter-trend bounce in the near term (Chart 16). US and Eurozone growth are diverging, with the EU struggling to roll out its COVID vaccine while the US prepares to pile a new $1.5-$1.9 trillion fiscal stimulus on top of the unspent $900 billion stimulus passed at the end of last year. Chart 15Italian Stocks Have Upside Versus Spanish
Italian Stocks Have Upside Versus Spanish
Italian Stocks Have Upside Versus Spanish
Chart 16Wait For Geopolitical Risk To Clear Before Shorting USD-EUR
Wait For Geopolitical Risk To Clear Before Shorting USD-EUR
Wait For Geopolitical Risk To Clear Before Shorting USD-EUR
Over the long run, a Draghi government provides limited upside with regard to Italian assets. The new coalition serves to avoid an election, not enable structural reform. An unstable ruling coalition will lose support over time in what will be a difficult post-pandemic environment. An early election and anti-establishment victory are not unlikely, if not in 2021 then in 2022 when Italy faces a falling stimulus impulse and the need for painful reforms. For now the truly bullish development is Germany’s dovish shift on fiscal policy rather than any temporary sign of Italian political functionality. Dysfunction can return to Italy fairly quickly but an accommodative Germany is hard to be gotten. Hence Italy’s biggest political risks will come if populist parties win full control of government in the next election while Germany and Brussels seek to normalize fiscal policy and impose some semblance of restraint in the wake of the crisis. It is also possible that a new economic shock or wave of immigration could bring Italy’s populists not only to take power but to rediscover their original euroskepticism. Thus any preference for Italian assets should be seen as a cyclical play on global growth and European solidarity and reflation – not a structural play on Italy’s endogenous strengths. Last week we shifted to the sidelines of the stock rally due to our concern that political and geopolitical risks have fallen too much off the radar. The Biden administration faces tests over China/Taiwan and Iran/Israel. Biden’s tax hikes will come into view soon. Chinese policy tightening is also a concern, even for those of us who do not expect overtightening. These factors pose downside risk to bubbly global stock markets in the near term. Matt Gertken Vice President Geopolitical Strategy mattg@bcaresearch.com Footnotes 1 Angela Giuffrida and Lorenzo Tondo, "‘A generation has died’: Italian province struggles to bury its coronavirus dead," The Guardian, March 19, 2020, theguardian.com. 2 See Stein Emil Vollset et al, "Fertility, mortality, migration, and population scenarios for 195 countries and territories from 2017 to 2100: a forecasting analysis for the Global Burden of Disease Study," The Lancet, July 14, 2020, thelancet.com.
Highlights GameStop & Bond Yields: The reflationary conditions that helped create a backdrop highly conducive to the wild stock market speculation on display last week – namely, aggressive monetary and fiscal policy stimulus to fight the pandemic – remain bearish for global government bonds and bullish for risk assets like global corporate credit. Remain overweight the latter versus the former. Italy: The latest bout of political uncertainty in Italy has only paused the medium-term spread compression story for BTPs versus core European government bonds, for two reasons: a) this political battle has, to date, had far less of the fiscal populism and anti-Europe flavor of past conflicts; and b) the ECB has shown that it will aggressively use its balance sheet to prevent a spike in Italian bond yields. Maintain an overweight stance on Italy in global bond portfolios, even with early elections likely later this year. Feature Dear Client, The next Global Fixed Income Strategy publication will be a Special Report on Canada, jointly published with our colleagues at Foreign Exchange Strategy on Friday, February 12. We will return to our regular publishing schedule on Tuesday, February 16. Rob Robis, Chief Global Fixed Income Strategist Chart of the WeekExpect More Bubbles & GameStop-Like Silliness
Expect More Bubbles & GameStop-Like Silliness
Expect More Bubbles & GameStop-Like Silliness
The “Reddit Retail Revolution” has exposed the dangers of staying too long in crowded short positions for equities like GameStop, but bond markets were unfazed by the wild moves in stocks last week. US Treasury yields actually crept upwards as the mother of all short squeezes became the top news story in America. Corporate credit spreads worldwide were essentially unchanged, despite the pickup in US equity volatility measures like the VIX. Bond investors recognize that, while the sideshow of rebel traders taking on mighty hedge funds makes for great theater, the underlying reflationary global policy backdrop remains the main driver of global bond yields and credit risk premia (Chart of the Week). Global fiscal policy risks are increasingly tilted towards more stimulus than currently projected, even as the pace of new COVID-19 cases is starting to slow in the US and much of Europe. Vaccine rollouts in many countries are going far slower than expected, which has forced global central banks to commit to maintaining highly accommodative policies - zero interest rates, quantitative easing (QE) and cheap bank funding – for longer. As Fed Chair Jerome Powell noted in his press conference following last week’s FOMC meeting, “There’s nothing more important to the economy now than people getting vaccinated.” Chart 2Vaccine Rollout Critical For Fed/ECB/BoE Policy
The Revolution Will Be Monetized
The Revolution Will Be Monetized
On that front, the largest economies on both sides of the Atlantic continue to perform poorly. According to data from the Duke Global Health Innovation Center, vaccination coverage (defined as actual vaccination doses acquired on a per person basis) in the US, UK and European Union remains low relative to the intensity of COVID-19 cases within the population (Chart 2) – especially compared to the experience of other major Western countries.1 As we discussed in last week’s report, it is far too soon for investors to fear a hawkish move by global central banks towards tapering asset purchases and signaling future interest rate hikes.2 The GameStop episode may cause some policymakers to worry about the financial stability risks resulting from cheap money policies, but not before the greater risks to global growth from the COVID-19 pandemic are contained. Until vaccination rates rise to levels where there is the potential for herd immunity to be reached, central banks will have little choice by to maintain 0% (or lower) policy rates for longer with continued expansion of their balance sheets (Chart 3). Policy makers will even likely respond with more QE in the event of broad financial market turmoil occurring before inflation expectations return to central bank targets (Chart 4). Chart 3Expect More Global QE ...
The Revolution Will Be Monetized
The Revolution Will Be Monetized
Chart 4...To Moderate Reflationary Pressure On Bond Yields
...To Moderate Reflationary Pressure On Bond Yields
...To Moderate Reflationary Pressure On Bond Yields
We continue to recommend the following medium-term positioning for reflation-based themes in global fixed income markets: below-benchmark overall duration exposure, favoring lower-quality corporate bonds versus government debt, and underweighting US Treasuries within global government bond portfolios. Bottom Line: The reflationary conditions that have helped create a backdrop highly conducive to the wild stock market speculation on display last week – namely, aggressive monetary and fiscal policy stimulus to fight the pandemic – remain bearish for global government bonds and bullish for risk assets like global corporate credit. Italy: ECB Policy Trumps Political Uncertainty One of our highest conviction fixed income investment recommendations over the past year has been to overweight Italian government bonds (BTPs). We have maintained that bullish stance with an expectation that Italian bond yields (and spreads over German debt) would converge to the levels of Spain, restoring a relationship last seen sustainably in 2016 (Chart 5). Chart 5A Small Response To Italian Political Uncertainty
A Small Response To Italian Political Uncertainty
A Small Response To Italian Political Uncertainty
The recent collapse of the coalition government of Prime Minister Giuseppe Conte would, in a more “normal” time, represent a serious threat to the stability of the Italian bond market and our bullish view. Yet the response so far has been muted, with the spread between 10-year BTPs and German Bunds up only 11bps from the mid-January lows. The current political drama stemmed from a disagreement within the ruling coalition over how the government was planning to use Italy’s share of the €750bn EU Recovery Fund. As we go to press, the survival of the current government hangs in the balance, with President Sergio Mattarella testing whether the political parties can form a government with a majority. The initial announcement of that Recovery Fund was considered to be a major reason for a reduced risk premium on Italian government bonds, as it represented a potential step towards greater fiscal integration within Europe. Unfortunately, it took the COVID-19 crisis to get the rest of Europe to offer help to the more economically fragile countries like Italy. The country suffered one of the world’s worst initial waves of the virus and the late-2020 surge has also hit hard – although, more recently, Italy has fared far better than Southern European neighbors Spain and Portugal with a slower pace of new cases and hospitalizations (Chart 6). Italy’s economy has struggled under the weight of some of the most stringent restrictions on activity within Europe to stop the spread of the virus, according to the Oxford COVID-19 database (Chart 7). Domestic spending on retail and recreation activities is estimated to be down nearly 50% from the start of the pandemic, a hit to the economy made worse by the collapse of tourism revenue that will take years to fully recover. In other words, Italy desperately needs the money from the EU Recovery Fund. Chart 6Italy's COVID-19 Situation Is Slowly Improving
Italy's COVID-19 Situation Is Slowly Improving
Italy's COVID-19 Situation Is Slowly Improving
Chart 7A Big Economic Hit To Italy From COVID-19
A Big Economic Hit To Italy From COVID-19
A Big Economic Hit To Italy From COVID-19
Former Prime Minister Matteo Renzi and his Italia Viva party precipitated the crisis by withdrawing their support from Conte’s coalition, but are in a weak position electorally. They claim that the funds should be handled by parliament, rather than a technocratic council overseen by Conte, and devoted to long-term structural reform rather than short-term fixes. Renzi’s withdrawal from the ruling coalition, however, is not grounded in substantial disagreements over fiscal spending: First, the EU recovery fund requires all member states to use 30% of the funds on climate change initiatives and 25% on digitizing the economy, and none of the major parties oppose this use of the €209 billion coming their way. Second, Prime Minister Conte adjusted his spending plans, nearly doubling the allocations for health, education, and culture, in response to Renzi’s criticisms that not enough spending focused on structural needs. Third, Renzi wants to tap €36 billion from the European Stability Mechanism in addition to taking recovery funds, but this would come with austerity measures attached (which is self-defeating) and would be opposed by the left-wing populist Five Star Movement, a linchpin in the ruling coalition. Even if the immediate political turmoil passes, there will still be an elevated risk of an early election as the various parties jockey for power in the wake of the cataclysmic pandemic, and as they eye control of the presidency, which is up for grabs in 2022. The only real change on the fiscal front would come if the populist League and Brothers of Italy ended up winning a majority and control of government in the eventual elections, as they favor much greater fiscal largesse. It is possible that Conte will survive as his personal support has increased throughout the crisis. Otherwise, former ECB President Mario Draghi could replace him, although he is now less popular than Conte. President Mattarella is not eager to dissolve parliament given that the combined strength of right-wing anti-establishment parties is greater than that of the centrist and left-wing parties in the ruling coalition judging by public opinion polls (Chart 8). Yet sooner rather than later, a new election looms. The country already completed an electoral reform via a referendum in September 2020 that cleared the way for a new election to be held. Chart 8Unstable Coalition Wants To Delay Election As Populist Right Slightly Ahead
Unstable Coalition Wants To Delay Election As Populist Right Slightly Ahead
Unstable Coalition Wants To Delay Election As Populist Right Slightly Ahead
Chart 9Waning Immigration Undercuts Italian Populists (For Now)
The Revolution Will Be Monetized
The Revolution Will Be Monetized
The current crisis is different than past bouts of Italian political uncertainty as there is less of a question over Italy’s commitment to the euro - which in the past has resulted in higher Italian bond yields and wider BTP-Bund spreads as markets had to price in euro breakup risk. The current coalition, and any new coalition cobbled out of the current morass to prevent a snap election, are united in their opposition to the populist League and the Brothers of Italy. They will strive to remain in power to distribute the EU recovery funds and secure the Italian presidency for an establishment political elite – one, like Mattarella, who will act as a check on the power of any future populist government and its cabinet choices, just as Mattarella himself hobbled the League’s most radical proposals from 2018-19. Chart 10Italian Support For EU & The Euro Sufficient But Not Ironclad
The Revolution Will Be Monetized
The Revolution Will Be Monetized
While the right-wing “sovereigntist” parties lead in the opinion polls, the League has lost support since its leader Matteo Salvini’s failed bid to trigger an election in August 2019 and especially since the COVID-19 outbreak has boosted the establishment parties and coalition members. Anti-immigration sentiment, a key support of this faction, has subsided as the EU has cut down the influx of immigrants (Chart 9). Salvini and his supporters have also compromised their euroskepticism to appeal to a broader audience as 60% of the populace still approves of the euro – although this support is falling again and bears monitoring (Chart 10). Another economic shock or a new wave of immigration could put the right-wing populists into power. Moreover, an unstable ruling coalition will lose support over time in what will be a difficult post-pandemic environment. Thus, the risk of euroskepticism and fiscal populism will persist over the coming two years, even though they are most likely contained at the moment. Has The ECB Removed The Tail Risk Of BTPs? The ECB has shown they are willing to use their balance sheet via QE and cheap bank funding tools like TLTROs to support the euro area’s weakest link – Italy. Thus, any upward pressure on Italian bond yields/spreads from the current political fracas will almost certainly be met by a more aggressive ECB response (more QE for longer, new TLTROs), limiting the damage to the Italian bond market. Chart 11What Would Italian Loan Growth Be WITHOUT ECB Support?
What Would Italian Loan Growth Be WITHOUT ECB Support?
What Would Italian Loan Growth Be WITHOUT ECB Support?
The ECB’s TLTROs appear to have been helpful for Italy, whose LTRO allotments represent 14.7% of total bank lending (Chart 11). Yet Spanish banks have relied on cheap ECB funding to a similar degree, while the growth of bank lending in Italy has substantially lagged that of Spain since the start of the pandemic in 2020 – even with Italy having less restrictive lending standards according to the ECB’s Bank Lending Survey. The ECB has also helped Italy by being more flexible with its purchases of Italian government bonds within both the Public Sector Purchase Program (PSPP) and the Pandemic Emergency Purchase Program (PEPP) that began in response to COVID-19. ECB data show that, after the worst days of the COVID-19 market rout last spring when the 10-year Italian bond yield soared from 1% to 2.4% over just three weeks, the ECB increased the Italy share of its bond buying to levels well above the Capital Key weighting scheme that “officially” governs the bond purchases. This was true within both the PSPP (Chart 12) and the PSPP (Chart 13). Chart 12ECB Paying Less Attention To The Capital Key In The PSPP ...
The Revolution Will Be Monetized
The Revolution Will Be Monetized
Chart 13… And The PEPP
The Revolution Will Be Monetized
The Revolution Will Be Monetized
Chart 14Stay Overweight Italian Government Bonds
Stay Overweight Italian Government Bonds
Stay Overweight Italian Government Bonds
The ECB’s actions helped stabilize Italian bond yields, sowing the seeds of the major decline in yields that took place between April and September. Once Italian bond yields fell back to pre-pandemic levels, the ECB slowed the pace of its purchases of Italian bonds to levels at or below the Capital Key weights. Thus, the ECB was willing to deviate from its own self-imposed rules for its bond purchase schemes in order to ease financial conditions in Italy during a pandemic. There is no reason to believe that would not occur again if yields rise because of a growing political risk premium while the pandemic was still raging. A prolonged period of political uncertainty in Italy, especially one that ends with fresh elections, could even force the ECB to maintain or extend its full current mix of policies and not just QE. For example, a new TLTRO could be initiated later this year, or the subsidized cost of banks borrowing from existing TLTROs could be reduced further, all in an effort to help boost Italian lending activity. More likely, the PEPP could be expanded in size or extended beyond the current March 2022 expiration, or the PSPP could be upsized to allow for more purchases of Italian debt (Chart 14). From an investment strategy perspective, there is still a strong case for overweighting Italian government bonds in global fixed income portfolios, even with the current political uncertainty. The weight of ECB policy actions removes much of the usual upside risk to BTP yields. However, investors will likely be more reluctant to drive Italian yields (and spreads versus Germany) to fresh lows if there is a risk of early elections, as we expect. Italian bonds are now more of a pure carry with yields trapped between politics and QE, but that still justifies an overweight stance - especially given the puny levels of alternative sovereign bond yields available elsewhere in the euro area. Bottom Line: The latest bout of political uncertainty in Italy has only paused the medium-term spread compression story for BTPs versus core European government bonds, for two reasons: a) this political battle has, to date, had far less of the fiscal populism and anti-Europe flavor of past conflicts; and b) the ECB has shown that it will aggressively use its balance sheet to prevent a spike in Italian bond yields. Maintain an overweight stance on Italy in global bond portfolios, even with early elections likely later this year. Robert Robis, CFA Chief Fixed Income Strategist rrobis@bcaresearch.com Matt Gertken Vice President Geopolitical Strategy mattg@bcaresearch.com Footnotes 1 The Duke Global Health Innovation Center data on COVID-19 can be found here: https://launchandscalefaster.org/COVID-19. 2 Please see BCA Research Global Fixed Income Strategy Report, "A Pause, Not A Peak, In Global Bond Yields", dated January 26, 2021, available at gfis.bcaresearch.com. Recommendations The GFIS Recommended Portfolio Vs. The Custom Benchmark Index
The Revolution Will Be Monetized
The Revolution Will Be Monetized
Duration Regional Allocation Spread Product Tactical Trades Yields & Returns Global Bond Yields Historical Returns
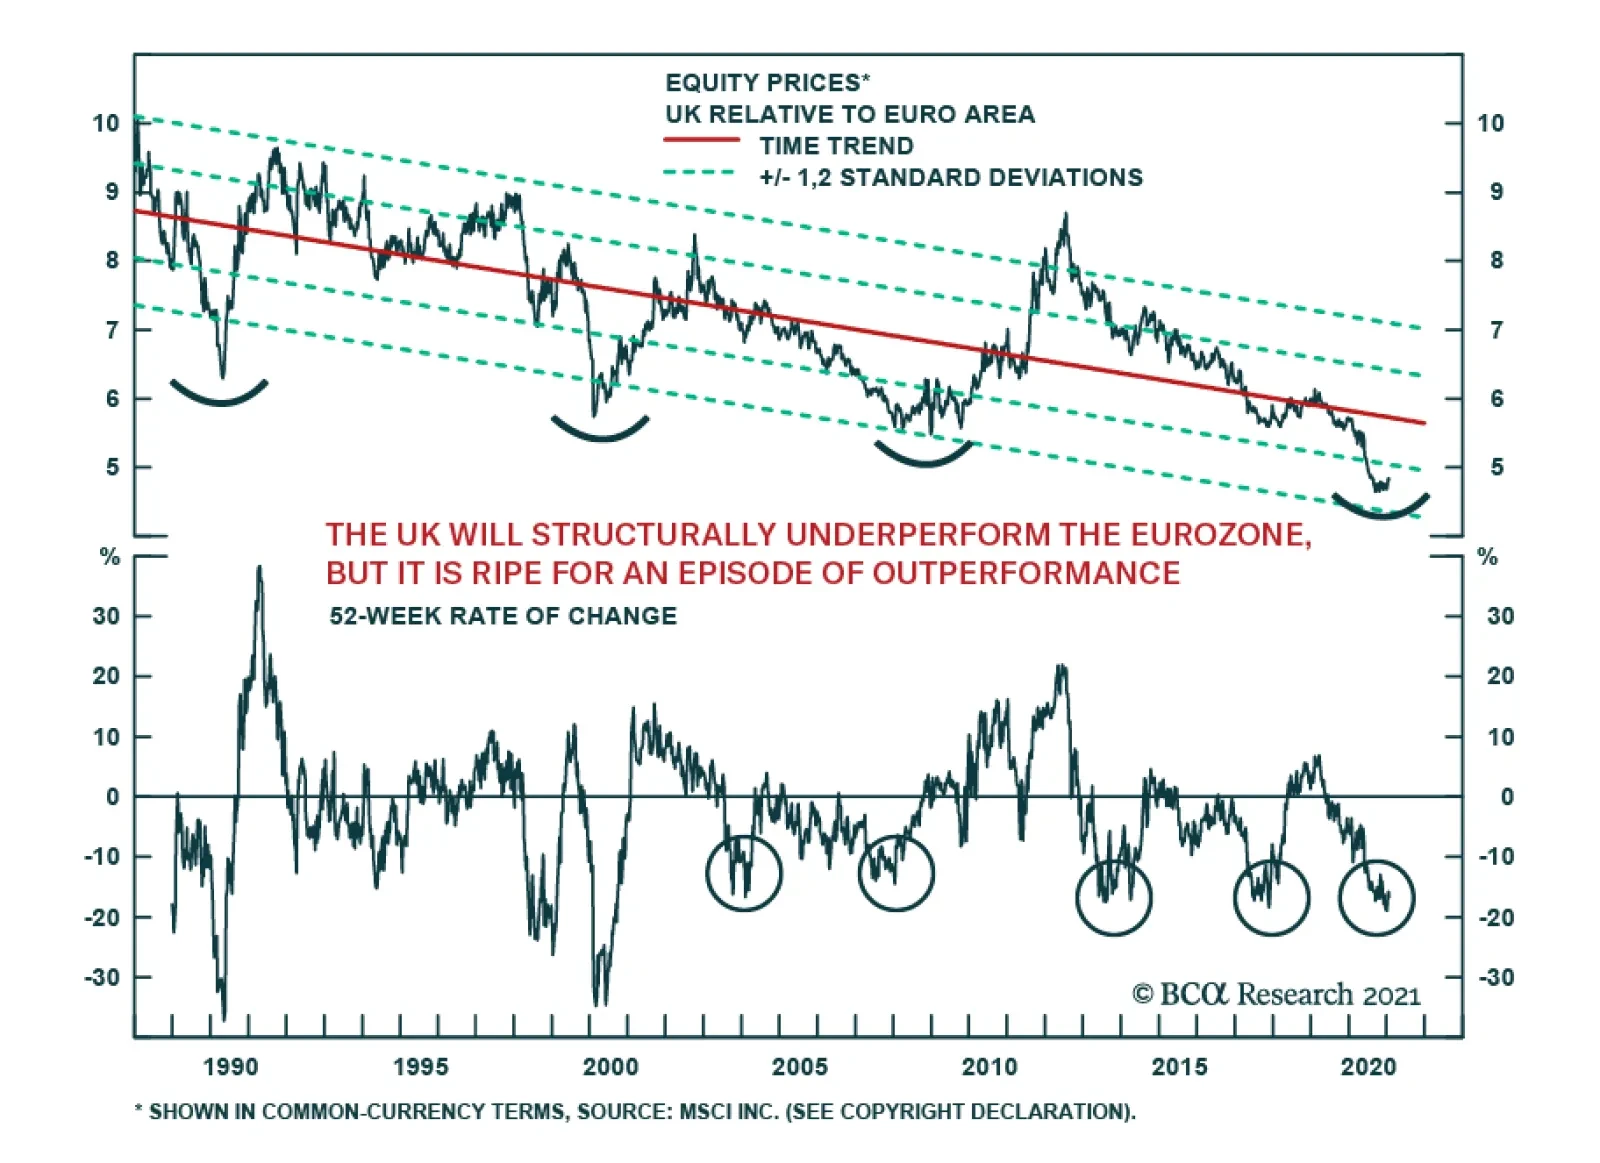
While it is well known that UK equities have been in a secular downtrend against the US, it is often less appreciated that they have greatly underperformed euro area stocks for the past 32 years. There is little reason to believe that the secular…
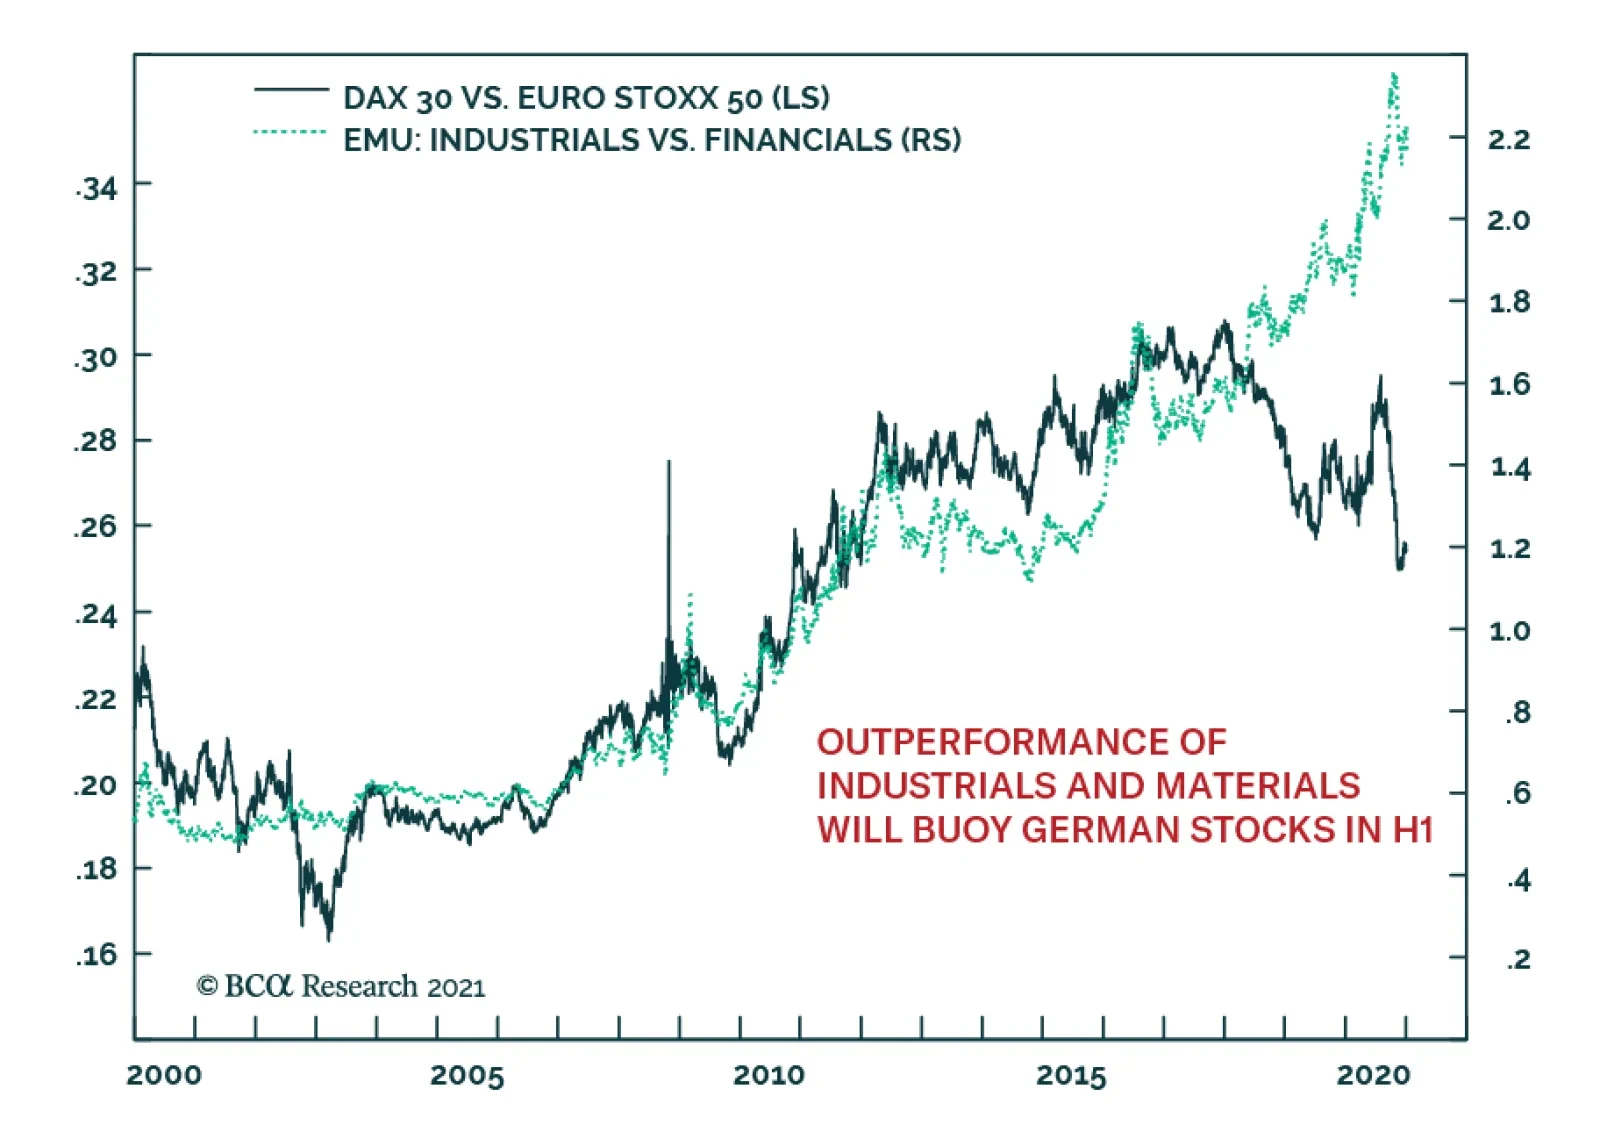
After bottoming in Q4, the German DAX is rallying and outperforming the Euro Stoxx 50 in the process. While the near-term is muddled by the pandemic’s resurgence, the global manufacturing recovery this year will ultimately benefit the German economy and…