Euro Area

Highlights There is some evidence that the euro could gravitate to 1.50 over the next few years. The key assumption is that the equilibrium rate of interest will rise in the euro area relative to that in the US. Our bias is that fair value for the euro is closer to 1.35, or 15% above current levels. Over the very near term, the risks are tilted towards the downside. But while EUR/USD could punch below 1.15, an undershoot towards parity is highly unlikely. In our FX portfolio, we are long EUR/CHF and short EUR/GBP. We would buy the euro outright below 1.15. Feature The markets have rejoiced at the success of a few vaccine trials and are looking forward to a return to normalcy in 2021. Around the world, equity markets have rallied in symphony. Even secular dogs such as the Japanese Nikkei, which has been in a relative bear market for many decades, broke to fresh 21-year highs. Copper prices are rising fervently, and measures of risk, such as the VIX index or high-yield corporate spreads, are collapsing to pre-pandemic levels both in the US and Europe. As a procyclical currency, the euro has also been quite cheerful. Bullish sentiment on the euro is at a decade high and the currency has rallied 11% from the lows, commensurate with the drop in the DXY index (Chart 1). As a share of total open interest, 80% of speculators are bullish on the euro. Historically, sentiment at this level has been usually associated with the euro being closer to 1.50. Chart 1Sentiment On The Euro Is Elevated
Sentiment On The Euro Is Elevated
Sentiment On The Euro Is Elevated
Chart 2The Euro Is Lagging Copper Prices
The Euro Is Lagging Copper Prices
The Euro Is Lagging Copper Prices
The juxtaposition of much welcomed good news and elevated sentiment sets the euro in a very precarious tug of war. Standard theory suggests that the post-pandemic trade may already be priced into the common currency, given bullish sentiment. This augurs for a reversal. On the other hand, other measures also suggest that the rally in the euro has more room to run. For example, copper prices and the euro have tended to move together, and the red metal suggests EUR/USD should be above 1.20 (Chart 2). Similarly, EUR/JPY has lagged the stellar performance of global equity prices. Is the lagging performance of EUR/USD sending the right signal, suggesting caution? Or is the common-currency a coiled spring ready to head much higher in 2021? How To Forecast The Euro According to Bloomberg forecasts, the euro will be at 1.25 by the end of 2022 (Chart 3). By our reckoning, these forecasts are much too pessimistic. The key driver of the EUR/USD exchange rate is the relative growth profile between the euro area and the US, how that profile is likely to evolve in the future, and the implication for relative monetary policies. Anything else that tries to predict the euro is a subset of this much bigger question. How is growth in the euro area likely to evolve compared to the US? There are many ways to approach this issue, with surprisingly similar results. The key driver of the EUR/USD exchange rate is the relative growth profile between the euro area and the US. The first is just to take the IMF growth estimates at face value. According to the Fund, the euro area economy is projected to contract by 8.3% this year, almost double that of the US, which is 4.3%. But by next year, the economy is expected to bounce back more fervently. Euro area growth is expected to advance by 5.2% compared to 3.1% in the US. Much of the rise will be due to a surge in investment within the euro area, especially driven by pent-up demand in the peripheral countries. This growth acceleration is projected to continue well into 2023. Back-of-the envelope calculations suggest that this will pin EUR/USD around 1.35 (Chart 4) Chart 3Few Expect The Euro Above 1.25
Few Expect The Euro Above 1.25
Few Expect The Euro Above 1.25
Chart 4EUR/USD And Relative Growth
EUR/USD And Relative Growth
EUR/USD And Relative Growth
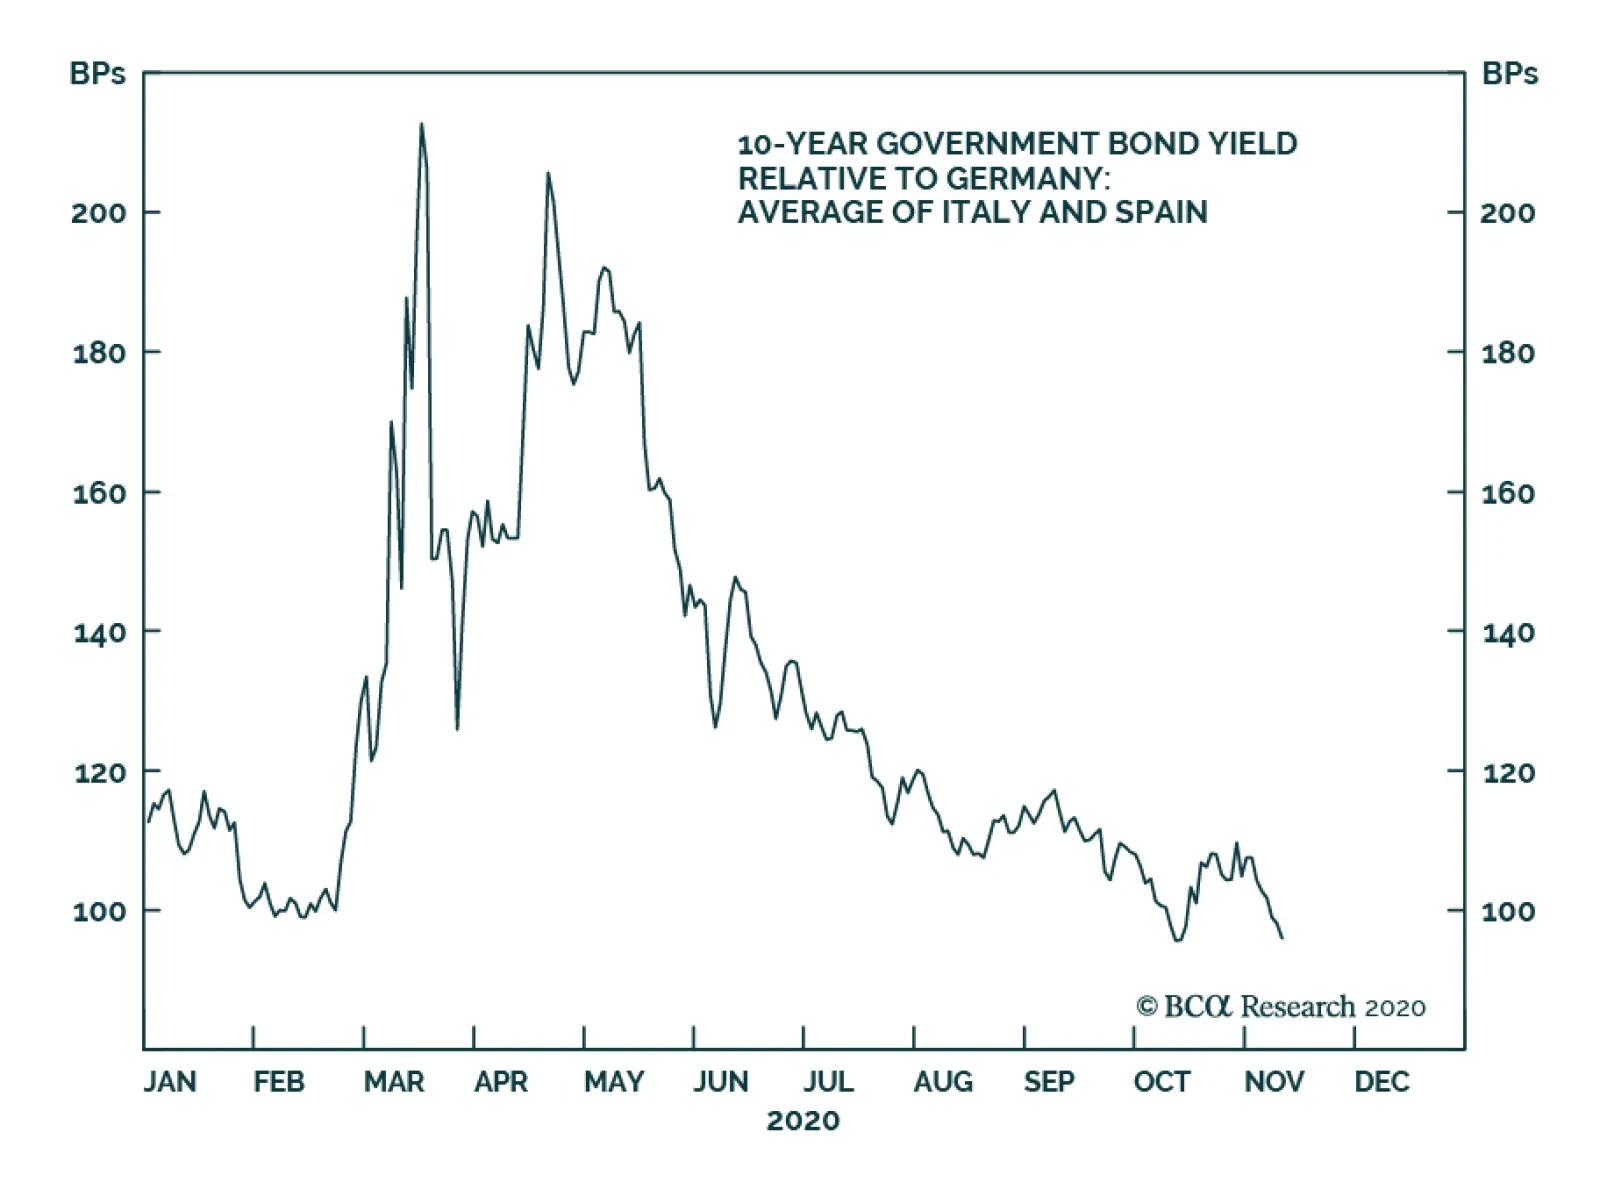
The Case For European Growth We tend to side with the IMF’s forecasts and even argue that this might actually be on the conservative side for the euro area. There are two major reasons for this, both of which are bilaterally important. First, the neutral rate of interest in the euro area may have moved a step function higher relative to the US. The standard dilemma for the euro zone is that interest rates have always been too low for the most productive nation, Germany, but too expensive for others, such as Spain and Italy. The silver lining is that the European Central Bank (ECB) has now lowered domestic interest rates and eased policy to the point where they are accommodative for all euro zone countries.1 Bond yields in peripheral Europe are collapsing relative to those in Germany and France (Chart 5). This makes it much easier for the less-productive, peripheral countries to borrow and invest. This will boost productivity, lifting the neutral rate. Chart 5The Neutral Rate In The Euro Area
The Neutral Rate In The Euro Area
The Neutral Rate In The Euro Area
Second and equally important, the periphery has become as competitive as the core. Through labor market reforms, internal devaluation, and recurring recessions throughout the last decade, unit labor costs in Greece, Ireland, Portugal, and Spain have converged with that in Germany and France. This has effectively eliminated the competitiveness gap that had accumulated over the past two decades (Chart 6). Even Italy, which remained saddled with a rigid and less productive workforce, has seen unit labor costs begin to crest. Chart 6Southern Europe Is Competitive Again
Southern Europe Is Competitive Again
Southern Europe Is Competitive Again
According to the Holston-Laubach-Williams estimates at the NY Fed, the natural rate of interest in the euro area is now higher than in the US, something that has rarely occurred over the 20-year history of the common currency. Based on these estimates, the euro could gravitate towards 1.50 (Chart 7). Chart 7EUR/USD And The Neutral Rate
EUR/USD And The Neutral Rate
EUR/USD And The Neutral Rate
US Versus Europe Chart 8Productivity In Europe Has Lagged
Productivity In Europe Has Lagged
Productivity In Europe Has Lagged
In today’s world, 1.50 for the euro is certainly very high and will surely stir up some action from the ECB well before we approach these levels. As most of my colleagues would argue, no central bank wants a strong currency.2 But how can we gauge the above premise that the neutral rate of interest should be higher in the euro area due to the tectonic shifts over the last few years? One way is to look at trend productivity growth. Since the 1960s, up until the Great Financial Crisis, trend productivity growth was around 2.2% in the US and 2.8% in the euro area. However, since 2009, productivity growth has been 0.6% per year in the euro area and 1.1% in the US (Chart 8). In other words, the European debt crisis has substantially subdued productivity growth in the euro area. If indeed the crisis is behind us, and we assume European productivity growth returns back to trend over the next 10 years, while making up for the shortfall relative to the US, this will pin it at roughly 1.6% higher in Europe relative to the US. Cumulatively, that is a rise of around 20%. Meanwhile, we highlighted last week that the euro was undervalued by over 10%.3 This pins the euro above 1.50. The Euro At Parity And Inflation Chart 9US Versus Euro Area Inflation
US Versus Euro Area Inflation
US Versus Euro Area Inflation
While the euro might gravitate higher in the next few years, it is unlikely to do so in a straight line. Meanwhile, deflation is a key near-term threat for the euro (Chart 9). With the ECB clearly telegraphing that it will do more easing in December, the relative monetary policy stance is not favorable. That said, there are three key points to consider about inflation. First, most G10 central banks were unable to meet their inflation mandate when output gaps were closing and the economy was at full employment. This makes it less likely they will meet their mandate anytime soon. This is not just an ECB problem, but one for the Fed, BoJ, and even the RBA. Second, inflation tends to be a global phenomenon in the developed world, meaning desynchronized cycles in inflation dynamics are quite rare. Finally, with balance sheets expanding everywhere in the G10, the potential for higher inflation once output gaps close will be universal. European productivity growth will have to outpace that in the US by roughly 1.6%, to play catch up. Going forward, an agreement on the mutualization of European debt means we can begin to expect more synchronized business cycles as fiscal stabilizers kick in. The reason is that both fiscal and monetary policy can now be synchronized across member states. This makes shortfalls in inflation less likely. Finally, while deflation can be a sign of an expensive currency, there is little evidence that this is the case for the euro. The euro area continues to sport very healthy trade and current account surpluses, a sign that the euro remains very competitive among its trading partners. Intra-European trade represents a large share of cross-border transactions in Europe, meaning currency considerations are less important. In 2019, most member states had a share of intra-EU exports of between 50% and 75%. The bottom line is that disappointing inflation dynamics could lead to a knee-jerk selloff in the euro, but this should be an opportunity to accumulate long positions. The Cyclical Catalyst Ultimately, European growth is cyclically tied to export growth. And with a huge concentration of cyclical sectors, such as financials, industrials, materials and energy, in European bourses, the euro tends to be largely driven by pro-cyclical flows. Earnings revisions between the euro area and the US have generally led the EUR/USD exchange rate by about 9-12 months (Chart 10). Chart 10EUR/USD Tracks Relative Profits
EUR/USD Tracks Relative Profits
EUR/USD Tracks Relative Profits
So far, the signs are positive. The impulse from Chinese credit is providing a release valve for European exports (Chart 11). So even if social distancing remains in place for longer than people expect, it still allows economies that are geared more towards manufacturing such as Europe, Japan, and China to keep churning higher. This could boost European earnings in a meaningful way. Chart 11Chinese Demand For European Goods
Chinese Demand For European Goods
Chinese Demand For European Goods
Fortunately for investors, European equities, especially those in the periphery, remain unloved, given that they are trading at some of the cheapest cyclically adjusted price-to-earnings multiples in the developed world (Chart 12A). Over the next decade, it would be surprising if some of these “old economy” stocks did not unwind their discount via both rising earnings and multiples. Many emerging markets, including China, still depend on “old-economy” materials such as oil, and industrial machinery, that Europe sells. The impulse from Chinese credit is providing a release valve for European exports. Even in the commodity space, cyclical metals like copper are still massively underperforming safe havens like gold. This has largely tracked the discount between European stocks and US stocks. A bet on a reversal could prove very profitable (Chart 12B). Chart 12AEuro Stocks Are Cheap
Euro Stocks Are Cheap
Euro Stocks Are Cheap
Chart 12BEuro Stocks Could Rerate
Euro Stocks Could Rerate
Euro Stocks Could Rerate
Chester Ntonifor Foreign Exchange Strategist chestern@bcaresearch.com Footnotes 1 Please see Foreign Exchange Strategy Weekly Report, "EUR/USD And The Neutral Rate Of Interest," dated June 14, 2019, available at fes.bcaresearch.com 2 Please see Global Fixed Income Strategy Weekly Report, "Nobody Wants A Strong Currency," dated November 17, 2020, gfis.bcaresearch.com 3 Please see Foreign Exchange Strategy Weekly Report, "Updating Our PPP Models," dated November 13, 2020. fes.bcaresearch.com Trades & Forecasts Forecast Summary Core Portfolio Tactical Trades Limit Orders Closed Trades

In an Insight published yesterday, we noted that the euro area is now projected to contract in Q4, as a result of the recent second wave in COVID-19 cases and the associated lockdown measures to suppress its spread. We also noted that France, Italy, and Spain…
Yesterday, Christine Lagarde provided a clear signal that vaccine optimism would not prevent the ECB from easing further in December, reinforcing the message that she gave at the last ECB meeting: that the central bank would “recalibrate its instruments”…
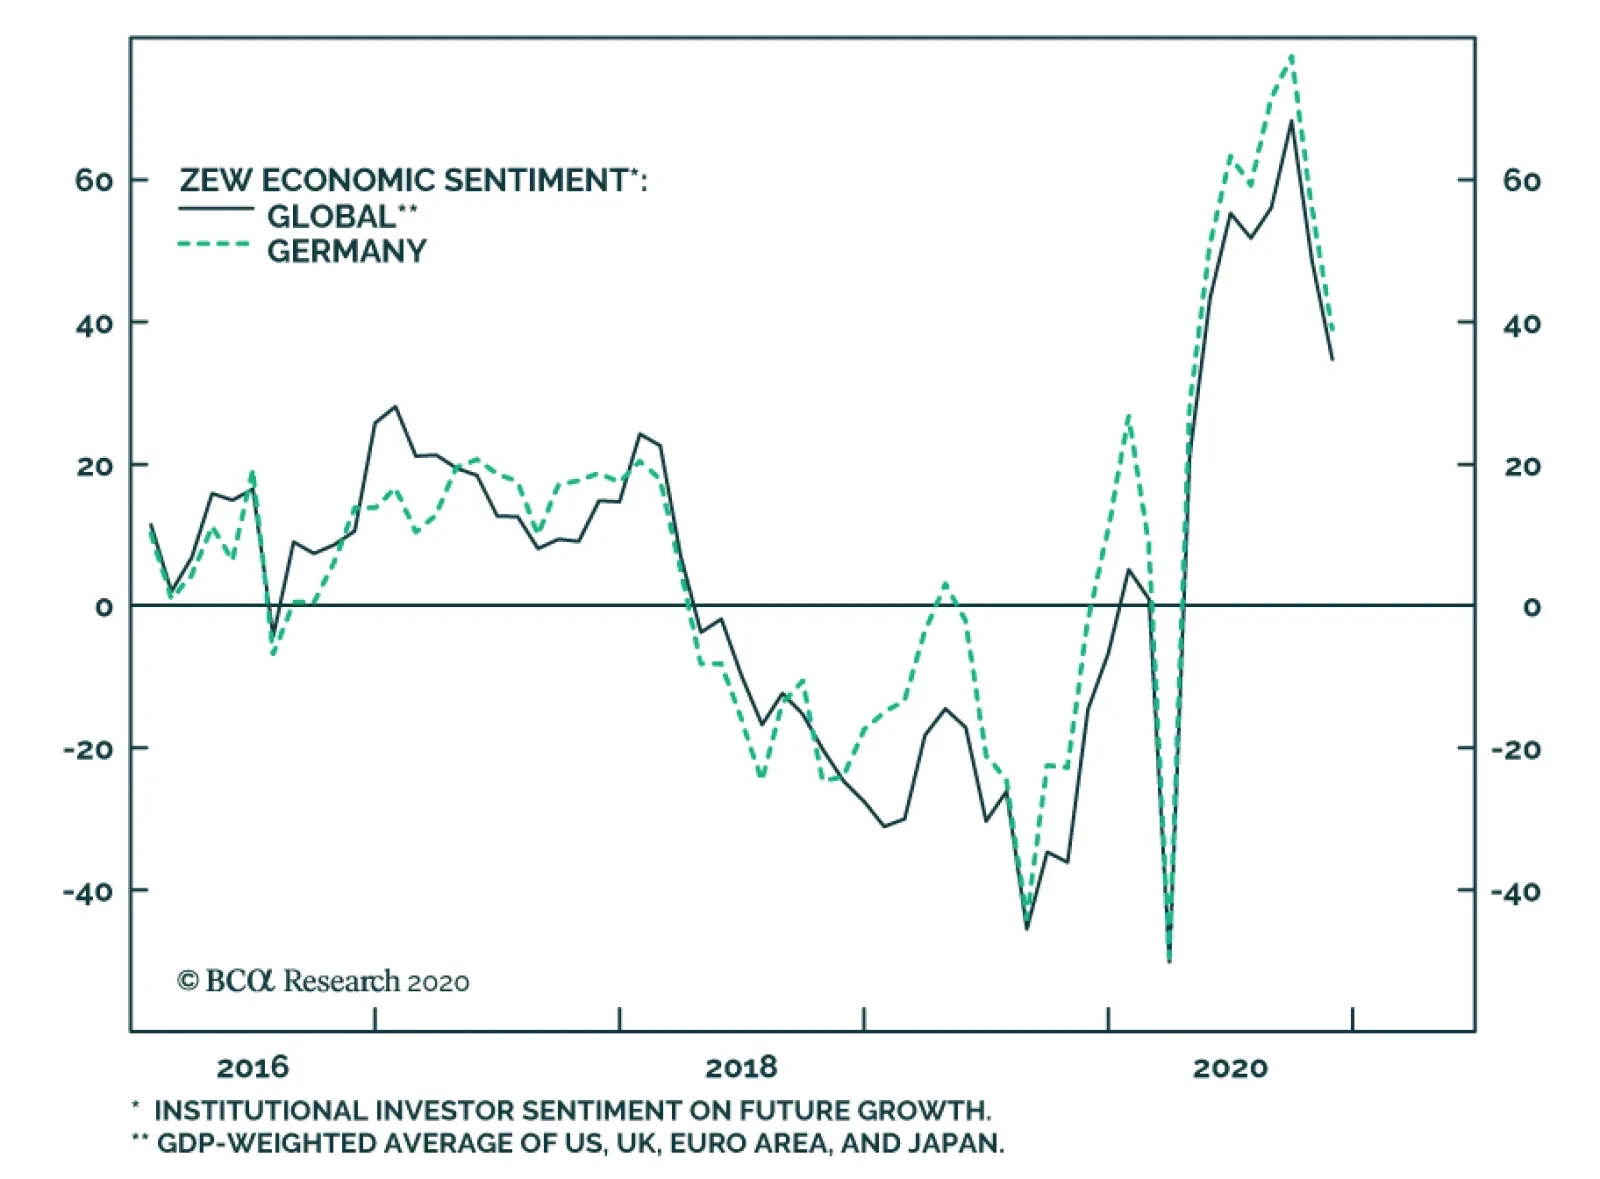
The ZEW survey of German investor sentiment plunged in November, declining to 39 from 56.1 in October. It fell short of expectations and marks the second consecutive monthly decline. The weak print confirms the somber outlook implied by the Euro Area’s…
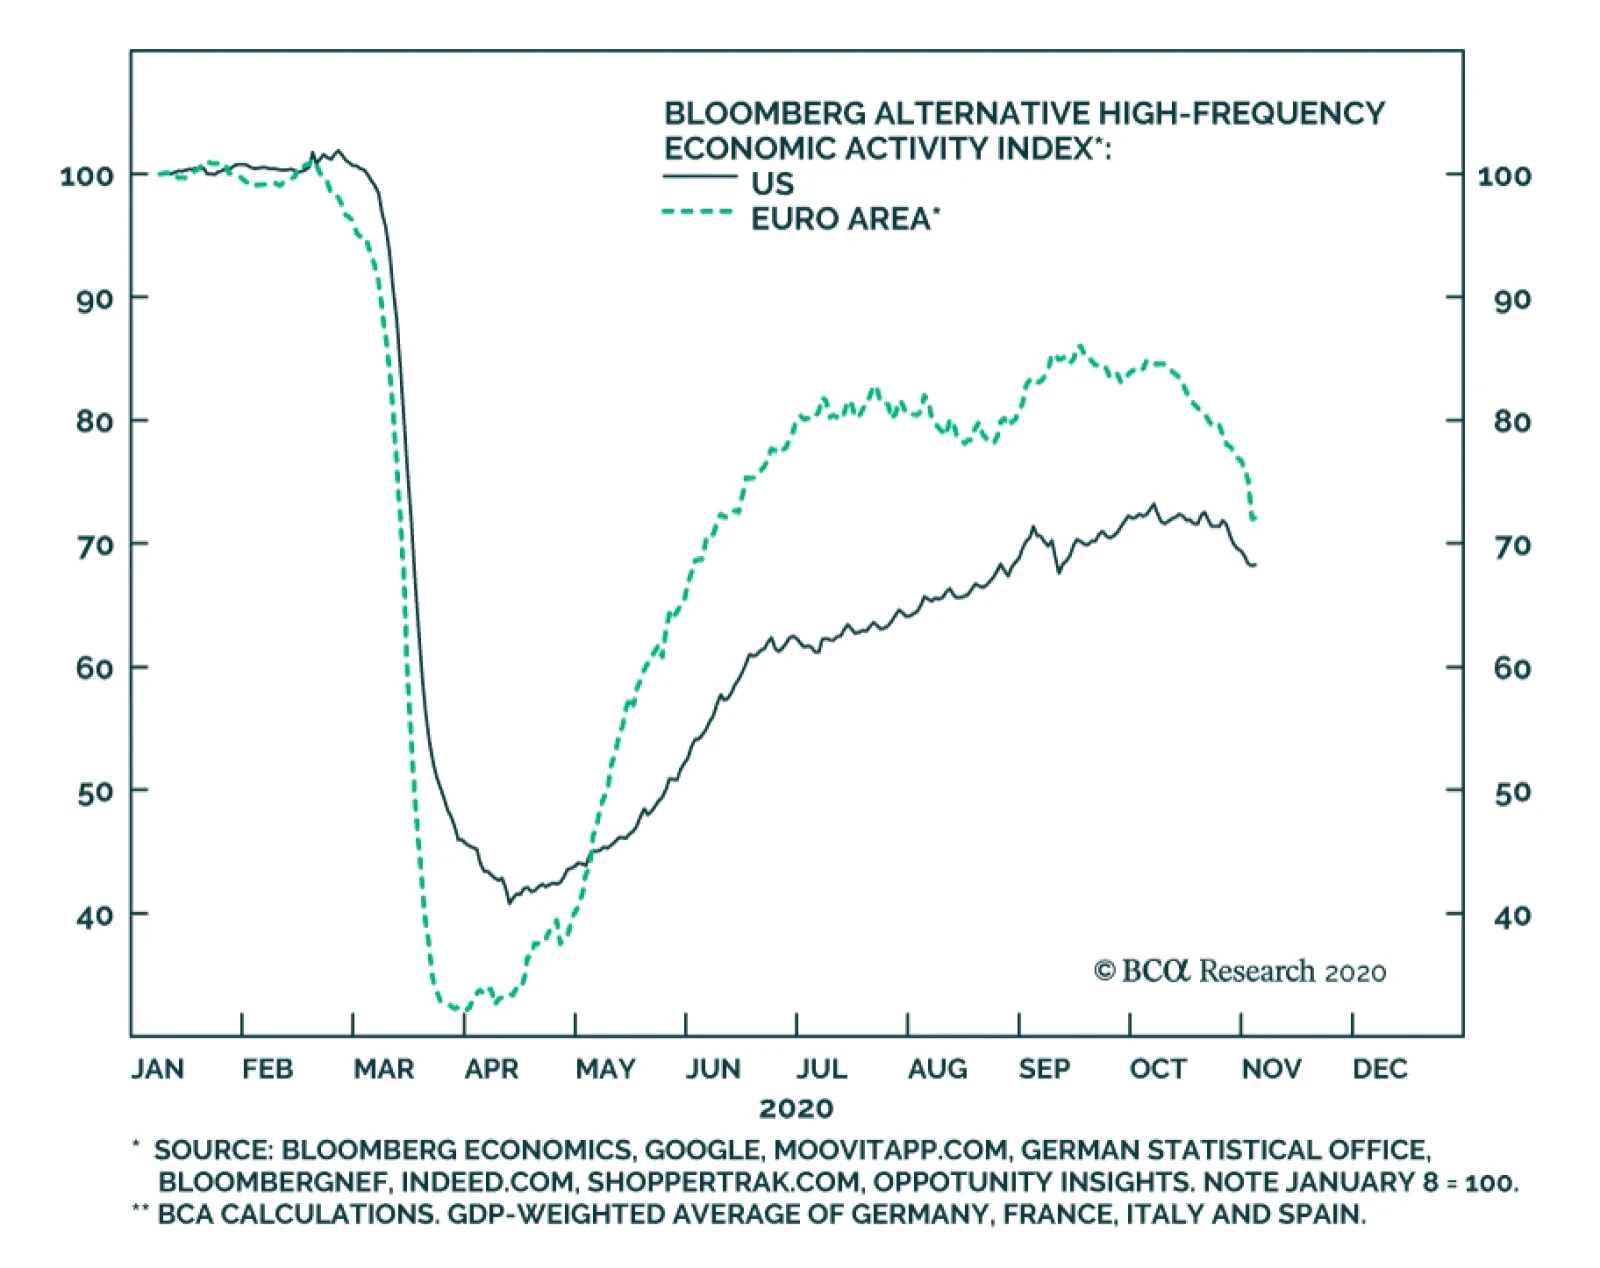
Alternative, high-frequency indicators of economic activity highlight that the US and euro area economies are already slowing in response to a new wave of COVID-19 infections. The chart above highlights Bloomberg's economic activity indexes for the US and…
In a previous Insight, we noted that the October euro area services PMI showed the region was at risk of a relative growth disappointment. The October survey was taken before the region re-imposed COVID-19 suppression measures of various intensity, from…
Highlights COVID-19 In Europe: The latest surge in COVID-19 cases in Europe has unnerved investors who now see renewed national lockdowns increasing the risk of a double-dip European recession and continued deflationary pressures. ECB: The signals from last week’s ECB policy meeting could not be more clear – the central bank will deliver new stimulus measures in December in response to the second wave of coronavirus sweeping through the euro area. This will be a combination of policies focused on expanding and extending the existing bond-buying vehicles and TLTROs, rather than cutting policy rates deeper into negative territory. European Bond Strategy: Stay overweight core European government debt, particularly versus US Treasuries. Remain overweight Italian and Spanish government bonds, as well, which remain supported by both ECB asset purchases and perceptions of increases European fiscal integration. Stay cautious on euro area corporate debt, however, as the renewed recession risk comes at a time when yields and spreads offer poor protection from future credit downgrades and defaults. Feature Chart of the WeekA Bad Time For A Second Wave
A Bad Time For A Second Wave
A Bad Time For A Second Wave
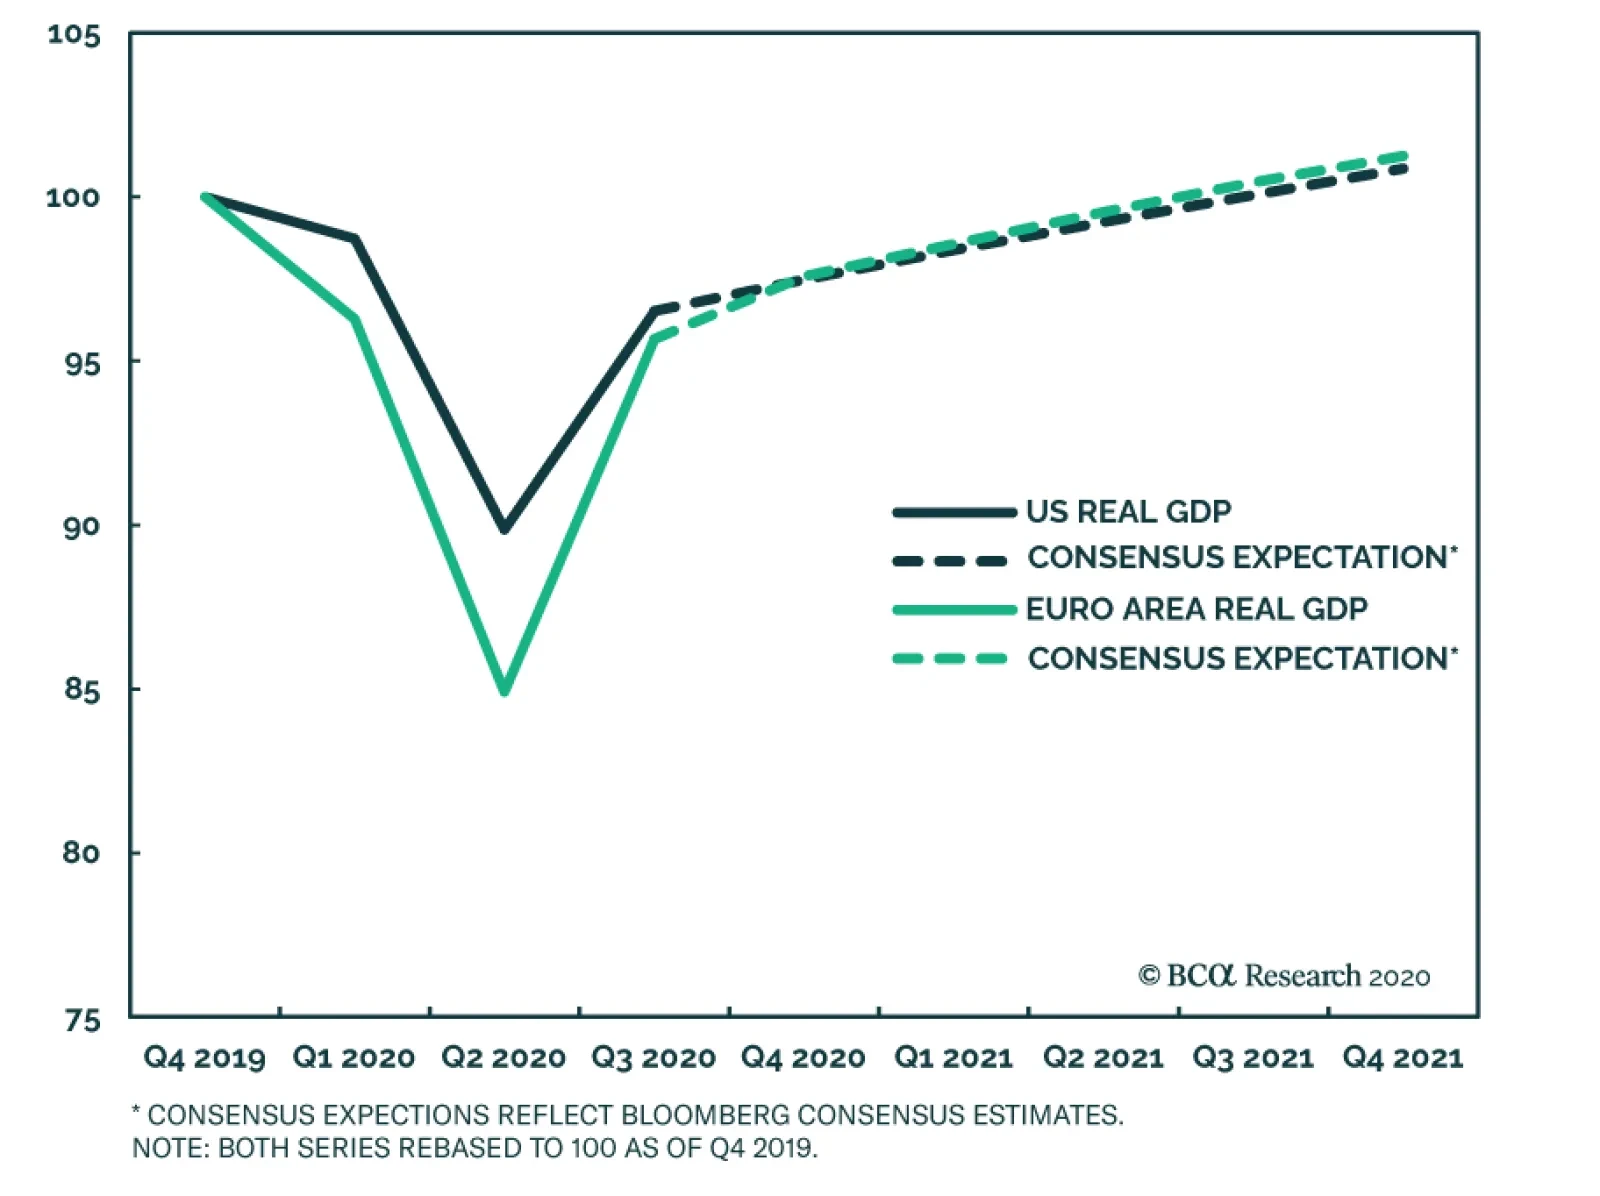
Today’s long anticipated US election will be the focus for investors in the coming days (and, potentially, weeks) as all votes are counted. We have discussed our views on the potential bond market impact of the election - bearish for US Treasuries with both Joe Biden and Donald Trump promising big fiscal stimulus in 2021 – in our previous two reports. We will provide an update of those views as soon as we get clarity on the election result. This week, we discuss a new concern for jittery markets - the explosion of new COVID-19 cases in Europe that has already led to governments imposing aggressive lockdown measures. The timing of the new viral surge could not be worse for the euro area economy, which had recovered smartly from the massive lockdown-related demand shock this past spring. Real GDP for the entire euro area exploded higher at a 12.7% rate in Q3/2020, a big rebound from the 11.8% drop in Q2. Yet the second wave of coronavirus is starting to weigh on the more domestically focused service sectors most vulnerable to lockdowns and declining consumer confidence (Chart of the Week). From the perspective of European fixed income strategy, the imposition of lockdowns will only force the ECB to turn more dovish at a time when Europe is already in deflation, as was strongly signaled at last week’s ECB policy meeting. This will support the performance of euro area government bond markets, both in absolute terms and especially versus US Treasuries where yields are drifting higher and should continue to do so after the US election. Another Deflationary Shock To Europe From The Virus The surge in COVID-19 cases has hit the euro area hard and fast. France has seen the most stunning increase, with a population-adjusted daily increase of 596 new cases per million, a nearly six-fold increase in just two months (Chart 2). Importantly, this second wave has so far been nowhere near as lethal as the first wave. The “case fatality ratio” – confirmed deaths as a percentage of confirmed cases – is down in the low single digits for the largest euro area countries (bottom panel). The imposition of lockdowns will only force the ECB to turn more dovish at a time when Europe is already in deflation, as was strongly signaled at last week’s ECB policy meeting. Even with this second wave being less deadly, governments are taking no chances. France and Germany announced national lockdowns last week for at least the month of November, and Italy and Spain have put new restrictions on activity as well. The new lockdowns are already denting consumer confidence across the euro area and this trend will continue as people choose to spend less time outside of their homes to avoid infection. If the case numbers do not begin to stabilize and the lockdown measures extend into December or beyond, governments will likely be forced to consider new fiscal stimulus measures. According to the latest IMF Fiscal Monitor, the largest euro area economies are projected to have a negative “fiscal thrust” – the change in the cyclically-adjusted primary budget balance as a share of potential GDP – in 2021 of at least -3% of GDP (Chart 3). Chart 22nd Wave Of European Coronavirus Is Far Less Lethal
2nd Wave Of European Coronavirus Is Far Less Lethal
2nd Wave Of European Coronavirus Is Far Less Lethal
Chart 3A Big European Fiscal Drag Coming Next Year
The Implications Of Europe's Second Wave Of Coronavirus
The Implications Of Europe's Second Wave Of Coronavirus
In the case of Italy, the fiscal thrust is expected to be a whopping -6.6% of GDP. The main cause is reduced government spending as the massive temporary stimulus measures to fight the 2020 COVID-19 recessions roll off. Chart 4The ECB Has A Deflation Problem
The ECB Has A Deflation Problem
The ECB Has A Deflation Problem
A fresh set of lockdowns will result in a need for more government support measures for unemployed workers, especially those in service-related industries like hospitality and tourism most exposed to lost business as consumers stay home. This poses a serious problem in countries like Spain and Italy that saw a rise in unemployment during the first lockdown but have seen no reversal since (Chart 4). More elevated unemployment rates suggest a lack of inflationary pressure, a point confirmed by recent inflation data. Overall headline HICP inflation fell to -0.3% in September, while core inflation is now a mere +0.4%. Headline HICP inflation rates are now below 0% in the largest euro area economies (Germany, France, Italy and Spain), while core HICP inflation in Italy fell to -0.3% in September. The collapse in oil prices earlier in 2020 has been the main cause of the negative headline inflation prints in the euro area, but is not the only source of weak inflation. According to a decomposition of inflation presented in the Bank of Italy’s October 2020 Economic Bulletin, a falling contribution from services inflation was responsible for about one-third of the entire decline in euro area headline HICP inflation since January (Chart 5). This comes from the part of the euro area economy most exposed to COVID-19 restrictions, highlighting the deflationary risk of the second wave. Chart 5Euro Area Deflation Is Mostly, But Not Only, Driven By Oil
The Implications Of Europe's Second Wave Of Coronavirus
The Implications Of Europe's Second Wave Of Coronavirus
Simply put, the second wave of COVID-19 could not have come at a worse time. The euro area economy is still dealing with excess capacity and deflation, made worse by previous appreciation of the euro, with a looming fiscal tightening next year. Policymakers need to spring into action to help provide support for the euro area economy during this time, starting with the ECB. The second wave of COVID-19 could not have come at a worse time. The euro area economy is still dealing with excess capacity and deflation, made worse by previous appreciation of the euro, with a looming fiscal tightening next year. Bottom Line: The latest surge in COVID-19 cases in Europe has unnerved investors who now see renewed national lockdowns increasing the risk of a double-dip European recession and continued deflationary pressures. The ECB Will Deliver New Stimulus In December At last week’s policy meeting, ECB President Christine Lagarde announced that the Governing Council would reassess its monetary policy stance at the December meeting, when a new set of economic projections would be presented that factored in the negative impact of the second COVID-19 wave. Lagarde was very candid about the expected outcome of that next meeting, when she stated that the ECB would “recalibrate its instruments” based on the new economic forecasts. Chart 6European Banks Are Tigthening Lending Standards
European Banks Are Tigthening Lending Standards
European Banks Are Tigthening Lending Standards
In our view, the ECB’s next policy options can only realistically focus on three options: Cutting policy rates deeper into negative territory Increasing the size, or altering the composition of its bond-buying programs Altering the terms of its current Targeted Long-Term Refinancing Operations (TLTROs) We view a rate cut as a low probability outcome. Not only are policy rates at or below 0%, but it is not clear that a cut would even help boost the demand or supply of new loans. According to the ECB’s latest Bank Lending Survey, euro area banks tightened credit conditions in Q3/2020 (Chart 6). Worsening perceptions of risk and a deteriorating economic outlook were cited as the main reasons for tightening lending standards. The tightening was most severe in Spain, but Italy also saw a big swing away from the easing standards seen in the Q2/2020 survey. Within the details of the Q3/2020 survey, the demand for loans from companies was expected to improve in Q4/2020. The demand for housing and consumer credit increased due to favorable borrowing conditions and a softening in negative contribution from consumer sentiment. Not only are policy rates at or below 0%, but it is not clear that a cut would even help boost the demand or supply of new loans. The ECB’s bond buying programs – the Asset Purchase Program (APP) and the Pandemic Emergency Purchase Program (PEPP) – were deemed to have a positive impact on bank liquidity and financing but a negative impact on profitability. Chart 7Low Interest Rates Are Crushing European Bank Stocks
Low Interest Rates Are Crushing European Bank Stocks
Low Interest Rates Are Crushing European Bank Stocks
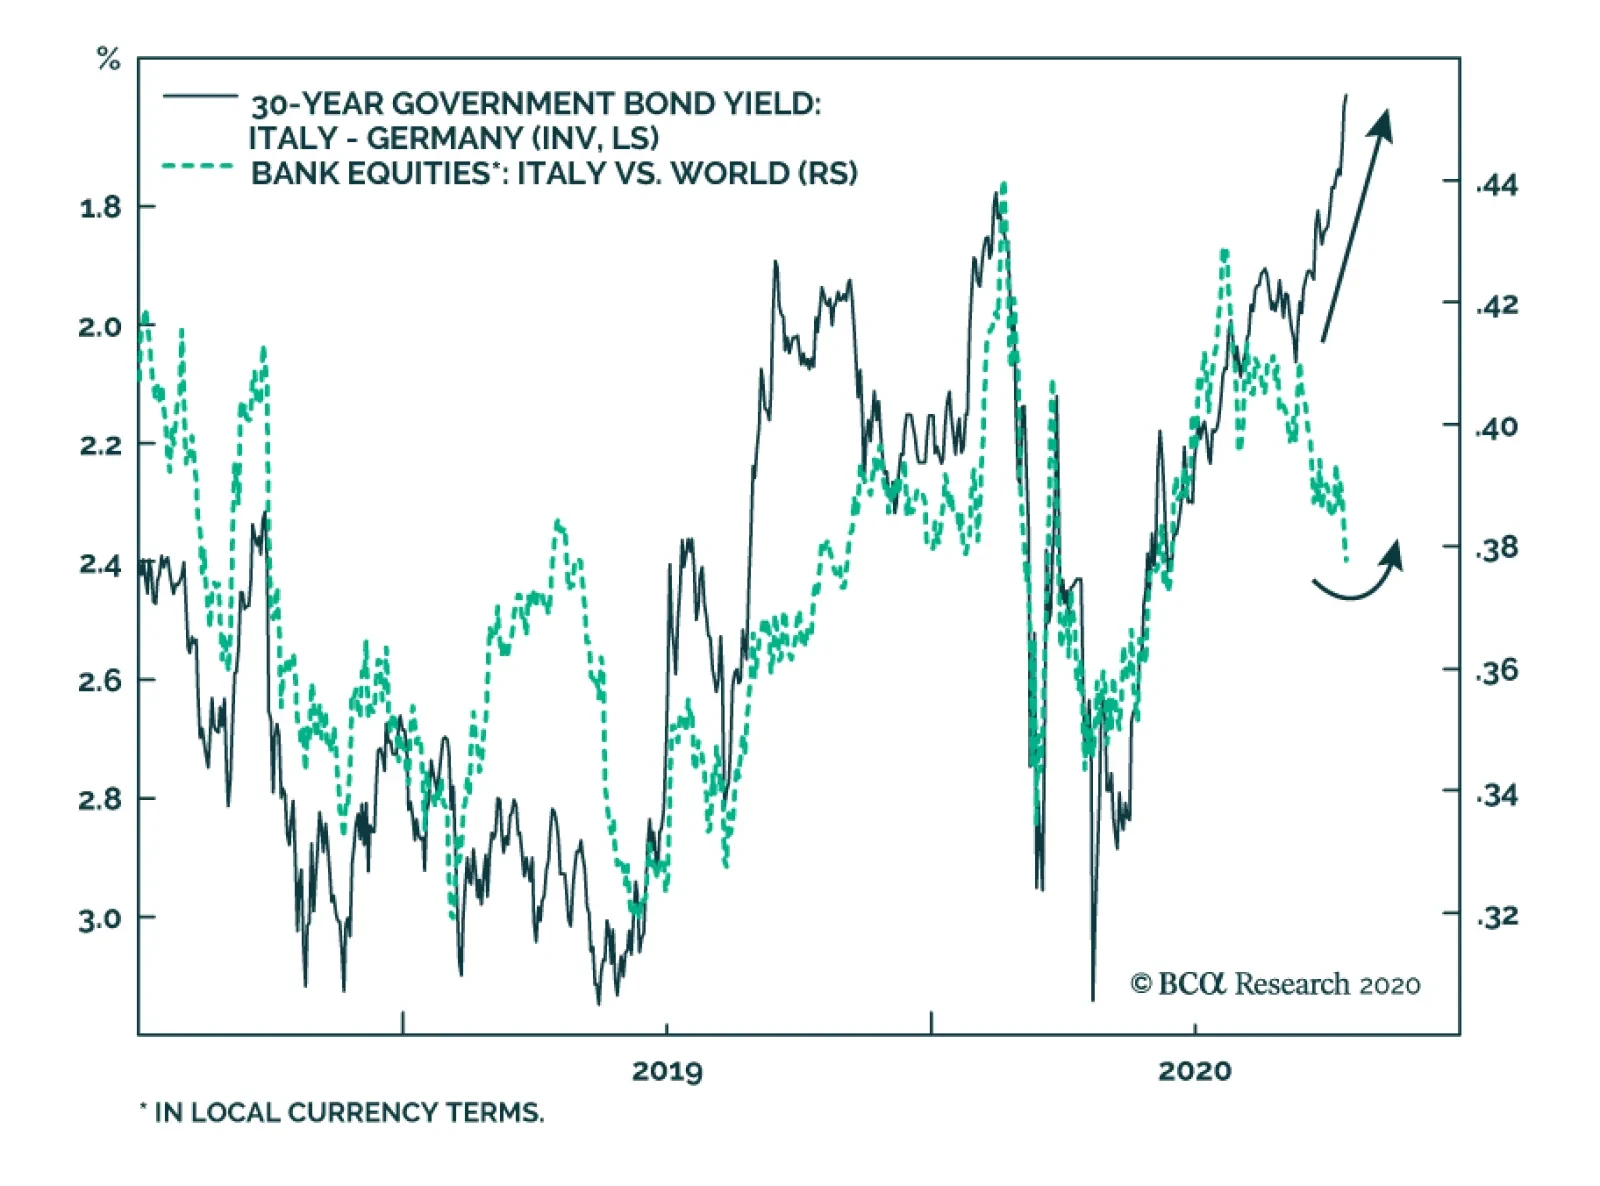
Therein lies the problem of the ECB’s negative interest rate policy and large-scale bond buying – it has lowered borrowing costs for euro area governments, consumers and businesses, but has crushed the profits of Europe’s banks. That can be seen when looking at the ongoing miserable performance of euro area bank stocks, which continue to plumb new lows. The relative performance of euro area banks versus the broad equity market benchmark index tracks the slope of government bond yield curves quite closely in the major euro area economies (Chart 7), highlighting the link between the level of euro area interest rates and bank profits. In Chart 8A, we show the Tier 1 capital ratio, as well as the non-performing loan (NPL) ratio for the five largest banks in Germany, France, Italy, Spain and the Netherlands. The message from the chart is clear – European banks remain well capitalized, with double-digit Tier 1 capital ratios well in excess of regulatory minimums, and have a relatively low share of assets that are non-performing. This is especially true in Italy, where the NPL ratio has collapsed from a high of 20% to 7% over the past five years. In Chart 8B, we present the return on equity and return on asset ratios for the same banks presented in the previous chart. Most large euro area banks suffer from a very low return on assets, not materially above 0%, reflecting the non-existent interest rates banks earn on their government bond holdings as well as the low rates on their loan books. Chart 8AEuropean Banks: The Good News
European Banks: The Good News
European Banks: The Good News
Chart 8BEuropean Banks: The Bad News
European Banks: The Bad News
European Banks: The Bad News
So given the fragile state of euro area bank health, and with banks already tightening lending standards in anticipation of slower economic activity because of second wave lockdowns, we can rule out a policy interest rate cut as an option to ease policy in December. This leaves only two other easing options, both associated with an expansion of the ECB’s balance sheet – more asset purchases of sovereign bonds and encouraging bank lending through cheap funding via TLTROs (Chart 9). The impact of either policy in offsetting slowing growth is debatable. Government bond yields are already miniscule, if not outright negative, across the euro area and do not represent a hindrance to increased government spending. The ECB can tweak some of the terms of the existing TLTRO programs, like maturity or the price of funding, but that may not encourage new lending if both borrowers and lenders fear a double-dip recession because of the second wave. The pressure is on the ECB to do something to stem the decline in euro area inflation. Nonetheless, the pressure is on the ECB to do something to stem the decline in euro area inflation. While real interest rates are still negative, they are increasingly becoming less so as inflation expectations continue to drift lower. The 5-year/5-year forward EUR CPI swap rate is now down to 1.1%, and was last trading near the ECB’s inflation target of just under 2% in 2013-14 (Chart 10). Unsurprisingly, the rising real rate backdrop has helped boost the value of the euro, especially versus the US dollar, which has suffered under the weight of falling real US interest rates this year. Chart 9The ECB Can Only Expand Its Balance Sheet
The ECB Can Only Expand Its Balance Sheet
The ECB Can Only Expand Its Balance Sheet
In the end, greater fiscal stimulus will be the only option available to get Europe through the second wave. All the ECB can do is provide a backdrop of loose monetary policy that supports easy financial conditions, so that any stimulus will have the maximum effect on growth. Chart 10Deflation Is Pushing Up Real Rates In Europe
Deflation Is Pushing Up Real Rates In Europe
Deflation Is Pushing Up Real Rates In Europe
Bottom Line: The signals from last week’s ECB policy meeting could not be more clear – the central bank will deliver new stimulus measures in December in response to the second wave of coronavirus sweeping through the euro area. This will be a combination of policies focused on expanding and extending the existing bond-buying vehicles and TLTROs, rather than cutting policy rates deeper into negative territory. Stay Overweight European Government Bonds, But Stay Cautious On Euro Area Credit With the ECB set to deliver some form of easing in December, core European bond yields are likely to remain stable over at least the next six months. The ECB has shown no reservations about expanding its balance sheet via bond purchases when needed. A surge of buying similar in size to that of the first COVID-19 wave is not out of the question if Europe faces a double-dip second wave recession (Chart 11). Chart 11Stay Overweight Core European Government Bonds
Stay Overweight Core European Government Bonds
Stay Overweight Core European Government Bonds
Chart 12Italian BTPs Are Preferable To Euro Area Corporate Credit
Italian BTPs Are Preferable To Euro Area Corporate Credit
Italian BTPs Are Preferable To Euro Area Corporate Credit
In an environment where we see US Treasury yields having more upside on the back of post-election fiscal stimulus, this makes the likes of German bunds and French OATs good “defensive” lower-beta plays to replace high-beta US Treasury exposure in global USD-hedged bond portfolios. We also like core Europe as a pure spread trade versus Treasuries, as we see scope for the UST-Bund spread to widen further – a tactical trade we initiated last week (see our Tactical Overlay table on page 15). We continue to recommend overweighting Italian government bonds as the preferred way to add scarce yield to a European bond portfolio with an asset that will directly benefit from more ECB buying. We continue to recommend overweighting Italian government bonds as the preferred way to add scarce yield to a European bond portfolio with an asset that will directly benefit from more ECB buying (Chart 12). The ECB has already been purchasing a greater share of Italy in the PEPP, allowing significant deviations from the Capital Key weights that limit purchases in the older APP. ECB President Lagarde noted last week that those deviations will continue over the life of the PEPP, which should help support further declines in Italian bond yields over at least the next six months. We are maintaining a relatively cautious stance on European credit, however, even with the ECB likely to make a move in December. The renewed recession risk from the second wave comes at a time when low yields and spreads for euro area corporate bonds offer poor protection from future credit downgrades and defaults. We continue to prefer owning US corporate credit, both investment grade and high-yield, versus US equivalents in USD-hedged bond portfolios. Robert Robis, CFA Chief Fixed Income Strategist rrobis@bcaresearch.com Recommendations The GFIS Recommended Portfolio Vs. The Custom Benchmark Index
The Implications Of Europe's Second Wave Of Coronavirus
The Implications Of Europe's Second Wave Of Coronavirus
Duration Regional Allocation Spread Product Tactical Trades Yields & Returns Global Bond Yields Historical Returns
It is in fashion to talk about the collapse of Italian yields to record lows, but one of the key investment implications of this move is often overlooked: it makes Italian banks attractive relative to lenders in other nations. The fall in yields,…
Highlights Bank credit 6-month impulses are plunging, and the pandemic is resurging. Maintain an overweight to growth defensives (technology and healthcare). In the short term, profits will be more resilient in a resurgent pandemic. In the long term, profits are well set to grow in an increasingly online, decentralised, remote-working, health-conscious world. The European stock market’s massive underweighting to growth defensives will weigh on its relative performance. Go underweight China economy plays. Fractal trade: Fractal analysis confirms that basic resources are vulnerable to a reversal. Within value cyclicals, tactically overweight financials versus basic resources. Feature Chart of the WeekThe Greatest Ever Monetary Stimulus Is Over... For Now
The Greatest Ever Monetary Stimulus Is Over... For Now
The Greatest Ever Monetary Stimulus Is Over... For Now
Monetary stimulus, as measured by the increase in banks’ six-month credit flows, reached an all-time high during the summer months. But now, the greatest ever monetary stimulus is fading (Chart of the Week). In the US and China, the increase in banks’ six-month credit flows peaked at $700 billion and $800 billion respectively during May. In the euro area, the increase peaked at over $1 trillion during July. The combination constituted the greatest ever global monetary stimulus, trumping even the stimulus that followed the 2008 financial crisis (Charts I-2 - I-4). Chart I-2US Monetary Stimulus Is Fading
US Monetary Stimulus Is Fading
US Monetary Stimulus Is Fading
Chart I-3China Monetary Stimulus Is Fading
China Monetary Stimulus Is Fading
China Monetary Stimulus Is Fading
Chart I-4Euro Area Monetary Stimulus To Fade
Euro Area Monetary Stimulus To Fade
Euro Area Monetary Stimulus To Fade
However, the increase in six-month credit flows has recently slumped to around $200 billion in both the US and China. The euro area has yet to update its data beyond July, but we expect it to fade too. The upshot is that the greatest ever monetary stimulus is over… for now. Bond Yields Are No Longer Stimulating Our preferred metric for assessing the transmission of monetary stimulus on an economy is the increase in the banks’ six-month credit flows. In turn, this depends on the six-month deceleration in the bond yield – meaning, the bond yield decline in the most recent six months must be greater than the decline in the previous six months. At first glance, this seems counterintuitive. Why focus on the bond yield’s deceleration rather than its plain vanilla decline? Box 1 explains how it follows from a fundamental accounting identity of GDP statistics. Box 1 Why The Bond Yield’s Deceleration Matters GDP is a flow statistic. It measures the flow of goods and services produced in a period. Hence, the GDP flow receives a contribution from the bank credit flow in that period. In turn, the bank credit flow is established by the decline in the bond yield (Chart I-5). Chart I-5The Decline In The Bond Yield Establishes The Bank Credit Flow
The Decline In The Bond Yield Establishes The Bank Credit Flow
The Decline In The Bond Yield Establishes The Bank Credit Flow
It follows that GDP growth receives a contribution from bank credit flow growth. Which, in turn, receives a contribution from the bond yield deceleration. In other words, the bond yield decline in the most recent period must be greater than the decline in the previous period. Finally, our preferred period is six months because it empirically equals the time to fully spend a bank credit flow. A quarter is too short: a year is much too long. Admittedly, during this year’s pandemic recession and rebound, the link between monetary stimulus and the real economy has weakened. Fiscal stimulus has played a more important role. Even when it comes to bank credit, much of the recent increase was not due to new loans. It was due to firms tapping pre-arranged credit lines, which they used to reinforce cash buffers, rather than to spend. Nevertheless, some impact of monetary stimulus will reach the real economy. This means that while this year’s earlier deceleration of bond yields was good news for the economy, the more recent acceleration of bond yields is bad news (Chart I-6). Chart I-6The Recent Acceleration Of Bond Yields Is Bad News
The Recent Acceleration Of Bond Yields Is Bad News
The Recent Acceleration Of Bond Yields Is Bad News
Tactically Underweight China Plays Through the summer months, 10-year bond yields flipped from sharp six-month decelerations to sharp accelerations. But the reversals were much more extreme in China and the US than in the euro area. Seen in this light, it is hardly surprising that the increase in six-month bank credit flows has already slumped in China and the US, and could soon turn negative. If so, they would be a contractionary force on the economy. One tactical investment conclusion is to underweight China economy plays. Specifically, with China’s bank credit six-month impulse in freefall, the 40 percent outperformance of basic resources versus financials is vulnerable to a sharp reversal (Chart I-7). This is also confirmed by fractal analysis (see later section). Chart I-7With China's Bank Credit 6-Month Impulse In Freefall, Basic Resources Are Vulnerable
With China's Bank Credit 6-Month Impulse In Freefall, Basic Resources Are Vulnerable
With China's Bank Credit 6-Month Impulse In Freefall, Basic Resources Are Vulnerable
Stay underweight cyclicals. But within cyclicals, tactically overweight financials versus basic resources. A Resurgent Pandemic Will Force People Back Into Their Shells A resurgence of the pandemic will create a further headwind to the economy, irrespective of whether governments impose fresh lockdowns or not. This is because most of us have an instinct for self-preservation as well as protecting our loved ones. In response to a resurgent pandemic, we will go back into our shells. Shunning public transport, shopping, and other crowded places, some might even think twice about letting their children go to school. But if this cautious behaviour is voluntary, then why do governments need to impose lockdowns? The answer is that while the majority behaves responsibly, a minority behaves irresponsibly. In the pandemic, this is critical because less than 10 percent of infected people are responsible for creating 90 percent of all Covid-19 infections. If this tiny minority of so-called ‘super-spreaders’ is left unchecked, then the pandemic will let rip. At first glance, it appears that the lockdown is causing the recession. In fact, this is a classic confusion between correlation and causation. The true cause of the recession is the pandemic, which forces people into their shells. But to the extent that severity of the lockdown correlates with the severity of the pandemic, many people confuse the correlated lockdown with the underlying cause, the pandemic. The ultimate proof comes from Scandinavia. Sweden imposed no lockdown, while its neighbour Denmark imposed the most extreme lockdown in Europe. If it was the lockdown that caused the recession, then the economy of no-lockdown Sweden should have fared much better than that of lockdown Denmark. In fact, the two Scandinavian economies suffered identical 9 percent recessions (Chart I-8). Chart I-8No-Lockdown Sweden Suffered An Identical Recession To Lockdown-Denmark
No-Lockdown Sweden Suffered An Identical Recession To Lockdown-Denmark
No-Lockdown Sweden Suffered An Identical Recession To Lockdown-Denmark
Focus On Sectors That Can Thrive In The New World Tactically we have recommended an underweight to stocks versus bonds since July 9, and this tactical position is broadly flat. Stick with it for now.1 A crucial question is: can bond yields go significantly lower? It is a crucial question because it was the collapse in bond yields earlier this year that saved the aggregate stock market. As long-duration bond yields plunged by 1 percent, the forward earnings yield of long-duration technology and healthcare stocks also plunged by 1 percent (Chart I-9). This surge in the valuation of the growth defensive sectors compensated for the collapsed profits of the value cyclical sectors – banks, basic resources, and oil and gas (Chart I-10). A resurgent pandemic combined with the end of the greatest ever monetary stimulus means that this playbook may get a rerun in the coming months. Chart I-9The Collapsed Bond Yield Explains The Collapsed Earnings Yield (Surging Valuation) Of Tech And Healthcare
The Collapsed Bond Yield Explains The Collapsed Earnings Yield (Surging Valuation) Of Tech And Healthcare
The Collapsed Bond Yield Explains The Collapsed Earnings Yield (Surging Valuation) Of Tech And Healthcare
Chart I-10Tech And Healthcare Saved The Aggregate Stock Market
Tech And Healthcare Saved The Aggregate Stock Market
Tech And Healthcare Saved The Aggregate Stock Market
The worry is that, from current levels, long-duration bond yields will struggle to plunge by another 1 percent and provide the same boost to valuations that they did in the first wave of the pandemic. In which case, the outlook for stocks and sectors will hinge more on their profits. On this basis, we still favour the growth defensives – which we define as technology and healthcare – both for the short term and the long term. In the short term, their profits will be more resilient in a resurgent pandemic. In the long term, their profits are well set to grow in an increasingly online, decentralised, remote-working, health-conscious world. One unfortunate consequence is that the European stock market’s massive underweighting to the growth defensives sectors will weigh on its relative performance, both in the short term and in the long term. Fractal Trading System* Supporting the fundamental analysis in the main body of this report, fractal analysis confirms that basic resources are vulnerable to a reversal versus financials. Hence, this week’s recommended trade is to go long financials versus basic resources. One way of implementing this is: long XLF, short XLB. Set the profit target and symmetrical stop-loss at 3.5 percent. In other trades, long ZAR/CLP reached the end of its holding period flat, and is now closed. The rolling 1-year win ratio now stands at 58 percent.
World: Basic Resources Vs. Financials
World: Basic Resources Vs. Financials
When the fractal dimension approaches the lower limit after an investment has been in an established trend it is a potential trigger for a liquidity-triggered trend reversal. Therefore, open a countertrend position. The profit target is a one-third reversal of the preceding 13-week move. Apply a symmetrical stop-loss. Close the position at the profit target or stop-loss. Otherwise close the position after 13 weeks. * For more details please see the European Investment Strategy Special Report “Fractals, Liquidity & A Trading Model,” dated December 11, 2014, available at eis.bcaresearch.com. Dhaval Joshi Chief European Investment Strategist dhaval@bcaresearch.com Footnotes 1 Expressed as short DAX versus 10-year T-bond. Fractal Trading System Cyclical Recommendations Structural Recommendations Closed Fractal Trades Trades Closed Trades Asset Performance Currency & Bond Equity Sector Country Equity Indicators Bond Yields Chart II-1Indicators To Watch - Bond Yields
Indicators To Watch - Bond Yields
Indicators To Watch - Bond Yields
Chart II-2Indicators To Watch - Bond Yields
Indicators To Watch - Bond Yields
Indicators To Watch - Bond Yields
Chart II-3Indicators To Watch - Bond Yields
Indicators To Watch - Bond Yields
Indicators To Watch - Bond Yields
Chart II-4Indicators To Watch - Bond Yields
Indicators To Watch - Bond Yields
Indicators To Watch - Bond Yields
Interest Rate Chart II-5Indicators To Watch - Interest Rate Expectations
Indicators To Watch - Interest Rate Expectations
Indicators To Watch - Interest Rate Expectations
Chart II-6Indicators To Watch - Interest Rate Expectations
Indicators To Watch - Interest Rate Expectations
Indicators To Watch - Interest Rate Expectations
Chart II-7Indicators To Watch - Interest Rate Expectations
Indicators To Watch - Interest Rate Expectations
Indicators To Watch - Interest Rate Expectations
Chart II-8Indicators To Watch - Interest Rate Expectations
Indicators To Watch - Interest Rate Expectations
Indicators To Watch - Interest Rate Expectations
Highlights The great political surprises of 2016 are approaching key deadlines on November 3 and December 31. Investors should not let Brexit take their eye off the US election. Globalization will retreat faster under Trump regardless of what happens in the United Kingdom. The market is starting to price several clear risks: a failure to extend fiscal relief in the US (25% chance); a surprise Trump tariff move (40%); a contested election (20%); or a failure of the UK and EU to seal a deal (35%). Trump is unlikely to pull off a landslide like Boris Johnson in December 2019. The backdrop has darkened and Biden is an acceptable alternative for voters, unlike Jeremy Corbyn. Go long GBP-USD at the 1.25 mark; go long GBP-EUR volatility. Feature The end game is approaching for the two great political shocks of 2016 – Brexit and Trump. November 3 is the US election and December 31 is the deadline for an UK-EU trade deal. Investor sentiment is starting to show some cracks for various reasons, some technical (Chart 1). But we do not believe near-term volatility and risk-off sentiment have fully run their course yet. Either the US election cycle or the UK’s brinkmanship with the EU, or both, will agitate markets as the deadlines approach. The former is a much weightier factor. Chart 1Market Starts To Price Bevy Of Near-Term Risks ... But Cyclical View Still Constructive
Market Starts To Price Bevy Of Near-Term Risks ... But Cyclical View Still Constructive
Market Starts To Price Bevy Of Near-Term Risks ... But Cyclical View Still Constructive
The risks in play are a failure to extend fiscal relief in the US (25% chance); a conflict between Trump and one of America’s foreign rivals such as China, whether due to Trump’s reelection or lame duck status (40%); a contested election (20%); or a failure of the UK and EU to seal a deal, setting back their economic recovery (35%). Maybe all of these risks will dissipate by mid-November, but maybe not. The market has not discounted any of them fully. So investors should buy insurance now. Vox Populi Is The Biggest Constraint For global investors Brexit is far less consequential than President Trump’s “America First” policy but the UK does punch above its economic weight in financial markets (Chart 2). Chart 2Brexit: Why Should We Care? UK Punches Above Its Economic Weight In Financial Markets
Brexit: Why Should We Care? UK Punches Above Its Economic Weight In Financial Markets
Brexit: Why Should We Care? UK Punches Above Its Economic Weight In Financial Markets
Geopolitical analysis teaches that limitations on policymakers should be the starting point of analysis. For democracies, the biggest constraint of all is the vox populi – the voice of the people, or popular will. The Brexit movement faced a vociferous “Resistance” that won over the media and financial market consensus until reality struck in the general election of December 12, in which the Conservative Party won a historic victory. Chart 3Joe Biden Is Not Jeremy Corbyn
The End-Game For Trump And Brexit
The End-Game For Trump And Brexit
The election vindicated Prime Minister Boris Johnson’s brinkmanship and “hard Brexit” terms, while once again chastening the elites and experts – including an innovative Supreme Court. Johnson’s single-party majority, combined with COVID-19 and the surge in domestic economic stimulus, have increased the odds that the UK will choose sovereignty over the economy and walk away from trade talks. Trump’s supporters show the same enthusiasm as Brexiteers and the same scorn for conventional wisdom and opinion polls. Will they be similarly vindicated? Beyond any knee-jerk equity rally, that would entail a “Phase Two” trade war with China – and possibly a new trade war with Europe or a global trade war. However, Trump faces much worse odds than Boris Johnson did. First, Johnson’s snap election took place at the top of the business cycle, back when a novel coronavirus was just starting to be discovered in Wuhan, China. This is how Harry Truman won his surprise victory in 1948, in defiance of all the opinion polls. Had Truman run in 1949, after a deep recession, the story would have gone differently – which is a problem for both Trump and the near-term equity market. Second, the political alternative was not acceptable in the United Kingdom but it is in the United States. Johnson led Jeremy Corbyn, a far-left rival for the premiership, by around 15%-20% in the polls. The Conservative Party itself led the Labour Party by 10%. By contrast, former Vice President Joe Biden is a center-left Democrat who has many flaws but is not out of the mainstream. He leads President Trump in the polling, as do Democrats over Republicans, though only by single digits. There is no contest between Biden and Corbyn (Chart 3). Trump might still win, but an American version of the UK landslide in 2019 is unlikely. Trump will lose the popular vote even if he wins the Electoral College, and Republicans have a very slim chance of winning the House of Representatives. The implication for financial markets is doubly negative, at least in the near term: there is about a 35% chance that the UK will leave without a deal and about a 35% chance that Trump will win. He could also kick China in the interim period if he loses. Won’t stocks cheer a Trump comeback and victory? Perhaps, but a data-dependent approach suggests that a “blue sweep” is still the base case, and that would be a good trigger for a full equity correction. Nor would a Trump win be positive for long-term equity returns in the final analysis. Trump is reflationary, but a larger trade war would hamper the global economic recovery and thus keep earnings suppressed. There is a 35% chance that Trump will win re-election. Trump is unlikely to win the national vox populi, like Brexit did, but he obviously can win the popular vote in the critical regions – the Sun Belt and the Rust Belt. If he does, the revolution in the global system will be confirmed: the retreat of globalization will accelerate. If he does not, then Brexit alone cannot confirm de-globalization; rather the UK will face even more pressure to make concessions and get a trade deal. Trump’s Path To Victory Chart 4Sitting Presidents Win Half The Time If Recession Ends In H1
Sitting Presidents Win Half The Time If Recession Ends In H1
Sitting Presidents Win Half The Time If Recession Ends In H1
We may well be forced to upgrade Trump’s odds of winning if his comeback gains momentum. Our subjective odds of a Trump win come from the historical record – incumbent parties only retain the White House amid recessions five out of 13 times in American history – but there are some important exceptions. First, the longest-serving American president, Franklin Delano Roosevelt, served during the Great Depression. So obviously a bad economy does not always disqualify a president. Nevertheless FDR got lucky with the timing of the fluctuations and he was personally popular, unlike President Trump. Second, an incumbent president wins 50% of the time if the recession ends before the election – namely in 1900, 1904, and 1924 (contrasted with defeats in 1888, 1912, and 1980). Today’s market performance looks similar to these cases, though premature fiscal tightening is now jeopardizing Trump’s bid (Chart 4). Assuming new stimulus passes, it is extremely beneficial for President Trump that COVID-19 cases are subsiding (Chart 5). Chart 5COVID-19 Subsides In Nick Of Time For Trump?
The End-Game For Trump And Brexit
The End-Game For Trump And Brexit
Chart 6Even Approval Of Trump’s Pandemic Response Improving
The End-Game For Trump And Brexit
The End-Game For Trump And Brexit
His approval rating on handling COVID-19 is somewhat recovering at the moment (Chart 6). Trump’s “law and order” message is also benefiting him amid the rise in vandalism, rioting, and homicide, judging by his improvement in national approval rating across almost all demographic groups, including many that are otherwise averse to Trump. Finally, Trump’s Abraham Accords – a potentially major peace deal between Israel and an expanding list of Arab states – could give his image another boost (Table 1). Foreign policy will not decide the election but these peace deals should not be underrated because they underscore a more important argument for voters: that the US should withdraw from its endless foreign wars and pursue peace and prosperity instead. If Trump’s typically weak approval rating on foreign policy starts to rise then his comeback gains breadth. Table 1The Abraham Accords Give Boost To Trump Image As Peacemaker
The End-Game For Trump And Brexit
The End-Game For Trump And Brexit
We will upgrade our 35% odds of Trump’s re-election if Congress passes a new fiscal relief package, assuming Trump’s polling continues to improve. Our quantitative model is now giving Trump a 45% chance, which is in line with the consensus view but well above our subjective odds (Chart 7). We will upgrade our view if Congress passes a new fiscal relief package, assuming Trump’s polling continues to improve. Chart 7Quantitative US Election Model Puts Trump Win At 45% Odds
The End-Game For Trump And Brexit
The End-Game For Trump And Brexit
Chart 8Stimulus Hiccups Cause Market To Sell
Stimulus Hiccups Cause Market To Sell
Stimulus Hiccups Cause Market To Sell
The stock market does not perform well during periods in which fiscal cliff negotiations are prolonged – the failure of the Emergency Economic Stabilization Act in 2008 is one thing, but today’s impasse is more reminiscent of the debt ceiling crises of 2011 and 2013. Trump is now directly pressuring Senate Republicans to capitulate to House Democratic spending demands. If Republican senators abandon him, market turmoil will undercut his argument that he is the best man to revive the economy and he will lose the election (Chart 8). We do not think they will – and House Speaker Nancy Pelosi’s pledge to keep the House in session until a deal is passed is very positive news – but until the deal is sealed the market is vulnerable. As mentioned above we give a 25% chance of a failure to pass any stimulus bill in September or October. The next chance for stimulus will be in late January or February. Trump stands for growth at all costs, which will be received well by equity markets, other things being equal. But a Trump victory implies more trade war and that the GOP will retain the Senate, creating a steeper fiscal cliff next year – so any relief rally will be short-lived. Meanwhile a Trump defeat raises the risk he will take aggressive actions on the way out to cement his legacy as the Man Who Confronted China, and bind the Biden administration to decoupling policy. This is not a favorable outlook for investor sentiment or the economic recovery over the next few months. Brexit: The Three Kingdoms Will Force A Trade Deal Chart 9Sterling Will Fall Before It Bounces Back On A Deal
Sterling Will Fall Before It Bounces Back On A Deal
Sterling Will Fall Before It Bounces Back On A Deal
In December 2016 we pointed to the three kingdoms – England, Ireland, and Scotland – as the origin of the geopolitical and constitutional crisis that would arise from the Brexit referendum and act as a powerful bar against a no-deal Brexit. That framework remains salient today as the risk of no-deal escalates due to quarrels over Northern Ireland Protocol, which was agreed in October 2019 as part of the formal Withdrawal Agreement that made Brexit happen on January 31, 2020. The implication is that the pound has not bottomed yet, though we see a buying opportunity around the corner (Chart 9). No one should doubt that the UK could walk away from the EU without a deal this December: The Tories’ single-party majority gives them the raw capability to push through plans they decide on – and raises the risk that they will overreach. The tariff shock of a no-deal exit is frequently exaggerated. The UK would suffer a tariff shock of about 1.38% of GDP, larger than what the US suffered in its tariff-war with China but hardly a death knell (Table 2). (The costs of losing single-market access would grow over time, however.) Table 2A No-Trade-Deal Brexit Would Create A Minimum Tariff Shock Of 1.4% Of GDP
The End-Game For Trump And Brexit
The End-Game For Trump And Brexit
COVID-19 has supplanted the worst-case outcome of a no-deal exit by producing a much worse recession than anyone feared. The US is using the disruption to decouple from China and the UK could do the same with the EU. The result of COVID-19 is massive domestic stimulus that raises the UK’s and Europe’s threshold for pain. Any failure of trade talks would spur more stimulus. The Bank of England still has some bond-buying ammunition left and parliament, again, is undivided. Given that Boris Johnson has until 2024 before the next election, there is theoretically time for his personal and party approval ratings to improve as the economy recovers from the pandemic and any messy Brexit (Chart 10). Chart 10Bojo Has Until 2024 To Recover From Crises
The End-Game For Trump And Brexit
The End-Game For Trump And Brexit
Chart 11UK Would Face WTO-Level Tariffs If No Deal
The End-Game For Trump And Brexit
The End-Game For Trump And Brexit
The UK’s position in the quarrel over Ireland is rational – but so is the EU’s. If the trade talks collapse, the UK will need to remove any regulatory or customs divisions with Northern Ireland. Yet in preparing to do so it vitiates trust with the EU and makes a trade deal less likely. However, weighing all these points up, an UK-EU trade deal is still the most likely outcome (65% chance), as the economic and political costs are crystal clear while the benefits of a hard break are not so clear. Allow us to explain. Northern Ireland is the latest cause of tensions, although it was inevitable that tensions would arise ahead of the end-of-year deadline for a trade deal. Westminster has proposed an Internal Market Bill, which has passed with solid majorities in two readings in parliament, to reclaim aspects of sovereignty over Northern Ireland that were traded away to clinch the Withdrawal Agreement last year. The Johnson government’s position should be seen as a negotiating tactic to build leverage in the talks but also as a real fallback position if the talks fail. The House of Lords could delay the bill by a year, meaning that it may not take effect until end of 2021 – but a trade deal would make it moot. The Northern Ireland Protocol solved the riddle of how to preserve the integrity of the EU’s single market after Brexit yet avoid a return to a hard customs border with the Republic of Ireland. Customs checks were removed with the Good Friday (or Belfast) Agreement in 1998, which ended the Troubles between the two Irelands. The Protocol introduces a pseudo-customs border on the Irish Sea, requiring declarations on exports to Great Britain and EU oversight of UK state aid for Northern Irish firms, so that Northern Ireland can stay in the EU customs area while the UK can leave and still preserve a semblance of its own customs area in Northern Ireland. If the UK and EU get a trade deal, then all trade is tariff-free and the Protocol becomes redundant. Also, the Protocol enables a Joint Committee to review disputes over exports to Northern Ireland that are “at risk” of making their way into the EU without duties. The Protocol is supposed to operate even if the UK and EU fail to get a trade deal. Yet it is politically untenable for the UK to subject trade within its own country to EU rules or duties, or allow the EU to supervise state corporate subsidies across the UK, if no deal is agreed. The UK is more likely to violate the treaty to preserve its internal integrity. As Northern Ireland Secretary Brandon Lewis admitted, “Yes, this [Internal Market Bill] does break international law in a very specific and limited way.” While the EU’s threat to slap tariffs on British food exports to Northern Ireland is the proximate trigger of the Internal Market Bill, another key reason for the UK’s aggressive shift is the issue of state aid. All governments are extending emergency aid to major corporations to keep them from insolvency amid the recession. This will be the case for some time and it is even more true of the EU than of the United Kingdom. However, under the Protocol, the EU would be able to penalize companies in Great Britain that receive subsidies if goods or firms in Northern Ireland can be shown to benefit. Northern Ireland is supposed to operate within the EU’s standards on state aid. London obviously bristles at this backdoor for letting in EU regulation, not least because, in the event that a trade deal is not reached, it will need to pump the country full of state aid to compensate for the shock of seeing exports to the EU rise by 3% across the board according to Most Favored Nation status under the World Trade Organization (Chart 11). An UK-EU trade deal is the most likely outcome. As Dhaval Joshi of BCA’s European Investment Strategy points out, Boris needs to keep his own Tories under his heel (Chart 12). The Internal Market Bill provoked a backlash among 30 moderates. If that number rises to 40 Johnson loses his majority. This is a problem that he is seeking to address by giving parliament a veto over any future uses of the bill that would violate international law (this is an acceptable compromise because he has a majority). But a failure to drive a hard bargain with the EU would cause a much bigger rebellion among hard Brexit Conservative MPs and threaten his job. Chart 12Bojo Must Balance Hard Brexit Tories
The End-Game For Trump And Brexit
The End-Game For Trump And Brexit
Geopolitics is about might, not right – the UK can assert its sovereignty and violate these international agreements, while the EU can then apply punitive tariffs, non-tariff barriers, and sanctions under the Withdrawal Agreement. Brexit is a power-political struggle that could devolve into a trade war. Obviously that would be a very bad outcome for the market, particularly for the UK, which is overmatched (Chart 13). But this risk is also a key limitation on the UK that will prevent this worst-case outcome. Indeed, despite all of the above, our base case is still that the UK and EU will get a deal. First, the economy will clearly suffer without a deal. After all, the US-China tariffs produced a negative effect for these two economies in 2019 and the impact on the UK would be bigger than that on the US (Chart 14). Chart 13The Brick Wall The UK Cannot Avoid
The Brick Wall The UK Cannot Avoid
The Brick Wall The UK Cannot Avoid
Chart 14UK Faces Trade Shock If No Deal
UK Faces Trade Shock If No Deal
UK Faces Trade Shock If No Deal
Second, the public doesn’t support a no-deal exit (Chart 15). Northern Ireland itself voted against Brexit in the referendum and as such would rather see an agreement that groups the UK and the EU under a single zero-tariff free trade agreement. Third, Boris faces a rebellion in Scotland if he pursues a hard break. The Scottish National Party would revive ahead of Scottish elections in May 2021 and demand a second independence referendum (Chart 16). The Irish Sea is a natural division that makes a more intrusive customs presence more supportable than otherwise. A little more paperwork is an acceptable cost to keep the United Kingdom from falling apart. Scotland is much more likely to go independent than Ireland is to unite. Chart 15Only 25% Think 'No Deal' A Good Outcome
The End-Game For Trump And Brexit
The End-Game For Trump And Brexit
Boris is now prime minister, not just party leader, and he will ultimately have to decide whether he wants to be the last prime minister of a United Kingdom. Assuming Boris is at least focused on the next election, he will have to decide if he wants the rest of his premiership to be consumed with a self-inflicted double-dip recession and democratic revolt in Scotland, or a recovery on the back of a functional if uninspiring trade deal enabling him to head off the Scottish threat and save the union. Chart 16No Deal' Would Boost Scottish Independence Movement
No Deal' Would Boost Scottish Independence Movement
No Deal' Would Boost Scottish Independence Movement
Obviously the final deal may not be clinched until the eleventh hour. The October 15 deadline can be delayed but talks must conclude in November or December in time to be ratified by the EU member states by December 31. US Election Drives Geopolitics, But Not The Brexit Outcome One factor that will not play much of a role in the UK’s decision-making is the US election. It is true that the Johnson government would benefit from President Trump’s reelection. But the EU is a much bigger market for the UK and the UK’s best strategy is to focus on its national interest regardless of what the US does. The US election may not be decided in mid-December in time for the UK to agree to a deal that can be ratified by year’s end anyway. Moreover the UK’s best strategy is to conclude a deal with the EU first, and then pursue a deal with the United States. This is because President Trump will be inclined to sign at least an executive deal, while a congressional deal requires support from the Democrats, which is only possible if Northern Ireland is resolved without hard border checks. Because the EU makes up such a larger share of British trade, an American deal does not give the UK much leverage in negotiating with the EU, but an EU deal does give the UK greater leverage in negotiating with the US. As Diagrams 1 and 2 show, this strategic logic holds even if the UK knows the outcome of the US election ahead of time: the scenarios with the least benefit and the greatest cost would still be scenarios involving no deal with the European Union. Diagrams 1 & 2United Kingdom Wants An EU Trade Deal (Regardless Of Trump/Biden)
The End-Game For Trump And Brexit
The End-Game For Trump And Brexit
Diagram 3 boils all of this down to a single decision tree. First, the diagram shows that the economic costs are not prohibitive and therefore the risk of a no-deal exit is substantial – we would say 35%. Second, it shows that the risks of the negotiation are skewed to the downside. Third, it highlights that the UK will settle its affairs directly with the EU and not hinge its actions on the US election cycle. Diagram 3No-Deal Brexit Cost Not Prohibitive, But Best Strategy Is To Get A Deal
The End-Game For Trump And Brexit
The End-Game For Trump And Brexit
Clearly the best strategy and best outcome involve seeking a trade deal with the EU, and hence it is our base case. This means an opportunity to buy the pound and domestic-oriented British equities, and turn neutral on gilts, is just around the corner. Investment Takeaways The GBP-EUR is the best measure of the market’s sensitivity to Brexit risks, so it should fall in the near term and rally sharply after resolution. However, the US election complicates things. The euro’s response is fairly binary: it is one of the biggest winners if Biden wins and one of the biggest losers if Trump wins. Hence GBP-EUR volatility will rise in the coming months (Chart 17). We recommend going long 1-month implied volatility contracts for October and November. The pound sterling, by contrast, will ultimately rise regardless of US election result, since the UK will pursue a trade deal out of its own national interest. Trump is less negative for the US dollar than Biden and a comeback and victory will drive a counter-trend dollar bounce. However, in the medium term we expect the dollar to fall regardless due to debt monetization and global growth recovery. Thus we recommend going long GBP-USD on a strategic basis when political risks peak over the next two-to-three months and GBP-USD falls to around 1.25, as recommended by our Foreign Exchange Strategist Chester Ntonifor (Chart 18). Chart 17EUR-GBP Volatility Will Rise
EUR-GBP Volatility Will Rise
EUR-GBP Volatility Will Rise
Sterling bears are forgetting that the sound defeat of Corbyn ruled out a sharp left-wing turn in domestic economic policy (higher taxes), while the Tories have made a clear turn against fiscal austerity. Therefore the worst-case scenario is a failure to agree to a trade deal by the end of this year. But that is not the base case and the risk will be priced within a month or two. Chart 18Pound Will Rally After Deal Concluded In November Or December
Pound Will Rally After Deal Concluded In November Or December
Pound Will Rally After Deal Concluded In November Or December
Chart 19Yes, China Is Opening The Taps
Yes, China Is Opening The Taps
Yes, China Is Opening The Taps
We remain tactically cautious and defensive even though the US fiscal negotiations are improving. The market is underrating too many clear and concrete risks to sentiment and the corporate earnings outlook, so the current bout of volatility can continue until there is greater clarity on US fiscal spending, the US election cycle, associated geopolitical risks, and the Brexit showdown. Book gains on long Brent trade for a return of 69.7%. We initiated this trade on March 27 in our “No Depression” report, which marked our shift to a strategic risk-on positioning. We remain bullish on oil prices and commodities on the back of global stimulus and our assessment that the OPEC 3.0 cartel will maintain discipline overall, but the next three-to-six months are crowded with downside risk. Cyclically, we see a global economic recovery deepening and broadening. China’s stimulus is surprising to the upside, as we have long written and the latest credit numbers bear this view out (Chart 19), which is critical for global reflation. Matt Gertken Vice President Geopolitical Strategy mattg@bcaresearch.com