Euro Area

Highlights The U.S.-Sino trade war is taking a dangerous turn, but the U.S. should avoid a recession until 2022. Global growth will bottom in early 2020. The Fed is set to cut rates two to three times in the next year. Safe-haven bonds have more tactical upside, but will perform poorly on a cyclical basis. Long-term investors should use the next six to nine months to offload their corporate bonds. Equities will be volatile for the rest of 2019; a breakout is forecast for 2020. Long-term investors should favor stocks over bonds, and international stocks over U.S. ones. Feature The yield curve has become the punch line of late-night shows, triggered by the 2-/10-year yield curve inversion in early August. Recession fears have hit the front page. There are good reasons for the mounting concern. Historically, yield curve inversions have done an excellent job forecasting recession. The trade war between the U.S. and China is intensifying at an alarming speed. Moreover, global government bond yields are dipping to all-time lows. Additionally, the global ZEW and PMIs are depressed, while the global production of capital goods and machinery is contracting (Chart I-1). Despite this backdrop, the odds of a U.S. recession are overstated. Consumers in the U.S. and other advanced economies are healthy, the U.S. Federal Reserve and other major central banks are easing, and global financial conditions are supporting growth. We expect stocks to break out of their volatile period of consolidation early next year. Bond yields should rise later this year, but it is too early to stand in front of their downward trend. Finally, long-term investors should use any additional narrowing in credit spreads to lighten their exposure to corporates. U.S. Recession Odds Are Low The yield curve signal is not as dire as the headlines suggest. The inversion is incomplete; the curve is inverted up to the five-year mark and beyond that point, it steepens again. If the yield curve foreshadows a recession, then its slope would be negative across all maturities (Chart I-2). Chart I-1The List Of Worries Is Long
The List Of Worries Is Long
The List Of Worries Is Long
Chart I-2
The consumer sector is doing well despite the global growth slowdown. Real retail sales, excluding motor vehicles, are growing at 4.4% and have quickly recovered from this past winter’s government shutdown. Meanwhile, retailers such as Walmart, Target, Home Depot and Lowe’s are reporting strong numbers. Three factors insulate consumer spending from global woes. First, household disposable income is expanding at a healthy 4.7% pace, courtesy of a tight labor market. Secondly, household balance sheets are robust. Household debt-servicing costs only represent 9.9% of disposable income, the lowest reading in more than four decades (Chart I-3, first panel). According to a December BIS paper, debt-servicing costs are one of the best forecasters of recessions.1 Additionally, household debt relative to GDP and to household assets is at 16- and 34-year lows, respectively (Chart I-3, second and third panel). Thirdly, the U.S. savings rate, which stands at 8.1%, already offers a cushion against adverse shocks and has limited upside. The corporate sector also displays some easily overlooked positives. So far, the PMIs and capex growth are still in mid-cycle slowdown territory. Meanwhile, debt loads have never provided an accurate recessionary signal. Since the end of the gold standard, recessions have always materialized after debt-servicing costs as a share of EBITDA rose two to four percentage points above their five-year moving average. We are nowhere near there (Chart I-4). Chart I-3Consumer Balance Sheets Are Very Robust
Consumer Balance Sheets Are Very Robust
Consumer Balance Sheets Are Very Robust
Chart I-4Corporate Debt Is Not In Recessionary Territory
Corporate Debt Is Not In Recessionary Territory
Corporate Debt Is Not In Recessionary Territory
Nevertheless, we will remain vigilant on the capex trend. Corporate investment may not indicate a recession, but the escalating trade war with China will hurt capex intentions. Even if capex contracts, as in 2016, the economy can still avoid a recession. The factors that prompted slowdowns in global trade and manufacturing provide a mixed message. Housing is showing some positive signs after subtracting from GDP in the past six quarters. The NAHB Housing Market Index is recovering smartly from its plunge last year and homebuilder stocks have been outperforming the S&P 500 since October 2018 (Chart I-5). Meanwhile, the 139-basis point collapse in mortgage rates since November 2018 is finally impacting the economy. Mortgage demand is surging, according to the Fed’s Senior Loan Officers Survey. The MBA mortgage applications data corroborate this observation. As a result, both existing home sales and residential investment are trying to bottom (Chart I-6). Chart I-5Leading Indicators Of Residential Activity Are Improving
Leading Indicators Of Residential Activity Are Improving
Leading Indicators Of Residential Activity Are Improving
Chart I-6Positive Signs For Residential Activity
Positive Signs For Residential Activity
Positive Signs For Residential Activity
The liquidity of the U.S. private sector is also strengthening. Deposit growth has reaccelerated after falling to near recessionary levels (Chart I-7) and the non-financial, private sector’s cash holdings are again increasing faster than debt. Furthermore, bank credit is expanding. Chart I-7The Private Sector Is Accumulating Liquidity
The Private Sector Is Accumulating Liquidity
The Private Sector Is Accumulating Liquidity
Waiting For The Global Economy To Bottom Global growth should bottom by early 2020. Thus, while the U.S. economy should avoid a recession, any distinct re-acceleration will wait until next year. The factors that prompted slowdowns in global trade and manufacturing provide a mixed message. The trade war between the U.S. and China is intensifying. Chinese activity has not yet bottomed but policymakers will be increasingly forced to react. However, the global inventory down cycle is advanced, and in Europe, domestic activity indicators are holding up despite the continued deterioration in external and industrial conditions. Trade War The uncertainty created by the Sino-U.S. trade war is hurting global growth. On August 1, U.S. President Donald Trump announced a 10% tariff on the remaining $300 billion of Chinese exports to the U.S. The tariffs are phased in: $112 billions of goods will be taxed on September 1 while $160 billion will be hit on December 15. Unsurprisingly, a vicious circle of retaliation has been unleashed as China imposed a tariff ranging from 5% to 10% on U.S. goods last Friday, to which Trump immediately responded with a tariff hike from 25% to 30% on the $250 billion batch of goods and from 10% to 15% on the $300 billion batch slated to come into place September 1 and December 1. To bring back hedged foreign buying of Treasurys, the Fed will have to engineer a steeper yield curve and lower FX hedging costs. A resumption in talks between Beijing and Washington in September will offer little solace to investors. Even if President Trump is pressured by the stock market and the U.S. electoral calendar to settle for what Beijing is offering, it is not clear that President Xi Jinping will accept a deal. As BCA’s Chief Geopolitical Strategist Matt Gertken discusses in Section II, the two superpowers are locked in a multi-decade geopolitical rivalry and the Hong Kong protests and tensions over Taiwan could move the talks off track. China’s Challenges China’s economy has yet to bottom convincingly. So far, Chinese reflation has been weaker than anticipated. Given that stimulus has not been forceful, the uncertainty produced by the trade war and the illiquidity created by bloated balance sheets is still dragging down China’s marginal propensity to consume (Chart I-8). However, this propensity to spend has little downside, if the past 10 years are any indication. Chinese infrastructure and equipment investment needs to be revived. They are shouldering the bulk of the decline in economic activity and have slowed to an annual pace of 2.8% and -2.1%, respectively. Residential investment is expanding at a 9.4% annual rate (Chart I-9), but according to Arthur Budaghyan, BCA’s Chief Emerging Markets Strategist, even this sector’s strength could be an illusion. Chinese property developers are starting projects to raise funds via pre-sales. However, they are not completing nearly as many projects as they have started.2 Chart I-8A Falling Marginal Propensity To Spend Means More Stimulus Is Needed
A Falling Marginal Propensity To Spend Means More Stimulus Is Needed
A Falling Marginal Propensity To Spend Means More Stimulus Is Needed
Chart I-9
We are not yet ready to give up on Chinese stimulus as the economy is on the verge of a deflationary spiral that could push debt-to-GDP abruptly higher. The following developments support this view: The statement following the July Politburo meeting showed a greater willingness to stimulate economic activity, as long as it does not add to the property bubble. Producer prices are again deflating. Contracting PPIs often unleash vicious circles as they push real rates higher and hurt investment, which foments additional price declines. Retail sales are slowing and the employment components of the manufacturing and non-manufacturing PMIs have fallen to 47.1 and 48.7, respectively. China’s economy needs to be insulated from the intensifying trade war with the U.S. or the deteriorating labor market will dampen consumer spending even more. We expect more tax cuts, more credit growth, and more issuance of local government special bonds to finance government spending, following China’s 70th anniversary celebrations on October 1. As Chart I-10 illustrates, an acceleration in total social financing will ultimately lift EM PMIs as well as Asian and European exports. Inventory Cycle The inventory cycle is very advanced. Inventories in the U.S., China and euro area are depleting (Chart I-11). Inventories cannot fall forever, especially when global monetary policy is increasingly accommodative and fiscal policy is loosened. Chart I-10More Chinese Stimulus Will Eventually Support Global Growth
More Chinese Stimulus Will Eventually Support Global Growth
More Chinese Stimulus Will Eventually Support Global Growth
Chart I-11The Inventory Purge Is Advanced
The Inventory Purge Is Advanced
The Inventory Purge Is Advanced
Global activity can rebound if the inventory adjustment ends. Inventory fluctuations help drive the Kitchin cycle, a 36-40 month oscillation in activity. According to BCA’s Chief Global Strategist, Peter Berezin, the current slowdown is nearing 18 months, the typical length of a down oscillation in these cycles (Chart I-12).3 Europe The manufacturing-heavy euro area will benefit when the global industrial cycle bottoms, but domestic tailwinds are also emerging. European deposits accumulation is quickening, driven by households (Chart I-13, top panel). Meanwhile, the European credit impulse has recovered thanks to the fall in both non-performing loans and borrowing costs (Chart I-13, bottom panel). Moreover, consumer spending is healthy as household balance sheets are improving and wage growth is accelerating to a 3.2% annual pace. Finally, last month we highlighted that the euro area fiscal thrust is set to increase by 0.7% of GDP this year.4 Fiscal easing appears set to expand as Germany and Italy study support packages. Finally, the Italian political uncertainty is receding as the Five Star Movement and the Democratic Party have agreed to form a coalition government. Chart I-12The Three-Year Cycle Is Also Advanced
The Three-Year Cycle Is Also Advanced
The Three-Year Cycle Is Also Advanced
Chart I-13Some Ignored Improvements In Europe
Some Ignored Improvements In Europe
Some Ignored Improvements In Europe
At the moment, the biggest risk for Europe is the significant probability of a No-Deal Brexit. After the recent decision to prorogue Parliament, Matt Gertken raised his probability of a No-Deal Brexit to one third from 20%.Such an event would negatively impact Dutch, German and French exports, which could scuttle any improvement in Europe. Adding It Up The combined effects of more Chinese stimulus in the fourth quarter, an impending end to the global inventory drawdown, and an endogenous improvement in Europe, all should ultimately outweigh the negatives created by the U.S.-Sino trade war. Moreover, global financial conditions are easing (Chart I-14). Therefore, the fall in global bond yields should push the G-10 12-month credit impulse higher (Chart I-14, bottom panel). Lower oil prices should also help G-10 consumers. Early indicators support this assessment. BCA’s Global Leading Economic Indicator has been slowly bottoming, and according to its diffusion index, it will soon move higher (Chart I-15, top panel). Moreover, Singapore’s container throughput is tentatively stabilizing, while our Asian EM Diffusion Index is improving, albeit from depressed levels (Chart I-15, second panel). Finally, ethylene and propylene prices are rallying with accelerating momentum (Chart I-15, third and fourth panels). Chart I-14Easier Financial Conditions Favor Credit Growth
Easier Financial Conditions Favor Credit Growth
Easier Financial Conditions Favor Credit Growth
Chart I-15Some Growth Indicators Are Stabilizing
Some Growth Indicators Are Stabilizing
Some Growth Indicators Are Stabilizing
Bottom Line: The U.S. economy will probably slow further in the coming months, but it will not enter into recession anytime soon. Neither debt nor consumers pose problems, the housing sector is turning the corner and the private sector’s liquidity position is strengthening. Meanwhile, global activity is trying to bottom, but any improvement will be delayed by the latest round of trade tensions. However, global policymakers are responding, thus global growth should improve by early 2020. Fed Policy: More Cuts Expected Chart I-16A Liquidity Crunch In The Interbank Market?
A Liquidity Crunch In The Interbank Market?
A Liquidity Crunch In The Interbank Market?
Our base case is that the Fed will cut rates twice more in the coming nine months. In the tails of the probability distribution, three supplementary cuts are more likely than only one additional cut. Paradoxically, liquidity considerations support our Fed view. A recurring theme in our research is the improvement in global liquidity indicators such as excess money, deposit growth and our financial liquidity index.5 However, these indicators are not able to boost growth because of an important technical consideration. What might be classified as excess reserves by the Fed may not be free reserves. Higher Supplementary Leverage Ratios under Basel III rules require commercial banks to hold greater levels of excess reserves to meet their mandatory Tier 1 capital ratios. Since the Fed’s balance sheet runoff results in falling excess reserves, the decline in reserves may have already created some illiquidity in the interbank system. Global central banks have been divesting from the T-bill market, which is worsening the decline in excess reserves. They have parked their short-term funds at the New York Fed’s Foreign Repurchase Agreement Pool (Foreign Repo Pool) which limits the availability of reserves in the banking system (Chart I-16).6 These dynamics increase the cost of hedging the dollar for foreign buyers of U.S. assets. When reserves fall below thresholds implied by Basel III regulations, global banks lose their ability to use their balance sheets to conduct capital market transactions. Without this necessary wiggle room, they cannot arbitrage away wider cross-currency basis swap spreads and deviations of FX forward prices from covered interest rate parity. For foreign investors, the cost of hedging their FX exposure increases. Together with the flatness of the U.S. yield curve, hedged U.S. Treasurys currently yield less than German Bunds or JGBs (Table I-1).
Chart I-
Chart I-17Declining Excess Reserves Hurt Risk Assets And Growth
Declining Excess Reserves Hurt Risk Assets And Growth
Declining Excess Reserves Hurt Risk Assets And Growth
Lower excess reserves and higher hedging costs have been bullish for the USD and negative for the global economy. Instead of buying hedged Treasurys, foreigners purchase U.S. assets unhedged (agency and corporate bonds, not Treasurys). Thus, falling excess reserves have been correlated with a stronger dollar, softer global growth and weaker EM asset and FX prices (Chart I-17). This adverse environment has accentuated the downside in Treasury yields and flattened the yield curve (Chart I-17, bottom panel). Going forward, these problems should intensify. The Treasury will issue over US$800 billion of debt by year-end to replenish its cash balance and finance the bulging U.S. budget deficit. Primary dealers will continue to plug the void left by foreigners and will purchase the expanding issuance (Chart I-18). In the past year, primary dealers have already increased their repo-market borrowing by $300 billion to finance their inventories of securities. They will need to expand these borrowings, which will further lift the cost of hedging U.S. assets. Thus, foreign investors faced with $16 trillion of assets with negative yields will buy more U.S. assets on an unhedged basis. The dollar will rise and global growth conditions will deteriorate. The Fed will have to cut rates two to three more times, otherwise the dangerous feedback loop described above will take hold. These cuts are more than domestic economic conditions warrant. To bring back hedged foreign buying of Treasurys, the Fed will have to engineer a steeper yield curve and lower FX hedging costs. The end of the balance sheet runoff is a step in the right direction, but it will not be enough. The BCA Financial Stress Index and our Fed Monitor are consistent with this view (Chart I-19). Moreover, the intensifying trade war is hurting the outlook for growth, inflation expectations and the stock market. Chart I-18A Large Inventory Build Up By Primary Dealers
A Large Inventory Build Up By Primary Dealers
A Large Inventory Build Up By Primary Dealers
Chart I-19Two To Three More Cuts Are Coming
Two To Three More Cuts Are Coming
Two To Three More Cuts Are Coming
Investment Implications Government Bonds We have revised our position on an imminent end to the bull market. We do expect bond yields to be higher in 12 months, but for now the global economy has too many risks to time a bottom in yields. The cyclical picture for bonds is bearish. Treasurys have outperformed cash by 8% in the past year, a performance normally associated with a fed fund rate that is 200 to 300 basis points below what markets anticipated 12 months ago (Chart I-20). In order for Treasurys to continue outperforming cash, the Fed must cut rates to zero next year. Nonetheless, a U.S. recession is not in the offing and the global economy should perk up by early 2020. At most, the Fed will validate current rate expectations of 96 basis points of cuts. Chart I-20The Fed Must Cut To Zero For Bonds To Further Outperform Cash Next Year
The Fed Must Cut To Zero For Bonds To Further Outperform Cash Next Year
The Fed Must Cut To Zero For Bonds To Further Outperform Cash Next Year
Valuations are also consistent with Treasurys delivering negative returns in the next 12 months. According to the BCA Bond Valuation Index, Treasurys are extremely overvalued. Moreover, real 10-year yields are two standard deviations below the three-year moving average of real GDP growth, a proxy for potential GDP (Chart I-21). Investors should wait to sell bonds until the Fed cuts rates by another 50 basis points, global and U.S. PMIs stabilize, and our cyclical indicator sends a sell signal. Technicals also point to poor 12-month prospective returns. The 13-week and 52-week rates of change in yields are consistent with tops in bond prices (Chart I-22). Positioning is also very stretched, as highlighted by the J.P. Morgan Duration Survey, the Bank of America Merrill Lynch Investors Survey, ETF flows, and government bonds futures and options holdings of asset managers. As a result, our Composite Technical Indicator is very overbought (Chart I-22, bottom panel). Chart I-21U.S. Bonds Are Very Expensive ...
U.S. Bonds Are Very Expensive ...
U.S. Bonds Are Very Expensive ...
Chart I-22... And Very Overbought
... And Very Overbought
... And Very Overbought
The quickening pace of accumulation of securities on bank balance sheets also points to higher yields in 12 months (Chart I-23). As banks stockpile liquid assets, they accumulate more juice to fuel future lending. However, the rising cost of hedging FX exposure is bullish for the dollar. Hence, increasing Treasury holdings will not lift yields until the Fed cuts rates more aggressively. We are reluctant to recommend shorting / underweighting bonds. As Chart I-24 illustrates, mounting uncertainty over economic policy anchors U.S. yields. Last week’s round of tariff increases, along with the Brexit saga, suggests that the uncertainty has not yet peaked. Chart I-23A Coiled Spring
A Coiled Spring
A Coiled Spring
Chart I-24Uncertainty Is Keeping Global Bonds Expensive
Uncertainty Is Keeping Global Bonds Expensive
Uncertainty Is Keeping Global Bonds Expensive
The collapse in German yields is also not finished. The fall in bund yields to -0.7% has dragged down rates worldwide as investors seek positive long-term returns. In response, the U.S. 10-year premium dropped to -1.1%. Historically, bunds end their rally when yields decline 120 basis points below their two-year moving average (Chart I-25). If history is a guide, German yields could bottom toward -1%, which is in line with Swiss 10-year yields. The 1995 experience also argues against an imminent end to the bond rally. In a recent Special Report, BCA’s U.S. Equity Strategy service highlighted the parallels between today’s environment and the aftermath of the December 1994 Tequila Crisis.7 In that episode, global growth troughed and the Fed cut rates three times before the U.S. ISM Manufacturing Index bottomed in January 1996. Only then did Treasury yields turn higher (Chart I-26). A similar scenario could easily unfold. Chart I-25More Downside For German Yields
More Downside For German Yields
More Downside For German Yields
Chart I-26Bottom In Yields: Wait For The ISM To Turn And The Fed To Cut More
Bottom In Yields: Wait For The ISM To Turn And The Fed To Cut More
Bottom In Yields: Wait For The ISM To Turn And The Fed To Cut More
EM assets are vulnerable and could spark a last stampede into U.S. Treasurys. Investors of EM fixed-income products have not yet capitulated. EM assets perform poorly when global growth is weak, dollar funding is hard to come by and trade uncertainty is rising. Yet, yields on EM local-currency bonds have fallen, indicating little selling pressure. Rather than dispose of their EM holdings, investors have hedged their EM exposure by selling EM currencies. Therefore, EM bonds are rallying with EM currencies falling (Chart I-27), which is a rare occurrence. Recent cracks in EM high-yield bonds and the breakdown in EM currencies suggest investors will not ignore the trade war for much longer. The ensuing flight to safety should pull down Treasury yields. Chart I-27A Rare Occurrence
A Rare Occurrence
A Rare Occurrence
BCA’s Cyclical Bond Indicator has yet to flash a buy signal, which will only happen when the indicator moves above its 9-month moving average (Chart I-28). Investors should wait to sell bonds until the Fed cuts rates by another 50 basis points, global and U.S. PMIs stabilize, and our cyclical indicator sends a sell signal. As a corollary, we remain positive on gold prices and expect the yellow metal to move to $1,600 in the coming months. Chart I-28BCA Cyclical Bond Indicator: Don't Sell Yet
BCA Cyclical Bond Indicator: Don't Sell Yet
BCA Cyclical Bond Indicator: Don't Sell Yet
Corporate Bonds Chart I-29Corporate Bond Fundamentals Are Worsening
Corporate Bond Fundamentals Are Worsening
Corporate Bond Fundamentals Are Worsening
The long-term outlook for corporate bonds is deteriorating enough that long-term investors should use any rally to lighten their exposures. However, on a six- to nine-month horizon, stresses will probably remain contained. A significant deterioration in corporate health will hurt this asset class’s long-term returns. Recent data revisions pushed GDP and productivity well below previous estimates. This curtailed corporate profitability, lifted debt-to-cash flow ratios, and hurt interest coverage measures. BCA’s Corporate Health Monitor is flashing its worst reading since the financial crisis. Moreover, the return on capital is at its lowest level in this cycle. Historically, these developments have pointed to higher default rates and spreads (Chart I-29). Worryingly, average interest coverage and profitability levels are distorted. Tech firms only account for 8% of the U.S. corporate bond universe, yet they represent 19% of cash flows generated by the U.S. corporate sector. Outside the tech sector, cash generation is poorer than suggested by our Corporate Health Monitor. This will amplify losses when the default cycle begins. The poor quality of bond issuance in the past 8 years will also hurt recovery rates when defaults rise. Since then, junk bonds constitute 10% of overall issuance, and BBB-rated bonds represent 42% of investment-grade issues. Historical averages are 9% and 27%, respectively. Additionally, covenants have been particularly light in the same period. Investors with horizons of one year or less still have a window to own corporate bonds. Moreover, since the deviation of corporate debt-servicing costs as a percentage of EBITDA remains well below historical trigger points, an imminent and durable jump in spreads is unlikely. Within the corporate universe, BCA’s U.S. Bond Strategy service currently favors high-yield to investment-grade bonds.8 Breakeven spreads in the junk space are much more rewarding than those offered by investment-grade issues (Chart I-30). Equities We expect the S&P 500 to remain volatile and below 3,000 for the rest of 2019. Early next year, an upside breakout will end this period of churn. The S&P will probably soon test the 2,700 level. Technically, the selling is not exhausted. The number of stocks above their 40-, 30- and 10-week moving averages have formed successively lower highs and are not yet oversold (Chart I-31). Furthermore, the Fed is unlikely to deliver a dovish surprise in September. Fed Chairman Jerome Powell’s recent speech at Jackson Hole suggests that the Fed needs to see more pain before moving ahead of the curve. Chart I-30Short-Term Investors Should Favor Junk Over Investment Grade Issues
Short-Term Investors Should Favor Junk Over Investment Grade Issues
Short-Term Investors Should Favor Junk Over Investment Grade Issues
Chart I-31This Correction Can Run Further
This Correction Can Run Further
This Correction Can Run Further
Once stocks stabilize, the subsequent rebound will not lead to an immediate breakout this year. Yields will move up when growth picks up or if President Trump becomes less combative on trade. However, falling interest rates have been a crucial support for stock prices in 2019. As the 1995-1996 experience shows, when the ISM turned up, the S&P 500 did not gain much traction. Higher yields pushed down multiples even as earnings estimates strengthened. We are more positive on the outlook for stocks next year with BCA’s Monetary Indicator pointing to higher stock prices (see Section III). Moreover, bear markets materialize only when a recession is roughly six to nine months away (Chart I-32). The S&P still has time to rally because we do not anticipate a recession until early 2022. Chart I-32No Recession, No Bear Market
No Recession, No Bear Market
No Recession, No Bear Market
Chart I-33Better Prospects For Non-U.S. Stocks
Better Prospects For Non-U.S. Stocks
Better Prospects For Non-U.S. Stocks
Cyclical investors should move their equity holdings outside the U.S. International markets are comparatively cheap (Chart I-33, top panel). Moreover, a rebound in global growth early next year is congruent with U.S. underperformance. Finally, our earnings models forecast an end to the deterioration of European profit growth in September 2019, but not yet in the U.S. (Chart I-33, bottom two panels). Stocks should outperform bonds on a long-term basis. According to the BCA Valuation Index, U.S. stocks are extremely expensive (see Section III). Our valuation indicator would be as elevated as in 2000 if interest rates were not so depressed today. As Peter Berezin showed in BCA’s Global Investment Strategy service, based on current valuation levels, investors can expect 10-year returns of 3.0%, 4.5%, 11.9% and 7.4% for the U.S., euro area, Japan and EM equities, respectively.9 This is not appealing. Nonetheless, long-term equity expected returns are superior to bonds. If held to maturity, they will return 1.5%, -0.7%, and -0.3% annually in the U.S., Germany and Japan, respectively. Practically, long-term investors should favor the rest of the world over the U.S. Local-currency expected returns are higher outside the U.S., and the dollar will decline during the next 10 years. As our Foreign Exchange Strategy service recently highlighted, the dollar is very expensive on a long-term basis.10 Exchange rates strongly revert to their purchasing-parity equilibria in such investment horizons. The growing U.S. twin deficit and the strong desire of reserve managers to diversify out of the greenback will only exacerbate the dollar’s decline. Mathieu Savary Vice President The Bank Credit Analyst August 29, 2019 Next Report: September 26, 2019 II. Big Trouble In Greater China The chance of a U.S.-China trade agreement by November 2020 is still only 40% – but an upgrade may be around the corner. Trump is on the verge of a tactical trade retreat due to fears of economic slowdown and a loss in 2020. Xi Jinping is now the known unknown. His aggressive foreign policy is a major risk even if Trump softens. Political divisions in Greater China – Hong Kong unrest and Taiwan elections – could harm the trade talks. Maintain tactical caution but remain cyclically overweight global equities. “I am the chosen one. Somebody had to do it. So I’m taking on China. I’m taking on China on trade. And you know what, we’re winning.” – U.S. President Donald J. Trump, August 21, 2019 On August 1, United States President Donald Trump declared that he would raise a new tariff of 10% on the remaining $300 billion worth of imports from China not already subject to his administration’s sweeping 25% tariff. Then, on August 13, with the S&P 500 index down a mere 2.4%, Trump announced that he would partially delay the tariff, separating it into two tranches that will take effect on September 1 and December 15 (Chart II-1). Chart II-1Trump's Latest Tariff Salvo
Trump's Latest Tariff Salvo
Trump's Latest Tariff Salvo
Six days later Trump’s Commerce Department renewed the 90-day temporary general license for U.S. companies to do business with embattled Chinese telecom company Huawei, which has ties to the Chinese state and is viewed as a threat to U.S. network security.
Chart II-2
The same pattern played out on August 23 when President Trump responded to China’s retaliatory tariffs by declaring he would raise tariffs to 30% on the first half of imports and 15% on the remainder by December 15. Within a single weekend he softened his rhetoric and said he still wanted a deal. Trump’s tendency to take two steps forward with coercive measures and then one step back to control the damage is by now familiar to global investors. Yet this backpedaling reveals that like other politicians he is concerned about reelection. After all, there is a clear chain of consequence leading from trade war to bear market to recession to a Democrat taking the White House in November 2020. Trump’s approval rating is already similar to that of presidents who fell short of re-election amid recession (Chart II-2) – an actual recession would consign him to history. Will Trump Stage A Tactical Retreat On Trade? Yes. Trump’s predicament suggests that he will have to adjust his policies. Global trade, capital spending, and sentiment have deteriorated significantly since the last escalation-and-delay episode with China in May and June. Beijing’s economic stimulus measures disappointed expectations, exacerbating the global slowdown (Chart II-3). This leaves him less room for maneuver going forward. The fourth quarter of 2019 may be Trump’s last chance to save the business cycle and his presidency. Even “Fortress America” – consumer-driven and relatively insulated from global trade – has seen manufacturing, private investment, and business sentiment weaken. GDP growth is slowing and has been revised downward for 2018 despite a surge in budget deficit projections to above $1 trillion dollars (Chart II-4). Chart II-3China's Gradual Stimulus Yet To Revive Global Economy
China's Gradual Stimulus Yet To Revive Global Economy
China's Gradual Stimulus Yet To Revive Global Economy
Chart II-4Trump's Economy Grew Slower Than Thought Despite Fiscal Stimulus
Trump's Economy Grew Slower Than Thought Despite Fiscal Stimulus
Trump's Economy Grew Slower Than Thought Despite Fiscal Stimulus
The U.S. Treasury yield curve inversion is deepening. While we at BCA would point out reasons that this may not be a reliable signal of imminent recession, Trump cannot afford to ignore it. He is sensitive to the widening talk of “recession” in American airwaves and is openly contemplating stimulus options (Chart II-5). His approval rating has lost momentum, partly due to his perceived mishandling of a domestic terrorist attack motivated by racist anti-immigrant sentiment in El Paso, Texas, but negative financial and economic news have likely also played a part (Chart II-6). Chart II-5Trump Fears Growing Talk Of Recession
Trump Fears Growing Talk Of Recession
Trump Fears Growing Talk Of Recession
In short, the fourth quarter of 2019 may be Trump’s last chance to save the business cycle and his presidency. The core predicament for Trump continues to be the divergence in American and Chinese policy. In the U.S., the stimulating effect of Trump’s Tax Cut and Jobs Act is wearing off just as the deflationary effect of his trade policy begins to bite. In China, the lingering effects of Xi’s all-but-defunct deleveraging campaign are combining with the trade war, and slowing trend growth, to produce a drag on domestic demand and global trade. The result is a rising dollar, which increases the trade deficit – the opposite of what Trump wants and needs (Chart II-7).
Chart II-6
Chart II-7Trump's Fiscal Policy Undid His Trade Policy
Trump's Fiscal Policy Undid His Trade Policy
Trump's Fiscal Policy Undid His Trade Policy
The United States is insulated from global trade, but only to a point – it cannot escape a global recession should one develop (Chart II-8). With global and U.S. equities vulnerable to additional volatility in the near term, Trump will have to make at least a tactical retreat on his trade policy over the rest of the year. First and foremost this would mean: Chart II-8If Total Trade War Causes A Global Relapse, The U.S. Economy Cannot Escape
If Total Trade War Causes A Global Relapse, The U.S. Economy Cannot Escape
If Total Trade War Causes A Global Relapse, The U.S. Economy Cannot Escape
Expediting a trade deal with Japan – this should get done before a China deal, possibly as early as September. Ratifying the U.S.-Mexico-Canada “NAFTA 2.0” agreement – this requires support from moderate Democrats in Congress. The window for passage is closing fast but not yet closed. Removing the threat to slap tariffs on European car and car part imports in mid-November. There is some momentum given Europe’s need to boost growth and recent progress on U.S. beef exports to the EU. Lastly, if financial and economic pressure are sustained, Trump will be forced to soften his stance on China. The problem for global risk assets – in the very near term – is that Trump’s tactical retreat has not fully materialized yet. The new tariff on China is still slated to take effect on September 1. This tariff hike or other disagreements could result in a cancellation of talks or failure to make any progress.11 Even if Trump does pivot on trade, China’s position has hardened. It is no longer clear that Beijing will accept a deal that is transparently designed to boost Trump’s reelection chances. Thus, the biggest question in the trade talks is no longer Trump, but Xi. Is Xi prepared to receive Trump kindly if the latter comes crawling back? How will he handle rising political risk in Hong Kong SAR and Taiwan island,12 and will the outcome derail the trade talks? The biggest question in the trade talks is no longer Trump, but Xi. Bottom Line: Global economic growth is fragile and President Trump has only rhetorically retracted his latest salvo against China. Nevertheless, the clear signal is that he is sensitive to the financial and economic constraints that affect his presidential run next year – and therefore investors should expect U.S. trade policy to turn less market-negative on the margin in the coming months. This is positive for the cyclical view on global risk assets. But the risk to the view is China: whether Trump will take a conciliatory turn and whether Xi will reciprocate. Can Xi Jinping Accept A Deal? Yes. It is extremely difficult for Xi Jinping to offer concessions in the short term. He is facing another tariff hike, U.S. military shows of force, persistent social unrest in Hong Kong, and a critical election in Taiwan. Certainly, he will not risk any sign of weakness ahead of the 70th anniversary of the People’s Republic of China on October 1, which will be a nationalist rally in defiance of imperialist western powers. After that, however, there is potential for Xi to be receptive to any Trump pivot on trade. China’s strategy in the trade talks has generally been to offer limited concessions and wait for Trump to resign himself to them. Concessions thus far are not negligible, but they can easily be picked apart. They consist largely of preexisting trends (large commodity purchases); minor adjustments (e.g. to car tariffs and foreign ownership rules); unverifiable promises (on foreign investment, technological transfer, and intellectual property); or reversible strategic cooperation (partial enforcement of North Korean and Iranian sanctions) (Table II-1). Many of these concessions have been postponed as a result of Trump’s punitive measures.
Chart II-
It is unlikely that Beijing will offer much more under today’s adverse circumstances. The exception is cooperation on North Korea, which should improve. So the contours of a deal are generally known. This is what Trump will have to accept if he seeks to calm markets and restore confidence in the economy ahead of his election. But this slate of concessions is ultimately acceptable for the U.S. Chart II-9China's Ultimate Economic Constraint
China's Ultimate Economic Constraint
China's Ultimate Economic Constraint
China’s demands are that Trump roll back all his tariffs, that purchases of U.S. goods must be reasonable in scale, and that any agreement be balanced and conducted with mutual respect. Of these three, the tariffs and the “respect” pose the most trouble. Trade balance: Washington and Beijing can agree on the terms of specific purchases. China can increase select imports substantially – it remains a cash-rich nation with a state sector that can be commanded to buy American goods. Tariff rollback: This is tougher but can be done. The U.S. will insist on some tariffs – or the threat of tech sanctions – as an enforcement mechanism to ensure that Beijing implements the structural concessions necessary for an agreement. But China might accept a deal in which tariffs were mostly rolled back – say to the original 25% tariff on $50 billion worth of goods. This would likely offset the degree of yuan appreciation to be expected from the likely currency addendum to any agreement. Balance and respect: This qualitative demand is the sticking point. Fundamentally, China cannot reward Trump for his aggressive and unilateral protectionist measures. This would be to set a precedent for future American presidents that sweeping tariffs on national security grounds are a legitimate way of coercing China into making economic structural reforms. Moreover if the U.S. wants to improve the trade balance, China thinks, it cannot embargo Chinese high-tech imports but must actually increase its high-tech exports. Clearly this is a major impasse in the talks. The last point, mutual respect, is the likeliest deal-breaker. It may ultimately hinge on strategic events outside of the realm of trade. But before discussing it further, it is important to recognize that China is not invincible – it has a pain threshold. Deterioration in China’s labor market is of utmost seriousness to any Chinese leader (Chart II-9). And the economy is still struggling to revive. Xi’s reform and deleveraging campaign of 2017-18 has largely been postponed but the lingering effects are weighing on growth and the property sector remains under tight regulation. Moreover the removal of implicit guarantees, and rare toleration of creative destruction (Chart II-10), have left banks and corporations afraid to take on new risks. The state’s reflationary measures, including a big boost to local government spending, have so far been merely sufficient for domestic stability. Chart II-10Creative Destruction In China
Creative Destruction In China
Creative Destruction In China
These problems can be addressed by additional policy easing. But the domestic political crackdown and the break with the U.S. have shaken manufacturers and private entrepreneurs to the bone, suppressing animal spirits and reducing the demand for loans. Ultimately a short-term trade deal to ease this economic stress would make sense for Xi Jinping, even though he knows that U.S. protectionism and the conflict over technological acquisition will persist beyond 2020 and beyond Trump. The threat of a sharp and destabilizing divorce from the U.S. is a real and present danger to the long-term stability of China’s economy and the Communist regime. Xi is a strongman leader, but is he really ready for Mao Zedong-style austerity? Is he not more like former President Jiang Zemin (ruled 1993-2003), who imposed some austerity while prizing domestic economic and political stability above all? To this question we now turn. Bottom Line: China has become the wild card in the trade war. Trump’s need to prevent a recession is known. Beijing has a higher pain threshold and could walk away from the deal to punish Trump (upsetting the global economy and diminishing Trump’s reelection prospects). This would set the precedent for future American presidents that China will not bow to gunboat diplomacy. Will Xi Jinping Overplay His Hand? Be Afraid. For decades China’s main foreign policy principle has been to “lie low and bide its time,” to paraphrase former leader Deng Xiaoping. In the current context this means maintaining a willingness to engage with the U.S. whenever it engages sincerely. This approach implies making the above concessions to minimize the immediate threat to stability from the trade war, while biding time in the longer run rivalry against the United States. Such an approach would also imply assisting the diplomatic process on the Korean peninsula, avoiding a military crackdown in Hong Kong, and refraining from aggressive military intimidation ahead of Taiwan’s election in January. Chart II-11China's Vast Market Its Most Persuasive Tool
China's Vast Market Its Most Persuasive Tool
China's Vast Market Its Most Persuasive Tool
After all, there is no better way for the Communist Party to undercut dissidents in Hong Kong and Taiwan than to strike a deal with the United States. This would demonstrate that Xi is a pragmatic leader who is still committed to “reform and opening up.” It would help generate an economic rebound that would bring other countries deeper into Beijing’s orbit (Chart II-11). China’s vast domestic market is ultimately its greatest strength in its contest with the United States. In short, conventional Chinese policy suggests that Xi should perpetuate the long success story since 1978 by striking another deal with another Republican president. The catch is that Xi Jinping is not conventional. Since coming to power in 2012, Xi has eschewed the subtle strategies of Sun Tzu and Deng Xiaoping in favor of a more ambitious approach: that of declaring China’s arrival as a major power and leveraging its economic and military heft to pursue foreign policy and commercial interests aggressively. Xi’s reassertion of Communist rule and state-guided technological acquisition is the biggest factor behind the new U.S. political consensus – entirely aside from Trump – that China is foe rather than friend. There are several empirical reasons to think that Xi might overplay his hand: Xi failed to make substantive concessions with President Barack Obama’s administration on North Korea, the South China Sea, and cyber security, resulting in Obama’s decision to harden U.S. policy toward both China and North Korea in 2015 – a trend that predates Trump. Xi formally removed presidential term limits from China’s constitution even though he could have attracted less negative attention from the West by ruling from behind the scenes after his term in office, like Deng Xiaoping or Jiang Zemin. China has mostly played for time in negotiations with the Trump administration, as mentioned, and this aggravated tensions. Deep revisions to the draft agreement, and the extent of tariff rollback which was supposedly 90% complete, broke the negotiations in May, sparking this summer’s standoff. Aggressive policies in territorial disputes have alienated even China’s potential allies. This includes regional states whose current ruling parties have courted China in recent years, in some cases obsequiously – South Korea, the Philippines, and Vietnam. The East and South China Seas remain a genuine source of “black swans” – unpredictable, low-probability, high-impact events – due to their status as critical sea lanes for the major Asian economies. China continues to militarize the islands there and aggressively prosecute its maritime-territorial disputes. We calculate that $6.4 trillion worth of goods flowed through this bottleneck in the year ending April 2019, 8% of which consists of energy goods from the Middle East that are vital to China and its East Asian neighbors, none of whom can stomach Chinese domination of this geographic space (Diagram II-1). Even if Washington abandoned the region, Japan, South Korea, and Taiwan would see Chinese control as a threat to their security. Ultimately, however, China’s adventures in its neighboring seas are a matter of choice. Not so for Greater China – in Hong Kong and Taiwan, political risk is rapidly mounting in a way that enflames the U.S.-China strategic distrust and threatens to prevent a trade agreement.
Chart II-
Hong Kong: The Dust Has Not Settled Mass protests in Hong Kong have lost some momentum, based on the size of the largest rally in August versus June. But do not be fooled: the political crisis is deepening. A plurality of Hong Kongers now harbors negative feelings toward mainland Chinese people as well as the government in Beijing – a trend that is spiking amid today’s protests but began with the Great Recession and has roots in the deeper socioeconomic malaise of this capitalist enclave (Chart II-12A & II-12B).
Chart II-12
Chart II-12
Chart II-13
A majority also lacks confidence in the political arrangement that ensures some autonomy from Beijing – known as “One Country, Two Systems” (Chart II-13). This is a particularly worrisome sign since this is the fundamental basis for stable political relations with Beijing. With clashes continuing between protesters and police, students calling for a boycott of school this fall, and Beijing rotating troops into the city and openly drilling its security forces in Shenzhen for a potential intervention, Hong Kong’s unrest is not yet laid to rest and could flare up again ahead of China’s sensitive National Day celebration. U.S. tariffs and sanctions are already in effect, reducing the ability of the U.S. to deter China from using force if it believes instability has gone too far. And as President Trump has warned – and would be true of any U.S. administration – a violent crackdown on civilian demonstrators would greatly reduce the political viability of a trade deal in the United States. Taiwan: The Black Swan Arrives Since Taiwan’s 2016 election, we have argued that it is a potential source of “black swans.” Mass protests in Hong Kong may have taken the cake. But these protests are now affecting the Taiwanese election dynamic and potentially the U.S.-China trade talks. Chart II-14U.S. Approves Big New Arms Sale To Taiwan
U.S. Approves Big New Arms Sale To Taiwan
U.S. Approves Big New Arms Sale To Taiwan
On August 20, the United States Department of Defense informed Congress that it is proceeding with an $8 billion sale of F-16 fighter jets and other military arms and equipment to Taiwan – the largest sale in 22 years and the largest aircraft sale since 1992 (Chart II-14). This sale is not yet complete and delivered, but ultimately will be – the question is the timing. Arms sales to Taiwan are a perennial source of tension between the United States and China – and China is increasingly assertive in using economic sanctions to get its way over such issues, as it showed in the lead up to South Korea’s election in 2017. This sale is not a military “game changer” – the U.S. did not send over fifth-generation F-35s, for instance – but China will respond vehemently. It is threatening to impose sanctions on American companies like Lockheed Martin and General Electric for their part in the deal. The sale does not in itself preclude the chance of a trade agreement but it contributes to a rise in strategic tensions that ultimately could. Chart II-15A 'Fourth Taiwan Strait Crisis' Would Have A Seismic Equity Impact
A 'Fourth Taiwan Strait Crisis' Would Have A Seismic Equity Impact
A 'Fourth Taiwan Strait Crisis' Would Have A Seismic Equity Impact
The context is Taiwan’s hugely important election in January. Four years ago, President Tsai Ing-wen and her pro-independence Democratic Progressive Party swept to power on the back of a popular protest movement – the “Sunflower Movement” – that opposed deeper cross-strait economic integration. It dangerously resembled the kind of anti-Communist “color revolutions” that motivate Xi Jinping’s hardline policies. Tsai shocked the world when she called Trump personally to congratulate him after his election, which violated diplomatic protocol given that Taiwan is a territory of China and not an independent nation-state. Since then Trump has largely avoided provoking the Taiwan issue so as not to strike at a core Chinese interest and obliterate the chance of a trade deal. But the U.S. has always argued that the provision of defensive arms to Taiwan is a condition of the U.S.-China détente – and Trump is so far moving forward with the sale. How will Xi Jinping react if the sale goes through? In 1995-96, China’s use of missile tests to try to intimidate Taiwan produced the opposite effect – driving voters into the arms of Lee Teng-hui, the candidate Beijing opposed. This was the occasion of the Third Taiwan Strait Crisis, in which U.S. President Bill Clinton sent two aircraft carriers to the region, one that sailed through the Taiwan Strait. The negative effect on markets at that time was local, whereas anything resembling this level of tensions would today be a seismic global risk-off (Chart II-15). Since the 1990s, leaders in Beijing have avoided direct military coercion ahead of elections. But Xi Jinping has hardened his stance on Taiwan throughout his term. He has dabbled with such coercion in his use of military drills that encircle Taiwan in recent years. While one must assume that he will use economic sanctions rather than outright military threats – as he did with South Korea – saber-rattling cannot be ruled out. The pressure on him is rising. Prior to the Hong Kong unrest, Taiwan’s elections looked likely to return the pro-mainland Kuomintang (KMT) to power and remove the incumbent President Tsai – a boon for Beijing. That outlook has changed and Tsai now has a fighting chance of staying in power (Chart II-16). The prospect of four more years of Tsai would not be too problematic for Beijing if not for the fact that the U.S. political establishment is now firmly in agreement on challenging China. But even if Tsai loses, Taiwan’s outlook is troublesome. And this makes Xi’s decision-making harder to predict. Taiwan has a lot more dry powder for a political crisis in the long run than Hong Kong. It is not that Tsai or her party will necessarily prevail. The manufacturing slowdown will take a toll and third-party candidates, particularly Ko Wen-je, would likely split Tsai’s vote. Moreover her Democratic Progressives still tie the KMT in opinion polling (Chart II-17). The Taiwanese people are primarily concerned about maintaining the strong economy and cross-strait peace and stability, which her reelection could jeopardize (Chart II-18). Tsai could very well lose, or she could be a lame duck presiding over the KMT in the legislature.
Chart II-16
Chart II-17
Rather, the problem for Xi Jinping is that the Taiwanese people clearly sympathize with the protesters in Hong Kong (Chart II-19). They fear that their own governance system faces the same fate as Hong Kong’s, with the Communist Party encroaching on traditional political liberties over time.
Chart II-18
Chart II-19
While Hong Kong ultimately has zero choice as to whether to accept Beijing’s supremacy, Taiwan has much greater autonomy – and the military support of outside forces. It is not a foregone conclusion that Taiwan must suffer the same political dependency as Hong Kong. Indeed, Taiwan has a long history of exercising the democratic vote and has even dabbled into the realm of popular referendums. In short, Taiwan has a lot more dry powder for a political crisis in the long run than Hong Kong. But the Hong Kong events have accentuated this fact, for two key reasons: First, Taiwanese people identify increasingly as exclusively Taiwanese, rather than as both Taiwanese and Chinese (Chart II-20). The incidents in Hong Kong reveal that this sentiment is tied to immediate political relations and therefore deterioration would encourage further alienation from the mainland. Second, while a strong majority of Taiwanese wish to maintain the political status quo to avoid conflict with the mainland, a substantial subset – approaching one-fourth – supports eventual or immediate independence (Chart II-21).
Chart II-20
Chart II-21
This means that relations with the mainland will eventually deteriorate even if the KMT wins the election. The KMT itself must respond to popular demand not to cozy up too much with Beijing, which is how it fell from power in 2016. Meanwhile, under KMT rule, Taiwan’s progressive-leaning youth are likely to set about reviving their protest movement in the subsequent years and imitating their Hong Kong peers, especially if the KMT warms up relations too fast with the mainland. Ultimately these points suggest that Xi Jinping will strive to avoid a violent crackdown in Hong Kong. A crackdown would be the surest way for him to harm the KMT in the Taiwanese election and to hasten the rebuilding of U.S.-Taiwan security ties. Call The President The best argument for Xi to lie low and avoid a larger crisis in Greater China is that it would unify the West and its allies against China. So far Xi’s foreign policy has not been so aggressive as to lead to diplomatic isolation. Europe is maintaining a studied neutrality due to its own differences with the United States; Asian neighbors are wary of provoking Chinese sanctions or military threats. A humanitarian crisis in Hong Kong or a “Fourth Taiwan Strait Crisis” would change that. For markets, the best-case scenario is that Xi Jinping exercises restraint. This would help Hong Kong protests lose steam, North Korean diplomacy get back on track, and Taiwanese independence sentiment simmer down. China would be more likely to halt U.S. tariffs and tech sanctions, settle a short-term trade agreement, and delay the upgrade in U.S.-Taiwan defense relations. China would still face adverse long-term political trends in both the U.S. and Taiwan, but an immediate crisis would be averted. The worst-case scenario is that Xi indulges his ambition. Hong Kong protests could explode, relations with Taiwan would deteriorate, and U.S.-China relations would move more rapidly in their downward spiral. Trade talks could collapse. Xi Jinping would face the possibility of a unified Western front, instability within Greater China, and a global recession. This might get rid of Donald Trump, but it would not get rid of the U.S. Congress, Navy, or Department of Defense. The choice seems pretty clear. Xi, like Trump, faces constraints that should motivate a tactical retreat from confrontation, at least after October 1. While this does not necessarily mean a settled trade agreement, it does suggest at least a ceasefire or truce. Our GeoRisk indicators show that market-based political risk in Taiwan – and less so South Korea – moves in keeping with global economic policy uncertainty. The underlying U.S.-China strategic confrontation and trade war are driving both (Chart II-22). A deterioration in this region has global consequences. Chart II-22U.S.-China Strategic Conflict Fuels Global Economic Uncertainty And Taiwanese Geopolitical Risk In Tandem
U.S.-China Strategic Conflict Fuels Global Economic Uncertainty And Taiwanese Geopolitical Risk In Tandem
U.S.-China Strategic Conflict Fuels Global Economic Uncertainty And Taiwanese Geopolitical Risk In Tandem
Xi is a markedly aggressive “strongman” Chinese leader who has not been afraid to model his leadership on that of Chairman Mao. He could still overplay his hand. This is why we maintain that the odds of a U.S.-China trade agreement remain 40%, though we are prepared to upgrade that probability if Trump and Xi make pro-market decisions. Investment Implications On the three-month tactical horizon, BCA’s Geopolitical Strategy is paring back our tactical safe-haven trades: we are closing our “Doomsday Basket” of long gold and Swiss bonds for a gain of 13.6%, while maintaining our simple gold portfolio hedge going forward. Trump has not yet decisively staged his tactical retreat on trade policy, while rising political risk in Greater China increases uncertainty over Xi Jinping’s next moves. On the cyclical horizon, the above suggests that there is a light at the end of the tunnel – if both Trump and Xi recognize their political constraints. This means that there is still a political and geopolitical basis to reinforce BCA’s House View to remain optimistic on global and U.S. equities over the next 12 months, with the potential for non-U.S. equities to recover and bond yields to reverse their deep dive. Matt Gertken Vice President Geopolitical Strategy III. Indicators And Reference Charts The S&P 500 correction is likely to deepen a bit further. A move toward 2700 remains our base case scenario. Short-term oscillators have not yet reached capitulation levels and the Sino-U.S. trade war remains a source of risks, especially as the Chinese side is unlikely to provide any strong concessions until October. However, we still do not expect a deeper correction to unfold. In other words, equities remain stuck in a trading range for the remainder of the year. Our Revealed Preference Indicator (RPI) continues to shun stocks. The RPI combines the idea of market momentum with valuation and policy measures. It provides a powerful bullish signal if positive market momentum lines up with constructive readings from the policy and valuation measures. Conversely, if strong market momentum is not supported by valuations and policy, investors should lean against the market trend. Global growth remains the biggest problem for stocks. Until the global economy finds a floor, the outlook for profits will be poor and our RPI will argue against buying equities. Beyond this year, the outlook remains constructive of stocks. Our Willingness-to-Pay (WTP) indicator for the U.S. and Japan is markedly improving. However, it continues to deteriorate in Europe. The WTP indicator tracks flows, and thus provides information on what investors are actually doing, as opposed to sentiment indexes that track how investors are feeling. The WTP therefore argues that investors are still looking to buy the dips in the U.S. and in Japan, which limits the downside in those markets. Yields have collapsed, money growth has picked up, and global central banks are cutting rates in unison. As a result, our Monetary Indicator points to the most accommodative global monetary backdrop since early 2015. Moreover, our Composite Technical Indicator is improving and continues to flash a buy signal. In 2015, it was deteriorating after having hit overbought territory. Therefore, unlike four years ago, equities are more likely to avoid the gravitational pull created by their overvaluation, especially as our BCA Composite Valuation index is in fact improving thanks to lower bond yields. According to our model, 10-year Treasurys have not been this expensive since late 2012. Back then, this level of overvaluation warned of an impending Treasury selloff. Moreover, our technical indicator is now deeply overbought. So are various rate-of-change measures for bond prices. While none of those indicators can tell you if yields will move up in the next few weeks, they do argue that the risk/reward of holding bonds over the coming year is extremely poor. That being said, we are closely monitoring the recent breakdown in the advanced/decline line of commodities, which might herald another down-leg in commodity prices, and therefore, in bond yields as well. On a PPP basis, the U.S. dollar is only growing ever more expensive. Additionally, despite the dollar’s recent strength, our Composite Technical Indicator has lost enough momentum that the negative divergence we flagged last month remains in place. It is worrisome for dollar bulls that despite growing uncertainty and a deteriorating global economy, the euro is not breaking down. If the dollar’s Technical Indicator deteriorates further and falls below zero, the momentum-continuation behavior of the greenback will likely kick in. The USD would suffer markedly were this to happen. EQUITIES: Chart III-1U.S. Equity Indicators
U.S. Equity Indicators
U.S. Equity Indicators
Chart III-2Willingness To Pay For Risk
Willingness To Pay For Risk
Willingness To Pay For Risk
Chart III-3U.S. Equity Sentiment Indicators
U.S. Equity Sentiment Indicators
U.S. Equity Sentiment Indicators
Chart III-4Revealed Preference Indicator
Revealed Preference Indicator
Revealed Preference Indicator
Chart III-5U.S. Stock Market Valuation
U.S. Stock Market Valuation
U.S. Stock Market Valuation
Chart III-6U.S. Earnings
U.S. Earnings
U.S. Earnings
Chart III-7Global Stock Market And Earnings: Relative Performance
Global Stock Market And Earnings: Relative Performance
Global Stock Market And Earnings: Relative Performance
Chart III-8Global Stock Market And Earnings: Relative Performance
Global Stock Market And Earnings: Relative Performance
Global Stock Market And Earnings: Relative Performance
FIXED INCOME: Chart III-9U.S. Treasurys And Valuations
U.S. Treasurys And Valuations
U.S. Treasurys And Valuations
Chart III-10Yield Curve Slopes
Yield Curve Slopes
Yield Curve Slopes
Chart III-11Selected U.S. Bond Yields
Selected U.S. Bond Yields
Selected U.S. Bond Yields
Chart III-1210-Year Treasury Yield Components
10-Year Treasury Yield Components
10-Year Treasury Yield Components
Chart III-13U.S. Corporate Bonds And Health Monitor
U.S. Corporate Bonds And Health Monitor
U.S. Corporate Bonds And Health Monitor
Chart III-14Global Bonds: Developed Markets
Global Bonds: Developed Markets
Global Bonds: Developed Markets
Chart III-15Global Bonds: Emerging Markets
Global Bonds: Emerging Markets
Global Bonds: Emerging Markets
CURRENCIES: Chart III-16U.S. Dollar And PPP
U.S. Dollar And PPP
U.S. Dollar And PPP
Chart III-17U.S. Dollar And Indicator
U.S. Dollar And Indicator
U.S. Dollar And Indicator
Chart III-18U.S. Dollar Fundamentals
U.S. Dollar Fundamentals
U.S. Dollar Fundamentals
Chart III-19Japanese Yen Technicals
Japanese Yen Technicals
Japanese Yen Technicals
Chart III-20Euro Technicals
Euro Technicals
Euro Technicals
Chart III-21Euro/Yen Technicals
Euro/Yen Technicals
Euro/Yen Technicals
Chart III-22Euro/Pound Technicals
Euro/Pound Technicals
Euro/Pound Technicals
COMMODITIES: Chart III-23Broad Commodity Indicators
Broad Commodity Indicators
Broad Commodity Indicators
Chart III-24Commodity Prices
Commodity Prices
Commodity Prices
Chart III-25Commodity Prices
Commodity Prices
Commodity Prices
Chart III-26Commodity Sentiment
Commodity Sentiment
Commodity Sentiment
Chart III-27Speculative Positioning
Speculative Positioning
Speculative Positioning
ECONOMY: Chart III-28U.S. And Global Macro Backdrop
U.S. And Global Macro Backdrop
U.S. And Global Macro Backdrop
Chart III-29U.S. Macro Snapshot
U.S. Macro Snapshot
U.S. Macro Snapshot
Chart III-30U.S. Growth Outlook
U.S. Growth Outlook
U.S. Growth Outlook
Chart III-31U.S. Cyclical Spending
U.S. Cyclical Spending
U.S. Cyclical Spending
Chart III-32U.S. Labor Market
U.S. Labor Market
U.S. Labor Market
Chart III-33U.S. Consumption
U.S. Consumption
U.S. Consumption
Chart III-34U.S. Housing
U.S. Housing
U.S. Housing
Chart III-35U.S. Debt And Deleveraging
U.S. Debt And Deleveraging
U.S. Debt And Deleveraging
Chart III-36U.S. Financial Conditions
U.S. Financial Conditions
U.S. Financial Conditions
Chart III-37Global Economic Snapshot: Europe
Global Economic Snapshot: Europe
Global Economic Snapshot: Europe
Chart III-38Global Economic Snapshot: China
Global Economic Snapshot: China
Global Economic Snapshot: China
Mathieu Savary Vice President The Bank Credit Analyst Footnotes 1 Claudio Borio , Mathias Drehmann, Dora Xia, "The financial cycle and recession risk," BIS Quarterly Review, December 2018. 2 Please see Emerging Markets Strategy Special Report "China’s Property Market: Making Sense Of Divergences," dated May 9, 2019, available at ems.bcaresearch.com 3 Please see Global Investment Strategy Weekly Report, “Three Cycles,” dated July 26, 2019, available at gis.bcaresearch.com 4 Please see The Bank Credit Analyst Section I, “August 2019,” dated July 25, 2019, available at bca.bcaresearch.com 5 Please see The Bank Credit Analyst Section I, “August 2019,” dated July 25, 2019, available at bca.bcaresearch.com 6 For an explanation of the mechanics of the FRP, please see NY Fed’s website: https://www.newyorkfed.org/aboutthefed/fedpoint/fed20 7 Please see U.S. Equity Strategy Special Report "Sector Performance And Fed “Mid-Cycle Adjustments”: For Better Or For Worse," dated August 19, 2019, available at uses.bcaresearch.com 8 Please see U.S. Bond Strategy Weekly Report "The Trump Interruption," dated August 13, 2019, available at usbs.bcaresearch.com 9 Please see Global Investment Strategy Special Report, “TINA To The Rescue?,” dated August 23, 2019, available at gis.bcaresearch.com 10 Please see Foreign Exchange Strategy Special Report, “A Fresh Look At Purchasing Power Parity,” dated August 23, 2019, available at fes.bcaresearch.com 11 Negotiations between Trump and Xi are slated for September in Washington. There is a prospect for Trump to hold another summit with Communist Party General Secretary Xi Jinping on the sidelines of the United Nations General Assembly in New York in late September and at the APEC summit in Chile in mid-November. 12 Hong Kong is a Special Administrative Region of the People’s Republic of China, while Taiwan is recognized as a province or territory. EQUITIES:FIXED INCOME:CURRENCIES:COMMODITIES:ECONOMY:
Feature Feature ChartNo 'Secular Stagnation' In Japan!
No Secular Stagnation In Japan!
No Secular Stagnation In Japan!
Bond yields have plummeted to all-time lows and inflation has continued to undershoot the 2 percent target which central bankers tell us is ‘price stability’. This configuration has led to renewed fears that the European and global economies are entering a so-called ‘secular stagnation’. We strongly disagree with this line of thinking. Near-zero bond yields and inflation are categorically not portents of a long-term drought in economic progress. Quite the opposite. Chart I-2Japan Has Experienced Near-Zero Inflation For Decades
Japan Has Experienced Near-Zero Inflation For Decades
Japan Has Experienced Near-Zero Inflation For Decades
Japan has experienced near-zero bond yields and inflation for decades (Chart I-2). Yet since the late 1990s, the growth in Japan’s real GDP per head has outperformed every other major economy1 (Feature Chart). Granted, the Japanese government has been running persistent deficits, but this is to counterbalance private sector de-levering. Total indebtedness as a share of GDP has not been rising. In the post credit boom era, Japan’s economic progress has come entirely from productivity improvements. The ability to learn, experiment, and innovate boosts the quality and/or quantity of output from a fixed set of inputs. Unlike the unsustainable growth that is fuelled by credit booms and asset bubbles, real growth that comes from productivity improvements marks genuine and sustainable economic progress. In Europe, Switzerland tells a similar tale. Swiss bond yields and inflation have been near zero for decades, but they have not defined a secular stagnation. Real GDP per head and living standards have steadily advanced, even from an already high base. In the post credit boom era, Japan’s economic progress has come entirely from productivity improvements. But the best counterexample comes from economic history. At the height of the British Empire in 1914, British consumer prices were little different to where they stood at the end of the English Civil War in 1651 – meaning that Britain experienced near-zero inflation and low bond yields for almost three centuries (Chart I-3). Did these define a secular stagnation? No, quite the opposite. For Britain, this was a golden epoch in which it emerged as the world’s preeminent economy. Chart I-3Britain Experienced Near-Zero Inflation For Centuries
Britain Experienced Near-Zero Inflation For Centuries
Britain Experienced Near-Zero Inflation For Centuries
The Real Reason For Near-Zero Inflation And Bond Yields The fear-mongering about a secular stagnation misses the real reason for today’s sub-2 percent inflation and record low bond yields. Central banks have wrongly defined price stability. Central banks have wrongly defined price stability because they think of it in terms of the economics and mathematics in which they have expertise. Their models tell them that they can nail inflation to one decimal place – two point zero. But price stability has as much to do with biology and psychology. Biologists will tell you that the human brain cannot distinguish inflation rates between -1 and 2 percent, a range we indistinguishably perceive as ‘price stability’. If biology teaches us that we cannot distinguish between -1 and 2 percent inflation, then central banks have a huge problem. It is impossible for a central bank to change our inflation expectations within that range, because the entire range just feels the same to us. Therefore, our behaviour in terms of wage demands and willingness to borrow will also stay unchanged. And if our economic behaviour is unchanged, what is the transmission mechanism to fine tune inflation within the -1 to 2 percent range? Central banks have wrongly defined price stability. Therefore, price stability is actually like a ‘quantum state’. You’re in the state or you’re out of the state, but once you’re in the state you cannot then fine tune inflation to an arbitrary number like two point zero. In fact, average inflation over, say, five years will gravitate to the mid-point of the price stability state, 0.5 percent, which is a long way below the central bank’s arbitrary target of 2 percent (Chart I-4). This forces the central bank into drastic and prolonged monetary policy easing – which depresses bond yields (Chart I-5). Chart I-4Central Banks Have Wrongly Defined Price Stability...
Central Banks Have Wrongly Defined Price Stability...
Central Banks Have Wrongly Defined Price Stability...
Chart I-5...Forcing Them To Depress Bond Yields
...Forcing Them To Depress Bond Yields
...Forcing Them To Depress Bond Yields
Monetary Policies Will Ultimately Converge As structural credit booms have sequentially ended, economies have one by one entered the state of price stability. First it was Japan; then it was Switzerland; more recently it has been the euro area and the United States. It follows that the 5-year annualised inflation rates have also sequentially tumbled to the mid-point of the price stability state, around 0.5 percent. By which point, inflation is so far below the misplaced 2 percent target, that the central bank’s drastic and prolonged monetary policy easing has depressed the 5-year bond yield to near zero. Japan reached this point in the late 1990s, Switzerland in the early 2010s, and the euro area in the late 2010s. Begging the question: why has the 5-year inflation rate in the U.S. not tumbled towards 0.5 percent too? The answer is that actually, it has. On a like-for-like basis, 5-year inflation rates are way below the 2 percent target in all the major jurisdictions. You see, the Americans measure inflation differently to the Europeans. In the U.S., the consumer price basket includes owner-occupied housing costs at a substantial weighting, while in Europe it is completely excluded. Using the same definition of inflation as in Europe, the U.S. 5-year inflation rate is not at 1.5 percent, it is at a feeble 0.6 percent (Chart I-6). Chart I-6On a Like-For-Like Basis, U.S. 5-Year Inflation Is A Feeble 0.6 Percent
On a Like-For-Like Basis, U.S. 5-Year Inflation Is A Feeble 0.6 Percent
On a Like-For-Like Basis, U.S. 5-Year Inflation Is A Feeble 0.6 Percent
Crucially, on a like-for-like basis, 5-year inflation rates are way below the 2 percent target in all the major jurisdictions: the U.S., euro area, and Japan. This leads us to believe that the current chasm in monetary policies is unsustainable. Even including owner-occupied housing in the consumer price basket, as the U.S. does, the long run boost to annual inflation is only about 0.2 percent (Chart I-7). Meaning that it is only a matter of time before U.S. structural inflation and bond yields converge with those in the euro area. Chart I-7Owner-Occupied Housing Boosts Inflation, But In The Long Run By Only 0.2 Percent
Owner-Occupied Housing Boosts Inflation, But In The Long Run By Only 0.2 Percent
Owner-Occupied Housing Boosts Inflation, But In The Long Run By Only 0.2 Percent
In the meantime, the chasm between monetary policies has become a major geopolitical risk. This is because it has depressed the euro versus the dollar by at least 10 percent – based on the ECB’s own competitiveness indicators. The exchange rate distortion stemming from polarised monetary policies is the culprit for the euro area’s huge trade surplus with the United States (Chart I-8). On this point, President Trump is spot on to complain that the Fed’s policy stance relative to other central banks is severely handicapping U.S. manufacturers. As the president tries to counter this handicap with tariffs, real or threatened, the Fed is being forced to lean against the risks to growth and inflation. Chart I-8Blame Polarised Monetary Policies For The Euro Area’s Huge Trade Surplus With The U.S.
Blame Polarised Monetary Policies For The Euro Area's Huge Trade Surplus with the U.S.
Blame Polarised Monetary Policies For The Euro Area's Huge Trade Surplus with the U.S.
What Does All Of This Mean? One way or another, the dollar will come under structural pressure in the coming years as the current chasm in monetary policies proves to be unjustified. However, in the near term, we prefer to express this not via the euro, but via the yen. The corollary is that U.S bond yields will eventually converge with their European counterparts. But to reiterate, a world with near-zero inflation is categorically not a portent of secular stagnation. It is just the true state of price stability as the human brain perceives it, rather than the over-precise two point zero that central banks have arbitrarily picked. In turn, ultra-low bond yields stem from the monetary policy response to this massive undershoot of true price stability from central bank defined price stability. All of this raises a fascinating question: if bond yields are lower than is truly required, why hasn’t it created a new inflation? The answer is that it has, but the new inflation is not in the real economy. The reason is that the world has just been through a structural credit boom, remains heavily indebted, and is still unwinding some of the credit excesses. In this world, as Japan has illustrated in recent decades, productivity growth must drive economic progress.
Chart I-9
Instead, the new inflation is in equity and other risk-asset prices. At ultra-low bond yields the prospect of bond capital gains diminishes versus potential losses, making bonds as risky as equities. This removes the need for an excess return on equities and other risk-assets versus bonds, meaning that the valuation of risk-assets inflates exponentially (Chart I-9). So long as bond yields remain depressed, this new inflation in risk-asset valuations is well justified and supported.2 But be very careful if the global 10-year bond yield rises above 2 percent.3 Dhaval Joshi, Chief European Investment Strategist dhaval@bcaresearch.com Footnotes 1 Based on real GDP per working age (15-64) population, but also broadly true for real GDP per total population. 2 Please see the European Investment Strategy Weekly Report “Risk: The Great Misunderstanding Of Finance”, October 25 2018, available at eis.bcaresearch.com. 3 The global 10-year bond yield is the simple average of 10-year government bond yields in the U.S., euro area (or France as a proxy), and China.
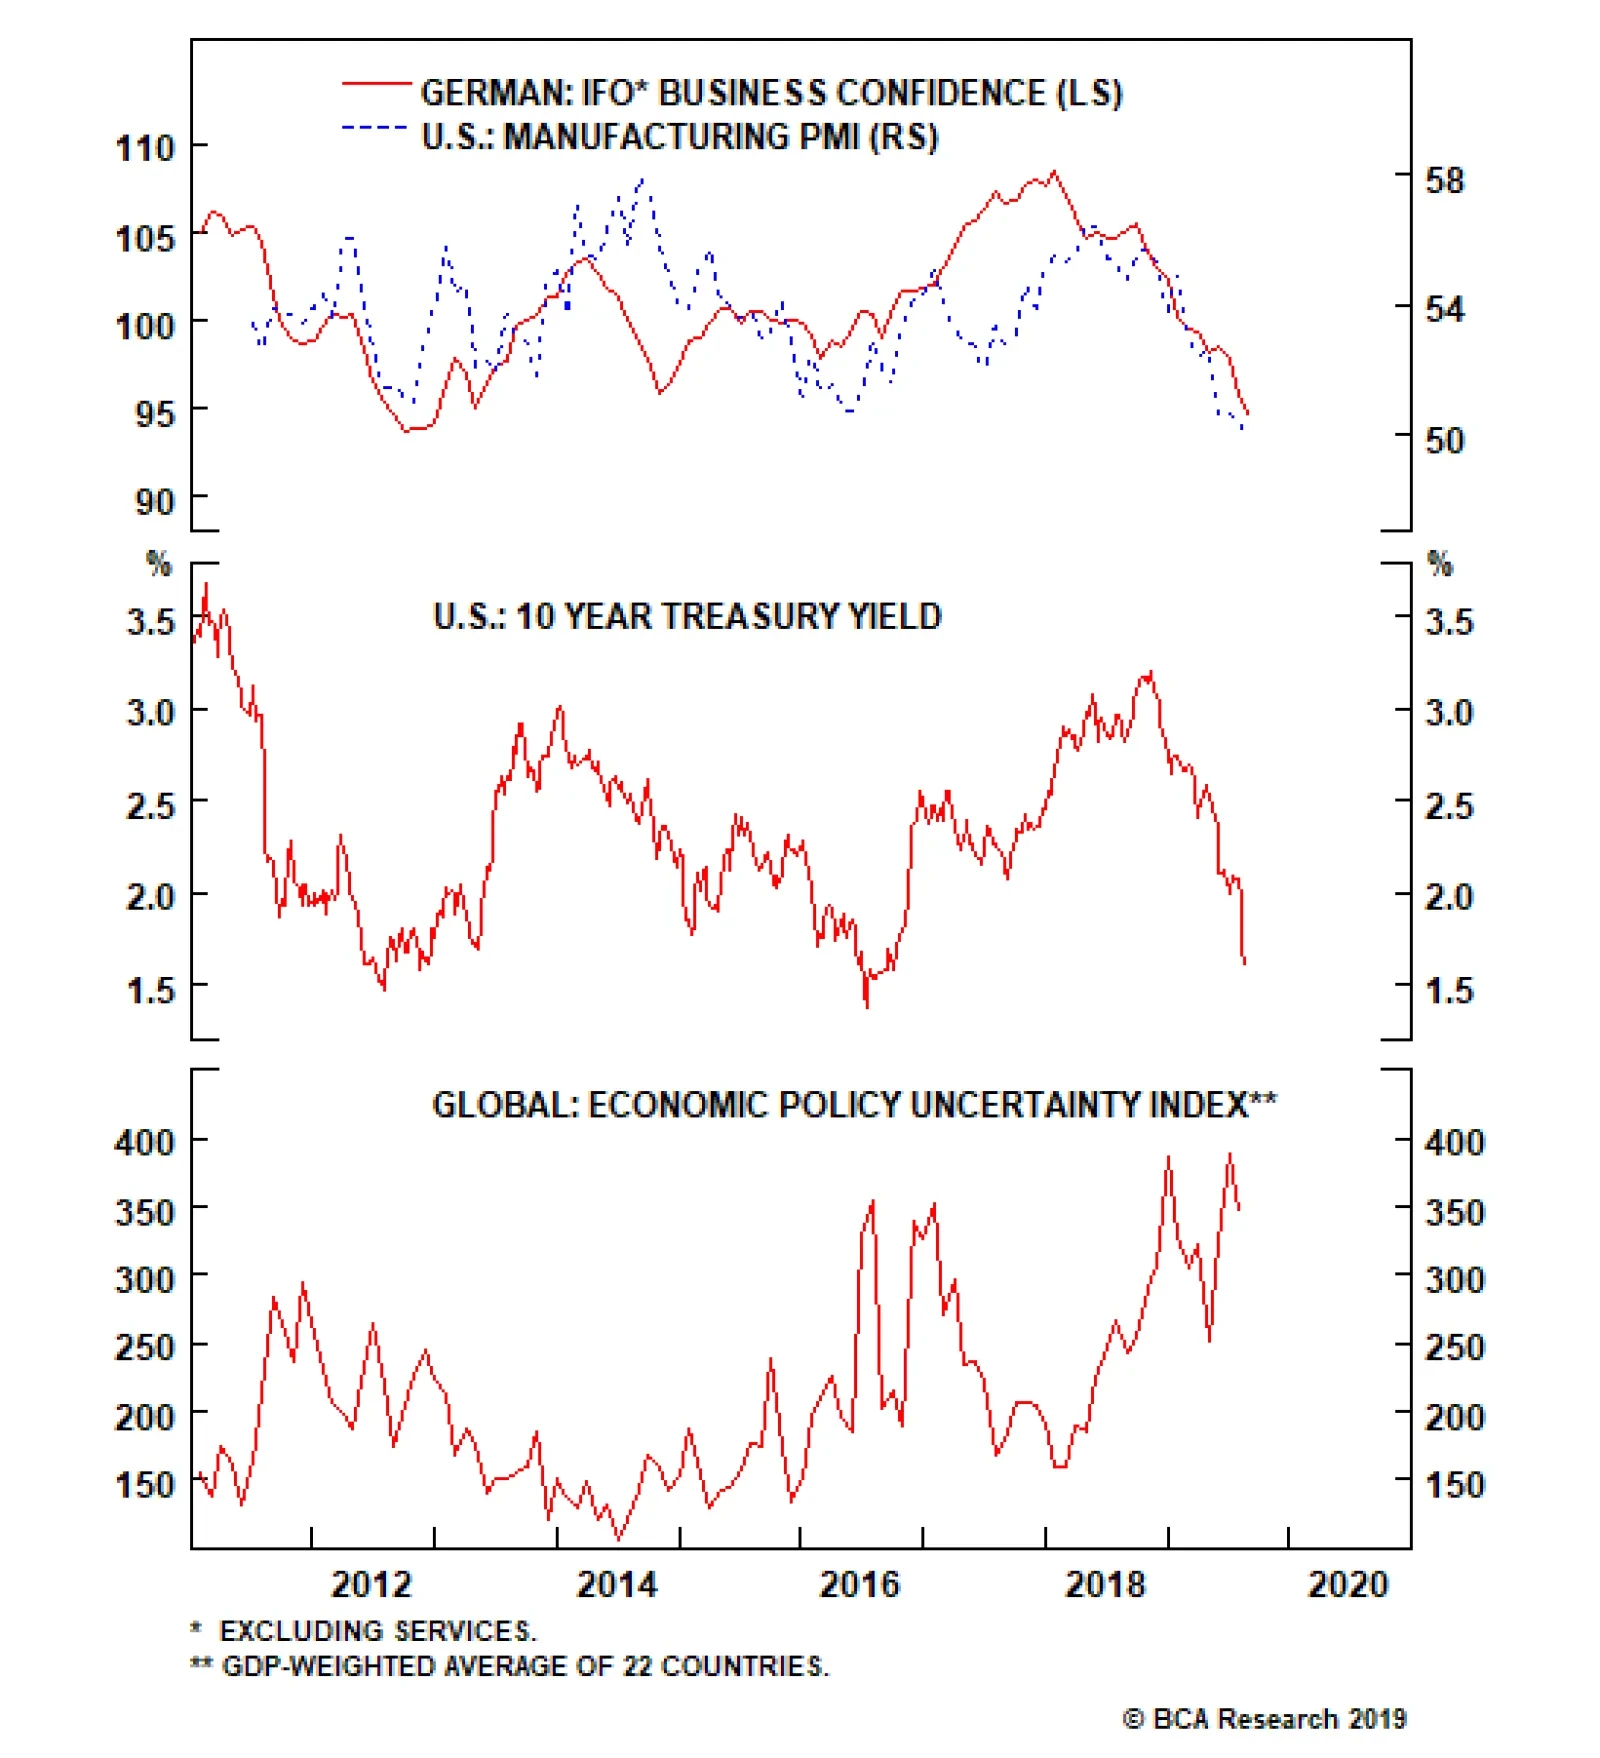
This morning, the August German Ifo fell more than expected, from 95.7 to 94.3. The expectations components also declined, from 92.2 to 91.3. It was anticipated to increase. This data highlights that the global manufacturing sector is still hurting. The…
Dear Client, Please note that there will be no regular Weekly Report next week, as we take a summer break. Our regular publication will resume September 6th. Best regards, Chester Ntonifor, Vice President Foreign Exchange Strategy Highlights Our PPP models show the DXY index to be overvalued by 10-15%. Within the G10 universe, the cheapest currencies are the Swedish krona, the British pound, the Japanese yen and the Norwegian krone. Look to go short CHF/GBP on valuation grounds. Feature Regular readers of our publication will notice that we tend to adhere to very simple and time-tested ideas. One such is the concept of purchasing power parity (PPP). The beauty comes from its simplicity. If the price of a good in Sweden is rising faster than in South Africa, then the krona should depreciate versus the rand to equalize prices across both borders. Otherwise, the krona becomes incrementally expensive, relative to the rand. In practice, various models have shown PPP to be a very poor tool for managing currencies. One roadblock comes from measurement issues, since consumer price baskets tend to differ in composition from one country to the next. Second, there is less price discovery for services, than there is for tradable goods. For example, it is rather difficult to import a haircut from Mumbai into the U.S., and so arbitraging those prices away tends to be impractical. Tariffs, trade restrictions and transport costs also tend to dampen the explanatory power of PPP models, though those have had diminishing importance over time. In order to get closer to an apples-to-apples comparison across countries, we make two adjustments. First, we divide the consumer price index (CPI) baskets into five major groups. In most cases, this breakdown captures 90% of the national CPI basket: Food, restaurants and hotels Shelter Health, culture and recreation Energy and transportation Household goods The second adjustment is to run two regressions with the exchange rate as the dependent variable. The first regression (call it REG1) uses the relative price ratios of the five groups as independent variables. This allows us to observe the most influential price ratios that help explain variations in the exchange rate. The second regression (call it REG2) uses a weighted average combination of the five groups to form a synthetic relative price ratio. If for example, shelter is 33% in the U.S. CPI basket, but 19% in the Swedish CPI basket, relative shelter prices will represent 26% of the combined price ratio. This allows for a uniform cross-sectional comparison, compared to using the national CPI weights. The results were largely consistent: Both regressions were statistically significant, but more so for REG1. This makes intuitive sense, as the number of variables were higher in the first regression. The sign for household goods was negative for some countries. This could be due to some specter of multicollinearity, if the tradable goods price effect is captured in other categories. There is also the low value-to-weight ratio for many household goods such as refrigerators or air conditioners, which could make currency deviations from PPP persistent. The shelter sign was also negative for some countries, meaning rising shelter prices tended to be associated with an incrementally cheaper currency. This could be due to the Balassa-Samuelson effect. Rising incomes (one key determinant of rising house prices) usually reflect rising productivity levels, which tend to lift the fair value of the exchange rate. The results showed the U.S. dollar as overvalued, especially versus the Swedish krona, British pound and Norwegian krone. Commodity currencies were closer to fair value, and within the safe haven complex, the Japanese yen was more attractive than the Swiss franc. The euro was less undervalued than implied by the overvaluation in the DXY index. As a final note, PPP models are just an additional kit to our currency toolbox, and so should never be used in isolation, but in conjunction with other currency signals. This is just a first iteration in our PPP modelling work, which we intend to improve in the months to come. U.S. Dollar We reverse-engineered the fair value for the DXY index by aggregating the model results from its six constituents. This includes the euro, the Japanese yen, the British pound, the Canadian dollar, the Swedish krona, and the Swiss franc, using the corresponding DXY weights. The message from the synthetic model is clear: the U.S dollar is above its fair value, in line with our fundamental view (Chart 1). Chart 1The Dollar is Slightly Expensive
The Dollar is Slightly Expensive
The Dollar is Slightly Expensive
Americans spent 35% of their income in 2018 on goods and 65% on services. Shelter remains the single largest consumption item for American households, which makes up 33% of the consumption basket. However, the relative importance of shelter is dwarfed by much more rampant rent and house price increases in other developed countries. Medical care accounts for 8.7% of the CPI basket, and is the highest in the developed world on a per capita basis. Total spending on health care accounts for almost 20% of nominal GDP. Since the 1980s, the CPI for medical care has risen fivefold, far outpacing many developed countries. This makes the dollar incrementally expensive. Core CPI edged higher to 2.2% in July, driven by medical care and shelter. While above the Federal Reserve’s 2% target, the risks to inflation remain asymmetric to the downside. That will keep the Fed on a dovish path near-term, which should help close overvaluation in the dollar. Euro We had limited data for the euro area, and so our regression results were less robust. REG1 shows the euro as cheap, while REG2 is more ambiguous (Chart 2). In short, a PPP model for the euro had one of lowest explanatory powers within the G10 universe. Food, restaurants and hotels are the largest consumption item in the euro CPI basket. Looking at the details, food and non-alcoholic beverages account for 14%, alcohol and tobacco make up 4%, and restaurant and hotels account for about 10% (Table). Relative price trends have moved to undermine the fair value of the euro. Chart 2The Euro Is Slightly Cheap
The Euro Is Slightly Cheap
The Euro Is Slightly Cheap
Euro Area CPI Weights
A Fresh Look At Purchasing Power Parity
A Fresh Look At Purchasing Power Parity
Shelter’s weight in the euro area CPI basket currently stands at 16.7%, the smallest among G10 countries. Since 2012, relative house and rent prices in the euro area have been decreasing compared with that in the U.S. Rampant rent controls, especially in places like Germany have subdued housing CPI, and tempered the fair value of the euro. This makes sense to the extent that it represents a concomitant rise in the welfare state. It is well-known that the euro area is relatively open and so tradable goods prices are important for the fair value of the euro. Given that the epicenter of trade tensions is between the U.S. and China, this will act to boost the relative attractiveness of European goods, which will be a bullish underpinning for the euro. Inflation expectations have collapsed in the euro area. However, compared to the Federal Reserve, there is little the European Central Bank can do to boost inflation. This is relatively euro bullish. Once global growth eventually picks up, improved competitiveness in the periphery will allow for non-inflationary growth. Japanese Yen The yen benefits from being cheap, as well as being a safe-haven currency (Chart 3). The overarching theme for Japan is a falling (and rapidly aging) population, which means that deficient demand and falling prices are the norm. This makes the yen relatively attractive on a recurring basis. Most of the Heisei era in Japan has been characterized by deflation. Importantly, all categories in Japan have been in a relative price downtrend during this period (Table). Domestically, an aging population (that tends to be a large voting base), prefer falling prices. Meanwhile, the bursting of the asset bubble in the late 80s/early 90s led to a powerful deleveraging wave that undermined prices. Chart 3The Yen Is Quite Cheap
The Yen Is Quite Cheap
The Yen Is Quite Cheap
Japan CPI Weights
A Fresh Look At Purchasing Power Parity
A Fresh Look At Purchasing Power Parity
The relative prices for most items have been decreasing, but culture and recreation inflation have experienced a meaningful rebound since 2013, largely due to a booming tourism industry in Japan.1 According to tourism statistics, the number of international visitors to Japan reached 31 million in 2018, almost five times the number ten years ago. But as long as the younger generation in Japan continues to save more and consume less, prices will remain under pressure. BoJ Governor Haruhiko Kuroda remains committed to achieving a 2% inflation target, but inflation expectations are falling to historical lows at a time when the BoJ is running out of policy bullets.2 That means inflation will likely lag that of other developed countries, lifting the fair value of the yen. British Pound Both regressions show the pound as undervalued. This supports our view that over the long term, the pound is a categorical buy (Chart 4). The consumption baskets in both the U.K. and the U.S. are roughly similar, which means traditional PPP models do a good job at capturing the true underlying picture of price differentials (Table). For example, OECD PPP models, based on national expenditure, show the pound as 15% undervalued. Chart 4The Pound Is Cheap
The Pound Is Cheap
The Pound Is Cheap
U.K. CPI Weights
A Fresh Look At Purchasing Power Parity
A Fresh Look At Purchasing Power Parity
Housing is the largest item in the consumption basket, with a total weight close to 30% (including housing electricity and water supply). The shelter consumer price index in the U.K. started to fall relative to the U.S. in 2016, which has lowered the fair-value of the pound (in the Balassa-Samuelson framework). That said, the fall in the pound has been much more deep and violent than suggested by domestic price fundamentals. For example, food restaurants and hotels are 10% cheaper in the U.K. compared to the U.S. over the last half decade. However, rather than appreciating 10%, the pound has plummeted by about 30%. Brexit will continue to dictate the ebb and flow of sterling gyrations, but the reality is that the pound should be higher on a fundamental basis. Meanwhile, a pick up in the global economy will benefit the pound. Going short CHF/GBP on valuation grounds is an attractive bet today. Australian Dollar As a commodity currency, PPP models are less useful for the Australian dollar than terms of trade, or even interest rate differentials. That said, the Aussie dollar is still relatively cheap versus the USD on a PPP basis (Chart 5). The key driver for value in the AUD has been a drop in the currency, relative to what price differentials will dictate. Food, restaurants and hotels comprise 23% of the Australian CPI basket, with the alcohol and tobacco category alone making up 7.4% (Table). Given food price differentials have been stable versus the U.S. in over a decade, Aussie citizens have not been particularly worse off. Chart 5The Aussie Is Slightly Cheap
The Aussie Is Slightly Cheap
The Aussie Is Slightly Cheap
Australia CPI Weights
A Fresh Look At Purchasing Power Parity
A Fresh Look At Purchasing Power Parity
Shelter accounts for almost a quarter percent of the basket. Relative shelter prices in Australia have been rising since the late 1990s, but started to soften in the past few years, on the back of macro prudential measures. Meanwhile, holiday travel and accommodation have a total weight of 6%, of which domestic travel makes up 2.9%, and international travel 3.1%. The overall cost of tourism in Australia has been falling relative to the U.S., boosting the fair value of the Aussie. In the 1980s, inflation in Australia averaged around 8.3% year-on-year. This made the Aussie incrementally expensive, creating grounds for a subsequent 50% devaluation from 1980 to 1986. Inflation targeting was finally introduced and has realigned Aussie prices with the rest of the world. Our bias is that the Aussie will be less driven by price differentials going forward, but more by RBA policy and terms of trade. New Zealand Dollar The New Zealand dollar is at fair value according to both models (Chart 6). Like the aussie, the kiwi is less driven by price differentials and more by terms of trade. Food and shelter account for the largest share of the consumption basket, and relative prices have not been moving in favor of the kiwi (Table). So, while the kiwi was overvalued earlier this decade, the overvaluation gap has been mostly closed via a higher dollar. Chart 6The Kiwi Is At Fair Value
The Kiwi Is At Fair Value
The Kiwi Is At Fair Value
New Zealand CPI Weights
A Fresh Look At Purchasing Power Parity
A Fresh Look At Purchasing Power Parity
Relative shelter prices in New Zealand have been soaring in recent decades compared to the U.S. Higher immigration, foreign purchases and a commodity boom helped. However, in August 2018, the ban on foreign property purchases came into effect, which helped cool down the housing market. Like in Australia, the inflation rate in New Zealand reached 18% year-on-year in the early 1980s, and was subsequently addressed via inflation targeting. This has realigned New Zealand prices somewhat with the rest of the world. Our bias is that going forward, the kiwi will underperform the aussie, mainly because of a negative terms of trade shock. Canadian Dollar The loonie is currently trading below its fair value, according to both of our models (Chart 7). Shelter remains the largest budget item for Canadian households (Table). The average Canadian household spent C$18,637 on shelter per year, around 29.2% of the total consumption in 2017.3 Interestingly, the shelter consumer price index does not fully capture skyrocketing house prices in Canada over the last decade. Since 2005, Canadian house prices relative to U.S. have doubled, according to OECD. On the contrary, the relative shelter CPI has trended downwards. These crosscurrents have dampened the explanatory power of the exchange rate. Chart 7The Loonie Is Slightly Cheap
The Loonie Is Slightly Cheap
The Loonie Is Slightly Cheap
Canada CPI Weights
A Fresh Look At Purchasing Power Parity
A Fresh Look At Purchasing Power Parity
Canadians are avid users of private transportation. The average spending on transportation accounted for 20% of total consumption, the second-largest expenditure item. Relative prices in this category have been rising, which has lowered the fair value of the exchange rate. Canada stands as the sixth largest energy producer in the world, but due to heavy taxation, Canadian consumers are paying more for gas prices than their U.S. neighbors. That said, terms of trade have been more important than PPP concerns for the loonie. In the near term, we believe energy prices (and the Western Canadian Select price spread) will continue to be important for the loonie. Swiss Franc USD/CHF is trading slightly below fair value, despite structural appreciation in the franc in recent years (Chart 8). The largest consumption item in Switzerland is the food, restaurants and hotels category (Table). The second item is shelter. Social services have a higher weight in the CPI basket, compared to other developed nations. This has been a huge driver of relative prices between Switzerland and the rest of the world, with falling relative prices boosting the fair value of the franc. Chart 8The Swiss Franc Is At Fair Value
The Swiss Franc Is At Fair Value
The Swiss Franc Is At Fair Value
Switzerland CPI Weights
A Fresh Look At Purchasing Power Parity
A Fresh Look At Purchasing Power Parity
Healthcare notably accounts for 15.5% in the total CPI basket, of which patient services makes up 11.5%. The Swiss healthcare system is a combination of public, subsidized private, and entirely private systems. It is mandatory for a Swiss resident to purchase basic health insurance, which covers a range of treatments. The insured person then pays the insurance premium plus part of the treatment costs. Finally, as a small open economy, tradable goods prices are important for Switzerland. Given high levels of specialization, terms-of-trade in Switzerland are soaring to record highs. This makes the franc a core holding in a currency portfolio. Norwegian Krone The Norwegian krone is undervalued according to both models (Chart 9). Food and shelter account for the largest share of the Norwegian CPI basket (Table). While the share of shelter is lower than in the U.S., other categories share similar weights, allowing traditional PPP models to be adequate for USD/NOK. One difference is that in terms of social services, only 0.2% of the expenditures are allocated to education, since all schools are free in Norway, including universities. Chart 9The Norwegian Krone Is Cheap
The Norwegian Krone Is Cheap
The Norwegian Krone Is Cheap
Norway CPI Weights
A Fresh Look At Purchasing Power Parity
A Fresh Look At Purchasing Power Parity
As a large energy producer, Norwegians pay less for electricity, gas, and other fuels. Norway is also a heavy producer of renewable energy, notably hydropower. This makes the domestic energy basket less susceptible to the ebbs and flows of energy prices. Going forward, the path of energy prices will continue to dictate ebbs and flows in the krone. Meanwhile, long NOK positions also benefit from an attractive valuation starting point. Swedish Krona The krona is the cheapest currency in our universe by a wide margin (Chart 10). This stems less from fluctuations in relative prices and more from negative rates that have hammered the exchange rate. Like many countries, food and shelter is the largest component of the consumption basket (Table). Transportation is also important. However, an important driver for undervaluation in the currency has been a drop in the relative price of social services. Chart 10The Swedish Krona Is Very Cheap
The Swedish Krona Is Very Cheap
The Swedish Krona Is Very Cheap
Sweden CPI Weights
A Fresh Look At Purchasing Power Parity
A Fresh Look At Purchasing Power Parity
Sweden experienced very high inflation rates in the 1980s, and since then, has been in a disinflationary regime. More recently, the inflation rate has edged down below the Riksbank’s target, mostly dragged down by recreation, culture, and healthcare. This makes Swedish real rates relatively attractive. We remain positive on the Swedish krona and believe that it will be one of the first to benefit, should global growth pick up. Chester Ntonifor, Foreign Exchange Strategist chestern@bcaresearch.com Kelly Zhong, Research Analyst kellyz@bcaresearch.com Footnotes 1 We removed the shelter component in regression 1, since it was distorting results. 2 Please see Foreign Exchange Strategy Weekly Report, titled “Short USD/JPY: Heads I Win, Tails I Don’t Lose Too Much”, dated May 31, 2019, available at fes.bcaresearch.com 3 Please see “Survey of Household Spending, 2017,” Statistic Canada, December 12, 2018. Trades & Forecasts Forecast Summary Core Portfolio Tactical Trades Limit Orders Closed Trades
Highlights Today’s equity risk premium of 1.6 percent makes equities the preferred long-term asset-class versus bonds at the current level of bond yields. The caveat is that this conclusion would quickly change if bond yields were to rise significantly. German equities are offering a more attractive risk premium of 3.7 percent versus German bunds. We closed our tactical short in equities at its 4 percent profit-target, and are now tactically neutral. Fractal analysis suggests that bonds are now technically overbought… …but developments in the coming weeks warrant a degree of caution. With trade tensions still simmering, the Italian government in chaos, the ECB likely to unveil new stimulus in September, and the no-deal Brexit deadline looming at the end of October, there is too much event risk to short bonds with high conviction right now. Feature Chart of the WeekStocks Set To Return 3 Percent, Bonds Set To Return 1.4 Percent
Stocks Set To Return 3 Percent, Bonds Set To Return 1.4 Percent
Stocks Set To Return 3 Percent, Bonds Set To Return 1.4 Percent
Bonds Set To Return 1.4 Percent This year’s rally in bonds has dragged down bond yields to unprecedented lows. Indeed, in many markets, the term ‘bond return’ should more truthfully be called ‘bond penalty’. For example, with the German 10-year bund now yielding -0.7 percent, buying and holding it for its ten year life will lose you 7 percent of your money.1 Or will it? Unlike in most jurisdictions where the currency cannot disintegrate, euro area bond yields are complicated by ‘redenomination’ discounts and premiums. If you were certain that the euro was going to break up within the next ten years, and that the German bund would pay you back in new deutschmarks worth 7 percent more than euros, then the currency redenomination gain would more than cancel out the cumulative loss from the negative yield. For this reason a better measure of the euro area bond yield comes from the single currency bloc’s average yield – because in a break up, the expected currency gains and losses for the average euro area bond yield must sum to zero. To avoid the onerous calculation of this euro area average yield, a useful proxy turns out to be the French OAT yield. While not as depressed as the German bund yield, the 10-year OAT yield, at -0.35 percent, still constitutes a bond penalty (Chart I-2). The global bond yield has reached a new record low. Meanwhile, although the global 10-year bond yield is still positive, it recently fell to an all-time low of 1.40 percent – breaking the previous record low of 1.43 percent set in the aftermath of the 2016 shock vote for Brexit (Chart I-3). Chart I-2The French OAT Is A Good Proxy For The Average Euro Area Bond
The French OAT Is A Good Proxy For The Average Euro Area Bond
The French OAT Is A Good Proxy For The Average Euro Area Bond
Chart I-3Bonds Set To Return##br## 1.4 Percent
Bonds Set To Return 1.4 Percent
Bonds Set To Return 1.4 Percent
Stocks Set To Return 3 Percent The long term prospective return from most asset-classes is well-defined: for the bond asset-class it is the yield to maturity, now at 1.4 percent;2 for the equity asset-class it comes from the starting valuation, which tends to be an excellent predictor of the long term prospective return. But which valuation metric? Equity valuations based on earnings are problematic – because valuations appear deceptively attractive when profit margins are structurally high, as they are now (Chart I-4). The problem is that earnings will face a structural headwind when margins normalise, depressing prospective returns. Some people suggest adjusting the earnings to derive a cyclically adjusted price to earnings multiple (CAPE), but by definition this only corrects for the cycle and does not correct for any structural trend. Chart I-4Structurally High Profit Margins Flatter Equity Earnings
Structurally High Profit Margins Flatter Equity Earnings
Structurally High Profit Margins Flatter Equity Earnings
Equity valuations based on assets are also problematic. Nowadays, such assets comprise intellectual capital or intangibles or ‘virtual’ assets, which are extremely difficult to quantify accurately. Hence, our preferred long-term valuation metric is price to sales – because sales are quantifiable, objective, and unambiguous. Indeed, the starting price to sales multiple of the global equity asset-class has been a near-perfect predictor of its prospective 10-year nominal return (Chart I-5). The method is to regress historic starting price to sales with (the known) prospective 10-year returns. Then apply the established relationship to the current price to sales to predict the (the unknown) prospective return. Chart I-5Stocks Set To Return 3 Percent
Stocks Set To Return 3 Percent
Stocks Set To Return 3 Percent
On this basis, today’s prospective 10-year annualised return from global equities is 3 percent. Is The 1.6 Percent Excess Return Enough? So the prospective 10-year return from equities, at an annualised 3 percent, is 1.6 percent more than that from bonds, at 1.4 percent.3 Is this excess return – the so-called ‘equity risk premium’ – enough (Chart of the Week)? Price to sales has been a near-perfect predictor of long term equity returns. Yes, because at ultra-low bond yields, the risk of owning bonds converges with the risk of owning equities. The asymmetry in the future direction of bond yields makes bonds riskier investments. The short-term potential for capital appreciation – nominal or real – diminishes, while the potential for vicious losses increases dramatically. The technical term for this unattractive asymmetry is negative skew. Recent breakthroughs in risk theory and behavioural economics conclude that our perception of an investment’s risk does not come from its volatility or correlation characteristics. It comes from the investment’s negative skew.
Chart I-6
The upshot is that today’s excess prospective return of 1.6 percent does make equities the preferred long-term asset-class at the current level of bond yields. The caveat is that this conclusion would quickly change if bond yields were to rise significantly (Chart I-6). Interestingly, German equities are an excellent long-term proxy for global equities, producing near-identical returns (Chart I-7). This is not surprising given the very similar international and sector focusses. We can infer that the German stock market, just like the global equity asset-class, is set to deliver an annualised 10-year return of 3 percent. But in Germany, the 10-year bond yield is -0.7 percent, implying that German equities are offering a more attractive risk premium of 3.7 percent versus German bunds. Chart I-7German Equities Are An Excellent Proxy For Global Equities
German Equities Are An Excellent Proxy For Global Equities
German Equities Are An Excellent Proxy For Global Equities
Some Other Asset Allocation Thoughts The rally in bonds has hurt our cyclical overweight to the DAX versus long-dated German bunds. However, given the aforementioned long-term analysis, we are sticking with it, albeit switching it from a cyclical to a structural recommendation. Our other recent asset allocation recommendations have worked. In May, we pointed out that the simultaneous strong rallies in equities, bonds, and oil was extremely rare, and that at least one of the rallies would soon break down. This is precisely what happened. While bonds rallied a further 5 percent, equities corrected by 5 percent, and the crude oil price plunged 20 percent. However, our portfolio construction could have been better as our weightings in the three assets left the combined short position roughly flat. The position is now closed. Our tactical short in equities achieved its 4 percent profit-target. Likewise in June, fractal analysis suggested that the double-digit rally in stock markets was vulnerable to a countertrend reversal. This is precisely what happened. Our tactical short position in the MSCI AC World Index achieved its 4 percent profit-target and is now closed (Chart I-8). Stay tactically neutral to equities. Chart I-8Stocks Were Overbought, And Reversed
Stocks Were Overbought, And Reversed
Stocks Were Overbought, And Reversed
Interestingly, the same fractal analysis is suggesting that it is the stellar rally in bonds that is now vulnerable to a countertrend reversal (Chart I-9), implying a tactical short position in bonds. Having said that, developments in the coming weeks warrant a degree of caution. With trade tensions still simmering, the Italian government in chaos, the ECB likely to unveil new stimulus in September, and the no-deal Brexit deadline looming at the end of October, there is too much event risk to short bonds with high conviction right now. Chart I-9Bonds Are Overbought
Bonds Are Overbought
Bonds Are Overbought
Fractal Trading System* This week we note that the sharp underperformance of Spain (IBEX 35) versus Belgium (BEL 20) is technically extended and susceptible to a liquidity-triggered reversal. Accordingly, the recommended trade is to go long Spain versus Belgium setting a profit-target of 3.5 percent with a symmetrical stop-loss. In the other trades, short MSCI All-Country World achieved its 4 percent profit-target and is now closed. For any investment, excessive trend following and groupthink can reach a natural point of instability, at which point the established trend is highly likely to break down with or without an external catalyst. An early warning sign is the investment’s fractal dimension approaching its natural lower bound. Encouragingly, this trigger has consistently identified countertrend moves of various magnitudes across all asset classes. Chart I-10
Spain VS. Belgium
Spain VS. Belgium
The post-June 9, 2016 fractal trading model rules are: When the fractal dimension approaches the lower limit after an investment has been in an established trend it is a potential trigger for a liquidity-triggered trend reversal. Therefore, open a countertrend position. The profit target is a one-third reversal of the preceding 13-week move. Apply a symmetrical stop-loss. Close the position at the profit target or stop-loss. Otherwise close the position after 13 weeks. Use the position size multiple to control risk. The position size will be smaller for more risky positions. * For more details please see the European Investment Strategy Special Report “Fractals, Liquidity & A Trading Model,” dated December 11, 2014, available at eis.bcaresearch.com. Dhaval Joshi, Chief European Investment Strategist dhaval@bcaresearch.com Footnotes 1 Assuming no default risk and no reinvestment risk. 2 Assuming no default risk and no reinvestment risk. 3 Nominal annualised total return, capital plus income. Fractal Trading System Cyclical Recommendations Structural Recommendations Closed Fractal Trades Closed Trades Asset Performance Currency & Bond Equity Sector Country Equity Indicators Bond Yields Chart II-1Indicators To Watch - Bond Yields
Indicators To Watch - Bond Yields
Indicators To Watch - Bond Yields
Chart II-2Indicators To Watch - Bond Yields
Indicators To Watch - Bond Yields
Indicators To Watch - Bond Yields
Chart II-3Indicators To Watch - Bond Yields
Indicators To Watch - Bond Yields
Indicators To Watch - Bond Yields
Chart II-4Indicators To Watch - Bond Yields
Indicators To Watch - Bond Yields
Indicators To Watch - Bond Yields
Interest Rate Chart II-5Indicators To Watch - Interest Rate Expectations
Indicators To Watch - Interest Rate Expectations
Indicators To Watch - Interest Rate Expectations
Chart II-6Indicators To Watch - Interest Rate Expectations
Indicators To Watch - Interest Rate Expectations
Indicators To Watch - Interest Rate Expectations
Chart II-7Indicators To Watch - Interest Rate Expectations
Indicators To Watch - Interest Rate Expectations
Indicators To Watch - Interest Rate Expectations
Chart II-8Indicators To Watch - Interest Rate Expectations
Indicators To Watch - Interest Rate Expectations
Indicators To Watch - Interest Rate Expectations
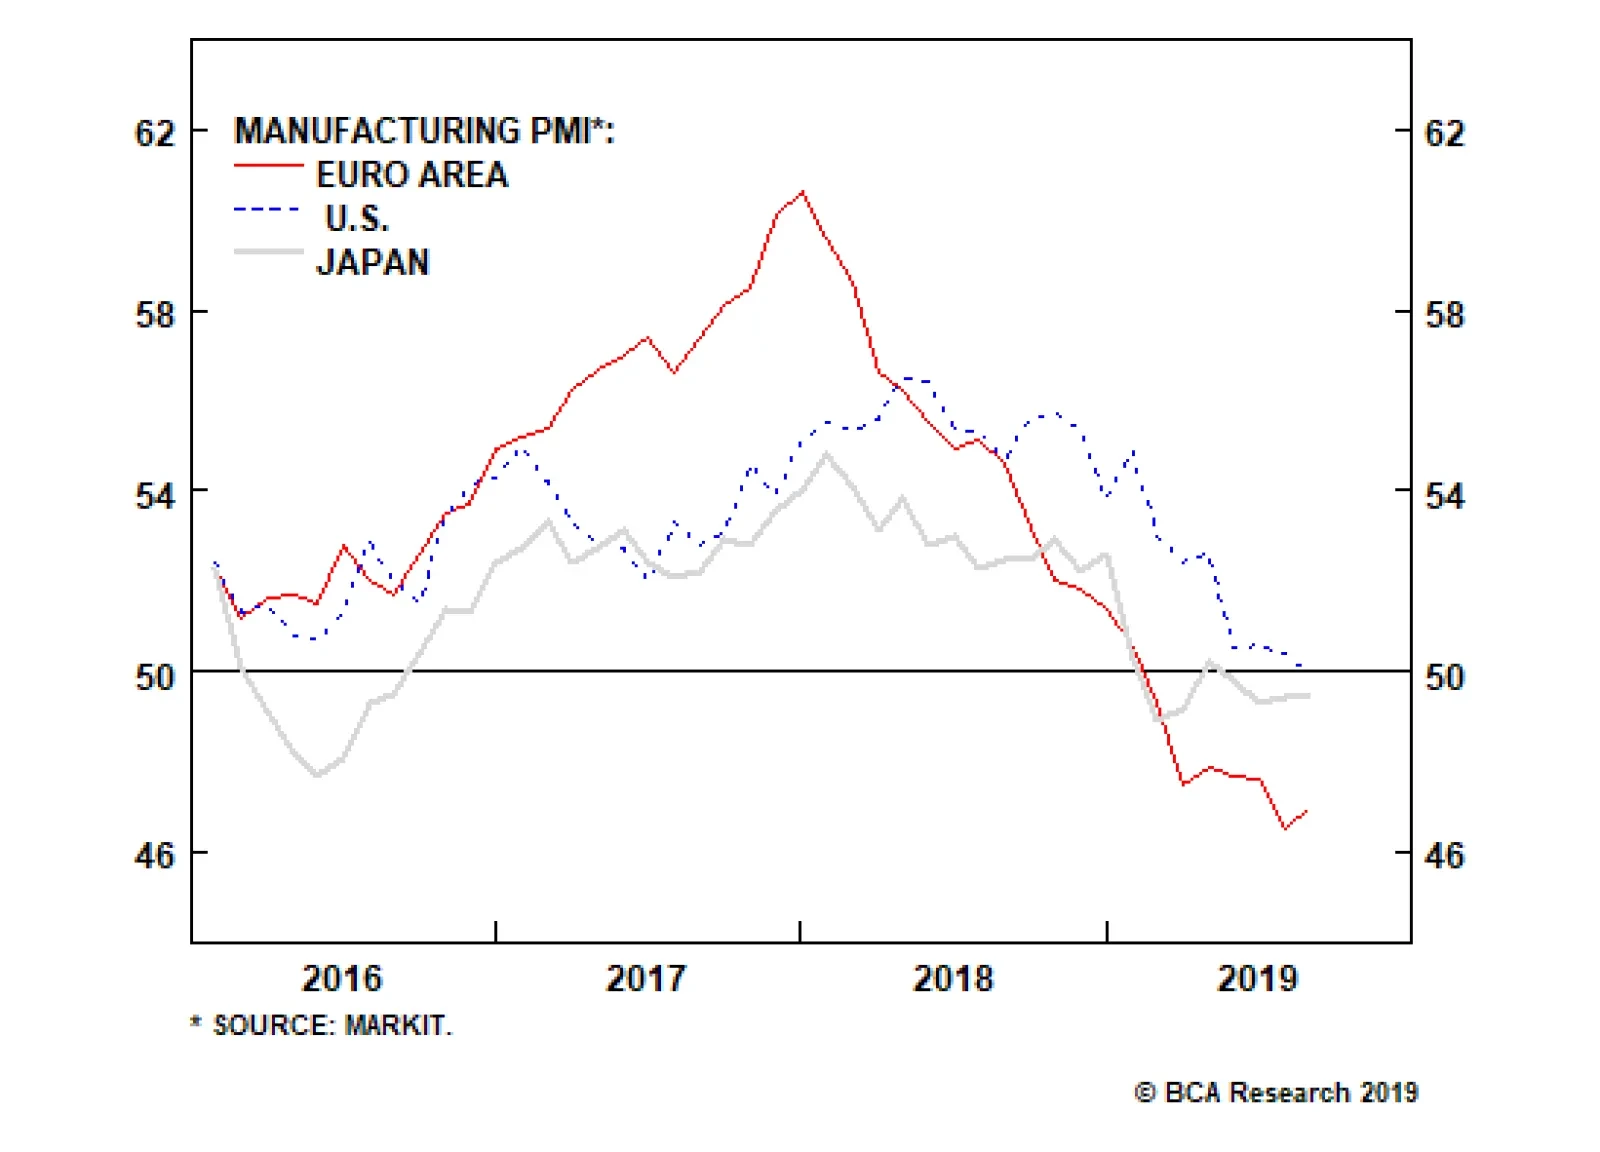
This morning, the Flash PMI saw a stabilization in the European manufacturing sector. Euro area manufacturing PMI moved up to 47 from 46.5, and in Germany, it rose to 43.6 from 43.2. In Japan, the manufacturing PMI also stabilized, inching 0.1 points higher…
Highlights Duration: Global manufacturing growth will rebound near the end of this year. Much like in 2016, this will result in higher global bond yields on a 12-month horizon. Investors should keep portfolio duration close to benchmark for now, but be prepared to shift to below-benchmark when our global growth indicators show signs of improvement. Country Allocation: Countries with yield curves furthest away from the effective lower bound also have the most cyclical bond markets. At present, this means that U.S. and Canadian bond markets will perform best if global growth continues to weaken. They will also perform worst in the event of an economic turnaround. Japanese bonds will perform best in a bond bear market, with German debt a close second. Relative Value In Global Government Debt: Changes in the level and shape of global yield curves have altered the relative value opportunities in the global government bond space. We find that the most positive carry (including both yield income and rolldown) in global government bond markets is earned in 30-year German, Japanese and Australian bonds, and in 10-year U.K. and Japanese bonds. Feature Reflexivity Chart 1A Brief Inversion
A Brief Inversion
A Brief Inversion
The decline in global bond yields has been unrelenting, and it took on a life of its own last week when the U.S. 2-year/10-year slope briefly inverted (Chart 1). After the inversion, the 30-year U.S. Treasury yield broke below 2% and the 10-year yield broke below 1.50%. The average yield on the 7-10 year Global Treasury Index closed at 0.49% last Thursday, just above its all-time low of 0.48% (Chart 1, bottom panel). There’s an interesting self-fulfilling prophesy that can take hold when the yield curve inverts. Investors interpret the inversion as a signal of weaker economic growth ahead. They then bid up long-dated bond prices causing the curve to invert even more. This sort of circular reasoning can cause bond yields to disconnect from the trends in global economic data, often severely. While recession fears have benefited government bonds, risky assets – equities and corporate bonds – have experienced relatively minor pain. The S&P 500’s recent sell-off pales in comparison to the one seen late last year (Chart 2). Meanwhile, corporate bond spreads remain well below early-2019 peaks. Risky assets have clearly benefited from the drop in bond yields, as markets price-in a future where central banks ease monetary policy in response to weaker economic growth, and where that easing is sufficient to keep equities and credit well supported. Chart 2Low Yields Support Risk Assets I
Low Yields Support Risk Assets I
Low Yields Support Risk Assets I
Chart 3Low Yields Support Risk Assets II
Low Yields Support Risk Assets II
Low Yields Support Risk Assets II
Further evidence of this dynamic is presented in Chart 3. The chart shows the sensitivity of daily changes in the U.S. 10-year Treasury yield to changes in the S&P 500 for each year since 2010. The sample is split into days when the S&P 500 rose and when it fell. For example, in 2010 the sensitivity on “up days” was 2.6, meaning that on days when the S&P 500 rose, the 10-year yield rose 2.6 basis points for every 1% increase in the S&P 500. Similarly, the sensitivity in 2010 on “down days” was 3.2. This means that the 10-year yield fell 3.2 bps for every 1% drop in the equity index. The main takeaway from Chart 3 is how dramatically the sensitivities have shifted in 2019. The yield sensitivity on “up days” has fallen sharply – down to 0.8. This means that yields barely rise on days when equities move up. Meanwhile, the sensitivity on “down days” has shot higher, to just under 4. This means that yields fall a lot on days when equities sell off. The perception of easier monetary policy has been the main support for risk assets this year. The logical interpretation of these trends is that the perception of easier monetary policy has been the main support for risk assets this year. Global Growth Needed At present, we are stuck in an environment where aggressively easy monetary policy and low bond yields are the sole supports for risky assets. In turn, falling bond yields are stoking concerns about the economy, leading to even easier monetary policy. Only one thing can bust us out of this pattern, and that’s a resurgence of global manufacturing growth. Unfortunately, there is little evidence that this is taking place (Chart 4). The Global Manufacturing PMI is now down to 49.3, below the 2016 trough of 49.9 (Chart 4, top panel). U.S. Industrial Production growth remains weak, but is showing signs of stabilization above the 2016 trough (Chart 4, panel 2). European Industrial Production, on the other hand, continues to contract (Chart 4, panel 3). The downtrend in our favorite real-time indicator of global manufacturing – the CRB Raw Industrials index – remains unbroken (Chart 4, bottom panel). However, even though evidence of a turnaround in global manufacturing is scant, we expect a rebound near the end of this year, for the following reasons: Global financial conditions have eased this year, the result of aggressive central bank stimulus. Financial conditions are easier now than they were in 2018, and much easier than they were prior to the 2015/16 global growth slowdown (Chart 5, top panel). China has started to ease credit conditions in response to U.S. tariffs and the slowdown in growth. So far, stimulus has been tepid relative to 2015/16 levels, but it should ramp up in the coming months.1 Many large important segments of the global economy remain unaffected by the global manufacturing slowdown. The U.S. consumer continues to spend: Core retail sales are growing at a robust 5% year-over-year rate, and consumer sentiment remains elevated (Chart 5, panels 2 & 3). Even in the Eurozone, the service sector has not experienced the same pain as manufacturing (Chart 5, bottom panel). Fiscal policy will remain a tailwind for economic growth this year and next. Last week, there were even rumors of increased fiscal thrust from Germany if the growth slowdown persists.2 Strong inflation readings only increased market worries that the Fed might not be as accommodative as necessary. On the whole, we expect that the above 4 factors will lead to a rebound in global manufacturing growth near the end of this year. Much like in 2016, this will result in higher global bond yields on a 12-month horizon, but the global growth indicators shown in Chart 4 will need to rebound first. Chart 4Global Growth Indicators
Global Growth Indicators
Global Growth Indicators
Chart 5Catalysts For Economic Recovery
Catalysts For Economic Recovery
Catalysts For Economic Recovery
Inflation Puts Pressure On Powell Chart 6Strong Inflation Could Complicate The Fed's Message
Strong Inflation Could Complicate The Fed's Message
Strong Inflation Could Complicate The Fed's Message
Strong U.S. inflation prints during the past two months add an interesting wrinkle to the macro landscape. Core U.S. inflation grew at an annualized rate of 3.55% in July, following an annualized rate of 3.59% in June (Chart 6). However, these strong inflation readings only increased market worries that the Fed might not be as accommodative as necessary. This exacerbated the flattening of the yield curve and sent long-dated TIPS breakeven inflation rates lower. Our sense is that the Fed is chiefly concerned with re-anchoring inflation expectations (Chart 6, bottom panel). This probably means that another rate cut is coming in September, and that Chairman Powell will do his best to sound accommodative in his Jackson Hole address on Friday. However, recent strong inflation data could prompt Powell to sound more hawkish than the market would like, causing yield curves to flatten and risky assets to fall. Bottom Line: Global manufacturing growth will rebound near the end of this year. Much like in 2016, this will result in higher global bond yields on a 12-month horizon. Investors should keep portfolio duration close to benchmark for now, but be prepared to shift to below-benchmark when our global growth indicators show signs of improvement. Country Allocation & The Zero Lower Bound Perhaps the most straightforward way to think about country allocation within a portfolio of developed market government bonds is to classify the different markets as either “high beta” or “low beta”. Chart 7 shows the trailing 3-year sensitivity of major countries’ 7-10 year bond yields relative to the global 7-10 year yield.3 The U.S. and Canada have the highest betas, followed by the U.K. and Australia. Germany has a beta close to one, and Japan’s beta is the lowest. Chart 7Global Yield Beta
Global Yield Beta
Global Yield Beta
In other words, if global growth falters and global bond yields decline, U.S. and Canadian bond markets should perform best, followed by the U.K. and Australia. German bonds should perform in line with the global index, and Japanese bonds should underperform the global benchmark. What makes this approach to portfolio allocation even better is that the calculation of trailing betas is not really necessary. A very similar ordering of countries – from “high beta” to “low beta” – is achieved by simply ranking the markets from highest yielding to lowest yielding. High yielding countries, like the U.S. and Canada, have the most room to ease monetary policy in response to a negative growth shock. This means that yields in those countries will respond most to global growth fluctuations. On the other hand, the entire Japanese yield curve is already pinned near the effective lower bound. Even in the event of a negative growth shock, there is little scope for easier Japanese monetary policy, and JGB yields will be relatively unaffected. Chart 8High Beta Countries Are Most Sensitive To Economic Growth
High Beta Countries Are Most Sensitive To Economic Growth
High Beta Countries Are Most Sensitive To Economic Growth
It’s interesting to note in Chart 7 that while German yields are actually below JGB yields, bunds remain somewhat less defensive than the Japanese market. This is because the German term structure has only recently moved to the effective lower bound, and investors likely still retain some hope that an improvement in global growth could lead to European policy tightening at some point in the future. This belief is largely absent in Japan, where the term structure has been pinned at the lower bound for many years. Chart 8 provides some further evidence of the split between “high beta” and “low beta” bond markets. It shows that the bond markets with the highest yields are also the most sensitive to trends in global growth, as proxied by the Global Manufacturing PMI. U.S. bond yields are highly correlated with the Global PMI, while Japanese bond yields are hardly correlated at all. It follows that if the slowdown in global growth continues and all nations’ yield curves converge to Japanese levels, then the overall economic sensitivity of global bond yields will decline. Bottom Line: Countries with yield curves furthest away from the effective lower bound also have the most cyclical bond markets. At present, this means that U.S. and Canadian bond markets will perform best if global growth continues to weaken. They will also perform worst in the event of an economic turnaround. Japanese bonds will perform best in a bond bear market, with German debt a close second. Looking For Positive Carry Yield curves have undergone dramatic shifts in recent months, in terms of both level and shape. Not only have curves for the major government bond markets shifted down since the beginning of the year, they also now exhibit varying degrees of a ‘U’ shape (Charts 9A-9F). With that in mind, in this week’s report we look for the best “positive carry” opportunities in global government bond markets. Yield curves for the major government bond markets have shifted down since the beginning of the year, they also now exhibit varying degrees of a ‘U’ shape. We use the term carry to mean the expected return from a given bond assuming an unchanged yield curve. This is essentially the combination of yield income (i.e. coupon return) and the price impact of rolling down (or up) the yield curve. For the purposes of this report, we assume a 12-month investment horizon and incorporate the impact of currency hedging into each security’s yield income.
Chart 9
Chart 9
Chart 9
Chart 9
Chart 9
Chart 9
Rolldown ‘U’ shaped yield curves mean that bonds near the base of the ‘U’ currently suffer from negative rolldown, while the rolldown for long maturities is often highly positive. Table 1 shows that rolldown is currently negative for all 2-year bonds, but especially for U.S. and Canadian debt. The U.S. and Canada have the highest policy rates within developed markets, so it’s not surprising that the front-end of their yield curves are also the most steeply inverted. In other words, their yield curves are pricing-in that they have more room to cut rates than other countries. Table 112-Month Rolldown* (%) For A Long Position In Government Bonds
Where's The Positive Carry In Bond Markets?
Where's The Positive Carry In Bond Markets?
In general, rolldown is relatively modest for most 5-year and 7-year maturities. The exceptions being German 5-year debt and Aussie 7-year debt, which benefit from 31 bps and 45 bps of positive rolldown, respectively. As mentioned above, rolldown is currently very positive for long maturity debt. In fact, a 10-year U.K. bond offers a whopping 85 bps of rolldown on a 12-month horizon. Yield Income & Overall Carry As mentioned above, rolldown is only one part of a bond’s carry. The other is the yield an investor earns over the course of the investment horizon – the yield income. Because we assume that investors hedge the currency impact of their bond positions, this yield income also depends on the native currency of the investor. Therefore, we show yield income and overall carry below from the perspective of investors in each of the major currency blocs (USD, EUR, JPY, GBP, CAD, AUD). USD Investors Being the global high yielder, USD investors benefit the most from currency hedging. That is, USD investors earn a lot of additional income on their currency hedges, making non-U.S. bonds look more attractive. Unsurprisingly, carry is most positive at the long-end of yield curves (Tables 2 & 3). Table 2In USD: 12-Month Yield Income* (%) For A Long Position In Government Bonds
Where's The Positive Carry In Bond Markets?
Where's The Positive Carry In Bond Markets?
Table 3In USD: 12-Month Carry (%) For A Long Position In Government Bonds
Where's The Positive Carry In Bond Markets?
Where's The Positive Carry In Bond Markets?
EUR Investors The polar opposite of USD investors, EUR-based investors give up a lot of return through currency hedging. This makes the potential for positive carry much less. In any case, the best positive carry opportunities still lie in German, Japanese and Australian 30-year bonds. U.K. and Japanese 10-year bonds are also attractive (Tables 4 & 5). Table 4In EUR: 12-Month Yield Income* (%) For A Long Position In Government Bonds
Where's The Positive Carry In Bond Markets?
Where's The Positive Carry In Bond Markets?
Table 5In EUR: 12-Month Carry (%) For A Long Position In Government Bonds
Where's The Positive Carry In Bond Markets?
Where's The Positive Carry In Bond Markets?
JPY Investors Yen-based investors currently have more opportunities to earn positive carry than those based in euros. But these opportunities remain confined to long-maturity debt. Once again, the standouts are Japanese, German and Australian 30-year bonds, and also U.K. and Japanese 10-year debt (Tables 6 & 7). Table 6In JPY: 12-Month Yield Income* (%) For A Long Position In Government Bonds
Where's The Positive Carry In Bond Markets?
Where's The Positive Carry In Bond Markets?
Table 7In JPY: 12-Month Carry (%) For A Long Position In Government Bonds
Where's The Positive Carry In Bond Markets?
Where's The Positive Carry In Bond Markets?
GBP Investors Currency hedges work more in favor of GBP than EUR or JPY. As a result, GBP-based investors see more opportunities to earn positive carry (Tables 8 & 9). Table 8In GBP: 12-Month Yield Income* (%) For A Long Position In Government Bonds
Where's The Positive Carry In Bond Markets?
Where's The Positive Carry In Bond Markets?
Table 9In GBP: 12-Month Carry (%) For A Long Position In Government Bonds
Where's The Positive Carry In Bond Markets?
Where's The Positive Carry In Bond Markets?
CAD Investors As with USD-based investors, CAD-based investors also benefit from currency hedging. All securities continue to offer positive carry when hedged into CAD (Tables 10 & 11). Table 10In CAD: 12-Month Yield Income* (%) For A Long Position In Government Bonds
Where's The Positive Carry In Bond Markets?
Where's The Positive Carry In Bond Markets?
Table 11In CAD: 12-Month Carry (%) For A Long Position In Government Bonds
Where's The Positive Carry In Bond Markets?
Where's The Positive Carry In Bond Markets?
AUD Investors AUD-based investors also see positive carry across the entire global bond space, after factoring-in the impact of currency hedging (Tables 12 & 13). Table 12In AUD: 12-Month Yield Income* (%) For A Long Position In Government Bond
Where's The Positive Carry In Bond Markets?
Where's The Positive Carry In Bond Markets?
Table 13In AUD: 12-Month Carry (%) For A Long Position In Government Bonds
Where's The Positive Carry In Bond Markets?
Where's The Positive Carry In Bond Markets?
Bottom Line: Changes in the level and shape of global yield curves have altered the relative value opportunities in the global government bond space. We find that the most positive carry (including both yield income and rolldown) in global government bond markets is earned in 30-year German, Japanese and Australian bonds, and in 10-year U.K. and Japanese bonds. Ryan Swift, U.S. Bond Strategist rswift@bcaresearch.com Footnotes 1 Please see U.S. Bond Strategy Weekly Report, “The Trump Interruption”, dated August 13, 2019, available at usbs.bcaresearch.com 2 https://www.bloomberg.com/news/articles/2019-08-16/germany-ready-to-raise-debt-if-recession-hits-spiegel-reports 3 We calculate betas using average yields from the Bloomberg Barclays Global Treasury Master index. Fixed Income Sector Performance Recommended Portfolio Specification
Highlights Negative Interest Rates: Time will tell if negative bond yields are indeed the “new normal”. We need to see negative yields maintained outside of a growth slowdown to prove that thesis. USTs & Bunds: U.S. Treasuries and German Bunds both look overbought, amid extreme price/yield momentum and aggressively long duration positioning. Yet given the persistent headline risk from the U.S.-China trade dispute, and without signs of improving growth in China or Europe, it is too early to position for a reversal of the stretched yield moves. Maintain a neutral overall stance on global duration exposure.1 Feature Positive Headlines On Negative Yields? Investors should always be cautious of “new era” explanations to justify an elevated asset price after a massive rally. That is akin to internet stocks in the late 1990s that were valued on “clicks and eyeballs” in the absence of actual profits. Or the “peak oil” thesis, predicting an impending exhaustion of global petroleum supplies, that was trotted out during past periods when oil prices were already above $100/bbl. The latest such argument can be found in government bonds, where fundamental justifications for the growing inventory of negative yielding bonds being “the new normal” have started to proliferate. The arguments underlying the “Negative Normal Thesis” (which we will coin “NNT”, not to be confused with the MMT of Modern Monetary Theory!) are hardly new. Aging demographics, “savings gluts” and a dwindling supply of global safe assets have been widely cited as causes for low bond yields since early in the 21st century (remember former Fed Chair Alan Greenspan’s famous “bond conundrum”?). Proponents of NNT point to Japan as the textbook example of how rates can stay low forever when savings are high and demand for capital is low. They are now declaring the “Japanification” of Europe … with the U.S. next in line to eventually join the negative rate party. If the argument that negative interest rates are now normal were to hold, however, we would need to see bond yields continue to stay at negative (or at least extremely low) levels even after global economic growth has stabilized. Chart of the WeekIs This Really A “New Era” For Bond Yields?
Is This Really A "New Era" For Bond Yields?
Is This Really A "New Era" For Bond Yields?
If the argument that negative interest rates are now normal were to hold, however, we would need to see bond yields continue to stay at negative (or at least extremely low) levels even after global economic growth has stabilized. For if negative yields are, in fact, structurally driven by excess savings and not just cyclically driven by weak nominal growth, then improving economic momentum should have little impact on the level of interest rates. That would be a true “Japanification” scenario. For now, as far as we can tell from the data, the big decline in bond yields over the past year can be fully explained by the classic drivers – slowing economic growth and soft inflation (Chart of the Week). Investors are keenly aware of the triggers for these moves by now: a) slowing global trade and capital spending, both victims of the ever-worsening U.S.-China trade dispute; b) the lagged impact of past monetary tightening (Fed rate hikes and, arguably, the end of ECB bond buying at the end of 2018); and c) the persistent strength of the U.S. dollar preventing global “reflation”. You do not have to be an aging saver to view those as good reasons to favor the near-term safety of government bonds. Right now, the steady drumbeat of weakening cyclical global growth indicators is fueling bullish bond sentiment, especially in the parts of the world most exposed to global trade like Europe. Looking ahead, however, we may get the first test of NNT much sooner than expected. The latest update of the OECD’s leading economic indicators (LEI) was released last week. The message is consistent with the modest improvement seen over the past several months (Chart 2), with meaningful gains seen in many economies sensitive to global growth like Mexico, Taiwan, Australia and, most importantly, China. Our “leading leading” indicator – the diffusion index of the global LEI, which includes many of the individual country OECD LEIs – continues to show that the majority of countries are seeing a rise in their LEI. We have shown that the LEI diffusion index has, in the past, been a fairly reliable leading indicator of the direction of not only the global LEI itself but of global bond yields as well. At present, the relatively optimistic reading from the global LEI diffusion index is at odds with the sharp downward momentum in bond yields (see the middle panel of the Chart of the Week). NNT at work, or a sign of a bubble forming in government bond markets? Time will tell. To be sure, the shaken confidence of investors thanks to the intensifying U.S.-China trade dispute has likely weakened the link between growth and yields – at least temporarily. Investors need to see hard evidence that global growth is bottoming out before seriously reevaluating the current level of bond yields. Signs of improvement in Chinese growth momentum would go a long way to turning around depressed investor confidence. It is still a bit too soon, however, to expect a rebound in Chinese domestic demand given the long lags between leading indicators like the OECD measure (or the China credit impulse) and hard Chinese economic data (Chart 3). More likely, a change in trend for these series would not be visible until well into the 4th quarter of 2019, at the earliest. Chart 2A Ray Of Hope For Global Growth?
A Ray Of Hope For Global Growth?
A Ray Of Hope For Global Growth?
Chart 3Still A Bit Too Soon To Expect A China Turnaround
Still A Bit Too Soon To Expect A China Turnaround
Still A Bit Too Soon To Expect A China Turnaround
Signs of better growth in Europe – where negative bond yields are most prevalent, including in corporate bonds – would also help to reverse excessive investor pessimism. A turnaround there, however, also needs better growth in China, given the heavy exposure of European exporters to Chinese demand. So until we see signs of a pickup in Chinese growth momentum, the economic gloomsters, “Ice Agers” and NNT crowd are in charge of the global government bond market. Until we see signs of a pickup in Chinese growth momentum, the economic gloomsters, “Ice Agers” and NNT crowd are in charge of the global government bond market. Bottom Line: Time will tell if negative bond yields are indeed the “new normal”. We need to see negative yields sustained outside of a growth slowdown to prove that thesis. Have The Rallies In U.S. Treasuries & German Bunds Now Gone Too Far? Last week, we upgraded our overall global duration call to neutral on a tactical (0-3 month) basis.2 This was driven by the growing risk that the global central banks – most notably, the Federal Reserve – could be forced to become even more dovish because of the escalation in the U.S.-China trade war. Furthermore, our Global Duration Indicator has pulled back after the steady rise since late 2018, and is now in line with the aggregate level of 10-year bond yields in the major developed markets (Chart 4). This is consistent with a neutral tactical duration view. Chart 4The Signal From Our Duration Indicator Is Consistent With A Neutral Stance
The Signal From Our Duration Indicator Is Consistent With A Neutral Stance
The Signal From Our Duration Indicator Is Consistent With A Neutral Stance
There are signs, however, that Treasuries are overbought: Even as Treasury yields are heading closer to the 2016 lows, U.S. inflation expectations derived from the TIPS market are closer to 2% than the lows below 1.5% seen in 2016 (Chart 5). That market pricing seems reasonable, with realized inflation higher, and the labor market tighter, than was the case three years ago. The price momentum for the 10-year Treasury yield is approaching the extremes seen in the “post Fed QE” era (Chart 6), with the 6-month rate of change of the Bloomberg Barclays U.S. Treasury index approaching 10%. The deviation of the 10-year Treasury yield from its 200-day moving average, which is also at the post-QE extreme of -75bps, tells a similar story. Chart 5A Different U.S. Inflation Backdrop Vs. 2016
A Different U.S. Inflation Backdrop Vs. 2016
A Different U.S. Inflation Backdrop Vs. 2016
Chart 6The Fall In UST Yields Looks Stretched
The Fall In UST Yields Looks Stretched
The Fall In UST Yields Looks Stretched
Investor positioning has become VERY long, with the J.P. Morgan duration survey of Active Clients surging to the highest level in the two-decade history of the series (Chart 6, third panel). A similar story applies to the German bond market, where the entire yield curve out to 30-years is trading below 0% (raising a cheer from the NNTers): Market-based inflation expectations have collapsed, with the 5-year CPI swap, 5-years forward reaching a low of 1.2% – lower than 2016, despite a tighter overall euro area labor market, accelerating wage growth and core inflation remaining sticky around 1% (Chart 7). The 6-month total return of the German government bond index is reaching a post-European Debt Crisis extreme near 10%, while the 10-year Bund yield is trading around a similar extreme of 50bps below its 200-day moving average (Chart 8). Chart 7European Inflation: Expectations Worse Than Reality
European Inflation: Expectations Worse Than Reality
European Inflation: Expectations Worse Than Reality
Chart 8The Fall in Bund Yields Is Looking Stretched
The Fall in Bund Yields Is Looking Stretched
The Fall in Bund Yields Is Looking Stretched
While the near-term backdrop does not justify a tactically bearish view on Treasuries or Bunds, the stretched technical backdrop suggests that yields could snap back quite sharply on any sign of better global growth or an easing of U.S.-China trade tensions. While the near-term backdrop does not justify a tactically bearish view on Treasuries or Bunds, the stretched technical backdrop suggests that yields could snap back quite sharply on any sign of better global growth or an easing of U.S.-China trade tensions. Bottom Line: U.S. Treasuries and German Bunds both look overbought, amid extreme price/yield momentum and aggressively long duration positioning. Yet given the persistent headline risk from the U.S.-China trade dispute, and without durable signs of improving growth in China or Europe, it is too early to position for a reversal of the stretched yield moves. Maintain a neutral overall stance on global duration exposure. Robert Robis, CFA, Chief Fixed Income Strategist rrobis@bcaresearch.com Footnotes 1 Please see BCA Global Fixed Income Strategy Weekly Report, “Trade War Worries: Once More, With Feeling”, dated August 6, 2019, available at gfis.bcarsearch.com. 2 Please see BCA Global Fixed Income Strategy Weekly Report, “Trade War Worries: Once More, With Feeling”, dated August 6, 2019, available at gfis.bcarsearch.com. Recommendations The GFIS Recommended Portfolio Vs. The Custom Benchmark Index
A "New Negative" World For Bonds? Or Just The Latest Bubble?
A "New Negative" World For Bonds? Or Just The Latest Bubble?
Duration Regional Allocation Spread Product Tactical Trades Yields & Returns Global Bond Yields Historical Returns
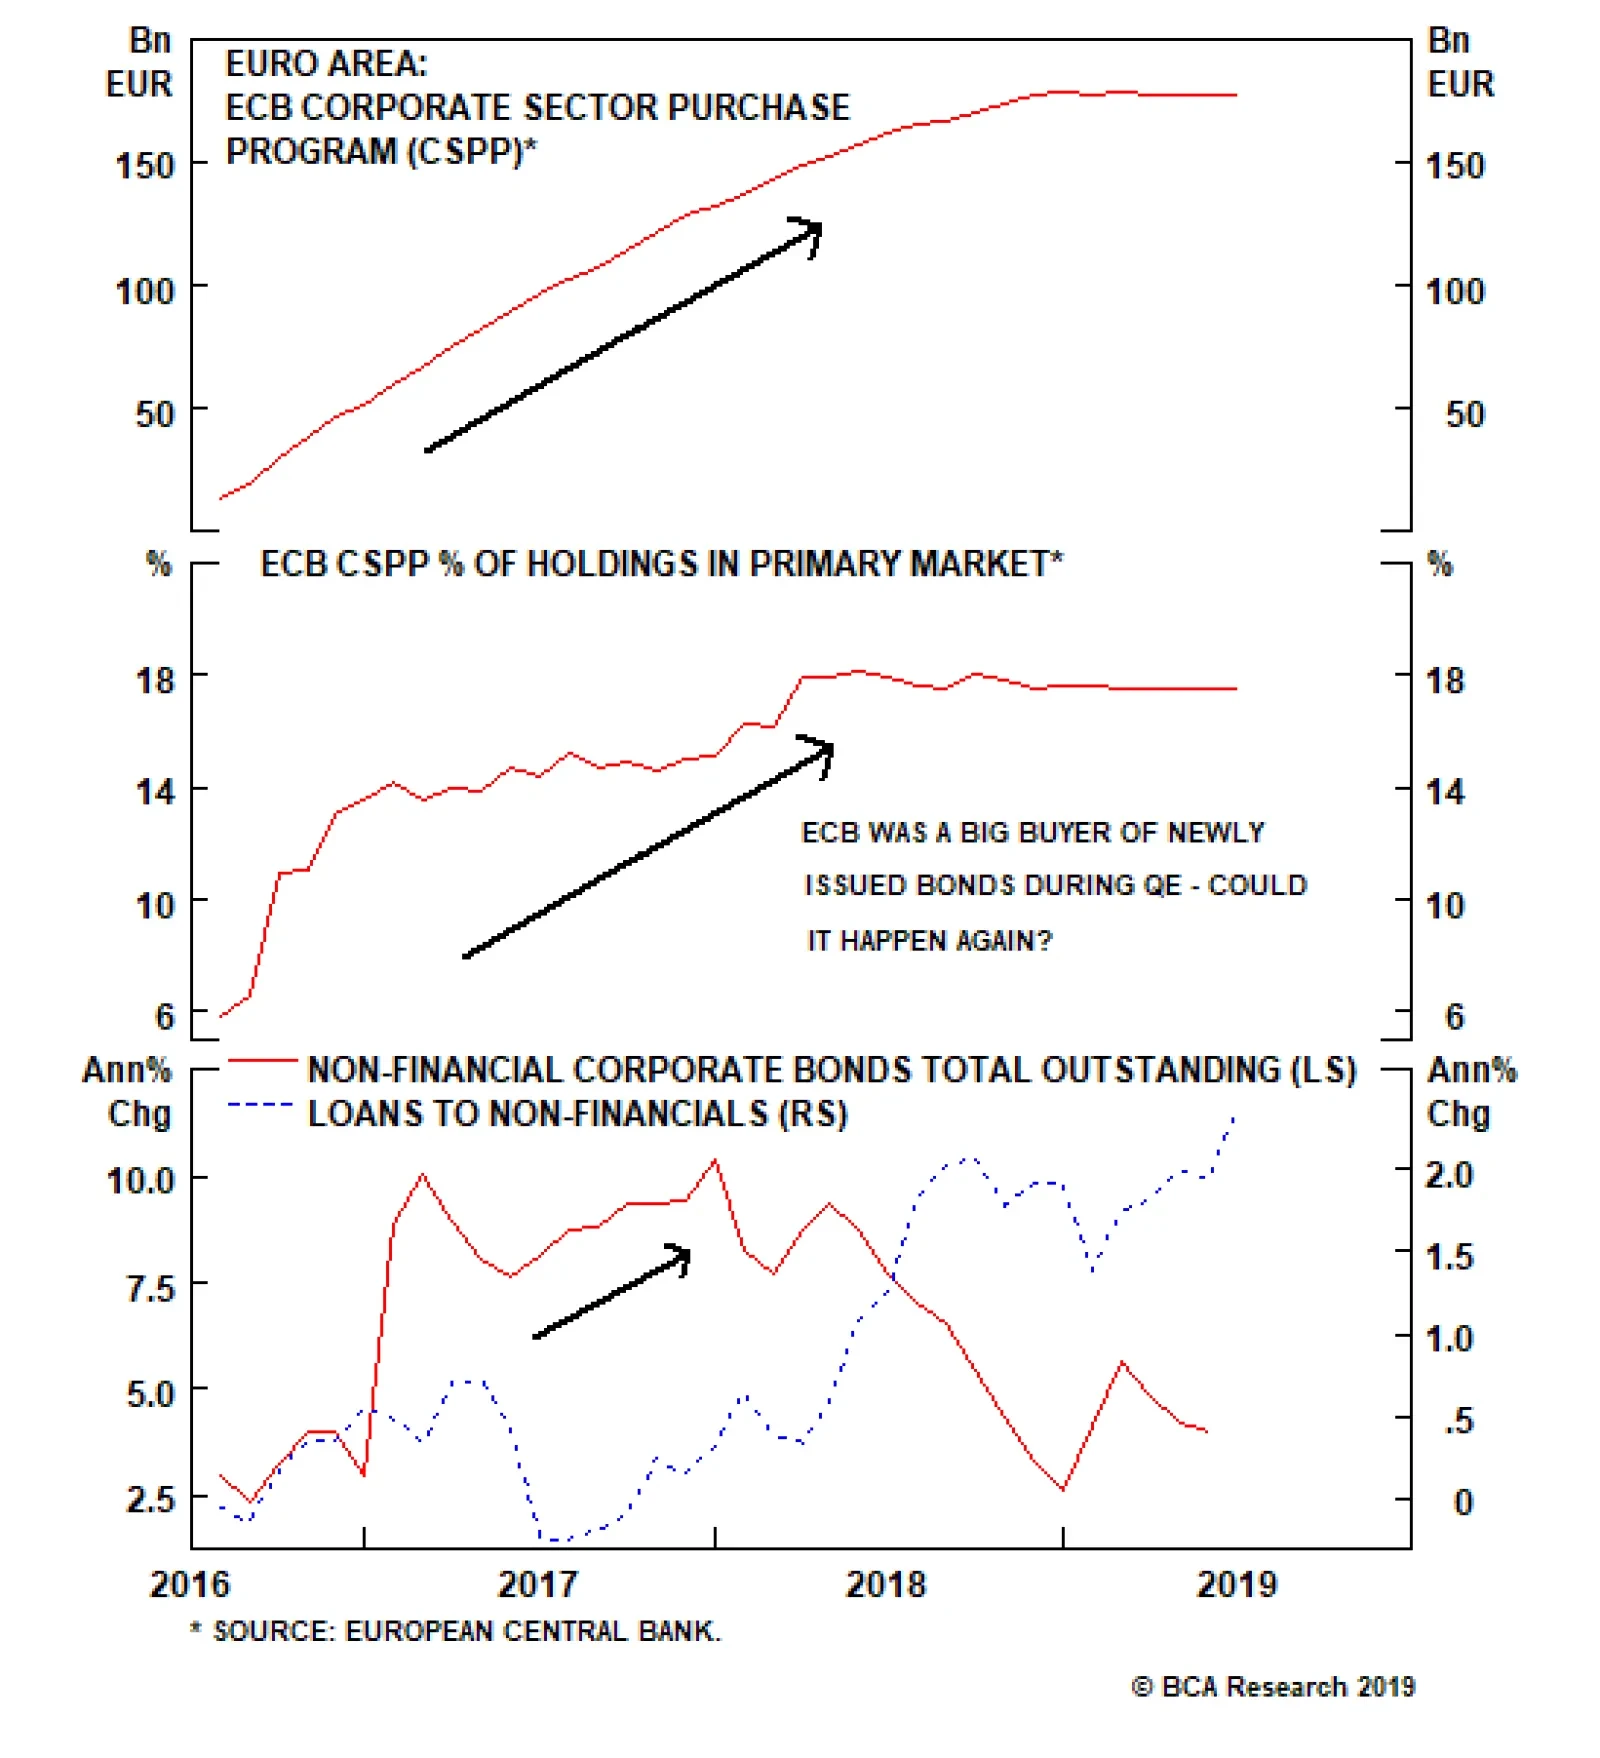
Given how loose monetary conditions already are, it makes sense for the ECB to restart the Asset Purchase Program (APP). This option is the most direct way for the ECB to directly lower the cost of borrowing for European companies where credit conditions…
Highlights Fed: The Fed will deliver a 25bp rate cut this week, despite a firmer tone to recent U.S. economic and inflation data, and the door will be left open to an additional “insurance” cut in September. ECB: The ECB will unveil a package of easing measures, from interest rate cuts to restarting asset purchases – including a healthy dose of corporate bond buying – in September. Fixed Income Strategy: The Fed is more likely to disappoint deeply dovish market expectations than the ECB over the next 6-12 months. European fixed income should outperform U.S. equivalents, both for government bonds and corporate debt, especially with the ECB ready to buy bonds again. Stay overweight Bunds vs Treasuries and euro area corporate debt vs U.S. equivalents on a USD-hedged basis. Feature Chart of the WeekData To Satisfy Both The Optimists & Pessimists
Data To Satisfy Both The Optimists & Pessimists
Data To Satisfy Both The Optimists & Pessimists
In normal years, the final days of July are a quiet time for financial markets, with investors focused on preparations for August vacations rather than fretting about the performance of their portfolios. This is not one of those years. Central banks are springing into action to combat a global manufacturing downturn, creating a peculiar divergence of market price signals - elevated stock prices and depressed bond yields. BCA exposed our own internal debate on the growth outlook, and the implications for financial markets, in a recent Special Report.1 Our latest discussions with clients show similar splits within investment committees. While Global Fixed Income Strategy is in the optimist camp at BCA, we do recognize that there is enough news and data at the moment to satisfy both bullish and bearish investors (Chart of the Week). The growth bears can point to the continued deceleration of global trade and manufacturing data, with our global PMI indicator now sitting below the 2015/16 lows. The bulls, on the other hand, can highlight the bottoming of forward-looking data like our global leading economic indicator or the pickup in Chinese credit growth. Most importantly, the bulls are having a very enjoyable summer with interest rate cuts expected from the Fed and ECB, and the latter likely to restart quantitative easing. In this Weekly Report, we focus on monetary policy – specifically, the outlook for the Fed and ECB’s next moves over the next few months – and the implications for financial markets. Our conclusion is that the likely policy choices will benefit the relative performance of European fixed income markets versus U.S. equivalents over a 6-12 month horizon. The ECB’s Next Move: See You In September Chart 2A "Manufacturing-Only" Slump
A "Manufacturing-Only" Slump
A "Manufacturing-Only" Slump
The global trade downturn has hit growth in the U.S. and Europe in a similar fashion, with PMI data showing substantially weaker activity in manufacturing compared to more domestically focused service industries (Chart 2). In Europe, there is an unprecedented divergence, with the services PMI rising and the manufacturing PMI plummeting over the past several months. At his press conference after last week’s monetary policy meeting, ECB President Mario Draghi described the European manufacturing data as “getting worse and worse”. He is right, as evidenced by the downtrends seen in other cyclical data like the ZEW and IFO surveys. European bond markets are betting that the ECB will focus on the manufacturing side of the export-heavy euro area economies and will soon ease monetary policy. Draghi gave strong indications that the ECB will deliver a package of easing measures at the September policy meeting, ranging from interest rate cuts to restarting the Asset Purchase Program (APP) for both government and corporate debt. Bond investors have been making large bets on the ECB delivering a big easing, with European bond yields plummeting to new cyclical lows. Investors remain highly skeptical that robust, inflationary growth – and higher interest rates – will ever return to Europe. The surge in the amount of debt trading at negative yields has gotten the attention of the market. By our count, 53% of all government bonds in the developed economies are now trading with a negative yield, with much of those in Europe (Chart 3). Investors are reaching for anything with a positive yield, including formerly toxic debt like Italian and Greek government bonds, with the benchmark 10-year yields in those markets now down to 1.6% and 2.1%, respectively. The rally has extended into spread product, creating oddities such as shorter-maturity EUR-denominated emerging market bonds – some with credit ratings below investment grade – trading at negative yields.2 From a longer-term perspective, the European bond rally continues a trend seen over the past decade where the relative performance of European equities versus government bonds, a.k.a. the stock-to-bond ratio, has been anemic compared to the similar metric in the U.S. (Chart 4). Investors remain highly skeptical that robust, inflationary growth – and higher interest rates – will ever return to Europe. Chart 3Positive Yields Are Getting Harder To Find
Positive Yields Are Getting Harder To Find
Positive Yields Are Getting Harder To Find
Chart 4Structural Market Pessimism On Europe
Structural Market Pessimism On Europe
Structural Market Pessimism On Europe
From a cyclical perspective, the case for a comprehensive easing package from the ECB now is a strong one, for several reasons: There is a broad-based slowing of growth and inflation within the euro area. Our diffusion indices of individual country data for real GDP growth and the OECD’s leading economic indicators show that the overwhelming majority of euro area nations are seeing slowing growth (Chart 5). Similar readings coincided with multiple interest rate cuts in 2001, 2008/09 and 2012. Chart 5Good Reasons For An ECB Rate Cut
Good Reasons For An ECB Rate Cut
Good Reasons For An ECB Rate Cut
Chart 6Can The ECB Stop A Credit Crunch In Italy?
Can The ECB Stop A Credit Crunch In Italy?
Can The ECB Stop A Credit Crunch In Italy?
Realized inflation and inflation expectations remain muted. Our diffusion indices for inflation rates among euro area countries are more mixed, with almost all nations actually seeing a slight uptick in core inflation over the past three months (bottom panel). Yet given the plunge in market-based inflation expectations, with the 5-year/5-year forward EUR CPI swap rate now down to 1.35%, the ECB must focus on trying to put a floor under growth to stabilize inflation expectations. Banks are starting to tighten lending standards. The ECB’s latest Bank Lending Survey showed a sharp tightening of lending standards to businesses during Q2/2019 (Chart 6) in France and, more worryingly, Italy where loan growth has been contracting on a year-over-year basis. The ECB already took action back in March to introduce a new targeted bank funding program (TLTRO3), largely to prevent a possible credit crunch in Italy where cheap ECB loans have funded 10% of total Italian bank lending. Yet with Italian banks already tightening lending standards to domestic borrowers, the ECB must take other actions to fight off a deeper contraction in Italian corporate loans. So what can the ECB plausibly do to ease monetary conditions that are already very loose? Cut the deposit rate. Given the ECB’s large balance sheet, swollen by asset purchases, the deposit rate on the excess reserves of banks is now effectively the ECB’s main policy rate. The deposit rate is currently -0.40%, and the ECB is concerned about the impact on European bank profitability by pushing that rate even deeper into negative territory. Draghi noted in his press conference last week that the ECB would consider “tiering” interest rates on excess deposits – essentially, exempting portions of European banks’ excess reserves from being charged negative deposit rates – to help offset the hit to bank profits from negative rates. Chart 7The ECB Can Help Finance European Companies
The ECB Can Help Finance European Companies
The ECB Can Help Finance European Companies
Tiering has been introduced in other countries with negative deposit rates (Japan, Switzerland, Denmark), with limited impacts on bank profitability. The experience of those countries, however, suggests that an introduction of tiering by the ECB could put a floor under interest rate expectations, as it would indicate that additional rate cuts would be too damaging for European bank profitability to be considered by the ECB. For that reason, the ECB could decide to cut rates in September, but without tiering to ensure the maximum effect on European interest rates and bond yields. Restart the Asset Purchase Program (APP). This option is the most intriguing, as it would be a more direct way for the ECB to directly lower the cost of borrowing for European companies where credit conditions are becoming tighter. During the corporate bond buying phase of the APP in 2016-2018, the ECB was not only buying bonds in the secondary market but was buying corporates in the primary (new issue) market. At the peak, the central bank was buying around 18% of all the primary issuance by euro area companies eligible for the APP (Chart 7). This allowed many smaller European companies that relied entirely on bank loans to begin issuing publicly traded corporate bonds to diversify their sources of funding, with the ECB as a guaranteed buyer – in some cases, at interest rates even lower than corporate bank lending rates. With the ECB having fewer constraints on its corporate bond buying (i.e. no Capital Key as in the case of government bond purchases), the big policy surprise in September could be a bigger focus on corporates over sovereigns in the restarted APP. That would be good news for euro area corporate bond performance. Chart 8Markets Discounting New ECB Corporate Bond Purchases?
Markets Discounting New ECB Corporate Bond Purchases?
Markets Discounting New ECB Corporate Bond Purchases?
Investors seem to have already priced in some expectation of a resumption of the ECB’s corporate bond buying program, as euro area credit spreads have tightened sharply despite weakening economic growth (Chart 8). The spread tightening has occurred across all countries and investment grade credit tiers, pushing valuations back to towards the levels seen during the height of the ECB’s last period of corporate bond buying in 2017. The ECB will likely have to start out fairly aggressively with its pace of corporate bond buying, likely with more than €10bn/month, to justify current valuations. With the ECB having fewer constraints on its corporate bond buying (i.e. no Capital Key as in the case of government bond purchases), the big policy surprise in September could be a bigger focus on corporates over sovereigns in the restarted APP. That would be good news for euro area corporate bond performance. Bottom Line: The ECB will unveil a package of easing measures, from interest rate cuts to restarting asset purchases – including a healthy dose of corporate bond buying – in September. The Fed’s Next Moves: Insurance Cuts In July & September, No More After That The latest batch of data from the U.S. suggests that tomorrow’s widely-expected Fed rate cut will not be the start of a full-blown easing cycle. Expect a 25bp cut, with forward guidance suggesting another 25bps in September to protect against the adverse effects on the U.S. from any additional trade policy uncertainty and the associated deterioration of non-U.S. economic growth. Any further easing beyond that is unnecessary given the current state of U.S. growth and inflation. While the year-over-year growth rates of real GDP and core durable goods orders have slowed, the annualized changes over the past six months have shown some reacceleration (Chart 9). Consumer spending has also perked up after the sharp drop fueled by the government shutdown back in January, while the lagged impact of the sharp fall in mortgage rates over the past year should provide a moderate boost to housing activity. A similar dynamic is seen on the inflation front, where the marginal 6-month annualized rate of change of core PCE inflation has picked up to 2% (Chart 10). Less volatile inflation gauges like the Dallas Fed’s trimmed mean core PCE inflation rate are also at 2%. Furthermore, one of the main causes of the unexpected downturn in core PCE inflation in 2018, the Financial Services component, is already rebounding – a trend that will continue given the U.S. equity market’s strong gains in 2019 (bottom panel). Chart 9U.S. Growth Rebounding
U.S. Growth Rebounding
U.S. Growth Rebounding
Chart 10U.S Inflation Rebounding
U.S Inflation Rebounding
U.S Inflation Rebounding
Look for the Fed to signal a cautious tone tomorrow, but without sounding overly pessimistic on U.S. growth prospects. Bottom Line: The Fed will deliver a 25bp rate cut this week, despite a firmer tone to recent U.S. economic and inflation data, and the door will be left open to an additional cut in September. Additional moves after that are unlikely, given signs of reaccelerating momentum in U.S. economic growth and inflation. Investment Implications For The U.S. Versus Europe Over The Next 6-12 Months Looking ahead over the rest of 2019, relative economic performance should continue to favor the U.S. over Europe, creating a backdrop where relative monetary policies will support euro area fixed income returns versus U.S. equivalents. Looking ahead over the rest of 2019, relative economic performance should continue to favor the U.S. over Europe, creating a backdrop where relative monetary policies will support euro area fixed income returns versus U.S. equivalents. Chart 11Too Soon To See An Export-Led Rebound In Europe
Too Soon To See An Export-Led Rebound In Europe
Too Soon To See An Export-Led Rebound In Europe
The European economic downturn seen over the past year has come almost entirely from the trade side, when looking at the contributions to real GDP growth from net exports and domestic demand (Chart 11). This is also consistent with the manufacturing/services gap discussed earlier in this report, given the large share of manufactured goods in overall euro area exports. China will play a huge role in determining the future path of European economic growth through the trade channel, and already the pickup in Chinese credit growth is heralding a future rebound in European exports to China (third panel). A recovery in euro area exports to other countries besides China is also in store, based on our global leading economic indicator diffusion index (i.e. the net number of countries seeing a rising leading indicator). Yet given the long lead time before changes in those leading European export indicators and the subsequent growth of European exports – between 9-12 months – an improvement in euro area exports will not be visible in the hard data until late in 2019. It will likely be even longer than that given the additional publishing lags of the export data. Importantly, while the recent headlines have provided grounds for more cautious optimism on U.S.-China trade talks, any breakdown on that front would potentially delay any recovery in euro area exports (even if that is met by a bigger policy stimulus from China). At the moment, the U.S. economy is better positioned to withstand a renewed bout of trade uncertainty than the euro area, even though U.S. growth would take a hit through higher market volatility and tighter financial conditions if investors turn more risk averse on another failure of U.S.-China trade talks. Chart 12Not Much Downside Left For Bond Yields
Not Much Downside Left For Bond Yields
Not Much Downside Left For Bond Yields
So after looking at the relative outlooks for economic growth in the U.S. and Europe, and the likely paths to be taken by the Fed and ECB, we come up with the following fixed income investment recommendations: Maintain below-benchmark overall global duration exposure: At an overall portfolio level, we continue to recommend a moderate below-benchmark global duration stance (Chart 12). Our global leading economic indicator diffusion index suggests that global real yields should soon bottom. At the same time, the annual rate of change of oil prices will accelerate over the rest of the year simply based on comparisons versus the sharp plunge in energy prices in the latter months of 2018. If the bullish oil forecast of BCA’s commodity strategists comes to fruition, the growth rate of oil prices will be even higher (see the “X” in the middle panel of Chart 12). Given the correlations between market-based inflation expectations and oil prices, a rebound in oil on a rate of change basis should put a floor under the inflation expectations component of government bond yields in the developed markets. Expect a rebound in the Treasury/Bund spread: The ECB is more likely to deliver on the policy expectations for the next twelve months discounted in Overnight Index Swap curves (-22bps of rate cuts) compared to the Fed (-89bps of rate cuts). This suggests that the spread between 10-year U.S. Treasury yields and 10-year German Bund yields is likely to widen, but coming first through higher relative market-based U.S. inflation expectations - a trend that is already starting to unfold (Chart 13). ECB rate cuts, and the return of the ECB as a buyer of euro area non-financial corporate debt, will provide an obvious boost to the relative performance of euro area corporate debt (both investment grade and high-yield) over U.S. equivalents. Favor euro area corporates versus U.S. corporates: ECB rate cuts, and the return of the ECB as a buyer of euro area non-financial corporate debt, will provide an obvious boost to the relative performance of euro area corporate debt (both investment grade and high-yield) over U.S. equivalents. Another factor supporting European corporates is the better state of financial health among euro area companies, according to our Corporate Health Monitors (Chart 14). Chart 13Inflation Expectations Bottoming Out, Led By The U.S.
Inflation Expectations Bottoming Out, Led By The U.S.
Inflation Expectations Bottoming Out, Led By The U.S.
The gap between the “bottom-up” versions of the Monitors tracks the spread differentials of the benchmark corporate bond indices quite closely, and is currently pointing to a more solid fundamental underpinning for euro area corporates on a cyclical (6-12 months) horizon. Chart 14Favor Euro Area Corporates Over U.S. Corporates
Favor Euro Area Corporates Over U.S. Corporates
Favor Euro Area Corporates Over U.S. Corporates
Robert Robis, CFA, Chief Fixed Income Strategist rrobis@bcaresearch.com Footnotes 1 Please see BCA Special Report, “What Goes On Between Those Walls? BCA’s Diverging Views In The Open”, dated July 19, 2019, available at bca.bcaresearch.com and gfis.bcaresearch.com. 2https://www.bloomberg.com/news/articles/2019-07-15/em-succumbs-to-sub-zero-epidemic-as-debt-pile-doubles-in-a-weekD The GFIS Recommended Portfolio Vs. The Custom Benchmark Index
A Cure For The Summertime Blues
A Cure For The Summertime Blues
Recommendations Duration Regional Allocation Spread Product Tactical Trades Yields & Returns Global Bond Yields Historical Returns