Euro Area

Highlights The trade war escalation is just the catalyst and not the cause of the market correction. This year’s absolute double-digit returns have most likely already been made during the early-2019 star alignment of near-perfect conditions for investors. The remainder of the year is likely to be a much tougher going for all the major asset-classes. Short a 30:60:10 portfolio of equities, bonds, and oil, setting the profit target and stop-loss at 3 percent. In the second half of the year, the big story will be sector rotation. Healthcare is likely to flip from underperformer to outperformer versus technology. Given their sector skews, it follows that European equities are likely to outperform Chinese equities. Feature A star alignment of near-perfect conditions lifted the entire financial market complex in the early part of the year. For investors, pretty much everything that could go right did go right! (Chart of the Week). Chart of the WeekIn Near-Perfect Conditions, European Equities Performed Very Well... But Chinese Equities Performed Even Better
In Near-Perfect Conditions, European Equities Performed Very Well... But Chinese Equities Performed Even Better
In Near-Perfect Conditions, European Equities Performed Very Well... But Chinese Equities Performed Even Better
The Federal Reserve stopped hiking interest rates; the ECB and other major central banks also pivoted to dovish; Brexit was delayed; the Italy versus Brussels spat over fiscal policy de-escalated; the drag from new emissions standards on German auto production eased; the trade war threat seemed to recede; and crucially, economic activity accelerated sharply (more about this later). A Rare Star Alignment… Which Cannot Last There was another rare star alignment: equities, bonds, and crude oil generated simultaneous strong rallies (Chart I-2). Such a star alignment is almost unheard of, because there are no set of economic circumstances that should benefit all three asset-classes at the same time. For example, if the oil price surge is inflationary – or at least less deflationary – then it should hurt bonds; if the surge is deflationary on real demand, then it should hurt equities. Equities, bonds, and oil should not surge together. Equities, bonds, and oil should not surge together, and on the extremely rare occasions they do, the simultaneous rally soon breaks down. Consider a €100 investment portfolio consisting of €30 equities, €60 long-dated bonds, and €10 crude oil. At the start of this year, the portfolio returned 10 percent in just three months. This is extremely rare, and has happened on only two other occasions in the past 25 years, in 2009 and 2016 (Chart I-3). Chart I-2A Rare Star Alignment:##br## Equities, Bonds, And Oil Surged ##br##Simultaneously
A Rare Star Alignment: Equities, Bonds, And Oil Surged Simultaneously
A Rare Star Alignment: Equities, Bonds, And Oil Surged Simultaneously
Chart I-3A Rare Star Alignment: A 30:60:10 Portfolio of Equities: Bonds: Oil Gained 10 Percent In 3 Months
A Rare Star Alignment: A 30:60:10 Portfolio of Equities: Bonds: Oil Gained 10 Percent In 3 Months
A Rare Star Alignment: A 30:60:10 Portfolio of Equities: Bonds: Oil Gained 10 Percent In 3 Months
On both previous occasions, the simultaneous rally broke down, and the portfolio went on to lose a large chunk of its 10 percent gain. Hence, at our quarterly webcast last week, we initiated a new investment recommendation: to short a 30:60:10 portfolio of equities, bonds, and oil, setting the profit target and stop-loss at 3 percent.1 When conditions are perfect, they are vulnerable to the tiniest setback. But the vulnerability emanates from the fragility of the perfect conditions, and not the precise setback. As an analogy, visualize a tree bedecked in its beautiful foliage in the autumn, and imagine you gently shake the tree. The gentlest of shakes will make the leaves collapse. At first glance, your shake caused the collapse, but in truth, your shake was just the catalyst; the underlying cause was the fragility of the autumnal foliage. Another catalyst, say a puff of wind, could have equally triggered the same collapse. When conditions are perfect, they are vulnerable to the tiniest setback. The re-escalation of the trade war has dominated the recent column inches and investment analyst missives. But just like the gentle shake of the tree, it is just a catalyst for the market correction. The underlying cause was that the simultaneous and strong rallies in all financial assets, based on a star alignment of near-perfect conditions, was vulnerable to the first blemish to the perfection. And the blemish could have been anything. Economic Activity Has Undoubtedly Accelerated… One of the things that drove up equity markets was the acceleration in economic activity. This acceleration is beyond doubt: euro area GDP prints show that growth picked up to 1.6 percent in the first quarter of 2019 from a low of 0.6 percent in the third quarter of 2018 (Chart I-4). Given the openness of the euro area economy, it is inconceivable that this growth pick-up does not reflect a more generalized acceleration in global activity.2 Chart I-4Euro Area GDP Growth Accelerated To 1.6 Percent
Euro Area GDP Growth Accelerated To 1.6 Percent
Euro Area GDP Growth Accelerated To 1.6 Percent
The trouble is that we do not receive these GDP prints in real-time. From the mid-point of the quarter to which the GDP prints refer to their release date around one month after the quarter end, there is a two and a half month delay. To proxy activity in real-time, we must look at current activity indicators (CAIs) which gauge GDP growth, but are available without much of a delay. While several such indicators exist, we have found that the ZEW economic sentiment indicator (not to be confused with the current situation indicator) does the job extremely well in real-time. Current activity indicators do not help equity investors. Having said that, current activity indicators do not help equity investors. The simple reason is that the equity market is a current activity indicator itself, and it would be absurd to expect one CAI to predict another CAI! In fact, the best current activity indicator is not the equity market taken as a whole. This is because the aggregate equity market can move as a result of drivers other than current economic activity, most notably central bank policy. Therefore, it turns out that the very best current activity indicator is found within the equity market: specifically, the performance of economically sensitive equity sectors – such as industrials and financials – relative to the aggregate market (Chart I-5 and Chart I-6). Both this and the ZEW economic sentiment indicator confirm that economic activity has accelerated sharply since late last year, but has suffered a slight setback in the last month. Chart I-5The Best Current Activity Indicator Is The Relative Performance Of Economically Sensitive Equity Sectors
The Best Current Activity Indicator Is The Relative Performance Of Economically Sensitive Equity Sectors
The Best Current Activity Indicator Is The Relative Performance Of Economically Sensitive Equity Sectors
Chart I-6The Best Current Activity Indicator Is The Relative Performance Of Economically Sensitive Equity Sectors
The Best Current Activity Indicator Is The Relative Performance Of Economically Sensitive Equity Sectors
The Best Current Activity Indicator Is The Relative Performance Of Economically Sensitive Equity Sectors
…But Can The Acceleration In Economic Activity Continue? To be crystal clear, let’s repeat the crucial point. Economically sensitive investments do not move on the level of GDP growth; economically sensitive investments move on the real-time change in GDP growth. The simple reason is that profits growth is highly leveraged to economic growth. Hence when GDP growth picks up, the embedded ‘g’ used to calculate the present value of the investment rises very sharply, which means that today’s price also rises very sharply; and vice versa when GDP growth declines. But once GDP growth stabilizes, even at a high level, there is no further meaningful change in ‘g’, or in the price. For any remaining sceptics, Chart I-7 shows that for many years, the big moves in the Euro Stoxx 50 have resulted from the changes in euro area GDP growth. Chart I-7The Euro Stoxx 50 Moves On Changes In GDP Growth
The Euro Stoxx 50 Moves On Changes In GDP Growth
The Euro Stoxx 50 Moves On Changes In GDP Growth
It follows that what investors really need is not a current activity indicator, but a future activity indicator (FAI). If investors could reliably predict the change in economic activity, then they could also reliably allocate between economically sensitive and defensive investments, as well as to the equity market as a whole. We have found that a future activity indicator for Europe would contain three components: The domestic 6-month credit impulse. The international 6-month credit impulse, and specifically the 6-month credit impulse in China given the large volume of European exports that head to the largest emerging economy. The crude oil price 6-month impulse, where a price decline constitutes a positive impulse given Europe’s dependence on energy imports. Chart I-8The Drivers Of Europe's Future Activity Indicator Are Losing Momentum
The Drivers Of Europe's Future Activity Indicator Are Losing Momentum
The Drivers Of Europe's Future Activity Indicator Are Losing Momentum
Today, we find that the 6-month credit impulse both in the euro area and in China have lost momentum; meanwhile, given the rebound in the oil price, the crude oil price 6-month impulse has clearly faded (Chart I-8). Hence, our future activity indicator suggests that in the second half of this year, euro area GDP growth is unlikely to accelerate much from the current 1.5-2 percent clip. For investors, this means that this year’s absolute double-digit returns have most likely already been made during the early-2019 star alignment of near-perfect conditions. And the remainder of the year is likely to be much tougher going for all the major asset-classes. Still, there are always double-digit returns to be found somewhere in the investment landscape. In the second half of the year, the big story will be sector rotation. For example, in recent reports, we highlighted that healthcare is likely to flip from underperformer to outperformer versus technology. Given their sector skews, it follows that European equities are likely to outperform Chinese equities. Fractal Trading System* This week’s recommended trade is based on an oddity. While the majority of stock markets have suffered corrections, New Zealand’s NZX 50 has escaped relatively unscathed so far, making it vulnerable to a corrective underperformance one way or another. Hence, short the NZX 50 versus the FTSE100, and set the profit target and stop-loss at 2 percent. In other trades, short China versus Japan quickly achieved its profit target. Long Nikkei 225 versus Hang Seng was also closed in profit at the end of the 65 day maximum holding period. Against these two profitable trades, long SEK/NOK was closed at its stop-loss. This leaves the Fractal Trading System with four open positions. For any investment, excessive trend following and groupthink can reach a natural point of instability, at which point the established trend is highly likely to break down with or without an external catalyst. An early warning sign is the investment’s fractal dimension approaching its natural lower bound. Encouragingly, this trigger has consistently identified countertrend moves of various magnitudes across all asset classes. Chart I-9
NZX 50 VS. FTSE100
NZX 50 VS. FTSE100
The post-June 9, 2016 fractal trading model rules are: When the fractal dimension approaches the lower limit after an investment has been in an established trend it is a potential trigger for a liquidity-triggered trend reversal. Therefore, open a countertrend position. The profit target is a one-third reversal of the preceding 13-week move. Apply a symmetrical stop-loss. Close the position at the profit target or stop-loss. Otherwise close the position after 13 weeks. Use the position size multiple to control risk. The position size will be smaller for more risky positions. * For more details please see the European Investment Strategy Special Report “Fractals, Liquidity & A Trading Model,” dated December 11, 2014, available at eis.bcaresearch.com. Dhaval Joshi, Chief European Investment Strategist dhaval@bcaresearch.com Footnotes 1 The precise mix of the portfolio is 29% MSCI World $, 29% German 30-year bund, 29% U.S. 30-year T-bond, 13% WTI. Please see a replay of the webcast ‘From Sweet Spot to Weak Spot’ available at eis.bcaresearch.com. 2 Quarter-on-quarter real GDP growth at annualized rates. Fractal Trading System Recommendations Asset Allocation Equity Regional and Country Allocation Equity Sector Allocation Bond and Interest Rate Allocation Currency and Other Allocation Closed Fractal Trades Trades Closed Trades Asset Performance Currency & Bond Equity Sector Country Equity Indicators Bond Yields Chart II-1Indicators To Watch - Bond Yields
Indicators To Watch - Bond Yields
Indicators To Watch - Bond Yields
Chart II-2Indicators To Watch - Bond Yields
Indicators To Watch - Bond Yields
Indicators To Watch - Bond Yields
Chart II-3Indicators To Watch - Bond Yields
Indicators To Watch - Bond Yields
Indicators To Watch - Bond Yields
Chart II-4Indicators To Watch - Bond Yields
Indicators To Watch - Bond Yields
Indicators To Watch - Bond Yields
Interest Rate Chart II-5Indicators To Watch - Interest Rate Expectations
Indicators To Watch - Interest Rate Expectations
Indicators To Watch - Interest Rate Expectations
Chart II-6Indicators To Watch - Interest Rate Expectations
Indicators To Watch - Interest Rate Expectations
Indicators To Watch - Interest Rate Expectations
Chart II-7Indicators To Watch - Interest Rate Expectations
Indicators To Watch - Interest Rate Expectations
Indicators To Watch - Interest Rate Expectations
Chart II-8Indicators To Watch - Interest Rate Expectations
Indicators To Watch - Interest Rate Expectations
Indicators To Watch - Interest Rate Expectations
Highlights U.S. Bond Strategy: U.S. Treasury yields are already priced for rate cuts and lower inflation, even as U.S. (and global) growth indicators are improving and U.S. realized inflation has ticked up. Maintain a below-benchmark stance on U.S. duration, even in the face of the current U.S.-China trade tensions. Stay overweight U.S. corporates versus Treasuries as well, with global growth indicators improving and U.S. monetary policy not yet restrictive. European Bond Strategy: Government bond yields in core Europe are too low relative to tentative signs that growth has bottomed out. At the same time, tight euro area corporate bond spreads already discount better economic momentum. Stay below-benchmark on euro area duration exposure, but maintain only a neutral weighting on euro area corporate bonds. Feature Monetary & Fiscal Policy Is More Important Than Trade Policy Chart 1Government Bonds Are Overvalued
Government Bonds Are Overvalued
Government Bonds Are Overvalued
The old market bugaboo from 2018, “global trade uncertainty”, returned last week after the U.S. and China failed to reach a trade deal by last Friday’s deadline. The Trump Administration followed through on its threat to raise the tariff rate on $200 billion of Chinese exports to the U.S. from 10% to 25%, effective immediately. China retaliated by announcing fresh tariffs on $60 billion of U.S. exports to China, effective June 1st. Global equities have responded negatively, with the S&P 500 down -5% since President Trump first Tweeted his threat to increase tariffs on May 5. Global bond yields have declined in a standard risk-off move. The 10-year U.S. Treasury yield dropped -13bps over the past week - despite higher-than-expected April CPI and PPI inflation releases – and now sits at 2.40%. Meanwhile, the 10-year German Bund has dipped back into negative territory despite recent data releases showing an unexpected pickup in German industrial activity in March, and a sharp increase in Euro Area core inflation in April. Despite the greater uncertainty, we do not see a case for making any changes to our recommended pro-growth medium-term fixed income recommendations on duration (below-benchmark) or asset allocation (overweight corporates versus government debt). The BCA Global Fixed Income Strategy Duration Indicator continues to climb, indicating cyclical pressures for higher global bond yields (Chart 1). Yet at the same time, the deeply negative term premium component of yields in the U.S. and Europe (and most other developed markets) suggests that there is a lot of pessimism on growth and inflation (and a big safe-haven bid from investors) embedded in the current level of yields. Despite the greater uncertainty, we do not see a case for making any changes to our recommended pro-growth medium-term fixed income recommendations on duration (below-benchmark) or asset allocation (overweight corporates versus government debt). Our colleagues at BCA Geopolitical Strategy now believe that the odds of a trade agreement being reached this year are a 50/50 coin flip. If the talks do break down completely, however, China’s policymakers will almost certainly ramp up additional stimulus measures to offset the hit to growth from the U.S. tariffs. As a reminder, China’s exports to the U.S. only account for around 3.5% of China’s GDP (Chart 2), so U.S. tariffs matter far less than domestic stimulus via fiscal and monetary easing. Thus, any additional stimulus will help sustain the current blossoming rebound in global growth, which has been fueled in part by improved economic sentiment and a pickup in Chinese credit growth (Chart 3). In addition, Chinese import demand has ticked higher, our global leading economic indicator (LEI) is bottoming out, the ZEW surveys of economic sentiment are climbing higher and even the OECD LEI for China is starting to perk up. Chart 2China-U.S. Trade Is A Small Part Of The Two Economies
China-U.S. Trade Is A Small Part Of The Two Economies
China-U.S. Trade Is A Small Part Of The Two Economies
Dovish central banks will also help limit the damage from increased trade uncertainty. In particular, the Fed will not rock the boat and stay “patient” by keeping rates on hold for longer. Chart 3A Consistent Message On A Global Growth Recovery
A Consistent Message On A Global Growth Recovery
A Consistent Message On A Global Growth Recovery
Although given the inflationary implications of higher tariffs and the FOMC’s belief that the recent dip in core PCE inflation was “transitory”, the current market pricing for Fed easing appears too optimistic. Dovish central banks will also help limit the damage from increased trade uncertainty. We did get our first post-tariff read on the Fed’s thinking last Friday, and it did not sound like rate cuts were on the way. Atlanta Fed president Raphael Bostic noted that the most recent CPI and PPI inflation readings suggest that “price pressures are a little hotter” and that the U.S. is “almost to the cusp where we are going to see prices move”.1 He also noted that U.S. businesses are far more likely to pass on a higher 25% tariff on Chinese imports to consumer prices, where previously they had been more willing to absorb the higher cost of the smaller 10% tariff. Of course, an even bigger near-term selloff in global equity and credit markets is possible, if the current impasse between D.C. and Beijing persists without any indication of fresh negotiations. BCA Global Investment Strategy has recommended a tactical hedge to the overall overweight allocation to global equities in our House View matrix by shorting the S&P 500 index.2 However, we do not see the need to make any similar recommendations on the U.S. fixed income side – both the below-benchmark duration stance and the overweight corporate credit tilt - for the following reasons (Chart 4): Our Fed Monitor continues to signal that no rate cuts are required in the U.S., while -31bps of cuts over the next year are already discounted in the U.S. Overnight Index Swap curve. U.S. financial conditions have only tightened modestly on last week’s moves – after the substantial easing seen year-to-date – and still point to above-trend GDP growth over the rest of 2019. U.S. inflation expectations have dipped back to recent lows, even as realized inflation has hooked up; TIPS breakevens are now 40-50bps below levels consistent with the Fed hitting its 2% PCE inflation target. The Treasury market is now very overbought from a momentum perspective, while duration positioning is now very long according to the JPMorgan Client Survey. The reaction of U.S. corporate credit spreads to the trade headlines has been relatively muted to date (Chart 5), less than what was seen last December when the market feared a hawkish Fed policy mistake – over the medium-term, monetary policy matters more than trade policy for credit markets. Chart 4Stay Below-Benchmark U.S. Duration
Stay Below-Benchmark U.S. Duration
Stay Below-Benchmark U.S. Duration
Chart 5A Modest Reaction (So Far) To The Tariffs
A Modest Reaction (So Far) To The Tariffs
A Modest Reaction (So Far) To The Tariffs
In other words, U.S. Treasury yields now discount a lot of bad news and, thus, have limited downside even in the event of a further breakdown of U.S.-China trade talks. On the other hand, any positive news on fresh U.S.-China negotiations could send both equities and bond yields substantially higher and tighten credit spreads. On a risk/reward basis, a below-benchmark U.S. duration stance and overweight tilt on U.S. corporates are still warranted, even with the more elevated uncertainty on U.S.-China trade. Bottom Line: U.S. bond yields are already priced for rate cuts and lower inflation, even as U.S. (and global) growth indicators are improving and U.S. realized inflation has ticked up. Maintain a below-benchmark stance on U.S. duration, even in the face of the current U.S.-China trade tensions. Stay overweight U.S. corporates versus Treasuries as well, with global growth indicators improving and U.S. monetary policy not yet restrictive. European Bond Markets – Too Much Bad News In Yields, Too Much Good News In Credit Spreads With markets now focused on the U.S.-China trade squabble, the European economic situation is garnering few headlines. Investors may be missing out on a good story, with euro area data now more frequently surprising to the upside (Chart 6). The ZEW measures of economic sentiment have been picking up in the past few months, most notably in Germany and France, even with current conditions still perceived to be soft. Improved sentiment is where economic upturns begin, however, and it looks like better days lie ahead for European growth. Investors may be missing out on a good story, with euro area data now more frequently surprising to the upside. The 2018 downturn in euro area GDP growth was a result of a sharp downturn in exports that fed into large pullbacks in industrial production. The most recent data, however, shows that exports have started growing again, and production growth is stabilizing (Chart 7). Credit growth has also hooked up in Germany and France, while the credit contraction in Italy and Spain is bottoming out. Chart 6Upside Growth Surprises In Europe?
Upside Growth Surprises In Europe?
Upside Growth Surprises In Europe?
Chart 7Starting To Reverse The 2018 Downturn
Starting To Reverse The 2018 Downturn
Starting To Reverse The 2018 Downturn
The improvement in global leading indicators, such as the China credit impulse and our global LEI diffusion index, points to a rebound in euro area export growth over the latter half of the year (Chart 8). The escalation in the U.S.-China trade dispute is a potential source of concern but, as discussed earlier in this report, Chinese policymakers will likely provide additional stimulus measures to offset any hit from U.S. tariffs. This will help boost European exports to China, especially if Chinese citizens are forced to divert demand away from tariffed U.S. goods towards tariff-free European products. The likely result is that a recovery in net exports will help boost overall euro area GDP growth to an above-trend pace over the next few quarters, which could generate some surprising upside pressures on inflation. Overall euro area inflation remains well below the European Central Bank (ECB) target of “just below” 2%. Looking ahead, faster rates of inflation are more likely over the next 6-12 months (Chart 9). The early “flash” estimate for April headline HICP inflation was 1.7%, but the lagged impact of higher oil prices and a soft euro should provide a lift towards Q4/2019, boosted by faster year-over-year comparisons versus the 2018 plunge in global oil prices. The flash estimate for April also showed that core HICP inflation jumped from 1% to 1.3%. That is a large move even for a data series that has always been volatile, and there may be more signal than noise this time with wage growth also accelerating. Chart 8Exports Set To Boost European Growth
Exports Set To Boost European Growth
Exports Set To Boost European Growth
Chart 9A Whiff Of Inflation?
A Whiff Of Inflation?
A Whiff Of Inflation?
In terms of bond investment strategy, the benchmark 10yr German Bund yield looks too low according to most valuation components (Chart 10): Inflation expectations are too low relative to the rising trend in euro-denominated oil prices, and with actual inflation stabilizing. Our estimate of the term premium component of the Bund yield is also depressed, within 25bps of the deeply negative levels seen during 2015/16, when inflation was near zero and the ECB was most aggressively buying government bonds in its Asset Purchase Program. Our proxy for the market’s expectation of the real neutral short-term interest rate in the euro area - the 5-year EUR Overnight Index Swap rate, 5-years forward minus the 5-year EUR CPI swap rate, 5-years forward – is now down to -0.6%. Even allowing for modest potential growth rates in the euro area, and the persistent problems of weak profitability for European banks, such deeply negative real rate expectations discount a lot of pessimism. Similar to the story for U.S. Treasury yields laid our earlier in this report, the medium term risk/reward tradeoff for German Bund yields points to a below-benchmark duration stance as most appropriate. The upside in yields will likely come almost entirely from the inflation expectations component initially, as the ECB will maintain a dovish bias until they are convinced that the economy is indeed accelerating. Thus, we continue to recommend owning inflation protection in the euro area, either through inflation-linked bonds or CPI swaps. Similar to the story for U.S. Treasury yields laid our earlier in this report, the medium term risk/reward tradeoff for German Bund yields points to a below-benchmark duration stance as most appropriate. For spread product, a combination of improving growth, moderate inflation and stable monetary policy should be ideal for the performance of credit. Unfortunately, the robust rally in euro area corporate bonds so far in 2019 has tightened spreads to levels consistent with an accelerating economy (Chart 11). In other words, European corporate credit already discounts the faster growth that is likely to be seen later this year. Just looking at the relationship between credit and the euro area manufacturing PMI, the current level of spreads is more consistent with a PMI several points above the current soft reading that is still below the expansionary 50 line. Chart 10Stay Below-Benchmark ##br##Euro Area Duration
Stay Below-Benchmark Euro Area Duration
Stay Below-Benchmark Euro Area Duration
Chart 11Stay Neutral European Corporates & Underweight BTPs
Stay Neutral European Corporates & Underweight BTPs
Stay Neutral European Corporates & Underweight BTPs
We continue to recommend only a neutral allocation to euro area corporates (both investment grade and high-yield), given the competing forces of cyclical improvement but stretched valuation. As for our other major tilt in Europe, we continue to recommend a cautious, below-benchmark, stance on Italian government bonds. The indicators for the Italian economy are lagging the signs of life seen in other large euro area nations, amidst ongoing fiscal squabbles with the EU. We continue to recommend a below-benchmark stance on Italian government bonds until there is more decisive evidence of a rebound in Italian growth, signaled by a rising OECD LEI for Italy (which has been negatively correlated to Italy-German spreads over the past decade). Bottom Line: Government bond yields in core Europe are too low relative to tentative signs that growth has bottomed out. At the same time, tight euro area corporate bond spreads already discount better economic momentum. Stay below-benchmark on euro area duration exposure, but maintain only a neutral weighting on euro area corporate bonds. Robert Robis, CFA, Chief Fixed Income Strategist rrobis@bcaresearch.com Footnotes 1https://www.bloomberg.com/news/articles/2019-05-09/fed-s-bostic-warns-consumers-may-feel-hit-on-china-tariff-boost 2 Please see BCA Global Investment Strategy Special Alert, “Stay Cyclically Overweight Global Equities, But Hedge Near-Term Downside Risks From An Escalation Of A Trade War”, dated May 10th 2019, available at gis.bcareseach.com. Recommendations Duration Regional Allocation Spread Product Tactical Trades Yields & Returns Global Bond Yields Historical Returns
Why has the median voter remained supportive of European institutions despite mixed economic performance? For one, investors – particularly outside continental Europe – continue to overstate how much emphasis Europeans put on “economic prosperity” as a key…

This concept is simple to understand, but difficult to implement. It is far easier to get lost in rumor intelligence-driven analysis of political consultants and journalists who pass on the cocktail party chatter insights gathered through speaking with…
Highlights So What? Investors should look to European assets for considerable upside. Why? In the Euro Area, investors have constantly overestimated the angst of the median voter towards the currency union. The European Parliament has few real powers, so a fractured European Parliament does not really matter. Europe’s high-beta economy should benefit from a Chinese and global rebound. Stronger European growth will translate into more credit demand and lower non-performing loans, which will boost bank earnings. Go long European banks as a tactical trade, and long European equities versus Chinese equities as a strategic play. We will also consider going long EUR/USD as a strategic play once we get clarity on potential tariffs. Feature
Chart 1
Europe’s economy and asset markets continue to underperform in 2019 despite a global policy pivot away from tightening monetary policy and a solid quarter of Chinese credit growth. Investors are broadly unattracted to continental Europe, regularly voicing fears that it is beset by a combination of hazards: from a no-deal Brexit to the ballooning Target 2 imbalances. According to the latest Bank of America Merrill Lynch survey of fund managers, the most crowded trade remains “short European equities” (Chart 1). The doom and gloom are intriguing considering that China is stimulating its economy and will continue to do so as long as trade tensions are elevated. “Higher beta” equities, including Europe and EM, should benefit from this stimulus (Chart 2). Exports, a key growth engine for the currency union, are closely linked to Chinese credit growth (Chart 3). Chart 2Chinese Stimulus Good For "High Beta" Economies
Chinese Stimulus Good For "High Beta" Economies
Chinese Stimulus Good For "High Beta" Economies
Chart 3Europe Will Benefit From Improving Chinese Growth
Europe Will Benefit From Improving Chinese Growth
Europe Will Benefit From Improving Chinese Growth
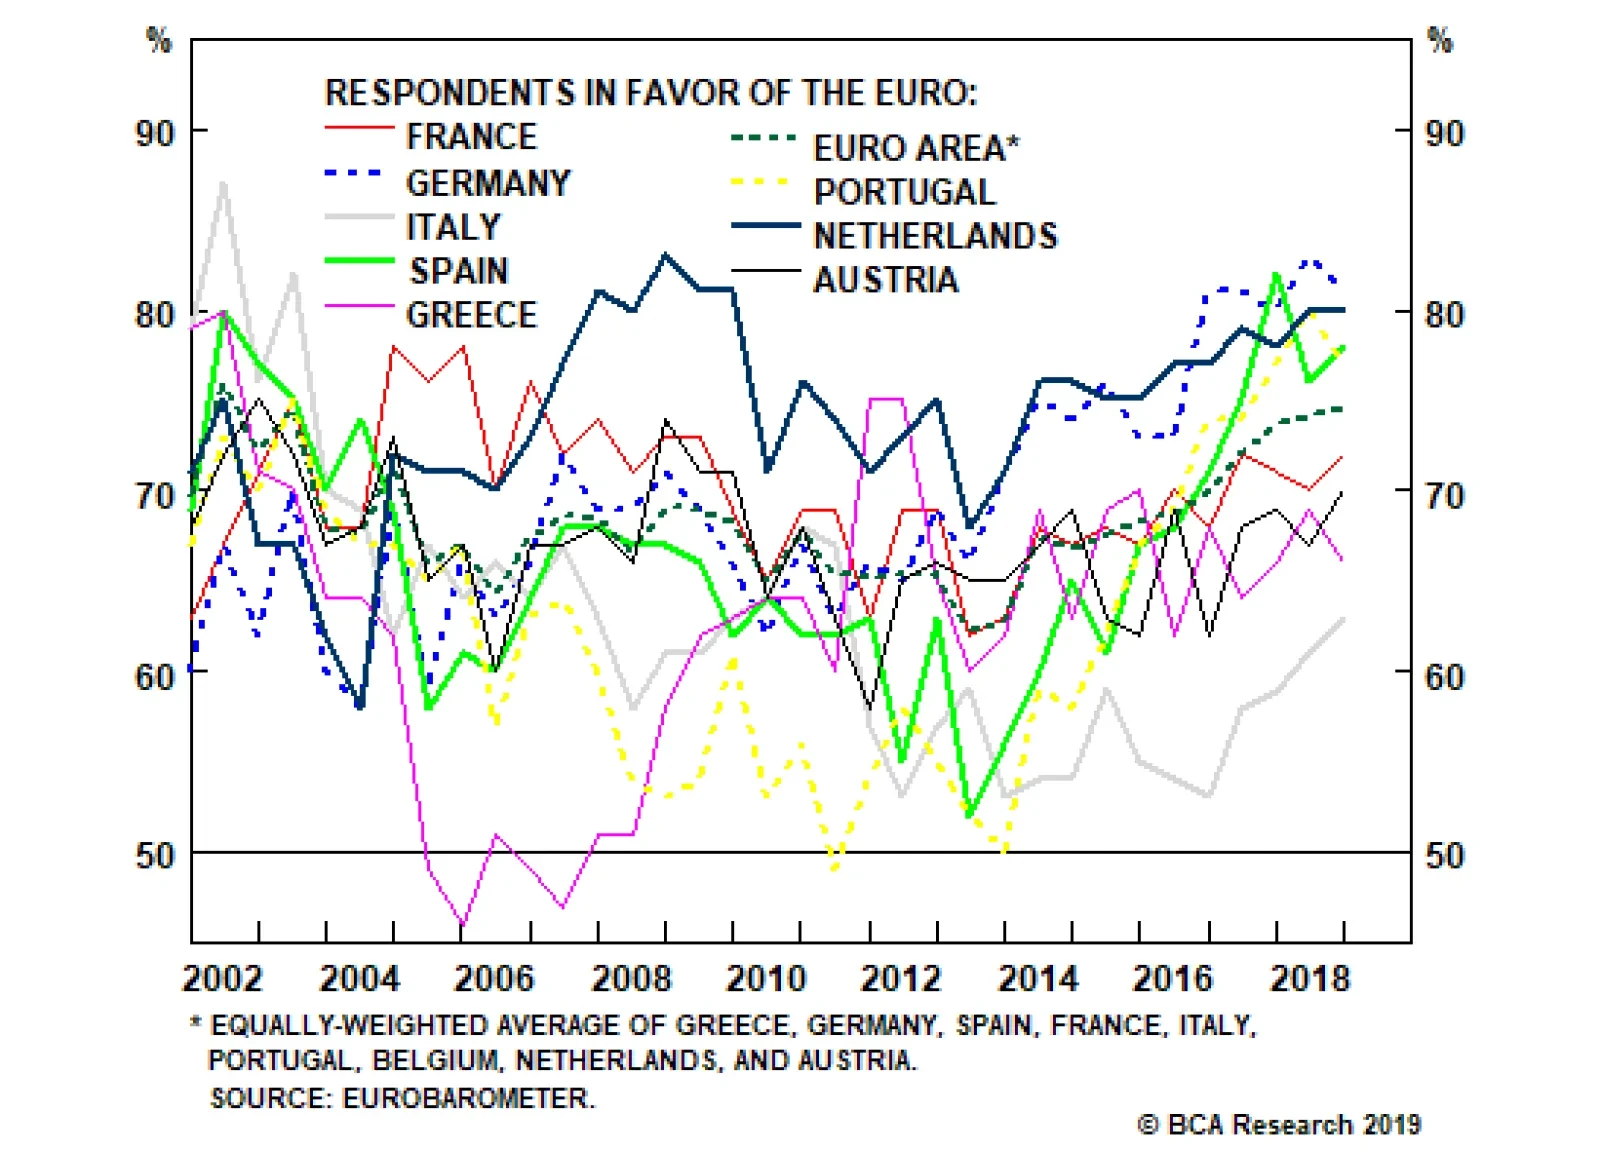
And yet Europe remains unloved. Given that most client questions focus on the political situation – and that many ask about the upcoming May 23 European Parliament (EP) elections – we focus on both in this analysis. First, we review the latest survey data on the collective sentiment towards Europe and integration. Second, we give our insights regarding the upcoming EP elections. Our broad conclusion is simple. If our house view that global growth is about to bottom is correct, and barring a collapse in U.S.-China trade talks, European assets – primarily equities and the euro – should be the top performers this year. What Does The European Median Voter Want? The Median Voter Theory is a critical concept for investors. At BCA Research Geopolitical Strategy, we believe that the median voter – not the policymaker – is the price maker in the political market place. Politicians, especially in democracies, are price takers. They are bound by constraints, of which the preferences of the median voter are the most concrete impediments to action. This concept is simple to understand, but difficult to implement. It is far easier to get lost in rumor intelligence-driven analysis of political consultants and journalists who pass on the cocktail party chatter insights gathered through speaking with policymakers. These insights focus on the preferences of the people in power. But their preferences are secondary to those of the median voter. Trust in the EU remains below 50%, but this is in line with or better than the usual trust most governments achieve. Chart 4Support For The Euro Has Been Trending Upwards
Support For The Euro Has Been Trending Upwards
Support For The Euro Has Been Trending Upwards
In the Euro Area, investors have constantly overestimated the angst of the median voter towards the currency union. This has led many investors to keep their money off the table, or take active short positions, even when it was prudent to remain invested. The prime example is the sentiment towards the common currency itself. Support for the euro hit a low in 2013 but has shot up since then across the continent (Chart 4). Even in Italy, the support for the euro is now at an eight-year high. Many investors have remained blind to this empirical fact. Not only has the support for the currency rebounded, but it has done so by converting doubters. Chart 5 shows that the increased support for the common currency – particularly in Spain, Germany, the Netherlands, and Italy – has occurred at the same time as the opposition has fallen. In other words, it is not the “undecideds” that are switching into supporters of the euro, rather it is the opponents who are relenting. Chart 5ASupport For The Common Currency Rising...
Support For The Common Currency Rising...
Support For The Common Currency Rising...
Chart 5B...As Doubters Convert
...As Doubters Convert
...As Doubters Convert
Chart 6Support For The EU Also On The Rise
Support For The EU Also On The Rise
Support For The EU Also On The Rise
What of the support for the EU broadly defined? Latest Pew Research polling also shows a strong rebound in support among the public in the largest member states (Chart 6). The last time we published the data – in the summer of 2016 following Brexit – the figures were much lower. Given that for many Europeans the EU is merely another layer of bureaucracy and government, the support level is impressive when put in the international context. Chart 7 shows that the trust in the EU, compared to the trust Europeans have in their own governments, falls somewhere squarely in the middle. When compared to non-European countries, Europeans have considerably more trust in the EU than Americans have in their own government and in line with the sentiment of Japanese towards their own government. In other words, the trust in the EU remains below 50%, but this is in line with or better than the usual trust most governments achieve.
Chart 7
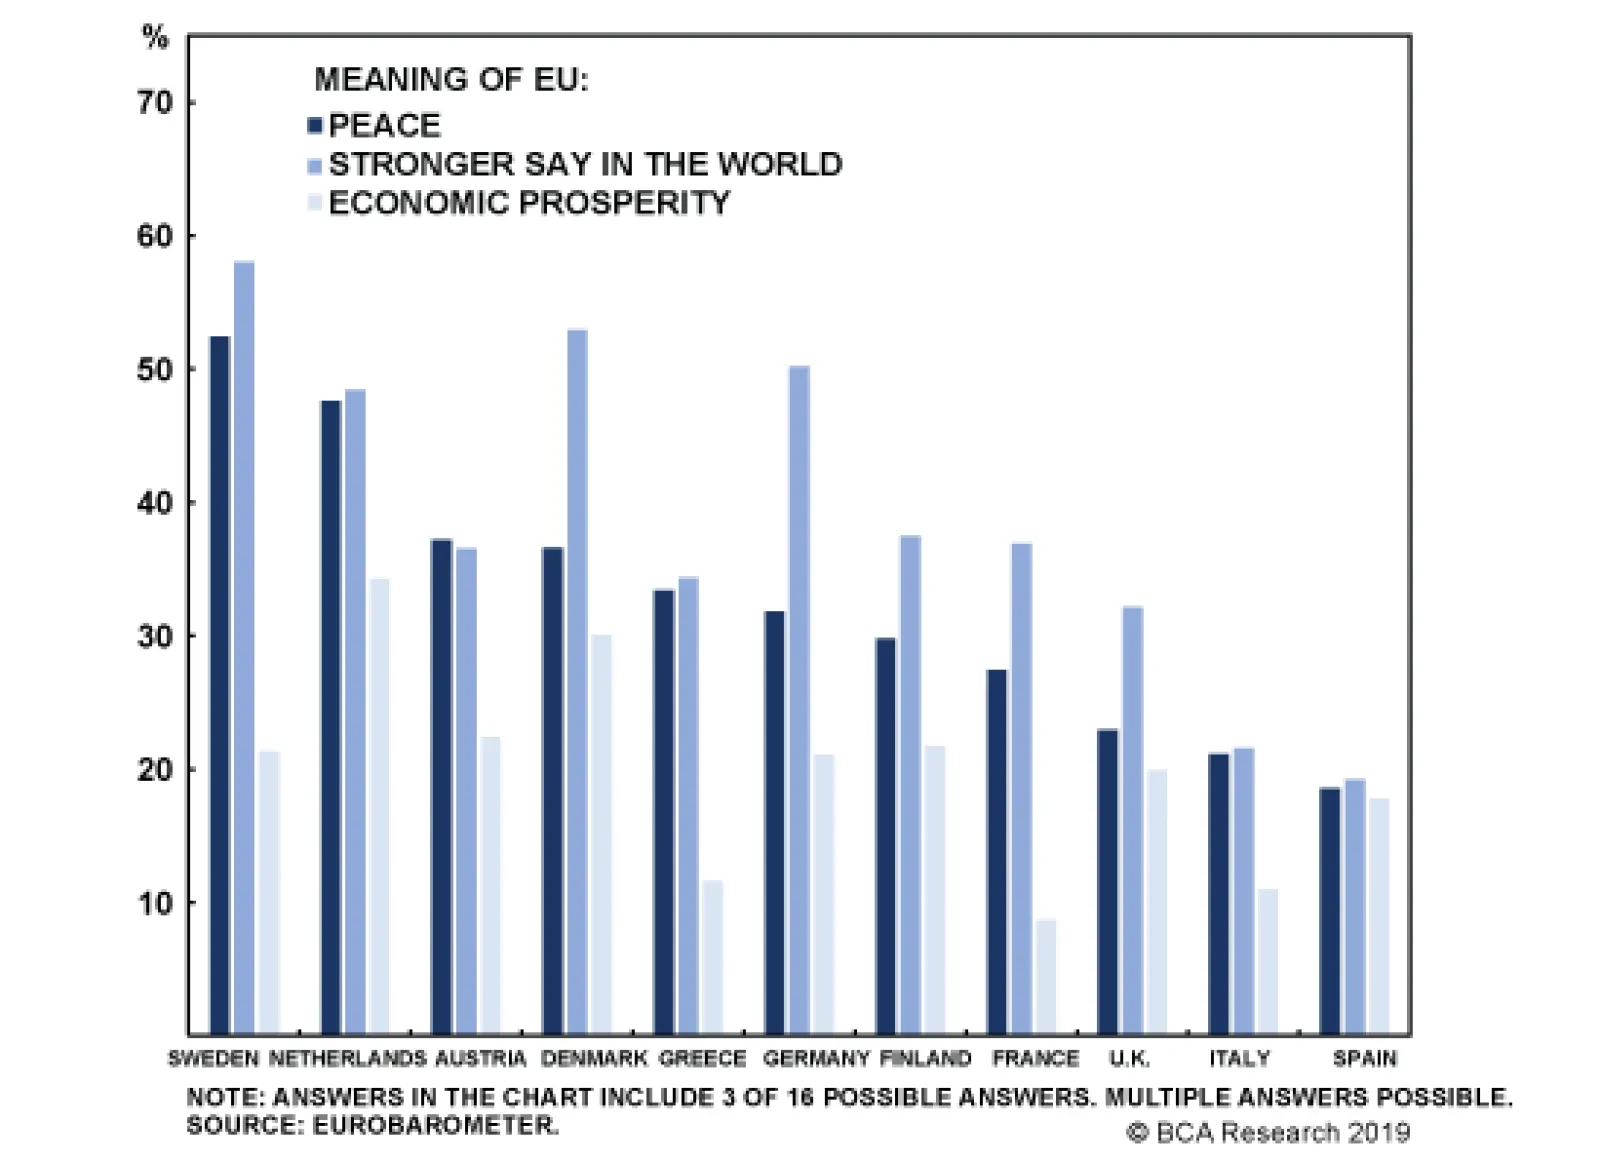
Why has the median voter remained supportive of European institutions despite mixed economic performance? For one, investors – particularly outside continental Europe – continue to overstate how much emphasis Europeans put on “economic prosperity” as a key goal of the integrationist process. Sure, everyone wants a humming economy, but Chart 8 shows that for most large European economies, “peace” and a “stronger say in the world” are more cogent explanations for the EU’s raison d’être than economic performance.
Chart 8
Now, a skeptic might argue that this is because the EU has failed to deliver on the promise of prosperity. Nonetheless, the data suggest that Europeans today no longer expect European institutions to focus primarily on economic matters. Geopolitics, particularly security and foreign policy, are not just concerns of the shadowy elites and bureaucrats in Brussels. The median voter is concerned with these matters as well. The one worrying aspect of Chart 8 is that voters in Italy and Spain don’t think the EU means much to them at all. That level of nihilism might be compatible with continued European integration today. However, it also means that both countries, particularly Italy, remain a risk whenever a recession hits. The second reason for the improvement in median voter support of European institutions is that the migration crisis of 2015 – which peaked in October 2015, merely eight months ahead of the fateful referendum in the U.K. – is done and gone (Chart 9). Illegal immigration is an issue of concern, but it has been for over half a century. In fact, every decade has seen a turn against immigration, usually following a recession. It is a recurring problem that will remain a major policy issue for the rest of the century. The path from a “policy problem” to “the end of European integration” is neither direct nor immediate. Third, terrorism has abated as an existential threat to Europe. Chart 10 shows that we have seen the end of the “bull market in terror” in Europe. Unfortunately, the data for that chart only goes to 2017, otherwise it would show an even more jarring collapse in both attacks and casualties. Chart 9The Migration Crisis Is No Longer A Crisis
The Migration Crisis Is No Longer A Crisis
The Migration Crisis Is No Longer A Crisis
Chart 10The "Bull Market In Terror" Is Over
The "Bull Market In Terror" Is Over
The "Bull Market In Terror" Is Over
The chart is also useful in putting the latest bout of terrorism – mainly of the radical Islamic variety – in its proper historical context. Europe has been riven with far left and nationalist terror (often both) since the late 1960s. The number of casualties per year in the 1970s was nearly two times greater than the peak of the recent bout of radical Islamic terror. This is largely the case even excluding the Troubles in Ireland and Northern Ireland. There is simply no evidence that the European median voter is moving towards Euroskepticism. Although it is difficult to make the connection, we would go on to posit that the abating of the migration crisis and bull market in radical Islamic terror has allowed the median voter in Europe to assess whether breaking apart the EU would truly resolve these crises. Elements of European integration, particularly the common labor market and Schengen Agreement – which is part and parcel of the integrationist evolution – definitely make it easier for migrants and terrorists to cross borders. However, the geopolitical forces that breed both are at least partly, if not completely, non-European in origin. As such, it is not clear how individual European countries that lack any hard power would deal with these events on their own. Thus European integration is not a policy born of strength but of weakness. Chart 11 illustrates this concept empirically. It shows the percent of respondents who think their country could better face the future outside the EU. The dotted line represents the pessimistic view. An astounding 87% of Dutch responders, for example, are pessimistic about the country’s future outside the EU. We pick on the Dutch because they have tended to vote for Euroskeptic parties. Similarly, a very high number of Germans, Finns, Swedes, French, and Spaniards are lacking confidence in “national sovereignty.” Only the Italians are flirting with “going it alone,” although even in their case the momentum for sovereignty appears to have stalled, as it has in traditionally Euroskeptic Austria. Chart 11AEuropeans Lack Confidence In National Sovereignty...
Europeans Lack Confidence In National Sovereignty...
Europeans Lack Confidence In National Sovereignty...
Chart 11B...And Believe They Are Better Off Sticking Together
...And Believe They Are Better Off Sticking Together
...And Believe They Are Better Off Sticking Together
Many investors approach European integration with an ideological slant. But charts don’t lie. Since we founded BCA Research Geopolitical Strategy, we have used Euro Area perseverance as the premier example of how an empirically-driven approach to political analysis can generate alpha. There is simply no evidence that the European median voter is moving towards Euroskepticism. A broad trend has existed since 2013 of rising support for the common currency, the euro. And a mini up-cycle in support for broader European institutions appears to be present since 2016, probably due to the combination of Brexit, an abating migration crisis, and the end of the bull market in terror. Bottom Line: The median voter supports both the euro and broad European integration. This is an empirical fact. But … Euroskeptics Are Winning Seats! Chart 12Anti-Establishment Parties Are Gaining Seats
Anti-Establishment Parties Are Gaining Seats
Anti-Establishment Parties Are Gaining Seats
Despite the comfort of our empirical data, the reality is that anti-establishment parties continue to increase their share of parliamentary seats across the continent (Chart 12). In the recent Spanish election, for example, the populist Vox managed to win 10.3% of the vote. Headlines immediately picked up on the extraordinary performance, noting that Euroskeptics have finally established a foothold in Spain. Spanish Prime Minister Pedro Sánchez, the leader of the victorious Socialist Party, has welcomed the characterization as a foil to his program, promising to build a pro-European bloc with other left-leaning parties. Sánchez is playing politics. He understands how broadly European integration is supported in Spain and is trying to paint his opponents – who disagree with him on many issues, but not on Spain’s membership in the EU and EMU – as being on the other side of the median voter’s preferences. In reality, Vox is not a hard Euroskeptic party. It is right wing on immigration, multiculturalism, and the centralization of the Spanish state, but on Europe Vox merely wants less integration from the current, already highly integrated level. Anti-establishment parties are realizing that the median voter does not want to abandon European integration. As such, the right-leaning anti-establishment parties are focusing on anti-immigrant and anti-multicultural policies, while the left-leaning are focusing on anti-austerity politics. But there appears to be an emerging truce on integration. We forecast this transition in our 2016 report titled “After Brexit, N-Exit?” We posited that anti-establishment parties would increasingly focus on anti-immigration policies, while reducing the emphasis on Euroskepticism, in order to remain competitive. We now have a number of examples of this process, from Italy’s Lega to Finland’s the Finns Party. Which brings us to the election at hand: the EP election on May 23.
Chart 13
Ironically, the EP election gives Euroskeptics the best chance at winning seats. First, the turnout has been falling for decades (Chart 13) given the dubious relevance of the legislative body (more on that below). Second, Euroskeptic voters tend to be highly motivated during EP elections as they get to vote “against Europe.” Third, ironically, EP elections allow Euroskeptics to build pan-European coalitions with their fellow skeptics. Despite the hype, the latest seat projections give Euroskeptics merely 26% of the seat total in the body, or just under 200 seats in the 750-seat body (Diagram 1). Chart 14 shows that the support for Euroskeptics has actually taken a serious dip following the Brexit referendum, with the overall continent-wide support remaining around 20%. This is broadly the same level at which the support was five years ago, giving Euroskeptic parties no gain in half a decade. Diagram 1Euroskeptics Expected To Hold Only A Quarter Of The Seats
European Parliament Election: Much Ado About A Moderately Relevant Event
European Parliament Election: Much Ado About A Moderately Relevant Event
Chart 14
All that said, if a fifth of Europe’s electorate is voting for anti-integrationist parties in the midst of the most important European-wide election, that must be a bad sign for Europe. Right? Wrong. The media rarely unpacks the Euroskeptics beyond citing their overall support figures. However, we have gone beyond merely citing the three leading Euroskeptic blocs. Instead, we have separated the individual Members of European Parliament (MEPs) from across the three Euroskeptic blocs into four camps: Eastern European Camp – These are MEPs from EU member states that are former members of the Warsaw Pact or former Republics of the Soviet Union. Hardcore Camp – These are committed Euroskeptics who genuinely want their countries to leave European institutions. The Dutch Party for Freedom wants to see the Netherlands leave both the EU and the EMU. However, parties such as the Swedish Democrats and the Finns Party are more nuanced. Nonetheless, we erred on the side of apocalypse and added them all to the hardcore camp. Classical Camp – These are MEPs who would have fit the Euroskeptic definition back in the 1990s. They generally do not have a problem with the EU, but tend to be skeptical of the EMU and definitely do not want to see any further integration (although some would welcome integration on the military front). Italy’s Lega belongs to this camp, at least since the 2017 election, given the reorientation of the party’s policy away from criticizing the EMU and toward anti-immigrant policies. On The Way Out Camp – The U.K. MEPs will eventually be forced to exit the EP given the eventual departure of the U.K. from the EU. In this camp, we have thrown all the U.K. MEPs who sit in Euroskeptic groupings, which includes both UKIP MEPs and Conservative Party members – even those who are not actually anti-EU. Diagram 2Almost Three Quarters Of Euroskeptic MEPs Are Bluffing
European Parliament Election: Much Ado About A Moderately Relevant Event
European Parliament Election: Much Ado About A Moderately Relevant Event
Diagram 2 shows the distribution of the currently 311 Euroskeptic MEPs. The largest portion, by far, are Eastern European MEPs. The second-largest portion are MEPs from the U.K., who are either on their way out or about to become the “lamest ducks” in the history of any legislature. What does this mean? First, that almost three quarters of the Euroskeptic MEPs are essentially bluffing. Eastern European Euroskepticism is a geopolitical oxymoron. Investors should ignore any Euroskeptic rhetoric from Eastern Europe for two reasons. First, many Eastern European economies remain highly dependent on the EU for structural funding (Chart 15). But even that crude measure does not illustrate the benefit of EU membership. If Eastern and Central European countries were to leave the EU, they would lose access to the common market, a huge economic cost given their close integration with the German manufacturing supply chain. Second, and perhaps more importantly, the EU is a critical geopolitical anchor for the former Warsaw Pact member states. As much as the Polish and Hungarian Euroskeptic MEPs like to speak of the “tyranny of Brussels,” they all remember all too clearly the actual tyranny of Moscow. As such, Eastern Europe’s Euroskepticism is a bluff, a rhetorical political tool to blame the ills of poor governance on Brussels for the sake of domestic political gains. It holds no actual threat to European integration or its institutions given that the alternative to Brussels is… Moscow.
Chart 15
This is why the three Euroskeptic blocs will find it difficult to cooperate in the future. The Eastern European-heavy European Conservatives and Reformists (ECR) are highly skeptical of Russia, as the largest party in the bloc is the Polish Law and Justice (PiS) Party. The PiS is highly critical of Moscow’s foreign policy and is the ruling party of Poland. Its rhetoric is on occasion illiberal and anti-EU, but it has also changed domestic policy when pressured by Brussels. The ECR is expected to be the smallest Euroskeptic party, with 55 MEPs. The genuinely hard-core Euroskeptic bloc is the Europe of Nations and Freedom (ENF). It is expected to win 58 MEPs and is dominated by genuine, long-time, anti-EU parties such as Marine Le Pen’s National Rally of France (formerly the National Front) and the Dutch Party for Freedom. However, its latest iteration is likely to be dominated by Matteo Salvini’s Lega, which is Italy’s ruling party and has taken a decided turn towards soft Euroskepticism. Finally, the moderately Euroskeptic Europe of Freedom and Direct Democracy (EFDD) is expected to win 57 seats. However, its largest bloc are the ruling Italian Five Star Movement (M5S) and an assortment of Euroskeptic British MEPs, including Niger Farage. Italy’s M5S has already toned down its Euroskeptic rhetoric given that it now sits in Rome and runs the EMU’s third-largest economy. Meanwhile, U.K. MEPs will be largely irrelevant, raising the question of whether EFDD should even be classified as Euroskeptic in the next EP. Bottom Line: When all is said and done, the European Parliament election is a much-hyped non-event. By our count, only about 60 out of approximately 190 Euroskeptic MEPs will be actual hard-core Euroskeptics (or, just 8% of the entire EP). The rest are either reformed centrists – the two major Italian parties, Lega and M5S – on their way out – U.K. Euroskeptics – or are just bluffing – all Eastern European MEPs. That said, the EP seat distribution will reflect the polarization and fracturing observed in most national parliaments across of Europe. It is likely that neither the center-left nor the center-right will have enough seats to select the European Commission President. Does Any Of This Even Matter? Does the EP election even matter? To answer this question, we first have to assess whether the European Parliament itself matters. Both the proponents and opponents of the EU overstate the bloc’s supranational institutions: the EP and the Commission. A fractured European Parliament does not really matter ... In fact, the European Parliament has few real powers. The true power in the EU is vested in the European Council. The European Council could be conceived of as an upper chamber of a combined EU legislature, the Senate to the European Parliament’s House of Representatives (to put into U.S. context). It is comprised of the heads of government of EU member states and is therefore elected on the national, not supranational, level. It is, by far, where most power resides in the EU. The Commission, on the other hand, is the EU’s technocratic executive. Its members are not democratically elected, but are chosen by the European Council and approved by both the Council and the EP.1 The EU Commission President is elected according to the Spitzenkandidat system. The party grouping that secures a majority governing coalition in the EP gets to name their leader as the candidate for the European Commission President. This system is not enshrined in EU law, it is merely a convention. In fact, it was designed to try to boost the voting turnout for the EP elections. The idea being that Europe’s voters would turn out to vote if it meant that their votes would ultimately determine who gets to head the European Commission. At the end of the day, the European Council has to approve the Spitzenkandidat. And, according to the letter of the law, the European Council can ultimately even ignore the Spitzenkandidat suggestions of the European Parliament and propose their own head of the European Commission. As such, the fact that Diagram 1 suggests a fractured European Parliament does not really matter. The European Council could, in the end, simply find a consensus candidate and have national governments instruct their MEPs to vote for that candidate in the EP. In fact, the European Parliament has few real powers. It is one of the only legislatures in the world with no actual legislative initiative (i.e., it cannot produce laws!). It gets to hold a ceremonial vote on new EU treaties – the treaties that act as a constitution of the bloc – but cannot veto them. On most important matters – including the EU budget – the Parliament cannot overrule the European Council (the heads of national governments), which means that it cannot subvert the sovereignty of the EU member states. In the political construct that is the EU, it is the upper-chamber that holds all the power (if we are to extend the analogy of the European Council as the “Senate”). Another important thing to remember is that MEPs are rarely unaffiliated. The vast majority are members of national parties on the national level. Few, if any, are actual supranational agents. In fact, most MEPs fall into two categories. They are either young up-and-comers being groomed for a successful career on the national level – the level that actually matters – or they are past-their-expiration-date elders looking for a cushy retirement posting that includes frequent, taxpayer-funded, trips between Brussels and Strasbourg. Bottom Line: The importance of the EP is vastly overstated by both Europhiles and Euroskeptics. Its role within the EU legislative process has been increasing through treaty evolution and convention. However, the true power in the EU still rests with the national governments and the EP can be sidelined if the European capitals so desire. Furthermore, while the EP is a supranational body with supranational powers, its soul is very much national. This is because most of its MEPs either have an eye on returning to domestic politics or are emeriti of domestic politics looking for one last bout of relevance. Investment Implications Given our sanguine view of European politics, and the BCA House View that global growth should bottom (Chart 16), investors should look to European assets for considerable upside. This is particularly the case if the U.S. and China overcome their cold feet and conclude a trade deal. Our colleague Peter Berezin, BCA’s Chief Investment Strategist, has proposed that investors go long European banks as a tactical trade. Peter has pointed out that banks are now trading at distressed valuations (Chart 17).2 Given a Chinese and global rebound, and barring a total relapse into trade war, Europe’s high-beta economy should benefit, leading to higher bond yields in core European markets.This has tended to help European bank stocks in the past (Chart 18). Stronger economic growth will also translate into more credit demand and lower non-performing loans. This will boost bank earnings (Chart 19). Chart 16Growth Is Recovering In The U.S. And China
Growth Is Recovering In The U.S. And China
Growth Is Recovering In The U.S. And China
Chart 17European Banks: A Good Value Play
European Banks: A Good Value Play
European Banks: A Good Value Play
Chart 18Euro Area: Higher Bond Yields Bode Well For Bank Stocks
Euro Area: Higher Bond Yields Bode Well For Bank Stocks
Euro Area: Higher Bond Yields Bode Well For Bank Stocks
Chart 19More Credit, Fatter Bank Earnings
More Credit, Fatter Bank Earnings
More Credit, Fatter Bank Earnings
In addition, U.S. dollar outperformance is long-in-the-tooth. If global growth is truly bottoming, and assuming a trade deal is done, then the policy divergence that has favored the greenback should be over (Chart 20). As such, we will consider going long EUR/USD as a strategic play once we get clarity on China tariffs and potential tariffs on U.S. auto imports (the latter risk is rising from 35% to 50% given Trump’s willingness to take risks this year). Chart 20If Trade War Subsides, Dollar May Fall
If Trade War Subsides, Dollar May Fall
If Trade War Subsides, Dollar May Fall
Chart 21A Reversal In Tech Outperformance Supports Long Europe/China
A Reversal In Tech Outperformance Supports Long Europe/China
A Reversal In Tech Outperformance Supports Long Europe/China
Finally, Dhaval Joshi, BCA’s Chief European Strategist, believes that Europe is a clear tactical overweight to China.3 Part of the reason is that the two markets are mirror opposites of each other in terms of sector skews. China is overweight technology and underweight healthcare, while Europe is overweight healthcare and underweight technology. The year-to-date outperformance by global technology stocks relative to healthcare is long in the tooth and ripe for a correction (Chart 21). Given our positive structural assessment of European political risk, we recommend going long European equities and short China as a strategic play. Marko Papic Consulting Editor marko@bcaresearch.com Footnotes 1 For the American context, the Commission would be what the various U.S. Departments would look like if they were serving at the pleasure of the U.S. Senate. While the analogy is not perfect, it does capture the fact that the EU’s executive is controlled by the European Council. 2 Please see BCA Global Investment Strategy Weekly Report, “King Dollar Is Due For A Breather,” dated April 26, 2019, available at gis.bcaresearch.com. 3 Please see BCA Research European Investment Strategy Weekly Report, “Suffering Market Vertigo,” dated May 2, 2019, available at eis.bcaresearch.com.
First, up until the last decade, Japan benefited from a robust global economy where trade grew strongly. Europe is entering its second decade of low growth in an environment of much weaker global economic activity. Second, excess capital stock in…
Europe has a more dire demographic profile than the U.S. It needs to purge capital stock and invigorate its economy through reforms, a smaller public sector, and more diversified financing channels. But can the euro area fare better than Japan has over the…
Highlights Open an equity market relative overweight to Europe versus China. Upgrade Denmark to neutral. Downgrade the Netherlands to underweight. Maintain Switzerland at overweight. With the Euro Stoxx 50 now up almost 20 percent from its January 3 low, the majority of this year’s absolute gains have already been made. Core euro area bond yields will edge modestly higher… …and EUR/USD will appreciate, as the backward-looking data on which the ECB depends catches up with the more perky real-time economic data. Feature Vertical charts scare us, as we contemplate falling over the edge. But they also excite us, as we contemplate a lucrative investment opportunity. Right now, the vertical chart that is causing us palpitations is technology versus healthcare (Chart of the Week). Chart of the WeekTechnology Versus Healthcare Has Gone Vertical!
Technology Versus Healthcare Has Gone Vertical!
Technology Versus Healthcare Has Gone Vertical!
The technology versus healthcare sector pair is critical, because it looms large in several stock markets’ ‘fingerprint’ sector skews. Meaning that the technology versus healthcare relative performance has unavoidable consequences for regional and country stock market allocation (Chart I-2 and Chart I-3). The technology versus healthcare sector pair is critical, because it looms large in several stock markets’ ‘fingerprint’ sector skews. Chart I-2When Technology Underperforms Healthcare, Netherlands Underperforms Switzerland
When Technology Underperforms Healthcare, Netherlands Underperforms Switzerland
When Technology Underperforms Healthcare, Netherlands Underperforms Switzerland
Chart I-3When Technology Underperforms Healthcare, China Underperforms Switzerland
When Technology Underperforms Healthcare, China Underperforms Switzerland
When Technology Underperforms Healthcare, China Underperforms Switzerland
Specifically, from a European stock market perspective, the Netherlands is overweight technology while Switzerland and Denmark are both overweight healthcare. Further afield, the U.S. is overweight technology while China is both overweight technology and underweight healthcare. Explaining Verticality And The Subsequent Fall What creates vertical charts? To answer the question, let’s turn it on its head: what prevents vertical charts? The answer is: the presence of value investors. In a healthy market, a cohort of value investors will sit on the side lines and only transact with the marginal seller when the price falls to a semblance of value. In other words, the value sensitive investors help to set the price, preventing verticality. But if the value sensitive cohort switches out of character to join a strong uptrend, the cohort will suddenly become value insensitive. In this case, the marginal seller will set the price higher and the formerly uninterested value sensitive buyer will now buy at the higher price. The market has morphed into a trend-following market. As more of the value cohort switch sides, the process adds rocket fuel to the rally. Driven by the ‘fear of missing out’ the marginal buyer will buy at larger and larger price increments, and the chart becomes vertical. What triggers the subsequent fall? When all of the value cohort have joined the uptrend, the fuel has run out: the marginal seller will no longer find a willing marginal buyer at the elevated price. At this critical point, one of two things will happen. Either: a completely new cohort of even deeper value investors will switch out of character and provide new fuel to the trend, allowing it to continue. Or: the deep value investors will stay true to character and will only deal with the marginal seller when the price falls, perhaps sharply, to a semblance of deep value. Technology versus healthcare is now at this critical technical point at which the probability of trend-reversal has significantly increased. Both the theoretical and empirical evidence suggests that at this critical point, the probability of trend-continuation decreases to about a third and the probability of a trend-reversal increases to about two-thirds. Technology versus healthcare is now at this critical technical point at which the probability of trend-reversal has significantly increased (Chart I-4). Chart I-4Technology Versus Healthcare: The Probability Of A Trend-Reversal Is High
Technology Versus Healthcare: The Probability Of A Trend-Reversal Is High
Technology Versus Healthcare: The Probability Of A Trend-Reversal Is High
Therefore, on a tactical horizon, it is now appropriate to underweight technology versus healthcare – which, to reiterate, carries unavoidable consequences for country and regional stock market allocation: Open an overweight to Europe versus China. Upgrade Denmark to neutral. Downgrade the Netherlands to underweight. Maintain Switzerland at overweight. Distinguishing Between Valuation And Growth Is Extremely Difficult There is another problem for value investors. Over short periods – meaning less than a year – it is very difficult, if not impossible, to decompose a price return into its two components: the component coming from the change in valuation and the component coming from the change in earnings growth expectations. A stock market’s actual earnings are highly sensitive to small changes in economic growth. This is universally the case but is especially true in Europe, because the European stock market’s skew towards growth-sensitive cyclicals gives it a very high operational leverage to GDP growth: a seemingly minor 0.5 percent change in economic growth translates into a major 25 percent change in stock market earnings growth (Chart I-5). The slightest improvement in economic growth expectations causes the market to upgrade its forecasts for earnings very sharply. Chart I-5A Minor Upgrade To Economic Growth = A Major Upgrade To Profits Growth
A Minor Upgrade To Economic Growth = A Major Upgrade To Profits Growth
A Minor Upgrade To Economic Growth = A Major Upgrade To Profits Growth
Given this very high operational leverage, the slightest improvement in economic growth expectations causes the market to upgrade its forecasts for earnings very sharply. Which of course lifts the market’s price, P, very sharply. In contrast, equity analysts’ forecasts for earnings, which drive the market’s ‘official’ forward earnings, E, adjust much more slowly. As my colleague, Chris Bowes explains: “analysts get married to a view and usually require overwhelming evidence to materially change it.” The upshot is that the P rises very sharply but the official forward E does not, meaning that the official forward P/E also rises very sharply. This gives the impression that the move is mostly valuation driven, but the truth is that the move is mostly earnings growth driven. In a similar vein, when central banks guide interest rates lower, how much of the equity market’s move is due to a higher valuation, and how much is due to improved prospects for economic growth resulting from the central bank policy change? Over relatively short periods of time, it is extremely difficult to tell. All of which provides an important lesson: over short periods, do not focus on separately forecasting the valuation change and earnings growth change of a stock market. Much better to forecast the stock market price directly, by focussing on the two main things which will drive it: changes to central bank policy, and changes to short-term real-time economic growth. Focus On Central Banks And Short-Term Economic Growth Central bank policy now ‘depends’ on relatively longer-term changes (say, year-on-year) in backward-looking data, most notably the consumer price index. Whereas the stock market’s earnings growth expectations take their cue from shorter-term changes in real-time economic indicators (Chart I-6). Chart I-6Quarter-On-Quarter Growth Is Rebounding
Quarter-On-Quarter Growth Is Rebounding
Quarter-On-Quarter Growth Is Rebounding
Hence, the ‘sweet spot’ for equity markets is when, in simple terms, year-on-year CPI inflation is decelerating, implying central banks will become more dovish, while quarter-on-quarter economic growth is accelerating, implying the market will upgrade earnings growth (Chart I-7). The stock market’s earnings growth expectations take their cue from shorter-term changes in real-time economic indicators. The ‘weak spot’ for equity markets is the exact opposite, when year-on-year CPI inflation is accelerating, implying central banks will become less dovish, while quarter-on-quarter economic growth is decelerating, implying the market will downgrade earnings growth. As 2019 progresses, our high-conviction prediction is that equity markets will move from a sweet spot to a weak spot. With the Euro Stoxx 50 now up almost 20 percent from its January 3 low, it implies that the majority of 2019’s gains have already been made in the first four months of the year – and the market is unlikely to be significantly higher at the end of the year. Compared to the equity market, the bond, interest rate, and currency markets are – almost by definition – much more dependent on central banks’ lagging reaction functions than on real-time growth. Which solves the mystery as to why bond yields are close to new lows while equity markets are close to new highs. It also solves the mystery as to why EUR/USD has lagged the very clear recovery in euro area real-time growth and in euro area stock markets (Chart I-8). Central banks are following lagging indicators. Chart I-7Stock Markets Take Their Cue from Real-Time Indicators
Stock Markets Take Their Cue from Real-Time Indicators
Stock Markets Take Their Cue from Real-Time Indicators
Chart I-8Central Banks Are Following Lagging Indicators, Stock Markets Are Following Real-Time Indicators
Central Banks Are Following Lagging Indicators, Stock Markets Are Following Real-Time Indicators
Central Banks Are Following Lagging Indicators, Stock Markets Are Following Real-Time Indicators
But as the backward-looking data, on which the ECB depends, catches up with the more perky real-time data, core euro area bond yields will edge modestly higher, and EUR/USD will gently appreciate. Next week, in lieu of the usual weekly report, I will be giving this quarter’s webcast titled ‘From Sweet Spot to Weak Spot?’ live on Wednesday May 8 at 10.00 AM EDT (3.00 PM BST, 4.00 PM CEST, 10.00 PM HKT). Through a series of key charts, the webcast will reveal the prospects and opportunities for all asset-classes through the remainder of 2019. At the end of the webcast, I will also unveil a brand new investment recommendation. So don’t miss it! Fractal Trading System* Supporting the arguments in the main body of this report, fractal analysis suggests that the recent rally in China’s stock market is at a technical point that has reliably signaled previous major reversals. Accordingly, this week’s recommended trade is a stock market pair trade, short China versus Japan. Set the profit target at 2.5 percent with a symmetrical stop-loss. We now have six open positions. For any investment, excessive trend following and groupthink can reach a natural point of instability, at which point the established trend is highly likely to break down with or without an external catalyst. An early warning sign is the investment’s fractal dimension approaching its natural lower bound. Encouragingly, this trigger has consistently identified countertrend moves of various magnitudes across all asset classes. Chart I-9Short China Vs. Japan
Short China VS. Japan
Short China VS. Japan
The post-June 9, 2016 fractal trading model rules are: When the fractal dimension approaches the lower limit after an investment has been in an established trend it is a potential trigger for a liquidity-triggered trend reversal. Therefore, open a countertrend position. The profit target is a one-third reversal of the preceding 13-week move. Apply a symmetrical stop-loss. Close the position at the profit target or stop-loss. Otherwise close the position after 13 weeks. Use the position size multiple to control risk. The position size will be smaller for more risky positions. * For more details please see the European Investment Strategy Special Report “Fractals, Liquidity & A Trading Model,” dated December 11, 2014, available at eis.bcaresearch.com. Dhaval Joshi, Chief European Investment Strategist dhaval@bcaresearch.com Recommendations Asset Allocation Equity Regional and Country Allocation Equity Sector Allocation Bond and Interest Rate Allocation Currency and Other Allocation Closed Fractal Trades Trades Closed Trades Asset Performance Currency & Bond Equity Sector Country Equity Indicators Bond Yields Chart II-1Indicators To Watch - Bond Yields
Indicators To Watch - Bond Yields
Indicators To Watch - Bond Yields
Chart II-2Indicators To Watch - Bond Yields
Indicators To Watch - Bond Yields
Indicators To Watch - Bond Yields
Chart II-3Indicators To Watch - Bond Yields
Indicators To Watch - Bond Yields
Indicators To Watch - Bond Yields
Chart II-4Indicators To Watch - Bond Yields
Indicators To Watch - Bond Yields
Indicators To Watch - Bond Yields
Interest Rate Chart II-5Indicators To Watch - Interest Rate Expectations
Indicators To Watch - Interest Rate Expectations
Indicators To Watch - Interest Rate Expectations
Chart II-6Indicators To Watch - Interest Rate Expectations
Indicators To Watch - Interest Rate Expectations
Indicators To Watch - Interest Rate Expectations
Chart II-7Indicators To Watch - Interest Rate Expectations
Indicators To Watch - Interest Rate Expectations
Indicators To Watch - Interest Rate Expectations
Chart II-8Indicators To Watch - Interest Rate Expectations
Indicators To Watch - Interest Rate Expectations
Indicators To Watch - Interest Rate Expectations
It’s official, the Italian technical recession is over. Italian GDP growth moved back into positive territory in the first quarter. Additionally, Spanish GDP growth rebounded to 0.7% on a quarterly basis, or 2.4% year-on-year. Thanks to those two surprises,…
Investor surveys show that the majority of investors’ top concerns are political or geopolitical in nature. Yet there is limited research devoted to quantifying these risks. The most prominent techniques involve tallying word counts of key terms that appear…