Euro Area
The twenty year life of the euro captures multiple manias and crises, some centered in Europe, some in the U.S. Through these twenty years, the euro area versus U.S. long bond yield spread has averaged -50 bps. Over this same period, the euro area versus U.S.…
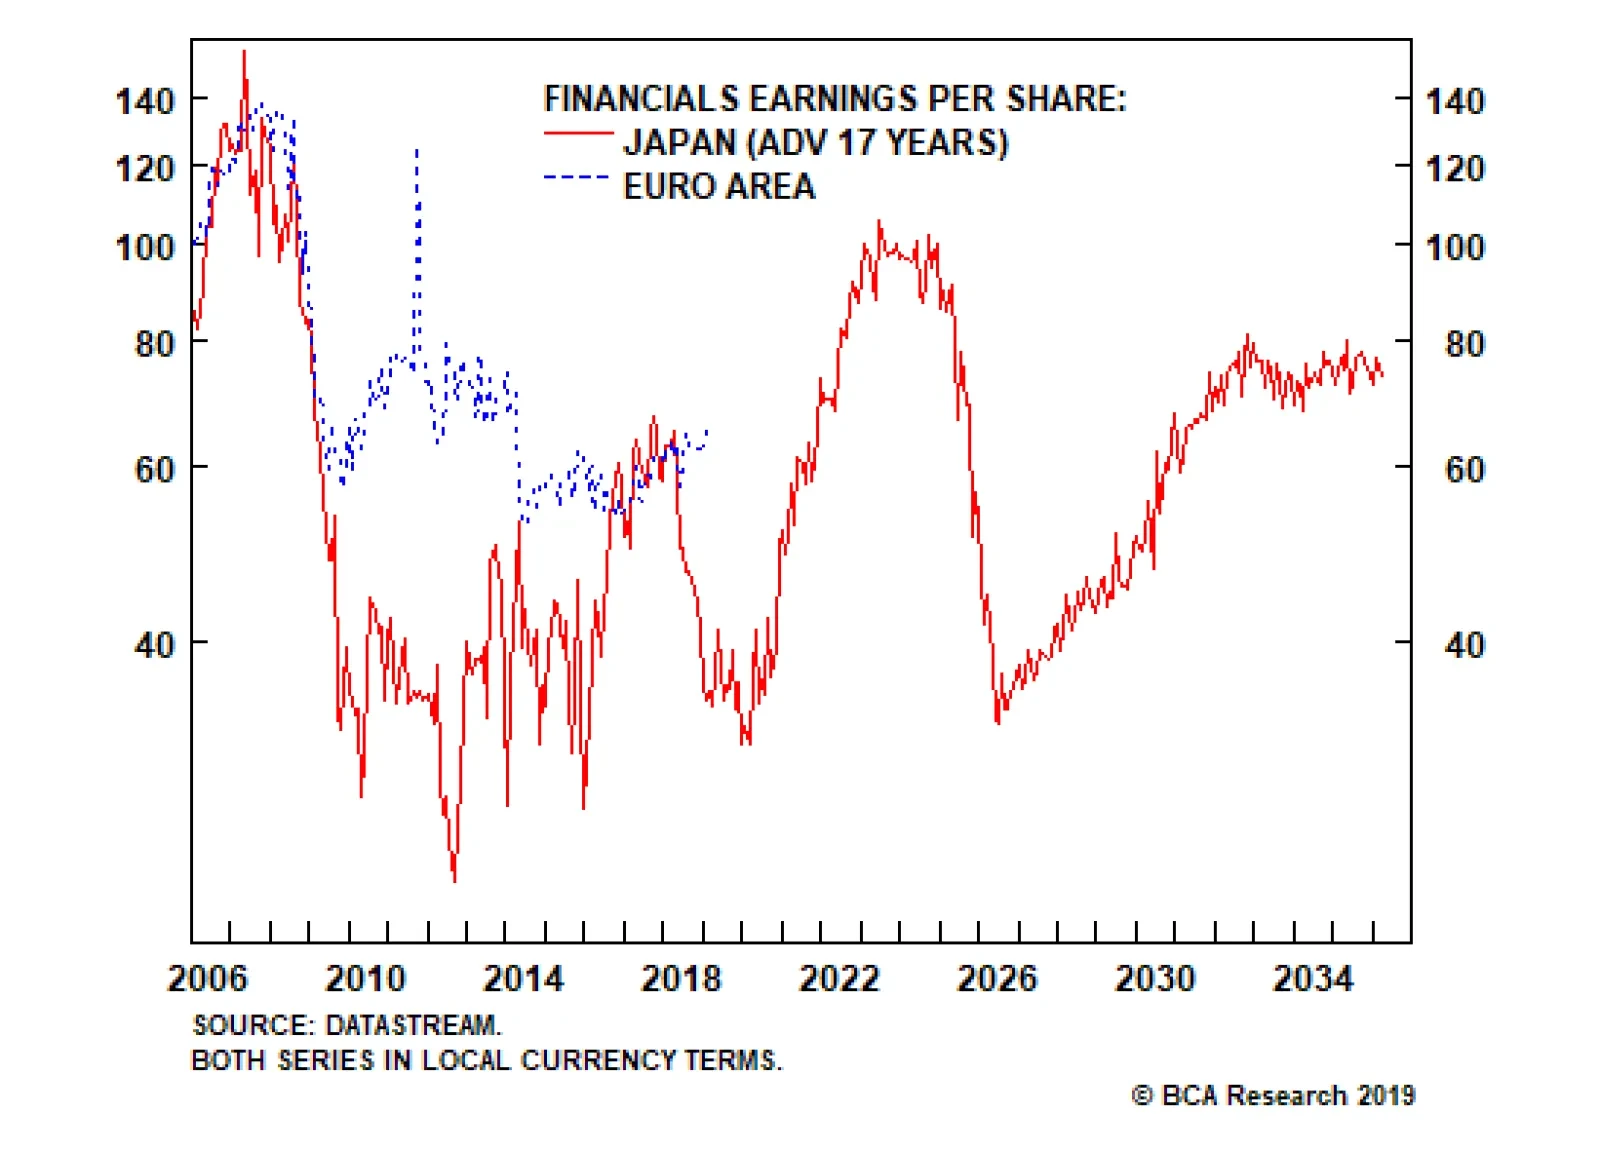
Japanese financial sector profits peaked in 1990 and stand at less than half that level today. Euro area financial sector profits peaked in 2007, and are tracking the Japanese experience with a 17-year lag. If euro area financial profits continue to follow in…

Highlights Global equities and other risk assets will trade sideways with elevated volatility over the coming weeks before grinding higher for the remainder of the year, as global growth finally accelerates after a series of false starts. We now see the Fed raising rates more slowly than we had previously envisioned, but ultimately having to scramble to hike rates in order to quell inflation. The fed funds rate will probably plateau at 4% in 2021, implying nine quarter-point hikes more than the market is currently discounting. Over a 12-month horizon, investors should overweight global equities, underweight government bonds, and maintain a neutral allocation to cash. The dollar will peak in the second quarter and then weaken over the remainder of the year and into 2020, before starting to strengthen again late next year. Investors should prepare to temporarily upgrade EM and European stocks over the coming weeks, while increasing exposure to cyclical equity sectors. Industrial metals and oil will strengthen over the course of the year. Gold should be bought on any dip. Investors should begin to de-risk their portfolios in late-2020 in anticipation of a recession in 2021.
Chart 001
Feature Here We Go Again? After having become more defensive last June, we turned bullish on stocks following the December post-FOMC meeting plunge. As stocks continued to rebound, we tempered our optimism. In the beginning of March, we wrote that “having rallied since the start of the year, global stocks will likely enter a ‘dead zone’ over the next six-to-eight weeks as investors nervously await the proverbial green shoots to sprout.”1 Last Friday’s release of disappointing European PMI data poured some herbicide on the green shoots thesis. Germany’s manufacturing PMI hit a six-year low, with the new orders component registering the weakest reading since the Great Recession. This took the 10-year German bund yield into negative territory for the first time since 2016. The U.S. 10-year Treasury yield also fell to a 15-month low, causing the 3-month/10-year curve to invert. Historically, an inverted yield curve has been a reliable predictor of U.S. recessions (Chart 1). Chart 1Yield Curve Inversions, Recessions, And The Term Premium
Yield Curve Inversions, Recessions, And The Term Premium
Yield Curve Inversions, Recessions, And The Term Premium
President Trump’s decision to appoint TV commentator Stephen Moore to the Fed’s Board of Governors did not help matters. Recommended by fellow supply-side “economist” Larry Kudlow, Moore is best known for dismissing concerns over the state of the housing market in 2007, his spot-on 2010 prediction that QE would cause hyperinflation, and his belief that the Trump tax cuts would lead to a smaller budget deficit. Global Growth Will Accelerate In The Second Half Of The Year Given all these worrisome developments, is it time to turn cyclically bearish on the economic outlook and risk assets again? We do not think so. While the next few weeks could be challenging for equities – a risk that our MacroQuant model is currently flagging – sentiment should improve as global growth finally accelerates after a series of false starts. Indeed, some positive signs are already visible: The diffusion index of our global leading economic indicator, which tracks the share of countries with rising LEIs, has moved higher (Chart 2). It leads the global LEI. Service sector PMIs have also generally improved, suggesting that the weakness in global growth remains concentrated in trade and manufacturing. And even on the trade front, a few forward-looking indicators such as the Baltic Dry Index and the weekly Harpex shipping index, which measures global container shipping activity, have bounced off their lows. We would downplay the signal from the yield curve, as it currently is severely distorted by a negative term premium. If the 10-year Treasury term premium were back to where it was in 2004, the 3-month/10-year slope would be more than 200 bps steeper, and nobody would be talking about this issue. In fact, given today’s term premium, the curve would have almost certainly inverted in 1995. Anyone who got out of stocks back then would have missed out on one of the greatest bull markets in history. It should also go without saying that some of the decline in the U.S. 10-year yield reflects a positive development: The Fed has turned more dovish! If one looks at the 10-year/30-year portion of the yield curve, it has actually steepened. This is a sign that the market is seeing the Fed’s actions as being reflationary in nature. There is no clear causal mechanism by which an inverted yield curve slows economic activity, apart from it potentially becoming a self-fulfilling prophecy where the yield-curve inversion scares investors, thereby leading to a tightening in financial conditions (Chart 3). Such “doom loops” are conceptually possible, but as we discussed earlier this year, they are unlikely to occur in the current environment.2 At any rate, financial conditions have eased since the start of the year. This should boost growth in the coming months. Chart 2Global Growth May Be ##br##Starting To Stabilize
Global Growth May Be Starting To Stabilize
Global Growth May Be Starting To Stabilize
Chart 3Easier Financial Conditions Since The Start Of The Year Bode Well For Global Growth
Easier Financial Conditions Since The Start Of The Year Bode Well For Global Growth
Easier Financial Conditions Since The Start Of The Year Bode Well For Global Growth
Chinese Credit Growth Set To Rise Global growth has been weighed down by a slowing Chinese economy. Last year’s deleveraging campaign led to a significant deceleration in investment spending, which had negative repercussions for capital equipment and commodity producers all over the world (Chart 4). Historically, China has loosened the reins on the financial sector whenever credit growth has fallen towards nominal GDP growth (Chart 5). It appears we have reached this point. Despite a weak seasonally-distorted February print, credit growth has finally accelerated on a year-over-year basis. Chart 4China: The Deleveraging Campaign Had Adverse Effects On Investment Spending
China: The Deleveraging Campaign Had Adverse Effects On Investment Spending
China: The Deleveraging Campaign Had Adverse Effects On Investment Spending
Chart 5Historically, China Has Scaled Back On Deleveraging When Credit Growth Has Fallen Close To Nominal GDP Growth
Historically, China Has Scaled Back On Deleveraging When Credit Growth Has Fallen Close To Nominal GDP Growth
Historically, China Has Scaled Back On Deleveraging When Credit Growth Has Fallen Close To Nominal GDP Growth
We do not expect Chinese credit growth to rise as much as in past releveraging cycles. However, this is because the economy is in better shape, not because there is some intrinsic constraint to increasing debt from current levels. China’s elevated savings rate has kept interest rates well below trend nominal GDP growth, which is the key determinant of debt sustainability (Chart 6).3 As long as the central government maintains an implicit guarantee on most local and corporate debt, as it is currently doing, default risk will remain minimal. In any case, given that total debt stands at 240% of GDP, even a one percentage-point increase in credit growth would generate a hefty 2.4% of GDP in credit stimulus. The Chinese credit impulse leads imports by about six-to-nine months (Chart 7). This bodes well for global trade in the second half of the year. Chart 6China's High Savings Rate Has Kept Interest Rates Well Below Trend Nominal GDP Growth
China's High Savings Rate Has Kept Interest Rates Well Below Trend Nominal GDP Growth
China's High Savings Rate Has Kept Interest Rates Well Below Trend Nominal GDP Growth
Chart 7Global Trade Will Benefit From A Chinese Reflationary Impulse
Global Trade Will Benefit From A Chinese Reflationary Impulse
Global Trade Will Benefit From A Chinese Reflationary Impulse
A Lull In The Trade War? A de-escalation in the trade war would help matters. As a self-professed master negotiator, Donald Trump needs to secure a deal with China before next year‘s presidential election, while also convincing American voters that the agreement was concluded on favorable terms for the United States. Reaching a deal with China early on in his term would have been risky for Trump if it had failed to bring down the bilateral trade deficit – an entirely likely outcome given how pro-cyclical U.S. fiscal policy is. At this point, however, Trump could crow about making a great deal with China while reassuring voters that the product of his brilliance will be realized only after he has been re-elected. Thus, the likelihood that Trump will seek to strike a deal has risen. For their part, the Chinese want as much negotiating leverage as they can muster. This means being able to convincingly demonstrate that their economy is strong enough to handle the repercussions from turning down a trade deal that fails to serve their interests. Since the credit cycle is the dominant driver of Chinese growth, this requires putting the deleveraging campaign on the backburner. Faster Global Growth And Stronger Domestic Demand Will Benefit Europe Stronger Chinese growth will help the European export sector later this year. The export component of the Chinese Caixin PMI has moved up from its lows. It leads the euro area PMI by about three months. Meanwhile, euro area domestic demand will benefit from a more accommodative fiscal policy and lower bond yields. The decline in bond yields will be especially helpful to Italy. The spike in yields and loss of business confidence following the election of a populist government last March plunged the economy into recession (Chart 8). Now that the 10-year BTP yield has fallen more than 100 bps from its highs, the Italian economy should start to perk up. The ECB will not raise rates this year even if domestic growth speeds up, but the market will probably price in a few rate hikes in 2020 and beyond. This will allow for a modest re-steepening of yield curves in core European bond markets, which should be positive for long-suffering bank profits. Brexit remains a concern. The ongoing saga has reached the farcical stage where: 1) The U.K. has voted to leave the EU; but 2) Parliament has voted to stay in the EU unless it reaches a satisfactory deal with Brussels; while 3) rejecting the only deal with Brussels that was on offer. Given that most British voters no longer want Brexit (Chart 9), we think that the government will kick the proverbial can down the road until a second referendum is announced or a “soft Brexit” deal is formulated. Either outcome would be welcomed by markets. Chart 8Italian Bond Yields Are A Headwind No More
Italian Bond Yields Are A Headwind No More
Italian Bond Yields Are A Headwind No More
Chart 9U.K.: In The Case Of A Do-Over, The Remain Side Would Likely Win
U.K.: In The Case Of A Do-Over, The Remain Side Would Likely Win
U.K.: In The Case Of A Do-Over, The Remain Side Would Likely Win
What Will The Fed Do?
Chart 10
Last year’s “Christmas Crash” clearly shifted the Fed’s reaction function in a more dovish direction. We do not expect Jay Powell to raise rates over the next few months, but a reacceleration in global growth is likely to prompt the Fed to tighten anew in December. The Fed will continue raising rates once per quarter in 2020, before accelerating the pace of tightening in 2021 in response to rising inflation. In all, we see the fed funds rate increasing to around 4% by the end of this cycle. This represents nine quarter-point hikes more than the market is currently discounting (Chart 10). We were stopped out of our short fed funds futures trade, but we recommend that clients short the June-2021 fed funds futures or a similar instrument. The U.S. Economy: Great Again Fundamentally, the U.S. economy is on solid ground and can handle higher interest rates. Unlike a decade ago, the housing market is in good shape (Chart 11). The homeowner vacancy rate stands near a record low. Judging by FICO scores, the quality of mortgage lending remains high. The labor market is also firm, with job openings hitting another record high in February (Chart 12). The combination of a healthy housing and labor market is invariably good for consumers. Chart 11U.S. Housing Fundamentals Are Solid
U.S. Housing Fundamentals Are Solid
U.S. Housing Fundamentals Are Solid
Chart 12The U.S. Labor Market Is Firm
The U.S. Labor Market Is Firm
The U.S. Labor Market Is Firm
Chart 13
The personal savings rate currently stands at 7.6%, notably higher than one would expect based on the ratio of household net worth-to-disposable income (Chart 13). A decline in the savings rate would allow consumer spending to increase more quickly than income. With the latter being propped up by rising wages, this will be bullish for consumption. Capital spending intentions have dipped over the past few months, but remain elevated by historic standards (Chart 14). The real nonresidential capital stock has grown by an average of only 1.7% since the start of the recovery, down from 3% in the pre-recession period (Chart 15). A cyclical upswing in productivity growth, rising labor costs, and low levels of spare capacity should all motivate businesses to invest in new plant and equipment. Chart 14Capital Spending Intentions Have Softened, But Remain Elevated
Capital Spending Intentions Have Softened, But Remain Elevated
Capital Spending Intentions Have Softened, But Remain Elevated
Chart 15There Is Room For More U.S. Capital Investment
There Is Room For More U.S. Capital Investment
There Is Room For More U.S. Capital Investment
Corporate Debt: How Much Of A Risk? Chart 16U.S. Corporate Debt Is Not Extreme By Global Standards
U.S. Corporate Debt Is Not Extreme By Global Standards
U.S. Corporate Debt Is Not Extreme By Global Standards
Corporate debt levels have increased significantly in recent years, while underwriting standards have deteriorated, as evidenced by the proliferation of covenant-lite loans. Nevertheless, the situation is far from dire. Relative to other countries, U.S. corporate debt is quite low (Chart 16). At 143% of GDP, corporate debt in France is twice that of the United States. This is not to suggest that everything is fine in the French corporate sector; but the fact is that France has not had a corporate debt crisis. This signals that the U.S. is not at imminent risk of one either. Netting out cash, U.S. corporate debt as a share of GDP is at the same level it was in 1989, a year in which the fed funds rate was close to nine percent. The ratio of corporate net debt-to-EBITD remains reasonably low. The interest coverage ratio is above its historic average. In addition, corporate assets have also risen quite briskly over the past few years, which has kept the corporate debt-to-asset ratio broadly stable (Chart 17). The corporate sector financial balance – the difference between corporate income and spending – is still in positive territory at 1% of GDP. Every recession in the past 50 years began when the corporate sector financial balance was in deficit (Chart 18). Chart 17U.S. Corporate Debt: How High?
U.S. Corporate Debt: How High?
U.S. Corporate Debt: How High?
Chart 18Corporate Sector Financial Balance Still In Surplus
Corporate Sector Financial Balance Still In Surplus
Corporate Sector Financial Balance Still In Surplus
Unlike mortgages, which are often held by leveraged institutions, most corporate debt is held by unleveraged players such as pension funds, insurance companies, mutual funds, and ETFs. Bank loans account for only 18% of nonfinancial corporate sector debt, down from 40% in 1980 (Chart 19). The share of leveraged loans held by banks has declined from about 25% a decade ago to less than 10% today. Moreover, banks today hold much more high-quality capital than in the past (Chart 20). This makes corporate debt less systemically important for the economy. Chart 19Banks Have Reduced Their Exposure To The Corporate Sector
Banks Have Reduced Their Exposure To The Corporate Sector
Banks Have Reduced Their Exposure To The Corporate Sector
Chart 20U.S. Banks Are Well Capitalized
U.S. Banks Are Well Capitalized
U.S. Banks Are Well Capitalized
One of the reasons we turned more bullish on risk assets in December was because stocks had plunged and corporate spreads widened without much follow-through in financial stress indices. For example, the infamous TED spread barely budged (Chart 21). Chart 21TED Spreads Are Well Behaved, Indicating No Major Signs Of Financial Stress
TED Spreads Are Well Behaved, Indicating No Major Signs Of Financial Stress
TED Spreads Are Well Behaved, Indicating No Major Signs Of Financial Stress
Everyone Agrees With Larry Given the lack of major imbalances in the U.S. economy, why do investors believe that the Fed cannot raise rates further even though the Fed funds rate in real terms is barely above zero? The answer is that investors appear to have bought into Larry Summers’ secular stagnation thesis, which posits that the neutral rate of interest is much lower today than it was in the past. We have some sympathy for this thesis, but it is important to remember that it is a theory about the long-term determinants of interest rates such as productivity and demographic trends. The theory says little about the cyclical drivers of interest rates, including the amount of spare capacity in the economy, the stance of fiscal policy, credit growth, and wage trends. Earlier this decade, when we were still very bullish on bonds, one could have plausibly argued that the economy needed extremely low interest rates: The output gap was still large; the deleveraging cycle had just begun; home and equity prices were depressed; wage growth was anemic; and fiscal policy had turned restrictive after a brief burst of stimulus during the Great Recession. Far From Neutral? All of the forces mentioned above have either fully or partially reversed course over the past few years. Take fiscal policy as one example. The IMF estimates that the U.S. structural budget deficit averaged 3.3% of GDP in 2014-15. In 2019-20, the IMF reckons the deficit will average 5.6% of GDP. To what extent has easier fiscal policy raised the U.S. neutral rate of interest? Let us conservatively assume that every $1 of additional fiscal stimulus adds $1 to aggregate demand. In this case, fiscal policy has added 2.3% of GDP to aggregate demand over the past five years. Suppose that a one-percentage point increase in aggregate demand raises the neutral rate of interest by 1%, which is in line with the specification of the Taylor Rule that former Fed Chair Janet Yellen favored. This implies that fiscal policy alone has raised the neutral rate by over two percentage points. The discussion above suggests that cyclical factors may have pushed up the neutral rate considerably, even if long-term structural factors are still dragging it down. Since the Fed is supposed to set interest rates with an eye on what is appropriate for the economy over the next year or two, rates may end up staying too low for too long. This will cause the economy to overheat, eventually leading to a surge in inflation. The Inflation Boogeyman The good news is that none of our favorite indicators point to a major imminent inflationary upswing (Chart 22): Despite higher tariffs, consumer import price inflation has slowed; core intermediate producer price inflation has decelerated; the prices paid components of the ISM and regional Fed surveys have plunged; inflation surprise indices have rolled over; and both survey and market-based measures of inflation expectations remain below where they were last summer. In keeping with these developments, BCA’s proprietary Pipeline Inflation Indicator has fallen to a two-and-a-half-year low. Wage growth has accelerated, but productivity growth has increased by even more. As a result, unit labor cost inflation has been coming down since the middle of last year. Unit labor costs lead core CPI inflation by about 12 months (Chart 23). This implies that consumer price inflation is unlikely to reach uncomfortably high levels at least until the second half of next year. Chart 22No Symptoms of An Imminent Major Inflationary Upswing In The U.S. ...
No Symptoms of An Imminent Major Inflationary Upswing In The U.S. ...
No Symptoms of An Imminent Major Inflationary Upswing In The U.S. ...
Chart 23... And Decelerating Unit Labor Costs Will Dampen Inflationary Pressures For The Time Being
... And Decelerating Unit Labor Costs Will Dampen Inflationary Pressures For The Time Being
... And Decelerating Unit Labor Costs Will Dampen Inflationary Pressures For The Time Being
At that point, risks are high that inflation will move up. This could force the Fed to start raising rates aggressively in early-2021, a course of action that will push up the dollar and cause equities and spread product to sell off. The resulting tightening in financial conditions will probably plunge the U.S. and the rest of the world into recession in mid-to-late 2021. Stay Bullish Global Equities For Now, Turn Defensive Late Next Year Chart 24Analyst Expectations Are Quite Muted
Analyst Expectations Are Quite Muted
Analyst Expectations Are Quite Muted
The two-stage Fed tightening cycle discussed above – gradual rate hikes starting in December and continuing into 2020, and more aggressive hikes thereafter in response to rising inflation – shapes our investment views over the next few years. The Key Financial Market Forecasts Chart at the beginning of this publication provides a rough sketch of where we think the main asset classes are heading. We suspect that equities and other risk assets will be able to digest the first stage of rate tightening, albeit with heightened volatility around the time when the Fed starts preparing the market for another hike later this year. Unlike last September, earnings estimates are much more conservative. Bottom-up estimates foresee EPS rising by 3.9% in the U.S. and 5.4% in the rest of the world in 2019 (Chart 24). The combination of faster growth, easier financial conditions, and ongoing share buybacks implies some upside to these numbers. Perhaps more importantly, unlike in September, the Fed will only start hiking rates if the economy is performing well. Powell erred in saying that “rates were a long way from neutral” just when the U.S. economy was starting to slow. Had he uttered those words when U.S. growth was still accelerating, investors would have probably disregarded them. Jay Powell won’t make the same mistake again. Rather, he will make a different one: He will let the economy overheat to the point where the Fed finds itself clearly behind the curve and forced to scramble to catch up. The resulting stagflationary environment – where growth is slowing due to a shortage of available workers and inflation is on the upswing – will be toxic for equities and other risk assets. While it is difficult to be precise about timing, we recommend that investors maintain a modestly pro-risk stance over the next 12-to-18 months. However, they should pare back exposure to equities and spread product late next year before the Fed ramps up the pace of rate hikes. Prepare To Temporarily Upgrade International Stocks The U.S. stock market tends to be “low beta” compared to other bourses. If global growth accelerates in the second half of this year, international stocks will outperform their U.S. counterparts. We sold our put on the EEM ETF for a gain of 104% on Jan 3rd, and now recommend being outright long EM equities. We will be looking to upgrade both EM and European equities to overweight in the coming weeks in currency-unhedged terms once we see more confirmatory evidence of a global growth revival. We have mixed feeling about Japanese stocks. Stronger global growth will benefit Japanese multinationals, but firms focused on the domestic market may suffer if the government goes ahead and raises the sales tax in October. We would hold off upgrading Japanese stocks for the time being. At the global sector level, we pared back our defensive tilt earlier this year, after having turned more cautious last summer. We recommend that investors overweight energy and industrials. We are also warming up to financials and materials. The former will benefit from a steepening in yield curves later this year as well as from faster credit growth. The latter will gain from a more robust Chinese economy. We would maintain a neutral allocation to health care, info tech, and communication services. Real estate and utilities will both suffer once bond yields start moving higher. Classically defensive sectors such as consumer staples will also underperform. Global Bond Yields Likely To Rise Global bond yields are likely to rise over the next 12-to-18 months as growth surprises on the upside. Yields will continue rising into the first half of 2021 as inflation accelerates. Unlike in past risk-off episodes, Treasurys will not provide much of a safe haven in the lead up to the next recession. As noted above, one of the reasons that bond yields are so low today is because the term premium is very depressed. The cumulative effect of Fed bond purchases has probably depressed the term premium, but the bigger impact has stemmed from the fact that investors see Treasurys as an insurance policy against various macro risks. Investors are accustomed to thinking that when an economy slides into recession, equity prices will fall, the housing market will deteriorate, wage gains will recede, job prospects will worsen, but at least the value of their bond portfolio will go up! The problem with this reasoning is that it is only valid when the Fed is hiking rates in response to stronger growth. If the Fed is hiking rates because inflation is getting out of hand, Treasury yields could end up rising while stocks are falling. This was actually the norm between the late-1960s and early-2000s (Chart 25). Chart 25Treasury Yields Could Rise While Stocks Fall
Treasury Yields Could Rise While Stocks Fall
Treasury Yields Could Rise While Stocks Fall
If Treasurys lose their safe-haven status, the term premium will move higher. A vicious circle could develop where rising bond yields weaken the stock market, causing investors to flood out of both stocks and bonds and into cash, leading to even higher bond yields and lower equity prices. Investors should maintain a modest short duration stance towards Treasurys over the next 12 months, and then move to maximum underweight duration in mid-2020 as inflation starts to break out. Going long duration will only make sense once the Fed has raised interest rates into restrictive territory and the economy slides into recession. That is not likely to occur until the second half of 2021. Regionally, we favor European, Canadian, Australian, New Zealand, and especially Japanese government bonds over the next 12 months relative to U.S. Treasurys. The U.S. economy is at the greatest risk of overheating. In currency-hedged terms, the 10-year U.S. Treasury yield is among the lowest in the world (Table 1). Japanese 10-year bonds, for example, offer 2.72% in currency-hedged terms, while German bunds command 2.94%. Table 1Bond Markets Across The Developed World
Second Quarter 2019 Strategy Outlook: From Dead Zone To End Zone
Second Quarter 2019 Strategy Outlook: From Dead Zone To End Zone
The U.S. Dollar: Heading Towards A Soft Patch Gauging the outlook for the U.S. dollar is a bit tricky. Even though the Fed will only be raising rates gradually over the next 12 months, it will still hike more than what is discounted by markets. With most other central banks still sitting on the sidelines, short-term rate differentials are likely to move in favor of the greenback. That said, aside from Japan, stronger global growth will likely prompt investors to price in a few more rate hikes in other developed economies in 2020 and beyond. Consequently, long-term yield differentials may not widen by as much as short-term differentials. Perhaps more importantly, the U.S. dollar is a countercyclical currency, meaning that it moves in the opposite direction of global growth (Chart 26). This countercyclicality stems from the fact that the U.S. economy is more geared towards services than manufacturing compared with the rest of the world (Chart 27). As such, when global growth accelerates, capital tends to flow from the U.S. to the rest of the world, translating into more demand for foreign currency and less demand for dollars. Chart 26The Dollar Is A Countercyclical Currency
The Dollar Is A Countercyclical Currency
The Dollar Is A Countercyclical Currency
Chart 27The U.S. Is A Low-Beta Play On Global Growth
The U.S. Is A Low-Beta Play On Global Growth
The U.S. Is A Low-Beta Play On Global Growth
If global growth picks up in the back half of this year, the dollar will likely peak in the second quarter and weaken over the remainder of 2019 and into 2020. The dollar’s trajectory may thus follow a similar course to the one in 2017, a year in which the Fed raised rates four times, but the broad trade-weighted dollar nevertheless managed to weaken by 7%. Chart 28The Yen Is A Risk-Off Currency
The Yen Is A Risk-Off Currency
The Yen Is A Risk-Off Currency
As was the case in 2017, the euro will probably gain ground later this year against the U.S. dollar as will most EM and commodity currencies. However, just as the Japanese yen failed to participate in the rally that most currencies experienced against the dollar in 2017, it will struggle to gain much traction against the greenback. The yen is a “risk-off” currency and thus tends to fall whenever global risk assets rally (Chart 28). In addition, the yen will suffer if global bond yields move up relative to JGB yields later this year, as will likely be the case if the BoJ is forced to prolong its yield curve control regime in the face of tighter fiscal policy. We would go long EUR/JPY on any break below 123. After First Weakening, The Dollar Will Rally Again Late Next Year As the U.S. economy encounters ever more supply-side constraints in 2020, growth will slow and inflation will accelerate. The Fed will respond by hiking rates more quickly than inflation is rising. The resulting increase in real interest rates will put upward pressure on the dollar. In this stagflationary environment, equities will tumble and credit spreads will widen. Tighter U.S. financial conditions will reverberate around the world, causing global growth to decelerate even more than it would have otherwise. This will further turbocharge the dollar. The greenback will only peak once the Fed starts cutting rates in late-2021. Commodities: Getting More Bullish A weaker dollar later this year, along with stronger global growth led by a resurgent China, will be bullish for commodities. BCA’s commodity strategists recommend going long copper at current prices. They are also maintaining their bullish bias towards oil. They expect Brent to average $75/bbl this year and $80/bbl in 2020. Higher U.S. shale output will be offset by delays in building out deepwater export facilities, which will keep supply fairly tight. In past reports, we discussed the merits of buying gold as an inflation hedge. However, we held back from doing so because of our bullish dollar view. Now that we see the dollar peaking over the next few months, we would be buyers of gold on any break below $1275/ounce. Peter Berezin, Chief Global Strategist Global Investment Strategy peterb@bcaresearch.com Footnotes 1 Please see Global Investment Strategy Weekly Report, “Gretzky’s Doctrine,” dated March 1, 2019. 2 Please see Global Investment Strategy Weekly Report, “Low Odds Of An FCI Doom Loop,” dated January 4, 2019. 3 Please see Global Investment Strategy Weekly Report, “Is There Really Too Much Government Debt In The World?” dated February 22, 2019. Strategy & Market Trends MacroQuant Model And Current Subjective Scores
Chart 29
Tactical Trades Strategic Recommendations Closed Trades
Highlights For the Eurostoxx50 to outperform the S&P500, the big euro area banks have to outperform the big U.S. tech stocks. Tactically overweight Eurostoxx50 versus S&P500 as well as other pro-cyclical positions such as overweight EM versus DM… …but prepare to take profits in the summer months. In the medium term, the euro area versus U.S. long-bond yield spread has plenty of scope to compress from its current -180 bps… …and EUR/USD has the scope to head higher. Feature Without a shadow of a doubt, the chart that causes the greatest stir among our clients is the Chart of the Week. It shows that one of the biggest investment decisions, the choice between the euro area and U.S. equity markets, reduces to the choice between the three large euro area banks – Santander, BNP Paribas, and ING – and the three U.S. tech behemoths – Apple, Microsoft, and Google. Chart of the WeekEurostoxx50 Vs. S&P500 Is Just 3 Banks Vs. 3 Tech Stocks!
Eurostoxx50 Vs. S&P500 Is Just 3 Banks Vs. 3 Tech Stocks!
Eurostoxx50 Vs. S&P500 Is Just 3 Banks Vs. 3 Tech Stocks!
Clients are simultaneously amazed and unsettled by this manifestation of the Pareto Principle, which states that the vast majority of an effect is explained by a tiny minority of causes. Financials feature large in the Eurostoxx50 while tech giants dominate the S&P500. But the amazing thing is that almost all of the relative performance can be explained by just three stocks in each market. The vast majority of an effect is explained by a tiny minority of causes. The chart creates a cognitive dissonance. What about the things that are supposed to matter for stock market selection: relative economic growth, profits growth, margins, valuations and geopolitics? The answer is that all of these are interesting areas of study, but they are mere details in the big picture. For the Eurostoxx50 to outperform the S&P500, the big euro area banks have to outperform the big U.S. tech stocks (Chart I-2). Period. Chart 2For The Eurostoxx50 To Outperform The S&P500, Euro Area Banks Have To Outperform U.S. Tech
For The Eurostoxx50 To Outperform The S&P500, Euro Area Banks Have To Outperform U.S. Tech
For The Eurostoxx50 To Outperform The S&P500, Euro Area Banks Have To Outperform U.S. Tech
Our view is that in the immediate future this is certainly possible, but that over the long haul it will prove to be a very tall order. When The Mean Is Meaningless The structural performances of vastly different equity sectors can diverge for a very long time. How long? Japanese banks have underperformed U.S. tech for thirty years and counting! In this situation, mean-reversion and ‘standard deviations’ from the mean become meaningless concepts (Chart I-3). Chart I-3Japanese Banks Have Underperformed U.S. Tech For Thirty Years And Counting!
Japanese Banks Have Underperformed U.S. Tech For Thirty Years And Counting!
Japanese Banks Have Underperformed U.S. Tech For Thirty Years And Counting!
The statistical concept of a standard deviation is only meaningful if the underlying data is stationary, which is to say mean-reverting. If it isn’t, then it is impossible to say that a sector price or valuation is stretched either versus another sector, or versus its own history. One problem is that sector performances and valuations undergo phase-shifts when they enter a different economic climate. The structural outlook for bank profits experiences a phase-shift when a debt super-cycle ends. Therefore, comparing a bank valuation after a debt super-cycle with the valuation during a debt super-cycle is as meaningless as comparing your height as an adult to your height when you were a child! Sector performances and valuations undergo phase-shifts when they enter a different economic climate. To which, a frequent riposte is: within the same sector, euro area companies appear cheaper than their counterparts elsewhere in the world. But again, this apparent value is deceptive because it is simply an adjustment for the so-called ‘currency translation effect’ and the anticipated long-term moves in exchange rates. If investors anticipate the euro ultimately to strengthen – because they see that it is trading well below purchasing power parity – then a multinational company listed on a euro area bourse will suffer a future headwind to its mixed-currency denominated profits when they are translated back to a stronger euro. To discount this anticipated headwind, the euro area multinational must trade cheaper compared with a peer in, say, the U.S. But the cheapness is a false impression. Pulling together these complexities of sector effects, phase-shifts in sector valuations and currency effects, making the big call between Europe and America on the basis of performance or valuation mean-reversion is dangerous. Instead, we come back to the basic question: should you tilt towards euro area financials or towards U.S. tech? Own Banks For The Short Term Only Japanese financial sector profits peaked in 1990 and stand at less than half that level today. Euro area financial sector profits peaked in 2007, and are tracking the Japanese experience with a 17-year lag. If euro area financial profits continue to follow in Japan’s footsteps, expect no sustained growth through the next 17 years (Chart I-4). Chart I-4Euro Area Financial Profits Are Following Japanese Footsteps
Euro Area Financial Profits Are Following Japanese Footsteps
Euro Area Financial Profits Are Following Japanese Footsteps
In a post credit boom era, banks lose the lifeblood of their business: credit creation. This loss becomes a multi-decade headwind to financial sector profit growth and share price performance. Bank profits are dependent on two other drivers. One is operational leverage – the amount of equity held against the balance sheet. More stringent European regulation is making this a headwind too. Banks have to hold more equity capital against assets, diluting their profitability. The other driver is the net interest margin – the difference between rates received on loans and rates paid on deposits. In this regard, both fintech and the blockchain are likely to create a further headwind to bank profitability. Japan’s experience suggests that euro area financials will struggle to outperform structurally. Admittedly, U.S. tech may also face its own headwinds or phase-shift, most obviously antitrust lawsuits to counter its near-monopoly status. But even allowing for this, Japan’s experience suggests that euro area financials will struggle to outperform structurally. Rather, financials is a sector to play for outperformance phases lasting no more than a few quarters. Last autumn, we noted that short-term credit impulses in the major economies were flipping from a sharp down-oscillation into an up-oscillation phase (Chart I-5). On that basis, we recommended a tactical overweight to Eurostoxx50 versus S&P500 as well as other pro-cyclical positions such as overweight EM versus DM. Those pro-cyclical sector positions have broadly succeeded, but they are still appropriate given that up-oscillation phases very reliably last around nine months. Chart I-5Short-Term Credit Impulses Have Flipped To Up-Oscillations
Short-Term Credit Impulses Have Flipped To Up-Oscillations
Short-Term Credit Impulses Have Flipped To Up-Oscillations
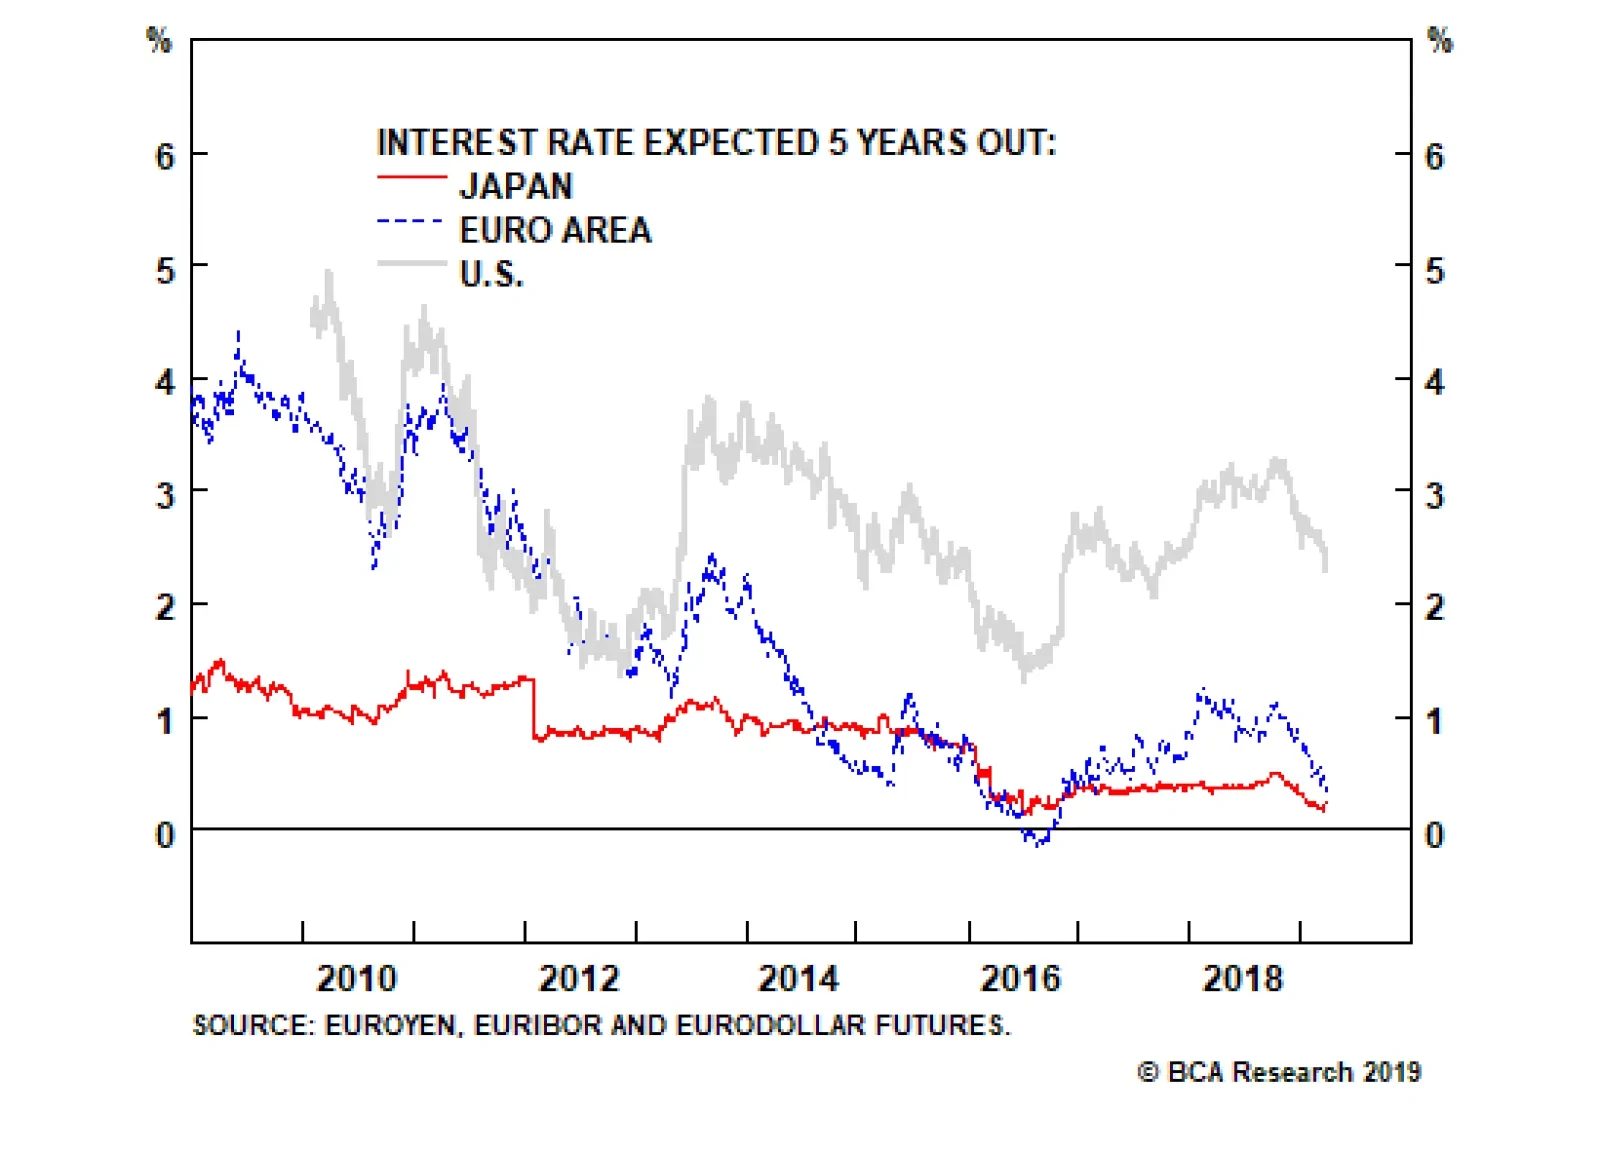
The caveat is: prepare to take profits in the summer months. The Fed Is Now At ‘Neutral’, But Where Is The ECB? Last week, the Federal Reserve confirmed that “the Federal funds rate (at 2.5 percent) is now in the broad range of estimates of neutral – the rate that tends neither to stimulate nor to restrain the economy.” This begs the question: where is the ECB policy rate (now at 0 percent) relative to its neutral? Our very high conviction view is that the ECB policy rate is well below neutral. Financials is a sector to play for outperformance phases lasting no more than a few quarters. The twenty year life of the euro captures multiple manias and crises, some centred in Europe, some in the U.S. Through these twenty years, the euro area versus U.S. long bond yield spread has averaged -50 bps1 (Chart I-6). Over this same period, the euro area versus U.S. annual inflation differential has also averaged -50 bps (Chart I-7). Ergo, the real interest rate differential has averaged zero. Meaning, the ex-post neutral real interest rates in the euro area and the U.S. have been exactly the same. Chart I-6The Euro Area Vs. U.S. Yield Spread Has Averaged -50 Bps...
The Euro Area Vs. U.S. Yield Spread Has Averaged -50 Bps...
The Euro Area Vs. U.S. Yield Spread Has Averaged -50 Bps...
Chart I-7...The Euro Area Vs. U.S. Inflation Spread Has Also Averaged -50 Bps
...The Euro Area Vs. U.S. Inflation Spread Has Also Averaged -50 Bps
...The Euro Area Vs. U.S. Inflation Spread Has Also Averaged -50 Bps
With little difference in the neutral real rates over the past two decades, is there a valid reason to expect a difference in the future? An obvious response is the fragility of the euro area’s banking system will require the ECB to persist with its zero interest rate policy for years. In Germany and France, bank lending is healthy, and could easily weather modestly tighter monetary policy. In fact, the evidence suggests that this fear is exaggerated. In Germany and France, bank lending is healthy, and could easily weather modestly tighter monetary policy (Chart I-8). The problem has been localised in Italy, where bank lending relapsed once again in 2018. Chart I-8Bank Lending Is Healthy In Germany And France
Bank Lending Is Healthy In Germany And France
Bank Lending Is Healthy In Germany And France
However, on closer examination this was a direct result of political tensions. Recently, Italian bank lending has been a very tight (inverse) function of the Italian bond yield. The BTP yield spiked last year when Rome escalated its budget spat with Brussels, and bank lending took a hard hit. But now that the Italian bond yield has retraced, lending should recover (Chart I-9). Chart I-9Italian Bank Lending Should Recover Now That The Bond Yield Has Come Down
Italian Bank Lending Should Recover Now That The Bond Yield Has Come Down
Italian Bank Lending Should Recover Now That The Bond Yield Has Come Down
The central issue is can the U.S. policy rate – which is at neutral – and the ECB policy – which is below neutral – diverge much from here? Our high conviction answer is no. Therefore, in the medium term, the euro area versus U.S. long-bond yield spread has plenty of scope to compress from its current -180 bps, one way or the other (Chart I-10). Chart I-10Can Interest Rate Expectations Diverge Much From Here?
Can Interest Rate Expectations Diverge Much From Here?
Can Interest Rate Expectations Diverge Much From Here?
It also implies that after remaining range-bound in the immediate future, EUR/USD has the scope to head higher. Dhaval Joshi, Chief European Investment Strategist dhaval@bcaresearch.com Fractal Trading System This week’s recommended trade is to go long SEK/NOK, as it is close to the limit of tight liquidity that has signaled many previous technical reversals in this currency cross. Set a profit target of 1.5 percent with a symmetrical stop-loss. In other trades, the on-going rally in government bonds caused the short position in 30-year T-bonds to hit its stop-loss. This leaves us with five open positions. Long SEK/NOK. For any investment, excessive trend following and groupthink can reach a natural point of instability, at which point the established trend is highly likely to break down with or without an external catalyst. An early warning sign is the investment’s fractal dimension approaching its natural lower bound. Encouragingly, this trigger has consistently identified countertrend moves of various magnitudes across all asset classes. Chart I-11
Long SEK/NOK
Long SEK/NOK
The post-June 9, 2016 fractal trading model rules are: When the fractal dimension approaches the lower limit after an investment has been in an established trend it is a potential trigger for a liquidity-triggered trend reversal. Therefore, open a countertrend position. The profit target is a one-third reversal of the preceding 13-week move. Apply a symmetrical stop-loss. Close the position at the profit target or stop-loss. Otherwise close the position after 13 weeks. Use the position size multiple to control risk. The position size will be smaller for more risky positions. * For more details please see the European Investment Strategy Special Report “Fractals, Liquidity & A Trading Model,” dated December 11, 2014, available at eis.bcaresearch.com Footnotes 1 Calculated from the over 10-year government bond yield: euro area average, weighted by sovereign issue size, less U.S. Fractal Trading System Recommendations Asset Allocation Equity Regional and Country Allocation Equity Sector Allocation Bond and Interest Rate Allocation Currency and Other Allocation Closed Fractal Trades Trades Closed Trades Asset Performance Currency & Bond Equity Sector Country Equity Indicators Bond Yields Chart II-1Indicators To Watch - Bond Yields
Indicators To Watch - Bond Yields
Indicators To Watch - Bond Yields
Chart II-2Indicators To Watch - Bond Yields
Indicators To Watch - Bond Yields
Indicators To Watch - Bond Yields
Chart II-3Indicators To Watch - Bond Yields
Indicators To Watch - Bond Yields
Indicators To Watch - Bond Yields
Chart II-4Indicators To Watch - Bond Yields
Indicators To Watch - Bond Yields
Indicators To Watch - Bond Yields
Interest Rate Chart II-5Indicators To Watch - Interest Rate Expectations
Indicators To Watch - Interest Rate Expectations
Indicators To Watch - Interest Rate Expectations
Chart II-6Indicators To Watch - Interest Rate Expectations
Indicators To Watch - Interest Rate Expectations
Indicators To Watch - Interest Rate Expectations
Chart II-7Indicators To Watch - Interest Rate Expectations
Indicators To Watch - Interest Rate Expectations
Indicators To Watch - Interest Rate Expectations
Chart II-8Indicators To Watch - Interest Rate Expectations
Indicators To Watch - Interest Rate Expectations
Indicators To Watch - Interest Rate Expectations
Highlights Driven by its fear that deflation is a more intractable danger than inflation, the Federal Reserve has enshrined its pause for the remainder of 2019 in order to lift inflation expectations. Since the U.S. business cycle expansion is not over, the Federal Reserve’s plan to put policy on hold this year raises the odds that the economy will overheat. Global growth is set to bottom during the second quarter in response to easier financial conditions. Accommodative policy, rebounding global economic activity and a softening dollar will boost risk asset prices during the remainder of the year. Safe-haven bonds, including Treasurys, will underperform cash over the coming 12 to 18 months. The rally in risk assets will ultimately prove the last hurrah as the Fed will resume tightening later this year or in 2020, and a bear market lies down the road. Only investors with tactical investment horizons should aggressively play this rally. Those with longer investment horizons should use this rally to lighten up their exposure to risk. Feature Introduction Following the introduction of the word “patience” into the Federal Reserve’s lexicon, a move lower in the so-called Fed dots was to be anticipated. The FOMC now expects no rate increases in 2019 and only one hike in 2020. The interest rate market remains skeptical that the Fed will be able to deliver on its forecast. For now, the OIS curve is pricing in a 75% probability of a cut this year, and rates at 1.9% by the end of 2020. With the 10-year/3-month yield curve inverting last week and the U.S. Leading Economic Indicator still decelerating, it is no wonder that investors are betting on the Fed becoming ever more dovish (Chart I-1). BCA is inclined to take the Fed at its word – the next move will be a hike, not a cut. This call rests on our view of the business cycle: The fed funds rate is still somewhat below neutral, U.S. economic activity can expand further, and global growth is likely to trough soon. The current dovish inclination of global central banks will only nurture the cycle a little bit longer. Consequently, we continue to recommend a positive stance on stocks for the coming quarters, while keeping in mind that the cycle is long in the tooth, and that beyond this last climb lies a significant bear market. The U.S. Business Cycle Has Further To Run… The Fed remains data dependent, but this now means that depressed inflation expectations in the private sector need to be vanquished before the hiking can resume (Chart I-2). With the view that low realized inflation has curtailed expectations now common across major central banks, this implies that a temporary overshoot in actual core PCE will be tolerated in order to lift expectations. Chart I-1Worrisome Signs For Growth
Worrisome Signs For Growth
Worrisome Signs For Growth
Chart I-2The Fed Wants To Lift Inflation Expectations
The Fed Wants To Lift Inflation Expectations
The Fed Wants To Lift Inflation Expectations
Since consumer prices are a lagging variable, lifting both realized and anticipated inflation will only be possible if we move ever further along the business cycle, further pressuring the economy. Our base case remains that the risk of a recession is low in 2019, and is even receding in 2020. First, U.S. credit-dependent cyclical spending currently constitutes only 25.3% of potential GDP. As Chart I-3 illustrates, this is in line with its historical average, and well below the levels recorded near the end of previous business cycles. This suggests that the amount of vulnerability caused by misallocated capital is not yet in line with previous cycles. It also indicates that the share of output generated by the sectors most sensitive to higher rates is also low. Chart I-3U.S. Cyclical Spending: Limited Signs Of Vulnerability
U.S. Cyclical Spending: Limited Signs Of Vulnerability
U.S. Cyclical Spending: Limited Signs Of Vulnerability
Second, the consumer remains in good shape. Households have deleveraged, and debt-service payments relative to disposable income are still near multi-generational lows (Chart I-4). Moreover, thanks to a saving rate of 7.6%, consumer spending is likely to move in line or even outperform income growth. On this front, the outlook is also good. As Chart I-5 demonstrates, the link between wages and salaries relative to the employment-to-population ratio for prime-age workers – a measure of labor utilization unaffected by the demographic changes that have muddied the interpretation of the unemployment rate – is still as tight as it was 20 years ago. Thus, as long as the labor market does not suddenly collapse, wage growth will continue to accelerate, supporting household income and consumption. Chart I-4Household Balance Sheets Are Solid
Household Balance Sheets Are Solid
Household Balance Sheets Are Solid
Chart I-5
Third, at 0.4% of GDP, the fiscal thrust remains positive. In other words, fiscal policy will still add to GDP in 2019. Fourth, we do not see the traditional symptoms associated with a fed funds rate above neutral. After dipping sharply in the second half of 2018, mortgage for purchase applications are back near their cycle highs (Chart I-6). Moreover, the performance of homebuilders’ equities relative to the broad market has begun to rebound, which is inconsistent with a fed funds rate above neutral. Chart I-6Mortgage Applications Do Not Suggest Policy Is Tight
Mortgage Applications Do Not Suggest Policy Is Tight
Mortgage Applications Do Not Suggest Policy Is Tight
Fifth, there is scope for the contribution from housing sector activity to morph from a negative to a positive. A fed funds rate below neutral historically is correlated with an improving housing market. Rising mortgage rates from 3.8% to 4.6% depressed home sales and construction output, and the fall in mortgage rates over the past x month 4.3% should stimulate housing activity (Chart I-7). Chart I-7Residential Activity Will Rebound This Year
Residential Activity Will Rebound This Year
Residential Activity Will Rebound This Year
Bottom Line: U.S. first-quarter GDP growth will be dismal, but one quarter does not make a trend. The low degree of economic vulnerability in the U.S., and the likelihood that the fed funds rate will stay below neutral for a while suggest that growth should rebound to the 2-2.5% range and should remain above-trend for the remainder of 2019. … And Global Growth Will Soon Trough As the cliché goes, it is darkest before the dawn. This is a fitting description of the world economy outside the U.S. right now. Global trade is depressed, global PMIs are moribund and nothing feels good. But it is exactly when nothing is going well that one needs to wonder what may cause the outlook to turn for the better. Thankfully, green shoots are emerging. To begin with, central banks around the world have taken a more dovish slant. This dovish forward guidance is nurturing global activity via a significant easing in global financial conditions, which is undoing the severe brake-pumping imposed on global growth in the fourth quarter of 2018 (Chart I-8). Chart I-8Global Financial Conditions Are Easing
Global Financial Conditions Are Easing
Global Financial Conditions Are Easing
This more dovish forward guidance has helped our Financial Liquidity Index, which sharply deteriorated through 2009, rebound. Historically, this presages an improvement in the BCA Global Leading Economic Indicator (Chart I-9). Improving liquidity conditions have already been reflected in lower real rates around the globe, creating a reflationary impulse. EM financial conditions are responding positively, pointing to an upcoming pick-up in industrial activity, as measured by our Global Nowcast (Chart I-10). Chart I-9Improving Global Liquidity Backdrop
Improving Global Liquidity Backdrop
Improving Global Liquidity Backdrop
Chart I-10A Tailwind From EM?
A Tailwind From EM?
A Tailwind From EM?
Our Global LEI diffusion Index has begun to reflect some of these developments. After forming a trough in 2018, more than 50% of the countries in our Global LEI are currently experiencing a sequential improvement in their LEIs. We are now entering the normal lag after which a broadening growth impulse converts into aggregate activity moving higher (Chart I-11). Most interestingly, investors do not seem to be anticipating such a rebound. There is therefore room for growth surprises around the world. Chart I-11Scope For Growth Surprises
Scope For Growth Surprises
Scope For Growth Surprises
China has a role to play in this story, will likely morph from a headwind to global growth to a positive. Positive may be a strong word, but at the very least, we expect China to stop detracting from global growth. Premier Li-Keqiang recently put the accent on stability and preserving employment, suggesting Chinese policymakers are likely to de-emphasize deleveraging over the coming 12-18 months. For Chinese growth to improve, deleveraging does not even have to stop. As both theory and history have shown, a slower pace of deleveraging means that the credit impulse moves back into positive territory and growth re-accelerates, even if only temporarily (Chart I-12). Chart I-12Growth Can Improve Even If Deleveraging Continues
Growth Can Improve Even If Deleveraging Continues
Growth Can Improve Even If Deleveraging Continues
As a thought experiment, if Chinese leverage were to stabilize this year and nominal growth were to hit 8% – the lower bound of the real GDP target of 6-6.5% and inflation of 2% – the Chinese credit impulse would surge to more than 10% of GDP (Chart I-13)! We are not forecasting such a large rebound in the impulse, but this exercise clearly shows that if the Chinese authorities – who are cutting taxes and trying to ease credit conditions for small- and medium-sized enterprises – want to favor stability and employment for just one year, the impact on growth will be non-negligible, even if deleveraging continues. Since domestic demand responds to the credit impulse, and imports sport an elevated beta to domestic demand, Chinese imports are likely to soon morph from a negative to something more neutral – maybe even a small positive for the rest of the world. Chart I-13A Thought Experiment
A Thought Experiment
A Thought Experiment
Finally, as weak as Europe is right now, it will likely be an important source of positive surprises in the second half of the year. To begin with, Europe is much more sensitive to EM growth conditions than the U.S. (Chart I-14). In the same way as Europe felt the full force of the deceleration in global trade last year, it will benefit from any improvement in trade this year.
Chart I-14
A myriad of idiosyncratic shocks rammed through the euro area last year, worsening an already difficult situation. The new WLTP emission standards caused German auto production to collapse by nearly 20%. Nonetheless, as contracting domestic manufacturing orders and a large inventory pullback in the final quarter of last year suggest, the inventory overhang has been worked off (Chart I-15, top panel). Chart I-15Passing European Idiosyncratic Shocks
Passing European Idiosyncratic Shocks
Passing European Idiosyncratic Shocks
Just as critically, Italy’s technical recession should end soon. The country’s economic malaise reflected the tightening in financial conditions that followed the violent battle between Rome and Brussels early last year. Ultimately, Rome folded: The budget deficit is 2.3% of GDP, not above 6%, and threats of leaving the union have been abandoned. Consequently, financial conditions are easing. Italian bond auctions are massively oversubscribed this year, and rising bond prices are supporting the solvency of the Italian banking system. The last hurdle affecting Europe was the fact that funding stress in the Italian and Spanish banking systems have been directly addressed by the TLTRO-III announced three weeks ago by the European Central Bank. Spanish and Italian banks have to refinance EUR 425 billion of TLTRO-II this June, in a year where a sizeable amounts of European bank bonds also needs to be refinanced. This is simply too much. With the ECB again bankrolling Italian and Spanish financial institutions, funding stress in the periphery can decline. Consequently, the European credit impulse, which had formed a valley in 2018 Q1, can continue its ascent (Chart I-15, bottom panel). Bottom Line: Investors expect little from the global economy outside the U.S., yet easing liquidity and financial conditions, a temporary shift in Chinese policy preferences and passing idiosyncratic shocks in Europe all point to improvement in global economic activity. U.S. Inflation Expectations Will Allow The Fed To Resume Rate Hikes Above-potential growth in the U.S. and rebounding economic activity in the rest of the world are consistent with higher – not lower – U.S. inflation. First, rebounding global growth is normally associated with a weakening dollar (Chart I-16). This time will not be different, especially as U.S. equity valuations relative to global stocks suggest that investors are particularly pessimistic on non-U.S. growth. A weaker dollar will lift import prices, commodity prices, and goods prices, helping inflation move higher. Chart I-16The USD Is Counter-Cyclical
The USD Is Counter-Cyclical
The USD Is Counter-Cyclical
Second, the change in the velocity of the money of zero maturity in the U.S. is consistent with a further strengthening in core inflation (Chart I-17). Chart I-17The Fisher Equations Points To Gently Rising Inflation
The Fisher Equations Points To Gently Rising Inflation
The Fisher Equations Points To Gently Rising Inflation
Third, above-trend U.S. growth in the context of elevated capacity utilization is also consistent with rising inflation (Chart I-18). Chart I-18Elevated U.S. Capacity Utilization
Elevated U.S. Capacity Utilization
Elevated U.S. Capacity Utilization
If these three forces can cause core PCE inflation to move slightly above 2% in the second half of 2019, this will likely result in inflation expectations firming. Moreover, the combination of positive growth surprises around the world and easy monetary and liquidity conditions will prove supportive of asset prices globally, implying further easing in global and U.S. financial conditions. This set of circumstances will allow the Fed to shift its tone toward the end of 2019, in order to crystalize additional hikes in 2020. Additionally, we estimate the U.S. terminal policy rate to be around 3.25%. In fact, a longer-than-originally-anticipated Fed pause reinforces confidence in this assessment, even if it means that it will take longer to reach the terminal level than we previously thought. Bottom Line: Our growth outlook is consistent with robust inflation and improving inflation expectations. This means we disagree with interest rate markets and anticipate the Fed will resume its hiking campaign instead of cutting rates next year. Moreover, easier-for-longer policy also strengthens our view that the fed funds rate can end this cycle near 3.25%. Stay Positive On Risk Assets For Now… Most bear markets are linked to recessions. It follows that if the U.S. business cycle can be extended and the Fed remains on the easy side of neutral for longer, then the S&P 500 has more upside (Chart I-19). So do global equities. Chart I-19Low Bear-Market Risk
Low Bear-Market Risk
Low Bear-Market Risk
This view is reinforced by the fact that buy-side analysts and investors alike have aggressively curtailed their expectations for EPS growth this year, to 3.9% for the U.S. and 4.9% outside the U.S. Yet, our profit model suggests that U.S. EPS growth is likely to come in at around 8.1% this year. Earnings revisions are pro-cyclical. Hence, our expectation that the BCA global Leading Economic Indicator meaningfully revives in the second half of 2019 points toward analysts having ample room to revise global earnings higher in the second half of the year (Chart I-20). Chart I-20Global Profit Margins Will Improve If Growth Rebounds
Global Profit Margins Will Improve If Growth Rebounds
Global Profit Margins Will Improve If Growth Rebounds
Moreover, global valuations experienced a reset last year. Despite a rebound, the forward P/E ratio for the MSCI All-Country World Index remains in line with 2014 levels, 12.5% lower than at their apex last year. When looking at the U.S., our composite valuation index has also improved meaningfully (Chart I-21). This improvement in valuations increases the probability that a bottom in global growth will lift stock prices. Chart I-21Large Improvement In The Equity / Risk Reward Ratio
Large Improvement In The Equity / Risk Reward Ratio
Large Improvement In The Equity / Risk Reward Ratio
Our Monetary Indicator further reinforces this message. After being a headwind for stocks over the past eight quarters, now that the Fed has paused and is essentially guaranteeing low real rates for an extended period, this gauge is growing more supportive of further equity price gains (Chart I-22). Chart I-22Stock-Friendly Monetary Backdrop
Stock-Friendly Monetary Backdrop
Stock-Friendly Monetary Backdrop
A below-benchmark duration exposure for fixed-income portfolio still makes sense, even if the Fed has prolonged its pause. As per our U.S. Bond Strategy service’s “Golden Rule Of Treasury Investing,” if the Fed increases rates more than the market has priced in 12 months prior, Treasurys underperform cash (Chart I-23). Even if the Fed does nothing this year, it will still be more than the OIS curve is currently pricing in. Moreover, the dollar is likely to soften and the Fed is increasingly taking the risk of falling behind the realized inflation curve. This should create upside not only for inflation breakevens but also for term premia, which are depressed everywhere across the G-10. The yield curve should modestly steepen in this environment. It may take a bit more time than we originally expected, but safe-haven bond yields are trending higher, not lower. Chart I-23The Golden Rule Of Treasury Investing
The Golden Rule Of Treasury Investing
The Golden Rule Of Treasury Investing
Spread products are also likely to continue to do well. Easy monetary policy, a soft U.S. dollar, an ongoing U.S. business expansion, an upcoming rebound in global growth and rising asset values all point toward a delay of the inevitable wave of defaults. Corporate bonds may offer poor value and credit quality has deteriorated, but an end to the business cycle and a tighter Fed will be key to catalyzing these poor fundamentals. We are not there yet. The Brexit saga continues to have the potential to unsettle markets. Nonetheless, we would fade any broad market sell-off linked to poor British headlines. As Marko Papic writes in this month's Special Report, despite continued political uncertainty in Westminster this year, the risk of a no-deal Brexit is dwindling by the minute, and political logic suggests that there is a high probability that the U.K. will ultimately remain in the EU in two to three years. Bottom Line: After the reset in valuations and earning expectations last year, markets should continue their ascent. The Fed has showed that its “put” is alive and well. This will both favor risk-taking and extend the duration of the business cycle. If global growth can rebound in the second quarter, it will create fertile ground for strong asset prices over the bulk of 2019. Treasury yields will also exhibit upside, even if achieving these higher rates will take more time now. … But Beware What Lurks Below The benign outlook for this year masks that the rally in risk assets is living on borrowed time. A Fed willingly falling behind the curve may fan speculative flames this year, but it doesn’t mean that policy will stay easy forever. On the contrary, the inevitable rise in inflation will push rates higher down the road and the unavoidable recession will ultimately materialize, most likely somewhere around 2021. Since asset valuations will only grow more inflated between now and then, a bigger fall will ultimately ensue. Our Composite Valuation Indicator may currently be flashing a positive signal, but dynamics within its components already point to brewing trouble down the road (Chart I-24). First, the balance sheet group of indicators has showed no improvement. In other words, without last year’s rebound in profitability, stocks would not be as attractively valued as the overall indicator suggests. Chart I-24Disconcerting Internal Dynamics
Disconcerting Internal Dynamics
Disconcerting Internal Dynamics
Second, the interest rate group is currently flattering aggregate valuations. To remain supportive of higher returns ahead, this group depends on interest rates staying constrained. Here, the Fed will play a particularly perverse role. Its willingness to tolerate inflationary pressures right now means lower rates today at the price of a higher cost of capital tomorrow. Once it becomes obvious that the Fed is falling behind the curve – something more likely to happen once inflation expectations normalize – safe-haven yields will rise sharply. The interest rate group will suddenly look a lot less supportive than it does today. Third, the profit components of our valuation indicator may look healthy today, but this will not remain the case. At 31.7%, EBITD margins are currently extraordinary elevated. In fact, if the profit margins were to normalize to their historical average, the Shiller P/E would skyrocket to 40.3 from 29.9 today, implying the stock market may be just as expensive as it was at the start of 2000. For margins to remain wide, wages will have to stay depressed relative to selling prices (Chart I-25). However, the combination of an economy at full employment and the Fed goosing economic growth points to rising wages. Since the pass-through from wages to prices is below 100%, unless productivity rises more than labor costs, profitability will suffer and P/E ratios will start sending the same message as the price-to-sales ratio, a multiple that currently stands near record highs. Chart I-25Rising Wages Will Ultimately Hurt Profits
Rising Wages Will Ultimately Hurt Profits
Rising Wages Will Ultimately Hurt Profits
Valuations are not the only danger lurking for stocks: Spread products will morph from a tailwind to a headwind for equities. Whether or not it steepens a bit this year, the yield curve’s previous big flattening already points toward rising financial market volatility (Chart I-26). The Fed’s recent dovish tilt can keep the VIX and the MOVE compressed for a while longer. However, since inflation expectations will ultimately move higher, likely within a year or so, the Fed will once again tilt to the hawkish side, and volatility will follow its path of least resistance higher. Carry trades of all kinds will suffer, and spreads will widen. The deteriorating credit quality this cycle, with BBB and lower-rated issues constituting 60.1% of the corporate universe, could make this widening more violent than normal. This phenomenon will hurt stocks. Chart I-26Volatility Is A Coiled Spring
Volatility Is A Coiled Spring
Volatility Is A Coiled Spring
Finally, the improvement in global growth this year is likely to prove temporary. China may want to slow the pace of deleveraging this year, but pushing debt loads lower and reforming the economy remains Beijing’s number one priority on a multi-year horizon. China has created USD 26 trillion worth of yuan since 2008, making the Chinese money supply larger than the euro area’s and the U.S.’s together. As a result, China’s incremental output-to-capital ratio continues to trend lower, implying large misallocation of capital (Chart I-27). State-owned enterprises, the recipients of much of the credit created over the past 10 years, now generate lower RoAs than their cost of borrowing, an unmistakable sign of poorly allocated funds. Chart I-27The Biggest Threat To China's Long-Term Prosperity
The Biggest Threat To China's Long-Term Prosperity
The Biggest Threat To China's Long-Term Prosperity
Correcting this structural impediment will require the Chinese credit impulse to once again move back into negative territory. This means that unless Chinese policymakers abandon their efforts to prise the country off easy credit, Chinese growth will morph back into a headwind for the world somewhere in 2020, i.e. not so late as to encourage excesses, but not so early as to sharply slow the economy ahead of the Communist Party’s one-hundredth birthday in July 2021. In 2018, the global economy nearly ground to a halt after China had shifted from stimulus to policy tightening. The next time around, we doubt that a global recession will be avoided. The second half of 2020 may set up to be one tumultuous period. Bottom Line: In all likelihood, global risk assets should perform well this year, but we are living on borrowed time. In the background, equity valuations are deteriorating meaningfully, a phenomenon that will worsen once the Fed’s desired outcome comes to fruition: higher inflation. Wage pressures and higher interest rates will reveal how fully rotten stock valuations genuinely are. Compounding this effect, higher volatility and a resumption of China’s deleveraging efforts will likely achieve the coup de grace for stocks in the second half of 2020. Conclusion The FOMC wants to lift inflation expectations in order to defuse any lingering deflationary risk. Consequently, the Fed’s pause will last longer than we originally anticipated, but terminal rates are likely to climb higher than would have otherwise been the case. Before last week’s Fed meeting, the U.S. was already set to grow above trend. Now, the Fed will only extend the business cycle further, fanning greater inflationary pressures in the process. This potentially misguided reflationary impulse, which is echoed around the world, will contribute to a rebound in global growth that will become fully evident by the summer. Consequently, we expect risk assets to climb to new highs over the coming 12 months. Treasurys will likely underperform cash over that timeframe, as interest rate markets are currently too sanguine. Investors are facing a real dilemma. On one hand, the potential for elevated stock market returns is high over the coming 12 months. On the other, poor valuations will only grow more onerous, and the Fed will ultimately have to tighten policy even more following the on-hold period. Moreover, Chinese policymakers are unlikely to ignore the pressing danger created by misallocating capital for an extended period of time. Consequently, the outlook for long-term returns is deteriorating. As a result, we recommend more tactically minded investors to stay long stocks, with a growing preference for international equities that are both cheaper and more exposed to global growth than U.S. ones. However, longer-term asset allocators should use this period of strength to progressively move out of stocks and into safer alternatives. Mathieu Savary Vice President The Bank Credit Analyst March 28, 2019 Next Report: April 25, 2019 II. The State Of Brexit So What? It makes sense for long-term investors to buy the GBP. However, short-term investors should instead buy the 2-year call while selling 3-month ones. Why? The U.K. electorate is not staunchly Euroskeptic. In fact, Bregret has already set in. Volatility is the only sure bet over the tactical and strategic time horizons. The most likely scenario is that Theresa May either resigns and is replaced by a soft-Brexit Tory, or that she agrees to a long-term extension to give the U.K. time to call a new election. Brexit is unsustainable over the secular time horizon. Our low-conviction view is that in the long term, the U.K. will remain inside the European Union. The hour is late in the ongoing Brexit saga. The original deadline, once spoken of with religious reverence, will be tossed aside for one, potentially two, extensions. In this analysis, we attempt to consider the state of Brexit from multiple time horizons. First, we offer our tactical view, what will happen in the next several weeks and months. Second, we offer our strategic view, surveying the Brexit process to the end of the year. Third, we consider the secular view and attempt to answer the question of whether the U.K. will ever fully exit the EU. We then assign investment recommendations across the three time horizons. How Did We Get Here? In March 2016, three months ahead of the fateful June referendum, BCA’s Geopolitical Strategy and European Investment Strategy published a joint report on the topic that drew three conclusions: The probability of Brexit was understated by the market. “According to our modeling results, roughly 64% of Tory undecided voters would have to swing to the “Stay” camp in order to ensure that the vote crosses the 50% threshold in favour of continued EU membership … Conventional wisdom suggests that the probability of Brexit is around 30%, anchoring to the 1975 referendum results. Our own analysis of current polling data suggests that it is much closer to 50%, as in too close to call.” The biggest loser of Brexit, domestically, would be the Conservative Party. “The risk is that the British populace realizes that leaving the EU was a sub-optimal result and that little sovereignty was recovered. As such, there could be a backlash against the Tories in the next general election. In this scenario, the winner would not necessarily be UKIP, but rather the Jeremy Corbyn-led Labour Party – as close to the Michael Foot-led opposition in the early 1980s as any Labour Leadership.” The EU would survive, intact, with no further “exits.” “European integration is therefore a gambit for relevance by Europe’s declining powers. Brexit will not create centrifugal forces that tear the EU apart, and could in fact enhance the sinews that bind EU member states in a bid for 21st century geopolitical relevance.” Thus far, all three predictions have proven prescient. Not only was the probability of Brexit understated, but the electorate actually voted to exit the EU.1 The Conservative Party has wrapped itself into an intellectual pretzel trying to deliver on a referendum that the pro-Brexit Tories – a minority in the party – promised would not mean losing access to the Common Market. And the EU has not only seen no other “exits,” but has held firm and united in the negotiations with the U.K. while witnessing an increase in the support for its troubled currency union, both in the Euro Area in aggregate as well as in crisis-ridden Italy (Chart II-1). Chart II-1The Euro Area Stands Unified
The Euro Area Stands Unified
The Euro Area Stands Unified
The net assessment we conducted in 2016 correctly gauged what the Brexit referendum was about and what it was not about. Our view was that behind the angst lay factors too general to be laid at the feet of European integration. Decades of supply-side reforms combined with competition from emerging economies led to a sharp rise in U.K. income inequality (Chart II-2), the erosion of its manufacturing economy (Chart II-3), and the ballooning of the country’s financial sector (Chart II-4). As a result, the U.K.’s income inequality and social mobility were, in 2016 as today, much closer to those of its Anglo-Saxon peer America than to those of its continental European neighbors (Chart II-5). Chart II-2Brits Saw Inequality Surge
Brits Saw Inequality Surge
Brits Saw Inequality Surge
Chart II-3Manufacturing Jobs Collapsed
Manufacturing Jobs Collapsed
Manufacturing Jobs Collapsed
Chart II-4The Financial Bubble Burst
The Financial Bubble Burst
The Financial Bubble Burst
Chart II-5
The underlying economic angst has continued to influence British politics since Brexit. Campaigning on an anti-austerity platform in the summer of 2017, the Labour Party leader Jeremy Corbyn nearly won the general election, only underperforming the Conservative vote by 2% (Chart II-6). The election was supposed to politically recapitalize Theresa May and allow her to lead the U.K. out of the EU. But the failure to secure a single-party majority created the political math in the House of Commons that is today preventing the prime minister from executing on Brexit. There are simply not enough committed Brexiters in Westminster to deliver on the relatively hard Brexit – no access to the EU Common Market or customs union – that Prime Minister May has put on offer (Chart II-7).
Chart II-6
Chart II-7
The decision not to pursue a customs union arrangement with the EU is particularly disastrous. As our colleague Dhaval Joshi – Chief Strategist of BCA’s European Investment Strategy – has pointed out, remaining in the customs union would have protected the cross-border supply chains that are vital to many U.K. businesses and would have avoided a hard customs border on the island of Ireland.2 However, the slim margin of the Tory victory in 2017 has boosted the influence of the 20-to-40 hard-Brexiters in the party. They pushed Theresa May to the extreme, where a customs union arrangement – let alone access to the Common Market – became politically unpalatable. Had the British electorate genuinely wanted “Brexit über alles,” or the relatively hard Brexit on offer today, the margin of victory for Leave would have been greater. Furthermore, the electorate would not have come so close to giving the far-left Corbyn – who nonetheless supports the softest-of-soft Brexits – a majority in mid-2017. The slim margin of victory effectively tied May’s hands in her subsequent negotiations with both the EU and her own party. But there was more to the 2016 referendum than just general malaise centered on the economy and inequality. There were idiosyncratic events that provided tailwinds for the Leave campaign. Or, as we put it in 2016: Certainly, a number of ills have befallen the continent in quick succession: the euro area sovereign debt crisis, Russian military intervention in Ukraine, rampant migrant inflows from Africa and the Middle East, and terrorist attacks in France. It is no surprise that the U.K. populace wants to think twice about tying itself even more closely to a Europe apparently on the run from the Four Horsemen of the Apocalypse. The two issues we would particularly focus on were the migrant crisis and terrorist attacks in Europe. Data ahead of the referendum clearly gave credence to the view that the influx of migrants was raising “concerns about immigration and race.” This angst was primarily focused on EU migrants who came to the U.K. legally (Chart II-8), but the influx of millions of migrants into the EU in 2015 – peaking at 172,000 in the month of October – certainly bolstered the anxiety in the U.K. (Chart II-9).3 Chart II-8EU Migrants A Source Of Anxiety In 2016
EU Migrants A Source Of Anxiety In 2016
EU Migrants A Source Of Anxiety In 2016
Chart II-9The Refugee Crisis Boosted Brexit Vote
The Refugee Crisis Boosted Brexit Vote
The Refugee Crisis Boosted Brexit Vote
Terrorism was another concern. In the 18 months preceding the referendum, continental Europe experienced 13 deadly terror attacks. Two were particularly egregious: the November 2015 Paris terror attack that led to 130 deaths, and the March 2016 Brussels terror attack that led to 32 deaths. Both the migration and terror crises, however, were temporary and caused by idiosyncratic variables with short half-lives. BCA’s Geopolitical Strategy argued that both would eventually abate. The migration crisis would subside due to firming European attitudes towards asylum seekers and the exhaustion of the supply of migrants as the Syrian Civil War drew to its tragic close. The extremist Islamic terror attacks would dwindle due to the decrease in the marginal utility of terror that has been observed in previous waves of terrorism (Chart II-10). Neither forecast was popular with our client base, but both have been spot on. Chart II-10Fewer Attacks Due To Declining Marginal Utility Of Terror
Fewer Attacks Due To Declining Marginal Utility Of Terror
Fewer Attacks Due To Declining Marginal Utility Of Terror
The point is that the British electorate was never as Euroskeptic as the Euroskeptics cheering on Brexit thought. Support for EU integration has waxed and waned for decades (Chart II-11). Instead, a combination of macro-malaise caused by the general plight of the middle class – the same factors that have given tailwinds to populist policymakers across developed markets – and idiosyncratic crises in the middle of this decade created the context in which the public voted to leave the EU. Whatever the vote was for, we can say with a high degree of certainty that it was not in favor of the current deal on offer, a relatively hard Brexit. After all, the pro-Leave Tories almost universally campaigned in favor of remaining in the Common Market post-Brexit.4 Chart II-11Data Does Not Support Euroskeptic U.K.
Data Does Not Support Euroskeptic U.K.
Data Does Not Support Euroskeptic U.K.
Today, Bregret has clearly set in. Not only on the specific issue of whether the U.K. should leave the EU – where the gap between Bremorseful voters and committed Brexiters is now 8% (Chart II-12), a 12% swing since just after the referendum – but also on the more existential question of whether U.K. citizens feel European (Chart II-13). Chart II-12Bregret Has Set In...
Bregret Has Set In...
Bregret Has Set In...
Chart II-13...And Brits Feeling More European
...And Brits Feeling More European
...And Brits Feeling More European
The political reality of Bregret is the most important variable in predicting Brexit. Not only is it difficult for Prime Minister May to deliver her relatively hard Brexit in Westminster due to the mid-2017 electoral math, but it is especially the case when the electorate does not want it. Yes, the mid-2016 referendum is an expression of a democratic will that must be respected. But no policymaker wants to respect the referendum at the cost of disrespecting the current disposition of the median voter, which is revealed through polls. Doing so will cost them in the next election. Reviewing “how we got here” is essential in forecasting the tactical, strategic, and secular time horizons in the ongoing Brexit imbroglio. To this task we now turn. Bottom Line: The U.K. electorate is not staunchly Euroskeptic: data clearly support this fact. The Brexit referendum simply came at the right time for the Leave vote, as the secular forces of middle-class discontent combined with idiosyncratic crises of migration and terror. Three years following the referendum, the discontent remains unaddressed by British policymakers while the idiosyncratic crises have abated. As such, Bregret has set in, creating a new reality that U.K. policymakers must respond to if they want to retain political capital. Where Are We Going? The Tactical And Strategic Time Horizons The EU has offered a two-step delay to the Article 50 deadline of March 29. The first option is a delay until May 22, but only if Theresa May successfully passes her Brexit plan through Westminster. The second option is a delay until April 12. This would come in effect if the House of Commons rejects the deal on offer. The short time frame is supposed to pressure London to come up with the next steps, which the EU has inferred would either be to get out of the bloc without a deal or to plan for a long-term extension. Although there are no official conditions to awarding a long-term extension, it is clear that the EU only envisages three options: Renegotiate the terms of Brexit, to include either a customs union or full Common Market membership (a softer Brexit); Hold a general election to break the impasse; Hold another referendum. The EU is suggesting that it could deny the U.K. an extension if London does not come back with a plan. There are two reasons why we would call the EU’s bluff. First, it is likely an attempt to help May get the deal through the House of Commons by creating a sense of urgency. Second, the European Court of Justice (ECJ) ruled in December 2018 that the U.K. could “revoke that notification unilaterally, in an unequivocal and unconditional manner, by a notice addressed to the European Council in writing.”5 The only requirement is that the notification be sent to Brussels prior to March 29 (or, in the case of a mutually agreed upon extension, prior to April 12). It is increasingly likely that, after the deal on offer fails, Theresa May will have to go “hat-in-hand” to the EU to ask for a much longer extension. She will have until April 12 to ask for that extension, but it would require participation in the European Parliamentary (EP) elections on May 23. Prime Minister May has said that the U.K. will not hold those elections. We beg to differ. Not holding the election would allow the EU to end the U.K.’s membership in the bloc, which would by default mean contravening the Parliament’s will to reject a no-deal Brexit (which it did in a rebuke to the government in March). As such, the U.K. will absolutely hold an EP election in May. Yes, it will be a huge embarrassment to the Conservative government. And we would venture that the election would turn out a huge pro-EU majority from the U.K., given that it is the Europhile side of the aisle that is now excited and activated, further embarrassing the ruling government. The most likely scenario, therefore, is that Theresa May either resigns and is replaced by a soft-Brexit Tory, or that she agrees to a long-term extension to give the U.K. time to call a new election. As we have been arguing throughout the year, the only way to break the impasse without calling a referendum – is to call a new election. A new election would be contested almost exclusively on the issue of Brexit – unlike the 2017 election, which Jeremy Corbyn managed to be almost exclusively contested on the issue of austerity. As such, the winner would have a clear political mandate to pursue the Brexit of their choice. If it is Jeremy Corbyn, this would mean a second referendum, given his recent conversion to supporting one. If Theresa May remains prime minister, it would be her relatively hard Brexit option; if another Tory replaces her, it would potentially be a softer Brexit. Intriguingly, Theresa May is coming up to the average “expiry date” of a “takeover” prime minister, which is 3.3 years (Chart II-14).
Chart II-14
Why do we think that Theresa May would be replaced with a soft Brexit Tory? Because there are simply not enough members of parliament in the Conservative Party caucus to elect a hard Brexiteer. Furthermore, the current deal on offer, which is a form of hard Brexit, clearly has no chance of passing in the House of Commons. Theresa May herself did not support the Leave campaign, but she converted into a hard Brexiteer due to the pressures in the Conservative Party caucus. If, on the other hand, we are wrong and the Conservative Party elects a hard Brexit Tory as leader, the odds of losing the election to the Labour Party would increase. Furthermore, the impasse in the House of Commons would not be resolved as Theresa May would be replaced by a prime minister with essentially the same approach to Brexit. Confused? You are not alone. Diagram II-1 illustrates the complexity of the tactical (0-3 months) and strategic (3-12 months) time horizons. There are so many options over the next six months alone that we ran out of space in our diagram to consider the consequences of the general election.
Chart II-
Needless to say, an election would induce volatility in the market as it would put Jeremy Corbyn close to the premiership. While he has now promised a second referendum, his government would also implement policies that could, especially in the short term, agitate the markets. Our forecasts of the currency moves alone suggest that volatility is the only sure bet over tactical and strategic time horizons. We do not have a high-conviction view on a directional call on the pound or U.K. equities. However, global growth concerns, combined with political uncertainty, should create a bond-bullish environment. Bottom Line: Over the course of the year, political uncertainty will remain high in the United Kingdom. A general election is the clearest path to breaking the current deadlock. However, it is not guaranteed, as Labour’s recent decline in the polls appears to be reversing since Jeremy Corbyn finally succumbed to the demands that he support a new referendum (Chart II-15). Chart II-15Labour Party Revives On Referendum Support
Labour Party Revives On Referendum Support
Labour Party Revives On Referendum Support
The Secular Horizon BCA Geopolitical Strategy believes that the median voter is the price maker in the political market place. Politicians are merely price takers. This is why Theresa May’s notion that the sanctity of the 2016 referendum cannot be abrogated is doubly false. First, she cannot truly claim from the slim 52%-48% result that U.K. voters want her form of Brexit. The referendum therefore may be a sacred expression of the democratic will, but her “no customs union” Brexit option is not holy water: It is an educated guess at best, pandering to hard Brexit Tories (a minority of the electorate) at worst. Given that 48% of the electorate wanted to remain in the EU and that a large portion of Brexit voters wanted a Common Market membership as part of Brexit, it is mathematically obvious that the softest of soft Brexit options was the desire of the median voter in June 2016. Furthermore, polling data (presented in Chart II-12 and Chart II-13 on page 28) now clearly show that the median voter is migrating away from even the softest of soft Brexit options to the “Stay” camp. Bregret has set in and a strong plurality of voters no longer supports Brexit. The question behind Chart II-12 is unambiguous. It clearly asks, “In hindsight, do you think Britain was right or wrong to vote to leave the EU?” What does all of this infer for the long term, or secular, horizon? First, an election this year could usher in a Labour government that delivers a new referendum. At this time, given the polling data and the geopolitical context, sans terror and migration crises, we would expect such a referendum to lead to a win for the Stay camp. Second, an election that produces a soft Brexit prime minister or negotiated outcome would allow the U.K. to leave the EU in an orderly fashion. A new Tory prime minister, pursuing a soft Brexit outcome, could even entice some Labour MPs to cross the aisle and support such an exit from the bloc. However, over a secular time horizon of the next two-to-three years, we doubt that a soft Brexit outcome would be viable. Investors have to realize that the vote on leaving the EU does not conclude the U.K. long-term deal with the bloc. That negotiating phase will last during the transition phase, over the next two-to-three years, and would conclude in yet another Westminster vote – and likely crisis – at the end of the period. If this deal entails membership in the Common Market, our low- conviction view over the long term is that it will ultimately fail. Take the financial community’s preferred soft Brexit option, the so-called super soft “Norway Plus” option. A Norway Plus option would entail the highest loss of sovereignty imaginable, given that the U.K. would essentially pay full EU membership fees with no ability to influence the regulatory policies that London would have to abide by. There is also a debate as to whether London would be able to constrict immigration from the EU under that option over the long term, a key demand of Brexiters.6 As such, the only viable option would be to switch to a customs union relationship. However, we fear that even this option may no longer be available to U.K. policymakers. Conservative Party leaders have wasted too much time and lost too much of the public’s good will. With only 40% of the electorate now considering Brexit the correct decision, it is possible that even a customs union arrangement will be unacceptable by the end of the transition period. Aside from the electorate’s growing Bregret, there is also the economic logic – or lack thereof – behind a customs union. A customs union would ensure the unfettered transit of goods between the U.K. and the continent, but not of services. This arrangement greatly favors the EU, not the U.K., as the latter has a wide (and growing) deficit in goods and an expanding surplus in services with the bloc (Chart II-16). Chart II-16Services Are Key For The U.K.
Services Are Key For The U.K.
Services Are Key For The U.K.
The only logic behind selecting a customs union over the Common Market is that a customs union would allow the U.K. to conclude separate trade deals with the rest of the world. While that may be a fantasy of the few remaining laissez-faire free traders in the U.K. Conservative Party, the view hardly represents the desire of the median voter. Other than a potential trade deal with the U.S., it is practically inconceivable to expect the U.K. electorate to support a free trade agreement with China or India, both of which would likely entail an even greater loss of blue-collar jobs. Even a trade deal with the U.S. would likely face political opposition, given that the U.K. is highly unlikely to be given preferential treatment by an economy seven times its size.7 The fact of the matter is that the Conservative Party has wasted its window of opportunity to push a hard, or moderately hard (customs union), Brexit through Parliament. Bregret has set in, as the doyens of Brexit increasingly pursued an unpopular strategy. On the other hand, a Brexit that retains the U.K. membership in the Common Market has never had much logic to begin with. Where does this leave the U.K. in the long term? Given the time horizon and the uncertainty on multiple fronts, our low-conviction view is that it leaves the U.K. inside the European Union. Bottom Line: The combination of increasing Bregret, lack of economic logic behind a customs union membership alone, and the lack of a political logic behind a Common Market membership, suggests that Brexit is unsustainable over the secular time horizon. This imperils the ultimate deal between the U.K. and the EU, which we think will not be able to pass the House of Commons in two-to-three years when it comes up for approval. This is a low-conviction view, however, as political realities can change. Support for Brexit could turn due to exogenous factors, such as a global recession that renews the Euro Area economic imbroglio or a major geopolitical crisis. Both are quite likely over the secular time horizon. Investment Implications Today, cable is cheap, trading at an 18% discount to its long-term fair value as implied by purchasing-power parity models (Chart II-17). The growing probability that the U.K. may, down the road, remain in the European Union means that, at current levels the pound is indeed attractive, especially against the U.S. dollar. Chart II-17Cable Attractive On Higher Odds Of Bremain
Cable Attractive On Higher Odds Of Bremain
Cable Attractive On Higher Odds Of Bremain
However, when it comes to short-term dynamics, the picture is much murkier. The low probability of a no-deal Brexit implies limited downside. However, the path to get the U.K. to abandon the current relatively hard Brexit is also one that involves a new election. This implies that before a resolution is reached, multiple scenarios are possible, including one where Corbyn becomes the next prime minister. Jeremy Corbyn could be the most left-of center leader of any G-10 nation since Francois Mitterrand in France in the early 1980s. Mitterrand’s audacious nationalization and left-leaning policies were met with a collapse in the French franc (Chart II-18). Chart II-18A Left-Wing Leader Bodes Ill For The Currency
A Left-Wing Leader Bodes Ill For The Currency
A Left-Wing Leader Bodes Ill For The Currency
Global growth also has an impact on cable. Despite all the noise around Brexit, the reality remains that exports constitute 30% of U.K. GDP, a larger contribution to output than in the euro area. This means that if global growth deteriorates, GBP/USD will face another headwind. If, however, global growth improves, then cable would face a new tailwind. Since BCA is of the view that global growth will likely trough by the summer, we are inclined to be positive on the pound. Netting out all those factors, it makes sense for long-term investors to buy the GBP, using the dips along the way to build a larger position in this currency. Even on a six-to-twelve-month basis, the path of least resistance for cable is likely upward. The problem is that risk-adjusted returns are likely to be poor as volatility will remain very elevated. We therefore recommend that short-term investors instead buy the 2-year call while selling 3-month ones (Chart II-19). Chart II-19Volatility Will Be A Challenge For Short Term Investors
Volatility Will Be A Challenge For Short Term Investors
Volatility Will Be A Challenge For Short Term Investors
Marko Papic Senior Vice President Chief Geopolitical Strategist Mathieu Savary Vice President The Bank Credit Analyst III. Indicators And Reference Charts Equities have had a volatile month of March, something that was bound to happen after the violent rally witnessed from the end of December to the end of February. When a rally is being tested, it always make sense to review our indicators to gauge whether or not a trend change is in the offing. Generally, our indicators remain broadly positive. Our Willingness-to-Pay (WTP) indicators for the U.S. and the euro area continue to improve. Meanwhile, it has begun to hook back up in Japan. The WTP indicators track flows, and thus provide information on what investors are actually doing, as opposed to sentiment indexes that track how investors are feeling. The current readings in major advanced economies thus suggest that investors are still inclined to add to their stock holdings. Our Revealed Preference Indicator (RPI) has however once again deteriorated, suggesting that the period of churn in global equities prices could last a bit longer. This indicator is essentially saying that in order to resume their ascent, stocks need a bit more time to digest their previous surge. The RPI combines the idea of market momentum with valuation and policy measures. It provides a powerful bullish signal if positive market momentum lines up with constructive signals from the policy and valuation measures. Conversely, if constructive market momentum is not supported by valuation and policy, investors should lean against the market trend. According to BCA’s Composite Valuation Indicator, an amalgamation of 11 measures, the U.S. stock market remains slightly overvalued from a long-term perspective. Nonetheless, despite this year’s rally, the S&P 500 offers a much more attractive risk/reward profile than it did in the fall. Moreover, our Monetary Indicator has shifted out of negative territory for stocks, and is now decisively in stimulative territory. The Fed’s dovish forward guidance last week only reinforces the message from this indicator. Our Composite Technical Indicator for stocks had broken down in December, but it is finally flashing a buy signal. This further confirms that the current period of churn is most likely to ultimately make way for a continued rally in the S&P 500. The 10-year Treasury yield remains within its neutral range according to our valuation model. Moreover, our technical indicator flags a similar picture. This means that without signs of improvements in global growth, price action alone will not be enough to lift bond yields higher. That being said, since BCA expects that over the next 24 months, the Fed will lift rates more than the OIS curve anticipates, and since the term premium is incredibly low, once green shoots for global growth become evident, bonds could suffer a violent selloff. The U.S. dollar is still very expensive on a PPP basis. Our Composite Technical Indicator is not as overbought as it once was, but it is far from having reached oversold levels either. This combination suggests that the greenback could experience further downside this year. However, for this downside to materialize, global growth will first have to stabilize. EQUITIES: Chart III-1U.S. Equity Indicators
U.S. Equity Indicators
U.S. Equity Indicators
Chart III-2Willingness To Pay For Risk
Willingness To Pay For Risk
Willingness To Pay For Risk
Chart III-3U.S. Equity Sentiment Indicators
U.S. Equity Sentiment Indicators
U.S. Equity Sentiment Indicators
Chart III-4Revealed Preference Indicator
Revealed Preference Indicator
Revealed Preference Indicator
Chart III-5U.S. Stock Market Valuation
U.S. Stock Market Valuation
U.S. Stock Market Valuation
Chart III-6U.S. Earnings
U.S. Earnings
U.S. Earnings
Chart III-7Global Stock Market And Earnings: Relative Performance
Global Stock Market And Earnings: Relative Performance
Global Stock Market And Earnings: Relative Performance
Chart III-8Global Stock Market And Earnings: Relative Performance
Global Stock Market And Earnings: Relative Performance
Global Stock Market And Earnings: Relative Performance
FIXED INCOME: Chart III-9U.S. Treasurys And Valuations
U.S. Treasurys And Valuations
U.S. Treasurys And Valuations
Chart III-10Yield Curve Slopes
Yield Curve Slopes
Yield Curve Slopes
Chart III-11Selected U.S. Bond Yields
Selected U.S. Bond Yields
Selected U.S. Bond Yields
Chart III-1210-Year Treasury Yield Components
10-Year Treasury Yield Components
10-Year Treasury Yield Components
Chart III-13U.S. Corporate Bonds And Health Monitor
U.S. Corporate Bonds And Health Monitor
U.S. Corporate Bonds And Health Monitor
Chart III-14Global Bonds: Developed Markets
Global Bonds: Developed Markets
Global Bonds: Developed Markets
Chart III-15Global Bonds: Emerging Markets
Global Bonds: Emerging Markets
Global Bonds: Emerging Markets
CURRENCIES: Chart III-16U.S. Dollar And PPP
U.S. Dollar And PPP
U.S. Dollar And PPP
Chart III-17U.S. Dollar And Indicator
U.S. Dollar And Indicator
U.S. Dollar And Indicator
Chart III-18U.S. Dollar Fundamentals
U.S. Dollar Fundamentals
U.S. Dollar Fundamentals
Chart III-19Japanese Yen Technicals
Japanese Yen Technicals
Japanese Yen Technicals
Chart III-20Euro Technicals
Euro Technicals
Euro Technicals
Chart III-21Euro/Yen Technicals
Euro/Yen Technicals
Euro/Yen Technicals
Chart III-22Euro/Pound Technicals
Euro/Pound Technicals
Euro/Pound Technicals
COMMODITIES: Chart III-23Broad Commodity Indicators
Broad Commodity Indicators
Broad Commodity Indicators
Chart III-24Commodity Prices
Commodity Prices
Commodity Prices
Chart III-25Commodity Prices
Commodity Prices
Commodity Prices
Chart III-26Commodity Sentiment
Commodity Sentiment
Commodity Sentiment
Chart III-27Speculative Positioning
Speculative Positioning
Speculative Positioning
ECONOMY: Chart III-28U.S. And Global Macro Backdrop
U.S. And Global Macro Backdrop
U.S. And Global Macro Backdrop
Chart III-29U.S. Macro Snapshot
U.S. Macro Snapshot
U.S. Macro Snapshot
Chart III-30U.S. Growth Outlook
U.S. Growth Outlook
U.S. Growth Outlook
Chart III-31U.S. Cyclical Spending
U.S. Cyclical Spending
U.S. Cyclical Spending
Chart III-32U.S. Labor Market
U.S. Labor Market
U.S. Labor Market
Chart III-33U.S. Consumption
U.S. Consumption
U.S. Consumption
Chart III-34U.S. Housing
U.S. Housing
U.S. Housing
Chart III-35U.S. Debt And Deleveraging
U.S. Debt And Deleveraging
U.S. Debt And Deleveraging
Chart III-36U.S. Financial Conditions
U.S. Financial Conditions
U.S. Financial Conditions
Chart III-37Global Economic Snapshot: Europe
Global Economic Snapshot: Europe
Global Economic Snapshot: Europe
Chart III-38Global Economic Snapshot: China
Global Economic Snapshot: China
Global Economic Snapshot: China
Mathieu Savary Vice President The Bank Credit Analyst Footnotes 1 At the time of publication of our March report, we still had a low-conviction view that the vote would swing towards Stay at the last moment. 2 Please see BCA Research European Investment Strategy Weekly Report, “Important Message From The Currency Markets,” dated March 14, 2019, available at eis.bcaresearch.com. 3 Trying to play up the threat of unchecked migration, the U.K. Independence Party ran a famous campaign poster showing hundreds of refugees on a road under the title of “Breaking Point – The EU has failed us all.” Despite the fact that the U.K. accepted only around 10,000 Syrian refugees since the 2015 crisis. Germany has accepted over 700,000 while Canada – which is located across the Atlantic Ocean on a different continent – accepted over 40,000. Even the impoverished Serbia has accepted more Syrian refugees than the U.K. 4 One of the most prominent Leave supporters, Boris Johnson, famously quipped after the referendum result that “There will continue to be free trade and access to the single market.” 5 Please see The European Court of Justice, “Judgement Of The Court,” In Case C-621/18, dated December 10, 2018, available at curia.europa.eu. 6 Proponents of the Norway Plus option point out that Article 112(1) of the European Economic Area (EEA) Agreement allows for restriction of movement of people within the area. However, these restrictions are intended to be used in times of “serious economic, societal or environmental difficulties.” It certainly appears to be an option for London to restrict EU migration, but it is not clear whether Europe would agree for this to be a permanent solution. Liechtenstein has been using Article 112 to impose quantitative limitations on immigration for decades, but that is because its tiny geographical area is recognized as a “specific situation” that justifies such restrictions. 7 President Donald Trump may want to give the U.K. preferential trade terms on the basis of the filial Anglo-Saxon relationship alone, but it is highly unlikely that the increasingly protectionist Congress would do the same. There is also no guarantee that President Trump will be around to bring such trade negotiations across the finish line. EQUITIES:FIXED INCOME:CURRENCIES:COMMODITIES:ECONOMY:
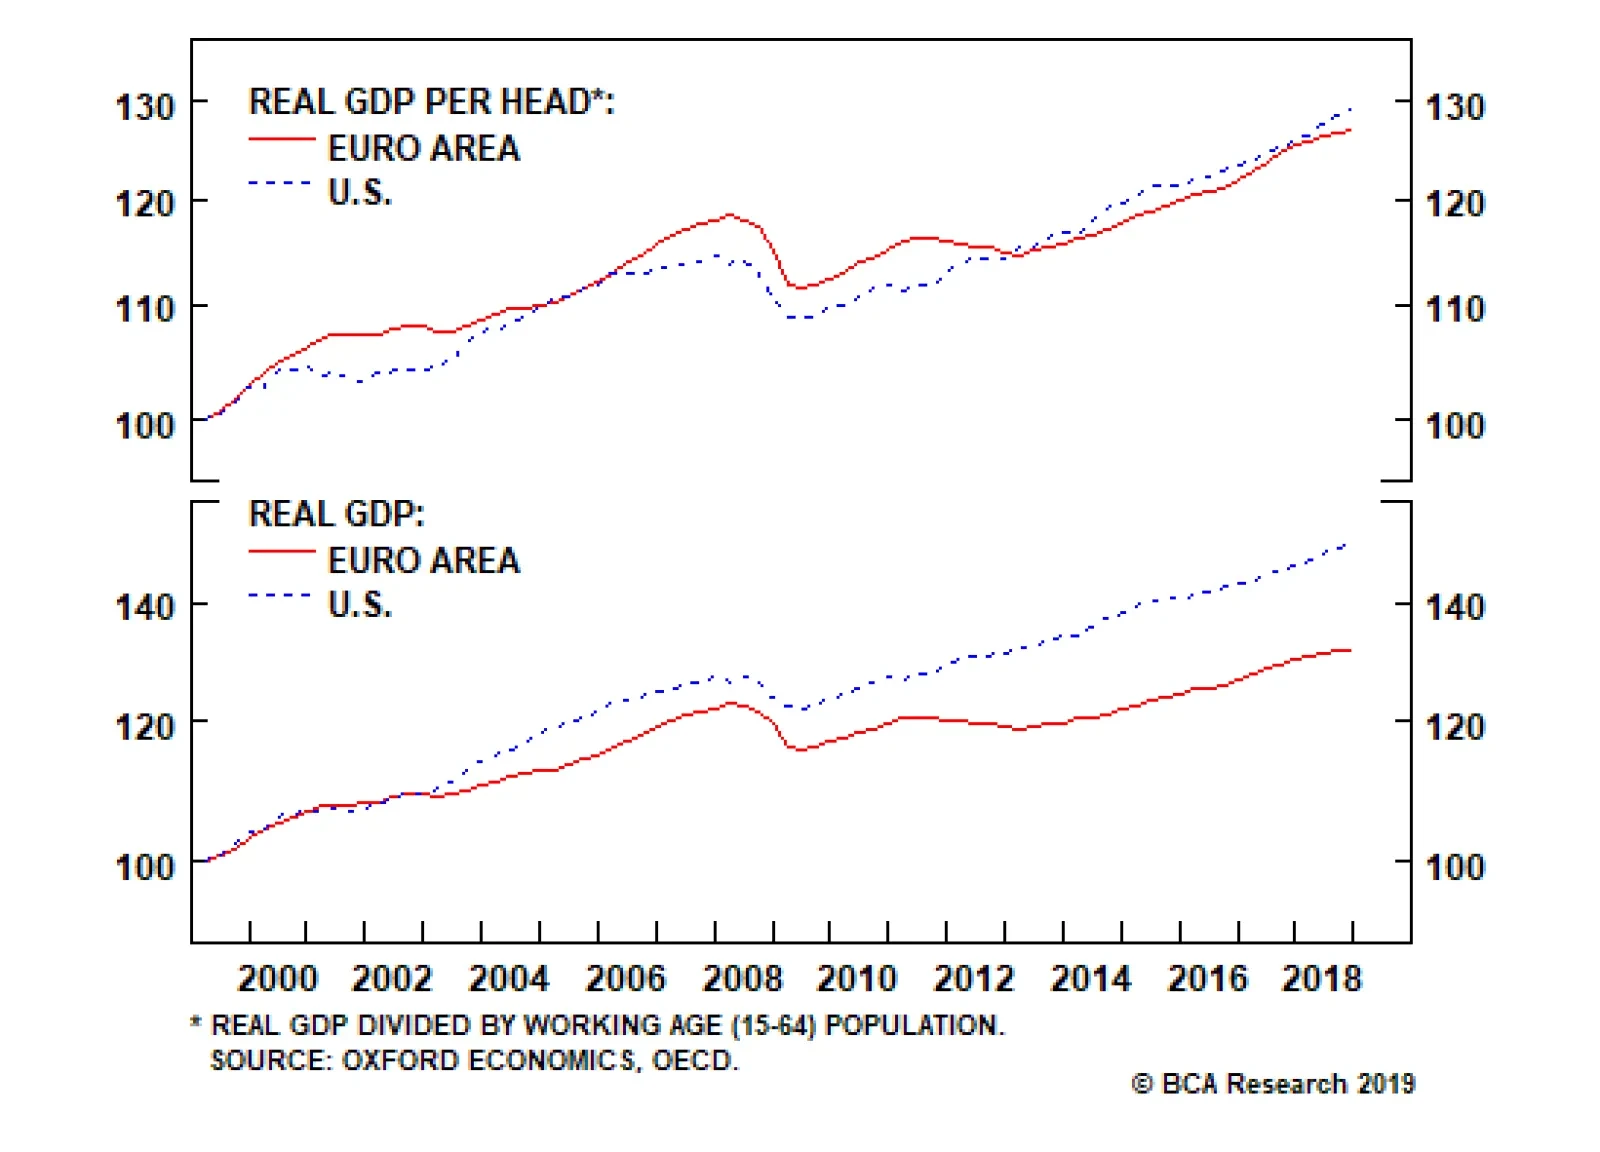
Here’s a simple way to grasp this crucial point: a 1.5 percent growth rate would be a very pleasing outcome for Europe, it would be a very unpleasing outcome for the U.S., and it would be a catastrophic outcome for China. The reason is that if a population…
Highlights Global equities will remain rangebound for the next month or so, but should move decisively higher as economic green shoots emerge in the spring. A revival in global growth will cause the recent rally in the U.S. dollar to stall out and reverse direction, setting the stage for a period of dollar weakness that could last until the second half of next year. Rising inflation will force the Fed to turn considerably more hawkish in late-2020 or early-2021. This will cause the dollar to surge once more. The combination of a stronger dollar and higher interest rates will trigger a recession in the U.S. in 2021, which will spread to the rest of the world. Investors should maintain a bullish stance towards global equities for the next 12 months, but look to reduce exposure at some point next year. Feature Stocks Temporarily Stuck In The Choppy Trading Range We argued at the end of February that global equities and other risk assets would likely enter a choppy trading range in March as investors nervously awaited the economic data to improve.1 Recent market action has been consistent with this thesis, with the MSCI All-Country World Index falling nearly 3% at the start of the month, only to recoup its losses over the past few days. We expect stocks to remain in a holding pattern over the coming weeks, as investors look for more evidence that global growth is bottoming out. The U.S. dollar is a countercyclical currency, meaning that it moves in the opposite direction of global growth (Chart 1). This countercyclicality stems from the fact that the U.S. economy is more geared towards services than manufacturing compared with the rest of the world. This makes the U.S. a low-beta play on global growth (Chart 2). As such, when global growth accelerates, capital tends to flow from the U.S. to the rest of the world, translating into more demand for foreign currency and less demand for dollars. Chart 1The Dollar Is A Countercyclical Currency
The Dollar Is A Countercyclical Currency
The Dollar Is A Countercyclical Currency
Chart 2The U.S. Is A Low-Beta Play On Global Growth
The U.S. Is A Low-Beta Play On Global Growth
The U.S. Is A Low-Beta Play On Global Growth
Given the dollar’s countercyclical nature, it is not surprising that the slowdown in global growth over the past 12 months has given the greenback a lift. The broad trade-weighted dollar has strengthened by almost 8% since February 2018, putting it near the top of its post 2015-range (Chart 3). Chart 3The Dollar Has Gotten A Lift From Global Growth Disappointments
The Dollar Has Gotten A Lift From Global Growth Disappointments
The Dollar Has Gotten A Lift From Global Growth Disappointments
Stocks Will Rally And The Dollar Will Weaken Starting In The Spring We expect the U.S. dollar to strengthen over the coming weeks as global economic data continues to underwhelm. However, an improvement in leading economic indicators in the spring will set the stage for a reacceleration in global growth and a decline in the dollar in the second half of this year. The combination of stronger growth and a weaker dollar later this year should be highly supportive of global equities. Equity investors with a 12-month horizon should overlook any near-term weakness and maintain a bullish bias towards stocks. We do not have a strong view on U.S. versus international equities at the moment, but expect to upgrade the latter once we see more confirmatory evidence that global growth is bottoming out. Equity investors with a 12-month horizon should overlook any near-term weakness and maintain a bullish bias towards stocks. A Stronger China Will Lead To A Weaker Dollar Our expectation that the dollar will weaken in the second half of this year hinges on what happens to China. The deceleration in global growth in 2018 was largely the consequence of China’s deleveraging campaign. China’s slowdown led to a falloff in capital spending throughout the world. Weaker Chinese growth also put downward pressure on the yuan, pulling other EM currencies lower with it (Chart 4). All this occurred alongside an escalation in trade tensions, further dampening business sentiment. Chart 4EM Currencies Are Off Their Early 2018 Highs
EM Currencies Are Off Their Early 2018 Highs
EM Currencies Are Off Their Early 2018 Highs
While it is too early to signal the all-clear on the trade front, the news of late has been encouraging. A recent Bloomberg story described how Trump watched approvingly as Asian stocks rose and U.S. futures rallied following his decision to delay the scheduled increase in tariffs on Chinese goods.2 As a self-professed master negotiator, Trump needs to secure a deal with China before next year‘s presidential election, while also convincing American voters that the deal was concluded on favorable terms for the United States. Reaching a deal with China early on in his term would have been risky if the agreement had failed to bring down the bilateral trade deficit — an entirely likely outcome given how pro-cyclical U.S. fiscal policy currently is. At this point, however, Trump can crow about making a great deal with China while reassuring voters that the product of his brilliance will be realized after he has been re-elected. This means that we are entering a window over the next 12 months where Trump will want to strike a deal. For their part, the Chinese want as much negotiating leverage with the Trump administration as they can muster. This means being able to convincingly demonstrate that their economy is strong enough to handle the repercussions from turning down a trade deal that fails to serve their interests. Since the credit cycle is the dominant driver of Chinese growth, this requires putting the deleveraging campaign on the backburner. Admittedly, credit growth surprised on the downside in February. However, this followed January’s strong showing. Averaging out the two months, credit growth appears to be stabilizing on a year-over-year basis. Conceptually, it is the change in credit growth that correlates with GDP growth.3 Thus, merely going from last year’s pattern of falling credit growth to stable credit growth would still imply a positive credit impulse and hence, an uptick in GDP growth. In practice, we suspect that the Chinese authorities will prefer that credit growth not only stabilize but increase modestly. In the past, this outcome has transpired whenever credit growth has fallen towards nominal GDP growth (Chart 5). The prospect of a rebound in credit growth in March was hinted at by the PBOC, which spun the weak February data as being caused by “seasonal factors.” Chart 5Historically, China Has Scaled Back On Deleveraging When Credit Growth Has Fallen Close To Nominal GDP Growth
Historically, China Has Scaled Back On Deleveraging When Credit Growth Has Fallen Close To Nominal GDP Growth
Historically, China Has Scaled Back On Deleveraging When Credit Growth Has Fallen Close To Nominal GDP Growth
Europe: Down But Not Out Stronger growth in China will help European exporters. Euro area domestic demand will also benefit from a rebound in German automobile production, the winding down of the “yellow vest” protests in France, and incrementally easier fiscal policy. In addition, the ECB’s new TLTRO facility should support credit formation, particularly in Italy where the banks remain heavily reliant on ECB funding. Our expectation that the dollar will weaken in the second half of this year hinges on what happens to China. Euro area financial conditions have eased significantly over the past three months, which bodes well for growth in the remainder of the year. It is encouraging that the composite euro area PMI has rebounded to a three-month high. The expectations component of the euro area confidence index has also moved up relative to the current situation component, which suggests further upside for the PMI in the coming months (Chart 6). Chart 6Easing Financial Conditions Bode Well For Euro Area Growth
Easing Financial Conditions Bode Well For Euro Area Growth
Easing Financial Conditions Bode Well For Euro Area Growth
The selloff in EUR/USD since last March has been largely driven by a decline in euro area interest rate expectations (Chart 7). If euro area growth accelerates in the back half of the year, the market will probably price back in a few rate hikes in 2020 and beyond. Chart 7EUR/USD Sell-Off Has Been Driven By Falling European Rate Expectations
EUR/USD Sell-Off Has Been Driven By Falling European Rate Expectations
EUR/USD Sell-Off Has Been Driven By Falling European Rate Expectations
What Will The Fed Do? Of course, the degree to which a steeper Eonia curve benefits EUR/USD will depend on what the Fed does. The 24-month discounter has fallen from over +100 bps in March 2018 to -25 bps today, implying that investors now believe that U.S. short rates will fall over the next two years (Chart 8). Chart 8The Fed's Dovish Messaging Has Worked... Almost Too Well
The Fed's Dovish Messaging Has Worked... Almost Too Well
The Fed's Dovish Messaging Has Worked... Almost Too Well
We expect the Fed to raise rates more than what is currently priced into the curve, thus justifying a short duration position in fixed-income portfolios. However, the Fed’s newfound “baby step” philosophy will probably translate into only two hikes over the next 12 months. Such a gradual pace of Fed rate hikes is unlikely to prevent the euro from appreciating against the dollar starting in the middle of this year, especially in the context of a resurgent global economy. We do not expect any major inflationary pressures to emerge in the near term. In contrast to the euro, the yen should depreciate against the dollar in the back half of this year. The yen is a “risk-off” currency and thus tends to weaken whenever global risk assets rally (Chart 9). The government is also about to raise the sales tax again in October, a completely unnecessary step that will only hurt domestic demand and force the Bank of Japan to prolong its yield curve control regime. We would go long EUR/JPY on any break below 123. Chart 9The Yen Is A Risk-Off Currency
The Yen Is A Risk-Off Currency
The Yen Is A Risk-Off Currency
A Blow-Off Rally In The Dollar Starting In Late-2020 What could really light a fire under the dollar is if the Fed began raising rates aggressively while the global economy was slowing down. In what twisted parallel universe could that happen? The answer is this one, provided that inflation rose to a level that evoked panic at the Fed. We do not expect any major inflationary pressures to emerge in the near term. The growth in unit labor costs leads core inflation by about 12 months (Chart 10). Thanks to a cyclical pickup in productivity growth, unit labor cost inflation has been trending lower since mid-2018. However, as we enter late-2020, if the labor market has tightened further by then, wage growth will likely pull well ahead of productivity growth, causing inflation to accelerate. Chart 10Decelerating Unit Labor Costs Will Dampen Inflationary Pressures For The Time Being
Decelerating Unit Labor Costs Will Dampen Inflationary Pressures For The Time Being
Decelerating Unit Labor Costs Will Dampen Inflationary Pressures For The Time Being
All things equal, higher inflation is bearish for a currency because it implies a loss in purchasing power relative to other monies. However, if higher inflation spurs a central bank to hike policy rates by more than inflation has risen – thus implying an increase in real rates – the currency will tend to strengthen. Chart 11 shows the “rational expectations” response of a currency to a scenario where inflation suddenly and unexpectedly rises by one percent relative to partner countries and stays at this higher level for five years while nominal rates rise by two percent. The currency initially appreciates by 5%, but then falls by 2% every year, eventually finishing down 5% from where it started.4
Chart 11
The yen should depreciate against the dollar in the back half of this year. The real world is much messier of course, but we suspect that the dollar will stage a final blow-off rally late next year or in early-2021 (Chart 12). Since the Fed will be hiking rates in a stagflationary environment at that time, global growth will weaken, further boosting the dollar. The resulting tightening in both U.S. and global financial conditions will likely trigger a global recession and a bear market in stocks. Investors should maintain a bullish stance towards global equities for the next 12 months, but look to reduce exposure at some point next year.
Chart 12
Peter Berezin, Chief Global Strategist Global Investment Strategy peterb@bcaresearch.com Footnotes 1 Please see Global Investment Strategy Weekly Report, “Gretzky’s Doctrine,” dated March 1, 2019. 2 Jennifer Jacobs and Saleha Mohsin, “Trump Pushes China Trade Deal to Boost Markets as 2020 Heats Up,” Bloomberg, March 6, 2019. 3 Recall that GDP is a flow variable (how much production takes place every period), whereas credit is a stock variable (how much debt there is outstanding). By definition, a flow is a change in a stock. Thus, credit growth affects GDP and the change in credit growth affects GDP growth. 4 The 2% annual decline in the currency is necessary for the real interest parity condition to be satisfied. Strategy & Market Trends MacroQuant Model And Current Subjective Scores
Image
Tactical Trades Strategic Recommendations Closed Trades
Highlights Await the U.K. parliament to coalesce a majority on a on a credible strategy for Brexit that is also acceptable to the EU27. At that point, buy the pound, the FTSE250, and U.K. homebuilder shares. An eerie calm has descended over developed economy currencies. But the Chinese yuan has rebounded sharply. Stay tactically overweight emerging market currencies, cyclical equity sectors, and equities versus bonds. But don’t expect these rallies to last beyond the summer. Feature Chart of the WeekAn Eerie Calm Has Descended Over The Currency Markets. Why?
An Eerie Calm Has Descended Over The Currency Markets. Why?
An Eerie Calm Has Descended Over The Currency Markets. Why?
End Of The Road For May From the moment almost three years ago that the U.K. voted to leave the EU, it was clear that a rational and measured Brexit would require the U.K. to remain in a customs union with the EU. Rational and measured because a customs union would protect the cross-border supply chains which are vital to so many U.K. businesses. Rational and measured because a customs union would avoid a hard customs border on the island of Ireland, and thereby prevent a break-up of the U.K. Rational and measured because a customs union would best deliver on the narrow 52:48 vote to leave the EU, which was driven by a desire to control migration and the supremacy of the European Court of Justice – both of which are compatible with remaining in a customs union – rather than a desire to strike independent trade deals – which is not. Yet Theresa May did not steer to this rational and measured Brexit, because she knew it would rip apart the Conservative party, a hard minority of which sees the sovereignty of trade policy as its Holy Grail. Beholden to this minority, May put her party interest above the national interest. But now, May has run out of road. Her Brexit deal has been rejected twice by huge parliamentary majorities. In the coming days, parliament, through a series of indicative votes, is likely to wrest control of the Brexit process from the government. So far, parliament has expressed what it is against (a no-deal Brexit), but it has yet to express what course of action it is for. We await the U.K. parliament to coalesce a majority on a credible strategy for Brexit that is also acceptable to the EU27. At that point, irrespective of the exact strategy, we will buy the pound, the FTSE250, and U.K. homebuilder shares. Important Message From The Currency Markets An unusually eerie calm has descended over the currency markets (Chart of the Week). For the past six months, GBP/USD has drifted within a tight 5 percent range, USD/JPY has also moved within a similarly narrow range, and EUR/USD has been trapped within an even tighter 3 percent range (Chart I-2 and Chart I-3). Chart I-2GBP/USD And EUR/USD Have Been Very Calm Recently
GBP/USD And EUR/USD Have Been Very Calm Recently
GBP/USD And EUR/USD Have Been Very Calm Recently
Chart I-3USD/JPY Has Also Been Very Calm Recently
USD/JPY Has Also Been Very Calm Recently
USD/JPY Has Also Been Very Calm Recently
The calm is eerie because Brexit tensions have actually intensified as the Article 50 clock has run down without a breakthrough; the Federal Reserve has made a dramatic volte-face from its sequential rate hikes; the ECB has pivoted back to dovish after the German economy narrowly avoided a technical recession; and the Japanese economy contracted sharply in the third quarter of 2018. Adding to the eeriness of the calm in currency markets, the equity and bond markets have experienced wild gyrations. Global equities plunged 20 percent before quickly recovering most of the losses, while long bond prices moved by close to 15 percent1 (Chart I-4 and Chart I-5).1 Chart I-4While Equities Have Been Turbulent, Currencies Have Been Calm
While Equities Have Been Turbulent, Currencies Have Been Calm
While Equities Have Been Turbulent, Currencies Have Been Calm
Chart I-5While Bonds Have Been Turbulent, Currencies Have Been Calm
While Bonds Have Been Turbulent, Currencies Have Been Calm
While Bonds Have Been Turbulent, Currencies Have Been Calm
Given all of this turbulence, why have currency markets remained a relative oasis of calm? The simple answer is that exchange rates are, by definition, relative prices. And in the major economies, growth and inflation rates have moved in the same direction by the same amount at roughly the same time. In fact, looking at quarter-on-quarter growth rates, the major economies have all recently experienced identical 1.5 percent slowdowns: from 4 to 2.5 percent in the U.S.; and from 2.5 percent to around 1 percent in both the euro area and the U.K.2 (Chart I-6 - Chart I-8). Chart I-6U.S. GDP Growth Slowed By 1.5 Percent
U.S. GDP Growth Slowed By 1.5 Percent
U.S. GDP Growth Slowed By 1.5 Percent
Chart I-7Euro Area GDP Growth Slowed By 1.5 Percent
Euro Area GDP Growth Slowed By 1.5 Percent
Euro Area GDP Growth Slowed By 1.5 Percent
Chart I-8U.K. GDP Growth Slowed By 1.5 Percent
U.K. GDP Growth Slowed By 1.5 Percent
U.K. GDP Growth Slowed By 1.5 Percent
Markets do not care about the level of growth. They care much more about the change in growth. Financial markets are a discounting mechanism, and what matters most to the price is the change in the assumptions that are embedded within it. For example, if the price were discounting a major economy to grow at 4 percent and that rate of growth subsequently fell to 2.5 percent, then the seemingly benign outcome of respectable growth would cause interest rate expectations to decline. In another major economy, if growth slowed from 2.5 percent to 1 percent, it would precipitate a broadly similar decline in interest rate expectations. In this situation of synchronised and meaningful slowdowns across major economies, and the consequent policy responses, equity and bond absolute prices would experience wild gyrations. By contrast, currencies are relative prices. So if the decline in major economy growth rates and interest rate expectations were broadly similar, currency markets would remain a relative oasis of calm. Which perfectly describes the observation of the last six months. This observation of near-identical slowdowns in the major economies supports our thesis that their genesis came from outside the developed economies, which we expounded in A European Cycle ‘Made In China’. And now we present the smoking gun. While an eerie calm has descended over developed economy currencies, all the action has been in emerging economy currencies, especially the Chinese yuan which has rebounded sharply. The message from the currency markets reinforces our thesis: last year’s growth downswing and the current upswing were made in China (see final chart). Never Focus On Levels Of Economic Growth It is worth repeating that a head-to-head comparison of growth rates across different economies is a meaningless exercise. Here’s a simple way to grasp this crucial point: a 1.5 percent growth rate would be a very pleasing outcome for Europe, it would be a very unpleasing outcome for the U.S., and it would be a catastrophic outcome for China. The reason is that if a population is growing, the economy needs to generate real growth well in excess of the rate of population growth to improve (per person) living standards. That excess comes from productivity growth which lifts standards of living and wellbeing. In the case of Germany or Japan where the population is not growing, or is indeed shrinking, the GDP growth rate that is consistent with these rising standards of living is much lower than in those economies where the population is growing (Chart I-9 and Chart I-10). Chart I-9The Same Productivity Growth In The Euro Area And The U.S. ...
The Same Productivity Growth In The Euro Area And The U.S. ...
The Same Productivity Growth In The Euro Area And The U.S. ...
Chart I-10... Generates Different GDP Growth
... Generates Different GDP Growth
... Generates Different GDP Growth
Necessarily, an economy with weaker demographics – like Germany or Japan – will flirt with technical recessions much more often than one with population growth – like the U.S. or China. But this is just Arithmetic 101. It doesn’t mean that Germany or Japan are in a fundamentally worse shape when it comes to all-important productivity growth and improving wellbeing. Just as important for investors, earnings per share (eps) growth depends on productivity growth and not on GDP growth. Granted, higher GDP from an increasing population will boost a firm’s sales, but without increasing productivity, the firm will have to hire more staff to produce those sales. In essence, the firm will have to employ more capital – issue more shares – which means than earnings per share will not grow. To reemphasise, levels of GDP growth, in themselves, do not drive financial markets. The Perils Of Data-Dependency Recently, the world’s major central banks have become even more wedded to ‘data-dependency’, for two reasons: first, under ever increasing external scrutiny, objectivity to the economic data boosts the transparency and rationale of central bank policy; second, data-dependency acts as a foil to politicians who might want to influence or interfere with the independence of monetary policy. No names mentioned! We applaud the central banks for their good intentions. Yet enhanced data-dependency also carries perils, as it increases the amplitude of the ever-present and natural oscillations in economic growth. The reason is that the high-profile hard data on which monetary policy ‘depends’ such as CPI inflation and GDP growth record what happened in the past, and sometimes in the distant past. Meanwhile, a monetary policy shift today will act on the economy in the future due to the unavoidable lags in transmission. It follows that enhanced data-dependency is akin to a crop farmer who uses last season’s depressed price, from oversupply, to justify planting much less seed for next season. The inevitable undersupply at next season’s harvest will then cause the crop price to surge. Making the farmer plant much more for the following season, at which point the price will collapse again. And the oscillations will continue ad infinitum. Unfortunately, the more backward the data on which policy actions depend, the higher the amplitude of the price and output oscillations. Right now, growth sensitive investment positions are midway through exactly such an up-oscillation, justifying a near-term overweight in emerging market currencies, cyclical equity sectors, and equities versus bonds. But these rallies are highly unlikely to last beyond the summer (Chart I-11). Chart I-11The Recent Mini-Cycle Is ‘Made In China’
The Recent Mini-Cycle Is 'Made In China'
The Recent Mini-Cycle Is 'Made In China'
Stay tuned for the next turn. Fractal Trading System* We are pleased to report that long DAX versus the 30-year bund achieved its 2.5 percent profit target which is now crystallised and closed. This week we note that the sharp sell-off in AUD/CNY is close to the limit of tight liquidity that has signaled recent reversals in this cyclical currency cross. Accordingly, this week’s recommended trade is to go long AUD/CNY. Set a profit target of 1.5 percent with a symmetrical stop-loss. For any investment, excessive trend following and groupthink can reach a natural point of instability, at which point the established trend is highly likely to break down with or without an external catalyst. An early warning sign is the investment’s fractal dimension approaching its natural lower bound. Encouragingly, this trigger has consistently identified countertrend moves of various magnitudes across all asset classes. Chart I-12
Long AUD/CNY
Long AUD/CNY
The post-June 9, 2016 fractal trading model rules are: When the fractal dimension approaches the lower limit after an investment has been in an established trend it is a potential trigger for a liquidity-triggered trend reversal. Therefore, open a countertrend position. The profit target is a one-third reversal of the preceding 13-week move. Apply a symmetrical stop-loss. Close the position at the profit target or stop-loss. Otherwise close the position after 13 weeks. Use the position size multiple to control risk. The position size will be smaller for more risky positions. * For more details please see the European Investment Strategy Special Report “Fractals, Liquidity & A Trading Model,” dated December 11, 2014, available at eis.bcaresearch.com Dhaval Joshi, Chief European Investment Strategist dhaval@bcaresearch.com Footnote 1 The German 30-year bund. 2 Based on annualised quarter-on-quarter real GDP growth rates. Fractal Trading System Recommendations Asset Allocation Equity Regional and Country Allocation Equity Sector Allocation Bond and Interest Rate Allocation Currency and Other Allocation Closed Fractal Trades Trades Closed Trades Asset Performance Currency & Bond Equity Sector Country Equity Indicators Bond Yields Chart II-1Indicators To Watch - Bond Yields
Indicators To Watch - Bond Yields
Indicators To Watch - Bond Yields
Chart II-2Indicators To Watch - Bond Yields
Indicators To Watch - Bond Yields
Indicators To Watch - Bond Yields
Chart II-3Indicators To Watch - Bond Yields
Indicators To Watch - Bond Yields
Indicators To Watch - Bond Yields
Chart II-4Indicators To Watch - Bond Yields
Indicators To Watch - Bond Yields
Indicators To Watch - Bond Yields
Interest Rate Chart II-5Indicators To Watch - Interest Rate Expectations
Indicators To Watch - Interest Rate Expectations
Indicators To Watch - Interest Rate Expectations
Chart II-6Indicators To Watch - Interest Rate Expectations
Indicators To Watch - Interest Rate Expectations
Indicators To Watch - Interest Rate Expectations
Chart II-7Indicators To Watch - Interest Rate Expectations
Indicators To Watch - Interest Rate Expectations
Indicators To Watch - Interest Rate Expectations
Chart II-8Indicators To Watch - Interest Rate Expectations
Indicators To Watch - Interest Rate Expectations
Indicators To Watch - Interest Rate Expectations
Highlights So What? The late-cycle rally still faces non-trivial political hurdles. Why? U.S.-China trade talks, the U.S. threat of tariffs on auto imports, and Brexit continue to pose risks. A shocking revelation from the Mueller report could have a temporary negative impact on equity markets. A bombshell would increase Trump’s chances of removal from office. We give 35% odds to tarrifs on autos and auto parts, and 10% odds to a hard Brexit. Feature In our February 6 report we outlined how a “Witches’ Brew” of geopolitical risks had the potential to short-circuit the late-cycle equity rally. A month later, that brew is still bubbling. President Donald Trump’s approval rating has rebounded but going forward it faces challenges from negative headlines (Chart 1). These include a soaring trade deficit, a large influx of illegal immigrants on the southern border, a weak jobs report for February, a setback in North Korean diplomacy, and an intensification of the scandals plaguing Trump’s inner circle. Chart 1Don't Get Comfortable Just Yet, Mr. President
Don't Get Comfortable Just Yet, Mr. President
Don't Get Comfortable Just Yet, Mr. President
Each of these issues calls into question the effectiveness of Trump’s core policies and the stability of his administration, though in reality they are only potentially problematic. While Special Counsel Robert Mueller’s forthcoming report poses a tail risk, the substantial threat remains Trump’s trade policy. Indeed, investors face “the persistence of uncertainties related to geopolitical factors” and the “threat of protectionism,” according to European Central Bank President Mario Draghi, who spoke as he rolled out a new round of monetary stimulus for Europe and its ailing banks. What did Draghi have in mind? The obvious culprits are the U.S.-China trade talks, the U.S. threat of tariffs on auto imports, and Brexit. There were other issues – such as “vulnerabilities in emerging markets” – but the first three are the most likely to have turned Draghi’s head. The global economic outlook is likely to improve on the back of Chinese stimulus and policy adjustments by the ECB and Federal Reserve. But growth has not yet stabilized and financial markets face additional volatility due to the fact that none of these “geopolitical factors” is going to be resolved easily. The good news is that Trump, overseeing a precarious economy ahead of an election, has an incentive to play softball rather than hardball. Mueller’s Smoking Gun? News reports suggest that Mueller will soon issue the final report of his investigation into President Trump’s election campaign links with Russia. There is really only one way in which the Mueller report could be market relevant: it could produce smoking-gun evidence that results in non-trivial impeachment proceedings. Any scandal big enough to remove Trump from office or clearly damage his reelection chances is significant because financial markets would dislike the extreme policy discontinuity (Chart 2). Anything short of this will be a red herring for markets, though admittedly many of our clients disagree.
Chart 2
Very little is known about what Mueller will report and how he will interpret his mandate. Mueller’s investigation may or may not make it to the public in full form, at least initially, and he may or may not make any major additional indictments. Congress will strive to get access to the report, which is internal to the Justice Department, while spin-off investigations will proliferate among lower-level federal district attorneys and congressional committees. The legal battle, writ large, will run into the 2020 election and beyond. House Democrats alone can decide whether to bring articles of impeachment against Trump, but the case would be struck down in the Senate if it did not rest on ironclad evidence of wrongdoing that implicated Trump personally. Republican Senators will not jump ship easily – especially not 18 of them. That would require a sea change in grassroots support for Trump. Trump’s approval among Republicans remains the indicator to watch, and it is still strong (Chart 3). If this number crashes in the aftermath of the Mueller report, then Trump could find himself on a Nixonian trajectory, implying higher odds of a Senate conviction (Chart 4). At that point, markets would begin discounting a Democratic sweep in 2020, with business sentiment and risk assets likely to drop at the prospect of higher taxes and increased regulation (Chart 5).
Chart 3
Chart 4
Chart 5A 2020 Democratic Sweep Would Dent Business Sentiment
A 2020 Democratic Sweep Would Dent Business Sentiment
A 2020 Democratic Sweep Would Dent Business Sentiment
After all, if scandals remove Trump from office, then not only is a Democrat likely to win the White House, but any Democrat is likely to win – even a non-centrist like Bernie Sanders or other Democratic candidates like Kamala Harris who have swung hard to the left. Meanwhile, the odds of Democrats taking control of the Senate (while keeping the House) will rise. With Democratic candidates flirting with democratic socialism and proposing a range of left-wing policies, the prospect of full Democratic control of the legislative and executive branches would weigh on financial markets. We doubt that the Mueller report can fall short of a smoking gun while still dealing a fatal blow to Trump. The Democrats control the House, so if the scandal grows to gigantic proportions, they will impeach. Yet if they impeach without an ironclad case, Trump will be acquitted. And if Trump is acquitted, it is hard to see how his chances of reelection would fall. The impeachment of former President Bill Clinton looms large over Democrats, since it ended up boosting his popularity. If Democrats are overzealous to no end, it will help Trump’s campaign. If Trump should then win re-election, he will have veto power and likely a GOP Senate, so his policies will remain in place. The outcome for markets would be policy continuity, though the market-positive aspects of Trump’s first term may not be improved while the market-negative aspects, such as his trade policy and foreign policy, may reboot. Mueller is an all-or-nothing prospect: he either leads us to the equivalent of the Watergate Tapes or not. Lesser crimes are unlikely to have a decisive impact on the election. But volatility is likely to go up as the report comes due, just as it did during the Lewinsky scandal (Chart 6), at least until the dust settles and there is clarity on impeachment. And an equity sell-off at dramatic points in the saga cannot be ruled out, especially if global factors combine with actual impeachment (Chart 7). Chart 6Impeachment Proceedings Likely To Raise Vol...
Impeachment Proceedings Likely To Raise Vol...
Impeachment Proceedings Likely To Raise Vol...
Chart 7… And Potentially Dampen Returns
...And Potentially Dampen Returns
...And Potentially Dampen Returns
Bottom Line: A specific, shocking revelation from the Mueller report could have a negative impact on equity markets and risk assets, but any such moves would be temporary as long as the growth and earnings backdrop remain positive and Mueller does not drop a bombshell that increases Trump’s chances of removal from office. Separating The Budget From The Border The president faces adverse developments on the southern border after having initiated a controversial national emergency in order to transfer military funds to construct new barriers. The U.S. has seen an abnormally large increase in apprehensions and attempted entries this year (Charts 8A & 8B). Ultimately the influx calls attention to the porous southern border and as such may help to justify Trump’s policy focus. For now it raises the question of why the administration’s tough tactics are failing to deter immigrants. Meanwhile his emergency declaration has divided the Republican Party, with several members likely to join with Democrats in a resolution of disapproval that Trump will veto.
Chart 8
Chart 8
Congress will not be able to override the veto, but Trump’s decree also faces challenges in the judicial system. We doubt that the Supreme Court will rule against him but it certainly is possible. The ruling is highly likely to come before the election. Meanwhile Trump is kicking off the FY2020 budget battle with his newest request of $8.6 billion for the border wall and cuts to a range of discretionary non-defense spending. The presidential budget is a fiction – it is based on unrealistic cuts to a range of government programs. Any budget that is passed will bear no relation to the administration’s proposals. Opinion polls referenced above clearly demonstrate that Trump’s approval rating suffered from the recent government shutdown. This does not mean that he will conclude the next budget battle by the initial deadline of October 1 or that a late-2019 shutdown is impossible. He might accept a short shutdown to try to secure defense spending that would arguably legitimize his repurposing of military funds for border construction. But his experience early this year means that the odds of another long-running, bruising shutdown are low. Might Trump refuse to raise the debt ceiling later this year to get his way on the wall? This is even less likely than a shutdown due to the negative impact that a debt ceiling constraint would have on social security recipients and bond markets. Trump also has the most to lose if the 2011 budget caps snap back into place in 2020 due to any failure of the FY2020 negotiations (Chart 9). As such, the debt ceiling – which the Treasury Department can keep at bay until the end of the fiscal year in October – and the 2020 budget may be resolved together this time around.
Chart 9
In short, Trump will be forced to punt on congressional funding for the wall later this year and will have to campaign on it again in November 2020, with the slogan “Finish the Wall.” This is a market-positive outcome, as the hurdles to fiscal spending in 2020 are likely to be reduced: Trump will have to concede to some Democratic priorities and abandon his proposed cuts. The Democrats, for their part, are likely to have enough moderates to get the next budget over the line with Republican support. To illustrate, Republicans only need 21 votes for a majority, while no fewer than 26 Democrats were recently chastised by House Speaker Nancy Pelosi for cooperating with Republicans. The implication is that a bipartisan majority can be found. Since Trump cannot get his budget cuts, and does not really even want them, the projected contraction of the budget deficit in 2020 will be reduced or erased (Chart 10). On the margin, this would support higher inflation and bond yields.
Chart 10
The biggest threat to Trump’s reelection is still the risk that the long business cycle will expire by November next year. However, the exceedingly low February payrolls print was misleading – the unemployment rate fell and wage growth was firm (Chart 11). American households are in relatively good shape and that bodes well for Trump, for the time being. Chart 11American Households Are In Good Shape
American Households Are In Good Shape
American Households Are In Good Shape
Bottom Line: The economy is relatively well supported and Trump and the Democrats are ultimately likely to cooperate on the budget under the table, reducing the risks of a debt ceiling breach, or an extended government shutdown later this year, or a fall off the 2020 stimulus cliff. The Trade Deficit: Trump’s Pivot To Europe Trade policy is where Trump’s challenges merge with Draghi’s woes. The U.S. trade deficit lurched upwards to a ten-year high of $621 billion in 2018 (Chart 12). The trade deficit is uniquely important to Trump because he campaigned on an unorthodox protectionist agenda in order to reduce it. It will be very difficult for him to evade the consequences if the deficit is higher, as a share of GDP, in November 2020 than it was in January 2017. Chart 12Trade Deficit Jump Is A Blow To Trump
Trade Deficit Jump Is A Blow To Trump
Trade Deficit Jump Is A Blow To Trump
The underlying cause of the rising deficit is that a growing American economy at full employment with a relatively strong dollar will suck in larger quantities of imports. This effect is overriding any that Trump’s tariffs have had in discouraging imports. Meanwhile the global slowdown, reinforced by trade retaliation and negative sentiment, are harming U.S. exports (Chart 13). The administration’s policies of fiscal stimulus combined with encouraging private investment are guaranteed to lead to a higher current account deficit, barring an offsetting (and highly unlikely) rise in private saving. The current account deficit must equal the gap between domestic saving and investment and a rising fiscal deficit represents a drop in saving. Chart 13Trade War Hurting U.S. Exports
Trade War Hurting U.S. Exports
Trade War Hurting U.S. Exports
What does the trade deficit imply for the U.S.-China talks? On one hand, the U.S. could put more pressure on China after feeling political heat from the large deficit. On the other hand, China has always offered to reduce the bilateral trade deficit directly through bulk purchases of goods, particularly commodities. It is Trump’s top negotiator, Robert Lighthizer, who has insisted that China make structural changes to reduce trade imbalances on a long-term and sustainable basis.1 In a sign of progress, the U.S. and China have reportedly arrived at a currency agreement. No details are known and therefore it is impossible to say if it would mean a more “market-oriented” renminbi, which could fluctuate and have a variable impact on the trade deficit, or a renminbi that is managed to be stronger against the dollar, which would tend to weigh on the deficit, as Trump might wish. The two negotiating teams are working on the text of five other structural issues that should also mitigate the deficit. Moreover, China’s new foreign investment law, if enforced, could increase American market access by leveling the playing field for foreign firms. However, there is still no monitoring mechanism, the two presidents have not scheduled a final signing summit, and the deterioration in North Korean peace talks also works against any quick conclusion. If Trump concludes a deal, the next question for investors is whether he will impose Section 232 tariffs on auto and auto imports on the EU and other partners (Chart 14).
Chart 14
The European Commission’s top trade negotiator, Cecilia Malmstrom, recently met with Lighthizer in Washington to discourage tariffs. She refused to admit agriculture into the negotiations, as per a U.S.-EU joint statement in July 2018, but proposed equalizing tariffs on industrial goods as a way for both sides to make a positive start (Chart 15). She said that the U.S. repealing the Section 232 steel and aluminum tariffs are necessary for any final deal. And she reiterated that any new tariffs (e.g., the proposed Section 232 tariffs on autos and auto parts) would prevent a deal and provoke immediate retaliation on $23 billion worth of American exports.
Chart 15
Malmstrom also said that the EU would prefer to work with the U.S. on reforming the World Trade Organization and addressing China’s trade violations. This approach fits with that of Japan, which has joined the U.S. and EU in trilateral discussions toward reforming the global trade architecture in a bid to mitigate U.S. protectionism and constrain China. The problem with the EU’s position is that once the U.S. and China make a trade deal, the U.S. will not have as immediate of a need to form a trade coalition against China (other than in dealing with WTO issues). Moreover, Japan will be forced to accept a deal with the U.S. in short order. A rotation of Trump trade policy to focus on Europe is likely. We give 35% odds to tariffs on autos and auto parts. The USMCA will increase the cost of production in North America while Europe is so far excluding cars from negotiations with the U.S., so there is room for a clash. But any tariffs on autos will be less sweeping than those against China. Trump will play softball rather than hardball for the following reasons: The public is less skeptical of trade with Europe and Japan than with China. The auto sector is heavily concentrated in the Red States and many states that are heavily exposed to trade with the EU are also critical to Trump’s reelection (Map 1).
Chart
Section 232 tariffs that are required to be enacted by May 18 would have plenty of time to impact the U.S. economy negatively by November 2020. Congress and the defense establishment are against a trade war with U.S. allies, while bipartisanship reigns when it comes to tougher actions toward China. The bilateral trade deficit is less excessive with Europe than with China (see Chart 12 above). The U.S. carmaker and auto parts lobby are unanimously against the tariffs – and in fact has called for the removal of the steel and aluminum tariffs in a stance that echoes that of the EU. The existing steel and aluminum tariffs provide Trump with leverage in the negotiations with the EU and Japan, whereas the U.S. has agreed not to impose new tariffs on these partners while trade negotiations are underway. New tariffs would nix negotiations and ensure that the ensuing quarrels are long and drawn out, with a necessarily worse economic impact. To initiate a new trade war in the wake of the U.S.-China war would be to undercut the positive impact on trade, financial conditions, and sentiment that is supposedly driving Trump’s desire for a China deal in the first place. The U.S. eventually will need to build a trilateral coalition to hold China to account and ensure that it does not slide back into its past mercantilist practices. Even limited or pinprick tariffs will have an adverse impact on equity markets, given that they will hit Europe at a time when its economy is decelerating dangerously and when Brexit uncertainty is already weighing on European assets and sentiment (see next section). This may be why both the U.K. and Germany have recently softened their positions on Chinese telecom company Huawei, which they have been investigating for national security concerns related to the rollout of 5G networks. They are signaling that they are not going to sacrifice their relationship with China if the U.S. is dealing with China bilaterally while threatening to turn around and slap tariffs on their auto exports. If the U.S. goes ahead with tariffs – on the basis that its China agreement allows it to isolate Europe – the EU will not be a pushover, as exports to the U.S. only amount to 2.6% of GDP (Chart 16). The result of the U.S.-China quarrel has been a deepening EU-China trade relationship and that trend is set to continue (Chart 17), especially if the U.S. continues to use punitive measures that increase the substitution effect and the strategic value of the Chinese and European markets to each other. Chart 16The EU Will Not Be A Pushover In Face Of U.S. Tariffs
The EU Will Not Be a Pushover In Face Of U.S. Tariffs
The EU Will Not Be a Pushover In Face Of U.S. Tariffs
Chart 17EU-China Trade Relationship Deepening
EU-China Trade Relationship Deepening
EU-China Trade Relationship Deepening
Bottom Line: In the wake of any U.S.-China agreement, we give a 35% chance that Trump will impose tariffs on European cars and car parts. Such tariffs are not our base case because they are unlikely to shrink the U.S. trade deficit and would have a negative impact on the Red State economy. But lower magnitude tariffs cannot be ruled out – and the impact on the euro and European industrial sector would clearly be detrimental in the short run. Assuming that global and European growth is recovering, a tariff shock to Europe’s carmakers could present a good opportunity to buy on the dip. Any U.S.-EU trade war will ultimately be shorter-lived and less disruptive than the U.S.-China trade war, which is likely to resume at some point even if Presidents Trump and Xi get a deal this year. The United Kingdom: Snap Election More Likely A series of important votes is taking place in Westminster this week, with the end result likely to be an extension to negotiations over a withdrawal deal at the EU Council summit on March 21. Conditional on that extension, the odds of a new election are sharply rising. The first vote, as we go to press on Tuesday, has resulted in a rejection of Prime Minister Theresa May’s exit plan by 149 votes – the second rejection after her colossal defeat in January by 230 votes. The loss was expected because the EU has not offered a substantial compromise on the contentious Irish “backstop” arrangement, which would keep Northern Ireland and/or the U.K. in the European Customs Union beyond the transition date of December 31, 2020. All that was offered was an exit clause for the U.K. sans Northern Ireland. But Northern Ireland is part of the U.K. and the introduction of additional border checks on the Irish Sea would mark a new division within the constitutional fabric. This is unacceptable to the Conservative Party and especially to the Democratic Union Party of Northern Ireland, which gives May her majority in parliament. On Wednesday, we expect the vote for a “no deal” exit, in which the U.K. simply leaves the EU without any arrangements as to the withdrawal (or future relationship), to fail by an even larger margin than May’s plan. Leaving without a deal would cause a negative economic shock due to the automatic reversion to relatively high WTO tariff levels with the EU, which receives 46% of the U.K.’s exports and is thus vital in the maintenance of its trade balance and terms of trade (Chart 18). It is impossible to see parliament voting in favor of such an outcome – parliament was never the driving force behind Brexit, with most MPs preferring to remain in the EU. Chart 18No Deal Brexit A Huge Blow To U.K.
No Deal Brexit Huge Blow To U.K.
No Deal Brexit Huge Blow To U.K.
The risk is that parliament should fail repeatedly to pass the third vote this week, a motion asking the EU for an extension period to the March 29 “exit day.” This is unlikely but possible. In this case, the supreme decision-making body of the U.K. will be paralyzed. A bloodbath will ensue in which the country will either see Prime Minister May ousted, a snap election called, or both. If the extension passes, the EU Council is likely to go along with the decision. It is in the EU’s near-term economic interest not to trigger a crash Brexit and in its long-term interest to delay Brexit until the U.K. public decides they would rather stay after all. The problem is that it will not want to grant an extension for longer than July, when new Members of the European Parliament take their seats after the May 23-26 EU elections. The U.K. may be forced to put up candidates for the election. What good would an extension do anyway? The likeliest possibility is, yet again, a new election. The conditions are not yet ripe for a second referendum, though the odds are rising that one will eventually occur. The Labour Party has fallen in the opinion polls amidst Jeremy Corbyn’s indecisive leadership and a divisive platform change within the party to push for a second Brexit referendum (Chart 19). An election now gives May’s Conservatives an opportunity to build a larger and stronger majority – after all, in the U.K. electoral system, the winner takes all in each constituency, so the Tories would pick up most of the seats that Labour loses. May’s faction might be able to strengthen its hand vis-à-vis hard Brexiters who have less popular support yet currently have the numbers to block May’s withdrawal plan. Chart 19A New Election Would Be Opportunistic
A New Election Would Be Opportunistic
A New Election Would Be Opportunistic
Theresa May might be unwilling to call an election given her fateful mistake of calling the snap election of 2017. If she demurs, she could face an internal party coup. There is a slim chance that a hard Brexiter could take the helm, bent on steering the U.K. out of the EU without a deal. Parliament, however, would rebel against such a leader. Ultimately, the economic and financial constraints of a crash Brexit are too hard and we expect that the votes will reflect this fact, whether in an adjusted exit deal or a new election. But both outcomes require an extension. However, we must point out that the constitutional and geopolitical constraints alone are not sufficient to prevent a crash out: parliament is the supreme lawmaking authority and there is no other basis for the U.K. to leave in an orderly fashion. The United Kingdom has survived worse, as many hard Brexiters will emphasize. A crash is a mistake that can happen. But the odds are not higher than 10%-20% given the stakes (Diagram 1). Diagram 1The Path To Salvation Remains Fraught With Dangers
The Witches’ Brew Keeps Bubbling…
The Witches’ Brew Keeps Bubbling…
With the EU economy not having stabilized and the U.S. contemplating Section 232 trade tariffs, Brexit is all the more reason to be wary of sterling, the euro, and European equities in the near term, especially relative to the U.S. dollar and U.S. equities. Gilts can rally even in the event of an extension given the uncertainty that this would entail, though the BCA House View is neutral. Bottom Line: Expect parliament to ask for an extension. At the same time, the odds of a new election have risen sharply. The absence of a new election could lead to a power struggle within the Tory party that could escalate the risk of a hard Brexit, though we still place the odds at 10%. A second referendum is rising in probability but will only become possible after the dust settles from the current crisis. Investment Conclusions The ECB’s stimulus measures are positive for European and global growth over a 6-to-12-month time frame. They suggest that financial assets could be supported later in the year, depending in great part on what happens in China. China’s combined January and February total social financing growth reinforces our Feb 20 report arguing that the risk of stimulus is now to the upside. As People’s Bank Governor Yi Gang put it, the slowdown in total social financing last year has stopped. The annual meeting of the National People’s Congress also resulted in largely accommodative measures on top of this credit increase. Nevertheless, stimulus operates with a lag, and for the reasons outlined above we are not yet willing to favor EUR/USD or European equities within developed markets. A 35% chance of tariffs is non-negligible. We expect U.S. equities to outperform within the developed world and Chinese equities to outperform within the emerging world on a 6-to-12 month basis. Matt Gertken, Vice President Geopolitical Strategy mattg@bcaresearch.com Marko Papic, Senior Vice President Chief Geopolitical Strategist marko@bcaresearch.com Footnotes 1 Lighthizer now has bipartisan support in Congress, whose members will lambast Trump if he squanders the historic leverage he has built up in exchange for a shallow deal that only temporarily weighs on the trade deficit.
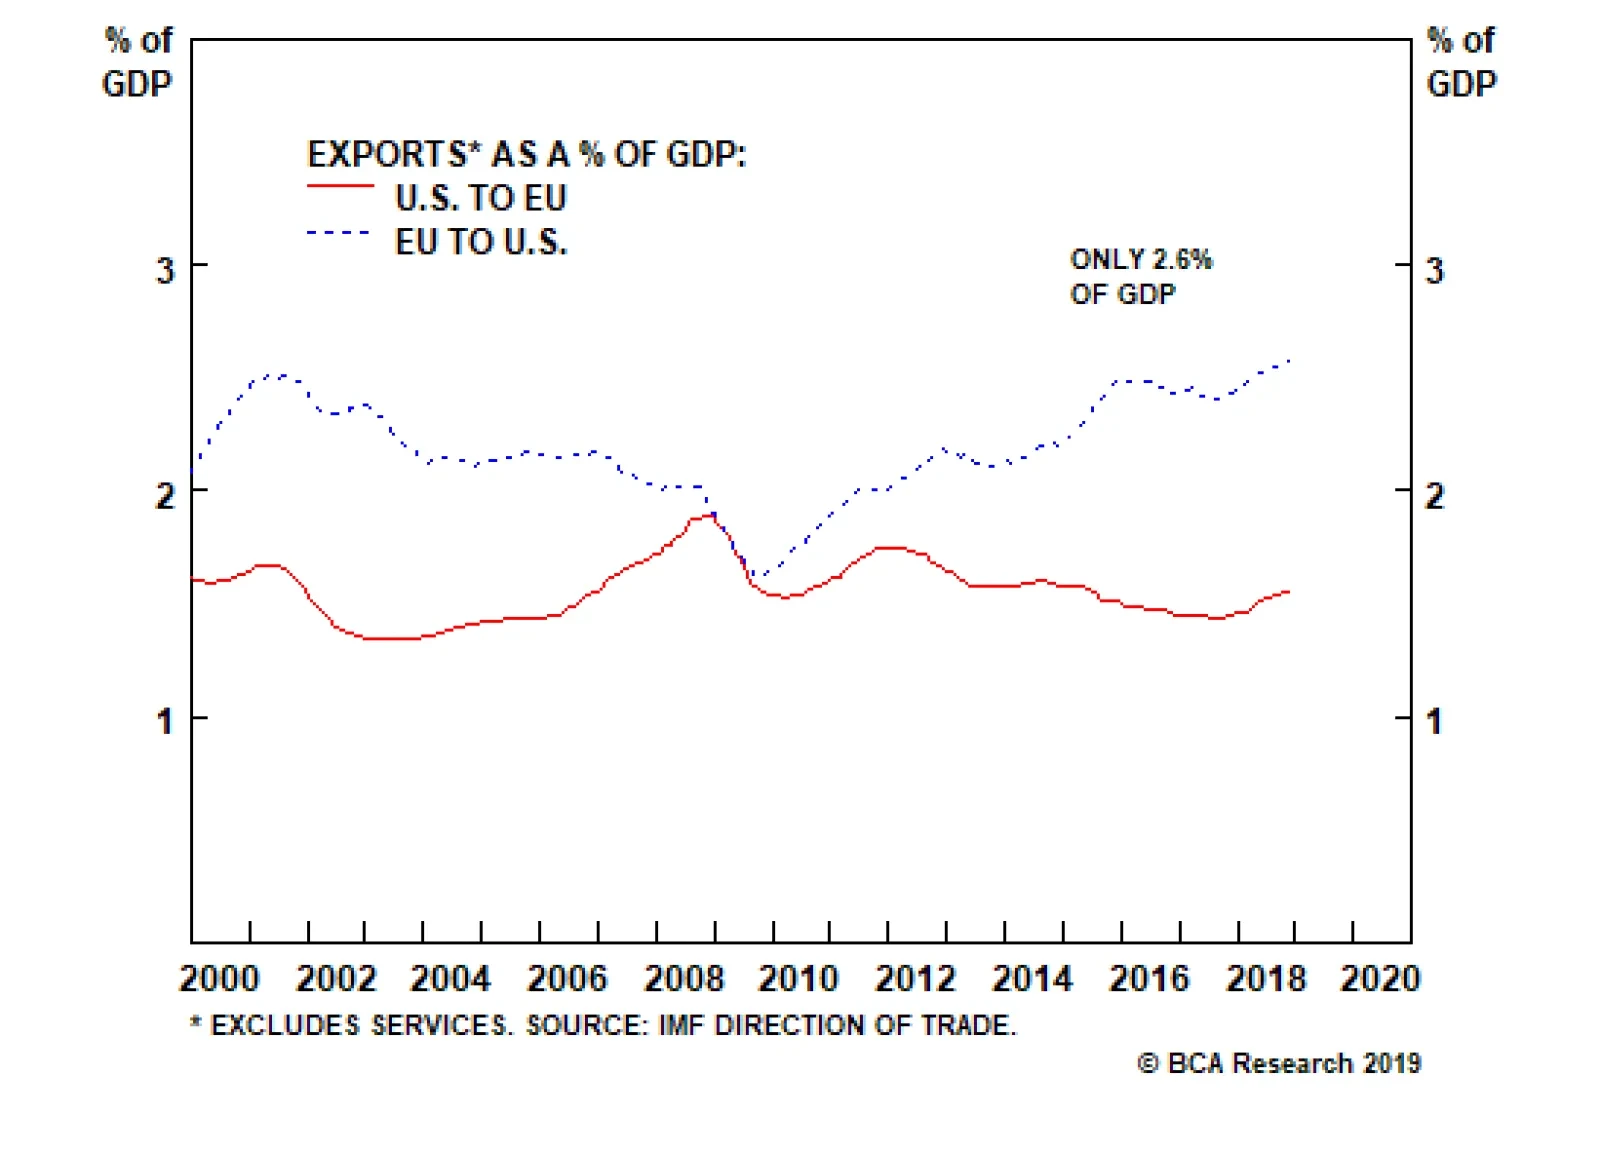
If Trump concludes a deal with China, the next question for investors is whether he will impose Section 232 tariffs on auto and auto imports on the EU and other partners. A rotation of Trump trade policy to focus on Europe is likely. We give 35% odds to…