Euro Area

Highlights The U.S. economy is slowing in a completely predictable manner. With inflationary pressures largely dormant, the Fed can afford to stay on hold for the next few FOMC meetings. Growth in the U.S. and the rest of the world should stabilize by mid-year. This will enable the Fed to resume raising rates in June. A bearish stance towards U.S. Treasurys is warranted over a 12-month horizon. As long as the Fed is hiking rates in response to above-trend GDP growth rather than accelerating inflation, risk assets will fare well. Investors should overweight global equities and spread product for now, but monitor inflation trends closely for signs of when to get out. Brexit fears are overdone. Stay long the pound versus the euro. We were stopped out of our short AUD/JPY trade for a gain of 10%. Feature A Predictable Slowdown Investors are misunderstanding the nature of the current slowdown in the United States and much of the world. Completely predictable slowdowns, such as this one, rarely morph into recessions. Real U.S. GDP rose at a blistering 3.8% average annualized pace in Q2 and Q3 of 2018. There is no way that sort of growth rate could have been sustained. Financial conditions also tightened sharply in Q4, which has inevitably weighed on growth. Given the stock market rout, it is actually surprising that the economy has not weakened more than it has. The New York Fed GDP Nowcast points to growth of 2.5% in Q4 of 2018 and 2.1% in Q1 of 2019. This is still above the Fed’s long-term estimate of potential GDP growth of 1.9%. Most of the slowdown has been concentrated in the manufacturing sector, but even there, the bloodletting may be ending. The latest Philadelphia Fed survey — arguably the most important of the regional Fed manufacturing reports — showed an uptick in activity, with the new orders component hitting the highest level since last July. Despite the tightening in financial conditions, bank lending to the business sector has accelerated over the past three months (Chart 1). The Conference Board’s Leading Credit Index remains in expansionary territory (Chart 2). While business capex intention surveys have come off their highs, they still point to robust spending plans over the next few quarters (Chart 3). Chart 1Credit Is Still Flowing To U.S. Businesses
Credit Is Still Flowing To U.S. Businesses
Credit Is Still Flowing To U.S. Businesses
Chart 2Little Sign Of A Looming Credit Crunch
Little Sign Of A Looming Credit Crunch
Little Sign Of A Looming Credit Crunch
Chart 3Capex Plans Still Solid
Capex Plans Still Solid
Capex Plans Still Solid
The labor market remains healthy, as evidenced by ongoing strong payroll growth and low initial unemployment claims. Faster wage growth is boosting consumer spending. Holiday sales rose by 5.1% from a year earlier according to the Mastercard SpendingPulse report, the fastest growth in six years. The Redbook same-store index tells a similar story (Chart 4). Chart 4Same-Store Sales Are Robust
Same-Store Sales Are Robust
Same-Store Sales Are Robust
The housing market struggled for much of 2018, but the recent stabilization in mortgage rates should help matters (Chart 5). Notably, mortgage applications for purchase have surged to their highest levels since 2010 (Chart 6). Homebuilder confidence improved in January, mirroring the rally in homebuilder shares (Chart 7). We are long homebuilders versus the S&P 500, a trade that is up 5.3% since we recommended it on November 1, 2018. Chart 5aThe U.S. Housing Sector Will Stabilize (I)
The U.S. Housing Sector Will Stabilize (I)
The U.S. Housing Sector Will Stabilize (I)
Chart 5BThe U.S. Housing Sector Will Stabilize (II)
The U.S. Housing Sector Will Stabilize (II)
The U.S. Housing Sector Will Stabilize (II)
Chart 6A Positive Signal For U.S. Housing
A Positive Signal For U.S. Housing
A Positive Signal For U.S. Housing
Chart 7U.S. Homebuilder Stocks Have Been Outperforming Recently
U.S. Homebuilder Stocks Have Been Outperforming Recently
U.S. Homebuilder Stocks Have Been Outperforming Recently
U.S. Government Shutdown: A Near-Term Hit To Growth The government shutdown poses a near-term risk to the U.S. economy. If it lasts until the end of March, it will shave about 1.7% off Q1 GDP based on White House estimates. While this represents a potentially significant hit to the economy, the effect is likely to be completely reversed once the shutdown ends. Moreover, the drag to growth from the shutdown pales in comparison to the overall stance of fiscal policy. According to the IMF, the cyclically-adjusted budget deficit is set to reach 5.7% of GDP this year, up from 3.2% of GDP in 2015. There is also a reasonable chance that any deal to end the shutdown will involve a commitment to increase spending beyond currently budgeted levels. This would increase the overall amount of fiscal stimulus the economy is receiving. Taking The Pulse Of Global Growth The slowdown in growth has been deeper and more protracted outside the United States. Nevertheless, rays of sunshine are emerging. Our global Leading Economic Indicator diffusion index, which measures the proportion of countries with rising LEIs compared to those with falling LEIs, has bottomed. The diffusion index leads the global LEI by a few months (Chart 8). Chart 8The Uptick In The LEI Diffusion Index Suggests Global Growth Could Stabilize
The Uptick In The LEI Diffusion Index Suggests Global Growth Could Stabilize
The Uptick In The LEI Diffusion Index Suggests Global Growth Could Stabilize
As is increasingly the case, the fate of the Chinese economy will be critical in determining when global growth begins to reaccelerate. The latest Chinese activity data has been disappointing, with this week’s downright awful export figures being the latest example. That said, credit growth may be starting to stabilize, as evidenced by stronger-than-expected loan growth for December. With credit growth now running only slightly above nominal GDP growth, the need for the authorities to maintain their deleveraging campaign has diminished. In an encouraging sign, the Market-Based China Growth Indicator developed by our China Investment Strategy service has been moving higher (Chart 9). Chart 9Encouraging Sign For The Chinese Economy
Encouraging Sign For The Chinese Economy
Encouraging Sign For The Chinese Economy
A revival in Chinese growth would aid trade-sensitive economies such as Japan and Germany. The former saw a decline in economic momentum in the second half of 2018, exacerbated by typhoons and an earthquake in Hokkaido. With the consumption tax set to increase from 8% to 10% in October, the Bank of Japan will need to maintain its yield curve control regime at least until 2020. This could weigh on the yen. With that in mind, we tightened the stop on our short AUD/JPY trade two weeks ago and subsequently exited the position with a gain of 10%. The German economy has taken it on the chin recently. Real GDP contracted in the third quarter and barely grew in the fourth quarter. The economy should rebound in 2019 as external demand improves. The drag on growth from the decline in automobile assemblies following the introduction of new emission standards should also turn into a modest tailwind as production resumes. In addition, fiscal policy is set to turn more stimulative, while robust wage growth, lower oil prices, and rising home prices should support consumption. Elsewhere in Europe, the Italian economy should recover as bond yields come down from their highs and confidence improves following the resolution of the impasse with the EU over budget targets. The modest easing in Italy’s fiscal policy of about 0.5% of GDP in 2019 should also benefit growth. It is too early to quantify the effect on the French economy from the “yellow vest” protests. France is no stranger to protests of this sort, so our guess is that the impact on the economy will be minimal. President Macron’s pledge to loosen fiscal policy in hopes of placating the protestors should also support demand. Brexit: A “No Deal” Outcome Looks Less Likely The Brexit saga could end in one of three ways: 1) A “no deal” where the U.K. leaves the EU with no alternative in place; 2) A “soft Brexit” involving an agreement to form a permanent customs union or some sort of “Norway plus” arrangement; 3) A decision to reverse the results of the original referendum and stay in the EU. In thinking about which of these three outcomes is most likely, one should keep the following in mind: Any course of action that the U.K. takes must have the support of the British parliament. A no deal outcome does not have parliament’s support. Not even close. Thus, it will not happen. This leaves options 2 and 3. This publication has argued since the day after the Brexit vote that the European establishment, following the example of the Irish and Danish referendums over various EU treaties, will keep insisting on do-overs until it gets the result it wants. If one referendum is good, two is even better – it’s twice as much democracy! The betting markets seem to be coming around to our view. As we go to press, PredictIt shows a one-in-three chance that a new referendum will be called by March 31 (Chart 10). Polling trends suggest that if another referendum were held, the remain side would probably prevail (Chart 11).
Chart 10
Chart 10
Chart 11U.K.: A Change Of Heart?
U.K.: A Change Of Heart?
U.K.: A Change Of Heart?
In some sense though, it does not matter for investors whether the original referendum is reversed or a soft-Brexit deal is reached. Either outcome would be welcomed by markets. We continue to advocate buying GBP/EUR. My colleague Dhaval Joshi, BCA’s Chief European strategist, also recommends that equity investors purchase the FTSE 250 index, which comprises from the 101st to the 350th largest companies listed on the London Stock Exchange. Unlike its large-cap counterpart, the FTSE 100, the FTSE 250 index is more geared to what happens in the U.K. than in the rest of the world. Investment Conclusions Global inflation remains subdued, which gives central banks the luxury of taking a wait-and-see approach to tightening monetary policy. Growth in the U.S. and the rest of the world should stabilize by mid-year. This will enable the Fed to resume raising rates in June. Given that the market is no longer pricing in any Fed hikes, a bearish stance towards U.S. Treasurys is warranted over a 12-month horizon (Chart 12). Outside of Japan, bond yields will also rise in the major developed economies. Chart 12Treasurys Will Underperform If The Fed Hikes Rates By More Than Expected
Treasurys Will Underperform If The Fed Hikes Rates By More Than Expected
Treasurys Will Underperform If The Fed Hikes Rates By More Than Expected
We downgraded global equities in June as our leading indicators began to point to slower growth ahead, but upgraded them back to overweight after stocks plunged following the December FOMC meeting. The rally over the past three weeks has reversed deeply oversold conditions and our tactical MacroQuant model is once again flagging some near-term risk to stocks. Nevertheless, if the global economy avoids a recession this year, as we expect, equities should fare well over a 12-month horizon. The MSCI All-Country World index is trading at a modest 13.6-times forward earnings (Chart 13). Profit estimates have been revised down meaningfully, suggesting that the bar for upward earnings surprises is now quite low. Chart 13A Lot Of Bad News Already Discounted?
A Lot Of Bad News Already Discounted?
A Lot Of Bad News Already Discounted?
Risk assets can tolerate higher rates as long as tighter monetary policy is the result of stronger growth. What risk assets cannot withstand is a stagflationary environment where growth is slowing but the Fed is hiking rates in order to bring down inflation. That is not the situation today, but could be the situation next year. Bottom line: Investors should overweight global equities and spread product for now, but monitor inflation trends closely for signs of when to get out. Peter Berezin, Chief Global Strategist Global Investment Strategy peterb@bcaresearch.com Strategy & Market Trends MacroQuant Model And Current Subjective Scores
Chart 14
Tactical Trades Strategic Recommendations Closed Trades
Highlights Global Corporates: The Fed is now clearly signaling a near-term capitulation to tightening financial conditions alongside slowing global growth and inflation. A pause in the U.S. rate hiking cycle, after credit spread valuations have cheapened up, opens up a window of opportunity for global corporate bond market outperformance versus government debt over the next 3-6 months. Country Allocation: Move to overweight (4 of 5) on both U.S. investment grade and high-yield corporates, while downgrading U.S. Treasuries to underweight (2 of 5). Upgrade euro area investment grade and high-yield corporates to neutral (3 of 5), while downgrading euro area governments to underweight (2 of 5). Upgrade emerging market U.S. dollar denominated debt (both sovereign and corporate) from maximum underweight to underweight (2 of 5). Feature We downgraded our overall recommended investment stance on global corporate debt to neutral on June 26 of last year.1 That decision reflected our concern at the time that less accommodative central banks, a rising U.S. dollar, weakening global growth momentum and intensifying U.S.-China trade tensions had all significantly worsened the near-term risk/reward tradeoff for owning corporate bonds. This accompanied a firm-wide call at BCA to pare back our recommended exposure to global equities for the same reasons. We now see an opportunity, driven by better value and diminished market volatility after the Fed has clearly signaled a pause on U.S. rate hikes (Chart of the Week), to go back to an overweight stance on corporate credit on a tactical basis (3-6 months). Chart of the WeekTime For A Pause In Corporate Spread Widening
Time For A Pause In Corporate Spread Widening
Time For A Pause In Corporate Spread Widening
To be clear, we still see medium-term risks for corporate credit once global growth stabilizes and a resilient U.S. economy forces the Fed to restart the rate hikes in the latter half of 2019. A move to a restrictive stance by the Fed toward year-end, signaled by an inversion of the U.S. Treasury yield curve, will raise recession risks and be the eventual death knell for this credit cycle. In the meantime, corporate debt is likely to outperform government bonds, justifying a tactical overweight position. This mirrors the recent change in the BCA House View, returning to a tactical overweight stance on global equities. On a regional basis, we prefer taking more of our upgraded credit risk in U.S. corporates over European and emerging market (EM) equivalents. The outlook for growth remains more favorable on a relative basis to Europe or China, the latter being most critical for the outperformance of EM assets. Why The Spread Widening Will Pause: A Patient Fed Is Taking A Break Global corporate bond spreads have widened since we did our downgrade in June, across all countries and credit tiers (Chart 2). Typically, some underperformance of corporate credit should occur when global growth momentum slows, as was the case throughout 2018. Yet the most violent period of spread widening only began once the Fed began signaling that it would continue with its interest hikes and balance sheet runoff, despite softening global growth.
Chart 2
This set off yet another clash between policy and the markets – one of BCA’s key investment themes for 2018 that still applies in 2019 – resulting in a sharp selloff in global risk assets, including corporate debt. The result was a tightening of U.S. financial conditions, first through a stronger U.S. dollar (supported by rate hike expectations) and later through lower equity prices and wider corporate spreads. This echoed the 2014/15 period when the Fed was trying to lift rates off the zero bound after ending its quantitative easing program. The Fed was only able to deliver a single rate hike in December 2015 before pausing because of severely slumping global growth (most notably in China) and a sharp tightening in financial conditions, both of which knocked the wind out of the U.S. economy. Turning to 2019, the downturn in cyclical growth indicators like manufacturing purchasing managers indices (PMI) and the global leading economic indicator (LEI) has reached levels last seen after that 2014/15 episode (Chart 3). Importantly, our global LEI diffusion index, which measures the number of countries with rising LEIs compared to falling LEIs and is itself a reliable leading indicator of the global LEI, is bottoming out at the same level that preceded the 2016 LEI revival (middle panel). This suggests that a stabilization of the global LEI could unfold in the next few months, which would also signal a potential rebound in corporate credit returns (bottom panel). Chart 3Credit Returns Already Reflect Slowing Growth
Credit Returns Already Reflect Slowing Growth
Credit Returns Already Reflect Slowing Growth
Given the many similarities between today and the 2014/15 backdrop, it is sensible to look for other indicators that accurately heralded the end of that period of spread widening to help time a potential increase in recommended exposure to corporates. Over the past several weeks, our colleagues at our sister BCA service, U.S. Bond Strategy, have been following a checklist of market-based signals to determine the timing of a potential peak in U.S. credit spreads.2 These are grouped into two categories: signals of rebounding global growth and signals of Fed capitulation on rate hikes. For global growth, the indicators monitored are shown in Chart 4: Chart 4Checklist For Peak U.S. Spreads: Global Growth
Checklist For Peak U.S. Spreads: Global Growth
Checklist For Peak U.S. Spreads: Global Growth
the CRB raw industrials index of commodity prices (a broader measure that excludes highly volatile oil prices) the BCA Market-Based China Growth Indicator (created by our China Investment Strategy team as a proxy of investor expectations of Chinese growth3) the Global Industrial Mining equity price index For Fed capitulation, the indicators monitored are shown in Chart 5: Chart 5Checklist For Peak U.S. Spreads: Fed Capitulation
Checklist For Peak U.S. Spreads: Fed Capitulation
Checklist For Peak U.S. Spreads: Fed Capitulation
our 12-month fed funds discounter, which measures the amount of expected Fed rate hikes over the next year discounted in the U.S. Overnight Index Swap (OIS) curve the price of gold in dollars (a higher price correlating with perceptions of easier U.S. monetary policy and vice versa) the nominal trade-weighted U.S. dollar index Among the growth-focused elements of the checklist, only the China Growth Indicator is in a clear uptrend. Non-oil commodity prices had been stabilizing at the end of 2018 but appear to be rolling over, while it is not yet clear if the downturn in Mining stocks has ended. With momentum in global PMIs and LEIs still having not yet bottomed out, it may be too early to expect a cyclical rebound in non-oil commodities and related equities. At a minimum, that will require even greater signs that China’s economy is regaining some vigor. However, as we discussed last week, Chinese policymakers’ options to stimulate growth are far more limited now than they were in 2015 and 2016 when a rebounding China boosted commodity demand and EM asset performance.4 Within the Fed-focused components of the “Peak Spreads Checklist”, the near-term bullish signal for credit is much stronger. Our fed funds discounter has rapidly priced out all rate hikes for 2019. Since November, gold is up nearly 8% and the nominal trade-weighted U.S. dollar is down 2%. The shift in recent Fed messaging from signaling a “gradual pace” of tightening to exhibiting “patience” on any future policy moves was a highly dovish signal for investors. This alone has been enough to stabilize equity and credit markets, which had been discounting that Fed tightening in 2019 would drive the U.S. into a possible recession. In the constant battle between financial conditions and the Fed, the former has won this latest round. How long will this Fed pause last? Continuing with the comparison to the 2014/15 episode, a critical difference is that underlying trends in U.S. economic growth and inflation are firmer today. This is evident in the BCA Fed Monitor, which is comprised of economic and financial data that indicate pressure on the Fed to tighten or ease monetary policy. Chart 6 shows a “cycle-on-cycle” comparison of the Fed Monitor (and its subcomponents) today versus 2014/15. The Fed Monitor is still signaling a need for the Fed to continue tightening because the Economic Growth and Inflation Components remain elevated. Yet the Monitor has declined from its recent peak thanks entirely to the plunge in the Financial Conditions Component, which has fallen even faster than it did in 2014/15. Chart 6BCA Fed Monitor: Today Vs 2014/15
BCA Fed Monitor: Today Vs 2014/15
BCA Fed Monitor: Today Vs 2014/15
The implication from our Fed Monitor is that there needs to be more evidence of slowing U.S. economic growth and reduced inflation pressures for the Fed to stay on hold for longer. If the data stay firm, but financial conditions ease because investors expect a prolonged pause from the Fed, then the Fed could quickly return to a hawkish bias later this year. This is now our base case scenario for how 2019 will play out. This is also why we are only upgrading corporate debt on a tactical basis. We do not expect U.S. growth or inflation to slow enough to prevent more Fed tightening later this year – an outcome that will weigh on credit returns as the Fed moves to a restrictive policy stance. Yet even if we are wrong and the U.S. economy decelerates more sharply, that is also a bad outcome for credit because it means weaker corporate profits and rising downgrades and defaults. For bond investors with longer-time horizons than 3-6 months, the credit rally that we are anticipating can actually provide an opportunity to reduce credit exposure for the final leg of the Fed’s monetary policy cycle and the multi-year corporate credit cycle. In other words, selling into the rally rather than chasing it. For now, we are choosing to play for the shorter-term move by upgrading our recommended global credit allocations. Yet we do not envision this turning into a long-term position. The medium-term outlook for corporates is far more challenging given the advanced age of the monetary, business and credit cycles. Bottom Line: The Fed is now clearly signaling a near-term capitulation to tightening global financial conditions alongside slowing global growth and inflation. A pause in the U.S. rate hiking cycle, after credit spread valuations have cheapened up, opens up a window of opportunity for global corporate bond market outperformance versus government debt over the next 3-6 months. The Specific Changes To Our Recommended Asset Allocation As part of our tactical upgrade of global corporate debt, we are making the following changes to our recommended portfolio allocation tables (see Page 13): Upgrade overall global credit exposure to overweight (4 out of 5) Upgrade both U.S. investment grade and high-yield corporate exposure to overweight (4 out of 5), while downgrading U.S. Treasury exposure to underweight (2 out of 5) Upgrade euro area investment grade and high-yield corporate exposure to neutral (3 out of 5) and downgrade euro area government bond exposure to underweight (2 out of 5) Upgrade EM U.S. dollar denominated debt from maximum underweight to underweight (2 out of 5), both for sovereign and corporate debt. The changes all represent a one-notch upgrade from our previous allocations, based on our more positive tactical view on overall global credit risk, while still maintaining our relative preference for U.S. corporates over non-U.S. equivalents. We prefer U.S. credit not only because we expect better relative economic growth momentum in the U.S., but also because our preferred valuation metrics indicate that U.S. corporate bond spreads now look relatively attractive. Our estimate of the default-adjusted spread on U.S. high-yield corporates, which is simply the current spread minus losses from defaults, has risen to 302bps, well above the long-run average of 268bps (Chart 7). That is a function of the high-yield spread now discounting a 2019 default rate of nearly 6%, well above our forecasted default rate of 2.5%.5 Chart 7Too Much Default Risk Priced Into U.S. Junk
Too Much Default Risk Priced Into U.S. Junk
Too Much Default Risk Priced Into U.S. Junk
Corporate credit spreads in the U.S. also look attractive on a volatility-adjusted basis. Our estimates of Breakeven Spreads – the amount of spread widening required for corporate returns to break-even with duration-matched U.S. Treasuries on a one-year horizon – shows that credit spreads have cheapened to levels that are in the upper end of the historical range for both investment grade and high-yield debt (Charts 8 & 9). Chart 8Vol-Adjusted IG Spreads Have Cheapened
Vol-Adjusted IG Spreads Have Cheapened
Vol-Adjusted IG Spreads Have Cheapened
Chart 9Vol-Adjusted HY Spreads Are Cheap
Vol-Adjusted HY Spreads Are Cheap
Vol-Adjusted HY Spreads Are Cheap
Credit spreads have also cheapened up in Europe and EM, and a “risk-on” rally from a Fed pause will likely benefit spread product in those regions. However, the performance of U.S. credit versus non-U.S. credit remains largely determined by relative growth trends (Charts 10 & 11). Given our more positive view on U.S. growth on a relative basis, we are maintaining a higher recommended allocation to U.S. corporates versus euro area and EM equivalents, even as we upgrade overall global corporate exposure. This is also a way to provide a partial hedge to the specific risks in the latter regions coming from: Chart 10Global Corporates: Continue Favoring U.S. Over Europe
Global Corporates: Continue Favoring U.S. Over Europe
Global Corporates: Continue Favoring U.S. Over Europe
Chart 11Global Corporates: Continue Favoring U.S. Over EM
Global Corporates: Continue Favoring U.S. Over EM
Global Corporates: Continue Favoring U.S. Over EM
a) an end of the ECB’s corporate bond buying as part of its Asset Purchase Program, which takes a major buyer out of the euro area corporate market b) a more persistent slowing of Chinese growth momentum and softer non-oil commodity prices, both of which would be negatives for EM assets On a final note, we are also changing the specific weighting in our Model Bond Portfolio on Page 12 to reflect all of the above changes. The allocations to all U.S., euro area and EM corporates are increased – with bigger allocation changes in the U.S. – funded out of reduced weightings in U.S., German and French government bonds. Note that we are not making any changes to our relative U.K. exposures this week, given the unique risk for U.K. financial markets from the Brexit uncertainty. Thus, we are maintaining an overweight stance on U.K. Gilts in the government bond portion of the model portfolio, while remaining underweight U.K. corporates on the credit side. Robert Robis, CFA, Senior Vice President Global Fixed Income Strategy rrobis@bcaresearch.com Footnotes 1 Please see BCA Global Fixed Income Strategy Weekly Report, “Time To Take Some Chips Off The Table: Downgrade Global Corporate Bond Exposure To Neutral”, dated June 26th 2018, available at gfis.bcaresearch.com. 2 Please see BCA U.S. Bond Strategy Weekly Report, “A Checklist For Peak Credit Spreads”, dated November 27th 2018, available at usbs.bcaresearch.com. 3 Please see BCA China Investment Strategy Weekly Report, “Trade Is Not China’s Only Problem”, dated November 21st 2018, available at cis.bcaresearch.com. 4 Please see BCA Global Fixed Income Strategy Weekly Report, “Three Big Questions To Start Off 2019”, dated January 8th 2019, available at gfis.bcaresearch.com. 5 That forecasted default rate is taken from Moody’s, who have a similarly positive outlook on 2019 U.S. growth as BCA. Therefore, we see no reason to use a different default rate assumption in our high-yield valuation estimate. Recommendations The GFIS Recommended Portfolio Vs. The Custom Benchmark Index
Enough With The Gloom: Upgrade Global Corporates On A Tactical Basis
Enough With The Gloom: Upgrade Global Corporates On A Tactical Basis
Duration Regional Allocation Spread Product Tactical Trades Yields & Returns Global Bond Yields Historical Returns
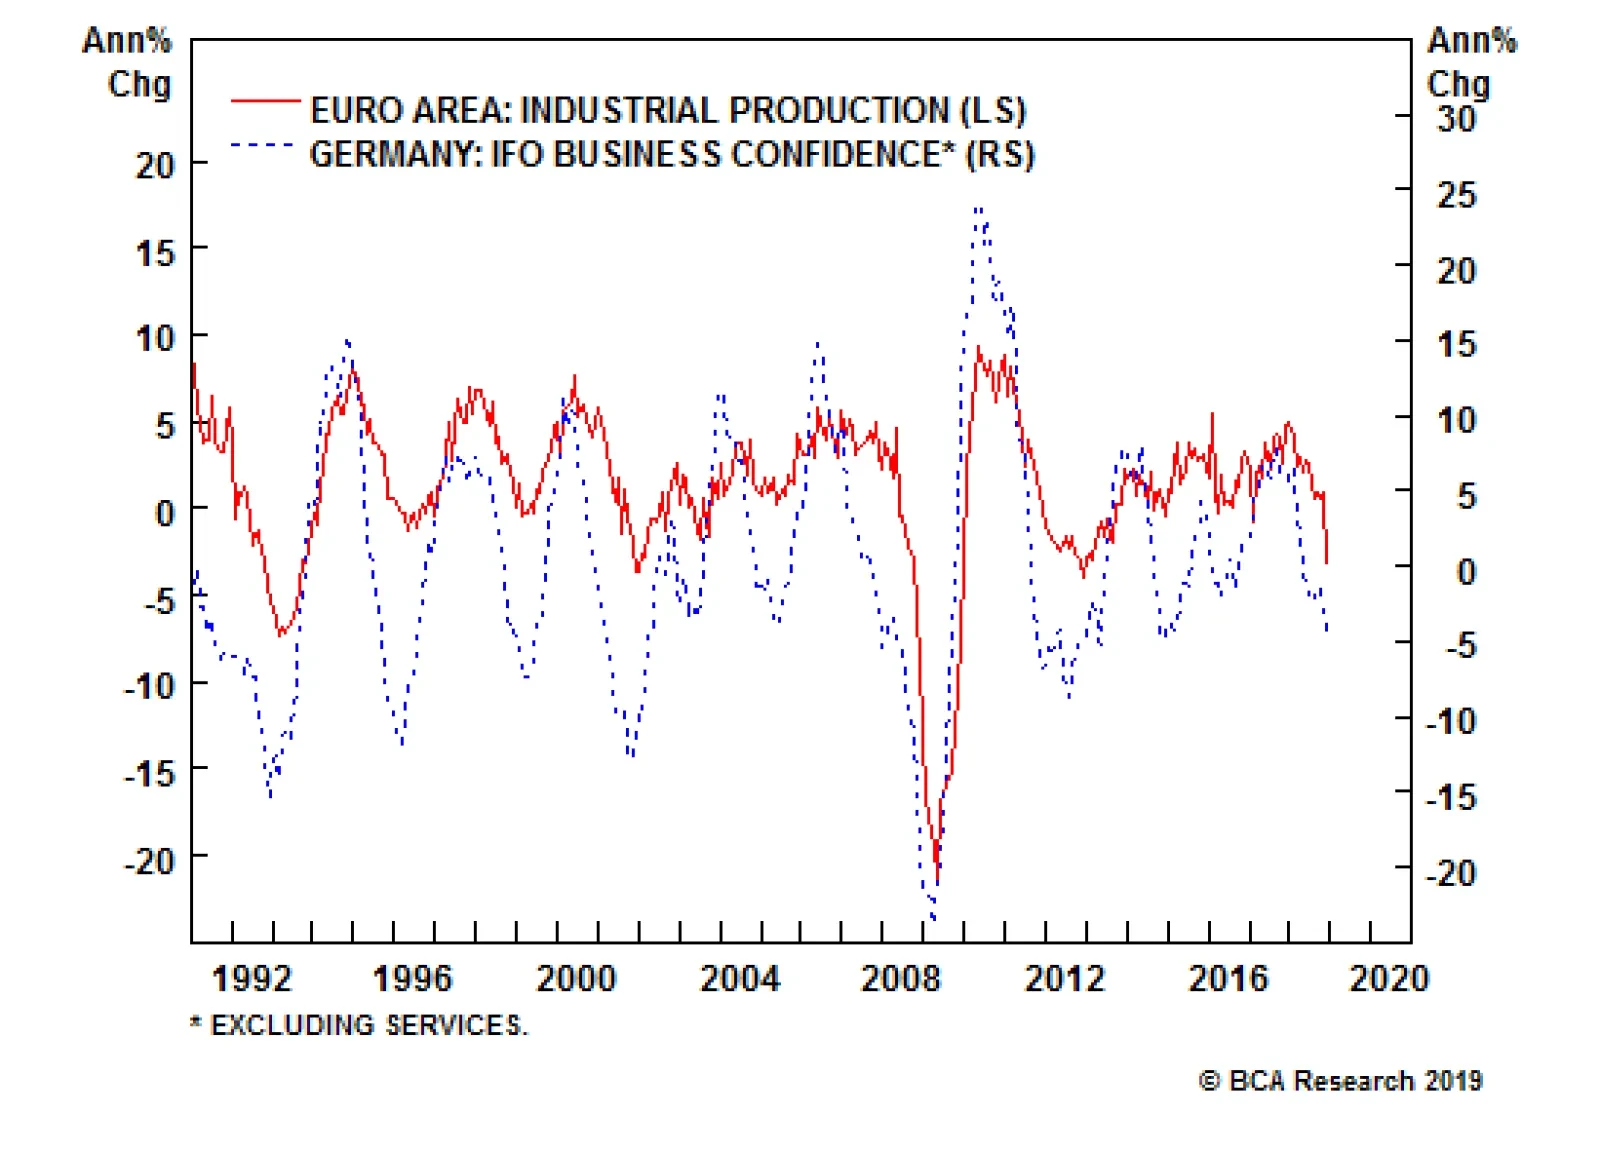
Today’s Industrial production in the euro area dropped to -3.3% on a year-on-year basis, much worse than expectations. The month-over-month number is -1.7%. This grim result raises concerns on the growth conditions in Europe. First, political tensions in…
Highlights All of our recent investment recommendations have performed very strongly but have further to go: 1. Own a combination of European banks plus U.S. T-bonds. 2. Overweight EM versus DM. 3. Overweight European versus U.S. equities. 4. Overweight Italian assets versus European assets. 5. Overweight the JPY. Feature Chart of the WeekBank Outperformance Corroborates A Growth Rebound
Bank Outperformance Corroborates A Growth Rebound
Bank Outperformance Corroborates A Growth Rebound
2019 will be the investment mirror-image of 2018. Last year started with growth fading and inflation on the cusp of picking up, both in Europe and around the world. This year has started with the European and global economies in the mirror-image configuration: growth likely to rebound, albeit modestly, and inflation set to fade (Chart I-2). Chart I-2Why 2019 Is The Mirror-Image Of 2018
Why 2019 Is The Mirror-Image Of 2018
Why 2019 Is The Mirror-Image Of 2018
However, as 2019 unfolds, the configuration will reverse, requiring a flip from a pro-cyclical to a pro-defensive investment tilt later in the year. This contrasts with 2018 which started pro-defensive and ended pro-cyclical. In this regard, the economic and investment shape of 2019 will be the mirror-image of 2018. Growth To Rebound, Inflation To Fade A tell-tale sign of a growth rebound is the recent outperformance of banks. Around the world, yield curves have flattened – or even inverted – meaning that banks’ net interest margins have compressed. This compression of bank profit margins is normally bad news for bank equities. Yet banks have been outperforming, not just in Europe but globally (Chart I-3). If margins are compressing, the plausible explanation for outperformance would be an improved outlook for asset growth, reflecting both a reduction in bad debt provisioning and a pick-up in bank credit growth. Chart I-3Banks Have Been Outperforming Since October
Banks Have Been Outperforming Since October
Banks Have Been Outperforming Since October
Independently and reassuringly, our proprietary credit impulse analysis supports this thesis (Chart of the Week). Six-month credit impulses have been rebounding not only in Europe, but also in the United States and very impressively in China (Chart I-4). Chart I-46-Month Credit Impulses Have Rebounded Everywhere
6-Month Credit Impulses Have Rebounded Everywhere
6-Month Credit Impulses Have Rebounded Everywhere
At the same time, inflation is set to disappoint as the recent near-halving of the crude oil price feeds into both headline and core consumer price indexes. With central banks now promising even greater “dependence on the incoming data”, this unfolding dynamic will force them to temper any hawkish intentions and rhetoric, limiting the extent of upside in bond yields. In this configuration, the combination of European banks plus U.S. T-bonds which we first recommended in November is still appropriate (Chart I-5). The position is up 3 percent in little more than a month and has further to go.1 Chart I-5Own A Combination Of Banks And Bonds
Own A Combination Of Banks And Bonds
Own A Combination Of Banks And Bonds
Europe’s largest economy, Germany, should benefit from another support to growth. Last year, the auto sector – a major engine of the German economy – spluttered as it absorbed the new WLTP emissions testing standard. Through the middle of 2018 German motor vehicle exports suffered a €20 billion hit which shaved 0.6 percent from Germany’s €3.4 trillion economy (Chart I-6). Now, if auto exports stabilize, this drag will disappear. And if auto exports recover to the pre-WLTP level after this one-off and temporary shock, Germany will receive a 0.6% mirror-image boost to growth.2 Chart I-6German Auto Exports Suffered A WLTP Hit
German Auto Exports Suffered A WLTP Hit
German Auto Exports Suffered A WLTP Hit
Regional Allocation Is Always And Everywhere About Sectors The European equity earnings cycle is tightly connected with global growth oscillations (Chart I-7). The simple reason is that the European equity market is over-exposed to classically growth-sensitive sectors such as banks and industrials. Chart I-7The European EPS Cycle Is Tightly Connected With Global Growth Oscillations
The European EPS Cycle Is Tightly Connected With Global Growth Oscillations
The European EPS Cycle Is Tightly Connected With Global Growth Oscillations
The emerging market earnings cycle is also connected with global growth oscillations (Chart I-8) because emerging markets have a very high exposure to banks. But the much less understood reason is that emerging markets have a near-zero exposure to healthcare (Table I-1). In sharp contrast, the U.S. equity earnings cycle has almost no connection with global growth oscillations (Chart I-9) because the U.S. equity market is over-exposed to technology and healthcare, neither of which are classically cyclical sectors. Chart I-8The EM EPS Cycle Is Also Connected With Global Growth Oscillations...
The EM EPS Cycle Is Also Connected With Global Growth Oscillations...
The EM EPS Cycle Is Also Connected With Global Growth Oscillations...
Chart I-9...But The U.S. EPS Cycle Is Not Connected With Global Growth Oscillations
...But The U.S. EPS Cycle Is Not Connected With Global Growth Oscillations
...But The U.S. EPS Cycle Is Not Connected With Global Growth Oscillations
Chart I-
Hence the allocation to emerging market (EM) versus developed market (DM) equities, and to Europe versus the U.S. reduce to simple equity sector calls. A quick glance at Chart I-10 and Chart I-11 will reveal two fundamental and inescapable truths: Chart I-10EM Outperforms DM When Global Banks Outperform Healthcare
EM Outperforms DM When Global Banks Outperform Healthcare
EM Outperforms DM When Global Banks Outperform Healthcare
Chart I-11European Equities Outperform U.S. Equities When Global Banks Outperform Technology
11. European Equities Outperform U.S. Equities When Global Banks Outperform Technology
11. European Equities Outperform U.S. Equities When Global Banks Outperform Technology
EM outperforms DM when global banks outperform global healthcare. European equities outperform U.S. equities when global banks outperform global technology. But is this just about so-called ‘beta’? No, banks can outperform in a rising market by going up more or, as recently, in a falling market by going down less. So this is always and everywhere about head-to-head sector relative performances. My colleague Arthur Budaghyan, our chief emerging market strategist, remains steadfastly pessimistic on the structural outlook for EM versus DM. We agree with Arthur, albeit we arrive at the structural conclusion from a completely different perspective. To reiterate, for EM to outperform DM global banks must outperform global healthcare. However, over an extended period this will prove to be an extremely tall order. As detailed in European Banks: The Case For And Against, blockchain is a long-term extinction threat to banks’ business models and profitability. Whereas healthcare is still a major growth sector as people focus more spending on improving the quality and quantity of their lifespans.3 Nevertheless, from a purely tactical perspective, the growth up-oscillation phase that started in October can continue for a little while longer allowing the recent countertrend moves to persist – especially as the recent decline in bond yields could further spur credit growth in the near term. So for the moment stay overweight: EM versus DM. European equities versus U.S. equities. Italian assets versus European assets. Bargain Basement Currencies Another of my colleagues Doug Peta, our chief U.S. strategist, has coined a lovely metaphor: “you cannot get hurt falling out of a basement window”. The metaphor beautifully captures the asymmetry when you are near the floor or ‘zero-bound’. Doug uses it to explain that small contributors to an economy have a limited capacity to damage economic growth because they cannot fall very far. We think the metaphor applies equally to interest rates when they are at or near their lower bound, which is to say, in the basement. This begs the obvious question: if interest rates are in the basement, then what is it that cannot get hurt much? The answer is: the exchange rate. The payoff profile for exchange rates just tracks expected long-term interest rate differentials. This means that when the expected interest rate is in or near the basement, the currency possesses a highly attractive payoff profile called positive skew. In essence, for any central bank already at the realistic limit of ultra-loose policy – such as the BoJ and ECB – policy rate expectations are effectively in the basement. They cannot go significantly lower. In contrast, policy rate expectations for the Federal Reserve are somewhere between the seventh and twelfth storey of the building (Chart I-12). From which you can get seriously hurt if you fall out of the window! Chart I-12You Cannot Get Hurt Falling Out Of A Basement Window
You Cannot Get Hurt Falling Out Of A Basement Window
You Cannot Get Hurt Falling Out Of A Basement Window
The upshot is that currency investors should always own at least one currency whose interest rate is in the basement against one whose interest rate is high up in the building, susceptible to fall out at some point, and get seriously hurt. The near term complication is the risk, albeit low, of a no-deal Brexit which would hurt European economies and currencies to a greater or lesser extent. Until the Brexit fog shows some signs of clearing, we would prefer the currency whose interest rate is in the basement to be a non-European currency. So for the moment, our favourite major currency remains the JPY. Dhaval Joshi, Senior Vice President Chief European Investment Strategist dhaval@bcaresearch.com Fractal Trading System* We are pleased to report that the 50:50 combination of Litecoin and Ethereum has surged by 42 percent in just two weeks! Also, long EUR/NZD achieved its 2.5 percent profit target and is now closed. This week’s trade is in line with the recommendation in the main body of this report to become pro-cyclical. Go long global industrials versus global utilities with a profit target of 3 percent and a symmetrical stop-loss. For any investment, excessive trend following and groupthink can reach a natural point of instability, at which point the established trend is highly likely to break down with or without an external catalyst. An early warning sign is the investment’s fractal dimension approaching its natural lower bound. Encouragingly, this trigger has consistently identified countertrend moves of various magnitudes across all asset classes. Chart I-13
Long Global Industrials Vs. Global Utilities
Long Global Industrials Vs. Global Utilities
The post-June 9, 2016 fractal trading model rules are: When the fractal dimension approaches the lower limit after an investment has been in an established trend it is a potential trigger for a liquidity-triggered trend reversal. Therefore, open a countertrend position. The profit target is a one-third reversal of the preceding 13-week move. Apply a symmetrical stop-loss. Close the position at the profit target or stop-loss. Otherwise close the position after 13 weeks. Use the position size multiple to control risk. The position size will be smaller for more risky positions. * For more details please see the European Investment Strategy Special Report “Fractals, Liquidity & A Trading Model,” dated December 11, 2014, available at eis.bcaresearch.com Footnotes 1 The European banks position is relative to the broader equity market, and the recommended combination is 25 cents in the banks and 75 cents in the bonds. 2 German auto net exports and GDP are quoted at annualized rates. The Worldwide Harmonized Light Vehicle test Procedure (WLTP) is a new standard for auto emissions that took effect on September 1, 2018. 3 Please see the European Investment Strategy Special Report “European Banks: The Case For And Against”, November 8, 2018 available at eis.bcaresearch.com. Fractal Trading System Recommendations Asset Allocation Equity Regional and Country Allocation Equity Sector Allocation Bond and Interest Rate Allocation Currency and Other Allocation Closed Fractal Trades Trades Closed Trades Asset Performance Currency & Bond Equity Sector Country Equity Indicators Bond Yields Chart II-1Indicators To Watch - Bond Yields
Indicators To Watch - Bond Yields
Indicators To Watch - Bond Yields
Chart II-2Indicators To Watch - Bond Yields
Indicators To Watch - Bond Yields
Indicators To Watch - Bond Yields
Chart II-3Indicators To Watch - Bond Yields
Indicators To Watch - Bond Yields
Indicators To Watch - Bond Yields
Chart II-4Indicators To Watch - Bond Yields
Indicators To Watch - Bond Yields
Indicators To Watch - Bond Yields
Interest Rate Chart II-5Indicators To Watch - Interest Rate Expectations
Indicators To Watch - Interest Rate Expectations
Indicators To Watch - Interest Rate Expectations
Chart II-6Indicators To Watch - Interest Rate Expectations
Indicators To Watch - Interest Rate Expectations
Indicators To Watch - Interest Rate Expectations
Chart II-7Indicators To Watch - Interest Rate Expectations
Indicators To Watch - Interest Rate Expectations
Indicators To Watch - Interest Rate Expectations
Chart II-8Indicators To Watch - Interest Rate Expectations
Indicators To Watch - Interest Rate Expectations
Indicators To Watch - Interest Rate Expectations
Dear Client, In lieu of next week’s report, I will be hosting a webcast on Wednesday, January 9th at 10 AM EST, when I will be discussing the economic and financial market outlook for 2019 and answering your questions. Best regards, Peter Berezin, Chief Global Strategist Highlights The lack of major financial and economic imbalances in the U.S., as well as the Fed’s ability to moderate the pace of rate hikes, reduce the risk of a vicious cycle where tighter financial conditions lead to slower economic growth and even tighter financial conditions. The scope for central banks to cut rates is more limited outside the United States. Imbalances are also greater abroad. Nevertheless, the news is not all bleak, with the recent rebound in China’s credit impulse being a case in point. We turned more bullish on risk assets following December’s post-FOMC equity sell-off. A moderately overweight position in global equities over a 12-month horizon is currently justified. While we continue to favor the U.S. over other bourses in dollar terms, our conviction level in this regional bias has decreased. Treasury yields are likely to rise in an environment where U.S. growth is strong enough to enable the Fed to continue raising rates. Outside Japan, global government bond yields will also increase in 2019. We are removing our long June-2019 Fed funds futures contract hedge, and we are now solely outright short the December-2020 contract. We are also taking profits on our March-2019 EEM ETF put for a gain of 104%. Feature Merry Crisis And A Happy New Fear Santa arrived early this year. The plunge in stocks allowed investors to buy some of the world’s premier companies at a mouthwatering 20%-to-30% discount to what they would have paid just a few months earlier. What a gift! Needless to say, most investors would not regard last month’s stock market performance in such a favorable light. But why not? One answer is that investors must mark their portfolios to market. Thus, even if the decline in equity prices raised future returns, it still implied a decline in present net worth. Yet, this cannot be the whole explanation, because if all investors expected stocks to bounce back quickly, they would not have sold in the first place. Clearly, many investors must have come to the conclusion that the stock market would not only go down but stay down. However, this presents a puzzle. The economic environment did not change that much in the weeks leading up to the October sell-off. Growth has slowed more recently (Chart 1), with this morning’s disappointing ISM manufacturing report being the latest example, but this appears to have been mainly a response to the souring market climate rather than the cause of it. Chart 1Tighter Financial Conditions Have Led To Slower Growth
Tighter Financial Conditions Have Led To Slower Growth
Tighter Financial Conditions Have Led To Slower Growth
Reverse Causality? This raises an intriguing possibility: What if the drop in stock prices and jump in credit spreads that began in late September hurt expectations of economic growth by enough to justify a further discount in risk asset valuations? Such a “Financial Conditions Index (FCI) doom loop” is not just a theoretical construct. The last two U.S. recessions were both the products of burst asset bubbles — first the dotcom bubble and then the housing bubble. Could such a self-fulfilling vicious cycle be erupting again? If so, any rally in stocks or credit should be sold into, just as was the case in both 2001 and 2007. U.S. Fairly Resilient To A Doom Loop Fortunately, there are two reasons to think that such an outcome will not reoccur, at least not in the United States. First, as Box 1 explains, an FCI doom loop is more likely to unfold when economic growth becomes very sensitive to changes in financial conditions. This normally happens when economic and financial imbalances are elevated. That does not appear to be the case today. Unlike in the lead-up to the last two recessions, the U.S. private sector is a net saver whose income outstrips spending by 2.1% of GDP (Chart 2). Cyclical spending – the sum of residential investment, business capex, and expenditures on consumer durable goods – is also far below prior business-cycle peaks as a share of GDP (Chart 3). Chart 2The U.S. Private Sector Is A Net Saver
The U.S. Private Sector Is A Net Saver
The U.S. Private Sector Is A Net Saver
Chart 3U.S. Economy: Cyclical Spending Is Still Restrained
U.S. Economy: Cyclical Spending Is Still Restrained
U.S. Economy: Cyclical Spending Is Still Restrained
Despite recent releveraging in some categories, U.S. household debt has continued to decline in relation to the size of the economy. The ratio of personal debt-to-disposable income is now 34 percentage points below pre-crisis levels (Chart 4). Chart 4Household Leverage Is Below Its Peak
Household Leverage Is Below Its Peak
Household Leverage Is Below Its Peak
U.S. corporate debt has moved in the opposite direction. Nevertheless, while the ratio of U.S. corporate debt-to-GDP has climbed to a record high, it is still quite low by global standards (Chart 5). Perhaps more importantly, corporate debt is generally held by non-leveraged institutions. If corporate defaults were to rise unexpectedly, the losses to lenders would not pose the same systemic risk to the financial sector as mortgage defaults did during the Global Financial Crisis. Chart 5U.S. Corporate Debt Is High, But It Is Higher Elsewhere
U.S. Corporate Debt Is High, But It Is Higher Elsewhere
U.S. Corporate Debt Is High, But It Is Higher Elsewhere
The Fed’s Reaction Function It is not surprising that the stock market sell-off accelerated in early October following Fed Chairman, and failed golfer, Jay Powell’s comment that interest rates were “far from neutral.” We think that worries that the Fed will tighten too quickly are misplaced. Yes, monetary policy operates with “long and variable lags.” However, financial conditions, which lead growth, can be observed in real time (Chart 6). Chart 6Global Financial Conditions Have Tightened
Global Financial Conditions Have Tightened
Global Financial Conditions Have Tightened
Most of the tightening in financial conditions since late September has been due to falling equity prices. Our baseline scenario envisions a gain of roughly 10% in the S&P 500 in 2019. A rebound in stocks of this magnitude will reverse most of the recent FCI tightening, thereby allowing the Fed to raise rates three times this year. But if equities continue to sag, the Fed will scale back further monetary tightening or even cut rates. The mere possibility of such a policy response reduces the odds of an FCI doom loop. A Mixed Bag Outside The U.S. The economic outlook is murkier outside the United States. Economic and financial imbalances are greater in the EM space and parts of Europe. Non-U.S. central banks also have less scope to respond to adverse shocks, either because of fears that looser monetary policy will spark capital outflows (as is the case in many emerging markets) or because of the presence of the zero-bound constraint on interest rates (as is the case in the euro area and Japan). Nevertheless, the situation is not that bad. EM assets have been fairly resilient over the past few months, at least in comparison to their developed economy counterparts (Chart 7). China’s credit impulse has actually perked up, an indication that while credit growth is falling, it is doing so at a slower pace. Chart 8 shows that the Chinese credit impulse is highly correlated with global industrial commodity prices. We still expect global growth to slow in the first half of 2019, but at this point, much of the slowdown has been discounted in asset markets. With that in mind, we are raising the stop on our short AUD/JPY trade to 10% and instituting a profit target of 15%. Chart 7EM Assets Have Been Outperforming Recently
EM Assets Have Been Outperforming Recently
EM Assets Have Been Outperforming Recently
Chart 8The Increase In China's Credit Impulse Bodes Well For Industrial Commodity Prices
The Increase In China's Credit Impulse Bodes Well For Industrial Commodity Prices
The Increase In China's Credit Impulse Bodes Well For Industrial Commodity Prices
The Perils Of Discrete Decision-Making One of the annoyances of being an investment strategist is that you often feel compelled to take discrete views on where the markets are heading. Are you bullish, bearish, or neutral? Actually, it is usually just bullish or bearish because most people regard neutral views as lacking in conviction and insight. This incentive structure is counterproductive. Not only does it cause analysts to turn a blind eye to incoming data that may challenge their thesis, it disregards how professional investors actually operate. Successful investors scale into positions as the market gets cheaper and scale out as it becomes more expensive. Trying to time the bottom (or the top) with exact precision is futile. With that in mind, we are going to tweak the way we make recommendations going forward in order to improve transparency, accountability, and accuracy. Rather than simply stating whether we are bullish, bearish, or neutral, we will assign the main asset classes a subjective score between zero and one hundred, with 0-to-40 being bearish, 40-to-60 being neutral, and 60-to-100 being bullish. We will adjust the score in every publication. To add analytic rigor to this framework, we will also compare our subjective model score with that of our MacroQuant model. Where Things Now Stand We downgraded global equities last June, but moved back to overweight following December’s post-FOMC meeting sell-off, as valuations reached that rather blurry line at which a modest equity overweight was warranted. Our subjective score for global equities currently stands at 65%, above the model’s estimate of 50%. Our moderately bullish view reflects our expectation that global growth will stabilize by mid-year and monetary policy will remain accommodative, even if the Fed raises rates by more than what the markets are currently discounting. Tempering our enthusiasm is the recognition that the business cycle is getting long in the tooth – especially in the U.S. – and that global equity valuations, while far cheaper than they were a few months ago, are still significantly less favorable than they were near past market bottoms (Chart 9). Chart 9Global Equity Valuations Have Improved
Global Equity Valuations Have Improved
Global Equity Valuations Have Improved
Regionally, we continue to favor U.S. stocks over other developed markets, and DM over EM more broadly. However, our conviction level on this view is not high, and we are prepared to revise it if it looks like global growth is accelerating, an outcome that would limit any further dollar strength (our subjective dollar score currently stands at 70%, below the model’s estimate of 92%). Reflecting our expectation of decent global equity returns in 2019 and our waning conviction to be underweight EM, we are taking profits on in our March-2019 EEM ETF put for a gain of 104%. Please note that our view on EM is more optimistic than that of Arthur Budaghyan, BCA’s chief emerging markets strategist, who continues to see considerable downside risks to EM assets. For now, Treasury yields are likely to rise in an environment where U.S. growth is strong enough to enable the Fed to continue raising rates. We assign the 10-year yield a score of 30%, which is close to our model estimate of 32%. Accordingly, we are removing our long June-2019 Fed funds futures contract hedge, and we are now solely outright short the December-2020 contract. Core European bond yields will increase, reflecting diminished excess capacity in the euro area and the end of ECB net asset purchases. U.K. yields should also grind higher, as the odds of a soft Brexit (or no Brexit) improve. Only in Japan will yields remain contained, thanks to the BoJ’s ongoing yield curve control regime. We do not expect spread product to have a banner year, but the current yield pick-up should be sufficient to ensure that risky credit outperforms cash. Peter Berezin, Chief Global Strategist Global Investment Strategy peterb@bcaresearch.com Box 1 The Analytics Of Doom Loops When will a tightening in financial conditions stemming from lower equity prices and higher borrowing costs lead to a vicious circle of slower economic growth and even tighter financial conditions? The answer depends on how sensitive economic growth is to financial conditions in relation to how sensitive financial conditions are to growth. Figure 1 shows two equilibrium schedules, one for the economy (EE) and one for asset markets (AA). Both schedules slope downward. The EE schedule is downward-sloping because easier financial conditions boost growth. If growth is too strong given the prevailing level of financial conditions, economic activity will slow (Panel A). The AA schedule is downward-sloping because equity prices tend to fall and credit spreads rise when growth slows. If equity prices are too high and credit spreads are too narrow for a certain level of growth, then financial conditions will tighten (Panel B). Suppose economic growth is not very sensitive to changes in financial conditions, perhaps because imbalances in the economy are limited (Panel C). Then changes in financial conditions will be fleeting: A decline in equity prices or a widening in credit spreads will not hurt growth very much, allowing the stock market and credit market to quickly normalize. In contrast, suppose that economic growth is very sensitive to financial conditions, so much so that the EE schedule is flatter than the AA schedule. In this case, the economy will be vulnerable to self-reinforcing booms and busts (Panel D). In particular, a small random jump from U to UI will send the economy careening towards a doom loop of ever-weaker growth and tighter financial conditions.
Chart 10
Strategy & Market Trends MacroQuant Model And Current Subjective Scores
Chart 11
Tactical Trades Strategic Recommendations Closed Trades
GAA DM Equity Country Allocation Model Update The GAA DM Equity Country Allocation model is updated as of December 31, 2018. The quant model reduced Spain’s large overweight to a slight overweight, and further downgraded the U.S. allocation. As a result, the model now has assigned overweight allocations to Germany, Switzerland, the Netherlands, Canada and Italy, with underweight allocations to the U.S., Japan, France and U.K. Australia and Sweden are now in the neutral zone, as shown in Table 1. Table 1Model Allocation Vs. Benchmark Weights
GAA Quant Model Updates
GAA Quant Model Updates
As shown in Table 2 and Chart 1, Chart 2 and Chart 3, the overall model outperformed the MSCI world benchmark by 38 bps in December, with a 48 bps of outperformance from Level 1 model offset by a 21 bps of underperformance from Level 2. Since going live, the overall model has outperformed by 96 bps, with Level 2 outperforming by 120 bps and level 1 outperforming by 57 bps. Table 2Performance (Total Returns In USD %)
GAA Quant Model Updates
GAA Quant Model Updates
Chart 1GAA DM Model Vs. MSCI World
GAA DM Model Vs. MSCI World
GAA DM Model Vs. MSCI World
Chart 2GAA U.S. Vs. Non U.S. Model (Level 1)
GAA U.S. Vs. Non U.S. Model (Level 1)
GAA U.S. Vs. Non U.S. Model (Level 1)
Chart 3GAA Non U.S. Model (Level 2)
GAA Non U.S. Model (Level 2)
GAA Non U.S. Model (Level 2)
Please see also the website http://gaa.bcaresearch.com/trades/allocation_performance. For more details on the models, please see Special Report, “Global Equity Allocation: Introducing The Developed Markets Country Allocation Model,” dated January 29, 2016, available at https://gaa.bcaresearch.com. Please note that the overall country and sector recommendations published in our Monthly Portfolio Update and Quarterly Portfolio Outlook use the results of these quantitative models as one input, but do not stick slavishly to them. We believe that models are a useful check, but structural changes and unquantifiable factors need to be considered too in making overall recommendations. GAA Equity Sector Selection Model Dear Client, As advised in our October 2018 Special Alert, we have suspended the GAA Equity Sector Selection Model due to the significant changes in the GICS sector classifications, implemented at the end of September. We will rebuild the model using the newly constituted sectors once full back data is available from MSCI, which we understood would be in December but which we have not received yet. We thank you for your understanding. Xiaoli Tang, Associate Vice President xiaoliT@bcaresearch.com Amr Hanafy, Research Associate amrh@bcaresearch.com
The Brexit tension remains high and may even intensify in early 2019 before a resolution arrives. Hence, while 2019 will offer a great opportunity to buy the pound, it will require a little patience. In contrast, Italy is de-escalating its brinkmanship…
Dear Client, We are sending you our last issue of the year, which contains a lighter fare than usual, highlighting 10 charts we find important. The first three charts tackle questions of Chinese growth, global activity and the outlook for the Federal Reserve. The other seven relate directly to the currency market. We will resume our regular publishing schedule on January 4th, 2019. The Foreign Exchange Strategy team would like to thank you for your continued readership and wish you and yours a joyful holiday season as well as a healthy, happy and prosperous 2019. Warm Regards, Mathieu Savary, Vice President Foreign Exchange Strategy mathieu@bcaresearch.com Feature 1) Chinese Growth Outlook Since the 19th National Congress of the Communist Party of China, Beijing has been focused on controlling debt growth. The Chinese leadership is worried that too much debt will lead to the dreaded middle-income trap, whereby a country’s development stalls once it achieves middle-income status. Because of Beijing’s laser focus on debt, Chinese growth, especially in the industrial sector, has slowed. Yet in the second half of 2018, Chinese policymakers have grown concerned by the deepening malaise in the domestic economy. Consequently, they have loosened policy, accelerating the issuance of local government bonds, letting the repo rate fall to 2.7% and cutting the reserve requirement ratio to 14.5%. Despite these measures, credit growth has continued to slow, hitting 16-year lows, and crucially, the shadow banking system is still contracting (Chart 1, left panel). While the supply of credit remains tepid, declining demand for credit is more concerning. China’s marginal propensity to save, as approximated by the gap between the growth of M2 and M1 money supply, is still rising. Historically, a rising marginal propensity to save leads to slowing industrial activity and slowing import growth (Chart 1, right panel). This implies that China will continue to weigh on global trade and global industrial activity. Thus, to turn growth around, Chinese policymakers will need to ease policy further. Chart 1AChinese Growth Will Slow Further (I)
Chinese Growth Will Slow Further (I)
Chinese Growth Will Slow Further (I)
Chart 1BChinese Growth Will Slow Further (II)
Chinese Growth Will Slow Further (II)
Chinese Growth Will Slow Further (II)
2) Global Growth And Inflation Outlook Already, the outlook for Chinese growth points to additional downside to global growth – something EM carry trades financed in yen are already sniffing out (Chart 2, left panel). The deterioration in the performance of those carry trades further amplifies the negative impulse emanating from China. If high-yielding EM currencies depreciate versus funding currencies like the yen, money is leaving those economies. Hence, EM liquidity conditions are tightening and financial conditions are deteriorating, reinforcing the leading property of EM carry trades vis-à-vis global industrial activity. Chart 2ASlowing Global Growth And Inflation (I)
Slowing Global Growth And Inflation (I)
Slowing Global Growth And Inflation (I)
Chart 2BSlowing Global Growth And Inflation (II)
Slowing Global Growth And Inflation (II)
Slowing Global Growth And Inflation (II)
Moreover, as telegraphed by the relative performance of EM bonds to EM equities, global inflation is set to peak soon, and then decelerate (Chart 2, right panel). This is a natural consequence of the deflationary impact of slowing Chinese growth and tightening EM liquidity conditions – the two most crucial factors lying behind the softness in global growth. Thus, financial markets are likely to remain volatile, at least until global policymakers have changed their tune enough to reverse global growth and inflation dynamics. 3) The Fed Is On Track To Hike More Than The Market Believes In its latest set of forecasts, the Federal Reserve may have been forced to adjust how much it will hike interest rates over the coming years. Nonetheless, by the end of 2020, the FOMC still anticipates having to increase interest rates by more than the -8 basis points currently priced into the futures curve. We are inclined to side with the Fed. U.S. growth may be slowing, but it will remain above trend in 2019. Additionally, the U.S. economy is most likely already at full employment, thus inflationary pressures are building. For the Fed, the labor market remains the fulcrum of potential inflation. As the left panel of Chart 3 shows, both the Atlanta Fed Wage Tracker and BLS average hourly earnings are growing at an accelerating pace, giving the Fed ammo to hike rates further. Moreover, the highly interest-sensitive housing sector has been a great source of concern for U.S. growth. However, now that this year’s surge in mortgage rates is being digested, mortgage applications are once again rebounding (Chart 3, right panel). This suggests that real estate activity will stabilize. Hence, even if the Fed pauses, it will still surprise markets to the upside over the coming 24 months. Chart 3AGood Reasons To Keep Hiking In 2019
Good Reasons To Keep Hiking In 2019
Good Reasons To Keep Hiking In 2019
Chart 3BGood Reasons To Keep Hiking In 2019
Good Reasons To Keep Hiking In 2019
Good Reasons To Keep Hiking In 2019
4) The Dollar Can Rally Even If U.S. Growth Falls Off A Cliff In our assessment, U.S. growth will slow next year, but will nonetheless remain above trend. However, if we are wrong and U.S. growth weakens much more, the dollar is unlikely to crater. As Chart 4 illustrates, periods of broad growth weakness – as measured by our U.S. economic diffusion index – often generate a strong – not weak – dollar. U.S. growth weakness often happens as global growth deteriorates. Since the U.S. economy exhibits a low beta to global industrial activity – the segment of the economy that contributes most to the variance in GDP growth – it follows that if a shock is global, the U.S. is likely to perform better than the rest of the world, leading to a strong dollar. Today, the downside risk is that the U.S. catches the cold that has hit the global economy. Hence, if U.S. growth has significantly more downside, it would suggest that economies outside the U.S. would suffer even more. The dollar should perform well in this environment. Chart 4The Dollar Doesn't Really Care If U.S. Growth Slows
The Dollar Doesn't Really Care If U.S. Growth Slows
The Dollar Doesn't Really Care If U.S. Growth Slows
5) The Dollar Versus Global Growth And Global Inflation The most important question to forecast the path of the dollar is where we stand in the global growth and inflation cycle. As Chart 5 shows, the dollar tends to perform most poorly early in the business cycle, when global growth is picking up but inflation remains muted (bottom-right quadrant), and late in the cycle when global growth has begun to weaken but inflation remains perky (top-left quadrant). The best time to hold the greenback is during global downturns, when both global growth and inflation are decelerating (bottom-left quadrant). With global industrial activity on a downtrend and inflation set to roll over soon, we are entering the bottom-left quadrant. As a result, the greenback should continue to rally on a trade-weighted basis, gaining most against the commodity currency complex. The yen may be the one currency bucking this trend, as in recent years it has become even more counter-cyclical than the dollar.
Chart 5
6) The Dollar Is A Momentum Currency One of the defining characteristics of the greenback is that from an investment-style perspective, it is a momentum currency. As the left panel of Chart 6 illustrates, among G-10 currencies, momentum continuation strategies work best for the USD. This is because of feedback loops present in the global economy.
Chart 6
Chart 6BMomentum Still Flashing A Greenlight For The Greenback (II)
Momentum Still Flashing A Greenlight For The Greenback (II)
Momentum Still Flashing A Greenlight For The Greenback (II)
Of the major economies, the U.S. is the least sensitive to global trade and global investment – a consequence of the low share of exports and manufacturing in GDP and employment. As a result, when global growth deteriorates, the U.S. economy experiences less of a slowdown and American rates of return decline less. Thus, money comes back into the U.S., lifting the dollar in the process. However, since there is USD 14-trillion in dollar-denominated foreign-currency debt, a rising dollar increases the cost of capital for these borrowers. The ensuing tightening in financial conditions hurts global growth, further enhancing the greenback’s appeal. The relationship goes in reverse once global growth improves. These powerful feedback loops explain why when the dollar strengthens, it remains stronger for longer than anyone anticipated, and vice versa when it weakens. Today, the momentum signal for the dollar remains positive (Chart 6, right panel). Along with slowing global growth, momentum was one of the key factors behind the dollar’s strength this year. If, as we expect, global inflation also weakens in the first half of 2019, the dollar will likely experience a beautiful first six months of the year. 7) Keep An Eye On Sino-U.S. Rate Differentials When one-year interest rate differentials between the U.S. and China widen, the DXY tends to strengthen (Chart 7, left panel). This is a reflection of global growth dynamics. U.S rates tend to rise relative to China when Chinese growth is decelerating. Since a slowing Chinese economy implies less intake of machinery and raw materials, a weaker China hurts Europe, Japan, EM and commodity producers a lot more than it affects the U.S. This lifts the dollar in the process. Moreover, so long as Chinese one-year interest rates keep falling versus the U.S., it also signals that any reflationary efforts by China have not yet had any impact on growth. Chart 7AU.S.-China Rate Differentials Point To A Stronger Dollar (I)
U.S.-China Rate Differentials Point To A Stronger Dollar (I)
U.S.-China Rate Differentials Point To A Stronger Dollar (I)
Chart 7BU.S.-China Rate Differentials Point To A Stronger Dollar (II)
U.S.-China Rate Differentials Point To A Stronger Dollar (II)
U.S.-China Rate Differentials Point To A Stronger Dollar (II)
This same rate differential between the U.S. and China also drives fluctuations in USD/CNY (Chart 7, right panel). Since falling relative Chinese rates are a symptom of a weaker Chinese economy, this relationship makes sense. Moreover, in recent years, more than against the dollar, Chinese policymakers have targeted the value of the CNY on a trade-weighted basis. Mechanically, if slowing Chinese growth flatters the trade-weighted dollar, it also forces USD/CNY up. This can further reinforce the strength in the broad trade-weighted dollar as a falling CNY is deflationary for the global economy. Because Chinese growth remains weak, we expect U.S. rates to continue to move higher vis-à-vis Chinese ones, lifting both the DXY and USD/CNY in the process. 8) EUR/USD: More Downside And A Complex Bottoming Process Ahead EUR/USD will suffer if global growth weakens and the dollar strengthens. On one hand, the European economy is much more sensitive to the Chinese and global industrial cycle than U.S. activity is. Our outlook for global growth therefore implies that the European Central Bank will find it difficult to raise rates in the fall of 2019, while the Fed is likely to surprise markets on the hawkish side. On the other hand, the simplest vehicle to bet on a strengthening dollar is to sell EUR/USD. Our fair-value model for EUR/USD currently pegs its equilibrium at 1.11 (Chart 8, left panel). However, EUR/USD never ends its downdrafts at its fair value – a consequence of its negative correlation with the dollar, a momentum currency that easily over- and under-shoots fair value. Thus, we expect the euro to find stability closer to 1.08. Chart 8AEUR/USD Will Bottom Later Next Year (I)
EUR/USD Will Bottom Later Next Year (I)
EUR/USD Will Bottom Later Next Year (I)
Chart 8BEUR/USD Will Bottom Later Next Year (II)
EUR/USD Will Bottom Later Next Year (II)
EUR/USD Will Bottom Later Next Year (II)
Moreover, inflationary dynamics do not suggest that EUR/USD is yet ripe for the taking. Since 2008, the gap between euro area and U.S. core CPI has been a reliable leading indicator for EUR/USD (Chart 8, right panel). In fact, this chart suggests that EUR/USD is more likely to bottom towards the second half of 2019; so as long as European inflation remains tepid, it will be hard for this currency to suddenly rebound and recoup the losses it has experienced this year. A complex bottom is more likely than a V-shaped one. 9) EUR/JPY: All About Bond Yields Even more so than USD/JPY, EUR/JPY remains beholden to trends in global bond yields (Chart 9). BCA’s view is that on a cyclical horizon of nine to 12 months, bond yields have upside. However, with global growth and inflation likely to decelerate further in the first half of 2019, safe haven assets could remain well bid over that timeframe. This implies the time to buy EUR/JPY is not now, and that a better buying opportunity will emerge once global growth stabilizes. Thus, we remain short EUR/JPY for the time being, a view we have held since the beginning of 2018. Chart 9Risks To Global Growth Equals EUR/JPY Downside
Risks To Global Growth Equals EUR/JPY Downside
Risks To Global Growth Equals EUR/JPY Downside
10) EUR/GBP Is At Risk At the current juncture, EUR/GBP is a binary bet: Either a hard Brexit comes to fruition, in which case U.K. real rates plummet and British inflation rises above 5%, creating a deeply pound-bearish environment. Alternatively, a soft Brexit (or even no Brexit) materializes, in which cases British real rates have upside, the Bank of England has a freer hand to combat inflationary pressures, and the pound can rally. With EUR/GBP currently trading toward the top of its historical distribution, we believe it is an attractive shorting opportunity (Chart 10). Marko Papic, BCA’s chief geopolitical strategist, assigns a less than 10% probability of a hard Brexit. As such, the pound is more likely to exist in a soft/no-Brexit world in 12 months than otherwise. This means the pound should be-revalued. Chart 10Sell EUR/GBP
Sell EUR/GBP
Sell EUR/GBP
We prefer playing the pound’s strength against the euro rather than the dollar, as we expect the dollar to rally further in the first half of 2019, so cable would be swimming against the tide. Moreover, when the dollar strengthens, historically EUR/GBP weakens, as the GBP has a lower beta to the dollar than the euro does. Hence, our dollar view is also consistent with a lower EUR/GBP. Mathieu Savary, Vice President Foreign Exchange Strategy mathieu@bcaresearch.com Trades & Forecasts Forecast Summary Core Portfolio Tactical Trades Closed Trades
Highlights Asset allocation: Start 2019 with an overweight to industrial commodities versus equities. Await an oversold sell-off signal on the 65-day fractal dimension to go tactically overweight equities versus cash. Equities: Start 2019 with a cyclical equity sector tilt, but become more defensive as the global economy inevitably flips into a down-oscillation later in 2019. Start tactically overweight Italy’s MIB versus the Eurostoxx. Bonds: Initiate a bond yield convergence play: long 10-year Italian BTPs versus Spanish Bonos. Currencies: Start 2019 short EUR/JPY combined with long EUR/USD. There will be a great opportunity to buy the GBP, but not yet. Alternatives: A compelling buying opportunity for the cryptocurrencies Litecoin and Ethereum. Feature 2019 will present investors a mirror-image pattern to 2018. Through most of 2018, global growth was decelerating while inflation was accelerating. Now this configuration is flipping: global growth is rebounding while inflation is set to collapse. Growth To Rebound, Then Fade Global growth has entered an up-oscillation, for which the evidence is irrefutable: Industrial (non-oil) commodities are strongly outperforming equities, and rising even in absolute terms (Chart of the Week and Chart 2). Emerging markets are strongly outperforming developed markets (Chart 3). Financials are outperforming the broad equity market (Chart 4). Sweden’s manufacturing PMI – a bellwether of global activity – is rebounding strongly (Chart 5). Perhaps most importantly, China’s 6-month credit impulse has gone vertical (Chart 6). Chart of the WeekNon-Oil Commodities Are Strongly Outperforming Equities
Non-Oil Commodities Are Strongly Outperforming Equities
Non-Oil Commodities Are Strongly Outperforming Equities
Chart I-2Non-Oil Commodities Are Recovering In Absolute Terms Too
Non-Oil Commodities Are Recovering In Absolute Terms Too
Non-Oil Commodities Are Recovering In Absolute Terms Too
Chart I-3Emerging Markets Are Strongly Outperforming Developed Markets
Emerging Markets Are Strongly Outperforming Developed Markets
Emerging Markets Are Strongly Outperforming Developed Markets
Chart I-4Financials Are Outperforming
Financials Are Outperforming
Financials Are Outperforming
Chart I-5Sweden’s Manufacturing PMI Is Up Sharply
Sweden's Manufacturing PMI Is Up Sharply
Sweden's Manufacturing PMI Is Up Sharply
Chart I-6China’s 6-Month Credit Impulse Has Gone Vertical
China's 6-Month Credit Impulse Has Gone Vertical
China's 6-Month Credit Impulse Has Gone Vertical
Taken together, this is compelling evidence of a growth rebound, even if it is modest. Crucially, such up-oscillations tend to last at least six to eight months. Hence, equity sector performances, which always take their cue from global growth, will follow a mirror-image pattern in 2019 to that in 2018. Bottom Line: Start the year with an overweight to industrial commodities versus equities and a cyclical equity sector tilt, but prepare to fade to a more defensive tilt as the global economy inevitably flips into a down-oscillation later in 2019. Inflation Is The Dog That Will Not Bark There are not many things that are certain in the economy, but a racing certainty for early 2019 is that headline inflation will collapse. This is because the plunge in the crude oil price – 40 percent so far and getting worse by the day – is about to feed through into headline consumer price indexes (Chart 7 and Chart 8). Inevitably, it will seep through into core inflation too, via the impact on energy dependent prices such as transport costs. Chart I-7Headline Inflation Will Collapse In Europe
Headline Inflation Will Collapse In Europe
Headline Inflation Will Collapse In Europe
Chart I-8Headline Inflation Will Collapse In The U.S.
Headline Inflation Will Collapse In The U.S.
Headline Inflation Will Collapse In The U.S.
Coming at a time that central banks have professed a much greater reliance on “incoming data”, we can deduce that central banks will find it hard to tighten policy in the face of weaker headline and core inflation prints. Crucially though, the ECB and BoJ were not planning on tightening policy anyway, so the plunge in reported inflation will be much more impactful on the Fed. This makes the dollar vulnerable, leaving us a choice between the euro and yen as our preferred major currency. And on this head-to-head the yen still beats the euro given its lower political risk: Bottom Line: Start 2019 short EUR/JPY combined with long EUR/USD. Use ‘The Rule Of 4’ And Fractals To Predict Tipping-Points For Equities Investment strategists are obsessed with timing the next recession. The thinking is that by predicting the next recession they can predict the next equity bear market. The logic sounds fine, except that the causality rarely runs from economic downturns to financial market instabilities. The causality almost always runs the other way. Paul Volcker, arguably the greatest central banker of the modern era, correctly points out that the danger to the economy almost always comes from systemic financial disturbances. The last three downturns, in 2000, 2007 and 2011, all resulted from financial disturbances: the bursting of the dot com bubble, the gross mispricing of U.S. sub-prime mortgages, and the distortion of euro area sovereign debt markets respectively. Instead of timing the next recession to predict financial market instability, the correct approach is to flip the logic around and ask: is there a glaring source of financial instability that could cause the next recession? To which the answer is yes. The current glaring instability is the hyper-vulnerability of elevated risk-asset valuations to the global bond yield. Near the lower bound of bond yields, bond prices develop the same unattractive negative asymmetry as equities, removing the need for an equity risk premium, and justifying sharply higher equity valuations. But when the 10-year global bond yield rises back to around 2 percent – or equivalently when the sum of the 10-year U.S. T-bond, German bund and Japanese government bond approaches 4 percent ‘the rule of 4’ – the process viciously reverses: bond prices lose their negative asymmetry, re-requiring an equity risk premium and sharply lower equity valuations (Chart 9 and Chart 10). Chart I-9Equities Plunged In February After A Spike In Bond Yields
Equities Plunged In February After A Spike In Bond Yields
Equities Plunged In February After A Spike In Bond Yields
Chart I-10Equities Plunged In October After A Spike In Bond Yields
Equities Plunged In October After A Spike In Bond Yields
Equities Plunged In October After A Spike In Bond Yields
In 2019, just as in 2018, investors should use this dynamic to allocate tactically to equities versus cash as follows: 1. When the rule of 4 approaches 4 and the market’s 65-day fractal dimension signals an overbought rally, go underweight equities. 2. When the rule of 4 approaches 3 and the market’s 65-day fractal dimension signals an oversold sell-off, go overweight equities. 3. At all other times stay neutral. Bottom Line: With the rule of 4 now approaching 3, await an oversold sell-off signal on the 65-day fractal dimension to go tactically overweight equities versus cash. Britain Escalates EU Tensions, Italy De-Escalates The two points of political tension in Europe, the U.K. and Italy, have a common theme: brinkmanship with the EU. The Brexit tension remains high and may even intensify in early 2019 before a resolution. Hence, while 2019 will offer a great opportunity to buy the pound, it might require a little patience. In contrast, Italy is de-escalating its brinkmanship with Brussels over its budget deficit. Meanwhile the crux of Italy’s long-standing woes – its banking system – is also showing signs of healing. The proportion of bank loans that are non-performing is plummeting, while the solvency of the banking system continues to improve (Chart 11 and Chart 12). Chart I-11Italian Banks’ NPLs Are Plummeting…
Italian Banks' NPLs Are Plummeting...
Italian Banks' NPLs Are Plummeting...
Chart I-12…And Italian Banks’ Solvency Is Improving
...And Italian Banks' Solvency Is Improving
...And Italian Banks' Solvency Is Improving
Bottom Line: Initiate a bond yield convergence play: long 10-year Italian BTPs versus Spanish Bonos. And tactically overweight Italy’s MIB versus the Eurostoxx. Cryptocurrencies Will Rebound 60 Percent Cryptocurrencies are here to stay, because the underlying technology, the blockchain, is here to stay. Just as the internet’s major innovation was to decentralise and democratise information, the blockchain’s major innovation is to decentralise and democratise trust. Until now, counterparties without an established trust relationship could only transact through an intermediary who could provide the necessary trust overlay. But once each participant in a transaction trusts the blockchain itself, they no longer need to use a conventional intermediary, like a bank or a law firm. One major argument against the blockchain is that it is energy intensive and therefore prohibitively costly. But conventional intermediation also exacts a significant cost. Let’s say that the stock of excess savings that the banks intermediate to borrowers conservatively equals global GDP. If the risk-adjusted interest rate spread that banks charge for their intermediation role conservatively equals 1 percent, it means that this conventional intermediation is costing 1 percent of global GDP. Against this, global energy consumption equals roughly 5 percent of global GDP. So even if the blockchain consumed a fifth of the world’s energy, its cost might still be comparable to conventional intermediation. The plunge in cryptocurrencies during 2018 was exacerbated by the recent ‘hard fork’ in bitcoin protocol. But such hard forks are a necessary part of the evolutionary process – being analogous to a Darwinian mutation which eliminates the weakest protocols while allowing the strongest and fittest to thrive. In the latest fork, the battle was between those who want cryptocurrencies to remain a speculative asset with low long-term survival prospects, and those who want them to become a stable means of payment with high long-term survival prospects. A year ago almost to the day, we recommended selling bitcoin at a price of $18,000. Our rationale was that excessive herding required a price gap down to normalise liquidity. The subsequent decline in the price to $3500 today has rewarded that recommendation handsomely. But today, Litecoin and Ethereum are approaching an opposite tipping-point where the price may have to gap up to normalise liquidity (Chart 13 and Chart 14). Chart I-13Litecoin Is Oversold On A 65-Day Horizon
Litecoin Is Oversold On A 65-Day Horizon
Litecoin Is Oversold On A 65-Day Horizon
Chart I-14Litecoin Is Oversold On A 130-Day Horizon
Litecoin Is Oversold On A 130-Day Horizon
Litecoin Is Oversold On A 130-Day Horizon
Bottom Line: A compelling buying opportunity for the cryptocurrencies Litecoin and Ethereum. For a 50:50 basket, target a return of 60 percent. And on that positive note, I am signing off for the year. I do hope that you have enjoyed reading this year’s reports, but more importantly that you have found value in them. This publication’s philosophy is to think out of the box, independently and unconstrained, never to shirk from challenging the received wisdom, and ultimately to provide successful investment ideas. We promise to continue this way in 2019! It just remains for me to wish you a very happy holiday season and a prosperous new year. Dhaval Joshi, Senior Vice President Chief European Investment Strategist dhaval@bcaresearch.com Fractal Trading Model* As discussed in the main body of this report, this week’s recommended trade is to buy a 50:50 combination of Litecoin and Ethereum. Set a profit target of 60 percent with a symmetrical stop-loss. As also discussed in the main body of this report, remain tactically overweight Italy’s MIB versus the Eurostoxx. For any investment, excessive trend following and groupthink can reach a natural point of instability, at which point the established trend is highly likely to break down with or without an external catalyst. An early warning sign is the investment’s fractal dimension approaching its natural lower bound. Encouragingly, this trigger has consistently identified countertrend moves of various magnitudes across all asset classes.
Long MIB Vs. Euro Stoxx
Long MIB Vs. Euro Stoxx
* For more details please see the European Investment Strategy Special Report “Fractals, Liquidity & A Trading Model,” dated December 11, 2014, available at eis.bcaresearch.com. Fractal Trading Model Recommendations Asset Allocation Equity Regional and Country Allocation Equity Sector Allocation Bond and Interest Rate Allocation Currency and Other Allocation Closed Fractal Trades Trades Closed Trades Asset Performance Currency & Bond Equity Sector Country Equity Indicators Bond Yields Chart II-1
Indicators To Watch - Bond Yields
Indicators To Watch - Bond Yields
Chart II-2
Indicators To Watch - Bond Yields
Indicators To Watch - Bond Yields
Chart II-3
Indicators To Watch - Bond Yields
Indicators To Watch - Bond Yields
Chart II-4
Indicators To Watch - Bond Yields
Indicators To Watch - Bond Yields
Interest Rate Chart II-5
Indicators To Watch - Interest Rate Expectations
Indicators To Watch - Interest Rate Expectations
Chart II-6
Indicators To Watch - Interest Rate Expectations
Indicators To Watch - Interest Rate Expectations
Chart II-7
Indicators To Watch - Interest Rate Expectations
Indicators To Watch - Interest Rate Expectations
Chart II-8
Indicators To Watch - Interest Rate Expectations
Indicators To Watch - Interest Rate Expectations
Highlights So What? Our best and worst calls of 2018 cast light on our methodology and 2019 forecasts. Why? Our clients took us to task for violating our own methodology on the Iranian oil sanctions. Sticking to our guns would have paid off with long Russian equities versus EM. We correctly called China’s domestic policy, the U.S.-China trade war, Europe, the U.S. midterms, and relative winners in emerging markets. Feature It has been a tradition for BCA’s Geopolitical Strategy, since our launch in 2012, to highlight our best and worst forecasts of the year.1 This will also be the final publication of the year, provided that there is no global conflagration worthy of a missive between now and January 9, when we return to our regular publication schedule. We wish all of our clients a great Holiday Season. And especially all the very best in 2019: lots of happiness, health, and hefty returns. Good luck and good hunting. The Worst Calls Of 2018 A forecasting mistake is wasted if one learns nothing from the error. This is why we take our mistakes seriously and why we always begin the report card with our zingers. Our overall performance in 2018 was … one of our best. The successes below will testify to this. However, we made three notable errors. A Schizophrenic Russia View Our worst call of the year was to panic and close our long Russian equities relative to emerging markets trade in the face of headline geopolitical risks. In early March, we posited that Russia was a “buy” relative to the broad EM equity index due to a combination of cheap valuations, strong macro fundamentals, orthodox policy, and an end to large-scale geopolitical adventurism. This call ultimately proved to be correct (Chart 1). Chart 1Russian Stocks Outperformed In The End
Russian Stocks Outperformed In The End
Russian Stocks Outperformed In The End
What went wrong? The main risk to our view, that the U.S. Congress would pursue an anti-Russia agenda regardless of any Russian sympathies in the Trump White House, materialized in the wake of the poisoning of former Russian military intelligence officer Sergei Skripal with a Novichok nerve agent in the United Kingdom. As fate would have it, the incident occurred just before our bullish report went to clients! The ensuing international uproar and sanctions caused a selloff. Our bullish thesis did not rest exclusively on geopolitics, but a thaw in West-Russia relations did form the main pillar of the view. Our Russia Geopolitical Risk Index, which had served us well in the past, was pricing as low of a level of geopolitical risk as one could hope for in the post-Crimea environment (Chart 2). Naturally the measure jumped into action following the Skripal incident. Chart 2Geopolitical Risk Was Low Prior To Skripal
Geopolitical Risk Was Low Prior To Skripal
Geopolitical Risk Was Low Prior To Skripal
The timing of our call was therefore off, but we should have stuck with the overall view. The U.S. imposed preliminary sanctions that lacked teeth. While Washington accepted the U.K.’s assessment that Moscow was behind the poisoning, the weakness of the sanctions also signaled that the U.S. did not consider the incident worthy of a tougher position. There are now two parallel sanction processes under way. The first round of sanctions announced in August gave Russia 90 days to comply and adopt “remedial measures” regarding the use of chemical and biological weapons. On November 9, the U.S. State Department noted that Russia had not complied with the deadline. The U.S. is now expected to impose a second round of sanctions that will include at least three of six punitive actions: Opposition to development aid and assistance by international financial institutions (think the IMF and the World Bank); Downgrading diplomatic relations; Additional restrictions on exports to Russia (high-tech exports have already been barred by the first round of sanctions); Restrictions on imports from Russia; A ban on landing rights in the U.S. for Russian state-owned airlines; Prohibiting U.S. banks from purchasing Russian government debt. While the White House was expected to have such sanctions ready to go on the November 9 deadline, it has dragged its feet for almost two months now. This suggests that President Trump continues to hold out for improved relations with President Putin. A visit by President Putin to Washington remains possible in Q1 2019. As such, we would expect the White House to adopt some mix of the first five items on the above list, hardly a crushing response from Moscow’s perspective. The U.S. Congress, however, has a parallel process in the form of the Defending American Security from Kremlin Aggression Act of 2018 (DASKAA). Introduced in August by Senator Lindsey Graham, a Russia hawk, the legislation would put restrictions on Americans buying Russian sovereign debt and curb investments in Russian energy projects. The bill also includes secondary sanctions on investing in the Russian oil sector, which would potentially ensnare European energy companies collaborating with Russia in the energy sector. There was some expectation that Congress would take up the bill ahead of the midterm election, but nothing came of it. Even with the latest incident – the seizing of two Ukrainian naval vessels in the Kerch Strait – we have yet to see action. While we expect the U.S. to do something eventually, the White House approach is likely to be tepid while the congressional approach may be too draconian to pass into law. And with Democrats about to take over the House, and likely demand even tougher sanctions against Russia, the ultimate legislation may be too bold for President Trump to sign into legislation. The point is that Russia has acted antagonistically towards the West in 2018, but in small enough increments that the response has been tepid. Given the paucity of Russian financial and trade links with the U.S., Washington’s sanctions would only bite if they included the dreaded “secondary sanction” implications for third party sovereigns and firms – particularly European, which do have a lot of business in Russia. This is highly unlikely without major Russian aggression. We cannot completely ignore the potential for such aggression in 2019, especially with President Putin’s popularity in the doldrums (Chart 3) and a contentious Ukrainian election due for March 31. However, we outlined the constraints against Russia in 2014, amidst the Ukrainian crisis, and we do not think that these constraints have been reduced (they may have only grown since then). Chart 3Non-Negligible Risk Of Russian Aggression
Non-Negligible Risk Of Russian Aggression
Non-Negligible Risk Of Russian Aggression
Regardless of the big picture for 2019, we could have faded the risks in 2018 and stuck to the fundamentals. Russia is up 17.2% against EM year-to-date. The lesson here, therefore, is to find re-entry points into a well-founded view despite market volatility. Chart 1 shows that Russian equities climbed the proverbial “wall of worry” relative to EM in 2018. Doubting Jair Bolsonaro Our list of mistakes keeps us in the EM universe where we underestimated Jair Bolsonaro’s chances of winning the presidency in Brazil. The answer to the question we posed in the title of our September report – “Brazil: Can The Election Change Anything?” – was a definitive “yes.” Since the publication of that report, BRL/USD is up 2.9% and Brazilian equities are up 18.5% relative to EM (Chart 4). Chart 4Bolsonaro Rally Losing Its Luster Already
Bolsonaro Rally Losing Its Luster Already
Bolsonaro Rally Losing Its Luster Already
To our credit, the question of Bolsonaro’s electoral chances elicited passionate and pointed internal debate. But our clients did not see the internal struggle, just the incorrect external output! A bad call is a bad call, no matter how it is assembled on the intellectual assembly line. That said, we still think that our report is valuable. It sets out the constraints facing Bolsonaro in 2019. He has to convince the left-leaning median voter that meaningful pension reform is needed; bully a fractured Congress into painful structural reforms; and overcome an unforgiving macro context of tepid Chinese stimulus and a strong USD. If the Bolsonaro administration wastes the good will of the investment community over the next six months, we expect the market’s punishment to be swift and painful. In fact, Chart 4 notes that the initial Bolsonaro rally has already lost most of its shine. Brazilian assets are still up since the election, but the gentle slope could become a steep fall if Bolsonaro stumbles. The market is priced for political perfection. To be clear, we are not bearish on Bolsonaro. We believe that, relative to EM, he will be a positive for Brazil. However, the market is currently betting that he will win by two touchdowns, whereas we think he will squeak by with a last-second field goal. The difference between the two forecasts is compelling and we have expressed it by being long MXN/BRL.2 Not Sticking To Our Method In The Case Of Iran Throughout late-2017 and 2018 we pointed out that President Trump’s successful application of “maximum pressure” against North Korea could become a market-relevant risk if he were emboldened to try the same strategy against Iran. For much of the year, this view was prescient. As investors realized the seriousness of President Trump’s strategy, a geopolitical risk premium began to seep into oil prices, as illustrated in Chart 5 by the red bar.
Chart 5
Every time we spoke to clients or published reports on this topic, we highlighted just how dangerous a “maximum pressure” strategy would be in the case of Iran. We stressed that Iran could wreak havoc across Iraq and other parts of the Middle East and even drive up oil prices to the point of causing a “geopolitical recession in 2019.” In other words, we stressed the extraordinary constraints that President Trump would face. To their credit many of our clients called us out on the inconsistency: our market call was über bullish oil prices, while our methodology emphasized constraints over preferences. We were constantly fielding questions such as: Why would President Trump face down such overwhelming constraints? We did not have a very good answer to this question other than that he was ideologically committed to overturning the Iranian nuclear deal. In essence, we doubted President Trump’s own ideological flexibility and realism. That was a mistake and we tip our hat to the White House for recognizing the complex constraints arrayed against it. President Trump realized by October how dangerous those constraints were and began floating the idea of sanction waivers, causing the geopolitical risk premium to drain from the market (Chart 6). To our credit, we highlighted sanction waivers as a key risk to our view and thus took profit on our bullish energy call early. Chart 6Sanction Waivers Caused A Collapse In Oil Prices
Sanction Waivers Caused A Collapse In Oil Prices
Sanction Waivers Caused A Collapse In Oil Prices
That said, our clients have taken the argument further, pointing out that if we were wrong on Trump’s ideological flexibility with Iran, we may be making the same mistake when it comes to China. However, there is a critical difference. Americans are more concerned about conflict with North Korea than with Iran (Chart 7), while China is the major concern about trade (Chart 8).
Chart 7
Chart 8
Second, railing against the Iran deal did not get President Trump elected, whereas his protectionist rhetoric – specifically regarding China – did (Chart 9). Getting anything less than the mother-of-all-deals with Beijing will draw down Trump’s political capital ahead of 2020 and open him to accusations of being “weak” and “surrendering to China.” These are accusations that the country’s other set of protectionists – the Democrats – will wantonly employ against him in the next general election. Chart 9Protectionism, Not Iran, Helped Trump Get Elected
Protectionism, Not Iran, Helped Trump Get Elected
Protectionism, Not Iran, Helped Trump Get Elected
Ultimately, if we have to be wrong, we are at least satisfied that our method stood firm in the face of our own fallibility. We are doubly glad to see our clients using our own method against our views. This is precisely what we wanted to accomplish when we began BCA’s Geopolitical Strategy in March 2012: to revolutionize finance by raising the sophistication with which it approaches geopolitics. That was a lofty goal, but we do not pretend to hold the monopoly on our constraint-based methodology. In the end, our market calls did not suffer due to our error. We closed our long EM energy-producer equities / EM equities for a gain of 4.67% and our long Brent / short S&P 500 for a gain of 6.01%. However, our latter call, shorting the S&P 500 in September, was based on several reasons, including concerns regarding FAANG stocks, overstretched valuations, and an escalation of the trade war. Had we paired our S&P 500 short with a better long, we would have added far more value to our clients. It is that lost opportunity that has kept us up at night throughout this quarter. We essentially timed the S&P 500 correction, but paired it with a wayward long. The Best Calls Of 2018 BCA’s Geopolitical Strategy had a strong year. We are not going to list all of our calls here, but only those most relevant to our clients. Our best 2018 forecast originally appeared in 2017, when in April of that year we predicted that “Political Risks Are Understated In 2018.” Our reasoning was bang on: U.S. fiscal policy would turn strongly stimulative (the tax cuts would pass and Trump would be a big spender) and thus cause the Fed to turn hawkish and the USD to rally, tightening global monetary policy; Trump’s trade war would re-emerge in 2018; China would reboot its structural reform efforts by focusing on containing leverage, thus tightening global “fiscal” policy. In the same report we also predicted that Italian elections in 2018 would reignite Euro Area breakup risks, but that Italian policymakers would ultimately be found to be bluffing, as has been our long-running assertion. Throughout 2018, our team largely maintained and curated the forecasts expressed in that early 2017 report. We start the list of the best calls with the one call that was by far the most important for global assets in 2018: economic policy in China. The Chinese Would Over-Tighten, Then Under-Stimulate Getting Chinese policy right required us, first, to predict that policy would bring negative economic surprises this year, and second, once policy began to ease, to convince clients and colleagues that “this time would be different” and the stimulus would not be very stimulating. In other words, this time, China would not panic and reach for the credit lever of the post-2008 years (Chart 10), but would maintain its relatively tight economic, financial, environmental, and macro-prudential oversight, while easing only on the margin. Chart 10No Massive Credit Stimulus In 2018
No Massive Credit Stimulus In 2018
No Massive Credit Stimulus In 2018
This is precisely what occurred. BCA Foreign Exchange Strategy’s “China Play Index,” which is designed to capture any reflation out of Beijing, collapsed in 2018 and has hardly ticked up since the policy easing announced in July (Chart 11). Chart 11Weak Reflation Signal From China
Weak Reflation Signal From China
Weak Reflation Signal From China
Our view was based on an understanding of Chinese politics that we can confidently say has been unique: From March 2017, we highlighted the importance of the 2017 October Party Congress, arguing that President Xi Jinping would consolidate his power and redouble his attempts to “reform” the economy by reining in dangerous imbalances. We explicitly characterized the containment of leverage as the most market-relevant reform to focus on. We stringently ignored the ideological debate about the nature of reform in China, focusing instead on the major policy changes afoot. We identified very early on how the rising odds of a U.S.-China conflict would embolden Chinese leadership to double-down on painful structural reforms. Will China maintain this disciplined approach in 2019? That is yet to be seen. But we are arming ourselves and clients with critical ways to identify when and whether Beijing’s policy easing transforms into a full-blown “stimulus overshoot”: First, we need to see a clear upturn in shadow financing to believe that the Xi administration has given up on preventing excess debt. Assuming that such a shift occurs, and that overall credit improves, it will enable us to turn bullish on global growth and global risk assets on a cyclical, i.e., not merely tactical, horizon (Chart 12). Chart 12A Shadow Lending Surge Would Mean A Big Policy Shift
A Shadow Lending Surge Would Mean A Big Policy Shift
A Shadow Lending Surge Would Mean A Big Policy Shift
Second, our qualitative checklist will need to see a lot more “checks” in order to change our mind. Short of an extraordinary surge in bank and shadow bank credit, there needs to be a splurge in central and especially local government spending (Table 1). The mid-year spike in local governments’ new bond issuance in 2018 was fleeting and fell far short of the surge that initiated the large-scale stimulus of 2015. Frontloading these bonds in 2019 will depend on timing and magnitude. Table 1A Credit Splurge, Or Government Spending Splurge, Is Necessary For Stimulus To Overshoot
BCA Geopolitical Strategy 2018 Report Card
BCA Geopolitical Strategy 2018 Report Card
Third, we would need to see President Xi Jinping make a shift in rhetoric away from the “Three Battles” of financial risk, pollution, and poverty. Having identified systemic financial risk as the first of the three ills, Xi needs to make a dramatic reversal of this three-year action plan if he is to clear the way for another credit blowout. Trade War Would Reignite In 2018 It paid off to stick with our trade war alarmism in 2018. We correctly forecast that the U.S. and China would collide over trade and that their initial trade agreement – on May 20 – was insubstantial and would not last. In the event it lasted three days. Our one setback on the trade front was to doubt the two sides would agree to a trade truce at the G20. However, by assigning a subjective 40% probability, we correctly noted the fair odds of a truce. We also insisted that any truce would be temporary, which ended up being the case. We may yet be vindicated if the March 1 deadline produces no sustainable deal, as we forecast in last week’s Strategic Outlook. That said, correct geopolitical calls do not butter our bread at BCA. Rather, we are paid to make market calls. To that end, we would point out that we correctly assessed the market-relevance of the trade conflict, fading S&P 500 risks and focusing on the effect on global risk assets. Will this continue into 2019? We think so. We do not see trade conflict as the originator of ongoing market turbulence (Chart 13) and would expect the U.S. to outperform global equities again over the course of 2019 (Chart 14). This view may appear wrong in Q1, as the market digests the Fed backing off from hawkish rhetoric, the ongoing trade negotiations, and the likely seasonal uptick in Chinese credit data in the beginning of the calendar year. Chart 13Yields, Not Trade War, Drove Stocks
Yields, Not Trade War, Drove Stocks
Yields, Not Trade War, Drove Stocks
Chart 14U.S. Stocks Will Resume Outperformance
U.S. Stocks Will Resume Outperformance
U.S. Stocks Will Resume Outperformance
However, any stabilization in equity markets would likely serve to ease financial conditions in the U.S., where economic and inflation conditions remain firmly in tightening territory (Chart 15). As such, the Fed pause is likely to last no more than a quarter, maybe two at best, leading to renewed carnage in global risk assets if our view on Chinese policy stimulus – tepid – remains valid through the course of 2019. Chart 15If Financial Conditions Ease, Tightening Will Be Back On
If Financial Conditions Ease, Tightening Will Be Back On
If Financial Conditions Ease, Tightening Will Be Back On
Europe (All Of It… Again) In 2017, our forecasting track record for Europe was stellar. This continued in 2018, with no major setbacks: Populism in Italy: Our long-held view has been that Europe’s chief remaining risks lay in Italian populists coming to power. We predicted in 2016 that this would eventually happen and that they would then be proven to be bluffing. This is essentially what happened in 2018. Matteo Salvini’s Lega is surging in the polls because its leader has realized that a combination of hard anti-immigrant policy and the softest-of-soft Euroskepticism is a winning combination. We believe that investors can live with this combination. Our only major fault in forecasting European politics and assets this year was to close our bearish Italy call too early: we booked our long Spanish / short Italian 10-year government bond trade for a small loss in August, before the spread between the two Mediterranean countries blew out to record levels. That missed opportunity could have also made it on our “worst calls” list as well.
Chart 16
Pluralism in Europe: To get the call on Italy right, we had to dabble in some theoretical work. In a somewhat academic report, we showed that political concentration was on the decline in the developed world (Chart 16), but especially in Europe (Chart 17). Put simply, lower political concentration suggests that a duopoly between the traditional center-left and center-right parties is breaking down. Contrary to the conventional wisdom, we argued that Europe’s parliamentary systems would enable centrist parties to adopt elements of the populist agenda, particularly on immigration, without compromising the overall stability of European institutions. As such, political pluralism, or low political concentration, is positive for markets.
Chart 17
Immigration crisis is over: For centrist parties to be able to successfully adopt populist immigration policy, they needed a pause in the immigration crisis. This was empirically verifiable in 2018 (Chart 18). Chart 18European Migration Crisis Is Over
European Migration Crisis Is Over
European Migration Crisis Is Over
Merkel’s time has run out: Since early 2017, we had cautioned clients that Angela Merkel’s demise was afoot, but that it would be an opportunity, rather than a risk, when it came. It finally happened in 2018 and it was not a market moving event. The main question for 2019 is whether German policymakers, and Europe as a whole, will use the infusion of fresh blood in Berlin to reaccelerate crucial reforms ahead of the next global recession. Brexit: Since early 2016, we have been right on Brexit. More specifically, we were corrent in cautioning investors that, were Brexit to occur, “the biggest loser would be the Conservative Party, not the EU.” As with the previous two Conservative Party prime ministers, it appears that the question of the U.K.’s relationship with the EU has completely drained any political capital out of Prime Minister Theresa May’s reign. We suspect that the only factor propping up the Tories in the polls is that Jeremy Corbyn is the leader of Her Majesty’s Most Loyal Opposition. We have also argued that soft Brexit would ultimately prove to be “illogical” and that “Bregret” would begin to seep in, as it now most clearly has. We parlayed these rising geopolitical risks and uncertainties by shorting cable in the first half of the year for a 6.21% gain. Malaysia Over Turkey And India Over Brazil Not all was lost for our EM calls this year. We played Malaysia against Turkey in the currency markets for a 17.44% gain, largely thanks to massively divergent governance and structural reform trajectories after Malaysia’s opposition won power for the first time in the country’s history. Second, we initiated a long Indian / short Brazilian equity view in March that returned 27.54% by August. This was a similar play on divergent structural reforms, but it was also a way to hedge our alarmist view on trade. Given India’s isolation from global trade and insular financial markets, we identified India as one of the EM markets that would remain aloof of protectionist risks. We could have closed the trade earlier for greater gain, but did not time the exit properly. Midterm Election: A Major Democratic Victory Our midterm election forecast was correct: Democrats won a substantial victory. Even our initial call on the Senate, that Democrats had a surprisingly large probability of picking up seats, proved to be correct, with Republicans eking out just two gains in a year when Democrats were defending 10 seats in states that Trump carried in 2016. What about our all-important call that the election would have no impact on the markets? That is more difficult to assess, given that the S&P 500 has in fact collapsed in the lead-up to and aftermath of the election. However, we see little connection between the election outcome and the stock market’s performance. Neither do our colleagues or clients, who have largely stopped asking about the Democrats’ policy designs. In 2019, domestic politics may play a role in the markets. Impeachment risk is low, but, if it rears its head, it could prompt President Trump to seek relevance abroad, as his predecessors have done when they lost control of domestic policy. In addition, the Democratic Party’s sweeping House victory may suggest a political pendulum swing to the left in the 2020 presidential election. We will discuss both risks as part of our annual Five Black Swans report in early 2019. U.S. domestic politics was a collection of Red Herrings during much of President Obama’s presidency, and has produced strong tailwinds under President Trump (tax cuts in particular). This may change in 2019, with considerable risk to investors, and asset prices, ahead. Marko Papic, Senior Vice President Chief Geopolitical Strategist marko@bcaresearch.com Matt Gertken, Vice President Geopolitical Strategy mattg@bcaresearch.com Roukaya Ibrahim, Editor/Strategist roukayai@bcaresearch.com Ekaterina Shtrevensky, Research Analyst ekaterinas@bcaresearch.com Footnotes 1 For our 2019 Outlook, please see BCA Geopolitical Strategy Strategic Outlook, “2019 Key Views: Balanced On A Knife’s Edge,” dated December 14, 2018, available at gps.bcaresearch.com. For our past Strategic Outlooks, please visit gps.bcaresearch.com. 2 In part we like this cross because we also think that Mexico’s newly elected president, Andrés Manuel López Obrador, is priced to lose by two touchdowns, whereas he may merely lose by a last-second field goal.