Euro Area

Mr. X and his daughter, Ms. X, are long-time BCA clients who visit our office toward the end of each year to discuss the economic and financial market outlook. This report is an edited transcript of our recent conversation. Mr. X: I have been eagerly looking forward to this meeting given the recent turbulence in financial markets. Our investments have done poorly in the past year and, with hindsight, I wish I had followed my instincts to significantly cut our equity exposure at the end of 2017, although we did follow your advice to move to a neutral stance in mid-2018. I remain greatly troubled by economic and political developments in many countries. I have long believed in open and free markets and healthy political discourse, and this all seems under challenge. As always, there is much to talk about. Ms. X: Let me add that I also am pleased to have this opportunity to talk through the key issues that will influence our investment strategy over the coming year. As I am sure you remember, I was more optimistic than my father about the outlook when we met a year ago but things have not worked out as well as I had hoped. In retrospect, I should have paid more attention to your view that markets and policy were on a collision course as that turned out to be a very accurate prediction. When I joined the family firm in early 2017, I persuaded my father that we should have a relatively high equity exposure and that was the correct stance. However, this success led us to maintain too much equity exposure in 2018, and my father has done well to resist the temptation to say “I told you so.” So, we are left with a debate similar to last year: Should we move now to an underweight in risk assets or hold off on the hope that prices will reach new highs in the coming year? I am still not convinced that we have seen the peak in risk asset prices as there is no recession on the horizon and equity valuations are much improved, following recent price declines. I will be very interested to hear your views. BCA: Our central theme for 2018 that markets and policy would collide did turn out to be appropriate and, importantly, the story has yet to fully play out. The monetary policy tightening cycle is still at a relatively early stage in the U.S. and has not even begun in many other regions. Yet, although it was a tough year for most equity markets, the conditions for a major bear market are not yet in place. One important change to our view, compared to a year ago, is that we have pushed back the timing of the next U.S. recession. This leaves a window for risk assets to show renewed strength. It remains to be seen whether prices will reach new peaks, but we believe it would be premature to shift to an underweight stance on equities. For the moment, we are sticking with our neutral weighting for risk assets, but may well recommend boosting exposure if prices suffer further near-term weakness. We will need more clarity about the timing of a recession before we consider aggressively cutting exposure. Mr. X: I can see we will have a lively discussion because I do not share your optimism. My list of concerns is long and I hope we have time to get through them all. But first, let’s briefly review your predictions from last year. BCA: That is always interesting to do, although sometimes rather humbling. A year ago, our key conclusions were that: The environment of easy money, low inflation and healthy profit growth that has been so bullish for risk assets will start to change during the coming year. Financial conditions, especially in the U.S., will gradually tighten as decent growth leads to building inflationary pressures, encouraging central banks to withdraw stimulus. With U.S. equities at an overvalued extreme and investor sentiment overly optimistic, this will set the scene for an eventual collision between policy and the markets. The conditions underpinning the bull market will erode only slowly which means that risk asset prices should continue to rise for at least the next six months. However, long-run investors should start shifting to a neutral exposure. Given our economic and policy views, there is a good chance that we will move to an underweight position in risk assets during the second half of 2018. The U.S. economy is already operating above potential and thus does not need any boost from easier fiscal policy. Any major tax cuts risk overheating the economy, encouraging the Federal Reserve to hike interest rates and boosting the probability of a recession in 2019. This is at odds with the popular view that tax cuts will be good for the equity market. A U.S. move to scrap NAFTA would add to downside risks. For the second year in a row, the IMF forecasts of economic growth for the coming year are likely to prove too pessimistic. The end of fiscal austerity has allowed the Euro Area economy to gather steam and this should be sustained in 2018. However, the slow progress in negotiating a Brexit deal with the EU poses a threat to the U.K. economy. China’s economy is saddled with excessive debt and excess capacity in a number of areas. Any other economy would have collapsed by now, but the government has enough control over banking and other sectors to prevent a crisis. Growth should hold above 6% in the next year or two, although much will depend on how aggressively President Xi pursues painful reforms. The market is too optimistic in assuming that the Fed will not raise interest rates by as much as indicated in their “dots” projections. There is a good chance that the U.S. yield curve will become flat or inverted by late 2018. Bonds are not an attractive investment at current yields. Only Greece and Portugal have real 10-year government bond yields above their historical average. Corporate bonds should outperform governments, but a tightening in financial conditions will put these at risk in the second half of 2018. The Euro Area and Japanese equity markets should outperform the U.S. over the next year reflecting their better valuations and more favorable financial conditions. Developed markets should outperform the emerging market index. Historically, the U.S. equity market has led recessions by between 3 and 12 months. If, as we fear, a U.S. recession starts in the second half of 2019, then the stock market would be at risk from the middle of 2018. The improving trend in capital spending should favor industrial stocks. Our other two overweight sectors are energy and financials. The oil price will be well supported by strong demand and output restraint by OPEC and Russia. The Brent price should average $65 a barrel over the coming year, with risks to the upside. We expect base metals prices to trade broadly sideways but will remain highly dependent on developments in China. Modest positions in gold are warranted. Relative economic and policy trends will favor a firm dollar in 2018. Unlike at the start of 2017, investors are significantly short the dollar which is bullish from a contrary perspective. Sterling is quite cheap but Brexit poses downside risks. The key market-relevant geopolitical events to monitor will be fiscal policy and mid-term elections in the U.S., and reform policies in China. With the former, the Democrats have a good chance of winning back control of the House of Representatives, creating a scenario of complete policy gridlock. A balanced portfolio is likely to generate average returns of only 3.3% a year in nominal terms over the next decade. This compares to average returns of around 10% a year between 1982 and 2017. As already noted, the broad theme that policy tightening – especially in the U.S. – would become a problem for asset markets during the year was supported by events. However, the exact timing was hard to predict. The indexes for non-U.S. developed equity markets and emerging markets peaked in late-January 2018, and have since dropped by around 18% and 24%, respectively (Chart 1). On the other hand, the U.S. market, after an early 2018 sell-off, hit a new peak in September, before falling anew in the past couple of months. The MSCI All-Country World index currently is about 6% below end-2017 levels in local-currency terms. Chart 1Our 'Collision Course' Theme For 2018 Played Out
Our 'Collision Course' Theme For 2018 Played Out
Our 'Collision Course' Theme For 2018 Played Out
We started the year recommending an overweight in developed equity markets but, as you noted, shifted that to a neutral position mid-year. A year ago, we thought we might move to an underweight stance in the second half of 2018 but decided against this because U.S. fiscal stimulus boosted corporate earnings and extended the economic cycle. Our call that emerging markets would underperform was on target. Although it was U.S. financial conditions that tightened the most, Wall Street was supported by the large cut in the corporate tax rate while the combination of higher bond yields and dollar strength was a major problem for many indebted emerging markets. Overall, it was not a good year for financial markets (Table 1). Table 1Market Performance
OUTLOOK 2019: Late-Cycle Turbulence
OUTLOOK 2019: Late-Cycle Turbulence
As far as the overall macro environment was concerned, we were correct in predicting that the IMF was too pessimistic on economic growth. A year ago, the IMF forecast that the advanced economies would expand by 2% in 2018 and that has since been revised up to 2.4% (Table 2). This offset a slight downgrading to the performance of emerging economies. The U.S., Europe and Japan all grew faster than previously expected. Not surprisingly, inflation also was higher than forecast, although in the G7, it has remained close to the 2% level targeted by most central banks. Table 2IMF Economic Forecasts
OUTLOOK 2019: Late-Cycle Turbulence
OUTLOOK 2019: Late-Cycle Turbulence
Despite widespread fears to the contrary, the data have supported our view that Chinese growth would hold above a 6% pace in 2018. Nevertheless, a slowdown currently is underway and downside risks remain very much in place in terms of excessive credit and trade pressures. Another difficult year lies ahead for the Chinese authorities and we will no doubt return to this topic later. As far as our other key forecasts are concerned, we were correct in our views that oil prices and the U.S. dollar would rise and that the market would be forced to revise up its predictions of Fed rate hikes. Of course, oil has recently given back its earlier gains, but we assume that is a temporary setback. On the sector front, our macro views led us to favor industrials, financials and energy, but that did not work out well as concerns about trade took a toll on cyclical sectors. Overall, there were no major macro surprises in 2018, and it seems clear that we have yet to resolve the key questions and issues that we discussed a year ago. At that time, we were concerned about the development of late-cycle pressures that ultimately would undermine asset prices. That story has yet to fully play out. It is hard to put precise timing on when the U.S. economy will peak and, thus, when asset prices will be at maximum risk. Nevertheless, our base case is that there likely will be a renewed and probably final run-up in asset prices before the next recession. Late-Cycle Challenges Mr. X: This seems like déjà-vu all over again. Since we last met, the cycle is one year older and, as you just said, the underlying challenges facing economies and markets have not really changed. If anything, things are even worse: Global debt levels are higher, inflation pressures more evident, Fed policy is moving closer to restrictive territory and protectionist policies have ratcheted up. If it was right to be cautious six months ago, then surely we should be even more cautious now. Ms. X: Oh dear, it does seem like a repeat of last year’s discussion because, once again, I am more optimistic than my father. Obviously, there are structural problems in a number of countries and, at some point, the global economy will suffer another recession. But timing is everything, and I attach very low odds to a downturn in the coming year. Meanwhile, I see many pockets of value in the equity market. Rather than cut equity positions, I am inclined to look for buying opportunities. BCA: We sympathize with your different perspectives because the outlook is complex and we also have lively debates about the view. The global equity index currently is a little below where it was when we met last year, but there has been tremendous intra-period volatility. That pattern seems likely to be repeated in 2019. In other words, it will be important to be flexible about your investment strategy. You both make good points. It is true that there are several worrying problems regarding the economic outlook, including excessive debt, protectionism and building inflation risks. At the same time, the classic conditions for an equity bear market are not yet in place, and may not be for some time. This leaves us in the rather uncomfortable position of sitting on the fence with regard to risk asset exposure. We are very open to raising exposure should markets weaken further in the months ahead, but also are keeping careful watch for signs that the economic cycle is close to peaking. In other words, it would be a mistake to lock in a 12-month strategy right now. Mr. X: I would like to challenge the consensus view, shared by my daughter, that the next recession will not occur before 2020, and might even be much later. The main rationale seems to be that the policy environment remains accommodative and there are none of the usual imbalances that occur ahead of recessions. Of course, U.S. fiscal policy has given a big boost to growth in the past year, but I assume the effects will wear off sharply in 2019. More importantly, there is huge uncertainty about the level of interest rates that will trigger economic problems. It certainly has not taken much in the way of Fed rate hikes to rattle financial markets. Thus, monetary policy may become restrictive much sooner than generally believed. I also strongly dispute the idea that there are no major financial imbalances. If running U.S. federal deficits of $1 trillion in the midst of an economic boom is not an imbalance, then I don’t know what is! At the same time, the U.S. corporate sector has issued large amounts of low-quality debt, and high-risk products such as junk-bond collateralized debt obligations have made an unwelcome reappearance. It seems that the memories of 2007-09 have faded. It is totally normal for long periods of extremely easy money to be accompanied by growing leverage and increasingly speculative financial activities, and I don’t see why this period should be any different. And often, the objects of speculation are not discovered until financial conditions become restrictive. Finally, there are huge risks associated with rising protectionism, the Chinese economy appears to be struggling, Italy’s banks are a mess, and the Brexit fiasco poses a threat to the U.K. economy. Starting with the U.S., please go ahead and convince me why a recession is more than a year away. BCA: It is natural for you to worry that a recession is right around the corner. The current U.S. economic expansion will become the longest on record if it makes it to July 2019, at which point it will surpass the 1990s expansion. Economists have a long and sad history of failing to forecast recessions. Therefore, a great deal of humility is warranted when it comes to predicting the evolution of the business cycle. The Great Recession was one of the deepest downturns on record and the recovery has been fairly sluggish by historic standards. Thus, it has taken much longer than usual for the U.S. economy to return to full employment. Looking out, there are many possible risks that could trip up the U.S. economy but, for the moment, we see no signs of recession on the horizon (Chart 2). For example, the leading economic indicator is still in an uptrend, the yield curve has not inverted and our monetary indicators are not contracting. Our proprietary recession indicator also suggests that the risk is currently low, although recent stock market weakness implies some deterioration. Chart 2Few U.S Recession 'Red Flags'
Few U.S Recession 'Red Flags'
Few U.S Recession 'Red Flags'
The buildup in corporate debt is a cause for concern and we are not buyers of corporate bonds at current yields. However, the impact of rising yields on the economy is likely to be manageable. The interest coverage ratio for the economy as a whole – defined as the profits corporations generate for every dollar of interest paid – is still above its historic average (Chart 3). Corporate bonds are also generally held by non-leveraged investors such as pension funds, insurance companies, and ETFs. The impact of defaults on the economy tends to be more severe when leveraged institutions are the ones that suffer the greatest losses. Chart 3Interest Costs Not Yet A Headwind
Interest Costs Not Yet A Headwind
Interest Costs Not Yet A Headwind
We share your worries about the long-term fiscal outlook. However, large budget deficits do not currently imperil the economy. The U.S. private sector is running a financial surplus, meaning that it earns more than it spends (Chart 4). Not only does this make the economy more resilient, it also provides the government with additional savings with which to finance its budget deficit. If anything, the highly accommodative stance of fiscal policy has pushed up the neutral rate of interest, giving the Fed greater scope to raise rates before monetary policy enters restrictive territory. The impetus of fiscal policy on the economy will be smaller in 2019 than it was in 2018, but it will still be positive (Chart 5). Chart 4The U.S. Private Sector Is Helping To Finance The Fiscal Deficit
The U.S. Private Sector Is Helping To Finance The Fiscal Deficit
The U.S. Private Sector Is Helping To Finance The Fiscal Deficit
Chart 5U.S. Fiscal Policy Still Stimulative In 2019
U.S. Fiscal Policy Still Stimulative In 2019
U.S. Fiscal Policy Still Stimulative In 2019
The risks to growth are more daunting outside the U.S. As you point out, Italy is struggling to contain borrowing costs, a dark cloud hangs over the Brexit negotiations, and China and most other emerging markets have seen growth slow meaningfully. The U.S., however, is a relatively closed economy – it is not as dependent on trade as most other countries. Its financial system is reasonably resilient thanks to the capital its banks have raised over the past decade. In addition, Dodd-Frank and other legislation have made it more difficult for financial institutions to engage in reckless risk-taking. Mr. X: I would never take a benign view of the ability and willingness of financial institutions to engage in reckless behavior, but maybe I am too cynical. Even if you are right that debt does not pose an immediate threat to the market, surely it will become a huge problem in the next downturn. If the U.S. federal deficit is $1 trillion when the economy is strong, it is bound to reach unimaginable levels in a recession. And, to make matters worse, the Federal Reserve may not have much scope to lower interest rates if they peak at a historically low level in the next year or so. What options will policymakers have to respond to the next cyclical downturn? Is there a limit to how much quantitative easing central banks can do? BCA: The Fed is aware of the challenges it faces if the next recession begins when interest rates are still quite low. Raising rates rapidly in order to have more “ammunition” for counteracting the downturn would hardly be the best course of action as this would only bring forward the onset of the recession. A better strategy is to let the economy overheat a bit so that inflation rises. This would allow the Fed to push real rates further into negative territory if the recession turns out to be severe. There is no real limit on how much quantitative easing the Fed can undertake. The FOMC will undoubtedly turn to asset purchases and forward guidance again during the next economic downturn. Now that the Fed has crossed the Rubicon into unorthodox monetary policy without generating high inflation, policymakers are likely to try even more exotic policies, such as price-level targeting. The private sector tends to try to save more during recessions. Thus, even though the fiscal deficit would widen during the next downturn, there should be plenty of buyers for government debt. However, once the next recovery begins, the Fed may feel increasing political pressure to keep rates low in order to allow the government to maintain its desired level of spending and taxes. The Fed guards its independence fiercely, but in a world of increasingly political populism, that independence may begin to erode. This will not happen quickly, but to the extent that it does occur, higher inflation is likely to be the outcome. Ms. X: I would like to explore the U.S.-China dynamic a bit more because I see that as one of the main challenges to my more optimistic view. I worry that President Trump will continue to take a hard line on China trade because it plays well with his base and has broad support in Congress. And I equally worry that President Xi will not want to be seen giving in to U.S. bullying. How do you see this playing out? BCA: Investors hoping that U.S. President Donald Trump and his Chinese counterpart Xi Jinping will reach a deal to end the trade war on the sidelines of the forthcoming G20 leaders' summit in Buenos Aires are likely to be disappointed. President Trump's fiscal policy is completely inconsistent with his trade agenda. Fiscal stimulus in a full-employment economy will suck in imports. It also forces the Fed to raise rates more aggressively than it otherwise would, leading to a stronger dollar. The result will be a larger U.S. trade deficit. Trump will not be able to blame Canada or Mexico for a deteriorating trade position because he just signed a trade agreement with them. The new USMCA agreement is remarkably similar to NAFTA, with the notable exception that it contains a clause barring Canada and Mexico from negotiating bilateral trade deals with China. This means Trump needs a patsy who will take the blame for America's burgeoning trade deficit and China will fill that role. For his part, President Xi knows full well that he will still be China’s leader when Trump is long gone. Giving in to Trump’s demands would hurt him politically. All this means that the trade war will persist. Mr. X: I see a trade war as a major threat to the economy, but it is not the only thing that could derail the economic expansion. Let’s explore that issue in more detail. The Economic Outlook Mr. X: You have shown in previous research that housing is often a very good leading indicator of the U.S. economy, largely because it is very sensitive to changes in the monetary environment. Are you not concerned about the marked deterioration in recent U.S. housing data? BCA: Recent trends in housing have indeed been disappointing, with residential investment acting as a drag on growth for three consecutive quarters. The weakness has been broad-based with sales, the rate of price appreciation of home prices, and builder confidence all declining (Chart 6). Even though the level of housing affordability is decent by historical standards, there has been a fall in the percentage of those who believe that it is a good time to buy a home. Chart 6Recent Softness In U.S. Housing
Recent Softness In U.S. Housing
Recent Softness In U.S. Housing
There are a few possible explanations for the weakness. First, the 2007-09 housing implosion likely had a profound and lasting impact on the perceived attractiveness of home ownership. The homeownership rate for people under 45 has remained extremely low by historical standards. Secondly, increased oversight and tighter regulations have curbed mortgage supply. Finally, the interest rate sensitivity of the sector may have increased with the result that even modest increases in the mortgage rate have outsized effects. That, in turn, could be partly explained by recent tax changes that capped the deduction on state and local property taxes, while lowering the limit on the tax deductibility of mortgage interest. The trend in housing is definitely a concern, but the odds of a further major contraction seem low. Unlike in 2006, the home vacancy rate stands near record levels and the same is true for the inventory of homes. The pace of housebuilding is below the level implied by demographic trends and consumer fundamentals are reasonably healthy. The key to the U.S. economy lies with business investment and consumer spending and these areas are well supported for the moment. Consumers are benefiting from continued strong growth in employment and a long overdue pickup in wages. Meanwhile, the ratio of net worth-to-income has surpased the previous peak and the ratio of debt servicing-to-income is low (Chart 7). Last year, we expressed some concern that the depressed saving rate might dampen spending, but the rate has since been revised substantially higher. Based on its historical relationship with U.S. household net worth, there is room for the saving rate to fall, fueling more spending. Real consumer spending has grown by 3% over the past year and there is a good chance of maintaining that pace during most of 2019. Chart 7U.S. Consumer Fundamentals Are Healthy
U.S. Consumer Fundamentals Are Healthy
U.S. Consumer Fundamentals Are Healthy
Turning to capital spending, the cut in corporate taxes was obviously good for cash flow, and surveys show a high level of business confidence. Moreover, many years of business caution toward spending has pushed up the average age of the nonresidential capital stock to the highest level since 1963 (Chart 8). Higher wages should also incentivize firms to invest in more machinery. Absent some new shock to confidence, business investment should stay firm during the next year. Chart 8An Aging Capital Stock
An Aging Capital Stock
An Aging Capital Stock
Overall, we expect the pace of U.S. economic growth to slow from its recent strong level, but it should hold above trend, currently estimated to be around 2%. As discussed earlier, that means capacity pressures will intensify, causing inflation to move higher. Ms. X: I share the view that the U.S. economy will continue to grow at a healthy pace, but I am less sure about the rest of the world. BCA: You are right to be concerned. We expected U.S. and global growth to diverge in 2018, but not by as much as occurred. Several factors have weighed on CEO confidence outside of the U.S., including trade wars, a strong dollar, higher oil prices, emerging market turbulence, the return of Italian debt woes, and a slowdown in the Chinese economy. The stress has shown up in the global manufacturing PMI, although the latter is still at a reasonably high level (Chart 9). Global export growth is moderating and the weakness appears to be concentrated in capex. Capital goods imports for the major economies, business investment, and the production of investment-related goods have all decelerated this year. Chart 9Global Manufacturing Slowdown
Global Manufacturing Slowdown
Global Manufacturing Slowdown
Our favorite global leading indicators are also flashing yellow (Chart 10). BCA’s global leading economic indicator has broken below the boom/bust line and its diffusion index suggests further downside. The global ZEW composite and the BCA boom/bust indicator are both holding below zero. Chart 10Global Growth Leading Indicators
Global Growth Leading Indicators
Global Growth Leading Indicators
Current trends in the leading indicators shown in Chart 11 imply that the growth divergence between the U.S. and the rest of the world will remain a key theme well into 2019. Among the advanced economies, Europe and Japan are quite vulnerable to the global soft patch in trade and capital spending. Chart 11Global Economic Divergence Will Continue
Global Economic Divergence Will Continue
Global Economic Divergence Will Continue
The loss of momentum in the Euro Area economy, while expected, has been quite pronounced. Part of this is due to the dissipation of the 2016/17 economic boost related to improved health in parts of the European banking system that sparked a temporary surge in credit growth. The tightening in Italian financial conditions following the government’s budget standoff with the EU has weighed on overall Euro Area growth. Softer Chinese demand for European exports, uncertainties related to U.S. trade policy and the torturous Brexit negotiations, have not helped the situation. Real GDP growth decelerated to close to a trend pace by the third quarter of 2018. The manufacturing PMI has fallen from a peak of 60.6 in December 2017 to 51.5, mirroring a 1% decline in the OECD’s leading economic indicator for the region. Not all the economic news has been bleak. Both consumer and industrial confidence remain at elevated levels according to the European Commission (EC) surveys, consistent with a resumption of above-trend growth. Even though exports have weakened substantially from the booming pace in 2017, the EC survey on firms’ export order books remains at robust levels (Chart 12). Importantly for the Euro Area, the bank credit impulse has moved higher.The German economy should also benefit from a rebound in vehicle production which plunged earlier this year following the introduction of new emission standards. Chart 12Europe: Slowing, But No Disaster
Europe: Slowing, But No Disaster
Europe: Slowing, But No Disaster
We interpret the 2018 Euro Area slowdown as a reversion-to-the-mean rather than the start of an extended period of sub-trend growth. Real GDP growth should fluctuate slightly above trend pace through 2019. Given that the Euro Area’s output gap is almost closed, the ECB will not deviate from its plan to end its asset purchase program by year end. Gradual rate hikes should begin late in 2019, assuming that inflation is closer to target by then. In contrast, the Bank of Japan (BoJ) is unlikely to change policy anytime soon. The good news is that wages have finally begun to grow at about a 2% pace, although it required extreme labor shortages. Yet, core inflation is barely positive and long-term inflation expectations are a long way from the 2% target. The inflation situation will have to improve significantly before the BoJ can consider adjusting or removing the Yield Curve Control policy. This is especially the case since the economy has hit a bit of an air pocket and the government intends to raise the VAT in 2019. Japan’s industrial production has stalled and we expect the export picture to get worse before it gets better. We do not anticipate any significant economic slack to develop, but even a sustained growth slowdown could partially reverse the gains that have been made on the inflation front. Ms. X: We can’t talk about the global economy without discussing China. You have noted in the past how the authorities are walking a tightrope between trying to unwind the credit bubble and restructure the economy on the one hand, and prevent a destabilizing economic and financial crisis on the other. Thus far, they have not fallen off the tightrope, but there has been limited progress in resolving the country’s imbalances. And now the authorities appear to be stimulating growth again, risking an even bigger buildup of credit. Can it all hold together for another year? BCA: That’s a very good question. Thus far, there is not much evidence that stimulus efforts are working. Credit growth is still weak and leading economic indicators have not turned around (Chart 13). There is thus a case for more aggressive reflation, but the authorities also remain keen to wean the economy off its addiction to debt. Chart 13China: No Sign Of Reacceleration
China: Credit Impulse Remains Weak
China: Credit Impulse Remains Weak
Waves of stimulus have caused total debt to soar from 140% of GDP in 2008 to about 260% of GDP at present (Chart 14). As is usually the case, rapid increases in leverage have been associated with a misallocation of capital. Since most of the new credit has been used to finance fixed-asset investment, the result has been overcapacity in a number of areas. For example, the fact that 15%-to-20% of apartments are sitting vacant is a reflection of overbuilding. Meanwhile, the rate of return on assets in the state-owned corporate sector has fallen below borrowing costs. Chart 14China: Debt Still Rising
China: Debt Still Rising
China: Debt Still Rising
Chinese exports are holding up well so far, but this might only represent front-running ahead of the implementation of higher tariffs. Judging from the steep drop in the export component of both the official and private-sector Chinese manufacturing PMI, exports are likely to come under increasing pressure over the next few quarters as the headwinds from higher tariffs fully manifest themselves (Chart 15). Chart 15Chinese Exports About To Suffer
Chinese Exports About To Suffer
Chinese Exports About To Suffer
The most likely outcome is that the authorities will adjust the policy dials just enough to stabilize growth sometime in the first half of 2019. The bottoming in China’s broad money impulse offers a ray of hope (Chart 16). Still, it is a tentative signal at best and it will take some time before this recent easing in monetary policy shows up in our credit impulse measure and, later, economic growth. A modest firming in Chinese growth in the second half of 2019 would provide a somewhat stronger demand backdrop for commodities and emerging economies that sell goods to China. Chart 16A Ray Of Hope From Broad Money
bca.bca_mp_2018_12_01_c16
bca.bca_mp_2018_12_01_c16
Ms. X: If you are correct about a stabilization in the Chinese economy next year, this presumably would be good news for emerging economies, especially if the Fed goes on hold. EM assets have been terribly beaten down and I am looking for an opportunity to buy. BCA: Fed rate hikes might have been the catalyst for the past year’s pain in EM assets, but it is not the underlying problem. As we highlighted at last year’s meeting, the troubles for emerging markets run much deeper. Our long-held caution on emerging economies and markets is rooted in concern about deteriorating fundamentals. Excessive debt is a ticking time bomb for many of these countries; EM dollar-denominated debt is now as high as it was in the late 1990s as a share of both GDP and exports (Chart 17). Moreover, the declining long-term growth potential for emerging economies as a group makes it more difficult for them to service the debt. The structural downtrend in EM labor force and productivity growth underscores that trend GDP growth has collapsed over the past three decades (Chart 17, bottom panel). Chart 17EM Debt A Problem Given Slowing Supply-Side...
EM Debt A Problem Given Slowing Supply-Side...
EM Debt A Problem Given Slowing Supply-Side...
Decelerating global growth has exposed these poor fundamentals. EM sovereign spreads have moved wider in conjunction with falling PMIs and slowing industrial production and export growth. And it certainly does not help that the Fed is tightening dollar-based liquidity conditions. EM equities usually fall when U.S. financial conditions tighten (Chart 18). Chart 18...And Tightening Financial Conditions
...And Tightening Financial Conditions
...And Tightening Financial Conditions
Chart 19 highlights the most vulnerable economies in terms of foreign currency funding requirements, and foreign debt-servicing obligations relative to total exports. Turkey stands out as the most vulnerable, along with Argentina, Brazil, Indonesia, Chile, and Colombia. In contrast, Emerging Asia appears to be in better shape relative to the crisis period of the late 1990s. Chart 19Spot The Outliers
OUTLOOK 2019: Late-Cycle Turbulence
OUTLOOK 2019: Late-Cycle Turbulence
The backdrop for EM assets is likely to get worse in the near term, given our view that the Fed will continue to tighten and China will be cautious about stimulating more aggressively. Our base case outlook sees some relief in the second half of 2019, but it is more of a “muddle-through” scenario than a V-shaped economic recovery. Mr. X: Perhaps EM assets could enjoy a bounce next year if the Chinese economy stabilizes, but the poor macro fundamentals you mentioned suggest that it would be a trade rather than a buy-and-hold proposition. I am inclined to avoid the whole asset class in 2019. Bond Market Prospects Ms. X: Let’s turn to fixed income now. I was bearish on bonds in 2018, but yields have risen quite a bit, at least in the United States. The Fed has lifted the fed funds rate by 100 basis points over the past year and I don’t see a lot of upside for inflation. So perhaps yields have peaked and will move sideways in 2019, which would be good for stocks in my view. BCA: Higher yields have indeed improved bond value recently. Nonetheless, they are not cheap enough to buy at this point (Chart 20). The real 10-year Treasury yield, at close to 1%, is still depressed by pre-Lehman standards. Long-term real yields in Germany and Japan remain in negative territory at close to the lowest levels ever recorded. Chart 20Real Yields Still Very Depressed
Real Yields Still Very Depressed
Real Yields Still Very Depressed
We called the bottom in global nominal bond yields in 2016. Our research at the time showed that the cyclical and structural factors that had depressed yields were at an inflection point, and were shifting in a less bond-bullish direction. Perhaps most important among the structural factors, population aging and a downward trend in underlying productivity growth resulted in lower equilibrium bond yields over the past couple of decades. Looking ahead, productivity growth could stage a mild rebound in line with the upturn in the growth rate of the capital stock (Chart 21). As for demographics, the age structure of the world population is transitioning from a period in which aging added to the global pool of savings to one in which aging is beginning to drain that pool as people retire and begin to consume their nest eggs (Chart 22). The household saving rates in the major advanced economies should trend lower in the coming years, placing upward pressure on equilibrium global bond yields. Chart 21Productivity Still Has Some Upside
Productivity Still Has Some Upside
Productivity Still Has Some Upside
Chart 22Demographics Past The Inflection Point
Demographics Past The Inflection Point
Demographics Past The Inflection Point
Cyclical factors are also turning against bonds. U.S. inflation has returned to target and the Fed is normalizing short-term interest rates. The market currently is priced for only one more rate hike after December 2018 in this cycle, but we see rates rising more than that. Treasury yields will follow as market expectations adjust. Long-term inflation expectations are still too low in the U.S. and most of the other major economies to be consistent with central banks’ meeting their inflation targets over the medium term. As actual inflation edges higher, long-term expectations built into bond yields will move up. The term premium portion of long-term bond yields is also too low. This is the premium that investors demand to hold longer-term bonds. Our estimates suggest that the term premium is still negative in the advanced economies outside of the U.S., which is not sustainable over the medium term (Chart 23). Chart 23Term Premia Are Too Low
Term Premia Are Too Low
Term Premia Are Too Low
We expect term premia to rise for two main reasons. First, investors have viewed government bonds as a good hedge for their equity holdings because bond prices have tended to rise when stock prices fell. Investors have been willing to pay a premium to hold long-term bonds to benefit from this hedging effect. But the correlation is now beginning to change as inflation and inflation expectations gradually adjust higher and output gaps close. As the hedging benefit wanes, the term premium should rise back into positive territory. Second, central bank bond purchases and forward guidance have depressed yields as well as interest-rate volatility. The latter helped to depress term premia in the bond market. This effect, too, is beginning to unwind. The Fed is letting its balance sheet shrink by about $50 billion per month. The Bank of England has kept its holdings of gilts and corporate bonds constant for over a year, while the ECB is about to end asset purchases. The Bank of Japan continues to buy assets, but at a much reduced pace. All this means that the private sector is being forced to absorb a net increase in government bonds for the first time since 2014 (Chart 24). Chart 25 shows that bond yields in the major countries will continue to trend higher as the rapid expansion of central bank balance sheets becomes a thing of the past. Chart 24Private Sector To Absorb More Bonds
OUTLOOK 2019: Late-Cycle Turbulence
OUTLOOK 2019: Late-Cycle Turbulence
Chart 25QE Unwind Will Weigh On Bond Prices
QE Unwind Will Weigh On Bond Prices
QE Unwind Will Weigh On Bond Prices
Ms. X: I’m not a fan of bonds at these levels, but that sounds overly bearish to me, especially given the recent plunge in oil prices. BCA: Lower oil prices will indeed help to hold down core inflation to the extent that energy prices leak into non-energy prices in the near term. Nonetheless, in the U.S., this effect will be overwhelmed by an overheated economy. From a long-term perspective, we believe that investors still have an overly benign view of the outlook for yields. The market expects that the 10-year Treasury yield in ten years will only be slightly above today’s spot yield, which itself is still very depressed by historical standards (Chart 26). And that also is the case in the other major bond markets. Chart 26Forward Yields Are Too Low
Forward Yields Are Too Low
Forward Yields Are Too Low
Of course, it will not be a straight line up for yields – there will be plenty of volatility. We expect the 10-year Treasury yield to peak sometime in 2019 or early 2020 in the 3.5%-to-4% range, before the next recession sends yields temporarily lower. Duration should be kept short at least until the middle of 2019, with an emphasis on TIPS relative to conventional Treasury bonds. We will likely downgrade TIPS versus conventionals once long-term inflation expectations move into our target range, which should occur sometime during 2019. The ECB and Japan will not be in a position to raise interest rates for some time, but the bear phase in U.S. Treasurys will drag up European and Japanese bond yields (at the very long end of the curve for the latter). Total returns are likely to be negative in all of the major bond markets in 2019. Real 10-year yields in all of the advanced economies are still well below their long-term average, except for Greece, Italy and Portugal (Chart 27). Chart 27Valuation Ranking Of Developed Bond Markets
OUTLOOK 2019: Late-Cycle Turbulence
OUTLOOK 2019: Late-Cycle Turbulence
Within global bond portfolios, we recommend being underweight bond markets where central banks are in a position to raise short-term interest rates (the U.S. and Canada), and overweight those that are not (Japan and Australia). The first ECB rate hike is unlikely before the end of 2019. However, the imminent end of the asset purchase program argues for no more than a benchmark allocation to core European bond markets within global fixed-income portfolios, especially since real 10-year yields in parts of continental Europe are the furthest below their long-term average. We are overweight gilts at the moment, but foresee shifting to underweight in 2019, depending on how Brexit plays out. Ms. X: What about corporate bonds? I know that total returns for corporates will be poor if government bond yields are rising. But you recommended overweighting corporate bonds relative to Treasurys last year. Given your view that the next U.S. recession is more than a year away, it seems reasonable to assume they will outperform government bonds. BCA: We were overweight corporates in the first half of 2018, but took profits in June and shifted to neutral at the same time that we downgraded our equity allocation. Spreads had tightened to levels that did not compensate investors for the risks. Recent spread widening has returned some value to U.S. corporates. The 12-month breakeven spreads for A-rated and Baa-rated corporate bonds are almost back up to their 50th percentile relative to history (Chart 28). Still, these levels are not attractive enough to justify buying based on valuation alone. As for high-yield, any rise in the default rate would quickly overwhelm the yield pickup in this space. Chart 28Corporate Bond Yields Still Have Upside
Corporate Bond Yields Still Have Upside
Corporate Bond Yields Still Have Upside
It is possible that some of the spread widening observed in October and November will reverse, but corporates offer a poor risk/reward tradeoff, even if the default rate stays low. Corporate profit growth is bound to decelerate in 2019. This would not be a disaster for equities, but slowing profit growth is more dangerous for corporate bond excess returns because the starting point for leverage is already elevated. As discussed above, at a macro level, the aggregate interest coverage ratio for the U.S. corporate sector is decent by historical standards. However, this includes mega-cap companies that have little debt and a lot of cash. Our bottom-up research suggests that interest coverage ratios for firms in the Bloomberg Barclays corporate bond index will likely drop close to multi-decade lows during the next recession, sparking a wave of downgrade activity and fallen angels. Seeing this coming, investors may require more yield padding to compensate for these risks as profit growth slows. Our next move will likely be to downgrade corporate bonds to underweight. We are watching the yield curve, bank lending standards, profit growth, and monetary indicators for signs to further trim exposure. You should already be moving up in quality within your corporate bond allocation. Mr. X: We have already shifted to underweight corporate bonds in our fixed income portfolio. Even considering the cheapening that has occurred over the past couple of months, spread levels still make no sense in terms of providing compensation for credit risk. Equity Market Outlook Ms. X: While we all seem to agree that corporate bonds are not very attractive, I believe that enough value has been restored to equities that we should upgrade our allocation, especially if the next recession is two years away. And I know that stocks sometimes have a powerful blow-off phase before the end of a bull market. Mr. X: This is where I vehemently disagree with my daughter. The recent sell-off resembles a bloodbath in parts of the global market. It has confirmed my worst fears, especially related to the high-flying tech stocks that I believe were in a bubble. Hopes for a blow-off phase are wishful thinking. I’m wondering if the sell-off represents the beginning of an extended bear market. BCA: Some value has indeed been restored. However, the U.S. market is far from cheap relative to corporate fundamentals. The trailing and 12-month forward price-earnings ratios (PER) of 20 and 16, respectively, are still far above their historical averages, especially if one leaves out the tech bubble period of the late 1990s. And the same is true for other metrics such as price-to-sales and price-to-book value (Chart 29). BCA’s composite valuation indicator, based on 8 different valuation measures, is only a little below the threshold of overvaluation at +1 standard deviation because low interest rates still favor equities on a relative yield basis. Chart 29U.S. Equities Are Not Cheap
U.S. Equities Are Not Cheap
U.S. Equities Are Not Cheap
It is true that equities can reward investors handsomely in the final stage of a bull market. Chart 30 presents cumulative returns to the S&P 500 in the last nine bull markets. The returns are broken down by quintile. The greatest returns, unsurprisingly, generally occur in the first part of the bull market (quintile 1). But total returns in the last 20% of the bull phase (quintile 5) have been solid and have beaten the middle quartiles. Chart 30Late-Cycle Blow-Offs Can Be Rewarding
OUTLOOK 2019: Late-Cycle Turbulence
OUTLOOK 2019: Late-Cycle Turbulence
Of course, the tricky part is determining where we are in the bull market. We have long viewed financial markets through the lens of money and credit. This includes a framework that involves the Fed policy cycle. The historical track record for risk assets is very clear; they tend to perform well when the fed funds rate is below neutral, whether rates are rising or falling. Risk assets tend to underperform cash when the fed funds rate is above neutral (Table 3). Table 3Stocks Do Well When The Fed Funds Rate Is Below Neutral
OUTLOOK 2019: Late-Cycle Turbulence
OUTLOOK 2019: Late-Cycle Turbulence
We believe the fed funds rate is still in easy territory. This suggests that it is too early to shift to underweight on risk assets. We may even want to upgrade to overweight if stocks become cheap enough, as long as Fed policy is not restrictive. That said, there is huge uncertainty about the exact level of rates that constitutes “neutral” (or R-star in the Fed’s lingo). Even the Fed is unsure. This means that we must watch for signs that the fed funds rate has crossed the line into restrictive territory as the FOMC tightens over the coming year. An inversion of the 3-month T-bill/10-year yield curve slope would be a powerful signal that policy has become tight, although the lead time of an inverted curve and declining risk asset prices has been quite variable historically. Finally, it is also important to watch U.S. profit margins. Some of our research over the past couple of years focused on the late-cycle dynamics of previous long expansions, such as the 1960s, 1980s and 1990s. We found that risk assets came under pressure once U.S. profit margins peaked. Returns were often negative from the peak in margins to the subsequent recession. Mr. X: U.S. profit margins must be close to peak levels. I’ve seen all sorts of anecdotal examples of rising cost pressures, not only in the labor market. BCA: We expected to see some margin pressure to appear by now. S&P 500 EPS growth will likely top out in the next couple of quarters, if only because the third quarter’s 26% year-over-year pace is simply not sustainable. But it is impressive that our margin proxies are not yet flagging an imminent margin squeeze, despite the pickup in wage growth (Chart 31). Chart 31U.S. Margin Indicators Still Upbeat
U.S. Margin Indicators Still Upbeat
U.S. Margin Indicators Still Upbeat
Margins according to the National Accounts (NIPA) data peaked in 2014 and have since diverged sharply with S&P 500 operating margins. It is difficult to fully explain the divergence. The NIPA margin is considered to be a better measure of underlying U.S. corporate profitability because it includes all companies (not just 500), and it is less subject to accounting trickery. That said, even the NIPA measure of margins firmed a little in 2018, along with the proxies we follow that correlate with the S&P 500 measure. The bottom line is that the macro variables that feed into our top-down U.S. EPS model point to a continuing high level of margins and fairly robust top-line growth, at least for the near term. For 2019, we assumed slower GDP growth and incorporated some decline in margins into our projection just to err on the conservative side. Nonetheless, our EPS model still projects a respectable 8% growth rate at the end of 2019 (Chart 32). The dollar will only be a minor headwind to earnings growth unless it surges by another 10% or more. Chart 32EPS Growth Forecasts
EPS Growth Forecasts
EPS Growth Forecasts
The risks to EPS growth probably are to the downside relative to our forecast, but the point is that U.S. earnings will likely remain supportive for the market unless economic growth is much weaker than we expect. None of this means that investors should be aggressively overweight stocks now. We trimmed our equity recommendation to benchmark in mid-2018 for several reasons. At the time, value was quite poor and bottom-up earnings expectations were too high, especially on a five-year horizon. Also, sentiment measures suggested that investors were overly complacent. As you know, we are always reluctant to chase markets into highly overvalued territory, especially when a lot of good news has been discounted. As we have noted, we are open to temporarily shifting back to overweight in equities and other risk assets. The extension of the economic expansion gives more time for earnings to grow. The risks facing the market have not eased much but, given our base-case macro view, we would be inclined to upgrade equities if there is another meaningful correction. Of course, our profit, monetary and economic indicators would have to remain supportive to justify an upgrade. Mr. X: But you are bearish on bonds. We saw in October that the equity market is vulnerable to higher yields. BCA: It certainly won’t be smooth sailing through 2019 as interest rates normalize. Until recently, higher bond yields reflected stronger growth without any associated fears that inflation was a growing problem. The ‘Fed Put’ was seen as a key backstop for the equity bull market. But now that the U.S. labor market is showing signs of overheating, the bond sell-off has become less benign for stocks because the Fed will be less inclined to ease up at the first sign of trouble in the equity market. How stocks react in 2019 to the upward trend in yields depends a lot on the evolution of actual inflation and long-term inflation expectations. If core PCE inflation hovers close to or just above 2% for a while, then the Fed Put should still be in place. However, it would get ugly for both bonds and stocks if inflation moves beyond 2.5%. Our base case is that this negative dynamic won’t occur until early 2020, but obviously the timing is uncertain. One key indicator to watch is long-term inflation expectations, such as the 10-year TIPS breakeven inflation rate (Chart 33). It is close to 2% at the moment. If it shifts up into the 2.3%-2.5% range, it would confirm that inflation expectations have returned to a level that is consistent with the Fed meeting its 2% inflation target on a sustained basis. This would be a signal to the Fed that it is must become more aggressive in calming growth, with obvious negative consequences for risk assets. Chart 33Watch For A Return To 2.3%-2.5% Range
Watch For A Return To 2.3%-2.5% Range
Watch For A Return To 2.3%-2.5% Range
Mr. X: I am skeptical that the U.S. corporate sector can pull off an 8% earnings gain in 2019. What about the other major markets? Won’t they get hit hard if global growth continues to slow as you suggest? BCA: Yes, that is correct. It is not surprising that EPS growth has already peaked in the Euro Area and Japan. The profit situation is going to deteriorate quickly in the coming quarters. Industrial production growth in both economies has already dropped close to zero, and we use this as a proxy for top-line growth in our EPS models. Nominal GDP growth has decelerated sharply in both economies in absolute terms and relative to the aggregate wage bill. These trends suggest that profit margins are coming under significant downward pressure. Even when we build in a modest growth pickup and slight rebound in margins in 2019, EPS growth falls close to zero by year-end according to our models. Both the Euro Area and Japanese equity markets are cheap relative to the U.S., based on our composite valuation indicators (Chart 34). However, neither is above the threshold of undervaluation (+1 standard deviation) that would justify overweight positions on valuation alone. We think the U.S. market will outperform the other two at least in the first half of 2019 in local and, especially, common-currency terms. Chart 34Valuation Of Nonfinancial Equity Markets Relative To The U.S.
OUTLOOK 2019: Late-Cycle Turbulence
OUTLOOK 2019: Late-Cycle Turbulence
Ms. X: It makes sense that U.S. profit growth will outperform the other major developed countries in 2019. I would like to circle back to emerging market assets. I understand that many emerging economies have deep structural problems. But you admitted that the Chinese authorities will eventually stimulate enough to stabilize growth, providing a bounce in EM growth and asset prices next year. These assets seem cheap enough to me to warrant buying now in anticipation of that rally. As we all know, reversals from oversold levels can happen in a blink of an eye and I don’t want to miss it. BCA: We are looking for an opportunity to buy as well, but are wary of getting in too early. First, valuation has improved but is not good enough on its own to justify buying now. EM stocks are only moderately undervalued based on our EM composite valuation indicator and the cyclically-adjusted P/E ratio (Chart 35). EM currencies are not particularly cheap either, outside of Argentina, Turkey and Mexico (Charts 36A and 36B). Valuation should only play a role in investment strategy when it is at an extreme, and this is not the case for most EM countries. Chart 35EM Stocks Are Not At Capitulation Levels...
bca.bca_mp_2018_12_01_c35
bca.bca_mp_2018_12_01_c35
Chart 36A…And Neither Are EM Currencies
...And Neither Are EM Currencies
...And Neither Are EM Currencies
Chart 36B…And Neither Are EM Currencies
...And Neither Are EM Currencies
...And Neither Are EM Currencies
Second, corporate earnings growth has plenty of downside potential in the near term. Annual growth in EM nonfinancial EBITDA, currently near 10%, is likely to turn negative next year, based on our China credit and fiscal impulse indicator (Chart 37). And, as we emphasized earlier, China is not yet pressing hard on the gas pedal. Chart 37EM Earnings Growth: Lots Of Downside
EM Earnings Growth: Lots Of Downside
EM Earnings Growth: Lots Of Downside
Third, it will take time for more aggressive Chinese policy stimulus, if it does occur, to show up in EM stocks and commodity prices. Trend changes in money growth and our credit and fiscal impulse preceded the trough in EM stocks and commodity prices in 2015, and again at the top in stocks and commodities in 2017 (Chart 38). However, even if these two indicators bottom today, it could take several months before the sell-off in EM financial markets and commodity prices abates. Chart 38Chinese Money And Credit Leads EM And Commodities
Chinese Money And Credit Leads EM And Commodities
Chinese Money And Credit Leads EM And Commodities
Finally, if Chinese stimulus comes largely via easier monetary policy rather than fiscal stimulus, then the outcome will be a weaker RMB. We expect the RMB to drift lower in any event, because rate differentials vis-à-vis the U.S. will move against the Chinese currency next year. A weaker RMB would add to the near-term headwinds facing EM assets. The bottom line is that the downside risks remain high enough that you should resist the temptation to bottom-fish until there are concrete signs that the Chinese authorities are getting serious about boosting the economy. We are also watching for signs outside of China that the global growth slowdown is ending. This includes our global leading economic indicator and data that are highly sensitive to global growth, such as German manufacturing foreign orders. Mr. X: Emerging market assets would have to become a lot cheaper for me to consider buying. Debt levels are just too high to be sustained, and stronger Chinese growth would only provide a short-term boost. I’m not sure I would even want to buy developed market risk assets based solely on some Chinese policy stimulus. BCA: Yes, we agree with your assessment that buying EM in 2019 would be a trade rather than a buy-and-hold strategy. Still, the combination of continued solid U.S. growth and a modest upturn in the Chinese economy would alleviate a lot of investors’ global growth concerns. The result could be a meaningful rally in pro-cyclical assets that you should not miss. We are defensively positioned at the moment, but we could see becoming more aggressive in 2019 on signs that China is stimulating more firmly and/or our global leading indicators begin to show some signs of life. Besides upgrading our overall equity allocation back to overweight, we would dip our toes in the EM space again. At the same time, we will likely upgrade the more cyclical DM equity markets, such as the Euro Area and Japan, while downgrading the defensive U.S. equity market to underweight. We are currently defensively positioned in terms of equity sectors, but it would make sense to shift cyclicals to overweight at the same time. Exact timing is always difficult, but we expect to become more aggressive around the middle of 2019. We also think the time is approaching to favor long-suffering value stocks over growth stocks. The relative performance of growth-over-value according to standard measures has become a sector call over the past decade: tech or financials. The sector skew complicates this issue, especially since tech stocks have already cracked. But we have found that stocks that are cheap within equity sectors tend to outperform expensive (or growth) stocks once the fed funds rate moves into restrictive territory. This is likely to occur in the latter half of 2019. Value should then have its day in the sun. Currencies: Mr. X: We don’t usually hedge our international equity exposure, so the direction of the dollar matters a lot to us. As you predicted a year ago, the U.S. dollar reigned supreme in 2018. Your economic views suggest another good year in 2019, but won’t this become a problem for the economy? President Trump’s desire to lower the U.S. trade deficit suggests that the Administration would like the dollar to drop and we could get some anti-dollar rhetoric from the White House. Also, it seems that the consensus is strongly bullish on the dollar which is always a concern. BCA: The outlook for the dollar is much trickier than it was at the end of 2017. As you highlighted, traders are already very long the dollar, implying that the hurdle for the greenback to surprise positively is much higher now. However, a key driver for the dollar is the global growth backdrop. If the latter is poor in the first half of 2019 as we expect, it will keep a bid under the greenback. Interest rates should also remain supportive for the dollar. As we argued earlier, current market expectations – only one more Fed hike after the December meeting – are too sanguine. If the Fed increases rates by more than currently discounted, the dollar’s fair value will rise, especially if global growth continues to lag that of the U.S. Since the dollar’s 2018 rally was largely a correction of its previous undervaluation, the currency has upside potential in the first half of the year (Chart 39). Chart 39U.S. Dollar Not Yet Overvalued
U.S. Dollar Not Yet Overvalued
U.S. Dollar Not Yet Overvalued
A stronger dollar will dampen foreign demand for U.S.-produced goods and will boost U.S. imports. However, do not forget that a rising dollar benefits U.S. consumers via its impact on import prices. Since the consumer sector represents 68% of GDP, and that 69% of household consumption is geared toward the (largely domestic) service sector, a strong dollar will not be as negative for aggregate demand and employment as many commentators fear, unless it were to surge by at least another 10%. In the end, the dollar will be more important for the distribution of U.S. growth than its overall level. Where the strong dollar is likely to cause tremors is in the political arena. You are correct to point out that there is a large inconsistency between the White House’s desires to shore up growth, while simultaneously curtailing the trade deficit, especially if the dollar appreciates further. As long as the Fed focuses on its dual mandate and tries to contain inflationary pressures, the executive branch of the U.S. government can do little to push the dollar down. Currency intervention cannot have a permanent effect unless it is accompanied by shifts in relative macro fundamentals. For example, foreign exchange intervention by the Japanese Ministry of Finance in the late 1990s merely had a temporary impact on the yen. The yen only weakened on a sustained basis once interest rate differentials moved against Japan. This problem underpins our view that the Sino-U.S. relationship is unlikely to improve meaningfully next year. China will remain an easy target to blame for the U.S.’s large trade deficit. What ultimately will signal a top in the dollar is better global growth, which is unlikely until the second half of 2019. At that point, expected returns outside the U.S. will improve, causing money to leave the U.S., pushing the dollar down. Mr. X: While 2017 was a stellar year for the euro, 2018 proved a much more challenging environment. Will 2019 be more like 2017 or 2018? BCA: We often think of the euro as the anti-dollar; buying EUR/USD is the simplest, most liquid vehicle for betting against the dollar, and vice versa. Our bullish dollar stance is therefore synonymous with a negative take on the euro. Also, the activity gap between the U.S. and the Euro Area continues to move in a euro-bearish fashion (Chart 40). Finally, since the Great Financial Crisis, EUR/USD has lagged the differential between European and U.S. core inflation by roughly six months. Today, this inflation spread still points toward a weaker euro. Chart 40Relative LEI's Moving Against Euro
Relative LEI's Moving Against Euro
Relative LEI's Moving Against Euro
It is important to remember that when Chinese economic activity weakens, European growth deteriorates relative to the U.S. Thus, our view that global growth will continue to sputter in the first half of 2019 implies that the monetary policy divergence between the Fed and the ECB has not yet reached a climax. Consequently, we expect EUR/USD to trade below 1.1 in the first half of 2019. By that point, the common currency will be trading at a meaningful discount to its fair value, which will allow it to find a floor (Chart 41). Chart 41Euro Heading Below Fair Value Before Bottoming
Euro Heading Below Fair Value Before Bottoming
Euro Heading Below Fair Value Before Bottoming
Mr. X: The Bank of Japan has debased the yen, with a balance sheet larger than Japan’s GDP. This cannot end well. I am very bearish on the currency. BCA: The BoJ’s monetary policy is definitely a challenge for the yen. The Japanese central bank rightfully understands that Japan’s inability to generate any meaningful inflation – despite an economy that is at full employment – is the consequence of a well-established deflationary mindset. The BoJ wants to shock inflation expectations upward by keeping real rates at very accommodative levels well after growth has picked up. This means that the BoJ will remain a laggard as global central banks move away from accommodative policies. The yen will continue to depreciate versus the dollar as U.S. yields rise on a cyclical horizon. That being said, the yen still has a place within investors’ portfolios. First, the yen is unlikely to collapse despite the BoJ’s heavy debt monetization. The JPY is one of the cheapest currencies in the world, with its real effective exchange rate hovering at a three-decade low (Chart 42). Additionally, Japan still sports a current account surplus of 3.7% of GDP, hardly the sign of an overstimulated and inflationary economy where demand is running amok. Instead, thanks to decades of current account surpluses, Japan has accumulated a positive net international investment position of 60% of GDP. This means that Japan runs a constant and large positive income balance, a feature historically associated with strong currencies. Chart 42The Yen Is Very Cheap
The Yen Is Very Cheap
The Yen Is Very Cheap
Japan’s large net international investment position also contributes to the yen’s defensive behavior as Japanese investors pull money back to safety at home when global growth deteriorates. Hence, the yen could rebound, especially against the euro, the commodity currencies, and EM currencies if there is a further global growth scare in the near term. Owning some yen can therefore stabilize portfolio returns during tough times. As we discussed earlier, we would avoid the EM asset class, including currency exposure, until global growth firms. Commodities: Ms. X: Once again, you made a good call on the energy price outlook a year ago, with prices moving higher for most of the year. But the recent weakness in oil seemed to come out of nowhere, and I must admit to being confused about where we go next. What are your latest thoughts on oil prices for the coming year? BCA: The fundamentals lined up in a very straightforward way at the end of 2017. The coalition we have dubbed OPEC 2.0 – the OPEC and non-OPEC producer group led by the Kingdom of Saudi Arabia (KSA) and Russia – outlined a clear strategy to reduce the global oil inventory overhang. The producers that had the capacity to increase supply maintained strict production discipline which, to some analysts, was still surprising even after the cohesiveness shown by the group in 2017. Outside that core group output continued to fall, especially in Venezuela, which remains a high-risk producing province. The oil market was balanced and prices were slowly moving higher as we entered the second quarter of this year, when President Trump announced the U.S. would re-impose oil export sanctions against Iran beginning early November. The oft-repeated goal of the sanctions was to reduce Iranian exports to zero. To compensate for the lost Iranian exports, President Trump pressured OPEC, led by KSA, to significantly increase production, which they did. However, as we approached the November deadline, the Trump Administration granted the eight largest importers of Iranian oil 180-day waivers on the sanctions. This restored much of the oil that would have been lost. Suddenly, the market found itself oversupplied and prices fell. As we move toward the December 6 meeting of OPEC 2.0 in Vienna, we are expecting a production cut from the coalition of as much as 1.4mm b/d to offset these waivers. The coalition wishes to keep global oil inventories from once again over-filling and dragging prices even lower in 2019. On the demand side, consumption continues to hold up both in the developed and emerging world, although we have somewhat lowered our expectations for growth next year. We are mindful of persistent concerns over the strength of demand – particularly in EM – in 2019. Thus, on the supply side and the demand side, the level of uncertainty in the oil markets is higher than it was at the start of 2018. Nonetheless, our base-case outlook is on the optimistic side for oil prices in 2019, with Brent crude oil averaging around $82/bbl, and WTI trading $6/bbl below that level (Chart 43). Chart 43Oil Prices To Rebound In 2019
Oil Prices To Rebound In 2019
Oil Prices To Rebound In 2019
Ms. X: I am skeptical that oil prices will rebound as much as you expect. First, oil demand is likely to falter if your view that global growth will continue slowing into early 2019 proves correct. Second, U.S. shale production is rising briskly, with pipeline bottlenecks finally starting to ease. Third, President Trump seems to have gone from taking credit for high equity prices to taking credit for low oil prices. Trump has taken a lot flack for supporting Saudi Arabia following the killing of The Washington Post journalist in Turkey. Would the Saudis really be willing to lose Trump’s support by cutting production at this politically sensitive time? BCA: Faltering demand growth remains a concern. However, note that in our forecasts we do expect global oil consumption growth to slow down to 1.46mm b/d next year, somewhat lower than the 1.6mm b/d growth we expect this year. In terms of the U.S. shale sector, production levels over the short term can be somewhat insensitive to changes in spot and forward prices, given the hedging activity of producers. Over the medium to longer term, however, lower spot and forward prices will disincentivize drilling by all but the most efficient producers with the best, lowest-cost acreage. If another price collapse were to occur – and were to persist, as the earlier price collapse did – we would expect a production loss of between 5% and 10% from the U.S. shales. Regarding KSA, the Kingdom needs close to $83/bbl to balance its budget this year and next, according to the IMF’s most recent estimates. If prices remain lower for longer, KSA’s official reserves will continue to fall, as its sovereign wealth fund continues to be tapped to fill budget gaps. President Trump’s insistence on higher production from KSA and the rest of OPEC is a non-starter – it would doom those economies to recession, and stifle further investment going forward. The U.S. would also suffer down the road, as the lack of investment significantly tightens global supply. So, net, if production cuts are not forthcoming from OPEC at its Vienna meeting we – and the market – will be downgrading our oil forecast. Ms. X: Does your optimism regarding energy extend to other commodities? The combination of a strong dollar and a China slowdown did a lot of damage to industrial commodities in 2018. Given your view that China’s economy should stabilize in 2019, are we close to a bottom in base metals? BCA: It is too soon to begin building positions in base metals because the trade war is going to get worse before it gets better. Exposure to base metals should be near benchmark at best entering 2019, although we will be looking to upgrade along with other risk assets if Chinese policy stimulus ramps up. Over the medium term, the outlook for base metals hinges on how successfully China pulls off its pivot toward consumer- and services-led growth, away from heavy industrial-led development. China accounts for roughly half of global demand for these base metals. Commodity demand from businesses providing consumer goods and services is lower than that of heavy industrial export-oriented firms. But demand for commodities used in consumer products – e.g., copper, zinc and nickel, which go into stainless-steel consumer appliances such as washers and dryers – will remain steady, and could increase if the transition away from heavy industrial-led growth is successful. Gasoline and jet fuel demand will also benefit, as EM consumers’ demand for leisure activities such as tourism increases with rising incomes. China is also going to be a large producer and consumer of electric vehicles, as it attempts to reduce its dependence on imported oil. Although timing the production ramp-up is difficult, in the long term these trends will be supportive for nickel and copper. Mr. X: You know I can’t let you get away without asking about gold. The price of bullion is down about 5% since the end of 2017, but that is no worse than the global equity market and it did provide a hedge against economic, financial or political shocks. The world seems just as risky as it did a year ago, so I am inclined to hold on to our gold positions, currently close to 10% of our portfolio. That is above your recommended level, but keeping a solid position in gold is one area where my daughter and I have close agreement regarding investment strategy. BCA: Gold did perform well during the risk asset corrections we had in 2018, and during the political crises as well. The price is not too far away from where we recommended going long gold as a portfolio hedge at the end of 2017 ($1230.3/oz). We continue to expect gold to perform well as a hedge. When other risk assets are trading lower, gold holds value relative to equities and tends to outperform bonds (Chart 44). Likewise, when other risk assets are rising, gold participates, but does not do as well as equities. It is this convexity – outperforming on the downside but participating on the upside with other risk assets – that continues to support our belief that gold has a role as a portfolio hedge. However, having 10% of your portfolio in gold is more than we would recommend – we favor an allocation of around 5%. Chart 44Hold Some Gold As A Hedge
OUTLOOK 2019: Late-Cycle Turbulence
OUTLOOK 2019: Late-Cycle Turbulence
Geopolitics Ms. X: I’m glad that the three of us agree at least on one thing – hold some gold! Let’s return to the geopolitical situation for a moment. Last year, you correctly forecast that divergent domestic policies in the U.S. and China – stimulus in the former and lack thereof in the latter – would be the most investment-relevant geopolitical issue. At the time, I found this an odd thing to highlight, given the risks of protectionism, populism, and North Korea. Do you still think that domestic policies will dominate in 2019? BCA: Yes, policy divergence between the U.S. and China will also dominate in 2019, especially if it continues to buoy the U.S. economy at the expense of the rest of the world. Of course, Beijing may decide to do more stimulus to offset its weakening economy and the impact of the trade tariffs. A headline rate cut, cuts to bank reserve requirements, and a boost to local government infrastructure spending are all in play. In the context of faltering housing and capex figures in the U.S., the narrative over the next quarter or two could be that the policy divergence is over, that Chinese policymakers have “blinked.” We are pushing back against this narrative on a structural basis. We have already broadly outlined our view that China will not be pressing hard to boost demand growth. Many of its recent policy efforts have focused on rebalancing the economy away from debt-driven investment (Chart 45). The problem for the rest of the world is that raw materials and capital goods comprise 85% of Chinese imports. As such, efforts to boost domestic consumption will have limited impact on the rest of the world, especially as emerging markets are highly leveraged to “old China.” Chart 45Rebalancing Of The Chinese Economy
Rebalancing Of The Chinese Economy
Rebalancing Of The Chinese Economy
Meanwhile, the Trump-Democrat gridlock could yield surprising results in 2019. President Trump is becoming singularly focused on winning re-election in 2020. As such, he fears the “stimulus cliff” looming over the election year. Democrats, eager to show that they are not merely the party of “the Resistance,” have already signaled that an infrastructure deal is their top priority. With fiscal conservatives in the House all but neutered by the midterm elections, a coalition between Trump and likely House Speaker Nancy Pelosi could emerge by late 2019, ushering in even more fiscal stimulus. While the net new federal spending will not be as grandiose as the headline figures, it will be something. There will also be regular spending increases in the wake of this year’s bipartisan removal of spending caps. We place solid odds that the current policy divergence narrative continues well into 2019, with bullish consequences for the U.S. dollar and bearish outcomes for EM assets, at least in the first half of the year. Mr. X: Your geopolitical team has consistently been alarmist on the U.S.-China trade war, a view that bore out throughout 2018. You already stated that you think trade tensions will persist in 2019. Where is this heading? BCA: Nowhere good. Rising geopolitical tensions in the Sino-American relationship has been our premier geopolitical risk since 2012. The Trump administration has begun tying geopolitical and strategic matters in with the trade talks. No longer is the White House merely asking for a narrowing of the trade deficit, improved intellectual property protections, and the removal of non-tariff barriers to trade. Now, everything from surface-to-air missiles in the South China Sea to Beijing’s “Belt and Road” project are on the list of U.S. demands. Trade negotiations are a “two-level game,” whereby policymakers negotiate in parallel with their foreign counterparts and domestic constituents. While Chinese economic agents may accept U.S. economic demands, it is not clear to us that its military and intelligence apparatus will accept U.S. geopolitical demands. And Xi Jinping himself is highly attuned to China’s geopolitical position, calling for national rejuvenation above all. We would therefore downplay any optimistic news from the G20 summit between Presidents Trump and Xi. President Trump could freeze tariffs at current rates and allow for a more serious negotiating round throughout 2019. But unless China is willing to kowtow to America, a fundamental deal will remain elusive in the end. For Trump, a failure to agree is still a win domestically, as the median American voter is not asking for a resolution of the trade war with China (Chart 46). Chart 46Americans Favor Being Tough On China
OUTLOOK 2019: Late-Cycle Turbulence
OUTLOOK 2019: Late-Cycle Turbulence
Ms. X: Could trade tensions spill into rising military friction? BCA: Absolutely. Minor military skirmishes will likely continue and could even escalate. We believe that there is a structural bull market in “war.” Investors should position themselves by being long global defense stocks. Mr. X: That is not encouraging. What about North Korea and Iran? Could they become geopolitical risks in 2019? BCA: Our answer to the North Korea question remains the same as 12 months ago: we have seen the peak in the U.S.’ display of a “credible military threat.” But Iran could re-emerge as a risk mid-year. We argued in last year’s discussion that President Trump was more interested in playing domestic politics than actually ratcheting up tensions with Iran. However, in early 2018 we raised our alarm level, particularly when staffing decisions in the White House involved several noted Iran hawks joining the foreign policy team. This was a mistake. Our initial call was correct, as President Trump ultimately offered six-month exemptions to eight importers of Iranian crude. That said, those exemptions will expire in the spring. The White House may, at that point, ratchet up tensions with Iran. This time, we will believe it when we see it. Intensifying tensions with Iran ahead of the U.S. summer vacation season, and at a time when crude oil markets are likely to be finely balanced, seems like folly, especially with primary elections a mere 6-to-8 months away. What does President Trump want more: to win re-election or to punish Iran? We think the answer is obvious, especially given that very few voters seem to view Iran as the country’s greatest threat (Chart 47). Chart 47Americans Don’t See Iran As A Major Threat
OUTLOOK 2019: Late-Cycle Turbulence
OUTLOOK 2019: Late-Cycle Turbulence
Ms. X: Let’s turn to Europe. You have tended to dismiss Euroskeptics as a minor threat, which has largely been correct. But don’t you think that, with Brexit upon us and Chancellor Angela Merkel in the twilight, populism in continental Europe will finally have its day? BCA: Let’s first wait to see how Brexit turns out! The next few months will be critical. Uncertainty is high, with considerable risks remaining. We do not think that Prime Minister May has the votes in the House of Commons to push through any version of soft Brexit that she has envisioned thus far. If the vote on the U.K.-EU exit deal falls through, a new election could be possible. This will require an extension of the exit process under Article 50 and a prolonged period of uncertainty. The probability of a no-deal Brexit is lower than 10%. It is simply not in the interest of anyone involved, save for a smattering of the hardest of hard Brexit adherents in the U.K. Conservative Party. Put simply, if the EU-U.K. deal falls through in the House of Commons, or even if PM May is replaced by a hard-Brexit Tory, the most likely outcome is an extension of the negotiation process. This can be easily done and we suspect that all EU member states would be in favor of such an extension given the cost to business sentiment and trade that would result from a no-deal Brexit. It is not clear that Brexit has emboldened Euroskeptics. In fact, most populist parties in the EU have chosen to tone down their Euroskepticism and emphasize their anti-immigrant agenda since the Brexit referendum. In part, this decision has to do with how messy the Brexit process has become. If the U.K. is struggling to unravel the sinews that tie it to Europe, how is any other country going to fare any better? The problem for Euroskeptic populists is that establishment parties are wise to the preferences of the European median voter. For example, we now have Friedrich Merz, a German candidate for the head of the Christian Democratic Union – essentially Merkel’s successor – who is both an ardent Europhile and a hardliner on immigration. This is not revolutionary. Merz simply read the polls correctly and realized that, with 83% of Germans supporting the euro, the rise of the anti-establishment Alternative for Germany (AfD) is more about immigration than about the EU. As such, we continue to stress that populism in Europe is overstated. In fact, we expect that Germany and France will redouble their efforts to reform European institutions in 2019. The European parliamentary elections in May will elicit much handwringing by the media due to a likely solid showing by Euroskeptics, even though the election is meaningless. Afterwards, we expect to see significant efforts to complete the banking union, reform the European Stability Mechanism, and even introduce a nascent Euro Area budget. But these reforms will not be for everyone. Euroskeptics in Central and Eastern Europe will be left on the outside looking in. Brussels may also be emboldened to take a hard line on Italy if institutional reforms convince the markets that the core Euro Area is sheltered from contagion. In other words, the fruits of integration will be reserved for those who play by the Franco-German rules. And that could, ironically, set the stage for the unraveling of the European Union as we know it. Over the long haul, a much tighter, more integrated, core could emerge centered on the Euro Area, with the rest of the EU becoming stillborn. The year 2019 will be a vital one for Europe. We are sensing an urgency in Berlin and Paris that has not existed throughout the crisis, largely due to Merkel’s own failings as a leader. We remain optimistic that the Euro Area will survive. However, there will be fireworks. Finally, a word about Japan. The coming year will see the peak of Prime Minister Shinzo Abe’s career. He is promoting the first-ever revision to Japan’s post-war constitution in order to countenance the armed forces. If he succeeds, he will have a big national security success to couple with his largely effective “Abenomics” economic agenda – after that, it will all be downhill. If he fails, he will become a lame duck. This means that political uncertainty will rise in 2019, after six years of unusual tranquility. Conclusions Mr. X: This is a good place to conclude our discussion. We have covered a lot of ground and your views have reinforced my belief that 2019 could be even more turbulent for financial markets than the past has been. I accept your opinion that a major global economic downturn is not around the corner, but with valuations still stretched, I feel that it makes good sense to focus on capital preservation. I may lose out on the proverbial “blow-off” rally, but so be it – I have been in this business long enough to know that it is much better to leave the party while the music is still playing! Ms. X: I agree with my father that the risks surrounding the outlook have risen as we have entered the late stages of this business-cycle expansion. Yet, if global growth does temporarily stabilize and corporate earnings continue to expand, I fear that being out of the market will be very painful. The era of hyper-easy money may be ending, but interest rates globally are still nowhere near restrictive territory. This tells me that the final stages of this bull market could be very rewarding. A turbulent market is not only one where prices go down – they can also go up a lot! BCA: The debate you are having is one we ourselves have had on numerous occasions. There is always a trade-off between maximizing short-term returns and taking a longer-term approach. Valuations are the ultimate guidepost for long-term returns. While most assets have cheapened over the past year, prices are still fairly elevated. Table 4 shows our baseline calculations of what a balanced portfolio will earn over the coming decade. We estimate that such a portfolio will deliver average annual returns of 4.9% over the next ten years, or 2.8% after adjusting for inflation. That is an improvement over our inflation-adjusted estimate of 1.3% from last year, but still well below the 6.6% real return that a balanced portfolio earned between 1982 and 2018. Table 410-Year Asset Return Projections
OUTLOOK 2019: Late-Cycle Turbulence
OUTLOOK 2019: Late-Cycle Turbulence
Our return calculations for equities assume that profit margins decline modestly over the period and that multiples mean revert to their historical average. These assumptions may turn out to be too pessimistic if underlying changes in the economy keep corporate profits elevated as a share of GDP. Structurally lower real interest rates may also justify higher P/E multiples, although this would be largely offset by the prospect of slower economic growth, which will translate into slower earnings growth. In terms of the outlook for the coming year, a lot hinges on our view that monetary policy in the main economies stays accommodative. This seems like a safe assumption in the Euro Area and Japan, where rates are near historic lows, as well as in China, where the government is actively loosening monetary conditions. It is not such a straightforward conclusion for the U.S., where the Fed is on track to keep raising rates. If it turns out that the neutral interest rate is not far above where rates are already, we could see a broad-based slowdown of the U.S. economy that ripples through to the rest of the world. And even if U.S. monetary policy does remain accommodative, many things could still upset the apple cart, including a full-out trade war, debt crises in Italy or China, or a debilitating spike in oil prices. As the title of our outlook implies, 2019 is likely to be a year of increased turbulence. Ms. X: As always, you have left us with much to think about. My father has looked forward to these discussions every year and now that I am able to join him, I understand why. Before we conclude, it would be helpful to have a recap of your key views. BCA: That would be our pleasure. The key points are as follows: The collision between policy and markets that we discussed last year finally came to a head in October. Rather than falling as they normally do when stocks plunge, U.S. bond yields rose as investors reassessed the willingness of the Fed to pause hiking rates even in the face of softer growth. Likewise, hopes that China would move swiftly to stimulate its economy were dashed as it became increasingly clear that the authorities were placing a high emphasis on their reform agenda of deleveraging and capacity reduction. The ongoing Brexit saga and the stalemate between the populist Italian government and the EU have increased uncertainty in Europe at a time when the region was already beginning to slow. We expect the tensions between policy and markets to be an ongoing theme in 2019. With the U.S. unemployment rate at a 48-year low, it will take a significant slowdown for the Fed to stop hiking rates. Despite the deterioration in economic data over the past month, real final domestic demand is still tracking to expand by 3% in the fourth quarter, well above estimates of the sustainable pace of economic growth. Ultimately, the Fed will deliver more hikes next year than discounted in the markets. This will push up the dollar and keep the upward trend in Treasury yields intact. The dollar should peak midway next year. China will also become more aggressive in stimulating its economy, which will boost global growth. However, until both of these things happen, emerging markets will remain under pressure. For the time being, we continue to favor developed market equities over their EM peers. We also prefer defensive equity sectors such as health care and consumer staples over cyclical sectors such as industrials and materials. Within the developed market universe, the U.S. will outperform Europe and Japan for the next few quarters, especially in dollar terms. A stabilization in global growth could ignite a blow-off rally in global equities. If the Fed is raising rates in response to falling unemployment, this is unlikely to derail the stock market. However, once supply-side constraints begin to fully bite in early 2020 and inflation rises well above the Fed’s target of 2%, stocks will begin to buckle. This means that a window exists next year where stocks will outperform bonds. We would maintain a benchmark allocation to stocks for now, but increase exposure if global bourses were to fall significantly from current levels without a corresponding deteriorating in the economic outlook. Corporate credit will underperform stocks as government bond yields rise. A major increase in spreads is unlikely as long as the economy is still expanding, but spreads could still widen modestly given their low starting point. U.S. shale companies have been the marginal producers in the global oil sector. With breakeven costs in shale close to $50/bbl, crude prices are unlikely to rise much from current levels over the long term. However, over the next 12 months, we expect production cuts in Saudi Arabia will push prices up, with Brent crude averaging around $82/bbl in 2019. A balanced portfolio is likely to generate average returns of only 2.8% a year in real terms over the next decade. This compares to average returns of around 6.6% a year between 1982 and 2018. We would like to take this opportunity to wish you and all of our clients a very peaceful, healthy and prosperous New Year. The Editors November 26, 2018
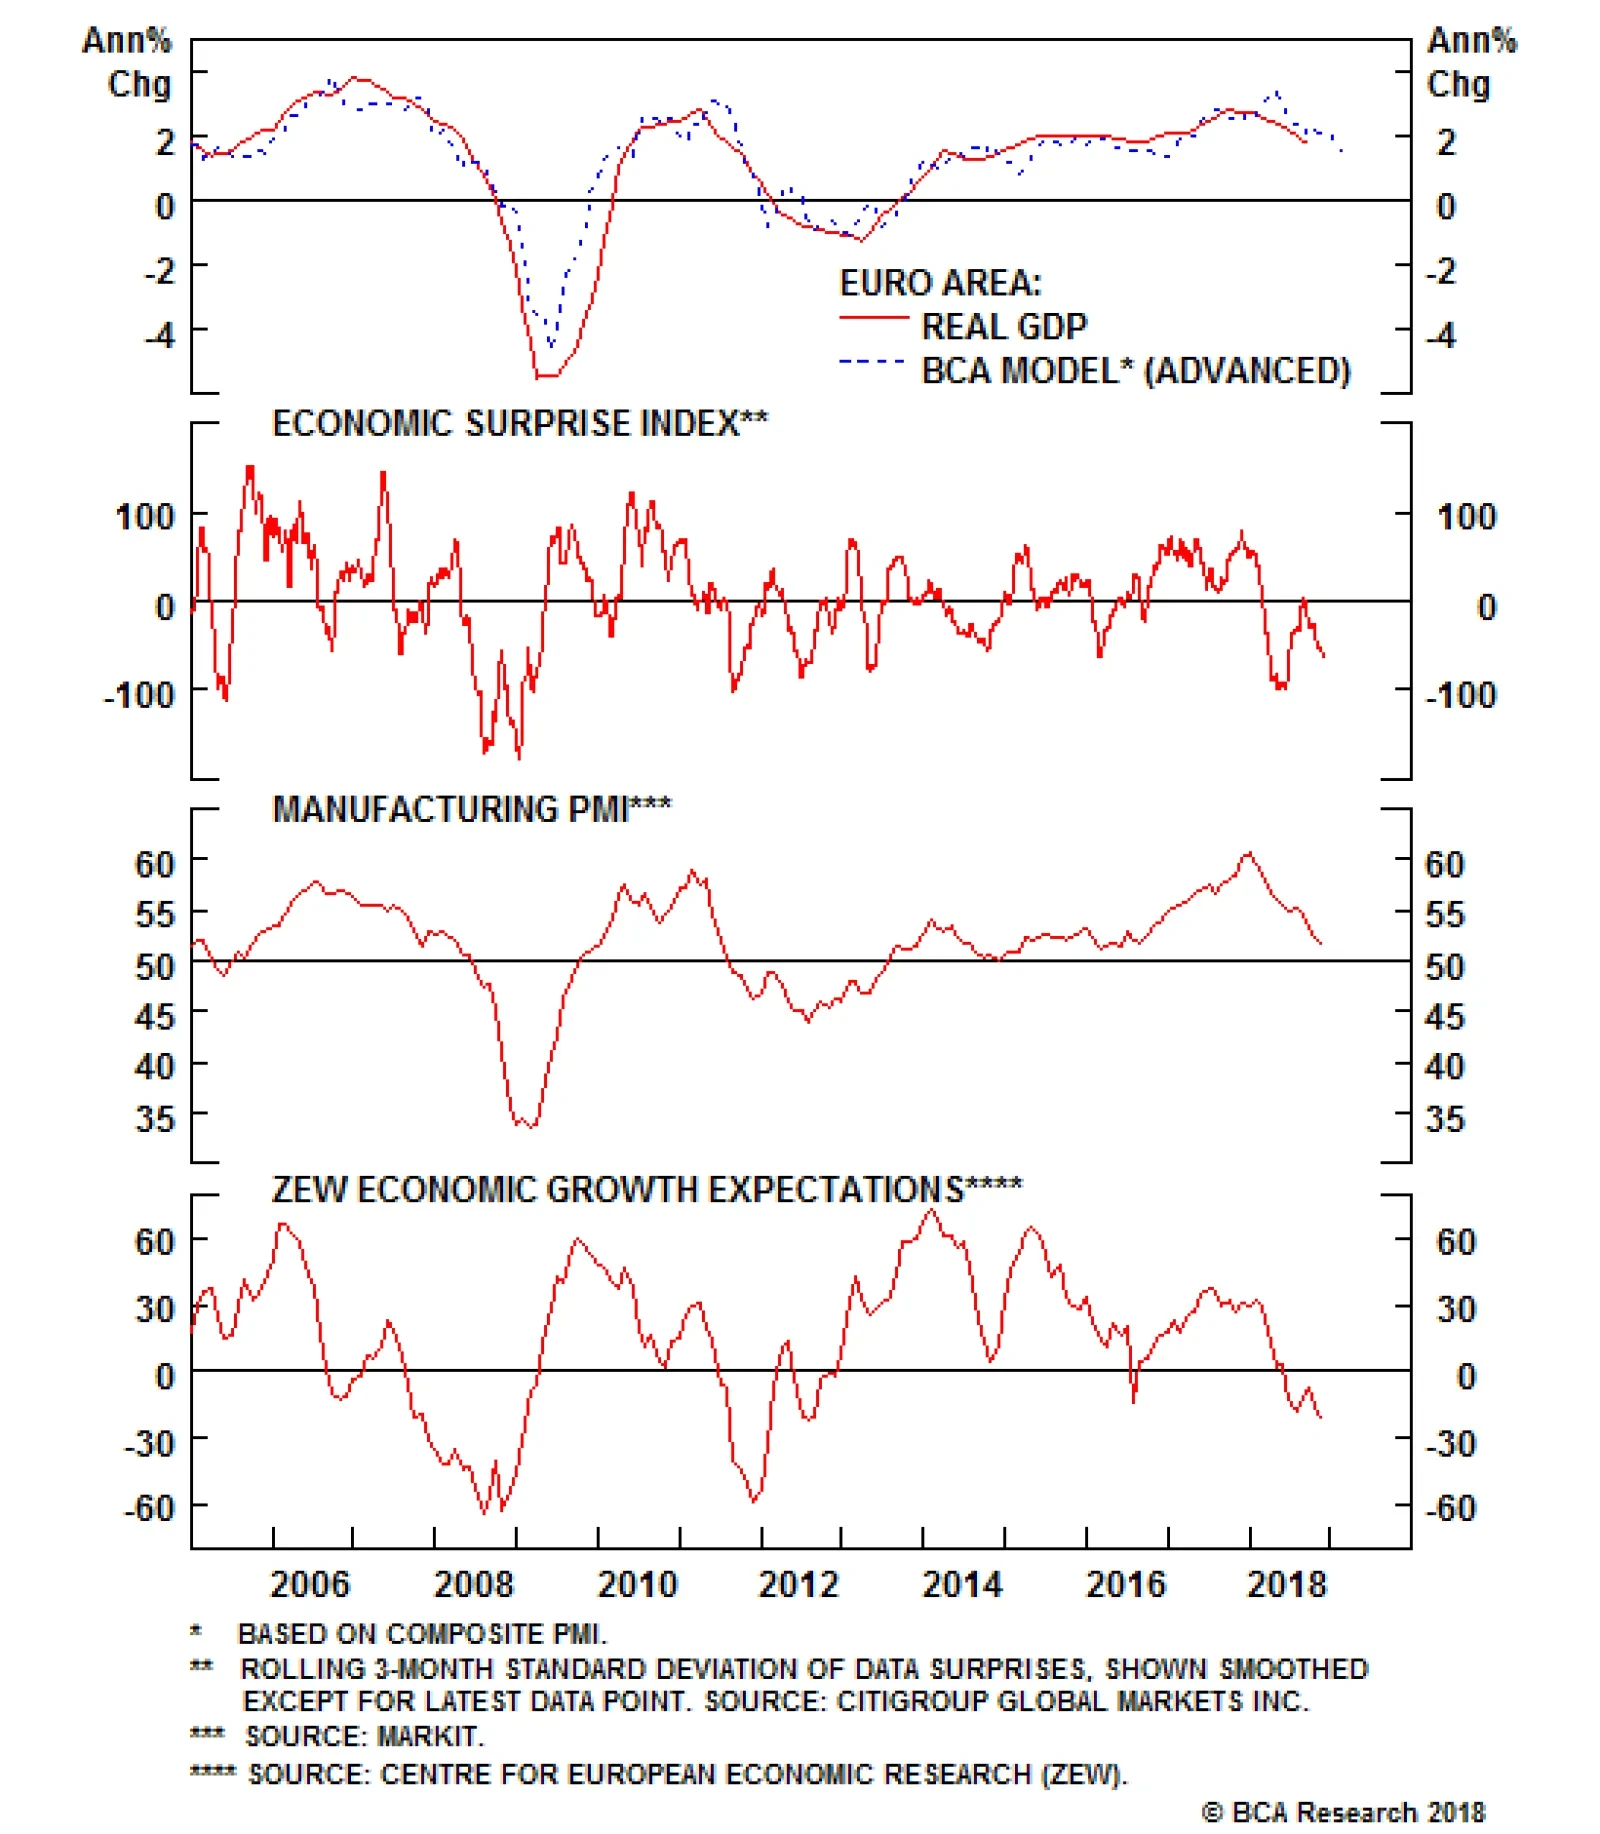
Europe’s all-important PMI data continued its slide in November. The euro area manufacturing PMI registered at 51.5 for November, versus expectations of 52; while the composite PMI data came in at 52.4, also below expectations of 53. This marks the 11th…
Mr. X and his daughter, Ms. X, are long-time BCA clients who visit our office toward the end of each year to discuss the economic and financial market outlook. This report is an edited transcript of our recent conversation. Mr. X: I have been eagerly looking forward to this meeting given the recent turbulence in financial markets. Our investments have done poorly in the past year and, with hindsight, I wish I had followed my instincts to significantly cut our equity exposure at the end of 2017, although we did follow your advice to move to a neutral stance in mid-2018. I remain greatly troubled by economic and political developments in many countries. I have long believed in open and free markets and healthy political discourse, and this all seems under challenge. As always, there is much to talk about. Ms. X: Let me add that I also am pleased to have this opportunity to talk through the key issues that will influence our investment strategy over the coming year. As I am sure you remember, I was more optimistic than my father about the outlook when we met a year ago but things have not worked out as well as I had hoped. In retrospect, I should have paid more attention to your view that markets and policy were on a collision course as that turned out to be a very accurate prediction. When I joined the family firm in early 2017, I persuaded my father that we should have a relatively high equity exposure and that was the correct stance. However, this success led us to maintain too much equity exposure in 2018, and my father has done well to resist the temptation to say “I told you so.” So, we are left with a debate similar to last year: Should we move now to an underweight in risk assets or hold off on the hope that prices will reach new highs in the coming year? I am still not convinced that we have seen the peak in risk asset prices as there is no recession on the horizon and equity valuations are much improved, following recent price declines. I will be very interested to hear your views. BCA: Our central theme for 2018 that markets and policy would collide did turn out to be appropriate and, importantly, the story has yet to fully play out. The monetary policy tightening cycle is still at a relatively early stage in the U.S. and has not even begun in many other regions. Yet, although it was a tough year for most equity markets, the conditions for a major bear market are not yet in place. One important change to our view, compared to a year ago, is that we have pushed back the timing of the next U.S. recession. This leaves a window for risk assets to show renewed strength. It remains to be seen whether prices will reach new peaks, but we believe it would be premature to shift to an underweight stance on equities. For the moment, we are sticking with our neutral weighting for risk assets, but may well recommend boosting exposure if prices suffer further near-term weakness. We will need more clarity about the timing of a recession before we consider aggressively cutting exposure. Mr. X: I can see we will have a lively discussion because I do not share your optimism. My list of concerns is long and I hope we have time to get through them all. But first, let’s briefly review your predictions from last year. BCA: That is always interesting to do, although sometimes rather humbling. A year ago, our key conclusions were that: The environment of easy money, low inflation and healthy profit growth that has been so bullish for risk assets will start to change during the coming year. Financial conditions, especially in the U.S., will gradually tighten as decent growth leads to building inflationary pressures, encouraging central banks to withdraw stimulus. With U.S. equities at an overvalued extreme and investor sentiment overly optimistic, this will set the scene for an eventual collision between policy and the markets. The conditions underpinning the bull market will erode only slowly which means that risk asset prices should continue to rise for at least the next six months. However, long-run investors should start shifting to a neutral exposure. Given our economic and policy views, there is a good chance that we will move to an underweight position in risk assets during the second half of 2018. The U.S. economy is already operating above potential and thus does not need any boost from easier fiscal policy. Any major tax cuts risk overheating the economy, encouraging the Federal Reserve to hike interest rates and boosting the probability of a recession in 2019. This is at odds with the popular view that tax cuts will be good for the equity market. A U.S. move to scrap NAFTA would add to downside risks. For the second year in a row, the IMF forecasts of economic growth for the coming year are likely to prove too pessimistic. The end of fiscal austerity has allowed the Euro Area economy to gather steam and this should be sustained in 2018. However, the slow progress in negotiating a Brexit deal with the EU poses a threat to the U.K. economy. China’s economy is saddled with excessive debt and excess capacity in a number of areas. Any other economy would have collapsed by now, but the government has enough control over banking and other sectors to prevent a crisis. Growth should hold above 6% in the next year or two, although much will depend on how aggressively President Xi pursues painful reforms. The market is too optimistic in assuming that the Fed will not raise interest rates by as much as indicated in their “dots” projections. There is a good chance that the U.S. yield curve will become flat or inverted by late 2018. Bonds are not an attractive investment at current yields. Only Greece and Portugal have real 10-year government bond yields above their historical average. Corporate bonds should outperform governments, but a tightening in financial conditions will put these at risk in the second half of 2018. The Euro Area and Japanese equity markets should outperform the U.S. over the next year reflecting their better valuations and more favorable financial conditions. Developed markets should outperform the emerging market index. Historically, the U.S. equity market has led recessions by between 3 and 12 months. If, as we fear, a U.S. recession starts in the second half of 2019, then the stock market would be at risk from the middle of 2018. The improving trend in capital spending should favor industrial stocks. Our other two overweight sectors are energy and financials. The oil price will be well supported by strong demand and output restraint by OPEC and Russia. The Brent price should average $65 a barrel over the coming year, with risks to the upside. We expect base metals prices to trade broadly sideways but will remain highly dependent on developments in China. Modest positions in gold are warranted. Relative economic and policy trends will favor a firm dollar in 2018. Unlike at the start of 2017, investors are significantly short the dollar which is bullish from a contrary perspective. Sterling is quite cheap but Brexit poses downside risks. The key market-relevant geopolitical events to monitor will be fiscal policy and mid-term elections in the U.S., and reform policies in China. With the former, the Democrats have a good chance of winning back control of the House of Representatives, creating a scenario of complete policy gridlock. A balanced portfolio is likely to generate average returns of only 3.3% a year in nominal terms over the next decade. This compares to average returns of around 10% a year between 1982 and 2017. As already noted, the broad theme that policy tightening – especially in the U.S. – would become a problem for asset markets during the year was supported by events. However, the exact timing was hard to predict. The indexes for non-U.S. developed equity markets and emerging markets peaked in late-January 2018, and have since dropped by around 18% and 24%, respectively (Chart 1). On the other hand, the U.S. market, after an early 2018 sell-off, hit a new peak in September, before falling anew in the past couple of months. The MSCI All-Country World index currently is about 6% below end-2017 levels in local-currency terms. Chart 1Our 'Collision Course' Theme For 2018 Played Out
Our 'Collision Course' Theme For 2018 Played Out
Our 'Collision Course' Theme For 2018 Played Out
We started the year recommending an overweight in developed equity markets but, as you noted, shifted that to a neutral position mid-year. A year ago, we thought we might move to an underweight stance in the second half of 2018 but decided against this because U.S. fiscal stimulus boosted corporate earnings and extended the economic cycle. Our call that emerging markets would underperform was on target. Although it was U.S. financial conditions that tightened the most, Wall Street was supported by the large cut in the corporate tax rate while the combination of higher bond yields and dollar strength was a major problem for many indebted emerging markets. Overall, it was not a good year for financial markets (Table 1). Table 1Market Performance
OUTLOOK 2019: Late-Cycle Turbulence
OUTLOOK 2019: Late-Cycle Turbulence
As far as the overall macro environment was concerned, we were correct in predicting that the IMF was too pessimistic on economic growth. A year ago, the IMF forecast that the advanced economies would expand by 2% in 2018 and that has since been revised up to 2.4% (Table 2). This offset a slight downgrading to the performance of emerging economies. The U.S., Europe and Japan all grew faster than previously expected. Not surprisingly, inflation also was higher than forecast, although in the G7, it has remained close to the 2% level targeted by most central banks. Table 2IMF Economic Forecasts
OUTLOOK 2019: Late-Cycle Turbulence
OUTLOOK 2019: Late-Cycle Turbulence
Despite widespread fears to the contrary, the data have supported our view that Chinese growth would hold above a 6% pace in 2018. Nevertheless, a slowdown currently is underway and downside risks remain very much in place in terms of excessive credit and trade pressures. Another difficult year lies ahead for the Chinese authorities and we will no doubt return to this topic later. As far as our other key forecasts are concerned, we were correct in our views that oil prices and the U.S. dollar would rise and that the market would be forced to revise up its predictions of Fed rate hikes. Of course, oil has recently given back its earlier gains, but we assume that is a temporary setback. On the sector front, our macro views led us to favor industrials, financials and energy, but that did not work out well as concerns about trade took a toll on cyclical sectors. Overall, there were no major macro surprises in 2018, and it seems clear that we have yet to resolve the key questions and issues that we discussed a year ago. At that time, we were concerned about the development of late-cycle pressures that ultimately would undermine asset prices. That story has yet to fully play out. It is hard to put precise timing on when the U.S. economy will peak and, thus, when asset prices will be at maximum risk. Nevertheless, our base case is that there likely will be a renewed and probably final run-up in asset prices before the next recession. Late-Cycle Challenges Mr. X: This seems like déjà-vu all over again. Since we last met, the cycle is one year older and, as you just said, the underlying challenges facing economies and markets have not really changed. If anything, things are even worse: Global debt levels are higher, inflation pressures more evident, Fed policy is moving closer to restrictive territory and protectionist policies have ratcheted up. If it was right to be cautious six months ago, then surely we should be even more cautious now. Ms. X: Oh dear, it does seem like a repeat of last year’s discussion because, once again, I am more optimistic than my father. Obviously, there are structural problems in a number of countries and, at some point, the global economy will suffer another recession. But timing is everything, and I attach very low odds to a downturn in the coming year. Meanwhile, I see many pockets of value in the equity market. Rather than cut equity positions, I am inclined to look for buying opportunities. BCA: We sympathize with your different perspectives because the outlook is complex and we also have lively debates about the view. The global equity index currently is a little below where it was when we met last year, but there has been tremendous intra-period volatility. That pattern seems likely to be repeated in 2019. In other words, it will be important to be flexible about your investment strategy. You both make good points. It is true that there are several worrying problems regarding the economic outlook, including excessive debt, protectionism and building inflation risks. At the same time, the classic conditions for an equity bear market are not yet in place, and may not be for some time. This leaves us in the rather uncomfortable position of sitting on the fence with regard to risk asset exposure. We are very open to raising exposure should markets weaken further in the months ahead, but also are keeping careful watch for signs that the economic cycle is close to peaking. In other words, it would be a mistake to lock in a 12-month strategy right now. Mr. X: I would like to challenge the consensus view, shared by my daughter, that the next recession will not occur before 2020, and might even be much later. The main rationale seems to be that the policy environment remains accommodative and there are none of the usual imbalances that occur ahead of recessions. Of course, U.S. fiscal policy has given a big boost to growth in the past year, but I assume the effects will wear off sharply in 2019. More importantly, there is huge uncertainty about the level of interest rates that will trigger economic problems. It certainly has not taken much in the way of Fed rate hikes to rattle financial markets. Thus, monetary policy may become restrictive much sooner than generally believed. I also strongly dispute the idea that there are no major financial imbalances. If running U.S. federal deficits of $1 trillion in the midst of an economic boom is not an imbalance, then I don’t know what is! At the same time, the U.S. corporate sector has issued large amounts of low-quality debt, and high-risk products such as junk-bond collateralized debt obligations have made an unwelcome reappearance. It seems that the memories of 2007-09 have faded. It is totally normal for long periods of extremely easy money to be accompanied by growing leverage and increasingly speculative financial activities, and I don’t see why this period should be any different. And often, the objects of speculation are not discovered until financial conditions become restrictive. Finally, there are huge risks associated with rising protectionism, the Chinese economy appears to be struggling, Italy’s banks are a mess, and the Brexit fiasco poses a threat to the U.K. economy. Starting with the U.S., please go ahead and convince me why a recession is more than a year away. BCA: It is natural for you to worry that a recession is right around the corner. The current U.S. economic expansion will become the longest on record if it makes it to July 2019, at which point it will surpass the 1990s expansion. Economists have a long and sad history of failing to forecast recessions. Therefore, a great deal of humility is warranted when it comes to predicting the evolution of the business cycle. The Great Recession was one of the deepest downturns on record and the recovery has been fairly sluggish by historic standards. Thus, it has taken much longer than usual for the U.S. economy to return to full employment. Looking out, there are many possible risks that could trip up the U.S. economy but, for the moment, we see no signs of recession on the horizon (Chart 2). For example, the leading economic indicator is still in an uptrend, the yield curve has not inverted and our monetary indicators are not contracting. Our proprietary recession indicator also suggests that the risk is currently low, although recent stock market weakness implies some deterioration. Chart 2Few U.S Recession 'Red Flags'
Few U.S Recession 'Red Flags'
Few U.S Recession 'Red Flags'
The buildup in corporate debt is a cause for concern and we are not buyers of corporate bonds at current yields. However, the impact of rising yields on the economy is likely to be manageable. The interest coverage ratio for the economy as a whole – defined as the profits corporations generate for every dollar of interest paid – is still above its historic average (Chart 3). Corporate bonds are also generally held by non-leveraged investors such as pension funds, insurance companies, and ETFs. The impact of defaults on the economy tends to be more severe when leveraged institutions are the ones that suffer the greatest losses. Chart 3Interest Costs Not Yet A Headwind
Interest Costs Not Yet A Headwind
Interest Costs Not Yet A Headwind
We share your worries about the long-term fiscal outlook. However, large budget deficits do not currently imperil the economy. The U.S. private sector is running a financial surplus, meaning that it earns more than it spends (Chart 4). Not only does this make the economy more resilient, it also provides the government with additional savings with which to finance its budget deficit. If anything, the highly accommodative stance of fiscal policy has pushed up the neutral rate of interest, giving the Fed greater scope to raise rates before monetary policy enters restrictive territory. The impetus of fiscal policy on the economy will be smaller in 2019 than it was in 2018, but it will still be positive (Chart 5). Chart 4The U.S. Private Sector Is Helping To Finance The Fiscal Deficit
The U.S. Private Sector Is Helping To Finance The Fiscal Deficit
The U.S. Private Sector Is Helping To Finance The Fiscal Deficit
Chart 5U.S. Fiscal Policy Still Stimulative In 2019
U.S. Fiscal Policy Still Stimulative In 2019
U.S. Fiscal Policy Still Stimulative In 2019
The risks to growth are more daunting outside the U.S. As you point out, Italy is struggling to contain borrowing costs, a dark cloud hangs over the Brexit negotiations, and China and most other emerging markets have seen growth slow meaningfully. The U.S., however, is a relatively closed economy – it is not as dependent on trade as most other countries. Its financial system is reasonably resilient thanks to the capital its banks have raised over the past decade. In addition, Dodd-Frank and other legislation have made it more difficult for financial institutions to engage in reckless risk-taking. Mr. X: I would never take a benign view of the ability and willingness of financial institutions to engage in reckless behavior, but maybe I am too cynical. Even if you are right that debt does not pose an immediate threat to the market, surely it will become a huge problem in the next downturn. If the U.S. federal deficit is $1 trillion when the economy is strong, it is bound to reach unimaginable levels in a recession. And, to make matters worse, the Federal Reserve may not have much scope to lower interest rates if they peak at a historically low level in the next year or so. What options will policymakers have to respond to the next cyclical downturn? Is there a limit to how much quantitative easing central banks can do? BCA: The Fed is aware of the challenges it faces if the next recession begins when interest rates are still quite low. Raising rates rapidly in order to have more “ammunition” for counteracting the downturn would hardly be the best course of action as this would only bring forward the onset of the recession. A better strategy is to let the economy overheat a bit so that inflation rises. This would allow the Fed to push real rates further into negative territory if the recession turns out to be severe. There is no real limit on how much quantitative easing the Fed can undertake. The FOMC will undoubtedly turn to asset purchases and forward guidance again during the next economic downturn. Now that the Fed has crossed the Rubicon into unorthodox monetary policy without generating high inflation, policymakers are likely to try even more exotic policies, such as price-level targeting. The private sector tends to try to save more during recessions. Thus, even though the fiscal deficit would widen during the next downturn, there should be plenty of buyers for government debt. However, once the next recovery begins, the Fed may feel increasing political pressure to keep rates low in order to allow the government to maintain its desired level of spending and taxes. The Fed guards its independence fiercely, but in a world of increasingly political populism, that independence may begin to erode. This will not happen quickly, but to the extent that it does occur, higher inflation is likely to be the outcome. Ms. X: I would like to explore the U.S.-China dynamic a bit more because I see that as one of the main challenges to my more optimistic view. I worry that President Trump will continue to take a hard line on China trade because it plays well with his base and has broad support in Congress. And I equally worry that President Xi will not want to be seen giving in to U.S. bullying. How do you see this playing out? BCA: Investors hoping that U.S. President Donald Trump and his Chinese counterpart Xi Jinping will reach a deal to end the trade war on the sidelines of the forthcoming G20 leaders' summit in Buenos Aires are likely to be disappointed. President Trump's fiscal policy is completely inconsistent with his trade agenda. Fiscal stimulus in a full-employment economy will suck in imports. It also forces the Fed to raise rates more aggressively than it otherwise would, leading to a stronger dollar. The result will be a larger U.S. trade deficit. Trump will not be able to blame Canada or Mexico for a deteriorating trade position because he just signed a trade agreement with them. The new USMCA agreement is remarkably similar to NAFTA, with the notable exception that it contains a clause barring Canada and Mexico from negotiating bilateral trade deals with China. This means Trump needs a patsy who will take the blame for America's burgeoning trade deficit and China will fill that role. For his part, President Xi knows full well that he will still be China’s leader when Trump is long gone. Giving in to Trump’s demands would hurt him politically. All this means that the trade war will persist. Mr. X: I see a trade war as a major threat to the economy, but it is not the only thing that could derail the economic expansion. Let’s explore that issue in more detail. The Economic Outlook Mr. X: You have shown in previous research that housing is often a very good leading indicator of the U.S. economy, largely because it is very sensitive to changes in the monetary environment. Are you not concerned about the marked deterioration in recent U.S. housing data? BCA: Recent trends in housing have indeed been disappointing, with residential investment acting as a drag on growth for three consecutive quarters. The weakness has been broad-based with sales, the rate of price appreciation of home prices, and builder confidence all declining (Chart 6). Even though the level of housing affordability is decent by historical standards, there has been a fall in the percentage of those who believe that it is a good time to buy a home. Chart 6Recent Softness In U.S. Housing
Recent Softness In U.S. Housing
Recent Softness In U.S. Housing
There are a few possible explanations for the weakness. First, the 2007-09 housing implosion likely had a profound and lasting impact on the perceived attractiveness of home ownership. The homeownership rate for people under 45 has remained extremely low by historical standards. Secondly, increased oversight and tighter regulations have curbed mortgage supply. Finally, the interest rate sensitivity of the sector may have increased with the result that even modest increases in the mortgage rate have outsized effects. That, in turn, could be partly explained by recent tax changes that capped the deduction on state and local property taxes, while lowering the limit on the tax deductibility of mortgage interest. The trend in housing is definitely a concern, but the odds of a further major contraction seem low. Unlike in 2006, the home vacancy rate stands near record levels and the same is true for the inventory of homes. The pace of housebuilding is below the level implied by demographic trends and consumer fundamentals are reasonably healthy. The key to the U.S. economy lies with business investment and consumer spending and these areas are well supported for the moment. Consumers are benefiting from continued strong growth in employment and a long overdue pickup in wages. Meanwhile, the ratio of net worth-to-income has surpased the previous peak and the ratio of debt servicing-to-income is low (Chart 7). Last year, we expressed some concern that the depressed saving rate might dampen spending, but the rate has since been revised substantially higher. Based on its historical relationship with U.S. household net worth, there is room for the saving rate to fall, fueling more spending. Real consumer spending has grown by 3% over the past year and there is a good chance of maintaining that pace during most of 2019. Chart 7U.S. Consumer Fundamentals Are Healthy
U.S. Consumer Fundamentals Are Healthy
U.S. Consumer Fundamentals Are Healthy
Turning to capital spending, the cut in corporate taxes was obviously good for cash flow, and surveys show a high level of business confidence. Moreover, many years of business caution toward spending has pushed up the average age of the nonresidential capital stock to the highest level since 1963 (Chart 8). Higher wages should also incentivize firms to invest in more machinery. Absent some new shock to confidence, business investment should stay firm during the next year. Chart 8An Aging Capital Stock
An Aging Capital Stock
An Aging Capital Stock
Overall, we expect the pace of U.S. economic growth to slow from its recent strong level, but it should hold above trend, currently estimated to be around 2%. As discussed earlier, that means capacity pressures will intensify, causing inflation to move higher. Ms. X: I share the view that the U.S. economy will continue to grow at a healthy pace, but I am less sure about the rest of the world. BCA: You are right to be concerned. We expected U.S. and global growth to diverge in 2018, but not by as much as occurred. Several factors have weighed on CEO confidence outside of the U.S., including trade wars, a strong dollar, higher oil prices, emerging market turbulence, the return of Italian debt woes, and a slowdown in the Chinese economy. The stress has shown up in the global manufacturing PMI, although the latter is still at a reasonably high level (Chart 9). Global export growth is moderating and the weakness appears to be concentrated in capex. Capital goods imports for the major economies, business investment, and the production of investment-related goods have all decelerated this year. Chart 9Global Manufacturing Slowdown
Global Manufacturing Slowdown
Global Manufacturing Slowdown
Our favorite global leading indicators are also flashing yellow (Chart 10). BCA’s global leading economic indicator has broken below the boom/bust line and its diffusion index suggests further downside. The global ZEW composite and the BCA boom/bust indicator are both holding below zero. Chart 10Global Growth Leading Indicators
Global Growth Leading Indicators
Global Growth Leading Indicators
Current trends in the leading indicators shown in Chart 11 imply that the growth divergence between the U.S. and the rest of the world will remain a key theme well into 2019. Among the advanced economies, Europe and Japan are quite vulnerable to the global soft patch in trade and capital spending. Chart 11Global Economic Divergence Will Continue
Global Economic Divergence Will Continue
Global Economic Divergence Will Continue
The loss of momentum in the Euro Area economy, while expected, has been quite pronounced. Part of this is due to the dissipation of the 2016/17 economic boost related to improved health in parts of the European banking system that sparked a temporary surge in credit growth. The tightening in Italian financial conditions following the government’s budget standoff with the EU has weighed on overall Euro Area growth. Softer Chinese demand for European exports, uncertainties related to U.S. trade policy and the torturous Brexit negotiations, have not helped the situation. Real GDP growth decelerated to close to a trend pace by the third quarter of 2018. The manufacturing PMI has fallen from a peak of 60.6 in December 2017 to 51.5, mirroring a 1% decline in the OECD’s leading economic indicator for the region. Not all the economic news has been bleak. Both consumer and industrial confidence remain at elevated levels according to the European Commission (EC) surveys, consistent with a resumption of above-trend growth. Even though exports have weakened substantially from the booming pace in 2017, the EC survey on firms’ export order books remains at robust levels (Chart 12). Importantly for the Euro Area, the bank credit impulse has moved higher.The German economy should also benefit from a rebound in vehicle production which plunged earlier this year following the introduction of new emission standards. Chart 12Europe: Slowing, But No Disaster
Europe: Slowing, But No Disaster
Europe: Slowing, But No Disaster
We interpret the 2018 Euro Area slowdown as a reversion-to-the-mean rather than the start of an extended period of sub-trend growth. Real GDP growth should fluctuate slightly above trend pace through 2019. Given that the Euro Area’s output gap is almost closed, the ECB will not deviate from its plan to end its asset purchase program by year end. Gradual rate hikes should begin late in 2019, assuming that inflation is closer to target by then. In contrast, the Bank of Japan (BoJ) is unlikely to change policy anytime soon. The good news is that wages have finally begun to grow at about a 2% pace, although it required extreme labor shortages. Yet, core inflation is barely positive and long-term inflation expectations are a long way from the 2% target. The inflation situation will have to improve significantly before the BoJ can consider adjusting or removing the Yield Curve Control policy. This is especially the case since the economy has hit a bit of an air pocket and the government intends to raise the VAT in 2019. Japan’s industrial production has stalled and we expect the export picture to get worse before it gets better. We do not anticipate any significant economic slack to develop, but even a sustained growth slowdown could partially reverse the gains that have been made on the inflation front. Ms. X: We can’t talk about the global economy without discussing China. You have noted in the past how the authorities are walking a tightrope between trying to unwind the credit bubble and restructure the economy on the one hand, and prevent a destabilizing economic and financial crisis on the other. Thus far, they have not fallen off the tightrope, but there has been limited progress in resolving the country’s imbalances. And now the authorities appear to be stimulating growth again, risking an even bigger buildup of credit. Can it all hold together for another year? BCA: That’s a very good question. Thus far, there is not much evidence that stimulus efforts are working. Credit growth is still weak and leading economic indicators have not turned around (Chart 13). There is thus a case for more aggressive reflation, but the authorities also remain keen to wean the economy off its addiction to debt. Chart 13China: No Sign Of Reacceleration
China: Credit Impulse Remains Weak
China: Credit Impulse Remains Weak
Waves of stimulus have caused total debt to soar from 140% of GDP in 2008 to about 260% of GDP at present (Chart 14). As is usually the case, rapid increases in leverage have been associated with a misallocation of capital. Since most of the new credit has been used to finance fixed-asset investment, the result has been overcapacity in a number of areas. For example, the fact that 15%-to-20% of apartments are sitting vacant is a reflection of overbuilding. Meanwhile, the rate of return on assets in the state-owned corporate sector has fallen below borrowing costs. Chart 14China: Debt Still Rising
China: Debt Still Rising
China: Debt Still Rising
Chinese exports are holding up well so far, but this might only represent front-running ahead of the implementation of higher tariffs. Judging from the steep drop in the export component of both the official and private-sector Chinese manufacturing PMI, exports are likely to come under increasing pressure over the next few quarters as the headwinds from higher tariffs fully manifest themselves (Chart 15). Chart 15Chinese Exports About To Suffer
Chinese Exports About To Suffer
Chinese Exports About To Suffer
The most likely outcome is that the authorities will adjust the policy dials just enough to stabilize growth sometime in the first half of 2019. The bottoming in China’s broad money impulse offers a ray of hope (Chart 16). Still, it is a tentative signal at best and it will take some time before this recent easing in monetary policy shows up in our credit impulse measure and, later, economic growth. A modest firming in Chinese growth in the second half of 2019 would provide a somewhat stronger demand backdrop for commodities and emerging economies that sell goods to China. Chart 16A Ray Of Hope From Broad Money
bca.bca_mp_2018_12_01_c16
bca.bca_mp_2018_12_01_c16
Ms. X: If you are correct about a stabilization in the Chinese economy next year, this presumably would be good news for emerging economies, especially if the Fed goes on hold. EM assets have been terribly beaten down and I am looking for an opportunity to buy. BCA: Fed rate hikes might have been the catalyst for the past year’s pain in EM assets, but it is not the underlying problem. As we highlighted at last year’s meeting, the troubles for emerging markets run much deeper. Our long-held caution on emerging economies and markets is rooted in concern about deteriorating fundamentals. Excessive debt is a ticking time bomb for many of these countries; EM dollar-denominated debt is now as high as it was in the late 1990s as a share of both GDP and exports (Chart 17). Moreover, the declining long-term growth potential for emerging economies as a group makes it more difficult for them to service the debt. The structural downtrend in EM labor force and productivity growth underscores that trend GDP growth has collapsed over the past three decades (Chart 17, bottom panel). Chart 17EM Debt A Problem Given Slowing Supply-Side...
EM Debt A Problem Given Slowing Supply-Side...
EM Debt A Problem Given Slowing Supply-Side...
Decelerating global growth has exposed these poor fundamentals. EM sovereign spreads have moved wider in conjunction with falling PMIs and slowing industrial production and export growth. And it certainly does not help that the Fed is tightening dollar-based liquidity conditions. EM equities usually fall when U.S. financial conditions tighten (Chart 18). Chart 18...And Tightening Financial Conditions
...And Tightening Financial Conditions
...And Tightening Financial Conditions
Chart 19 highlights the most vulnerable economies in terms of foreign currency funding requirements, and foreign debt-servicing obligations relative to total exports. Turkey stands out as the most vulnerable, along with Argentina, Brazil, Indonesia, Chile, and Colombia. In contrast, Emerging Asia appears to be in better shape relative to the crisis period of the late 1990s. Chart 19Spot The Outliers
OUTLOOK 2019: Late-Cycle Turbulence
OUTLOOK 2019: Late-Cycle Turbulence
The backdrop for EM assets is likely to get worse in the near term, given our view that the Fed will continue to tighten and China will be cautious about stimulating more aggressively. Our base case outlook sees some relief in the second half of 2019, but it is more of a “muddle-through” scenario than a V-shaped economic recovery. Mr. X: Perhaps EM assets could enjoy a bounce next year if the Chinese economy stabilizes, but the poor macro fundamentals you mentioned suggest that it would be a trade rather than a buy-and-hold proposition. I am inclined to avoid the whole asset class in 2019. Bond Market Prospects Ms. X: Let’s turn to fixed income now. I was bearish on bonds in 2018, but yields have risen quite a bit, at least in the United States. The Fed has lifted the fed funds rate by 100 basis points over the past year and I don’t see a lot of upside for inflation. So perhaps yields have peaked and will move sideways in 2019, which would be good for stocks in my view. BCA: Higher yields have indeed improved bond value recently. Nonetheless, they are not cheap enough to buy at this point (Chart 20). The real 10-year Treasury yield, at close to 1%, is still depressed by pre-Lehman standards. Long-term real yields in Germany and Japan remain in negative territory at close to the lowest levels ever recorded. Chart 20Real Yields Still Very Depressed
Real Yields Still Very Depressed
Real Yields Still Very Depressed
We called the bottom in global nominal bond yields in 2016. Our research at the time showed that the cyclical and structural factors that had depressed yields were at an inflection point, and were shifting in a less bond-bullish direction. Perhaps most important among the structural factors, population aging and a downward trend in underlying productivity growth resulted in lower equilibrium bond yields over the past couple of decades. Looking ahead, productivity growth could stage a mild rebound in line with the upturn in the growth rate of the capital stock (Chart 21). As for demographics, the age structure of the world population is transitioning from a period in which aging added to the global pool of savings to one in which aging is beginning to drain that pool as people retire and begin to consume their nest eggs (Chart 22). The household saving rates in the major advanced economies should trend lower in the coming years, placing upward pressure on equilibrium global bond yields. Chart 21Productivity Still Has Some Upside
Productivity Still Has Some Upside
Productivity Still Has Some Upside
Chart 22Demographics Past The Inflection Point
Demographics Past The Inflection Point
Demographics Past The Inflection Point
Cyclical factors are also turning against bonds. U.S. inflation has returned to target and the Fed is normalizing short-term interest rates. The market currently is priced for only one more rate hike after December 2018 in this cycle, but we see rates rising more than that. Treasury yields will follow as market expectations adjust. Long-term inflation expectations are still too low in the U.S. and most of the other major economies to be consistent with central banks’ meeting their inflation targets over the medium term. As actual inflation edges higher, long-term expectations built into bond yields will move up. The term premium portion of long-term bond yields is also too low. This is the premium that investors demand to hold longer-term bonds. Our estimates suggest that the term premium is still negative in the advanced economies outside of the U.S., which is not sustainable over the medium term (Chart 23). Chart 23Term Premia Are Too Low
Term Premia Are Too Low
Term Premia Are Too Low
We expect term premia to rise for two main reasons. First, investors have viewed government bonds as a good hedge for their equity holdings because bond prices have tended to rise when stock prices fell. Investors have been willing to pay a premium to hold long-term bonds to benefit from this hedging effect. But the correlation is now beginning to change as inflation and inflation expectations gradually adjust higher and output gaps close. As the hedging benefit wanes, the term premium should rise back into positive territory. Second, central bank bond purchases and forward guidance have depressed yields as well as interest-rate volatility. The latter helped to depress term premia in the bond market. This effect, too, is beginning to unwind. The Fed is letting its balance sheet shrink by about $50 billion per month. The Bank of England has kept its holdings of gilts and corporate bonds constant for over a year, while the ECB is about to end asset purchases. The Bank of Japan continues to buy assets, but at a much reduced pace. All this means that the private sector is being forced to absorb a net increase in government bonds for the first time since 2014 (Chart 24). Chart 25 shows that bond yields in the major countries will continue to trend higher as the rapid expansion of central bank balance sheets becomes a thing of the past. Chart 24Private Sector To Absorb More Bonds
OUTLOOK 2019: Late-Cycle Turbulence
OUTLOOK 2019: Late-Cycle Turbulence
Chart 25QE Unwind Will Weigh On Bond Prices
QE Unwind Will Weigh On Bond Prices
QE Unwind Will Weigh On Bond Prices
Ms. X: I’m not a fan of bonds at these levels, but that sounds overly bearish to me, especially given the recent plunge in oil prices. BCA: Lower oil prices will indeed help to hold down core inflation to the extent that energy prices leak into non-energy prices in the near term. Nonetheless, in the U.S., this effect will be overwhelmed by an overheated economy. From a long-term perspective, we believe that investors still have an overly benign view of the outlook for yields. The market expects that the 10-year Treasury yield in ten years will only be slightly above today’s spot yield, which itself is still very depressed by historical standards (Chart 26). And that also is the case in the other major bond markets. Chart 26Forward Yields Are Too Low
Forward Yields Are Too Low
Forward Yields Are Too Low
Of course, it will not be a straight line up for yields – there will be plenty of volatility. We expect the 10-year Treasury yield to peak sometime in 2019 or early 2020 in the 3.5%-to-4% range, before the next recession sends yields temporarily lower. Duration should be kept short at least until the middle of 2019, with an emphasis on TIPS relative to conventional Treasury bonds. We will likely downgrade TIPS versus conventionals once long-term inflation expectations move into our target range, which should occur sometime during 2019. The ECB and Japan will not be in a position to raise interest rates for some time, but the bear phase in U.S. Treasurys will drag up European and Japanese bond yields (at the very long end of the curve for the latter). Total returns are likely to be negative in all of the major bond markets in 2019. Real 10-year yields in all of the advanced economies are still well below their long-term average, except for Greece, Italy and Portugal (Chart 27). Chart 27Valuation Ranking Of Developed Bond Markets
OUTLOOK 2019: Late-Cycle Turbulence
OUTLOOK 2019: Late-Cycle Turbulence
Within global bond portfolios, we recommend being underweight bond markets where central banks are in a position to raise short-term interest rates (the U.S. and Canada), and overweight those that are not (Japan and Australia). The first ECB rate hike is unlikely before the end of 2019. However, the imminent end of the asset purchase program argues for no more than a benchmark allocation to core European bond markets within global fixed-income portfolios, especially since real 10-year yields in parts of continental Europe are the furthest below their long-term average. We are overweight gilts at the moment, but foresee shifting to underweight in 2019, depending on how Brexit plays out. Ms. X: What about corporate bonds? I know that total returns for corporates will be poor if government bond yields are rising. But you recommended overweighting corporate bonds relative to Treasurys last year. Given your view that the next U.S. recession is more than a year away, it seems reasonable to assume they will outperform government bonds. BCA: We were overweight corporates in the first half of 2018, but took profits in June and shifted to neutral at the same time that we downgraded our equity allocation. Spreads had tightened to levels that did not compensate investors for the risks. Recent spread widening has returned some value to U.S. corporates. The 12-month breakeven spreads for A-rated and Baa-rated corporate bonds are almost back up to their 50th percentile relative to history (Chart 28). Still, these levels are not attractive enough to justify buying based on valuation alone. As for high-yield, any rise in the default rate would quickly overwhelm the yield pickup in this space. Chart 28Corporate Bond Yields Still Have Upside
Corporate Bond Yields Still Have Upside
Corporate Bond Yields Still Have Upside
It is possible that some of the spread widening observed in October and November will reverse, but corporates offer a poor risk/reward tradeoff, even if the default rate stays low. Corporate profit growth is bound to decelerate in 2019. This would not be a disaster for equities, but slowing profit growth is more dangerous for corporate bond excess returns because the starting point for leverage is already elevated. As discussed above, at a macro level, the aggregate interest coverage ratio for the U.S. corporate sector is decent by historical standards. However, this includes mega-cap companies that have little debt and a lot of cash. Our bottom-up research suggests that interest coverage ratios for firms in the Bloomberg Barclays corporate bond index will likely drop close to multi-decade lows during the next recession, sparking a wave of downgrade activity and fallen angels. Seeing this coming, investors may require more yield padding to compensate for these risks as profit growth slows. Our next move will likely be to downgrade corporate bonds to underweight. We are watching the yield curve, bank lending standards, profit growth, and monetary indicators for signs to further trim exposure. You should already be moving up in quality within your corporate bond allocation. Mr. X: We have already shifted to underweight corporate bonds in our fixed income portfolio. Even considering the cheapening that has occurred over the past couple of months, spread levels still make no sense in terms of providing compensation for credit risk. Equity Market Outlook Ms. X: While we all seem to agree that corporate bonds are not very attractive, I believe that enough value has been restored to equities that we should upgrade our allocation, especially if the next recession is two years away. And I know that stocks sometimes have a powerful blow-off phase before the end of a bull market. Mr. X: This is where I vehemently disagree with my daughter. The recent sell-off resembles a bloodbath in parts of the global market. It has confirmed my worst fears, especially related to the high-flying tech stocks that I believe were in a bubble. Hopes for a blow-off phase are wishful thinking. I’m wondering if the sell-off represents the beginning of an extended bear market. BCA: Some value has indeed been restored. However, the U.S. market is far from cheap relative to corporate fundamentals. The trailing and 12-month forward price-earnings ratios (PER) of 20 and 16, respectively, are still far above their historical averages, especially if one leaves out the tech bubble period of the late 1990s. And the same is true for other metrics such as price-to-sales and price-to-book value (Chart 29). BCA’s composite valuation indicator, based on 8 different valuation measures, is only a little below the threshold of overvaluation at +1 standard deviation because low interest rates still favor equities on a relative yield basis. Chart 29U.S. Equities Are Not Cheap
U.S. Equities Are Not Cheap
U.S. Equities Are Not Cheap
It is true that equities can reward investors handsomely in the final stage of a bull market. Chart 30 presents cumulative returns to the S&P 500 in the last nine bull markets. The returns are broken down by quintile. The greatest returns, unsurprisingly, generally occur in the first part of the bull market (quintile 1). But total returns in the last 20% of the bull phase (quintile 5) have been solid and have beaten the middle quartiles. Chart 30Late-Cycle Blow-Offs Can Be Rewarding
OUTLOOK 2019: Late-Cycle Turbulence
OUTLOOK 2019: Late-Cycle Turbulence
Of course, the tricky part is determining where we are in the bull market. We have long viewed financial markets through the lens of money and credit. This includes a framework that involves the Fed policy cycle. The historical track record for risk assets is very clear; they tend to perform well when the fed funds rate is below neutral, whether rates are rising or falling. Risk assets tend to underperform cash when the fed funds rate is above neutral (Table 3). Table 3Stocks Do Well When The Fed Funds Rate Is Below Neutral
OUTLOOK 2019: Late-Cycle Turbulence
OUTLOOK 2019: Late-Cycle Turbulence
We believe the fed funds rate is still in easy territory. This suggests that it is too early to shift to underweight on risk assets. We may even want to upgrade to overweight if stocks become cheap enough, as long as Fed policy is not restrictive. That said, there is huge uncertainty about the exact level of rates that constitutes “neutral” (or R-star in the Fed’s lingo). Even the Fed is unsure. This means that we must watch for signs that the fed funds rate has crossed the line into restrictive territory as the FOMC tightens over the coming year. An inversion of the 3-month T-bill/10-year yield curve slope would be a powerful signal that policy has become tight, although the lead time of an inverted curve and declining risk asset prices has been quite variable historically. Finally, it is also important to watch U.S. profit margins. Some of our research over the past couple of years focused on the late-cycle dynamics of previous long expansions, such as the 1960s, 1980s and 1990s. We found that risk assets came under pressure once U.S. profit margins peaked. Returns were often negative from the peak in margins to the subsequent recession. Mr. X: U.S. profit margins must be close to peak levels. I’ve seen all sorts of anecdotal examples of rising cost pressures, not only in the labor market. BCA: We expected to see some margin pressure to appear by now. S&P 500 EPS growth will likely top out in the next couple of quarters, if only because the third quarter’s 26% year-over-year pace is simply not sustainable. But it is impressive that our margin proxies are not yet flagging an imminent margin squeeze, despite the pickup in wage growth (Chart 31). Chart 31U.S. Margin Indicators Still Upbeat
U.S. Margin Indicators Still Upbeat
U.S. Margin Indicators Still Upbeat
Margins according to the National Accounts (NIPA) data peaked in 2014 and have since diverged sharply with S&P 500 operating margins. It is difficult to fully explain the divergence. The NIPA margin is considered to be a better measure of underlying U.S. corporate profitability because it includes all companies (not just 500), and it is less subject to accounting trickery. That said, even the NIPA measure of margins firmed a little in 2018, along with the proxies we follow that correlate with the S&P 500 measure. The bottom line is that the macro variables that feed into our top-down U.S. EPS model point to a continuing high level of margins and fairly robust top-line growth, at least for the near term. For 2019, we assumed slower GDP growth and incorporated some decline in margins into our projection just to err on the conservative side. Nonetheless, our EPS model still projects a respectable 8% growth rate at the end of 2019 (Chart 32). The dollar will only be a minor headwind to earnings growth unless it surges by another 10% or more. Chart 32EPS Growth Forecasts
EPS Growth Forecasts
EPS Growth Forecasts
The risks to EPS growth probably are to the downside relative to our forecast, but the point is that U.S. earnings will likely remain supportive for the market unless economic growth is much weaker than we expect. None of this means that investors should be aggressively overweight stocks now. We trimmed our equity recommendation to benchmark in mid-2018 for several reasons. At the time, value was quite poor and bottom-up earnings expectations were too high, especially on a five-year horizon. Also, sentiment measures suggested that investors were overly complacent. As you know, we are always reluctant to chase markets into highly overvalued territory, especially when a lot of good news has been discounted. As we have noted, we are open to temporarily shifting back to overweight in equities and other risk assets. The extension of the economic expansion gives more time for earnings to grow. The risks facing the market have not eased much but, given our base-case macro view, we would be inclined to upgrade equities if there is another meaningful correction. Of course, our profit, monetary and economic indicators would have to remain supportive to justify an upgrade. Mr. X: But you are bearish on bonds. We saw in October that the equity market is vulnerable to higher yields. BCA: It certainly won’t be smooth sailing through 2019 as interest rates normalize. Until recently, higher bond yields reflected stronger growth without any associated fears that inflation was a growing problem. The ‘Fed Put’ was seen as a key backstop for the equity bull market. But now that the U.S. labor market is showing signs of overheating, the bond sell-off has become less benign for stocks because the Fed will be less inclined to ease up at the first sign of trouble in the equity market. How stocks react in 2019 to the upward trend in yields depends a lot on the evolution of actual inflation and long-term inflation expectations. If core PCE inflation hovers close to or just above 2% for a while, then the Fed Put should still be in place. However, it would get ugly for both bonds and stocks if inflation moves beyond 2.5%. Our base case is that this negative dynamic won’t occur until early 2020, but obviously the timing is uncertain. One key indicator to watch is long-term inflation expectations, such as the 10-year TIPS breakeven inflation rate (Chart 33). It is close to 2% at the moment. If it shifts up into the 2.3%-2.5% range, it would confirm that inflation expectations have returned to a level that is consistent with the Fed meeting its 2% inflation target on a sustained basis. This would be a signal to the Fed that it is must become more aggressive in calming growth, with obvious negative consequences for risk assets. Chart 33Watch For A Return To 2.3%-2.5% Range
Watch For A Return To 2.3%-2.5% Range
Watch For A Return To 2.3%-2.5% Range
Mr. X: I am skeptical that the U.S. corporate sector can pull off an 8% earnings gain in 2019. What about the other major markets? Won’t they get hit hard if global growth continues to slow as you suggest? BCA: Yes, that is correct. It is not surprising that EPS growth has already peaked in the Euro Area and Japan. The profit situation is going to deteriorate quickly in the coming quarters. Industrial production growth in both economies has already dropped close to zero, and we use this as a proxy for top-line growth in our EPS models. Nominal GDP growth has decelerated sharply in both economies in absolute terms and relative to the aggregate wage bill. These trends suggest that profit margins are coming under significant downward pressure. Even when we build in a modest growth pickup and slight rebound in margins in 2019, EPS growth falls close to zero by year-end according to our models. Both the Euro Area and Japanese equity markets are cheap relative to the U.S., based on our composite valuation indicators (Chart 34). However, neither is above the threshold of undervaluation (+1 standard deviation) that would justify overweight positions on valuation alone. We think the U.S. market will outperform the other two at least in the first half of 2019 in local and, especially, common-currency terms. Chart 34Valuation Of Nonfinancial Equity Markets Relative To The U.S.
OUTLOOK 2019: Late-Cycle Turbulence
OUTLOOK 2019: Late-Cycle Turbulence
Ms. X: It makes sense that U.S. profit growth will outperform the other major developed countries in 2019. I would like to circle back to emerging market assets. I understand that many emerging economies have deep structural problems. But you admitted that the Chinese authorities will eventually stimulate enough to stabilize growth, providing a bounce in EM growth and asset prices next year. These assets seem cheap enough to me to warrant buying now in anticipation of that rally. As we all know, reversals from oversold levels can happen in a blink of an eye and I don’t want to miss it. BCA: We are looking for an opportunity to buy as well, but are wary of getting in too early. First, valuation has improved but is not good enough on its own to justify buying now. EM stocks are only moderately undervalued based on our EM composite valuation indicator and the cyclically-adjusted P/E ratio (Chart 35). EM currencies are not particularly cheap either, outside of Argentina, Turkey and Mexico (Charts 36A and 36B). Valuation should only play a role in investment strategy when it is at an extreme, and this is not the case for most EM countries. Chart 35EM Stocks Are Not At Capitulation Levels...
bca.bca_mp_2018_12_01_c35
bca.bca_mp_2018_12_01_c35
Chart 36A…And Neither Are EM Currencies
...And Neither Are EM Currencies
...And Neither Are EM Currencies
Chart 36B…And Neither Are EM Currencies
...And Neither Are EM Currencies
...And Neither Are EM Currencies
Second, corporate earnings growth has plenty of downside potential in the near term. Annual growth in EM nonfinancial EBITDA, currently near 10%, is likely to turn negative next year, based on our China credit and fiscal impulse indicator (Chart 37). And, as we emphasized earlier, China is not yet pressing hard on the gas pedal. Chart 37EM Earnings Growth: Lots Of Downside
EM Earnings Growth: Lots Of Downside
EM Earnings Growth: Lots Of Downside
Third, it will take time for more aggressive Chinese policy stimulus, if it does occur, to show up in EM stocks and commodity prices. Trend changes in money growth and our credit and fiscal impulse preceded the trough in EM stocks and commodity prices in 2015, and again at the top in stocks and commodities in 2017 (Chart 38). However, even if these two indicators bottom today, it could take several months before the sell-off in EM financial markets and commodity prices abates. Chart 38Chinese Money And Credit Leads EM And Commodities
Chinese Money And Credit Leads EM And Commodities
Chinese Money And Credit Leads EM And Commodities
Finally, if Chinese stimulus comes largely via easier monetary policy rather than fiscal stimulus, then the outcome will be a weaker RMB. We expect the RMB to drift lower in any event, because rate differentials vis-à-vis the U.S. will move against the Chinese currency next year. A weaker RMB would add to the near-term headwinds facing EM assets. The bottom line is that the downside risks remain high enough that you should resist the temptation to bottom-fish until there are concrete signs that the Chinese authorities are getting serious about boosting the economy. We are also watching for signs outside of China that the global growth slowdown is ending. This includes our global leading economic indicator and data that are highly sensitive to global growth, such as German manufacturing foreign orders. Mr. X: Emerging market assets would have to become a lot cheaper for me to consider buying. Debt levels are just too high to be sustained, and stronger Chinese growth would only provide a short-term boost. I’m not sure I would even want to buy developed market risk assets based solely on some Chinese policy stimulus. BCA: Yes, we agree with your assessment that buying EM in 2019 would be a trade rather than a buy-and-hold strategy. Still, the combination of continued solid U.S. growth and a modest upturn in the Chinese economy would alleviate a lot of investors’ global growth concerns. The result could be a meaningful rally in pro-cyclical assets that you should not miss. We are defensively positioned at the moment, but we could see becoming more aggressive in 2019 on signs that China is stimulating more firmly and/or our global leading indicators begin to show some signs of life. Besides upgrading our overall equity allocation back to overweight, we would dip our toes in the EM space again. At the same time, we will likely upgrade the more cyclical DM equity markets, such as the Euro Area and Japan, while downgrading the defensive U.S. equity market to underweight. We are currently defensively positioned in terms of equity sectors, but it would make sense to shift cyclicals to overweight at the same time. Exact timing is always difficult, but we expect to become more aggressive around the middle of 2019. We also think the time is approaching to favor long-suffering value stocks over growth stocks. The relative performance of growth-over-value according to standard measures has become a sector call over the past decade: tech or financials. The sector skew complicates this issue, especially since tech stocks have already cracked. But we have found that stocks that are cheap within equity sectors tend to outperform expensive (or growth) stocks once the fed funds rate moves into restrictive territory. This is likely to occur in the latter half of 2019. Value should then have its day in the sun. Currencies: Mr. X: We don’t usually hedge our international equity exposure, so the direction of the dollar matters a lot to us. As you predicted a year ago, the U.S. dollar reigned supreme in 2018. Your economic views suggest another good year in 2019, but won’t this become a problem for the economy? President Trump’s desire to lower the U.S. trade deficit suggests that the Administration would like the dollar to drop and we could get some anti-dollar rhetoric from the White House. Also, it seems that the consensus is strongly bullish on the dollar which is always a concern. BCA: The outlook for the dollar is much trickier than it was at the end of 2017. As you highlighted, traders are already very long the dollar, implying that the hurdle for the greenback to surprise positively is much higher now. However, a key driver for the dollar is the global growth backdrop. If the latter is poor in the first half of 2019 as we expect, it will keep a bid under the greenback. Interest rates should also remain supportive for the dollar. As we argued earlier, current market expectations – only one more Fed hike after the December meeting – are too sanguine. If the Fed increases rates by more than currently discounted, the dollar’s fair value will rise, especially if global growth continues to lag that of the U.S. Since the dollar’s 2018 rally was largely a correction of its previous undervaluation, the currency has upside potential in the first half of the year (Chart 39). Chart 39U.S. Dollar Not Yet Overvalued
U.S. Dollar Not Yet Overvalued
U.S. Dollar Not Yet Overvalued
A stronger dollar will dampen foreign demand for U.S.-produced goods and will boost U.S. imports. However, do not forget that a rising dollar benefits U.S. consumers via its impact on import prices. Since the consumer sector represents 68% of GDP, and that 69% of household consumption is geared toward the (largely domestic) service sector, a strong dollar will not be as negative for aggregate demand and employment as many commentators fear, unless it were to surge by at least another 10%. In the end, the dollar will be more important for the distribution of U.S. growth than its overall level. Where the strong dollar is likely to cause tremors is in the political arena. You are correct to point out that there is a large inconsistency between the White House’s desires to shore up growth, while simultaneously curtailing the trade deficit, especially if the dollar appreciates further. As long as the Fed focuses on its dual mandate and tries to contain inflationary pressures, the executive branch of the U.S. government can do little to push the dollar down. Currency intervention cannot have a permanent effect unless it is accompanied by shifts in relative macro fundamentals. For example, foreign exchange intervention by the Japanese Ministry of Finance in the late 1990s merely had a temporary impact on the yen. The yen only weakened on a sustained basis once interest rate differentials moved against Japan. This problem underpins our view that the Sino-U.S. relationship is unlikely to improve meaningfully next year. China will remain an easy target to blame for the U.S.’s large trade deficit. What ultimately will signal a top in the dollar is better global growth, which is unlikely until the second half of 2019. At that point, expected returns outside the U.S. will improve, causing money to leave the U.S., pushing the dollar down. Mr. X: While 2017 was a stellar year for the euro, 2018 proved a much more challenging environment. Will 2019 be more like 2017 or 2018? BCA: We often think of the euro as the anti-dollar; buying EUR/USD is the simplest, most liquid vehicle for betting against the dollar, and vice versa. Our bullish dollar stance is therefore synonymous with a negative take on the euro. Also, the activity gap between the U.S. and the Euro Area continues to move in a euro-bearish fashion (Chart 40). Finally, since the Great Financial Crisis, EUR/USD has lagged the differential between European and U.S. core inflation by roughly six months. Today, this inflation spread still points toward a weaker euro. Chart 40Relative LEI's Moving Against Euro
Relative LEI's Moving Against Euro
Relative LEI's Moving Against Euro
It is important to remember that when Chinese economic activity weakens, European growth deteriorates relative to the U.S. Thus, our view that global growth will continue to sputter in the first half of 2019 implies that the monetary policy divergence between the Fed and the ECB has not yet reached a climax. Consequently, we expect EUR/USD to trade below 1.1 in the first half of 2019. By that point, the common currency will be trading at a meaningful discount to its fair value, which will allow it to find a floor (Chart 41). Chart 41Euro Heading Below Fair Value Before Bottoming
Euro Heading Below Fair Value Before Bottoming
Euro Heading Below Fair Value Before Bottoming
Mr. X: The Bank of Japan has debased the yen, with a balance sheet larger than Japan’s GDP. This cannot end well. I am very bearish on the currency. BCA: The BoJ’s monetary policy is definitely a challenge for the yen. The Japanese central bank rightfully understands that Japan’s inability to generate any meaningful inflation – despite an economy that is at full employment – is the consequence of a well-established deflationary mindset. The BoJ wants to shock inflation expectations upward by keeping real rates at very accommodative levels well after growth has picked up. This means that the BoJ will remain a laggard as global central banks move away from accommodative policies. The yen will continue to depreciate versus the dollar as U.S. yields rise on a cyclical horizon. That being said, the yen still has a place within investors’ portfolios. First, the yen is unlikely to collapse despite the BoJ’s heavy debt monetization. The JPY is one of the cheapest currencies in the world, with its real effective exchange rate hovering at a three-decade low (Chart 42). Additionally, Japan still sports a current account surplus of 3.7% of GDP, hardly the sign of an overstimulated and inflationary economy where demand is running amok. Instead, thanks to decades of current account surpluses, Japan has accumulated a positive net international investment position of 60% of GDP. This means that Japan runs a constant and large positive income balance, a feature historically associated with strong currencies. Chart 42The Yen Is Very Cheap
The Yen Is Very Cheap
The Yen Is Very Cheap
Japan’s large net international investment position also contributes to the yen’s defensive behavior as Japanese investors pull money back to safety at home when global growth deteriorates. Hence, the yen could rebound, especially against the euro, the commodity currencies, and EM currencies if there is a further global growth scare in the near term. Owning some yen can therefore stabilize portfolio returns during tough times. As we discussed earlier, we would avoid the EM asset class, including currency exposure, until global growth firms. Commodities: Ms. X: Once again, you made a good call on the energy price outlook a year ago, with prices moving higher for most of the year. But the recent weakness in oil seemed to come out of nowhere, and I must admit to being confused about where we go next. What are your latest thoughts on oil prices for the coming year? BCA: The fundamentals lined up in a very straightforward way at the end of 2017. The coalition we have dubbed OPEC 2.0 – the OPEC and non-OPEC producer group led by the Kingdom of Saudi Arabia (KSA) and Russia – outlined a clear strategy to reduce the global oil inventory overhang. The producers that had the capacity to increase supply maintained strict production discipline which, to some analysts, was still surprising even after the cohesiveness shown by the group in 2017. Outside that core group output continued to fall, especially in Venezuela, which remains a high-risk producing province. The oil market was balanced and prices were slowly moving higher as we entered the second quarter of this year, when President Trump announced the U.S. would re-impose oil export sanctions against Iran beginning early November. The oft-repeated goal of the sanctions was to reduce Iranian exports to zero. To compensate for the lost Iranian exports, President Trump pressured OPEC, led by KSA, to significantly increase production, which they did. However, as we approached the November deadline, the Trump Administration granted the eight largest importers of Iranian oil 180-day waivers on the sanctions. This restored much of the oil that would have been lost. Suddenly, the market found itself oversupplied and prices fell. As we move toward the December 6 meeting of OPEC 2.0 in Vienna, we are expecting a production cut from the coalition of as much as 1.4mm b/d to offset these waivers. The coalition wishes to keep global oil inventories from once again over-filling and dragging prices even lower in 2019. On the demand side, consumption continues to hold up both in the developed and emerging world, although we have somewhat lowered our expectations for growth next year. We are mindful of persistent concerns over the strength of demand – particularly in EM – in 2019. Thus, on the supply side and the demand side, the level of uncertainty in the oil markets is higher than it was at the start of 2018. Nonetheless, our base-case outlook is on the optimistic side for oil prices in 2019, with Brent crude oil averaging around $82/bbl, and WTI trading $6/bbl below that level (Chart 43). Chart 43Oil Prices To Rebound In 2019
Oil Prices To Rebound In 2019
Oil Prices To Rebound In 2019
Ms. X: I am skeptical that oil prices will rebound as much as you expect. First, oil demand is likely to falter if your view that global growth will continue slowing into early 2019 proves correct. Second, U.S. shale production is rising briskly, with pipeline bottlenecks finally starting to ease. Third, President Trump seems to have gone from taking credit for high equity prices to taking credit for low oil prices. Trump has taken a lot flack for supporting Saudi Arabia following the killing of The Washington Post journalist in Turkey. Would the Saudis really be willing to lose Trump’s support by cutting production at this politically sensitive time? BCA: Faltering demand growth remains a concern. However, note that in our forecasts we do expect global oil consumption growth to slow down to 1.46mm b/d next year, somewhat lower than the 1.6mm b/d growth we expect this year. In terms of the U.S. shale sector, production levels over the short term can be somewhat insensitive to changes in spot and forward prices, given the hedging activity of producers. Over the medium to longer term, however, lower spot and forward prices will disincentivize drilling by all but the most efficient producers with the best, lowest-cost acreage. If another price collapse were to occur – and were to persist, as the earlier price collapse did – we would expect a production loss of between 5% and 10% from the U.S. shales. Regarding KSA, the Kingdom needs close to $83/bbl to balance its budget this year and next, according to the IMF’s most recent estimates. If prices remain lower for longer, KSA’s official reserves will continue to fall, as its sovereign wealth fund continues to be tapped to fill budget gaps. President Trump’s insistence on higher production from KSA and the rest of OPEC is a non-starter – it would doom those economies to recession, and stifle further investment going forward. The U.S. would also suffer down the road, as the lack of investment significantly tightens global supply. So, net, if production cuts are not forthcoming from OPEC at its Vienna meeting we – and the market – will be downgrading our oil forecast. Ms. X: Does your optimism regarding energy extend to other commodities? The combination of a strong dollar and a China slowdown did a lot of damage to industrial commodities in 2018. Given your view that China’s economy should stabilize in 2019, are we close to a bottom in base metals? BCA: It is too soon to begin building positions in base metals because the trade war is going to get worse before it gets better. Exposure to base metals should be near benchmark at best entering 2019, although we will be looking to upgrade along with other risk assets if Chinese policy stimulus ramps up. Over the medium term, the outlook for base metals hinges on how successfully China pulls off its pivot toward consumer- and services-led growth, away from heavy industrial-led development. China accounts for roughly half of global demand for these base metals. Commodity demand from businesses providing consumer goods and services is lower than that of heavy industrial export-oriented firms. But demand for commodities used in consumer products – e.g., copper, zinc and nickel, which go into stainless-steel consumer appliances such as washers and dryers – will remain steady, and could increase if the transition away from heavy industrial-led growth is successful. Gasoline and jet fuel demand will also benefit, as EM consumers’ demand for leisure activities such as tourism increases with rising incomes. China is also going to be a large producer and consumer of electric vehicles, as it attempts to reduce its dependence on imported oil. Although timing the production ramp-up is difficult, in the long term these trends will be supportive for nickel and copper. Mr. X: You know I can’t let you get away without asking about gold. The price of bullion is down about 5% since the end of 2017, but that is no worse than the global equity market and it did provide a hedge against economic, financial or political shocks. The world seems just as risky as it did a year ago, so I am inclined to hold on to our gold positions, currently close to 10% of our portfolio. That is above your recommended level, but keeping a solid position in gold is one area where my daughter and I have close agreement regarding investment strategy. BCA: Gold did perform well during the risk asset corrections we had in 2018, and during the political crises as well. The price is not too far away from where we recommended going long gold as a portfolio hedge at the end of 2017 ($1230.3/oz). We continue to expect gold to perform well as a hedge. When other risk assets are trading lower, gold holds value relative to equities and tends to outperform bonds (Chart 44). Likewise, when other risk assets are rising, gold participates, but does not do as well as equities. It is this convexity – outperforming on the downside but participating on the upside with other risk assets – that continues to support our belief that gold has a role as a portfolio hedge. However, having 10% of your portfolio in gold is more than we would recommend – we favor an allocation of around 5%. Chart 44Hold Some Gold As A Hedge
OUTLOOK 2019: Late-Cycle Turbulence
OUTLOOK 2019: Late-Cycle Turbulence
Geopolitics Ms. X: I’m glad that the three of us agree at least on one thing – hold some gold! Let’s return to the geopolitical situation for a moment. Last year, you correctly forecast that divergent domestic policies in the U.S. and China – stimulus in the former and lack thereof in the latter – would be the most investment-relevant geopolitical issue. At the time, I found this an odd thing to highlight, given the risks of protectionism, populism, and North Korea. Do you still think that domestic policies will dominate in 2019? BCA: Yes, policy divergence between the U.S. and China will also dominate in 2019, especially if it continues to buoy the U.S. economy at the expense of the rest of the world. Of course, Beijing may decide to do more stimulus to offset its weakening economy and the impact of the trade tariffs. A headline rate cut, cuts to bank reserve requirements, and a boost to local government infrastructure spending are all in play. In the context of faltering housing and capex figures in the U.S., the narrative over the next quarter or two could be that the policy divergence is over, that Chinese policymakers have “blinked.” We are pushing back against this narrative on a structural basis. We have already broadly outlined our view that China will not be pressing hard to boost demand growth. Many of its recent policy efforts have focused on rebalancing the economy away from debt-driven investment (Chart 45). The problem for the rest of the world is that raw materials and capital goods comprise 85% of Chinese imports. As such, efforts to boost domestic consumption will have limited impact on the rest of the world, especially as emerging markets are highly leveraged to “old China.” Chart 45Rebalancing Of The Chinese Economy
Rebalancing Of The Chinese Economy
Rebalancing Of The Chinese Economy
Meanwhile, the Trump-Democrat gridlock could yield surprising results in 2019. President Trump is becoming singularly focused on winning re-election in 2020. As such, he fears the “stimulus cliff” looming over the election year. Democrats, eager to show that they are not merely the party of “the Resistance,” have already signaled that an infrastructure deal is their top priority. With fiscal conservatives in the House all but neutered by the midterm elections, a coalition between Trump and likely House Speaker Nancy Pelosi could emerge by late 2019, ushering in even more fiscal stimulus. While the net new federal spending will not be as grandiose as the headline figures, it will be something. There will also be regular spending increases in the wake of this year’s bipartisan removal of spending caps. We place solid odds that the current policy divergence narrative continues well into 2019, with bullish consequences for the U.S. dollar and bearish outcomes for EM assets, at least in the first half of the year. Mr. X: Your geopolitical team has consistently been alarmist on the U.S.-China trade war, a view that bore out throughout 2018. You already stated that you think trade tensions will persist in 2019. Where is this heading? BCA: Nowhere good. Rising geopolitical tensions in the Sino-American relationship has been our premier geopolitical risk since 2012. The Trump administration has begun tying geopolitical and strategic matters in with the trade talks. No longer is the White House merely asking for a narrowing of the trade deficit, improved intellectual property protections, and the removal of non-tariff barriers to trade. Now, everything from surface-to-air missiles in the South China Sea to Beijing’s “Belt and Road” project are on the list of U.S. demands. Trade negotiations are a “two-level game,” whereby policymakers negotiate in parallel with their foreign counterparts and domestic constituents. While Chinese economic agents may accept U.S. economic demands, it is not clear to us that its military and intelligence apparatus will accept U.S. geopolitical demands. And Xi Jinping himself is highly attuned to China’s geopolitical position, calling for national rejuvenation above all. We would therefore downplay any optimistic news from the G20 summit between Presidents Trump and Xi. President Trump could freeze tariffs at current rates and allow for a more serious negotiating round throughout 2019. But unless China is willing to kowtow to America, a fundamental deal will remain elusive in the end. For Trump, a failure to agree is still a win domestically, as the median American voter is not asking for a resolution of the trade war with China (Chart 46). Chart 46Americans Favor Being Tough On China
OUTLOOK 2019: Late-Cycle Turbulence
OUTLOOK 2019: Late-Cycle Turbulence
Ms. X: Could trade tensions spill into rising military friction? BCA: Absolutely. Minor military skirmishes will likely continue and could even escalate. We believe that there is a structural bull market in “war.” Investors should position themselves by being long global defense stocks. Mr. X: That is not encouraging. What about North Korea and Iran? Could they become geopolitical risks in 2019? BCA: Our answer to the North Korea question remains the same as 12 months ago: we have seen the peak in the U.S.’ display of a “credible military threat.” But Iran could re-emerge as a risk mid-year. We argued in last year’s discussion that President Trump was more interested in playing domestic politics than actually ratcheting up tensions with Iran. However, in early 2018 we raised our alarm level, particularly when staffing decisions in the White House involved several noted Iran hawks joining the foreign policy team. This was a mistake. Our initial call was correct, as President Trump ultimately offered six-month exemptions to eight importers of Iranian crude. That said, those exemptions will expire in the spring. The White House may, at that point, ratchet up tensions with Iran. This time, we will believe it when we see it. Intensifying tensions with Iran ahead of the U.S. summer vacation season, and at a time when crude oil markets are likely to be finely balanced, seems like folly, especially with primary elections a mere 6-to-8 months away. What does President Trump want more: to win re-election or to punish Iran? We think the answer is obvious, especially given that very few voters seem to view Iran as the country’s greatest threat (Chart 47). Chart 47Americans Don’t See Iran As A Major Threat
OUTLOOK 2019: Late-Cycle Turbulence
OUTLOOK 2019: Late-Cycle Turbulence
Ms. X: Let’s turn to Europe. You have tended to dismiss Euroskeptics as a minor threat, which has largely been correct. But don’t you think that, with Brexit upon us and Chancellor Angela Merkel in the twilight, populism in continental Europe will finally have its day? BCA: Let’s first wait to see how Brexit turns out! The next few months will be critical. Uncertainty is high, with considerable risks remaining. We do not think that Prime Minister May has the votes in the House of Commons to push through any version of soft Brexit that she has envisioned thus far. If the vote on the U.K.-EU exit deal falls through, a new election could be possible. This will require an extension of the exit process under Article 50 and a prolonged period of uncertainty. The probability of a no-deal Brexit is lower than 10%. It is simply not in the interest of anyone involved, save for a smattering of the hardest of hard Brexit adherents in the U.K. Conservative Party. Put simply, if the EU-U.K. deal falls through in the House of Commons, or even if PM May is replaced by a hard-Brexit Tory, the most likely outcome is an extension of the negotiation process. This can be easily done and we suspect that all EU member states would be in favor of such an extension given the cost to business sentiment and trade that would result from a no-deal Brexit. It is not clear that Brexit has emboldened Euroskeptics. In fact, most populist parties in the EU have chosen to tone down their Euroskepticism and emphasize their anti-immigrant agenda since the Brexit referendum. In part, this decision has to do with how messy the Brexit process has become. If the U.K. is struggling to unravel the sinews that tie it to Europe, how is any other country going to fare any better? The problem for Euroskeptic populists is that establishment parties are wise to the preferences of the European median voter. For example, we now have Friedrich Merz, a German candidate for the head of the Christian Democratic Union – essentially Merkel’s successor – who is both an ardent Europhile and a hardliner on immigration. This is not revolutionary. Merz simply read the polls correctly and realized that, with 83% of Germans supporting the euro, the rise of the anti-establishment Alternative for Germany (AfD) is more about immigration than about the EU. As such, we continue to stress that populism in Europe is overstated. In fact, we expect that Germany and France will redouble their efforts to reform European institutions in 2019. The European parliamentary elections in May will elicit much handwringing by the media due to a likely solid showing by Euroskeptics, even though the election is meaningless. Afterwards, we expect to see significant efforts to complete the banking union, reform the European Stability Mechanism, and even introduce a nascent Euro Area budget. But these reforms will not be for everyone. Euroskeptics in Central and Eastern Europe will be left on the outside looking in. Brussels may also be emboldened to take a hard line on Italy if institutional reforms convince the markets that the core Euro Area is sheltered from contagion. In other words, the fruits of integration will be reserved for those who play by the Franco-German rules. And that could, ironically, set the stage for the unraveling of the European Union as we know it. Over the long haul, a much tighter, more integrated, core could emerge centered on the Euro Area, with the rest of the EU becoming stillborn. The year 2019 will be a vital one for Europe. We are sensing an urgency in Berlin and Paris that has not existed throughout the crisis, largely due to Merkel’s own failings as a leader. We remain optimistic that the Euro Area will survive. However, there will be fireworks. Finally, a word about Japan. The coming year will see the peak of Prime Minister Shinzo Abe’s career. He is promoting the first-ever revision to Japan’s post-war constitution in order to countenance the armed forces. If he succeeds, he will have a big national security success to couple with his largely effective “Abenomics” economic agenda – after that, it will all be downhill. If he fails, he will become a lame duck. This means that political uncertainty will rise in 2019, after six years of unusual tranquility. Conclusions Mr. X: This is a good place to conclude our discussion. We have covered a lot of ground and your views have reinforced my belief that 2019 could be even more turbulent for financial markets than the past has been. I accept your opinion that a major global economic downturn is not around the corner, but with valuations still stretched, I feel that it makes good sense to focus on capital preservation. I may lose out on the proverbial “blow-off” rally, but so be it – I have been in this business long enough to know that it is much better to leave the party while the music is still playing! Ms. X: I agree with my father that the risks surrounding the outlook have risen as we have entered the late stages of this business-cycle expansion. Yet, if global growth does temporarily stabilize and corporate earnings continue to expand, I fear that being out of the market will be very painful. The era of hyper-easy money may be ending, but interest rates globally are still nowhere near restrictive territory. This tells me that the final stages of this bull market could be very rewarding. A turbulent market is not only one where prices go down – they can also go up a lot! BCA: The debate you are having is one we ourselves have had on numerous occasions. There is always a trade-off between maximizing short-term returns and taking a longer-term approach. Valuations are the ultimate guidepost for long-term returns. While most assets have cheapened over the past year, prices are still fairly elevated. Table 4 shows our baseline calculations of what a balanced portfolio will earn over the coming decade. We estimate that such a portfolio will deliver average annual returns of 4.9% over the next ten years, or 2.8% after adjusting for inflation. That is an improvement over our inflation-adjusted estimate of 1.3% from last year, but still well below the 6.6% real return that a balanced portfolio earned between 1982 and 2018. Table 410-Year Asset Return Projections
OUTLOOK 2019: Late-Cycle Turbulence
OUTLOOK 2019: Late-Cycle Turbulence
Our return calculations for equities assume that profit margins decline modestly over the period and that multiples mean revert to their historical average. These assumptions may turn out to be too pessimistic if underlying changes in the economy keep corporate profits elevated as a share of GDP. Structurally lower real interest rates may also justify higher P/E multiples, although this would be largely offset by the prospect of slower economic growth, which will translate into slower earnings growth. In terms of the outlook for the coming year, a lot hinges on our view that monetary policy in the main economies stays accommodative. This seems like a safe assumption in the Euro Area and Japan, where rates are near historic lows, as well as in China, where the government is actively loosening monetary conditions. It is not such a straightforward conclusion for the U.S., where the Fed is on track to keep raising rates. If it turns out that the neutral interest rate is not far above where rates are already, we could see a broad-based slowdown of the U.S. economy that ripples through to the rest of the world. And even if U.S. monetary policy does remain accommodative, many things could still upset the apple cart, including a full-out trade war, debt crises in Italy or China, or a debilitating spike in oil prices. As the title of our outlook implies, 2019 is likely to be a year of increased turbulence. Ms. X: As always, you have left us with much to think about. My father has looked forward to these discussions every year and now that I am able to join him, I understand why. Before we conclude, it would be helpful to have a recap of your key views. BCA: That would be our pleasure. The key points are as follows: The collision between policy and markets that we discussed last year finally came to a head in October. Rather than falling as they normally do when stocks plunge, U.S. bond yields rose as investors reassessed the willingness of the Fed to pause hiking rates even in the face of softer growth. Likewise, hopes that China would move swiftly to stimulate its economy were dashed as it became increasingly clear that the authorities were placing a high emphasis on their reform agenda of deleveraging and capacity reduction. The ongoing Brexit saga and the stalemate between the populist Italian government and the EU have increased uncertainty in Europe at a time when the region was already beginning to slow. We expect the tensions between policy and markets to be an ongoing theme in 2019. With the U.S. unemployment rate at a 48-year low, it will take a significant slowdown for the Fed to stop hiking rates. Despite the deterioration in economic data over the past month, real final domestic demand is still tracking to expand by 3% in the fourth quarter, well above estimates of the sustainable pace of economic growth. Ultimately, the Fed will deliver more hikes next year than discounted in the markets. This will push up the dollar and keep the upward trend in Treasury yields intact. The dollar should peak midway next year. China will also become more aggressive in stimulating its economy, which will boost global growth. However, until both of these things happen, emerging markets will remain under pressure. For the time being, we continue to favor developed market equities over their EM peers. We also prefer defensive equity sectors such as health care and consumer staples over cyclical sectors such as industrials and materials. Within the developed market universe, the U.S. will outperform Europe and Japan for the next few quarters, especially in dollar terms. A stabilization in global growth could ignite a blow-off rally in global equities. If the Fed is raising rates in response to falling unemployment, this is unlikely to derail the stock market. However, once supply-side constraints begin to fully bite in early 2020 and inflation rises well above the Fed’s target of 2%, stocks will begin to buckle. This means that a window exists next year where stocks will outperform bonds. We would maintain a benchmark allocation to stocks for now, but increase exposure if global bourses were to fall significantly from current levels without a corresponding deteriorating in the economic outlook. Corporate credit will underperform stocks as government bond yields rise. A major increase in spreads is unlikely as long as the economy is still expanding, but spreads could still widen modestly given their low starting point. U.S. shale companies have been the marginal producers in the global oil sector. With breakeven costs in shale close to $50/bbl, crude prices are unlikely to rise much from current levels over the long term. However, over the next 12 months, we expect production cuts in Saudi Arabia will push prices up, with Brent crude averaging around $82/bbl in 2019. A balanced portfolio is likely to generate average returns of only 2.8% a year in real terms over the next decade. This compares to average returns of around 6.6% a year between 1982 and 2018. We would like to take this opportunity to wish you and all of our clients a very peaceful, healthy and prosperous New Year. The Editors November 26, 2018
Dear Client, Early next week, we will be sending you our BCA Outlook 2019 - our annual dialogue with the bearishly inclined Mr. X and his family. In this report, BCA editors will highlight the most impactful themes for the global economy next year, and the opportunities and risks they create for international asset markets. Next Friday, we will also send you our take on the implications of this discussion for the FX market. Best regards, Mathieu Savary, Vice President Foreign Exchange Strategy Highlights A bearish consensus is forming around the dollar for 2019 as U.S. growth is falling prey to global economic deterioration. However, slowing global growth and inflation create the best environment for the dollar, suggesting the greenback could perform very well in early 2019. While EUR/USD should trade below 1.10 before mid-2019, the dollar should be strongest against the AUD, the NZD and the SEK. The yen faces a trickier picture. With a low degree of conviction, we anticipate USD/JPY to depreciate; but with a high level of confidence, we foresee additional strength in the JPY against the AUD, the NZD and the SEK; EUR/JPY should move below 120. Close short CAD/NOK. Feature The end of the year is approaching, which means that like BCA, banks and research houses around the world are rolling out their major forecasts for the upcoming year. The near-uniform bearishness toward the greenback of the current vintage of forecasts has struck us. Our contrarian streak inclines us to re-assert our bullish dollar stance, but being contrarian for the sake of it is often the perfect recipe to lose money. Welcome To The Jungle A bearish tone on the dollar appears justified right now. Speculators hold near-record long bets on the dollar, yet U.S. economic data seem to finally be succumbing to the gravitational pull of slowing global economic activity. U.S. core inflation has disappointed, orders have been weak, capex intentions have softened, the Conference Board's leading economic indicator has rolled over, and financial conditions have tightened as junk bonds have sold off. This combination could easily generate the perfect recipe for the dollar to sell off. The dollar's strength has been rooted in the divergence of U.S. growth from a weak world economy (Chart I-1). As the narrative goes, without U.S. strength, the Federal Reserve will not be tightening policy anymore, and the dollar will sag. Interest rate markets are already on this page, as after the December meeting they only foresee one more rate hike over the coming two years. Chart I-1Will The Dollar Lose A Key Support?
Will The Dollar Lose A Key Support?
Will The Dollar Lose A Key Support?
Despite this tantalizing narrative, the dollar rarely weakens because of poor U.S. growth alone. To the contrary, dives in our diffusion index of 16 key U.S. economic variables are most often associated with a strengthening greenback (Chart I-2). The recent sharp fall in this diffusion index would actually point to an appreciating USD. Chart I-2The Plot Thickens
The Plot Thickens
The Plot Thickens
This relationship is obviously paradoxical. It exists because the dollar is not a normal currency: it is the premier reserve currency of the world. Resting at the center of the global financial system, the dollar is more sensitive to global growth and inflation conditions than to U.S. growth and policy alone. As Chart I-3 shows, the dollar's behavior is a function of where we stand in the global economic and inflation cycle. We looked at the performance of G-10 currencies versus the dollar since 1986, decomposing the period in four samples based on trends in global activity and global headline inflation. We observed the following patterns: When global growth is accelerating but inflation is decelerating, the dollar tends to weaken, especially against the very pro-cyclical AUD, NZD and SEK (Bottom right quadrant). This is often an environment observed in the early days of a business cycle recovery. When global growth and global inflation are both accelerating, the dollar also tends to weaken, but the pattern is much less clear than in the previous stage (Top right quadrant). This is generally a mid-cycle environment. When global growth is decelerating but global inflation is accelerating, the dollar weakens much more clearly than in the mid-cycle stage (Top left quadrant). In this stage, global growth has begun to decelerate but is still elevated. Risk assets are doing well, but some clouds are gathering on the horizon. European currencies perform best. The most distinct change in the dollar's behavior happens when both global growth and global inflation are decelerating (Bottom left quadrant). In this context, the dollar is strong across the board. This is an end-of-cycle environment where global growth is poor and inflation sags. Investors become very risk averse and they favor the dollar. Commodity currencies and Scandinavian currencies are the worst performers, while the yen is the best. We were surprised that the yen did not manage to appreciate during the periods described by the bottom-left quadrant. However, this is due to the long sample used (since 1986). Prior to the mid-1990s, the yen was a decidedly pro-cyclical currency. This taints the study's overall results. If we only use a shortened time span, the yen in fact appreciates in the last stage of the global business cycle. The yen is the only currency to experience such a sharp regime shift in its relationship to the global business cycle. Chart I-3The Dollar And The Global Business Cycle
Appetite For Destruction? FX Investing For Slowing Global Growth And Inflation
Appetite For Destruction? FX Investing For Slowing Global Growth And Inflation
Bottom Line: Dividing the business cycle into four periods shows that only when global growth and inflation are very weak can the dollar unequivocally rally. This is exactly what we would anticipate of a reserve currency. Investors flock to it when they are looking for safety. Moreover, since being the global reserve currency also means that most of the world's foreign-currency borrowing is in dollars, periods of tumult force debtors to repay their debt, prompting them to buy the greenback in the process. Finally, the low beta of the U.S. economy to the global industrial cycle only adds fuel to the fire, as it means that U.S. growth outperforms global growth when global activity deteriorates meaningfully. Paradise City Under this lens, the dollar's strength this year was rather impressive. We have seen global growth slow, but global inflation accelerate. This could have been a disastrous year for the dollar, but it was not. Markets have been sniffing out slower growth and its potentially deflationary impact; hence, the dollar has responded well. Moreover, the dollar started the year trading at a 5% discount to its fair value, and investors were massively short. Finally, as we have previously showed, the dollar is the epitome of momentum currencies within the G-10 space, and this year, our momentum measure flagged a very bullish signal for the dollar (Chart I-4).1 Chart I-4Momentum Has And Continues To Support The Greenback
Momentum Has And Continues To Support The Greenback
Momentum Has And Continues To Support The Greenback
While the dollar has already been strong, the next three to six months could generate considerably more dollar strength. The dollar may not be cheap anymore, but as we argued last week, it is not expensive either.2 Moreover, while investors are already very long the dollar - a source of concern for us - momentum still favors the greenback. Finally, the global economy might spend some time in the bottom-left quadrant described above where global growth and global inflation both decelerate - the quadrant where the dollar strengthens. Thus, both momentum and economics could line up to enhance the dollar's appeal. First, we have already highlighted that global growth is in the process of weakening. Under the weight of China's deleveraging efforts, of uncertainty surrounding global trade under the Trump administration, and of the tightening in EM financial conditions, global export growth has been flailing.3 Now, our global economic and financial advance/decline line shows that enough variables are pointing in a growth-negative direction that global industrial production - not just orders and surveys - is set to deteriorate sharply (Chart I-5). Chart I-5Global Growth Will Slow Materially In The First Half Of 2019
Global Growth Will Slow Materially In The First Half Of 2019
Global Growth Will Slow Materially In The First Half Of 2019
This message is confirmed by the OECD's leading economic indicator, which is falling faster than it was in late 2015. Most crucially, the very poor performance of EM carry trades financed in yen, which have been a reliable forecaster of global industrial activity, point to a sharp deterioration of our Global Nowcast (Chart I-6), an indicator that measures the evolution of global industrial activity while bypassing the long publishing lags inherent in global IP statistics. Chart I-6The Canaries Are Suffocating
The Canaries Are Suffocating
The Canaries Are Suffocating
Second, while global inflation has been on an uptrend, we expect it to soon relapse, potentially for six months or so. To begin with, we are already seeing some key global inflation measures soften. Recent U.S. core inflation releases have disappointed, Japan's GDP deflator has grown more negative, Germany's producer prices have decelerated, and both producer and core consumer prices in China are slowing sharply. If we are to believe financial markets, this development has further to run. The change in 10-year and 5-year/5-year forward U.S. inflation break-evens has collapsed, and the performance of U.S. industrial stocks relative to utilities suggest that global core inflation will soon decelerate noticeably (Chart I-7). Additionally, the annual total returns of EM equities relative to EM bonds, adjusted for their mutual volatility, has fallen, which normally also foreshadows a decline in underlying global inflation (Chart I-8). Chart I-7U.S. Financial Market Point To Slower Global Inflation...
U.S. Financial Market Point To Slower Global Inflation...
U.S. Financial Market Point To Slower Global Inflation...
Chart I-8...So Do EM Stocks And Bonds
...So Do EM Stocks And Bonds
...So Do EM Stocks And Bonds
The trend in some of the most important globally traded good prices is also very worrisome for inflation hawks, at least for the first half of 2019. Oil has fallen 26% since its October peak, but also, after rising nearly 90% from April to August, the Baltic Dry index has tumbled by nearly 45%. Another risk could exacerbate these deflationary forces: the Chinese yuan. The Chinese authorities are afraid of the potentially deeply negative impact on their economy of a trade war with the U.S. As a result, they have slowly been injecting monetary stimulus into the economy and are also adjusting fiscal policy to support the Chinese consumer. However, until now, these measures have not been enough to lift Chinese growth and investment. Chinese interest rates are thus likely to continue to lag behind U.S. rates. Deeper cuts to the reserve requirement ratio for commercial banks are also forthcoming. Historically, these developments have been associated with a weaker renminbi (Chart I-9). Chart I-9A Falling CNY Will Further Curtail Inflation
A Falling CNY Will Further Curtail Inflation
A Falling CNY Will Further Curtail Inflation
A softening CNY is deflationary for the world for three reasons: It decreases the purchasing power of China abroad; it cuts Chinese export prices; and it forces competitors to China to also lower their prices and let their currencies depreciate in order to maintain their own competitiveness in international markets. In other words, a falling yuan unleashes China's own deflationary forces onto the rest of the world. Bottom Line: While momentum has already been a tailwind for the dollar, now the global economy is likely to enter the quadrant where both growth and inflation decelerate. This means the greenback is likely to pick up an additional strong tailwind. Stay long the dollar. Nightrain Based on this analysis, the first half of 2019 could be very positive for the dollar. The Bottom left quadrant of Chart I-3 implies that EUR/USD is unlikely to suffer the greatest downside. Nonetheless, based on our preferred fair-value model for the euro - which is based on real short-rate differentials, yield curve slope differences, and the price of lumber relative to copper - the common currency needs to move below 1.1 before trading at a discount (Chart I-10). We expect the euro will settle between 1.10 and 1.05. Chart I-10EUR/USD Will Fall Below 1.1
EUR/USD Will Fall Below 1.1
EUR/USD Will Fall Below 1.1
If business cycle analysis is any guide, the dollar should shine most brightly against commodity currencies - the AUD and NZD in particular - and Scandinavian currencies. We closed our long NZD trades last week, and this week's analysis implies completely curtailing our positive bias toward the kiwi. Positive domestic economic results have lifted the AUD, but slowing global growth and inflation will hurt this very pro-cyclical economy. A key support for the expensive AUD will dissipate as quickly as it appeared. We had sold CAD/NOK, but this trade is not panning out. Global business cycle dynamics suggest that we should terminate this bet. Slowing global growth and inflation historically hurt the NOK more than the CAD. As Chart I-11 shows, under these circumstances, CAD/NOK does not depreciate, it appreciates. However, we remain committed to our long-term short AUD/CAD trade. This cross performs poorly in this quadrant of the global business cycle. This view is reinforced by the fact that Robert Ryan, BCA's head of commodities, continues to favor energy over base metals. Furthermore, the Canadian government unveiled C$14billion of corporate tax cuts this week, creating a marginal additional positive for the Canadian economy. We therefore do not expect AUD/CAD to break above the important technical resistance it currently faces. Instead, it is likely to embark on the last leg of a downtrend started in March 2017, which could culminate with AUD/CAD trading between 0.88 and 0.86 (Chart I-12). Chart I-11The Global Business Cycle Votes Nay To Short CAD/NOK, But Yea To Long AUD/CAD
Appetite For Destruction? FX Investing For Slowing Global Growth And Inflation
Appetite For Destruction? FX Investing For Slowing Global Growth And Inflation
Chart I-12Attractive Spot To Sell AUD/CAD
Attractive Spot To Sell AUD/CAD
Attractive Spot To Sell AUD/CAD
The yen is potentially the trickiest of all the currencies. At face value, the global business cycle analysis suggests the yen could depreciate against the dollar, but as we argued, this is an artefact of the long sample used in this analysis. A shorter sample would show the yen appreciating against the dollar. We are inclined to agree with this conclusion. Slowing global growth and inflation as well as a strong trade-weighted dollar could very well put a bid under the price of Treasury bonds over the next few months, especially as speculators are still large sellers of the whole U.S. government bond universe (Chart I-13). Since the yen remains broadly inversely correlated to Treasury yields, it may appreciate against the dollar over the coming three to six months. Chart I-13Extreme Positioning And A Poor Global Business Cycle Outlook Point To A Tactical Rally In Treasurys...
Extreme Positioning And A Poor Global Business Cycle Outlook Point To A Tactical Rally In Treasurys...
Extreme Positioning And A Poor Global Business Cycle Outlook Point To A Tactical Rally In Treasurys...
Our view has been and remains that the yen offers its most attractive reward-to-risk ratio on its crosses, not against the U.S. dollar. The business cycle analysis confirms that the yen has upside against all the other currencies when both global growth and inflation slows (Chart I-3, bottom left quadrant). The yen should, therefore, offer plentiful upside against the AUD, the NZD, the SEK and the NOK. Moreover, since the beginning of the year, a core view of this publication has been that EUR/JPY would depreciate4 - a trend that has materialized, albeit in a volatile fashion. Since the global business cycle is likely to put downward pressure on global yields for another three to six months, it should also push EUR/JPY lower (Chart I-14). Hence, a move in EUR/JPY below 120 is likely over the coming months. Chart I-14...Which Will Hurt EUR/JPY
...Which Will Hurt EUR/JPY
...Which Will Hurt EUR/JPY
Bottom Line: While EUR/USD could fall slightly below 1.1, the greenback is likely to experience its sharpest upside against the AUD, NZD, SEK and NOK. While selling CAD/NOK does not work when global growth and inflation decelerate, selling AUD/CAD does. The JPY is likely to experience more upside against the dollar, but the JPY is most attractive against commodity currencies and the euro. Mathieu Savary, Vice President Foreign Exchange Strategy mathieu@bcaresearch.com Footnotes 1 Please see Foreign Exchange Strategy Special Report, titled "Riding The Wave: Momentum Strategies In Foreign Exchange Markets", dated December 8, 2017, available at fes.bcaresearch.com 2 Please see Foreign Exchange Strategy Weekly Report, titled "Six Questions From The Road", dated November 16, 2018, available at fes.bcaresearch.com 3 Please see Foreign Exchange Strategy Weekly Report, titled "Clashing Forces: The Fed And EM Financial Conditions", dated October 19, 2018, available at fes.bcaresearch.com 4 Please see Foreign Exchange Strategy Weekly Report, titled "The Unstoppable Euro?", dated January 19, 2018, and Foreign Exchange Strategy Weekly Report, titled "The Yen's Mighty Rise Continues", dated February 16, 2018, available at fes.bcaresearch.com Currencies U.S. Dollar Chart II-1USD Technicals 1
USD Technicals 1
USD Technicals 1
Chart II-2USD Technicals 2
USD Technicals 2
USD Technicals 2
Recent data in the U.S. has been mixed: Capacity utilization came in above expectations, coming in at 78.4%. However, both initial jobless claims and continuing jobless claims surprised negatively, coming in at 224 thousand and 1.688 million. Finally, durable goods orders also disappointed expectations DXY has been roughly flat this week. Several indicators point to a slowdown on economic data. At face value this could imply that the dollar could fall. However, falling oil prices, point to a slowdown in global inflation. This factor, alongside slowing global growth has historically been very positive for the U.S. dollar. Thus, we maintain our long dollar position. Report Links: Six Questions From The Road - November 16, 2018 Updating Our Intermediate Timing Models - November 2, 2018 In Fall, Leaves Turn Red, The Dollar Turns Green - October 12, 2018 The Euro Chart II-3EUR Technicals 1
EUR Technicals 1
EUR Technicals 1
Chart II-4EUR Technicals 2
EUR Technicals 2
EUR Technicals 2
Recent data in the euro area has been mixed: Both core and headline inflation came in line with expectations, coming in at 1.1% and 2.2%, respectively. Headline inflation in Italy also came in line with expectations, at 1.6%. EUR/USD has risen by roughly 0.5% this week. Overall, we continue to be bearish on the euro, given that we expect an environment of declining growth and inflation, which usually is negative for EUR/USD. Moreover, large exposure to vulnerable emerging markets by European banks will continue to be a drag on how much the ECB can tighten policy. Report Links: Six Questions From The Road - November 16, 2018 Evaluating The ECB's Options In December - November 6, 2018 Updating Our Intermediate Timing Models - November 2, 2018 The Yen Chart II-5JPY Technicals 1
JPY Technicals 1
JPY Technicals 1
Chart II-6JPY Technicals 2
JPY Technicals 2
JPY Technicals 2
Recent data in Japan has been mixed: The All Industry Activity Index monthly change underperformed expectations, coming in at -0.9%. Meanwhile, national inflation ex-fresh food came in line with expectations at 1%. Finally, national inflation also came in line with expectations, coming in at 1.4%. USD/JPY has been flat this week. We remain positive on the trade-weighted yen, given that the continued slowdown in global growth, fueled by the dual tightening of policy by Chinese authorities and the Fed, will help safe haven currencies like the yen. Moreover, the current selloff in U.S. markets could also provide a boon for this currency if it forces the Fed to tamper its hawkishness. Report Links: Updating Our Intermediate Timing Models - November 2, 2018 Will Rising Wages Cause An Imminent Change In Policy Direction In Europe And Japan? - October 5, 2018 Rhetoric Is Not Always Policy - July 27, 2018 British Pound Chart II-7GBP Technicals 1
GBP Technicals 1
GBP Technicals 1
Chart II-8GBP Technicals 2
GBP Technicals 2
GBP Technicals 2
GBP/USD has risen by 0.9% this week. The market reacted positively to the draft of the Brexit agreement. Even if risks have begun to decline, the all clear for the pound has not been reached as political risks will continue to regularly inject doses of volatility into British assets. Moreover, the strength in the dollar should continue to weigh on cable. Report Links: Six Questions From The Road - November 16, 2018 Updating Our Intermediate Timing Models - November 2, 2018 Clashing Forces: The Fed And EM Financial Conditions - October 19, 2018 Australian Dollar Chart II-9AUD Technicals 1
AUD Technicals 1
AUD Technicals 1
Chart II-10AUD Technicals 2
AUD Technicals 2
AUD Technicals 2
AUD/USD has been flat this week. We are most negative on this currency within the G10, given that the AUD is highly sensitive to the Chinese industrial cycle, which will continue to slow down, as Chinese authorities keep cleaning credit excesses in the economy. Moreover, policy tightening by the Fed will provide a further headwind to cyclical plays like the AUD. We are short AUD/CAD within our portfolio, as we believe that global inflation will start to roll over. This deceleration in prices, coupled with slowing growth will provide a dangerous cocktail for this cross. Report Links: Updating Our Intermediate Timing Models - November 2, 2018 Policy Divergences Are Still The Name Of The Game - August 14, 2018 What Is Good For China Doesn't Always Help The World - June 29, 2018 New Zealand Dollar Chart II-11NZD Technicals 1
NZD Technicals 1
NZD Technicals 1
Chart II-12NZD Technicals 2
NZD Technicals 2
NZD Technicals 2
NZD/USD has been flat this week. While we were positive the NZD and capitalized on this view, we are becoming more cautious. We cannot rule out any further short-term upside, but on a six month basis, the NZD will likely experience heavy downside, as slowing global growth and inflation are major hurdles for this currency. Report Links: Updating Our Intermediate Timing Models - November 2, 2018 Clashing Forces: The Fed And EM Financial Conditions - October 19, 2018 In Fall, Leaves Turn Red, The Dollar Turns Green - October 12, 2018 Canadian Dollar Chart II-13CAD Technicals 1
CAD Technicals 1
CAD Technicals 1
Chart II-14CAD Technicals 2
CAD Technicals 2
CAD Technicals 2
USD/CAD has risen by 0.6% this week. The weakness in oil prices have caused the Canadian dollar to be one of the worst performing currencies in the G10 in recent weeks. We are reticent to be too bullish on the CAD, given that markets are now pricing in a BoC that will be more hawkish than the Fed. Nonetheless the CAD tends to outperform other commodity currencies when the global business cycle slows. Report Links: Updating Our Intermediate Timing Models - November 2, 2018 Clashing Forces: The Fed And EM Financial Conditions - October 19, 2018 Updating Our Long-Term FX Fair Value Models - June 22, 2018 Swiss Franc Chart II-15CHF Technicals 1
CHF Technicals 1
CHF Technicals 1
Chart II-16CHF Technicals 2
CHF Technicals 2
CHF Technicals 2
EUR/CHF has fallen by 0.7% this week. While global volatility can temporarily support the swiss france versus the euro, w continue to be bearish on the franc on a 12 to 18 months basis, given that Swiss growth and inflation remain too tepid for the SNB to hike policy rates. This point is confirmed by the recent rollover in industrial production. Moreover, the SNB will also have to intervene in currency markets if the franc becomes more expensive in response to the current risk-off environment. Report Links: Updating Our Intermediate Timing Models - November 2, 2018 Updating Our Long-Term FX Fair Value Models - June 22, 2018 Updating Our Intermediate Timing Models - May 18, 2018 Norwegian Krone Chart II-17NOK Technicals 1
NOK Technicals 1
NOK Technicals 1
Chart II-18NOK Technicals 2
NOK Technicals 2
NOK Technicals 2
USD/NOK has risen by 0.4% this week. Overall, we expect for the krone to have further downside as oil continues to fall while U.S. rates continue to rise. Moreover, if the fall in oil prices causes a large fall in inflation the krone could depreciate even more against the CAD, as this cross has historically fallen when this particular set of circumstances occur. Report Links: Updating Our Intermediate Timing Models - November 2, 2018 Clashing Forces: The Fed And EM Financial Conditions - October 19, 2018 Updating Our Long-Term FX Fair Value Models - June 22, 2018 Swedish Krona Chart II-19SEK Technicals 1
SEK Technicals 1
SEK Technicals 1
Chart II-20SEK Technicals 2
SEK Technicals 2
SEK Technicals 2
USD/SEK has been flat this week. Overall, we are bullish on the krona on a long-term basis. After all, the Riksbank is on the verge of beginning a tightening cycle, as imbalances in the Swedish economy are only growing more dangerous. The optimism on domestic factors is tempered by global risks. The krona tends to perform very poorly when global growth slows, as Sweden is very exposed to the gyrations of the global economy. Report Links: Updating Our Intermediate Timing Models - November 2, 2018 Updating Our Long-Term FX Fair Value Models - June 22, 2018 Updating Our Intermediate Timing Models - May 18, 2018 Trades & Forecasts Forecast Summary Core Portfolio Tactical Trades Closed Trades
Highlights The relative performance of developed market (DM) versus emerging market (EM) equities just corresponds to the relative performance of healthcare versus financials. On a six month horizon, DM will underperform EM. Within Europe, overweight Poland, Hungary and Czech Republic, but steer clear of energy-heavy Russia. Wait for the 10-year BTP yield to move closer to 3 percent before buying Italian assets, either in absolute or relative terms. Buy the pound on any sharp sell-offs during the Brexit psychodrama. Our medium-term expected value of pound/euro equals 1.18. Chart of the WeekDeveloped Vs. Emerging Markets = Healthcare Vs. Financials
Developed Vs. Emerging Markets = Healthcare Vs. Financials
Developed Vs. Emerging Markets = Healthcare Vs. Financials
Feature They say that to capture the Zeitgeist at any moment, all you need to do is name the top five companies in the world. So here are the top five companies in the developed equity markets (DM): Apple, Microsoft, Google, Amazon, and Facebook (Table I-1). Table I-1Developed Markets: Top 5 Companies
DM Versus EM, And Two European Psychodramas
DM Versus EM, And Two European Psychodramas
These five names do perfectly capture the spirit of our time and should not surprise you. Now look at the top five companies in the emerging equity markets (EM): Tencent, Taiwan Semiconductor, Samsung Electronics, Alibaba, and Naspers (Table I-2). Table I-2Emerging Markets: Top 5 Companies
DM Versus EM, And Two European Psychodramas
DM Versus EM, And Two European Psychodramas
What may surprise you is that technology titans dominate in EM markets too. In fact, the technology sector's weighting in EM, at 25 percent, is even larger than in DM, at 19 percent. If technology looms even larger in EM than in DM, what is the defining sector difference between the two regions? The answer is that emerging markets have almost no healthcare stocks, and an offsetting substantial overweighting to financials (Table I-3). Table I-3Developed Markets Versus Emerging Markets: Sector Weights
DM Versus EM, And Two European Psychodramas
DM Versus EM, And Two European Psychodramas
Developed Vs. Emerging Markets = Healthcare Vs. Financials The following is a very different way of looking at the DM versus EM investment decision and, as such, may differ from the BCA house view. As we have demonstrated time and time again on these pages, an equity market's dominant sector skew is of critical importance to investors (Chart I-2). This is because equity sector skews almost always drive regional and country relative performance. Crucially, this fundamental truth applies at the highest level too: the relative performance of DM versus EM. The Chart of the Week should leave you in absolutely no doubt that the relative performance of DM versus EM just corresponds to the relative performance of healthcare versus financials. Chart I-2Developed Versus Emerging Markets: Sector Weight Differences
DM Versus EM, And Two European Psychodramas
DM Versus EM, And Two European Psychodramas
Nevertheless, this striking observation raises a fascinating question: what is the direction of causality? Does healthcare versus financials drive DM versus EM, or in fact does DM versus EM drive healthcare versus financials? The answer is sometimes the former, and at other times the latter. For example, a major slump in emerging economies would undoubtedly drag down global equities. In the ensuing synchronized bear market, the more defensive healthcare sector would almost certainly outperform the financials, and under these circumstances the direction of causality would clearly be from DM versus EM to global sector performance. On the other hand, absent a major bear market, if a reappraisal of sector relative valuations and growth prospects caused a rotation in sector leadership, the causality would run in the other direction: from global sector performance to DM versus EM. Such a reappraisal of sector relative valuations and growth prospects appears to be underway at the moment, and is likely to persist for the next few months. This is because the very sharp down-oscillation in global credit growth which occurred from February through September has now clearly flipped into an up-oscillation. For investors, these oscillations in global credit growth provide excellent tactical opportunities because the oscillations are very regular and therefore predictable; and the cyclical versus defensive sector performance closely tracks the oscillations. So after healthcare's strong outperformance versus financials from February through September, sector relative performance has now flipped into a reverse configuration (Chart I-3). Chart I-3An Up-Oscillation In Global Credit Growth Technically Favours Financials
An Up-Oscillation In Global Credit Growth Technically Favours Financials
An Up-Oscillation In Global Credit Growth Technically Favours Financials
To be clear, this is likely a tactical opportunity lasting no more than six months or so. Nevertheless, from a DM versus EM perspective, it would imply a countertrend move within a structural trend - in which the outperformance of DM versus EM temporarily ends, or even flips into an underperformance (Chart I-4). Chart I-4An Up-Oscillation In Global Credit Growth Technically Favours EM
An Up-Oscillation In Global Credit Growth Technically Favours EM
An Up-Oscillation In Global Credit Growth Technically Favours EM
For European equity investors, the important implication is that developed Europe versus emerging Europe closely tracks broad DM versus broad EM (Chart I-5). Of course, 'emerging Europe' is a misnomer because Poland, Hungary, Czech Republic, and even Russia are developed economies and markets. Nevertheless, as they fall within the MSCI EM index, they tend to move with EM. Chart I-5Developed Europe Vs. Emerging Europe = Developed Markets Vs. Emerging Markets
Developed Europe Vs. Emerging Europe = Developed Markets Vs. Emerging Markets
Developed Europe Vs. Emerging Europe = Developed Markets Vs. Emerging Markets
The upshot is that on a tactical horizon, emerging Europe is likely to outperform developed Europe. However, given our high conviction view that non-energy commodities will continue to outperform energy, focus on Poland, Hungary and Czech Republic and steer clear of energy-heavy Russia. European Psychodrama 1: Italy Vs. The EU In the low-level game of chicken between Italy and the EU Commission over Italy's 2019 budget, the bond market will determine who swerves first. If the 10-year BTP yield rises and stays well above 4 percent, the weakened capital position of Italian banks from lower bond prices combined with deteriorating funding conditions will weigh on bank lending and economic growth. This will put pressure on the Italian government to swerve first and concede ground to the EU's demands. That said, it is hard to know the exact level of yields at which the government would reach its pain threshold. On the other hand, if the 10-year BTP yield falls and stays well below 3 percent, the bond market's insouciance would embolden the Italian government. Moreover, this apparent vote of confidence would be based on sound economics. Italy likely has a very high fiscal multiplier, meaning that a modest increase in its budget deficit to 2.4 percent would more than pay for itself through higher economic growth. Under these circumstances the EU would be under pressure to swerve first and give Italy some room for manoeuvre. The long-term investment opportunity is the Italy versus Spain sovereign 10-year yield spread. At 200 bps, the spread is at its all-time widest, and incongruous with the vanishing gap between the non-performing loans ratios in Italy and Spain. Nevertheless, our recommendation is to wait for the 10-year BTP yield to move closer to 3 percent before buying Italian assets, either in absolute or relative terms (Chart I-6). Chart I-6Remain Neutral Italian Assets Until The 10-Year BTP Yield Moves Closer To 3 Percent
Remain Neutral Italian Assets Until The 10-Year BTP Yield Moves Closer To 3 Percent
Remain Neutral Italian Assets Until The 10-Year BTP Yield Moves Closer To 3 Percent
European Psychodrama 2: Brexit In the psychodrama called Brexit, every new plot twist and turn has the potential to move the pound up or down by a few cents in a day. The next such major twist is the passage of the withdrawal bill through the U.K. parliament in early December. The ultra Brexiteer Conservative MPs and Northern Ireland Unionists will almost certainly vote against the agreement that Theresa May has forged with Brussels. This is because the agreement conjures up the Brexiteers' worst nightmare: a potentially indefinite customs union with the EU27, making it impossible for the U.K. to strike free trade deals with the rest of the world. Hence, for Theresa May to get her agreement through parliament, she will require the support of a substantial number of Labour MPs. But the substantial numbers just aren't there. The upshot is that she is likely to lose the vote, at which point the pound will tumble. For medium-term investors, this would be the moment to buy the pound, and we now explain why. On a six month horizon, the crucial question is: what will happen when the Article 50 process for the U.K. to leave the EU expires at 11pm on March 29, 2019? There are only three possibilities: 1. The U.K. doesn't leave the EU. At this advanced stage on the timeline, not leaving the EU on March 29 2019 effectively means an extension of the Article 50 process. This would require the U.K. to apply for an extension, and for the EU27 to agree to it. But realistically, the EU27 would only agree to it to facilitate a general election and/or a second referendum which could reverse Brexit. Probability = 45%. With the parliamentary arithmetic pointing to a rejection of May's Brexit deal as it stands, an amendment to the withdrawal bill forcing a second referendum, or a lost vote of no confidence in the government could lead to this outcome. Pound/euro = 1.20, because of the realistic prospect of reversing Brexit (Chart I-7). Chart I-7British Public Opinion On Brexit Is Shifting
Long Emerging Markets Vs. Developed Markets
Long Emerging Markets Vs. Developed Markets
2. The U.K. enters a transition period to leave the EU with a negotiated agreement. Theresa May's proposed withdrawal deal, or a variation of it, is approved by the U.K parliament (and the EU27) Probability = 45%. Appropriate amendments to the withdrawal agreement might sufficiently reduce the parliamentary rebellion. Pound/euro = 1.20 because the removal of the 'no deal' outcome would liberate the BoE to hike interest rates. 3. The U.K. crashes out of the EU with 'no deal'. Probability = 10%. This outcome would be the result of a gridlock in the U.K. parliament, with no majority formed for any Brexit strategy. Unlikely, but not impossible. Pound/euro = 1.00 because the U.K. economy would face months of severe disruption and uncertainty. Based on these three possible outcomes on March 29 2019, our expected value of pound/euro equals 1.18. Meaning that any sharp sell-off during the ongoing psychodrama constitutes a medium-term buying opportunity. Dhaval Joshi, Senior Vice President Chief European Investment Strategist dhaval@bcaresearch.com Fractal Trading Model* Supporting the thesis in the main body of this report, the 130-day fractal dimension of EM versus DM recently hit its lower bound, suggesting an oversold extreme and a likely countertrend move. For a short-term trade, position for a 2.5% profit with a symmetrical stop-loss. In other trades, long Portugal / short Hungary hit its stop-loss and is closed, leaving four open trades. For any investment, excessive trend following and groupthink can reach a natural point of instability, at which point the established trend is highly likely to break down with or without an external catalyst. An early warning sign is the investment's fractal dimension approaching its natural lower bound. Encouragingly, this trigger has consistently identified countertrend moves of various magnitudes across all asset classes. Chart I-8
Long Emerging Markets Vs. Developed Markets
Long Emerging Markets Vs. Developed Markets
The post-June 9, 2016 fractal trading model rules are: When the fractal dimension approaches the lower limit after an investment has been in an established trend it is a potential trigger for a liquidity-triggered trend reversal. Therefore, open a countertrend position. The profit target is a one-third reversal of the preceding 13-week move. Apply a symmetrical stop-loss. Close the position at the profit target or stop-loss. Otherwise close the position after 13 weeks. Use the position size multiple to control risk. The position size will be smaller for more risky positions. * For more details please see the European Investment Strategy Special Report "Fractals, Liquidity & A Trading Model," dated December 11, 2014, available at eis.bcaresearch.com Fractal Trading Model Recommendations Asset Allocation Equity Regional and Country Allocation Equity Sector Allocation Bond and Interest Rate Allocation Currency and Other Allocation Closed Fractal Trades Trades Closed Trades Asset Performance Currency & Bond Equity Sector Country Equity Indicators Bond Yields Chart II-1Indicators To Watch - Bond Yields
Indicators To Watch - Bond Yields
Indicators To Watch - Bond Yields
Chart II-2Indicators To Watch - Bond Yields
Indicators To Watch - Bond Yields
Indicators To Watch - Bond Yields
Chart II-3Indicators To Watch - Bond Yields
Indicators To Watch - Bond Yields
Indicators To Watch - Bond Yields
Chart II-4Indicators To Watch - Bond Yields
Indicators To Watch - Bond Yields
Indicators To Watch - Bond Yields
Interest Rate Chart II-5Indicators To Watch - Interest Rate Expectations
Indicators To Watch - Interest Rate Expectations
Indicators To Watch - Interest Rate Expectations
Chart II-6Indicators To Watch - Interest Rate Expectations
Indicators To Watch - Interest Rate Expectations
Indicators To Watch - Interest Rate Expectations
Chart II-7Indicators To Watch - Interest Rate Expectations
Indicators To Watch - Interest Rate Expectations
Indicators To Watch - Interest Rate Expectations
Chart II-8Indicators To Watch - Interest Rate Expectations
Indicators To Watch - Interest Rate Expectations
Indicators To Watch - Interest Rate Expectations
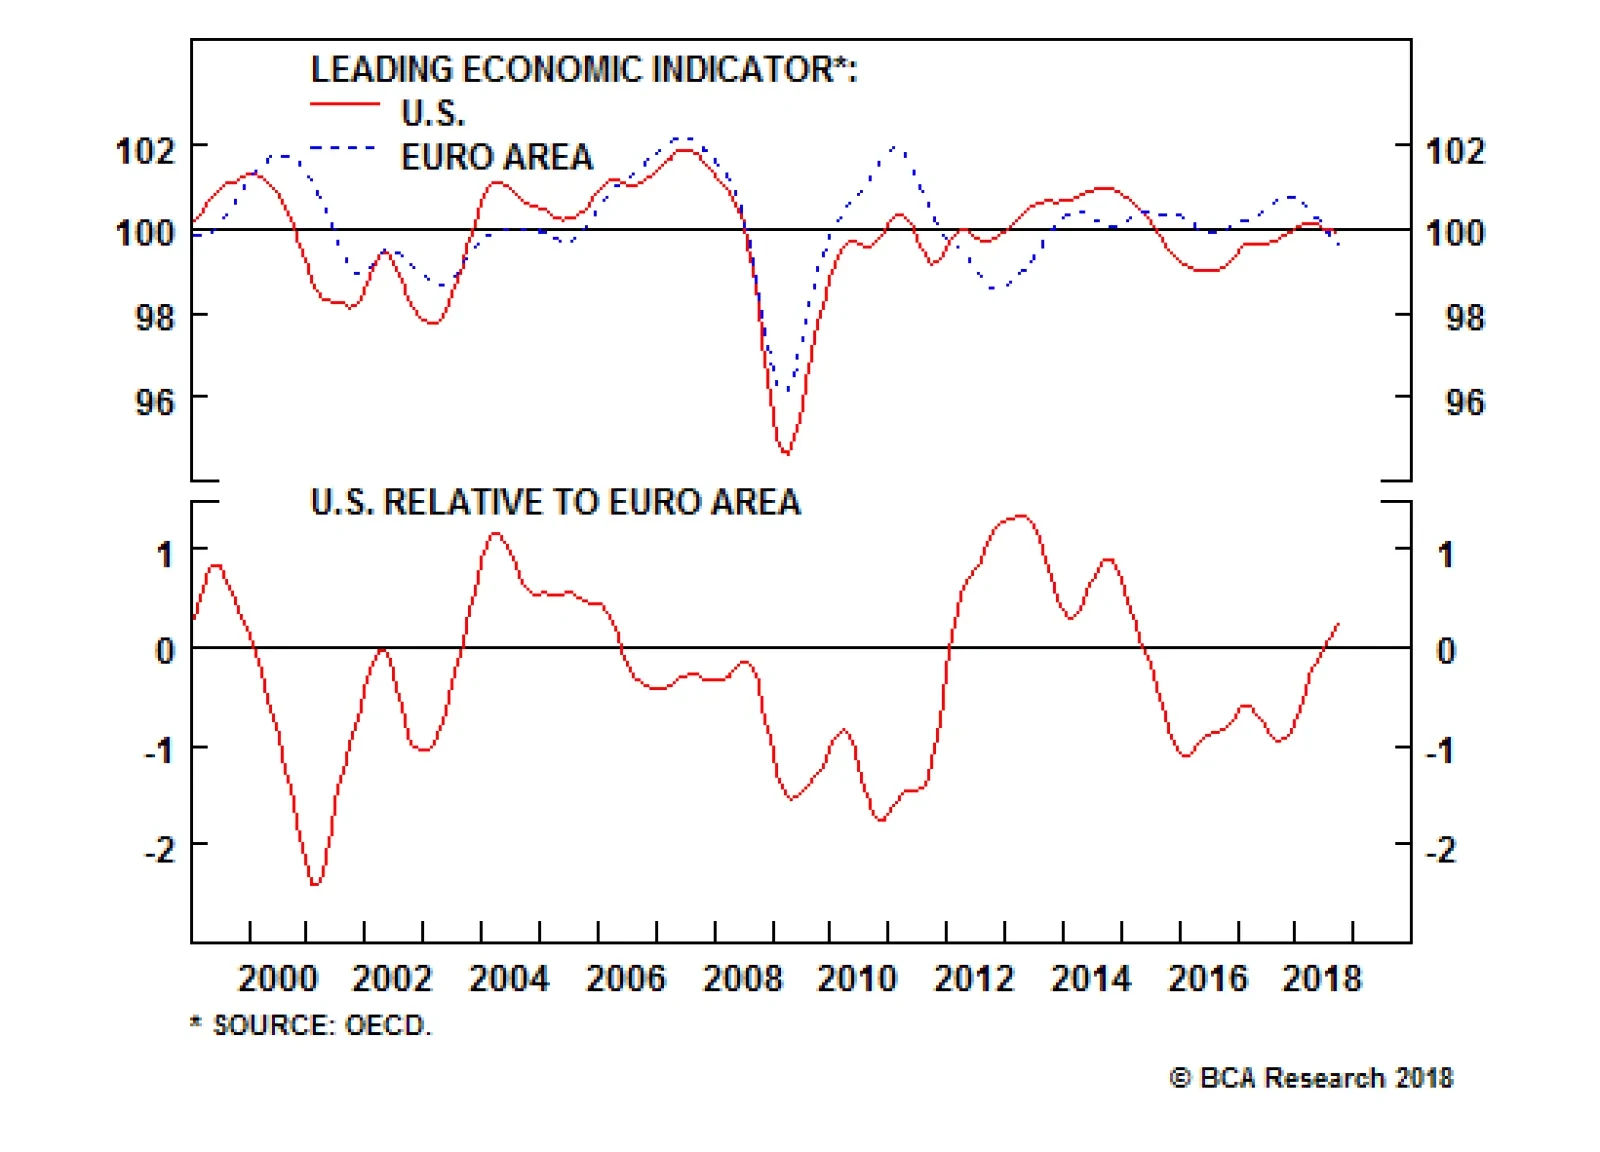
This past year has been a great one for the U.S. economy, particularly when compared to previous years in this cycle. However, the U.S. data has started to weaken lately. The corporate sector and housing market look most vulnerable. A strong dollar, higher…
Dear Client, Barring any major market developments, we will not be sending you a report next week. Instead, I will be working with my colleagues on BCA's Annual Outlook, which will be published on Monday, November 26. The outlook will feature a wide-ranging discussion with Mr. X and his daughter Ms. X on the key themes that we see shaping global markets in 2019. Best regards, Peter Berezin, Chief Global Strategist Highlights The stock market correction has further to run. We would turn more bullish if global equities were to drop another 8% from current levels. A mundane economic identity - savings minus investment equals the current account balance - provides deep market insight into the workings of the global economy. The U.S. economy is suffering from a shortage of savings, which will push up interest rates and the value of the dollar. In contrast, China has a surfeit of savings. Rectifying this will require a weaker yuan. The political impasse between the EU and Italy over next year's budget will be resolved. However, the fact that Italy lacks a readily available outlet for its excess private-sector savings could spell doom for the euro area down the road. Feature The Correction Ain't Over Our MacroQuant model continues to signal downside risks for global equities over the coming weeks (Chart 1). The model is flagging a deterioration in a variety of leading economic indicators, both in the U.S. and abroad, which tends to be bearish for stocks (Chart 2). Global financial conditions have also tightened since the summer due to the rise in government bond yields, higher credit spreads, and a firmer dollar. Chart 1MacroQuant* Model Suggests Caution Is Still Warranted
S-I=CA In The U.S., China, And Italy
S-I=CA In The U.S., China, And Italy
Chart 2Global Growth Indicators Are Deteriorating
Global Growth Indicators Are Deteriorating
Global Growth Indicators Are Deteriorating
Sentiment remains reasonably upbeat, a bearish contrarian indicator. The November Bank of America Merrill Lynch Global Fund Manager Survey revealed that a net 31% of managers were still overweight global stocks. Past major bottoms in 2008, 2011, 2012, and 2016 all saw equity allocations fall into underweight territory. Strikingly, EM allocations rose in November, with a net 13% of fund managers overweight the asset class. This is in stark contrast to 2015 when a net 30% of fund managers were underweight EM stocks. We do not expect the correction which began in October to morph into a full-fledged bear market. Nevertheless, the near-term path of least resistance for stocks remains to the downside. We would only upgrade global equities to overweight if the MSCI All-Country World index were to fall another 8% from current levels, consistent with a price of $64 on the ACWI ETF. At that level, the forward P/E on the index would be back to 2013 levels (Chart 3). Chart 3A Valuation Reset
A Valuation Reset
A Valuation Reset
A Key Macro Identity One of the first identities undergraduate economics students learn is S-I=CA: The difference between what a country saves and invests is equal to its current account balance.1 While it is easy to dismiss this identity as yet another abstract concept that only egghead economists would find interesting, it has real-world implications for investors of all stripes. To see this, it is useful to expand the identity a bit. Total savings is just the sum of private-sector and public-sector savings. Thus, we can write: Private-sector savings = fixed asset investment + government budget deficit + current account balance In other words, the savings that the private sector generates must either be recycled into investment, soaked up by the government through a budget deficit, or exported abroad via a current account surplus. This relationship always holds ex post. But what happens if it does not hold ex ante? Then "something" must adjust to make the relationship hold. In a normal environment, this "something" is interest rates. If there is a shortfall of private-sector savings - that is, if the right-hand side of the equation above exceeds the left-hand side - an increase in rates can restore the identity by encouraging private savings, discouraging investment, and potentially making it more difficult for the government to pursue an expansionary fiscal policy. Higher rates will also produce a stronger currency, leading to a deterioration in the current account balance. The exact opposite will happen if there is an excess of private-sector savings. What happens if there is excessive savings but the central bank cannot lower interest rates either because it lacks monetary independence - i.e., when a country has a currency peg - or because monetary policy is constrained by the zero lower bound on nominal short-term rates? In that case, employment will decline. One cannot save if one does not have a job that generates income. In practice, this can lead to a vicious circle where falling employment causes households to try to save more for precautionary reasons, while discouraging companies from investing in new capacity. The resulting increase in desired savings is likely to lead to further declines in employment. Keynes referred to this outcome as the paradox of thrift: A situation where one person's desire to save more leads to a collective decline in savings because aggregate income shrinks. Let's turn to what all this means for investors today. The U.S.: Trump's Fiscal Policy Is Inconsistent With His Trade Goals The IMF estimates that the U.S. cyclically-adjusted budget deficit will reach 5.6% of GDP next year. The results of the midterm elections are unlikely to change this outcome. While the takeover of the House of Representatives by the Democrats will preclude Congress from passing another round of tax cuts, our geopolitical strategists believe that there is a better than 50% chance that a bipartisan deal will be reached to increase infrastructure spending.2 They point out that Nancy Pelosi mentioned infrastructure five times during her election night address, without mentioning impeachment once. Recent data on U.S. capital spending has been on the soft side (Chart 4). Core capital goods orders have decelerated and capex intention surveys have come off their highs. Residential investment has also been weak, as reflected in declining housing starts and building permits. Chart 4Both Residential And Nonresidential Investment Have Softened
Both Residential And Nonresidential Investment Have Softened
Both Residential And Nonresidential Investment Have Softened
We would tend to fade the weakness in capital spending (Chart 5). The ISM industrial capacity utilization rate is near cycle highs. Rising wages will incentivize firms to substitute labor with capital, leading to more investment spending. The downside risk to home building is also limited, given that residential investment stands at only 3.9% of GDP, well below the high of 6.7% reached in 2005. If anything, the U.S. is not churning out enough fixed capital, as evidenced by the fact that the average age of the capital stock has risen swiftly over the past decade. As my colleague Doug Peta likes to say, you don't get hurt falling out of a basement window. Chart 5Running Out Of Spare Capacity
Running Out Of Spare Capacity
Running Out Of Spare Capacity
Meanwhile, the personal savings rate stands at over 6%, significantly higher than what one would expect based on its typical relationship with household net worth (Chart 6). Chart 6U.S. Household Savings Rate Is High Relative To Wealth
S-I=CA In The U.S., China, And Italy
S-I=CA In The U.S., China, And Italy
The identity described at the outset of this report implies that the trade balance will necessarily deteriorate if the savings rate falls, investment rises, and the budget deficit remains elevated. If President Trump strikes a trade deal with China, he will have no one to blame for a larger U.S. trade deficit. Hence, he has little incentive to make a deal. Protectionism remains popular in the U.S. Midwest, the battleground on which the next presidential election will be fought. Democrat Sherrod Brown won the Ohio Senate race by 6.4% - a state that Trump carried by 8.1% - on a highly protectionist platform. Trump simply cannot afford to go soft on one of his signature issues. China: What To Do With Excess Savings? The slowdown in Chinese growth this year has been concentrated in domestic demand (Chart 7). Exports have held up well. In fact, Chinese exports to the U.S. are up 13% in dollar terms in the first ten months of the year compared with the same period last year. Chart 7China's Domestic Economy Is Weakening
China's Domestic Economy Is Weakening
China's Domestic Economy Is Weakening
Unfortunately, judging from the steep drop in the export component of the Chinese manufacturing PMI, exports are likely to come under increasing pressure over the coming months (Chart 8). This makes it all the more important for the Chinese authorities to prop up domestic growth. Chart 8China's Export Outlook Is Dire
China's Export Outlook Is Dire
China's Export Outlook Is Dire
China has historically stimulated its economy through debt-financed fixed-investment spending (Chart 9). This made eminent sense when China needed more factories, infrastructure, and modern housing. However, now that China has all this in spades, it is looking for different stimulus options. Chart 9China: Debt And Capital Accumulation Have Gone Hand In Hand
China: Debt And Capital Accumulation Have Gone Hand In Hand
China: Debt And Capital Accumulation Have Gone Hand In Hand
Our formula reveals what those other options must be. If China wants to reduce investment spending to a more sustainable level, it must either boost consumption, increase the fiscal deficit, or raise net exports. Given a hostile export backdrop, it is therefore no surprise that the Chinese government has been cutting taxes, increasing social transfer payments, and letting the currency slide. The problem is that none of these other forms of stimulus are beneficial to the rest of the world, and in some cases, they may be quite detrimental. The rest of the world relies on Chinese investment, not Chinese consumption. Raw materials and capital goods comprise 80% of Chinese imports. China represents close to half of the world's demand for aluminum, copper, zinc, nickel, and steel (Chart 10). Whether it be services or manufactured goods, what Chinese households consume is generally produced in China. Chart 10China Is The Predominant Source Of Global Demand For Metals
China Is The Predominant Source Of Global Demand For Metals
China Is The Predominant Source Of Global Demand For Metals
A weaker yuan will make the Chinese economy more competitive, but at the expense of other emerging markets. A weaker yuan will also raise the price of imported goods, leading to a lower volume of imports. The implication is that both the magnitude and composition of China's stimulus may disappoint. This week's much weaker-than-expected credit and money data - new CNY loans clocked in at RMB 697 billion in October, well below consensus expectations of RMB 905 billion - validates this view. Italy: Getting To "Yes" Is The Easy Part The showdown between Italy's populist leaders and the EU continues. The Lega-Five Star coalition government promised big tax cuts and generous increases in social spending. It is loath to backtrack on its campaign pledges so soon after the election. As long as there is no contagion from Italy to the rest of Europe, the EU has no incentive to back off. While it will never admit it, the EU establishment would love nothing more than to humiliate the Italians in order to dissuade voters across Europe from electing populist politicians. In the end, we expect the Italian government to give in to the EU's demands. Business confidence has plunged (Chart 11). The economy is again teetering on the brink of recession. Italy's banking system would be technically insolvent if the ten-year BTP yield were to rise above 4% based on a mark-to-market accounting of Italian bank holdings of government debt. Chart 11Italy: Is The Economy Heading For Another Dip?
Italy: Is The Economy Heading For Another Dip?
Italy: Is The Economy Heading For Another Dip?
A political resolution to the ongoing crisis would provide short-term relief. However, it may not solve Italy's problems - indeed, it could exacerbate them. Italy's working-age population is shrinking (Chart 12). This has made companies reluctant to expand capacity. Meanwhile, households are busily saving for retirement. Their motivation to save more would only be amplified by the cuts to pension benefits that the previous caretaker government promised and that the EU is insisting be implemented. The overall private-sector financial balance - the difference between what the private sector saves and invests - reached a surplus of 5.1% of GDP in 2017 (Chart 13). Chart 12The Italian Workforce Is Shrinking
S-I=CA In The U.S., China, And Italy
S-I=CA In The U.S., China, And Italy
Chart 13Italy: Private Sector Saves Too Much And Spends Too Little
Italy: Private Sector Saves Too Much And Spends Too Little
Italy: Private Sector Saves Too Much And Spends Too Little
Our formula shows that counterbalancing this private-sector surplus will require a persistent government fiscal deficit or current account surplus. Italy's primary budget balance - its overall budget balance excluding interest payments - hit 1.7% of GDP in 2017 (Chart 14). This primary surplus is necessary to cover the 3.6% of GDP in interest payments that the government has to make, a number that will only rise if the ECB raises rates (hence, our high-conviction view that the ECB will have to keep rates low for years to come). Chart 14Italy Needs A Primary Budget Surplus
Italy Needs A Primary Budget Surplus
Italy Needs A Primary Budget Surplus
Italy runs a modest current account surplus of 2% of GDP. However, its current account balance would be far smaller, and perhaps even negative, if the economy were operating at full employment since stronger domestic demand would suck in more imports. Italy would love to copy Germany, a country which habitually over-saves but exports its excess savings to the rest of the world through a gargantuan 8% of GDP current account surplus. Alas, achieving a larger current account surplus would require either a currency depreciation or productivity-enhancing structural reforms. The former is impossible as long as Italy is a member of the euro area, while the latter has proven to be wishful thinking for as long as people have talked about it. We do not expect Italy to default on its debt or jettison the euro in the near term. But when the next synchronized global downturn arrives - probably in about two years or so - all hell could break loose. Concluding Thoughts An economy facing a shortfall in savings is one where desired spending exceeds income. When the economy has spare capacity, such a savings shortfall is a good thing; it means more demand, more employment, and ultimately, more income. However, once spare capacity is soaked up, a shortage of savings will lead to higher inflation. The U.S. finds itself in the latter situation today. The output gap is fully closed, but growth remains above trend. As we have discussed in past reports, the Fed is likely to raise rates more than the market expects.3 This will lead to higher Treasury yields and a stronger dollar. With that in mind, we are raising our end-year target on our long DXY trade recommendation from 98 to 100, implying another 3% increase from current levels. In the absence of offsetting Chinese stimulus, a stronger dollar will put further pressure on emerging markets. EM equities will likely bottom in the first half of next year once the dollar peaks and global growth stabilizes. Until then, investors should overweight DM stocks relative to their EM peers. Peter Berezin, Chief Global Strategist Global Investment Strategy peterb@bcaresearch.com 1 National savings, S, is equal to Y-C-G, where Y is national income and C and G are household and government consumption, respectively. Substituting this identity into the standard Y=C+I+G+X-M equation yields S-I=X-M. National income includes net foreign earnings. In this case, the trade balance, X-M, is equal to the current account balance. 2 Please see Geopolitical Strategy Special Report, "The 2020 U.S. Election: A "Way Too Soon" Forecast," dated November 7, 2018. 3 Please see Global Investment Strategy Weekly Report, "Bond Bears Maul Goldilocks," dated October 12, 2018; and "The Next U.S. Recession: Waiting For Godot?" dated October 5, 2018. Strategy & Market Trends Tactical Trades Strategic Recommendations Closed Trades
Highlights Bond yields have trapped equities, and equities have trapped bond yields. The double-digit investment opportunities are within asset-classes. From a tactical perspective: Banks will outperform the broad market. EM will outperform DM. The Eurostoxx50 will briefly outperform the S&P500. Raw industrial commodities will outperform crude oil. Feature What has been the biggest driver of financial markets this year? Trade wars and the emerging market slowdown? The budget spat between Italy and the EU Commission? The U.S. mid-term elections? Or perhaps, central bank policy normalization? These are all sensible answers, and each one has generated endless output of commentary and analysis. But none of these tells the biggest story of 2018. Chart of the WeekIn 2018, Bond Yields Have Trapped Equities, And Equities Have Trapped Bond Yields
In 2018, Bond Yields Have Trapped Equities, And Equities Have Trapped Bond Yields
In 2018, Bond Yields Have Trapped Equities, And Equities Have Trapped Bond Yields
The Biggest Story Is Not Economics Or Politics... It Is Mathematics This year, the two largest five-day plunges in the global stock market - 6 percent in February and 7 percent in mid-October - resulted directly from the two largest five-day spikes in the global bond yield (Chart I-2 and Chart I-3). This simple observation reveals the biggest story in the financial markets this year: the hypersensitivity of the stock market to rising bond yields, and especially when the global 10-year yield approaches 2 percent - or equivalently 'the rule of 4': when the sum of the 10-year U.S. T-bond, German bund and Japanese government bond approaches 4 percent (Chart of the Week).1 Chart I-2Equities Plunged In February After A Spike In Bond Yields
Equities Plunged In February After A Spike In Bond Yields
Equities Plunged In February After A Spike In Bond Yields
Chart I-3Equities Plunged In October After A Spike In Bond Yields
Equities Plunged In October After A Spike In Bond Yields
Equities Plunged In October After A Spike In Bond Yields
With the global stock market now flat year-to-date, it follows that excluding these two five-day plunges, global equities would be comfortably higher even with the emerging market slowdown, trade war quarrels, and political spats. Meaning that this year's market action is not explained by economics or by politics. It is explained by mathematics, and specifically the great misunderstanding of investment risk. Previous reports have focused on this great misunderstanding, most recently Risk: The Great Misunderstanding Of Finance, to which we refer our readers. Here, we will just summarize:2 An investment's risk depends on the negative asymmetry of its short-term returns. At very low bond yields, bond returns develop the same negative asymmetry as equity returns. This means that equities lose their excess riskiness versus bonds, requiring equity valuations to experience a phase transition sharply higher. But when bond yields normalize, equities regain their excess riskiness versus bonds - and their valuations must suffer a phase transition sharply lower. This phase transition to sharply lower equity valuations is most pronounced when the global 10-year bond yield rises to 2 percent. This dynamic has proved to be the biggest driver of financial markets in 2018, and is likely to be the biggest driver in 2019 too. Essentially, higher bond yields can suddenly and viciously undermine the valuation support of equities, limiting the upside in the stock market (Chart I-4). In turn, a plunge in the stock market and other risk-assets threatens a disinflationary impulse, limiting the sustainable upside in bond yields. Chart I-4Equities Remain Richly Valued
Equities Remain Richly Valued
Equities Remain Richly Valued
In effect, bond yields have trapped equities, and equities have trapped bond yields (Chart I-5). The result is that in 2018 the global asset-classes: equities, bonds, commodities, and cash have all ended up going nowhere. Indeed, the global 30-year bond yield has been trapped since early 2017!3 Chart I-5The Global 30-Year Bond Yield Has Been Trapped For Two Years
The Global 30-Year Bond Yield Has Been Trapped For Two Years
The Global 30-Year Bond Yield Has Been Trapped For Two Years
The Double-Digit Investment Opportunities Are Within Asset-Classes Although the global asset-classes have ended up going nowhere this year (Chart I-6), 2018 has still provided double-digit investment opportunities. But to find these double-digit opportunities, you have to look below the main asset allocation decision to within the asset-classes, in sector, region and country allocation. Chart I-6In 2018, Global Asset-Classes Have Ended Up Going Nowhere
In 2018, Global Asset-Classes Have Ended Up Going Nowhere
In 2018, Global Asset-Classes Have Ended Up Going Nowhere
For example, until very recently: banks had underperformed the broad equity market by 10 percent globally and 25 percent in Europe; emerging market equities had underperformed developed market equities by 15 percent; the Eurostoxx50 had underperformed the S&P500 by 13 percent; and raw industrial commodities had underperformed crude oil by 30 percent. But in the last month or so, these strong trends have exhausted and even started to reverse: banks have started to outperform the market; the Eurostoxx50 has eked ahead of the S&P500; emerging market equities have retraced versus developed market equities; and raw industrial commodities have made up much lost ground on crude oil (Charts I-7 - Chart I-10). One important reason is that the sharp down-oscillation in global credit growth which was responsible for many of this year's intra asset-class trends has now clearly rebounded into an up-oscillation. Chart I-7Banks Have Started To Outperform
Banks Have Started To Outperform
Banks Have Started To Outperform
Chart I-8The Eurostoxx50 Is Starting To Outperform The S&P500
The Eurostoxx50 Is Starting To Outperform The S&P500
The Eurostoxx50 Is Starting To Outperform The S&P500
Chart I-9EM Has Started To Outperform DM
EM Has Started To Outperform DM
EM Has Started To Outperform DM
Chart I-10Industrial Commodities Are Starting To Outperform Crude Oil
Industrial Commodities Are Starting To Outperform Crude Oil
Industrial Commodities Are Starting To Outperform Crude Oil
Hence, we expect these trend reversals to continue in the coming months. From a tactical perspective only, this means: 1. Banks will outperform the broad market. 2. EM will outperform DM. 3. The Eurostoxx50 will briefly outperform the S&P500. 4. Raw industrial commodities will outperform crude oil. Such an inflection point can leave investors scratching their heads in confusion, because sector performances seem to conflict with the economic data releases. But the conflict is easily resolved. Though we are now in mid-November, the economic data releases - for example, German exports - are a lagging indicator, referring to a time in the past, September, when global credit growth might still have been in a down-oscillation. Whereas the financial markets - for example, bank equities' relative performance - are a contemporaneous indicator, sensing credit growth's switch to an up-oscillation in real-time. Always remember that market prices move on the marginal change in information and expectations. To be absolutely clear, we are not referring to the business cycle. We are referring to predictable oscillations in credit growth that occur within the business cycle, but which nevertheless create double-digit investment opportunities - such as bank equities' relative performance. The Importance Of 6-Month Credit Growth Still, several clients have asked about our choice of 6-month credit growth, as it appears to be an arbitrary period plucked out of thin air or, more cynically, 'data-mined'. In fact, our choice of 6-month growth has a rock-solid foundation in economic theory.4 For any item, if supply lags demand by a period t, then economic theory proves that both the quantity of the item and its price will experience oscillations with half-cycle length t. Clearly, bank credit is such an item whose supply does lag demand. For example, a mortgage is only allocated and released after a time-consuming process of checking collateral and creditworthiness. For bank credit in aggregate, the lag between demand and supply, and specifically final spending of the funds, averages six to eight months. Once you accept this fundamental truth, it follows that credit growth must also experience oscillations whose half-cycles last six to eight months. So we end with a very important investment lesson. If you only look at the conventionally examined year-on-year credit growth data, you will not see the predictable oscillations in 6-month credit growth. And if you do not look at 6-month credit growth, you will miss the double-digit investment opportunities that are always on offer (Chart I-11). Chart I-11A Sharp Down-Oscillation In Global Credit Growth Has Rebounded Into An Up-Oscillation
A Sharp Down-Oscillation In Global Credit Growth Has Rebounded Into An Up-Oscillation
A Sharp Down-Oscillation In Global Credit Growth Has Rebounded Into An Up-Oscillation
The choice is yours. Dhaval Joshi, Senior Vice President Chief European Investment Strategist dhaval@bcaresearch.com 1 We use the MSCI All Country World Index in local currency terms to capture the global stock market. 2 Negative asymmetry of returns means the possibility of larger short-term losses than short-term gains. Please see the European Investment Strategy Weekly Report, "Risk: The Great Misunderstanding Of Finance", October 25, 2018 available at eis.bcaresearch.com. 3 Please see the European Investment Strategy Weekly Report, "Trapped: Have Equities Trapped Bonds?", September 13, 2018 available at eis.bcaresearch.com. 4 Please see the European Investment Strategy Special Report, "The Cobweb Theory And Market Cycles", January 11, 2018 available at eis.bcaresearch.com. Fractal Trading Model* Palladium has outperformed nickel by 50% in the past three months, but this strong trend is nearing exhaustion according to its 65-day fractal dimension. Hence, this week's trade recommendation is long nickel/short palladium setting a profit target of 14% with a symmetrical stop-loss. For any investment, excessive trend following and groupthink can reach a natural point of instability, at which point the established trend is highly likely to break down with or without an external catalyst. An early warning sign is the investment's fractal dimension approaching its natural lower bound. Encouragingly, this trigger has consistently identified countertrend moves of various magnitudes across all asset classes. Chart I-12
Long Platinum / Short Nickel
Long Platinum / Short Nickel
The post-June 9, 2016 fractal trading model rules are: When the fractal dimension approaches the lower limit after an investment has been in an established trend it is a potential trigger for a liquidity-triggered trend reversal. Therefore, open a countertrend position. The profit target is a one-third reversal of the preceding 13-week move. Apply a symmetrical stop-loss. Close the position at the profit target or stop-loss. Otherwise close the position after 13 weeks. Use the position size multiple to control risk. The position size will be smaller for more risky positions. * For more details please see the European Investment Strategy Special Report "Fractals, Liquidity & A Trading Model," dated December 11, 2014, available at eis.bcaresearch.com Fractal Trading Model Recommendations Asset Allocation Equity Regional and Country Allocation Equity Sector Allocation Bond and Interest Rate Allocation Currency and Other Allocation Closed Fractal Trades Trades Closed Trades Asset Performance Currency & Bond Equity Sector Country Equity Indicators Bond Yields Chart II-1Indicators To Watch - Bond Yields
Indicators To Watch - Bond Yields
Indicators To Watch - Bond Yields
Chart II-2Indicators To Watch - Bond Yields
Indicators To Watch - Bond Yields
Indicators To Watch - Bond Yields
Chart II-3Indicators To Watch - Bond Yields
Indicators To Watch - Bond Yields
Indicators To Watch - Bond Yields
Chart II-4Indicators To Watch - Bond Yields
Indicators To Watch - Bond Yields
Indicators To Watch - Bond Yields
Interest Rate Chart II-5Indicators To Watch - Interest Rate Expectations
Indicators To Watch - Interest Rate Expectations
Indicators To Watch - Interest Rate Expectations
Chart II-6Indicators To Watch - Interest Rate Expectations
Indicators To Watch - Interest Rate Expectations
Indicators To Watch - Interest Rate Expectations
Chart II-7Indicators To Watch - Interest Rate Expectations
Indicators To Watch - Interest Rate Expectations
Indicators To Watch - Interest Rate Expectations
Chart II-8Indicators To Watch - Interest Rate Expectations
Indicators To Watch - Interest Rate Expectations
Indicators To Watch - Interest Rate Expectations
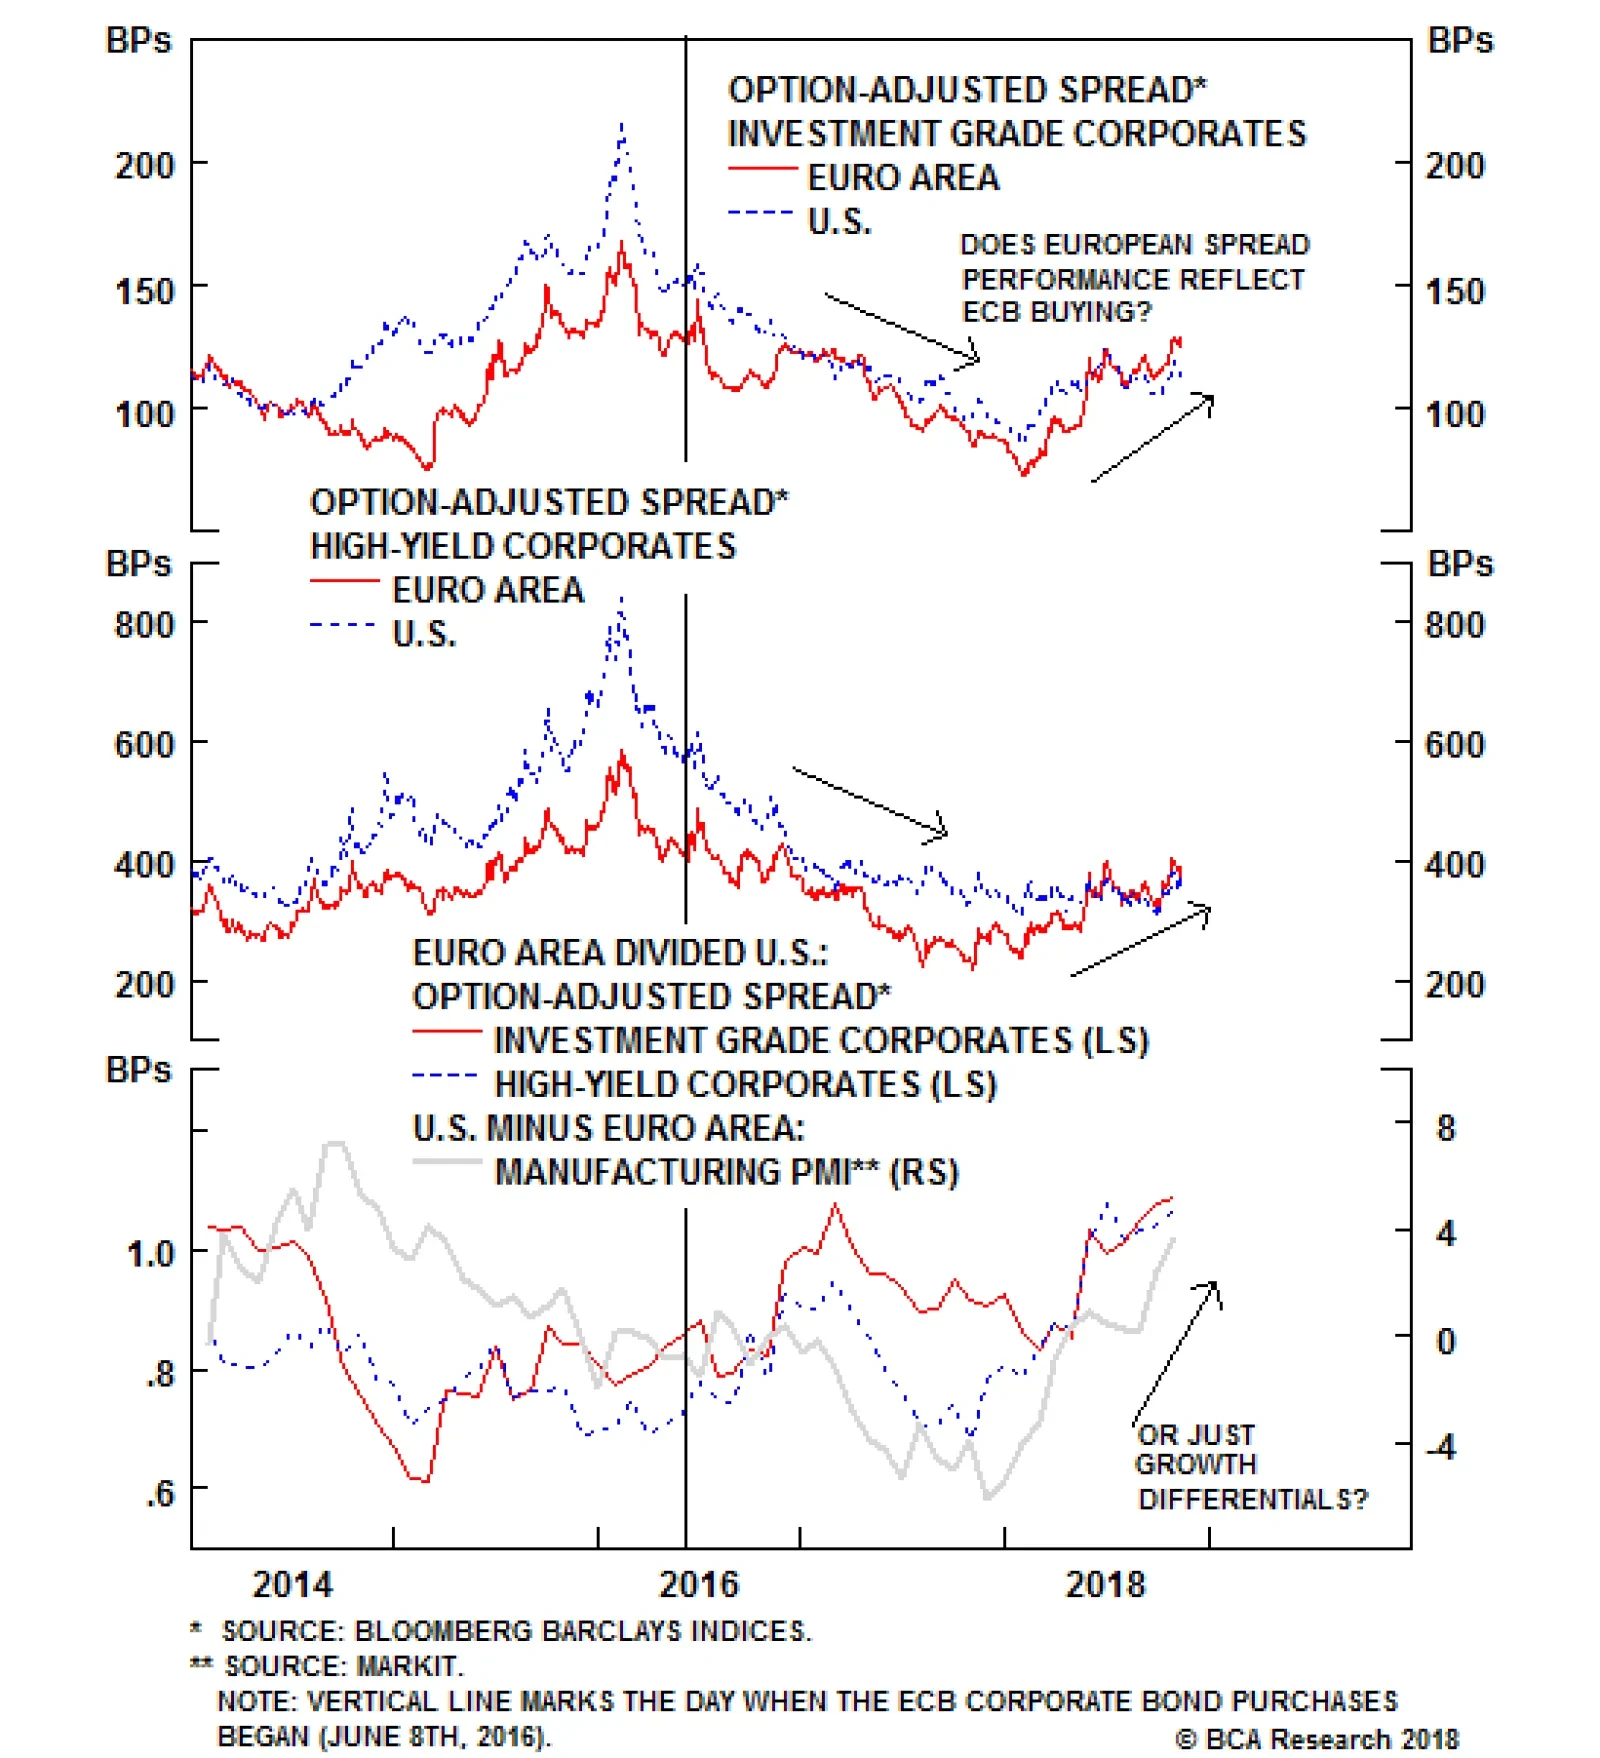
The ECB has been buying corporate bonds since 2016. The Corporate Sector Purchase Program (CSPP), as it is formally known, has been a targeted tool used by the ECB to ease financial conditions for euro area companies. This effect has occurred through three…
Highlights Falling Oil Prices & Bond Yields: Murky trends in global growth data, at a time of tight labor markets and gently rising inflation, are preventing a full recovery of risk assets after the October correction. A new concern is the falling price of oil, although this looks more corrective than a true change in trend. For now, maintain a cautious stance within global fixed income portfolios - neutral on corporate credit, below-benchmark on duration exposure. ECB Corporate Bond Purchases: The ECB is set to end the new buying phase of its Asset Purchase Program next month. This suggests that the best days in this cycle for European corporate credit are behind us, as the ECB will not treat its corporate bond purchases any differently than its government bond purchases. Both are going to stop. Remain underweight euro area corporate debt, both investment grade & high-yield. Feature Are Falling Oil Prices Telling Us Something About Global Growth? Thus far in November, global financial markets have reversed some of the steep losses incurred during the "Red October" correction. This has occurred for U.S. equities (the S&P 500 fell -8% last month but has risen +4% so far this month), U.S. corporate bonds (high-yield spreads widened +71bps last month and have tightened -19bps this month) and emerging market hard currency debt (USD-denominated sovereign spreads widened +27bps last month and have tightened -9bps this month). One market that has not rebounded, however, is oil. The benchmark Brent oil price fell -11% in October, but has fallen another -7% in November. This has been enough to nearly wipe out the entire +20% run-up seen in August and September. Global government bond yields have been very sensitive to swings in oil markets in recent years. Such a large decline in the oil price as has been seen of late would typically result in sharp drop in government bond yields, driven by falling inflation expectations. That correlation has been holding up in the major economies outside the U.S., where nominal yields and inflation expectations are lower than the levels seen before the October peak in oil prices. Nominal U.S. Treasury yields, by contrast, remain resilient, despite the fall in TIPS breakevens (Chart of the Week). This is because real Treasury yields have been climbing higher as investors acquiesce to the steady hawkish message from the Fed by making upward revisions to the expected path of U.S. policy rates. Chart of the WeekShifting Correlations
Shifting Correlations
Shifting Correlations
The biggest impediment holding back a full recovery of the October losses for global risk assets is uncertainty over the global growth outlook. While the U.S. economy continues to churn along at an above-trend pace, there are signs that tighter monetary policy is starting to have an impact. Both housing and capital spending have cooled, although not yet by enough to pose a terminal threat to the current long business cycle expansion. The outlook for growth outside the U.S. is far more muddled, adding to investor confusion. China has seen a clear growth deceleration throughout 2018, but the recent reads from imports and the Li Keqiang index suggest that growth may be stabilizing or even modestly re-accelerating (Chart 2). Our China strategists are not convinced that this is anything more than a ramping up of imports and production in advance of the full imposition of U.S. trade tariffs, especially with Chinese policymakers reluctant to deploy significant fiscal or monetary stimulus to boost growth. Chart 2Mixed Messages On Growth
Mixed Messages On Growth
Mixed Messages On Growth
A similar mixed read is evident in overall global trade data. World import growth has also slowed throughout 2018, but has shown some stabilization of late (second panel). A similar pattern can be seen in capital goods imports within the major developed economies. Our global leading economic indicator (LEI) continues to contract, but the pace of the decline has been moderating and our global LEI diffusion index - which measures the number of countries with a rising LEI versus those with a falling LEI - may be bottoming out (third panel). There are also large, and growing, divergences within the major developed economies. The manufacturing purchasing managers' indices (PMIs) for the euro area and the U.K. have been falling steadily since the start of the year, but the PMIs have recently ticked up in the U.S. and Japan (Chart 3). A similar pattern can be seen in the OECD LEIs, which have retreated from the latest cyclical peaks by far more in the U.K. (-1.6%) and euro area (-1.2%) than in the U.S. (-0.3%) and Japan (-0.6%). Chart 3Diverging Growth, Diverging Bond Yields
Diverging Growth, Diverging Bond Yields
Diverging Growth, Diverging Bond Yields
With such mixed messages from the macro data, investors understandably lack conviction. The backdrop does not look soft enough yet to threaten global profit growth and justify sharply lower equity prices and wider corporate bond spreads. Yet the growth divergences between the U.S. and the rest of the world are intensifying, creating a backdrop of rising U.S. real interest rates and a stronger U.S. dollar. That combination is typically toxic for emerging markets, but the impact of that would be muted this time if China were to indeed see a genuine growth reacceleration. This macro backdrop lines up with our current major fixed income investment recommendations. We suggest only a neutral allocation to global corporate bonds given the uncertainty over growth, but favoring the U.S. over Europe and emerging markets given the clearer evidence of a strong U.S. economy. At the same time, we continue to recommend below-benchmark overall portfolio duration exposure, but with regional allocations favoring countries where central banks will have difficulty raising interest rates (Japan, Australia, core Europe, the U.K.) versus nations where policymakers are likely to tighten monetary policy (U.S., Canada). However, the latest dip in oil should not be ignored. A more sustained breakdown of oil prices could force us to downgrade corporate bonds and raise duration exposure - if it were a sign that global growth was slowing and inflation expectations had peaked. The current pullback in oil has occurred alongside a decelerating trend in global economic data surprises, after speculators had ramped up long positions in oil and prices were stretched relative to the 200-day moving average (Chart 4). This suggests that the latest move has been corrective, and not a change in trend, although the burden of proof now falls on the evolution of global growth, both in absolute terms and relative to investor expectations. Chart 4Oil Correction Or Growth Scare?
Oil Correction Or Growth Scare?
Oil Correction Or Growth Scare?
Bottom Line: Murky trends in global growth data, at a time of tight labor markets and gently rising inflation, are preventing a full recovery of risk assets after the October correction. A new concern is the falling price of oil, although this looks more corrective than a true change in trend. For now, maintain a cautious stance within global fixed income portfolios - neutral on corporate credit, below-benchmark on duration exposure. European Corporates Are About To Lose A Major Buyer Last week, we published a Special Report discussing the ECB's options at next month's critical monetary policy meeting.1 One of our conclusions was that the central bank will deliver on its commitment to end the new purchases phase of its Asset Purchase Program (APP) at year-end. The bulk of the assets in the APP are government bonds, but the ECB has also been buying corporate debt in the APP since June 2016. The ECB is set to end those purchases at the end of December, to the likely detriment of euro area corporate bond returns. The Corporate Sector Purchase Program (CSPP), as it is formally known, has been a targeted tool used by the ECB to ease financial conditions for euro area companies. This has occurred through three main channels: tighter corporate bond spreads, greater access for companies to issue debt in the corporate primary market, and increased bank lending to non-financial corporations. The CSPP was intended to complement the ECB's other monetary stimulus measures, like negative interest rates and the buying of government debt. The first CSPP purchases were made on June 8, 2016. The euro area corporate bond market responded as expected, with investment grade spreads tightening from 128bps to 86bps by the end of 2017. There were spillovers into high-yield bonds, as well, with spreads falling -129bps over the same period (Chart 5). Since then, however, spreads have steadily widened and European corporates have underperformed their U.S. equivalents. This suggests that some of the relative performance of euro area credit may have simply reflected the relative strength of the euro area economy compared to the U.S. The greater acceleration of euro area growth in 2017 helped euro area corporates outperform U.S. equivalents, while the opposite has held true in 2018. Chart 5ECB Buying Does Not Control European Credit Spreads
ECB Buying Does Not Control European Credit Spreads
ECB Buying Does Not Control European Credit Spreads
The CSPP has operated with a defined set of rules governing the purchases. Bank debt was excluded, as were bonds rated below investment grade. Only debt issued by corporations established in the euro area were eligible for the CSPP, although bonds from euro-based companies with parents who were not based in the euro area were also eligible. The latest update on the holdings data from the ECB shows that there are just under 1,200 bonds in the CSPP portfolio. Yet despite the ECB's best efforts to maintain some degree of portfolio diversification, the impact of the CSPP on euro area corporate bond markets was fairly consistent across countries and sectors (Chart 6). Italy is the notable diverging country this year, as the rising risk premiums on all Italian financial assets have pushed corporate bond yields and spreads well above the levels seen in core Europe, even with the ECB owning some Italian names in the CSPP. Chart 6Spread Convergence During CSPP
Spread Convergence During CSPP
Spread Convergence During CSPP
There was also convergence of yields and spreads among credit tiers during the first eighteen months of the CSPP, with valuations on BBB-rated debt falling towards the levels on AA-rated and A-rated bonds (Chart 7). That convergence has gone into reverse in 2018, with BBB-rated spreads widening by +55bps year-to-date (this compares to a smaller +25bps increase in U.S. BBB-rated corporate spreads). A surge in the available supply of BBB-rated euro area bonds is a likely factor in that spread widening, as evidenced by the sharp rise in the market capitalization of the BBB segment of the Bloomberg Barclays euro area corporate bond index (top panel). Chart 7A Worsening Supply/Demand Balance For European BBBs?
A Worsening Supply/Demand Balance For European BBBs?
A Worsening Supply/Demand Balance For European BBBs?
More broadly, the CSPP has helped the ECB's goal of boosting the ability of European companies to issue debt in primary bond markets. Traditionally, European firms have used bank loans as their main source of borrowed funds, with only the largest firms being able to issue debt in credit markets. That has changed during the CSPP era. According to data from the ECB, gross debt issuance by euro area non-financial companies (NFCs) has risen by €104bn since the start of the CSPP, taking issuance back to levels not seen since 2014 (Chart 8). The bulk of the issuance has been in shorter-maturity bonds, but there has been a notable increase in the issuance of longer-dated debt since the CSPP began. Chart 8Bank Funding Versus Bond Funding
Bank Funding Versus Bond Funding
Bank Funding Versus Bond Funding
The ECB's role as a marginal buyer of bonds in the primary, or newly-issued, market has helped boost that gross issuance figure. The share of bonds that the ECB owns in the CSPP that was issued in the primary market has gone from 6% soon after the CSPP started to the current 18% (Chart 9). The growth in euro area non-financial corporate debt went from 6% to over 10% during the peak of the CSPP buying between mid-2016 and end-2017, but has since decelerated to 7%. At the same time, the annual growth in loans to NFCs, which was essentially zero during the first eighteen months of the CSPP, has accelerated to 2% over the course of 2018. Chart 9More Bank Loans, Less Debt Issuance
More Bank Loans, Less Debt Issuance
More Bank Loans, Less Debt Issuance
In other words, euro area companies had been substituting bank financing for bond financing in the CSPP "era", but have since shifted back towards bank loans in 2018. That shift in financing was most notable among CSPP-eligible companies, particularly those smaller firms that had not be able to issue debt in the primary market pre-CSPP, according to an ECB analysis conducted earlier this year.2 From the point of view of the investible euro area corporate bond market, however, even larger companies that have done that shift in bank financing to bond financing have seen no noticeable increase in aggregate corporate leverage. In Chart 10, we show our bottom-up version of our Corporate Health Monitor (CHM) for the euro area. This indicator is designed to measure the aggregate financial health of euro area companies using financial ratios incorporating actual data from individual companies. We separated out the list of companies used in that CHM that are currently held in the CSPP portfolio and created a "CSPP-only" version of the CHM (the blue lines in all panels). All issuers that were eligible for inclusion in the CSPP, but whose bonds were not actually purchased by the ECB, are used to create a "non-CSPP" CHM (the black dotted lines). Chart 10No Fundamental Changes From CSPP
No Fundamental Changes From CSPP
No Fundamental Changes From CSPP
As can be seen in the chart, there is no material difference in any of the ratios for bonds within or outside the CSPP. The one notable exception is short-term liquidity, where the ratios were much lower for names purchased by the ECB than for those that were not. This lends credence to the idea that the CSPP most helped firms that were more liquidity-constrained, likely smaller companies. The biggest change in any of the ratios has been in interest coverage, but that has been for both CSPP and non-CSPP issuers, suggesting a common factor outside of ECB buying - zero/negative ECB policy rates, ECB purchases of government bonds that helped reduce all European borrowing rates - has been the main driver of lowering interest costs. Looking ahead, the ECB is likely to stop the net new purchases of its CSPP program when it does the same for the full APP next month. All of which is occurring for the same reason - the euro area economy is deemed by the central bank to no longer need the support of large-scale asset purchases given a full employment labor market and gently rising inflation. As we discussed in our Special Report last week, the ECB has other options available to them if there is a reduction in euro area banks' capacity or willingness to lend, such as introducing a new Targeted Long-Term Refinancing Operation (TLTRO). Continuing with unconventional measures involving direct ECB involvement in financial markets, like buying corporate debt, is no longer necessary. Our euro area CHM suggests that there are no major problems with European corporate health that require a wider credit risk premium. We still have our reservations, however, about recommending significant euro area corporate bond exposure while the ECB is set to end its asset purchase program. New buyers will certainly come in to replace the lost demand from the elimination of CSPP purchases, but private investors will likely require higher yields and spreads than the central bank - especially if the current period of slowing euro area growth were to continue. Bottom Line: The ECB is set to end the new buying phase of its Asset Purchase Program next month. This suggests that the best days for European corporate debt for the current cycle are behind us, as the ECB will not treat its corporate bond purchases any different than its government bond purchases. Both are going to stop. Remain underweight euro area corporate debt, both investment grade and high-yield. Robert Robis, CFA, Senior Vice President Global Fixed Income Strategy rrobis@bcaresearch.com 1 Please see BCA Global Fixed Income Strategy/Foreign Exchange Strategy Special Report, "Evaluating The ECB's Options In December", dated November 6th 2018, available at gfis.bcareserach.com and fes.bcaresearch.com. 2 The ECB report on its CSPP program was published in the March 2018 edition of the ECB Economic Bulletin, which can be found here. https://www.ecb.europa.eu/pub/economic-bulletin/html/eb201804.en.html Recommendations The GFIS Recommended Portfolio Vs. The Custom Benchmark Index
Stubbornly Resilient Bond Yields
Stubbornly Resilient Bond Yields
Duration Regional Allocation Spread Product Tactical Trades Yields & Returns Global Bond Yields Historical Returns