Euro Area

Feature In the late 1980s, half of the global stock market capitalization resided in Japan Furthermore, almost a third of the Japanese stock market capitalization resided in banks. It followed that to have a view on the global stock market you had to have a view on Japanese banks. Indeed, in 1988, five of the ten largest companies in the world were Japanese banks. Less than ten years later, the weighting of Japanese banks in the global stock market had collapsed to less than one percent, rendering Japanese banks a largely irrelevant part of a global equity portfolio. In the new millennium, it was the turn of European banks to step into the limelight. By 2007, the proportion of the euro area's stock market capitalization in banks had ballooned to a quarter. And then, Europe followed in Japan's footsteps. Today, the weighting of banks in the Euro Stoxx has plunged to around a tenth. Could European banks now become a global investment irrelevance too (Feature Chart)? Feature ChartAre Europe's Banks Following In Japan's Footsteps?
Are Europe's Banks Following In Japan's Footsteps?
Are Europe's Banks Following In Japan's Footsteps?
European banks have performed very poorly. From their peak in 2007, a one dollar investment in euro area banks relative to the world index would now be worth just 15 cents. But Japanese banks have performed abysmally: from their peak in the late 1980s, a one dollar investment in Japanese banks relative to the world index would now be worth a pitiful 3 cents (Chart I-2 and Chart I-3).1 Chart 2Japan Dominated The Global Stock Market In The Late 1980s
Japan Dominated The Global Stock Market In The Late 1980s
Japan Dominated The Global Stock Market In The Late 1980s
Chart 3Banks Have Performed Abysmally
Banks Have Performed Abysmally
Banks Have Performed Abysmally
What turned Japanese bank shares from heroes to zeroes? Some people point to sky-high valuations: in the late 80s, Japanese bank dividend yields dropped below 0.5 percent (Chart I-4), and these high valuations clearly contributed to their subsequent poor investment performance. But this was not the main reason. Chart 4Japanese Banks Offered Miserly Dividend Yields
Japanese Banks Offered Miserly Dividend Yields
Japanese Banks Offered Miserly Dividend Yields
Banks' Lifeblood Is Credit Creation The main reason for the severe underperformance of Japanese banks was that they lost their lifeblood: credit creation. Put simply, if bank assets stop growing structurally, then it is impossible for bank revenues to grow structurally. But in Japan, it was worse: from the 1990s through the mid noughties, private sector indebtedness actually shrank from 220 percent to 160 percent of GDP, and this explains the bulk of the abysmal performance of bank equities (Chart I-5). Chart 5Banks' Lifeblood Is Credit Creation
Banks' Lifeblood Is Credit Creation
Banks' Lifeblood Is Credit Creation
The important lesson is that the structural outlook for bank equities depends first and foremost on the structural outlook for bank credit creation. This is especially true in Europe because the majority of credit intermediation occurs via the banking system rather than via the bond market. So how can we assess the structural outlook for bank credit creation? Basically by noting that there appears to be an upper limit at which all the good lending has been done. Additional bank credit then generates misallocation of capital and mal-investments. At which point, the economy and bank asset quality start to suffer, limiting any further increase in profitable lending. The precise point at which this happens is not set in stone, because high levels of public indebtedness, through 'crowding out', can pull down the limit of productive private indebtedness. And vice-versa. Nevertheless when private indebtedness, as a percentage of GDP, reaches the mid-200s, the evidence suggests that the scope for further growth becomes limited. On this basis, the outlook for bank asset growth in Europe is a mixed bag. In Switzerland, Sweden and Norway, private indebtedness already stands at 250 percent of GDP, implying that the stock of profitable bank assets is close to its upper limit (Chart I-6). Chart 6In Switzerland, Sweden And Norway, Private Indebtedness Is Very High
In Switzerland, Sweden And Norway, Private Indebtedness Is Very High
In Switzerland, Sweden And Norway, Private Indebtedness Is Very High
Meanwhile in the euro area, private indebtedness ratios in the Netherlands and Belgium are already well above 200 percent, and in France at 200 percent. On the other hand, the ratios in Germany and Italy - the largest and third largest euro area economies - are barely above 100 percent (Chart I-7). This bestows on them the honour of the lowest privately indebted major economies in the world (Chart I-8), with considerable theoretical capacity for bank asset growth. Admittedly, Italy has a high level of public indebtedness. Nevertheless, it is hard to deny that if the banking system in Italy could be unfrozen, there is great scope for economically productive lending. Chart 7In Germany And Italy, Private Indebtedness Is Very Low
In Germany And Italy, Private Indebtedness Is Very Low
In Germany And Italy, Private Indebtedness Is Very Low
Chart 8In Japan, Private Indebtedness Has Plunged
In Japan, Private Indebtedness Has Plunged
In Japan, Private Indebtedness Has Plunged
Having said all that, we now turn to something that bank investors everywhere in the world should fear: blockchain. Blockchain Is A Mortal Threat To Banks The internet's major innovation was to decentralize and democratize information. Before the internet, the creation, ownership and dissemination of information was a function centralized to privileged organizations: governments, media and entertainment companies. But after the internet, anybody and everybody could create, receive and share content - and this has proved to be a game changer for the governments, media and entertainment companies that previously owned and/or controlled the information. In the same way, blockchain's major innovation is to decentralize and democratize trust. The Economist even described blockchain as "the trust machine".2 It follows that blockchain will be a game changer for the privileged organizations whose raison d'être is to supply trust and integrity in transactions - essentially, those that act as a middleman. Clearly, one such privileged organization is the banking system, because the banking system is really nothing more than a middleman that provides trust and integrity in the transaction between the people with savings and the people who want to borrow those savings. Granted, banks also assess and price the credit risk of borrowers as well as provide a degree of insurance for savers. But with the prevalence of universal credit scoring systems and compensation schemes, there is a growing tendency to decentralize those functions too. Put simply, blockchain removes the need for a middleman. Until now, counterparties without an established trust relationship could only transact through a middleman who could add the trust and integrity overlay. But once each participant in the transaction trusts the blockchain itself, they no longer need to use a costly intermediary, like a bank. Therefore, just as the internet has revolutionized politics, media and entertainment, it is our very high conviction view that blockchain will revolutionize the way that money, assets and securities are held, transferred and accounted for. And the major casualty will be the banking system as we now know it. Investment Considerations The structural case for European banks is that Germany and Italy - the largest and third largest euro area economies - have considerable scope for bank credit expansion. The structural case against is that the other European economies have very limited scope for bank credit expansion. Furthermore, we confidently predict that within a decade blockchain will have decentralized and democratized financial intermediation, transforming it to something that is unrecognizable from today. Overall, this will not be a good thing for bank investors. With this in mind, German and Italian real estate and real estate equities are a much cleaner structural play on the potential for increased private indebtedness in those economies, whether intermediated by the banking system or not (Chart I-9 and Chart I-10). Chart 9The Evolution Of Private Indebtedness...
European Banks: The Case For And Against
European Banks: The Case For And Against
Chart 10...Drives The Real Estate Market
Drives The Real Estate Market
Drives The Real Estate Market
We end with another important lesson from Japan. Even in a three decade long bear market, the banks had the capacity for countertrend bursts of outperformance from oversold levels, sometimes by as much as 50 percent in a year. This is because even within a structural bear trend, there are cycles of excessive depression. European banks could be ripe for such a countertrend burst of outperformance. This year, European banks sank by 35 percent versus European healthcare. However, the sharp deceleration in global credit growth which dragged them down has now clearly reversed (Chart I-11). On this basis, the next six months could be a countertrend phase: a brief opportunity to own some European banks, at least relative to other equity sectors. Chart 11European Banks Are Ripe For A Burst Of Outperformance
European Banks Are Ripe For A Burst Of Outperformance
European Banks Are Ripe For A Burst Of Outperformance
Dhaval Joshi, Senior Vice President Chief European Investment Strategist dhaval@bcaresearch.com 1 Performances are calculated in common currency terms. 2 Please see 'the trust machine', The Economist, October 31, 2015.
This is the most effective way to get European banks to extend credit to borrowers at lower interest rates, since the banks would be able to fund that borrowing via the TLTRO at a rate lower than market rates. In our view, a new TLTRO is the most effective…
Right now, our Months-to-Hike indicators, which measure the time until a full rate hike is discounted in the European Overnight Index Swap (OIS) curve, are discounting a hike of 10bps by November 2019 and a hike of 25bps by May 2020. The ECB could easily…
Extending the Asset Purchase Program (APP) into 2019 is the least likely choice because the ECB is already close to some of the self-imposed constraints on its government bond holdings. The ECB has set a limit of owning no more than 33% of an individual…
Highlights The End Of APP?: Economic growth in the euro area has lost momentum, but it is not clear that an extended period of below-trend growth is unfolding. With most measures of spare capacity showing a lack of it, the ECB must still move forward with its plans to begin removing policy accommodation. Policy Choices: If the ECB downgrades its growth and inflation forecasts next month, delaying the end of the APP into 2019 is unlikely, as is altering the country weightings within the APP portfolio. More plausible options include pushing out forward guidance on future rate hikes, extending the maturity of the existing bond holdings, or introducing a new TLTRO to support lending. Impact On European Bonds & The Euro: The ECB is most likely to take a less hawkish slant in December, but will not signal any rapid move to begin hiking rates. This outcome will be bearish for the euro, but only neutral at best for overvalued European government bonds. Feature For the European Central Bank (ECB), the countdown is on to the December policy meeting, when a final decision will have to be made on the end of the Asset Purchase Program (APP). The central bank has been signaling throughout 2018 that net new APP bond purchases will stop at the end of the year, with a potential interest rate increase coming in September 2019 at the earliest. That decision on APP, however, will be conditional on the ECB remaining confident in its forecast that inflation will sustainably return to the target of "just below" 2%. Slumping European economic growth in 2018 means that the ECB's forecasts may prove to be too optimistic. This is especially true given the risks to growth and financial stability stemming from Italy's fiscal policy debate with the European Union, softening Chinese demand for European exports, and the uncertainties related to U.S. trade protectionism and the final U.K.-E.U. Brexit deal. Some pundits are even suggesting that the ECB may be forced to extend the APP program beyond December - or look for other ways to prevent a tightening of monetary conditions - even with headline inflation and wage growth having picked up across most countries. Against this increasingly muddled backdrop, what can the ECB credibly announce in December? In this Special Report, jointly published by BCA's Global Fixed Income Strategy and Foreign Exchange Strategy services, we discuss the state of the euro area economy and then consider the ECB's next potential policy moves, with ramifications for European bond yields and the euro. Our conclusion is that there are a few policy tools available to the ECB in case of a prolonged slump in growth, without having to bring on the operational difficulties from extending the APP beyond December. Such a "dovish" shift would be bearish for the euro but neutral, at best, for European government bonds which remain deeply overvalued. ECB Policy Dilemma: Slowing Growth Vs. Accelerating Inflation At last month's monetary policy meeting, ECB President Mario Draghi noted that the slowing economy was merely returning to trend (or potential) growth from an unsustainably fast pace in 2017 that was fueled by strong export demand. Looking at the broad swath of euro area economic data, Draghi's relatively optimistic assessment is not far off the mark. The euro zone has seen a clear loss of economic growth momentum since the start of the year (Chart 1). The initial read on real GDP for the third quarter, released last week, showed a deceleration to a below-potential quarterly growth pace of 1.7%. The manufacturing purchasing managers index (PMI) has fallen from a peak of 61 in December 2017 to 52 in October, mirroring a -1% decline in the OECD's leading economic indicator for the region. Chart 1A European Growth Slump, Not Yet A Downtrend
A European Growth Slump, Not Yet A Downtrend
A European Growth Slump, Not Yet A Downtrend
Yet not all the economic news has been that weak. Both consumer and business confidence remain at elevated levels according to the European Commission (EC) surveys, consistent with above-trend real GDP growth (bottom two panels). Even though exports have weakened substantially from the booming pace in 2017 - largely due to China's slowing growth - the EC survey on firms' export order books remains at robust levels and overall export growth has rebounded of late (Chart 2). The current conditions component of the euro area ZEW index has also ticked higher (top panel), as has the bank credit impulse (bottom panel). Chart 2Not All The Economic News Is Bad
Not All The Economic News Is Bad
Not All The Economic News Is Bad
The bigger issue for the ECB is that the recent cooling of growth comes at a time when, by almost all measures, there is little economic slack in the euro area. Capacity utilization is running at an 11-year high of 84%, while the output gap is effectively closed according to estimates from the IMF (Chart 3). Chart 3No Spare Capacity In Europe
No Spare Capacity In Europe
No Spare Capacity In Europe
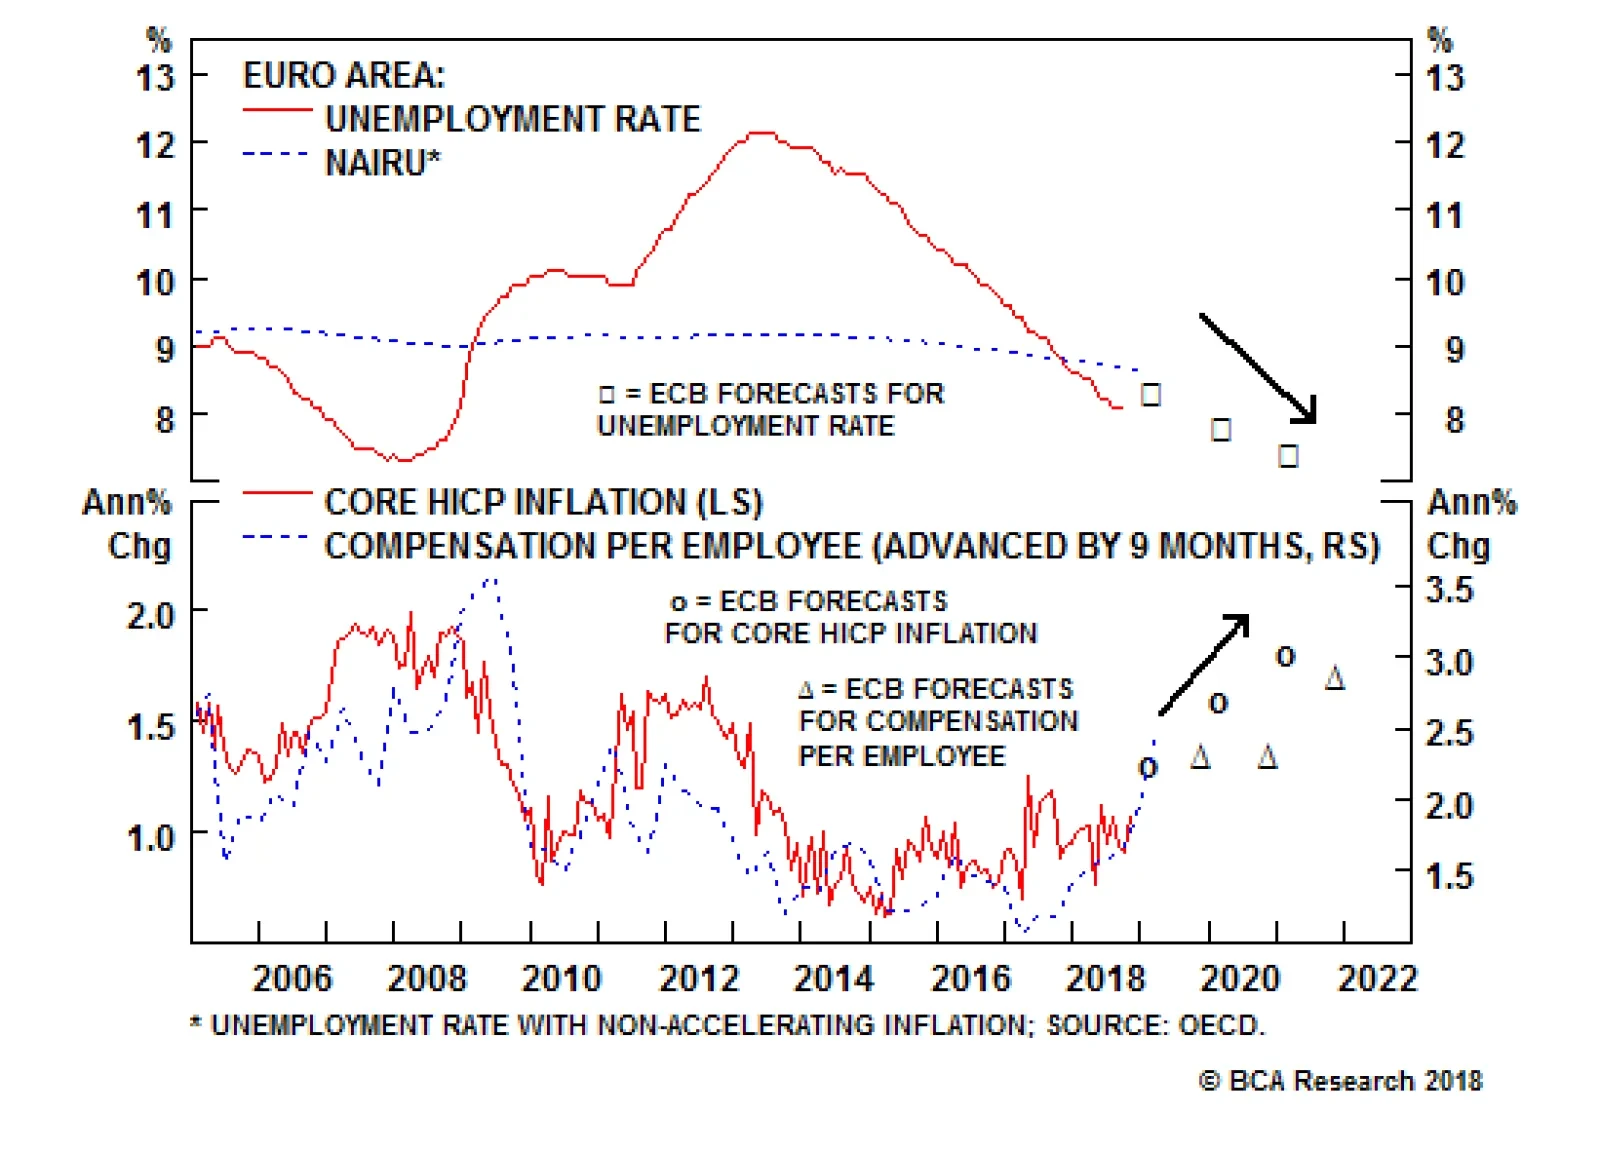
With that gap projected to turn positive in 2019, core inflation in the euro zone should be expected to drift higher. Yet core inflation now remains stuck around 1%, well below the headline inflation figure of 2% that has been heavily influenced by past increases in energy prices (bottom panel). The labor market is sending signals that the current period of low euro area inflation may be turning around. The unemployment rate for the entire region fell to a 10-year low of 8.1% in September, well below both the ECB's latest 2018 forecast and the OECD's estimate of the full employment NAIRU (Chart 4). This tightening labor market is a broad-based phenomenon across the euro area, with nearly 80% of countries in the region having an unemployment rate below NAIRU (middle panel).1 The last two times there was such a broad-based decline in unemployment in the region, in 2001-02 and 2006-07, a significant tightening of monetary policy was required as measured by a simple Taylor Rule. Chart 4Broad-Based Labor Market Strength
Broad-Based Labor Market Strength
Broad-Based Labor Market Strength
Already, the tightening labor market is starting to put upward pressure on labor costs. The annual growth in wages & salaries accelerated to just over 2% in the second quarter of 2018. Similar to the fall in unemployment rates, the faster wage growth has also been widely seen throughout the region, with nearly three-quarters of euro area countries showing faster wage growth from one year ago (bottom panel). The mix of slowing growth momentum with some inflationary pressures can be seen in our ECB Monitor, which measures the cyclical pressures to tighten or ease monetary policy in the euro area. The Monitor had been signaling a need for tighter policy for most of the past two years, but has now fallen back to levels consistent with no change in policy (Chart 5). When breaking down the Monitor into its inflation and growth components, the latter has fallen the most. The inflation components remain in the "tight money required" zone above the zero line. Chart 5Our ECB Monitor Says 'Do Nothing'
Our ECB Monitor Says 'Do Nothing'
Our ECB Monitor Says 'Do Nothing'
Looking across the balance of the euro area data, President Draghi's assessment that the recent economic weakness is not the beginning of a sustained move to below-trend growth is justified. Given the broad evidence pointing to a lack of excess capacity across the euro area economy, it will take a much bigger growth slump before the ECB can shift to a more dovish policy bias. The critical series to monitor will be business confidence, capital spending and export orders. All are at risk of downshifting due to slowing global trade activity and sluggish Chinese demand. BCA's China experts continue to have doubts that the Chinese government will undertake any typical initiatives to stimulate demand, like interest rate cuts or fiscal spending, given worries about high domestic debt levels. Without the impetus from strong Chinese import demand boosting euro area exports, the current tightness of euro area labor markets, and uptrend in wage growth, may be at risk of a reversal, as we discussed in a recent Special Report.2 Bottom Line: Economic growth in the euro area has lost momentum, but it is not clear that an extended period of below-trend growth is unfolding. With most measures of spare capacity showing a lack of it, the ECB must still move forward with its plans to begin removing policy accommodation. What Tools Are Available For The ECB? Net-net, when looking at the broad balance of growth and inflation data at the moment, there is not yet enough evidence to suggest that the ECB needs to back away from its current plans to end net new APP purchases in December. That does not mean that the ECB would not consider changes to its total mix of monetary policy measures. The ECB has treated the APP, which began in 2015, as a "deflation fighting tool" during a period when there was excess capacity and very low inflation in the euro area. That is no longer the case, so it will be difficult for the ECB Governing Council to argue in December that new APP purchases are still necessary. It would take a substantial downward adjustment to the ECB growth and inflation forecasts, with a subsequent upward revision to the expectations for the unemployment rate, for the ECB to reconsider the plans to stop new bond purchases at year-end. Yet the ECB has also made it clear that interest rate hikes will not happen soon after the APP purchases end. Going back over the entire 20-year history of the ECB, there have only been three tightening episodes through rate hikes: 1999-2000, 2003-07 and 2011. In all three cases, what prompted the rate hikes was a period of broad-based increases in euro zone inflation that followed a period of equally broad-based euro zone economic growth. This can be seen in Chart 6, which shows "diffusion indices", or breadth across countries, for euro area real GDP and inflation. A higher number means that a greater percentage of individual nations is experiencing faster growth or inflation, and vice versa. During those three previous tightening cycles, the diffusion indices all reached elevated levels for growth and, more importantly, inflation. With more countries enjoying the upturn, the ECB could be more confident in seeing the need for interest rate increases to cool off demand to prevent an inflation overshoot. Chart 6No Need For ECB Rate Hikes Anytime Soon
No Need For ECB Rate Hikes Anytime Soon
No Need For ECB Rate Hikes Anytime Soon
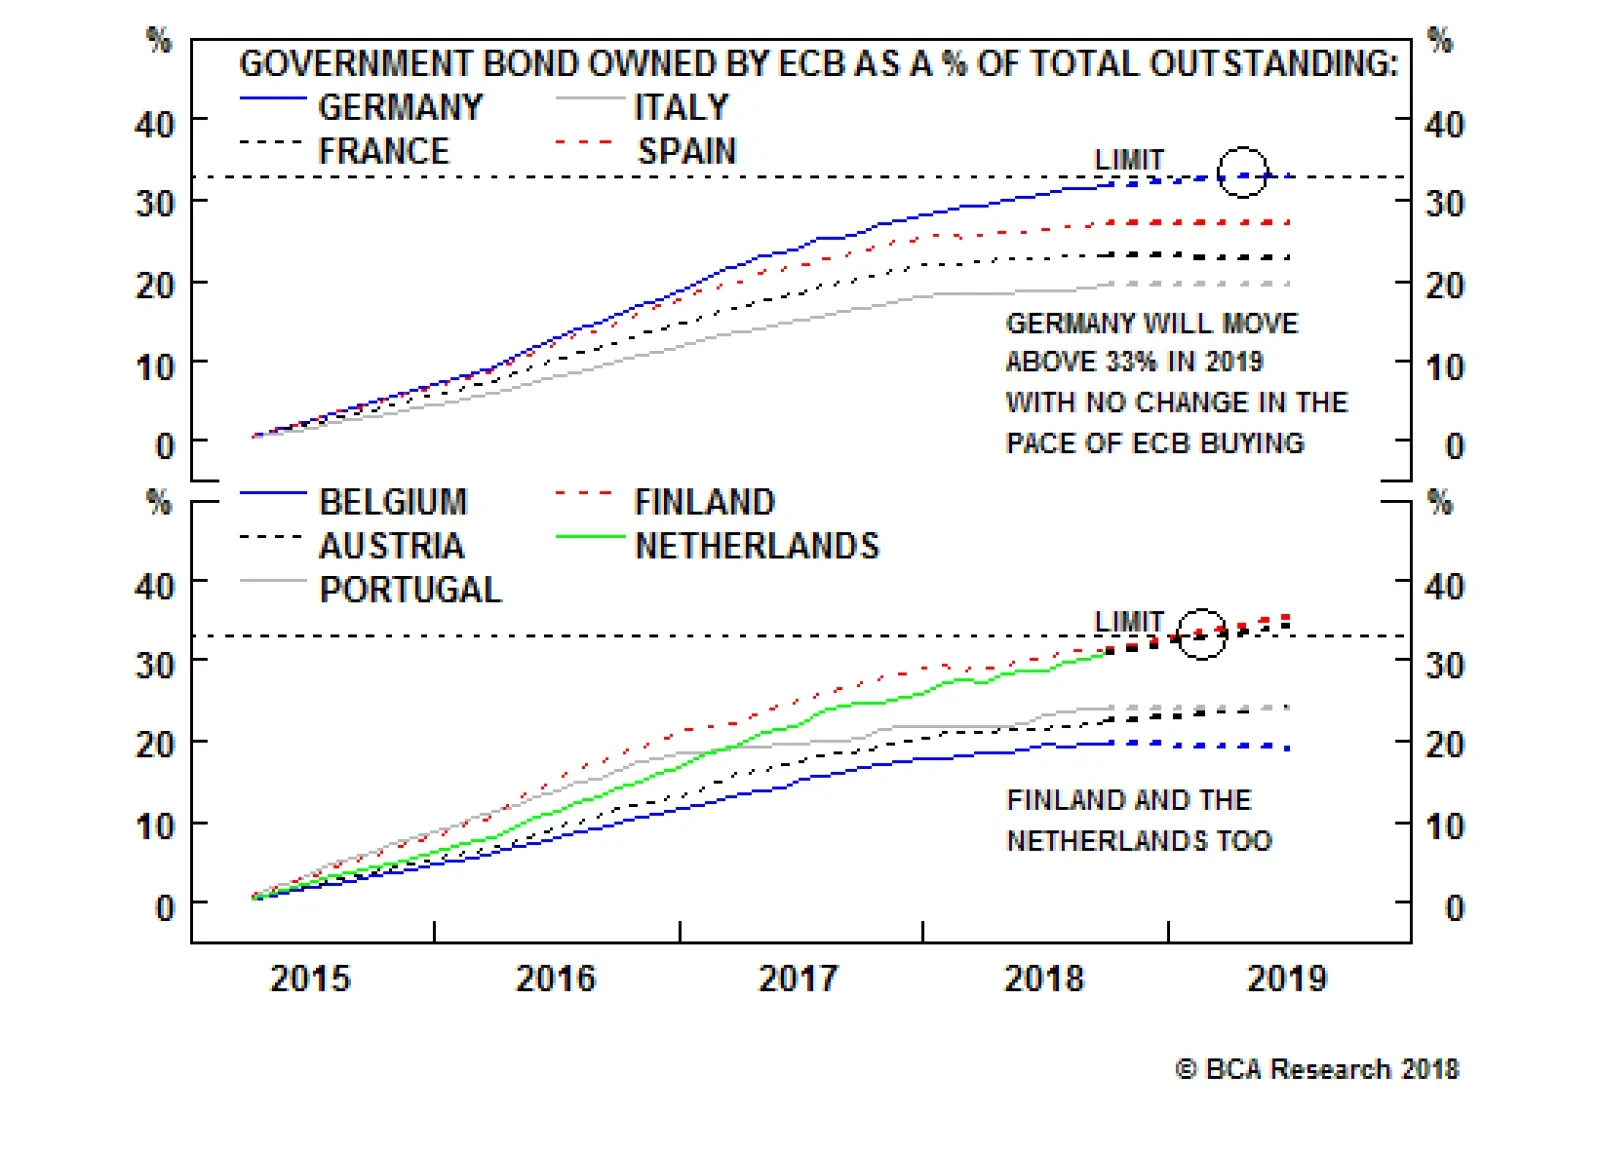
At the moment, the diffusion indices are quite low, suggesting that few countries are witnessing accelerating growth or inflation. This means that there is no pressure for the ECB to move up its current dovish guidance to the markets about the timing of the first rate hike in late 2019. That also means that there is a risk that the ECB is forced to consider options for providing additional monetary accommodation if there was a large enough downgrade to its growth and inflation forecasts. If the ECB were to indeed lower its growth forecasts in December and consider additional easing options, there are only four plausible options at their disposal: 1) Extending the APP purchases beyond December, either at the current pace of €15bn/month or a slower pace between €5-10bn/month Extending the APP into 2019 is the least likely choice because the ECB is already close to some of the self-imposed constraints on its government bond holdings. The ECB has set a limit of owning no more than 33% of an individual country's allowable government bonds, with maturities of between 1-31 years. Right now, the ECB owns about 31% of all eligible German government debt (Chart 7), and would breach that 33% level sometime in the first half of 2019 if the current pace of buying was maintained without any increase in German bond issuance (i.e. smaller budget surpluses).3 A similar outcome would also occur for smaller bond markets, like the Netherlands and Finland (bottom panel). Chart 7ECB Will Hit Country Issuer Limits If Current APP Is Maintained
ECB Will Hit Country Issuer Limits If Current APP Is Maintained
ECB Will Hit Country Issuer Limits If Current APP Is Maintained
Of course, this is a self-imposed rule by the ECB that can easily be changed. That already occurred back in 2016 when the ECB allowed the purchase of bonds below the deposit rate as part of its APP operations. This meant that the ECB would buy bonds with negative yields, essentially guaranteeing a loss assuming that the bonds were held to maturity. Yet given how much emphasis the ECB has placed on abiding by the issuer limits, we think the ECB would consider other policy choices before raising them. 2) Changing the composition of the APP portfolio Changing the mix of bonds within the APP portfolio is a more likely option, but even this has its limits. The ECB could choose to buy more corporate bonds or covered bonds, but those are less liquid markets where there is arguably more evidence that ECB buying has impacted market functionality. The ECB may be reluctant to take on more credit risk in its bond portfolio, as well. At the country level, the ECB could choose to move away from using its Capital Key weightings to determine the allocation of its bond purchases by country. In the current heated political atmosphere in Europe, however, with the populist Italian government in a very public battle with the E.U. over its 2019 budget, the ECB will not want to be seen as favoring any country more than another by buying more government bonds in places like Italy or Spain over Germany and France. That can already be seen in how bond purchases have been allocated in 2018, with purchases sticking closer to the Capital Key weightings in Italy and France from the larger weightings seen in 2017 (Charts 8 & 9). Chart 8The ECB Capital Key ...
The ECB Capital Key...
The ECB Capital Key...
Chart 9... Is Not Always Adhered To
...Is Not Always Adhered Too
...Is Not Always Adhered Too
A more likely reallocation of bond holdings could occur within each country by adjusting the maturities held within the ECB's portfolio. Following the template of the Fed's 2012 "Operation Twist", the ECB could aim to sell shorter-dated bonds in exchange for longer-maturity debt, thereby exacting a flattening influence on government yield curves. There is scope for that in Germany, where the weighted-average-maturity (WAM) of the ECB's bond holdings has decline by 18 months since peaking in late 2015 (Chart 10). Large declines in WAW have also occurred for Spanish, Italian and Portuguese bonds owned by the ECB, if policymakers were willing to take on more duration risk in the Periphery. Chart 10The ECB Has Room To Extend Its APP Maturities
The ECB Has Room To Extend Its APP Maturities
The ECB Has Room To Extend Its APP Maturities
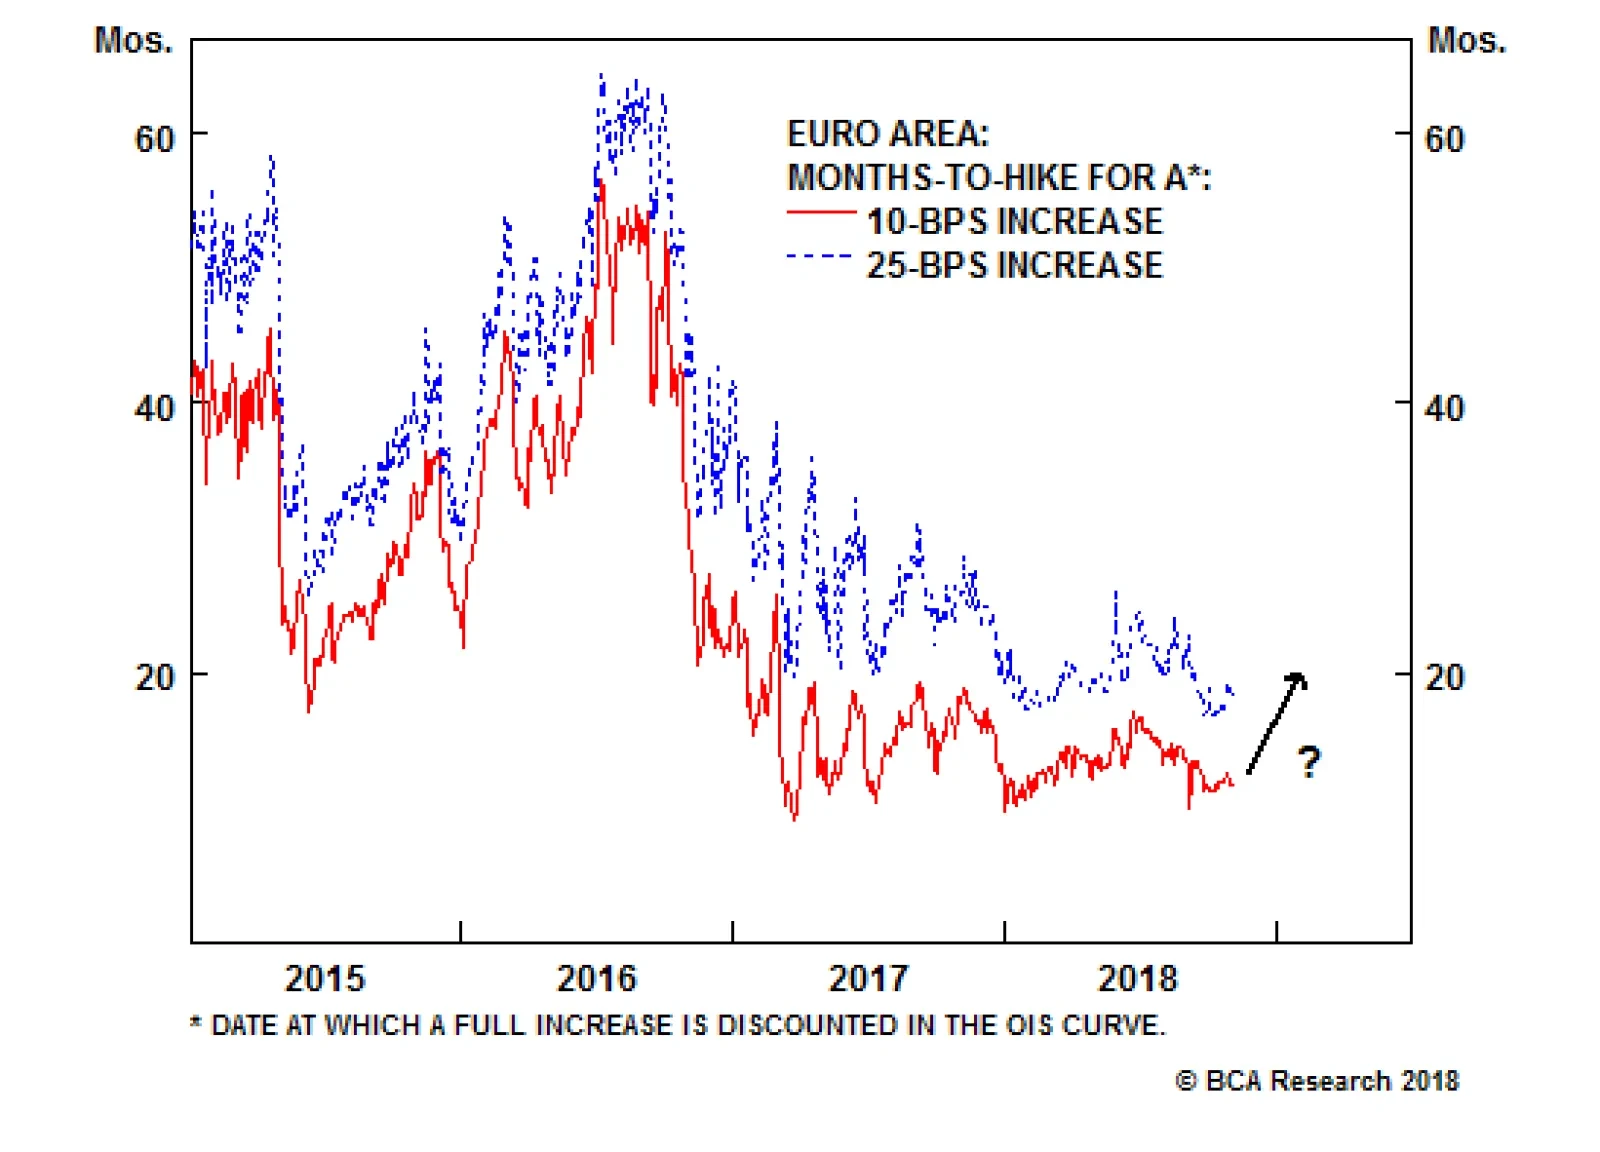
3) Extend forward guidance on the first rate hike The easiest option for the ECB in the event of a downgrade of its growth/inflation projections is to simply extend the forward guidance on the timing of the first interest rate hike. Right now, our Months-to-Hike indicators, which measure the time until a full rate hike is discounted in the European Overnight Index Swap (OIS) curve, are discounting a hike of 10bps by November 2019 and a hike of 25bps by May 2020 (Chart 11). The ECB could easily signal that any rate hike, of any size, would not occur before the latter half of 2020 if an additional easing move was required. This would mostly likely result in lower bond yields and a weaker euro, all else equal, helping easy monetary conditions in the euro area. Chart 11Extending Forward Guidance Is An Option
Extending Forward Guidance Is An Option
Extending Forward Guidance Is An Option
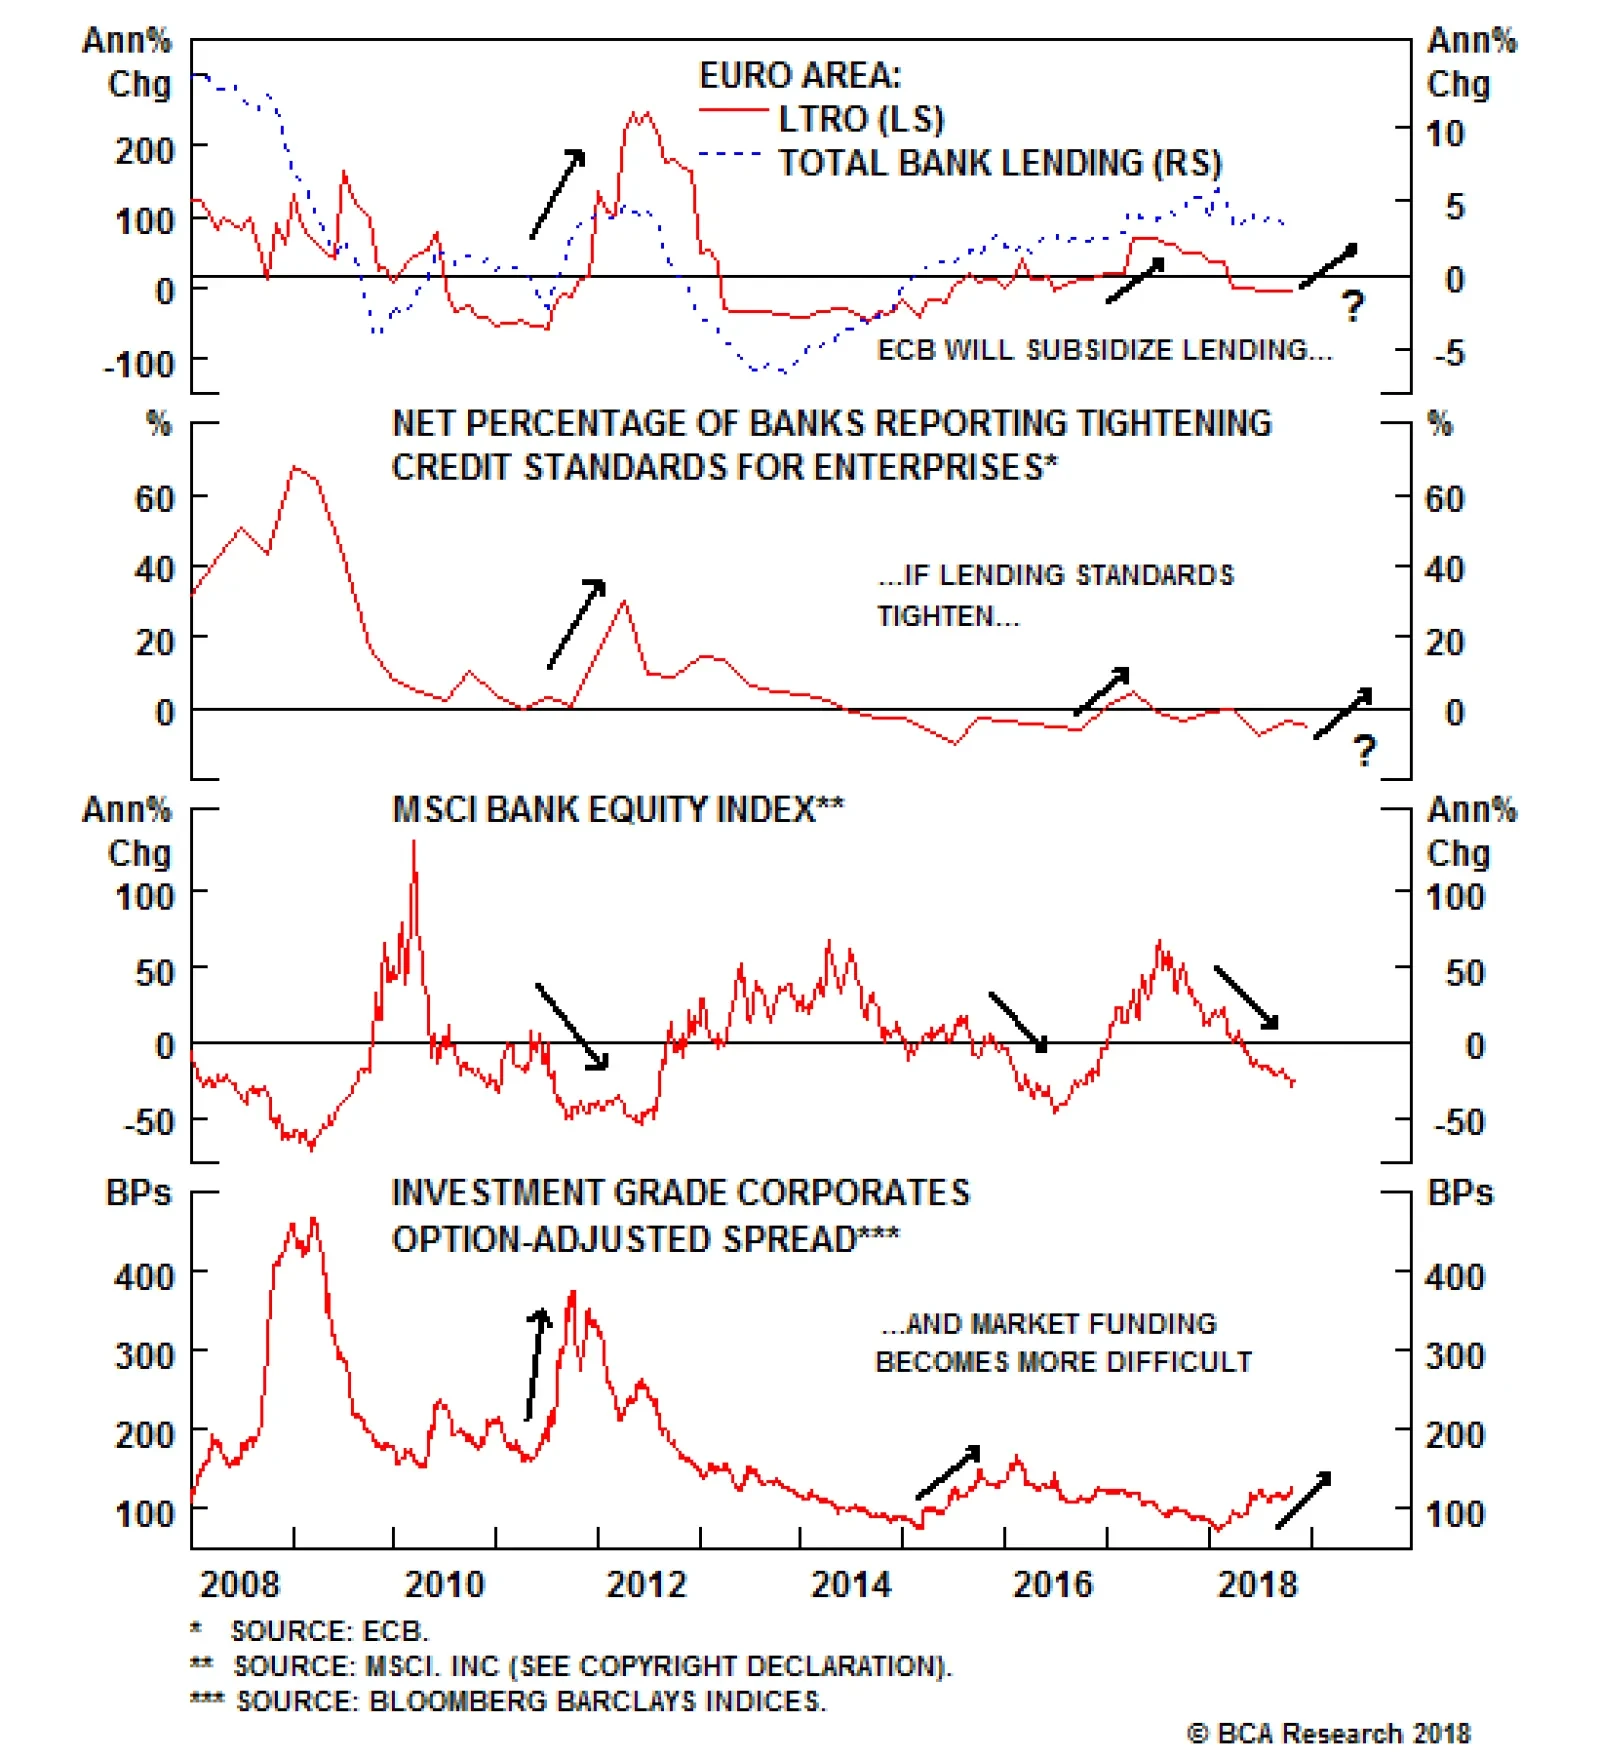
4) Introduce a new Targeted Long-Term Lending Operation (TLTRO) One final intriguing option for an ECB policy ease would be the introduction of another TLTRO. The last such targeted lending program occurred in 2016, but the first wave of the much larger program that began in 2014 has already started to run off the ECB's balance sheet. This is the most effective way to get European banks to extend credit to borrowers at lower interest rates, since the banks would be able to fund that borrowing via the TLTRO at a rate lower than market rates. President Draghi did note last month that some members of the Governing Council brought up the idea of a new TLTRO at the ECB's policy meeting, and some well-known investment banks have recently discussed the implications of a new operation. In our view, a new TLTRO is the most effective way for the ECB to provide stimulus via lower private borrowing rates. It would also help offset any negative ramifications of the reduction of the ECB's balance sheet from the expiration of prior TLTROs. This would likely only happen, though, if there was evidence that the credit channel was impaired in the euro area. The previous TLTROs occurred after a period when banks were tightening credit standards, corporate borrowing rates and credit spreads were widening, European bank stocks were falling and European bank lending standards were becoming more restrictive (Chart 12). Chart 12A New TLTRO? Watch Lending Standards
A New TLTRO? Watch Lending Standards
A New TLTRO? Watch Lending Standards
Today, bank stocks are falling and corporate bond yields/spreads are low but slowly rising, while European banks are actually easing lending standards according to the ECB's Q3 Bank Lending Survey. If the latter were to flip into the "tightening standards" zone, without any rebound in European bank shares or decline in corporate borrowing rates, the ECB could be tempted to go down the TLTRO route once again. Bottom Line: If the ECB downgrades its growth and inflation forecasts next month, delaying the end of the APP into 2019 is unlikely, as is altering the country weightings within the APP portfolio. More plausible options include pushing out forward guidance on future rate hikes, extending the maturity of the existing bond holdings, or introducing a new TLTRO to support lending. Likely ECB Options & Investment Implications In our view, the most realistic outcomes for the December ECB meeting can be boiled down to two decisions, conditional on how the ECB's economic forecasts are presented: 1) Unchanged growth & inflation forecasts: The ECB will signal the end of new APP bond purchases at the end of December, while maintaining the current forward guidance on rate hikes that no move will occur until at least September 2019. 2) Downgraded growth & inflation forecasts: The ECB will signal the end of new APP bond purchases at the end of December, but will also push out forward guidance on the first rate hike to at least sometime in mid-2020. In the latter scenario, the ECB could also consider two other options: extending maturities within its German bond holdings, or announcing a new TLTRO. We think that the ECB will wait to see how financial markets absorb the end of new APP buying before considering any move on maturity extension. At the same time, the ECB would signal that a TLTRO is a possibility if lending standards deteriorate and borrowing rates climb higher. While the ECB has talked a lot about how they will continue to reinvest the proceeds of maturing bonds in its portfolio, similar to what the Federal Reserve did after it ended its QE buying, the bigger impact on bond yields will come from a worsening of the supply/demand balance for European bonds. The ECB has been buying amounts greater than the entire net bond issuance of all euro area governments since the APP started in 2015, which has created a scarcity of risk-free sovereign debt for private investors. The result: extremely low bond yields, with a negative term premium (Chart 13). Reduced ECB buying will result in more bonds that have to be purchased by private investors, and a less negative term premium, going forward. Chart 13Bund Term Premium Unwind?
Bund Term Premium Unwind?
Bund Term Premium Unwind?
How high euro area bond yields eventually go will then be determined by more traditional factors, like inflation expectations and the expected path of ECB rate hikes. Going back to the ECB's previous tightening cycles over its existence, actual rate hikes did now occur before inflation expectations - as measured by 5-year CPI swaps, 5-years forward - rose above 2% (Chart 14). Those inflation expectations are now 32bps below that level, and the ECB will not begin to shift to less dovish forward guidance unless the markets begin to discount more stable inflation close to the ECB's "near 2%" target. Chart 14Not Enough Inflation (Yet) To Justify Rate Hikes
Not Enough Inflation (Yet) To Justify Rate Hikes
Not Enough Inflation (Yet) To Justify Rate Hikes
Dovish guidance on future ECB rate hikes will continue to widen the U.S.-Europe interest rate differentials that have helped weaken the euro versus the U.S. dollar in 2018 (Chart 15). This will continue to put downward pressure on EUR/USD cross, particularly with neutral momentum and positioning indicators suggesting that the euro is not yet oversold (bottom panel). Chart 15Likely ECB Actions Are Euro-Bearish
Likely ECB Actions Are Euro-Bearish
Likely ECB Actions Are Euro-Bearish
Bottom Line: The ECB is most likely to take a less hawkish slant in December, but will not signal any rapid move to begin hiking rates. This outcome will be bearish for the euro, but only neutral at best for overvalued European government bonds. Robert Robis, CFA, Senior Vice President Global Fixed Income Strategy rrobis@bcaresearch.com 1 Since not every country in the euro area is also part of the OECD, we could only use 14 of the 19 countries in the euro area in the indicator shown in the middle panel of Chart 5. 2 Please see BCA Foreign Exchange Strategy/Global Fixed Income Strategy Special Report, "Will Rising Wages Cause An Imminent Change In Policy Direction In Europe And Japan?, dated October 6th 2018, available at fes.bcaresearch.com and gfis.bcaresearch.com. 3 The ECB does allow the purchase of both federal government bonds, as well as the debt of government agencies and supranationals, as part of its APP. For our projections, we have assumed that of the €15bn in net new bonds that the ECB buys each month, 82% are debt issued by government-related entities (i.e. 18% goes to credit instruments like corporate bonds and covered bonds), with 10% of those government purchases going to supras. From that reduced number, we assume anywhere from 10-30% of purchases go to agencies, depending on the country. For the sake of simplicity, we also assume a pace of net government bond issuance in line with that seen over the past year, rather than make specific assumptions on changes in individual country budget deficits.
Dear Client, Next week, I am on the road in the Middle East visiting clients and teaching the BCA Academy Principles of Global Macro course. There will be no regular Weekly Report on November 9th. Instead, we will be sending you a Special Report on November 6th written by my colleague Rob Robis, who runs BCA's Global Fixed Income Strategy service. In this piece, Rob will be discussing the outlook for Euro Area monetary policy and its implications for rate markets and the euro. This is an especially relevant topic as the end of the ECB's Asset Purchase Program is scheduled to soon materialize. I trust you will find this report both interesting and informative. Best regards, Mathieu Savary, Vice President Foreign Exchange Strategy Highlights Uncovered Interest Rate Parity still works for currencies. However, it needs to be based on a combination of short- and long-term real rates. Currencies are also affected by global risk appetite, as approximated by corporate spreads and commodity prices. Based on our timing models, the dollar is now fairly valued on short-term basis. However, slowing global growth and robust U.S. activity suggest that the dollar has room to rally further, with our models pointing to a move in the greenback's favor. These conflicting forces suggest the dollar's easy gains are behind us, and any further dollar rally will prove much more volatile. Feature In July 2016, in a Special Report titled, "In Search Of A Lost Timing Model," we introduced a set of intermediate-term models to complement our long-term fair value models for various currencies.1 These groups of models provide additional discipline - a sanity check if you will - to our regular analysis. Additionally, these models can help global equity investors manage their currency exposure, thanks to their ability to increase the Sharpe ratio of global equity portfolios vis-Ã -vis other hedging strategies, and also for a host of base-currencies.2 In this report, we review the logic underpinning these intermediate-term models and provide commentary on their most recent readings for the G10 currencies vis-Ã -vis the USD. UIP, Revisited The Uncovered Interest Rate Parity (UIP) relationship is at the core of this modeling exercise. This theory suggests that an equilibrium exchange rate is what will make an investor indifferent between holding the bonds of Country A or Country B. This means that as interest rates rise in Country A relative to Country B, the currency of Country B will fall today in order to appreciate in the future. These higher expected returns are what will drive investors to hold the lower-yielding bonds of Country B. There has long been debate as to whether investors should focus on short rates or long rates when looking at exchange rates through the prism of UIP. This debate has regained vigor in the past six months as the dollar has greatly lagged the levels implied by 2-year rate differentials (Chart 1). Research by the Federal Reserve and the IMF suggests that incorporating longer-term rates to UIP models increase their accuracy.3 This informational advantage works whether policy rates are or aren't close to their lower bound.4 Chart 1Interest Rate Parity: Generally Helpful, But...
Interest Rate Parity: Generally Helpful, But...
Interest Rate Parity: Generally Helpful, But...
Incorporating long-term rates as an explanatory variable increases the performance of UIP models because exchange rate movements not only reflect current interest rate conditions, but currency market investors also try to anticipate the path of interest rates over many periods. By definition, long-term bonds do just that, as they are based on the expected path of short rates over their maturity - as well as a term premium, which compensates for the uncertain nature of future interest rates. There is another reason why long-term rate differential changes improve the power of UIP models. Since UIP models are based on the concept of indifference among investors between assets in two countries, changes in the spreads between 10-year bonds in these two countries will create more volatility in the currency pair than changes in the spreads between 3-month rates. This is because an equivalent delta in the 10-year spread will have a much greater impact on the relative prices of the bonds than on the short-term paper, courtesy of their much more elevated duration. To compensate for these greater changes in prices, the currency does have to overshoot its long-term PPP to a much greater extent to entice investors trading the long end of the curve. Bottom Line: The interest rate parity relationship still constitutes the bedrock of any shorter-term currency fair value model. However, to increase its accuracy, both long-term and short-term rates should be used. Real Rates Really Count Another perennial question regarding exchange rate determination is whether to use nominal or real rate differentials. At a theoretical level, real rates are what matter. Investors can look through the loss of purchasing power created by inflation. Therefore, exchange rates overshoot around real rate differentials, not nominal ones. On a practical level, there are additional reasons to believe that real rates should matter, especially when trying to explain currency moves beyond a few weeks. Indeed, various surveys and studies on models used by forecasters and traders show that FX professionals use purchasing power parity as well as productivity differential concepts when setting their forex forecasts.5 Indeed, as Chart 2 illustrates, real rate differentials have withstood the test of time as an explanatory variable for exchange rate dynamics, albeit with periods where rate differentials and the currency can deviate from one another. Chart 2Real Rates Work Better Over The Long Run
Real Rates Work Better Over The Long Run
Real Rates Work Better Over The Long Run
It is true that very often, nominal rate differentials can be used as a shorthand for real rate differentials, as both interest rate gaps tend to move together. However, regularly enough, they do not. In countries with very depressed inflation expectations (Japan immediately comes to mind), nominal and real rate differentials can in fact look very different (Chart 3). With the informational cost of incorporating market-based inflation expectations being very low, we find the shorthand unnecessary when building UIP-based models. Chart 3Real And Nominal Rate Spreads Can Differ
Real And Nominal Rate Spreads Can Differ
Real And Nominal Rate Spreads Can Differ
Finally, it is important to remark that in environments of high inflation, inflation differentials dominate any other factor when it comes to exchange rate determination. However, the currencies discussed in this report currently are not like Zimbabwe or Latin America in the early 1980s. Bottom Line: When considering an intermediate-term fair value model for exchange rates, investors should focus on real - not nominal - long-term rate differentials. Global Risk Aversion And Commodity Prices Global risk appetite is also a key factor in trying to model exchange rates. Risk-aversion shocks tend to lead to appreciation in the U.S. dollar, which benefits from its status as the global reserve currency.6 Much literature has focused on the use of the VIX as a gauge for global risk appetite. Our exercise shows stronger explanatory power with options-adjusted spreads on junk bonds (Chart 4). Chart 4The Dollar Benefits From Global Stresses
The Dollar Benefits From Global Stresses
The Dollar Benefits From Global Stresses
Commodity prices, too, play a key role. Historically, commodity prices have displayed a very strong negative correlation with the dollar.7 This correlation is obviously at its strongest for commodity-producing nations, as rising natural resources prices constitute a terms-of-trade shock for them. However, this relationship holds up for the euro as well, something already documented by the European Central Bank.8 The Models The models for each cross rate are built to reflect the insight gleaned above. Each cross is modeled on three variables, with the model computed on a weekly timeframe. Real rates differentials: We use the average of 2-year and 10-year real rates. The rates are deflated using inflation expectations. Global risk appetite approximated by junk OAS. Commodity prices: We use the Bloomberg Continuous Commodity Index. For all countries, the variables are statistically highly significant and of the expected signs. These models help us understand in which direction the fundamentals are pushing the currency. We refer to these as Fundamental Intermediate-Term Models (FITM). We created a second set of models, based on the variables above, which also include a 52-week moving average for each cross. The real rates differentials, junk spreads and commodity prices remain statistically very significant and of the correct sign. They are therefore trend- and risk-appetite adjusted UIP-deviation models. These models are more useful as timing indicators on a three- to nine-month basis, as their error terms revert to zero much faster. We refer to these as Intermediate-Term Timing Models (ITTM). Mathieu Savary, Vice President Foreign Exchange Strategy mathieu@bcaresearch.com The U.S. Dollar To model the dollar index (DXY), we used two approaches. In the first one, we took all the deviation from fair value for the pairs constituting the index, based on their weights in the DXY. In the second approach, we ran the model specifically for the DXY, using the three variables described above. U.S. real rates were compared to an average of euro area, Japanese, Canadian, British, Swiss and Swedish real rates, weighted by their contribution to the DXY. We then averaged both approaches, which gave us very similar results to begin with. Currently, there is no evident mispricing in the USD, as it trades near fair value when compared to both the FITM (Chart 5) and ITTM. While this means that the easy part of the dollar rally is behind us, it does not imply that the rally is over. As Chart 6 illustrates, periods of dollar strength tend to end when the dollar trades at a 5% premium to the ITTM. This would imply that a move to 102 on the DXY is likely over the coming months. Moreover, the widening interest rate differential between the U.S. and the rest of the world, as well the bout of rising volatility the world is experiencing, should continue to push the fair values of both the FITM and ITTM higher. Chart 5Fundamentals Continue To Help The Dollar
Fundamentals Continue To Help The Dollar
Fundamentals Continue To Help The Dollar
Chart 6More Upside Is Possible
More Upside Is Possible
More Upside Is Possible
The Euro As a mirror image to the DXY, there is no evident mispricing in EUR/USD. Currently, based on both the FITM and the ITTM, the euro trades at a small premium to fair value (Chart 7). However, the sell signal generated by the deviation from the ITTM in 2017 is still in place, as periods of overvaluation tend to be followed by periods of undervaluation (Chart 8). This indicator will only generate a buy signal for the euro once EUR/USD falls 5% below equilibrium, or to a level of 1.06. Moreover, this target is a moving one. European growth and inflation continue to disappoint, as the euro area feels the drag of a slowing China and decelerating global growth. This means that interest rate differentials are likely to continue to move in a euro-bearish fashion in the coming months. Hence, the flattening in the FITM that materialized in 2018 is at risk of becoming an outright deterioration. Chart 7Fundamentals For The Euro Are Deteriorating
Fundamentals For The Euro Are Deteriorating
Fundamentals For The Euro Are Deteriorating
Chart 8EUR/USD Is Not Cheap
EUR/USD Is Not Cheap
EUR/USD Is Not Cheap
The Yen In an environment of rising global bond yields, the FITM for the yen continues to trend south, as Japanese rates lag well behind U.S. interest rates (Chart 9). This means the yen is once again trading at a small premium to its FITM, implying that even if global risk assets sell off further, the upside for the yen against the dollar may prove limited. However, the picture for the yen against the ITTM is more benign. The yen is at equilibrium on this basis (Chart 10). However, due to the design of the ITTM, previous periods of overvaluations tend to be followed by periods of undervaluation. As a result, on the basis of this model, the yen could continue to experience downside against the dollar over the coming three to six months. This will be even truer if U.S. bond yields can continue to rise. Chart 9Rate Differentials Continue To Hurt The Yen
Rate Differentials Continue To Hurt The Yen
Rate Differentials Continue To Hurt The Yen
Chart 10More Downside Ahead If U.S. Yields Keep Rising
More Downside Ahead If U.S. Yields Keep Rising
More Downside Ahead If U.S. Yields Keep Rising
The British Pound The GBP/USD has deteriorated in recent weeks, a move that was mimicked by cable itself. As a result, the pound does not show any evident mispricing on this basis against the USD (Chart 11). The ITTM corroborates this message, as GBP/USD trades at a marginal 1% discount to this indicator (Chart 12). This upholds our analysis of September 7, which showed there was little risk premium embedded in the pound to compensate investors for the risks associated with the Brexit negotiations and the cloudy British political climate.9 Since British politics remain a minefield, this lack of valuation cushion suggests that the GBP is likely to continue to swing widely. As a result, a strategy to be long volatility in the pound, or to bet on the reversal of both large upside and downside weekly moves in the GBP, remains our preferred approach. Chart 11Cable Is At Equilibrium
Cable Is At Equilibrium
Cable Is At Equilibrium
Chart 12Small Valuation Cushion Could Be Problem If Political Risk Increases
Small Valuation Cushion Could Be Problem If Political Risk Increases
Small Valuation Cushion Could Be Problem If Political Risk Increases
The Canadian Dollar Despite the softening evident in the Loonie's FITM, the Canadian dollar continues to trade at a substantial discount to this fair value model (Chart 13). However, the FITM for the CAD is at risk of weakening further as oil prices have begun to be engulfed in the weakness that has gripped EM and risk assets globally. Mitigating this message, on the eve of the announcement of the USMCA trade deal, which essentially kept in place the trade relationships that existed between the U.S. and Canada under NAFTA, the Loonie was trading at a 1.5 sigma discount to the ITTM, a level normally constituting a buy signal (Chart 14). As a result, we expect the Canadian dollar to not be as sensitive to commodity price weakness as would have been the case had the CAD traded at a premium to its ITTM. This is one factor explaining why the Canadian dollar remains one of our favorite currencies outside the USD for the coming three to six months. The second favorable factor for the CAD is that the Bank of Canada is likely to hike interest rates at the same pace as the Fed. Hence, unlike with other currencies, interest rate differentials are unlikely to move against the CAD. Chart 13Loonie Trades At A Big Discount To Fundamentals...
Loonie Trades At A Big Discount To Fundamentals...
Loonie Trades At A Big Discount To Fundamentals...
Chart 14...Which Will Help The CAD Mitigate A Fall In Oil Prices
...Which Will Help The CAD Mitigate A Fall In Oil Prices
...Which Will Help The CAD Mitigate A Fall In Oil Prices
The Swiss Franc Like the euro, the Swiss franc trades in line with both its FITM and ITTM fair values (Chart 15). Moreover, the CHF has been hovering around its fair value for nearly a year now, which means there is less of a case for an undershoot of the ITTM fair value than for currencies that have experienced recent overshoot (Chart 16). Moreover, if volatility in financial markets remains elevated, and volatility within the bond market picks up, the fair value of the Swissie could experience some upside. However, this is where the positives for the Swiss franc end. The Swiss economy remains mired by underlying deflationary weaknesses, reflecting the lack of Swiss pricing power as well as the tepid growth of Swiss wages. As a result, the interest rate differential components of the models are likely to continue to represent a headwind for the CHF, especially as the Swiss National Bank remains firmly dovish and wants to keep real interest rates at low levels in order to weigh on the franc and also stimulate domestic demand. Based on these bifurcated influences, while we remain negative on the CHF against both the dollar and the euro on a cyclical basis, EUR/CHF may remain under downward pressure over the coming three to six months. Chart 15No Valuation Mismatch...
No Valuation Mismatch...
No Valuation Mismatch...
Chart 16...Implies That The CHF Will Be At The Mercy Of Central Banks
...Implies That The CHF Will Be At The Mercy Of Central Banks
...Implies That The CHF Will Be At The Mercy Of Central Banks
The Australian Dollar While the Australian dollar continues to trade at a significant premium against long-term models, it now trades at an important discount against both its FITM and ITTM equilibria (Chart 17). However, the problem for the AUD is that the FITM estimates continue to trend lower as Australian interest rates are lagging U.S. rates, especially in real terms. This is a direct consequence of the Reserve Bank of Australia maintaining the cash rate at multi-generational lows, while the Fed keeps hiking its own policy benchmark. With real estate prices sagging in both Melbourne and Sydney, as well as with a lack of wage growth and inflationary pressures, this down-under dichotomy is likely to remain in place and further weigh on the AUD. Meanwhile, while it is true that the AUD is also trading at a discount to its ITTM, historically, the Aussie has bottomed at slightly deeper levels of undervaluation (Chart 18). When all these factors are taken in aggregate, they suggest that for the AUD to fall meaningfully from current levels, we need to see more EM pain, more Chinese economic weaknesses, and commodity prices following these two variables lower. While this remains BCA's central scenario for the coming three to six months, if this scenario does not pan out the AUD could experience a sharp rebound over that timeframe. Chart 17Discount In AUD Emerging...
Discount In AUD Emerging...
Discount In AUD Emerging...
Chart 18...But Not Yet Large Enough
...But Not Yet Large Enough
...But Not Yet Large Enough
The New Zealand Dollar The NZD now trades at an even greater discount to both its FITM and ITTM equilibria than the AUD (Chart 19). In fact, so large is this discount that the ITTM is flashing a buy signal for the kiwi (Chart 20). This further confirms the view that we espoused 3 weeks ago that the NZD was set to rebound. As a result, we remain comfortable with our tactical recommendation of buying NZD/USD and selling GBP/NZD. The long NZD/USD position is definitely the riskier one of the two, as the NZD's upside may be limited if EM markets sell off further. In fact, NZD/USD traded at an even greater discount to its ITTM fair value when EM markets were extremely weak in late 2015 and early 2016. However, EM spreads are narrower and EM equities today trade well above the levels that prevail in those days, implying a margin of safety exists for the NZD. Meanwhile, short GBP/NZD is less likely to be challenged by weak EM asset prices, especially as in a post-Brexit environment the U.K. needs global risk aversion to stay low and global liquidity to remain ample in order to finance its large current account deficit of 3.3% of GDP. Chart 19NZD Is Now So Cheap...
NZD Is Now So Cheap...
NZD Is Now So Cheap...
Chart 20...That It Is A Buy
...That It Is A Buy
...That It Is A Buy
The Norwegian Krone The Norwegian krone continues to trade at a large discount to its FITM. However, this pair often experiences large and persistent deviations from this model (Chart 21). Nonetheless, it is important to note that as real interest rate differentials between the U.S. and Norway continue to widen, the fundamental drivers of the NOK are set to deteriorate further. By construction, the ITTM has proven to be a more reliable indicator for the Norwegian krone. While the NOK is currently at fair value on this metric, it is concerning that the upward trend in the ITTM has ended and that the equilibrium value for this currency has begun to deteriorate (Chart 22). As such, if oil prices are not able to find a floor at current levels, USD/NOK is likely to experience additional upside. This is because on a three- to six-month basis, there is not enough of a valuation cushion embedded in the NOK at current levels to prevent the Norwegian krone from experiencing deleterious effects in a weak energy price environment. Chart 21The NOK Fundmentals's Are Still Pointing South
The NOK Fundmentals's Are Still Pointing South
The NOK Fundmentals's Are Still Pointing South
Chart 22...And The NOK Remains Vulnerable Versus The USD
...And The NOK Remains Vulnerable Versus The USD
...And The NOK Remains Vulnerable Versus The USD
The Swedish Krona The very easy monetary policy conducted by the Riksbank is the key factor explaining why the Swedish krona remains so weak. Indeed, despite a robust economy, Swedish real interest rates are lagging well behind U.S. rates, which is putting strong downward pressure on the SEK's FITM (Chart 23). Meanwhile, despite the SEK's prodigious weakness, this currency only trades at a modest, statistically insignificant discount to its ITTM (Chart 24). This picture suggests that for the SEK to appreciate, the Riksbank needs to become much more aggressive. It is true that the Swedish central bank has flagged an imminent rise in interest rates, but the pace of increase will continue to lag far behind the Fed's own tightening. Moreover, the weakness in global trade is likely to hamper Swedish growth as Sweden is a small, open economy very influenced by gyrations in global industrial activity. As a result, the current slowdown in global trade may well give the Riksbank yet another excuse to only timidly remove monetary accommodation. This suggests that both the FITM and ITTM for the SEK have downward potential. Chart 23The Riskbank Still Hurts The SEK
The Riskbank Still Hurts The SEK
The Riskbank Still Hurts The SEK
Chart 24...And The Krona Needs To Build A Greater Valuation Cushion
...And The Krona Needs To Build A Greater Valuation Cushion
...And The Krona Needs To Build A Greater Valuation Cushion
1 Please see Foreign Exchange Strategy / Global Investment Strategy Special Report titled, "Assessing Fair Value In FX Markets", dated February 26, 2016, available at fes.bcaresearch.com and gis.bcaresearch.com 2 Please see Foreign Exchange Strategy / Global Asset Allocation Special Reports titled, "Currency Hedging: Dynamic Or Static? - A Practical Guide For Global Equity Investors", dated September 29, 2017, and "Currency Hedging: Dynamic Or Static? - A Practical Guide For Global Equity Investors (Part II)", dated October 13, 2017, available at fes.bcaresearch.com and gaa.bcaresearch.com 3 Ravi Balakrishnan, Stefan Laseen, and Andrea Pescatori, "U.S. Dollar Dynamics: How Important Are Policy Divergence And FX Risk Premiums?" IMF Working Paper No.16/125 (July 2016); and Michael T. Kiley, "Exchange Rates, Monetary Policy Statements, And Uncovered Interest Parity: Before And After The Zero Lower Bound," Finance and Economics Discussion Series 2013-17, Board of Governors of the Federal Reserve System (January 2013). 4 Michael T. Kiley (January 2013). 5 Please see Yin-Wong Cheung and Menzie David Chinn, "Currency Traders and Exchange Rate Dynamics: A Survey of the U.S. Market," CESifo Working Paper Series No. 251 (February 2000); and David Hauner, Jaewoo Lee, and Hajime Takizawa, "In which exchange rate models do forecasters trust?" IMF Working Paper No.11/116 (May 2010) for revealed preference approach based on published forecasts from Consensus Economics. 6 Ravi Balakrishnan, Stefan Laseen, and Andrea Pescatori (July 2016) 7 Ravi Balakrishnan, Stefan Laseen, and Andrea Pescatori (July 2016) 8 Francisco Maeso-Fernandez, Chiara Osbat, and Bernd Schnatz, "Determinants Of The Euro Real Effective Exchange Rate: A BEER/PEER Approach," Working Paper No.85, European Central Bank (November 2001). 9 Please see Foreign Exchange Strategy Special Report, titled "Assesing The Geopolitical Risk Premium In the Pound", dated September 7, 2018, available at fes.bcaresearch.com Trades & Forecasts Forecast Summary Core Portfolio Tactical Trades Closed Trades
Highlights Four high conviction long-term investment views: The Italy versus Spain sovereign yield spread will compress. The yen will go up. The yield shortfall on German bunds versus U.S. T-bonds will compress. Swedish real estate prices will face strong headwinds. Chart of the WeekThe Italy Versus Spain Sovereign Yield Spread Is At An All-Time Wide
The Italy Versus Spain Sovereign Yield Spread Is At An All-Time Wide
The Italy Versus Spain Sovereign Yield Spread Is At An All-Time Wide
Feature This week's report focusses on 'must-read' recent commentaries from two giants of central banking: Mario Draghi, President of the ECB 2011-19; and Paul Volcker, Chairman of the U.S. Federal Reserve 1979-87. In the case of Paul Volcker, the term giant is not just metaphorical but also literal, as he stands six feet seven inches tall! The Volcker piece is the more profound of the two commentaries because it shatters a shibboleth of monetary policy - the 2 percent inflation target. But we will begin with Draghi. Draghi Reveals Some Home Truths The first must-read is the transcript of the latest ECB press conference.1 Draghi's remarks provide valuable insights into the direction of euro area monetary policy, the impact on sovereign yield spreads, and a view on the budget spat between the EU and Draghi's country of origin, Italy. Despite the recent wobble in the euro area economy, the ECB remains on course to end QE and gradually raise ultra-accommodative interest rates. Although Draghi acknowledged the deceleration in euro area growth in the third quarter to 0.6 percent (annualised rate), he attributed some of it to "country-specific idiosyncratic phenomena", for example the car sector in Germany having to meet new standards on emissions. Another drag came from exports, but Draghi pointed out that "the emerging market situation seems to have stabilised". Meanwhile, euro area consumption trends remain pretty strong, buoyed by expanding employment and rising wages. Negotiated wages keep on going up. "This is a very comforting sign because it means that wage increases, which have been quite significant in some core countries, are going to stay". Most significantly, "the labour market keeps on expanding but it is progressively getting tighter and tighter, and capacity utilisation rates in most countries are pretty high". Draghi went on to correct a common myth. The ECB's QE (and its end) does not in itself impact euro area sovereign credit spreads, and he gave a powerful illustration. Although the ECB has not bought Greek bonds but has bought Italian bonds, the spread between Greece and Italy has narrowed sharply (Chart I-2). Hence, the end of QE does not imply widening spreads. "We would expect spreads to depend only on perceptions of net issuance... if countries were having the same net issuance, you wouldn't see any change in spreads". Chart I-2The ECB Hasn't Bought Greek Bonds, Yet The Greece Versus Italy Sovereign Spread Has Narrowed
The ECB Hasn't Bought Greek Bonds, Yet The Greece Versus Italy Sovereign Spread Has Narrowed
The ECB Hasn't Bought Greek Bonds, Yet The Greece Versus Italy Sovereign Spread Has Narrowed
Draghi also provided an important insight on the recent low-level game of chicken between EU institutions and the Italian government over its 2019 budget. Draghi explained that for Italy, escalating the game of chicken risks higher interest rates through the bond market's perceptions for net issuance. But paradoxically, this reduces the room to expand the budget. The weakened capital position of Italian banks from lower bond prices (Chart I-3) combined with deteriorating funding conditions squeezes bank credit, economic growth, and thereby the very space that is needed for fiscal expansion. The latest bank credit data show signs of this danger (Chart I-4). Chart I-3The Capital Position Of Italian Banks Is Weak...
The Capital Position Of Italian Banks Is Weak...
The Capital Position Of Italian Banks Is Weak...
Chart I-4...And Italian Bank Credit Growth Has Faltered
...And Italian Bank Credit Growth Has Faltered
...And Italian Bank Credit Growth Has Faltered
Meanwhile, for the EU, escalating the game of chicken risks financial market contagion to other so-called 'non-core' countries such as Spain. But so far, the sovereign yield spreads of the non-core countries indicate few signs of such danger (Chart I-5). Chart I-5No Major Contagion From Italy To Other Non-Core Countries... Yet
No Major Contagion From Italy To Other Non-Core Countries... Yet
No Major Contagion From Italy To Other Non-Core Countries... Yet
Hence, at this stage in the low-level game of chicken, the onus to budge falls more on Italy than on the EU. Opining on his country of origin, Draghi says that in the end "it is just good common sense and perception of what is good for the country and the interests of the Italian people that will lead parties to converge to some sort of agreement". On the basis of Draghi's confidence, the long-term investment opportunity is the Italy versus Spain sovereign 10-year yield spread (Chart of the Week). At almost 200 bps, the spread is at its all-time widest, and incongruous with the vanishing gap between the non-performing loans ratios in Italy and Spain (Chart I-6). Still, for those interested in timing, our tactical stance is to wait for the 10-year BTP yield to move closer to 3 percent before buying Italian assets. Chart I-6Spain Fixed Its Banks In 2013, Italy Is Fixing Its Banks Now
Spain Fixed Its Banks In 2013, Italy Is Fixing Its Banks Now
Spain Fixed Its Banks In 2013, Italy Is Fixing Its Banks Now
What's Wrong With The 2 Percent Inflation Target The second, and more profound, must-read is a Bloomberg op-ed by Paul Volcker, What's Wrong With The 2 Percent Inflation Target.2 To be fair, we have an ulterior motive as the Volcker op-ed repeats almost word for word a Special Report that we penned three years ago, Mission Impossible: 2 Percent Inflation, and its subsequent update last year.3 Of course, we are not implying that Volcker based his piece on ours. Rather that it is a great honour that a central banking colossus such as Volcker would endorse every heterodox argument that we made. The 2 percent inflation target is a relatively recent phenomenon, whose origin can be traced back to New Zealand's Reserve Bank Act of 1989 (Chart I-7). But Volcker's (and our) overarching point is that in trying to manage an economy, "false precision can lead to dangerous policies". Price stability is that state in which expected changes in the general price level do not effectively alter business or household decisions (Chart I-8). However, it is ill-advised to define that state with a point target, such as 2 percent (Chart I-9). Chart I-7The 2 Percent Inflation Target Was Born In New Zealand In 1989
The 2 Percent Inflation Target Was Born In New Zealand In 1989
The 2 Percent Inflation Target Was Born In New Zealand In 1989
Chart I-8Excluding Wars, Britain Had Price Stability For Centuries
Excluding Wars, Britain Had Price Stability For Centuries
Excluding Wars, Britain Had Price Stability For Centuries
Chart I-9Switzerland And Japan Have Had Price Stability For Decades Despite Not Achieving 2 Percent Inflation
Switzerland And Japan Have Had Price Stability For Decades Despite Not Achieving 2 Percent Inflation
Switzerland And Japan Have Had Price Stability For Decades Despite Not Achieving 2 Percent Inflation
To paraphrase Volcker, a 2 percent target, or limit, is not in the textbooks; there is no theoretical justification; it is difficult to be both a target and a limit at the same time; and no price index can capture, down to a tenth or a quarter of a percent, the real change in consumer prices. Yet with economic growth robust and unemployment rates near historic lows, concerns are being voiced that consumer prices are growing too slowly - just because they are a quarter percent or so below the 2 percent target! Could that be a signal to delay restraint? That would be nonsense. The seeming numerical precision of 2 percent suggests that it is possible to fine-tune policy with more flexible targeting as conditions change. Unfortunately, the tools of monetary and fiscal policy simply do not permit that degree of precision. Another argument runs, let's keep a little inflation - even in a recession - as a kind of safeguard against deflation, and a backdoor way of keeping real interest rates negative. Borrowers will be enticed to borrow at zero or low interest rates, to invest before prices rise further. However, all these arguments seem to have little empirical support. Actual deflation is rare, yet the exaggerated fear of it can lead to policies that inadvertently increase the risk. Deflation is a threat posed by a critical breakdown of the financial system, so the real danger comes from encouraging extreme speculation and risk taking, in effect standing by while bubbles and excesses threaten financial markets (Chart 10). Previously, we wrote that "the single minded pursuit of 2 percent inflation creates risks and instabilities". Volcker issues a strikingly similar warning: "Ironically, the easy money, striving for a little inflation, as a means of forestalling deflation, could, in the end, be what brings it about". Chart I-10The Real Danger Comes From Bubbles And Financial Market Excesses
The Real Danger Comes From Bubbles And Financial Market Excesses
The Real Danger Comes From Bubbles And Financial Market Excesses
Hence, the central banks whose interest rates remain at the zero bound - the BoJ, ECB, and Riksbank - are the ones whose policy is most dangerous and incongruous with their economic fundamentals. On this premise we hold three high conviction multi-year investment views: The yen will go up. The yield shortfall on German bunds versus U.S. T-bonds will compress. Swedish real estate prices will face strong headwinds. Dhaval Joshi, Senior Vice President Chief European Investment Strategist dhaval@bcaresearch.com 1 https://www.ecb.europa.eu/press/pressconf/2018/html/ecb.is181025.en.html. 2 https://www.bloomberg.com/opinion/articles/2018-10-24/what-s-wrong-with-the-2-percent-inflation-target 3 Please see the European Investment Strategy Special Report 'Mission Impossible: 2% Inflation' August 20, 2015 and Weekly Report 'Mission Impossible: 2% Inflation An Update' July 20, 2017 available at eis.bcaresearch.com. Fractal Trading Model* Long Eurostoxx50 versus Nikkei225 achieved its 3.5% profit target and is now closed. There are no trades this week, leaving three open positions. For any investment, excessive trend following and groupthink can reach a natural point of instability, at which point the established trend is highly likely to break down with or without an external catalyst. An early warning sign is the investment's fractal dimension approaching its natural lower bound. Encouragingly, this trigger has consistently identified countertrend moves of various magnitudes across all asset classes. Chart I-11
Long Eurostoxx50 VS. Nikkei 225
Long Eurostoxx50 VS. Nikkei 225
The post-June 9, 2016 fractal trading model rules are: When the fractal dimension approaches the lower limit after an investment has been in an established trend it is a potential trigger for a liquidity-triggered trend reversal. Therefore, open a countertrend position. The profit target is a one-third reversal of the preceding 13-week move. Apply a symmetrical stop-loss. Close the position at the profit target or stop-loss. Otherwise close the position after 13 weeks. Use the position size multiple to control risk. The position size will be smaller for more risky positions. * For more details please see the European Investment Strategy Special Report "Fractals, Liquidity & A Trading Model," dated December 11, 2014, available at eis.bcaresearch.com Fractal Trading Model RECOMMENDATIONS Asset Allocation Equity Regional And Country Allocation Equity Sector Allocation Bond And Interest Rate Allocation Currency And Other Allocation Closed Fractal Trades Trades Closed Trades Asset Performance Currency & Bond Equity Sector Country Equity Indicators Bond Yields Chart II-1Indicators To Watch - Bond Yields
Indicators To Watch - Bond Yields
Indicators To Watch - Bond Yields
Chart II-2Indicators To Watch - Bond Yields
Indicators To Watch - Bond Yields
Indicators To Watch - Bond Yields
Chart II-3Indicators To Watch - Bond Yields
Indicators To Watch - Bond Yields
Indicators To Watch - Bond Yields
Chart II-4Indicators To Watch - Bond Yields
Indicators To Watch - Bond Yields
Indicators To Watch - Bond Yields
Interest Rate Chart II-5Indicators To Watch - Interest Rate Expectations
Indicators To Watch - Interest Rate Expectations
Indicators To Watch - Interest Rate Expectations
Chart II-6Indicators To Watch - Interest Rate Expectations
Indicators To Watch - Interest Rate Expectations
Indicators To Watch - Interest Rate Expectations
Chart II-7Indicators To Watch - Interest Rate Expectations
Indicators To Watch - Interest Rate Expectations
Indicators To Watch - Interest Rate Expectations
Chart II-8Indicators To Watch - Interest Rate Expectations
Indicators To Watch - Interest Rate Expectations
Indicators To Watch - Interest Rate Expectations
The latest data releases for the Eurozone have been mixed. Real GDP growth disappointed with a 0.2% Q/Q rise in the third quarter. This is in line with the pullback in other indicators, such as the PMIs, highlighting that the Eurozone economy is being hit by…
The most important question for global investors is whether Merkel's fall from grace is related to a growing trend of populism in Europe. The answer is ‘yes’ in part, but Merkel's problem runs deeper. Merkel-fatigue in Germany has deeper roots than her…
Highlights So What? Chancellor Angela Merkel's decision to step down as party chairperson is positive for European political evolution and thus not a risk to the market. Why? The Christian Democratic Union (CDU) is unlikely to turn Euroskeptic, the median German voter is not. Europhile Green Party is surging, throwing shade at the narrative that Germans are souring on Europe. New elections are unlikely in the next 12 months, neither main centrist party would benefit. Chancellor Merkel's stabilizing role in the Euro Area crisis is overstated. Infusion of new blood is precisely what Germany, and Europe, needs. Also... 2019 will be a big year for Europe with multiple decisions to be taken on governance reforms. New leadership in Berlin is exactly what the doctor ordered. Feature German Chancellor Angela Merkel's Christian Democratic Union (CDU) suffered a deep loss in the Hesse election on October 28. Germany's main centrist parties - the center-right CDU and center-left Social Democratic Party (SPD) - suffered deep losses in Hesse, mirroring the results in Bavaria from October 14 (Chart 1). The results have prompted Angela Merkel to confirm that she will not stand for re-election as chair of the CDU at the Hamburg party convention and that she will not seek any political posts after her current term as chancellor ends in 2021. Chart 1Winners And Losers In Bavaria And Hesse
Merkel's Done. Now What?
Merkel's Done. Now What?
In this Client Note, we examine what Chancellor Merkel's decision means for Germany and Europe. Are Euroskeptics Taking Over Germany? The most important question for global investors is whether Merkel's fall from grace is related to a growing trend of populism in Europe. In part, yes. However, Merkel's problem is deeper. Merkel-fatigue in Germany has deeper roots than her decision on immigration in 2015. Polling suggests that Merkel recovered from that crisis and reached a 70% approval rating in mid-2017, only to see a precipitous decline since (Chart 2). Chart 2Merkel's Political Capital Is Spent
Merkel's Political Capital Is Spent
Merkel's Political Capital Is Spent
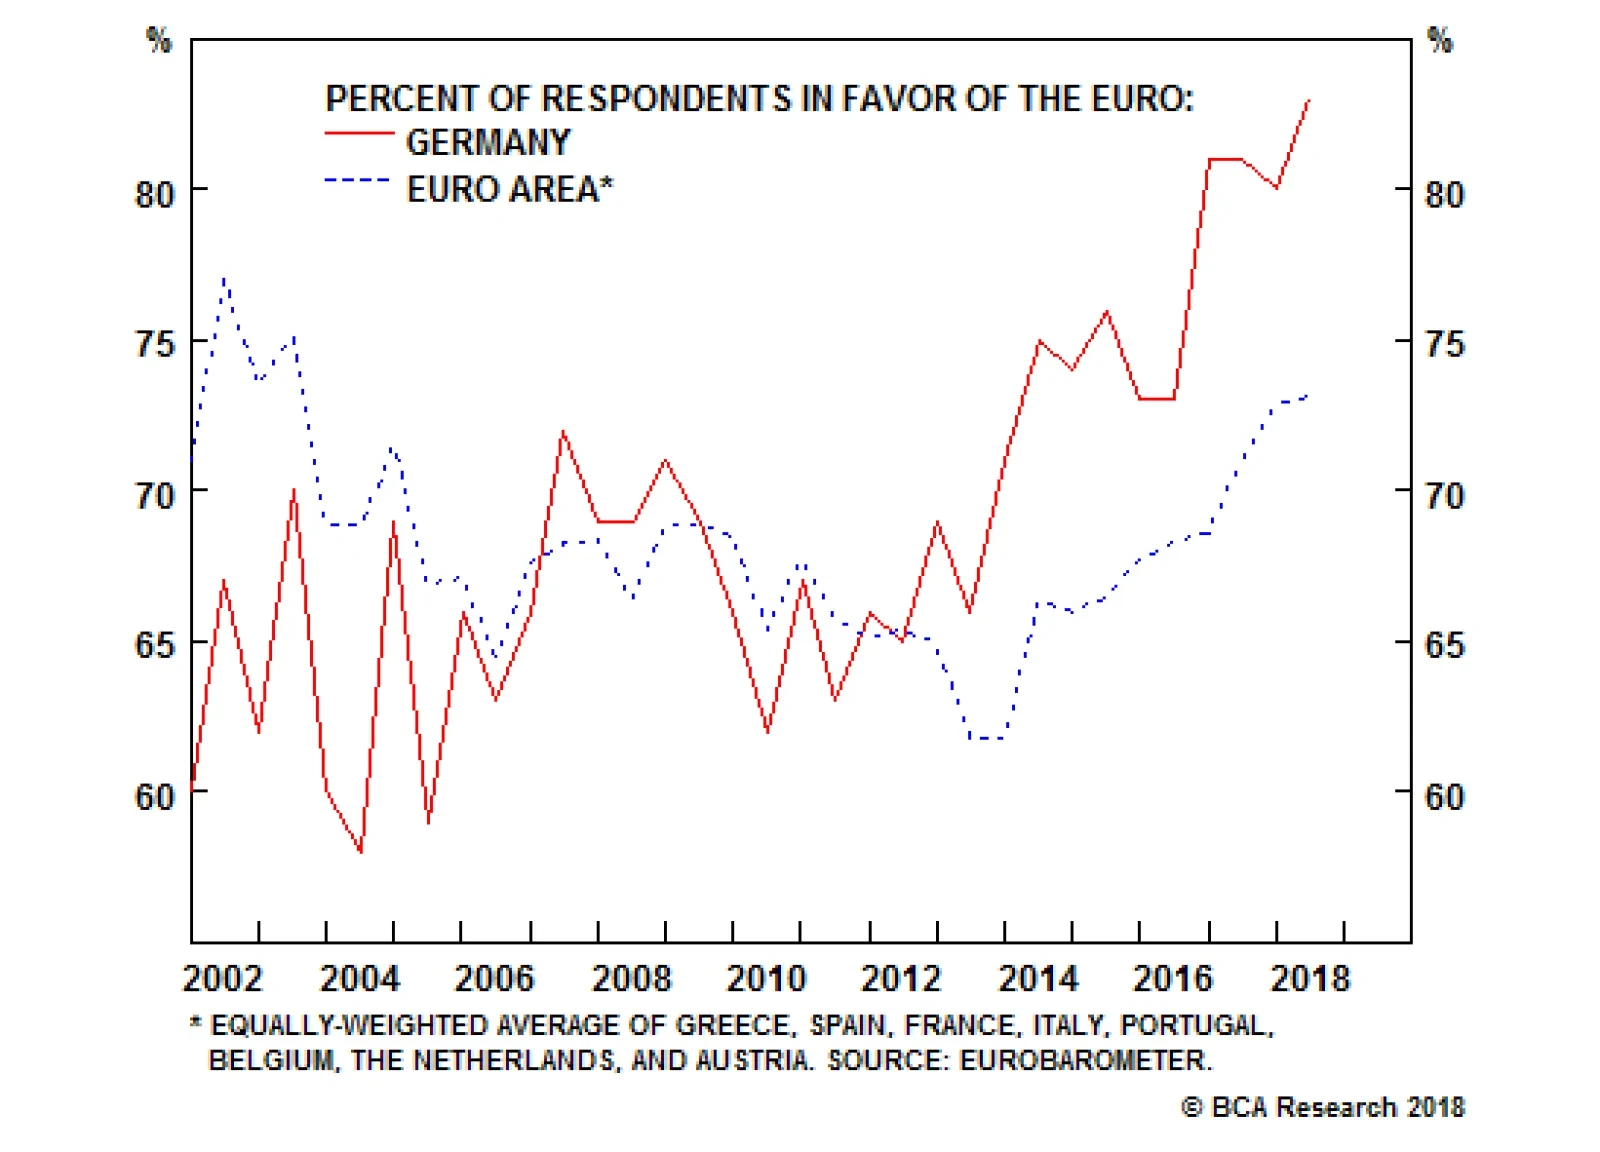
That said, German Euroskeptic sentiment is not on the rise (Chart 3). In fact, Germans support the currency union at one of the highest clips in Europe. Furthermore, Germans continue to "feel" European (Chart 4). Chart 3Germans Are Europhile...
Germans Are Europhile...
Germans Are Europhile...
Chart 4...And Feel Quite European
...And Feel Quite European
...And Feel Quite European
In the last two Lander elections in Bavaria and Hesse, the right-wing, Euroskeptic party Alternative for Germany (AfD) underperformed its national polling. Its support in opinion polls, at 16%, appears to be limited by the number of Germans who identify as Euroskeptic, similarly around 14%. In fact, it was the Green Party that surprised in both Bavaria and Hesse, gaining 8.9% and 8.7% respectively. Bottom Line: The short answer is no, Germany is not being taken over by Euroskeptics. True, the 2015 migration crisis has given the AfD a tailwind, allowing it to become entrenched in the political system. Yet just as impressive is the rise of the Europhile Green party (Chart 5). Chart 5Grand Coalition Parties Would Be Crazy To Call A New Election
Grand Coalition Parties Would Be Crazy To Call A New Election
Grand Coalition Parties Would Be Crazy To Call A New Election
OK, But Will The CDU Move To The Right? The previous question was purposely hyperbolic. The more nuanced question is whether the CDU will swing to the right in the face of AfD's rise? The answer depends on the issue. The two key issues are immigration and EU integration. On immigration, it is simply good politics for Germany's center-right party to steal from the AfD platform. The only downside of adopting a right-leaning immigrant policy is that it will make forming coalitions with the surging Green Party more difficult. It was immigration policy that ultimately prevented the so-called Jamaica Coalition - the CDU, the Green Party, and the pro-business and mildly Euroskeptic Free Democratic Party (FDP) - from becoming a fully-fledged ruling coalition in November 2017. This forced Merkel to re-establish the uninspiring Grand Coalition with the SPD.1 On European integration, it is possible that the CDU will adopt more Euroskeptic rhetoric, but such a move could backfire. First, data suggests that Germans continue to support the euro at a high clip. Second, AfD has already captured the "hard Euroskeptic" voters, whereas FDP has captured "soft Euroskeptics." It is unclear if the CDU has any chance of getting any of those voters back by crowding the "Euroskeptic corner." In fact, data from Bavaria and Hesse indicate that the CDU has been losing voters equally to the Green Party and the AfD. From the perspective of the Median Voter Theory, the CDU has a clear path forward. By remaining Europhile and pro-EU, it can ensure that it does not abandon the 83% of Germans who continue to support the currency union. The German median voter clearly does not want to abandon European institutions. But by ditching Merkel's liberal, pro-immigrant policy, the CDU can ensure that it withstands the AfD's attack on its right flank. Bottom Line: Germany's main center-right party has the luxury of picking its battles with the right-wing AfD. We suspect that the CDU will adopt some of the AfD's anti-immigrant rhetoric and policy, but retain its centrism on other issues. Who Will Replace Merkel As The Head Of The CDU? After months of speculation, Chancellor Merkel has confirmed that she will not pursue the CDU chairmanship at the upcoming December 7-8 party conference in Hamburg. Instead, Germany's ruling party will select a new chairperson, one who will be groomed as Merkel's successor for the 2021 election. The process for selecting the CDU chairperson is largely closed and dominated by party elites. The Federal Executive Board of the CDU - which is made up of the chairperson and 39 other members - sits down with the CDU parliamentary faction to approve the candidates, ensuring that a rogue candidate cannot stage a surprise in the delegate vote. It is highly likely that Merkel will be able to hand-pick a successor. Table 1 is our attempt to collate the likeliest candidates to replace Merkel as the head of the CDU. The list includes only one Euroskeptic candidate - former party whip Friedrich Merz who has not sat in the Bundestag since 2009 - and quite a few outright Europhiles. Merkel's preferred candidate is Annegret Kramp-Karrenbauer - often referred to by German media by her acronym AKK - a centrist who is to the left of Merkel on economic policy, EU matters, and social issues. Table 1Potential Merkel Successors
Merkel's Done. Now What?
Merkel's Done. Now What?
Given the short period of time between now and the Hamburg conference, it is highly unlikely that a surprise candidate - such as the Euroskeptic Merz - will emerge victorious. Merkel, for instance, spent months grooming the party rank-and-file prior to her nomination. Bottom Line: Merkel's successor is likely to be hand-picked. Will Merkel Survive Until 2021? Merkel's chances of staying in power until the end of the current government's term will increase if her favored successor - Kramp-Karrenbauer - emerges victorious in December. A win for an outsider, or someone highly critical of Merkel (such as Jens Spahn, who has disagreed with Merkel on immigration), might hasten Merkel's demise. How would such an outcome play out? If Merkel resigns, the Bundestag would have to elect a new chancellor with a simple majority. Given that the CDU currently governs in a coalition with the SPD, the latter party would have to support the election of a new chancellor. Kramp-Karrenbauer would be acceptable to the SPD, but one of the more contentious candidates may not. A new election would require the chancellor - Merkel or her successor - to lose a confidence vote that he or she has called. However, this is a controversial matter constitutionally as the government must claim that it has reached a legislative impasse on a particular issue. (Chancellor Gerhard Schroder argued in 2005 that his economic agenda was stalled.) The other question is why would either of the ruling parties want new elections at this point? Both centrist parties are tanking in the polls, as both Bavarian and Hesse elections signal and as overall polling indicates (see Chart 5). As such, we suspect that a new election will not take place over the next 12 months, at the very least. Bottom Line: Early elections are not easy to arrange and neither of the two ruling parties want one at the moment. Merkel has at least one more year in power. Investment Implications: Does Any Of This Matter? Chancellor Merkel has lost all of her political capital: that much is clear. As such, her decision to begin the process of finding a successor is a positive development, one that political leaders rarely take willingly. Given the election of a Europhile Emanuel Macron in France in 2017, Berlin needs to find a comparable partner that can carry on reforms. Otherwise, Germany risks wasting the window of opportunity afforded by the Macron presidency to make critical changes to Euro Area governance. On the agenda over the next year or two are several important issues. First, the European Stability Mechanism (ESM) is supposed to be granted new powers, evolving it into a kind of European replacement for the IMF. Some argue - including the ESM's leadership - that this expanded role will necessitate a greater injection of capital, for which obviously Berlin must be on board. Second, the stalled Banking Union project requires Berlin's intimate involvement. A deposit insurance union would go a long way toward stabilizing the Euro Area amid future financial crises. Under Merkel, Berlin has been reticent to greenlight such developments. Third, Berlin must agree with EU peers on several important positions after the European Parliament elections in May 2019. These will include staffing the European Commission. According to press reports this summer, Merkel was focused on ensuring that the next president of the European Commission would be a German. To get her way, Chancellor Merkel supposedly indicated that she would not fight to get a German to replace Mario Draghi, whose term at the ECB is set to expire in October 2019. A change at the top in Berlin, particularly if a Euroskeptic takes over the CDU, may signal a reversal of this strategy. That said, what Berlin wants is not necessarily what Berlin will get, no matter who is in charge. Finally, there is the philosophical question of whether Merkel has been a factor of stability for Europe over the past decade. We believe the answer is no. Not for any normative reason but rather because she has been an intently domestic chancellor. Investors have been overstating Merkel's role as the "anchor" of Euro Area stability. She has, in fact, dithered multiple times throughout the crisis. In 2011, for example, Merkel delayed the decision on whether to set up a permanent Euro Area fiscal backstop mechanism due to the upcoming Lander elections in Rhineland-Palatinate and Baden Württemberg. Such delays and hesitations have cost Europe considerable momentum throughout the crisis and since. As such, we believe that Chancellor Merkel's decision presents considerable upside for European politics and limited downside. Infusion of new blood in Berlin is the only way for Europe to restart the stalled governance reforms. However, much will depend on whether the CDU takes a significant turn towards a "softer Euroskeptic" position or maintains its traditional pro-European outlook. Marko Papic, Senior Vice President Chief Geopolitical Strategist marko@bcaresearch.com 1 The name references the colors of the three parties (black for CDU, green for the Green Party, and yellow for the FDP).