Euro Area
The main risk confronting Europe’s major institutions such as the ECB, the EU Council, and the EU Commission is an existential risk. This is because the very existence of the pan-European project relies on the ongoing (largely) unanimous support of a…

Highlights Five risks to our bullish dollar stance need to be monitored: further weakness in the S&P 500; rebounding gold prices; stabilizing EM exchange rates and bond prices; Spanish bank stocks at multi-decade lows; and large, long-exposure by speculators to the greenback. However, China's lackluster response to stimulus and the U.S.'s domestic strength still favor the dollar. In fact, the key force likely to cause U.S. growth to converge toward weaker global growth will be a stronger U.S. dollar. Feature BCA has a positive bias toward the dollar for the coming six to nine months. Admittedly, the dollar is expensive, but cyclical determinants still favor a rally. The Federal Reserve is hiking rates as the U.S. economy is at full capacity and goosed up by fiscal injections. Yet global growth is very wobbly. This combination is a potent cocktail for USD strength. Despite these key sources of support, we cannot be dogmatic, especially as financial markets are anticipatory mechanisms, and therefore the dollar could have already priced in some of these developments. As such, this week we explore the key risks to our dollar view. While serious threats for the dollar exist over the upcoming two to three quarters, the key macro and financial drivers remain dollar bullish. The Threats 1) The S&P Sells Off Further The MSCI EAFE index, expressed in USD terms, is down nearly 20% since its January 2018 highs. Meanwhile, the S&P 500 has fallen 9% since its recent all-time high, or 7% vis-Ã -vis where it stood in late January. The risk is that as the global economic slowdown deepens, investors end up selling their good assets along with their bad ones. This means the S&P 500 could fall more. In fact, our colleague Peter Berezin writes in BCA's Global Investment Strategy that U.S. equities could fall an additional 6% from current levels before finding a durable support.1 The problem for the dollar is not whether stock prices fall. It is about what it means for the Fed. Until earlier this week, equity weakness had no impact at all on bonds. However, now, weak stock prices are dragging down U.S. bond yields. Moreover, while the U.S. yield curve slope steepened between August 24 and October 5, it is flattening anew (Chart I-1). All these market moves suggest investors are beginning to price out anticipated interest rate hikes. If U.S. stocks were to fall further, these dynamics would most likely deepen. However, since there is little monetary tightening to price out of the European or Japanese interest rate curves, such a move would likely lead to a dollar-bearish narrowing of interest rate differentials. Chart I-1It Took A Stock Market Rout For Investors To Reconsider The Fed's Path
It Took A Stock Market Rout For Investors To Reconsider The Fed's Path
It Took A Stock Market Rout For Investors To Reconsider The Fed's Path
2) Gold Is Rebounding Keynes might have called gold a barbarous relic of a bygone era, but as an extremely long-duration asset with no cash flow, the yellow metal remains an important gauge of global monetary and liquidity conditions. As the stock of dollar foreign-currency debt is large, a strong dollar is synonymous with tightening global liquidity conditions. Unsurprisingly, since 2017, gold and the dollar have been tightly negatively correlated (Chart I-2). However, since October, this correlation has been breaking down. Both the dollar and gold are moving up. This suggests that the recent increase in U.S. interest rates and in the dollar might not be as deleterious for the world as markets are currently anticipating. Chart I-2Is Gold Not Hating A Strong Dollar Anymore?
Is Gold Not Hating A Strong Dollar Anymore?
Is Gold Not Hating A Strong Dollar Anymore?
Moreover, gold prices often lead EM asset prices. Since gold prices are highly sensitive to global liquidity, this makes sense. When the yellow metal sniffs out whiffs of reflation, it is only a matter of time before EM assets do as well. Since a rally in EM assets would lead to an easing in EM financial conditions, this easing would improve the global growth outlook (Chart I-3). Hence, rising gold prices might be a sign that while investors are increasingly negative on global industrial activity, the light at the end of the tunnel could be around the corner. The dollar would suffer if the outlook for global growth were to improve. Chart I-3EM Financial Conditions Hold The Key To Global Growth
EM Financial Conditions Hold The Key To Global Growth
EM Financial Conditions Hold The Key To Global Growth
3) EM Currencies And EM High-Yield Bonds Stabilizing Something strange is happening. While EM equity prices are still falling, EM high-yield bonds and currencies are not. In fact, EM FX and EM debt prices bottomed at the beginning of September, despite rising U.S. interest rates. However, since then, EM stock prices denominated in USD terms have fallen nearly 10% (Chart I-4). EM exchange rates and yields are the most important determinants of EM financial conditions. This suggests that despite EM stock prices falling fast, EM financial conditions may not be deteriorating as quickly as assumed. Chart I-4Are EM Financial Conditions Easing?
Are EM Financial Conditions Easing?
Are EM Financial Conditions Easing?
This market action is in fact consistent with the development we highlighted in the gold market. We must therefore maintain a watchful eye on EM bonds and EM FX. Further meaningful improvement in these assets, while not BCA's base-case, would dangerously challenge our view that global industrial activity slows further, undermining our dollar-bullish view. 4) Spanish Banks Near Post-2008 Lows As we highlighted in August, Spanish banks are the most exposed major banks in the world to EM woes (Chart I-5).2 The exposure of the Spanish banking sector to the weakest EM economies represents 170% of capital and reserves, which is driving the entire euro area's exposure to these markets to 32% of Eurozone banks' capital and reserves. Chart I-5Who Has More Exposure To EM?
Risks To The Dollar View
Risks To The Dollar View
The weakening in EM expected growth and the fall in EM currencies is a risk for Spanish banks. However, Spanish banks also maintain a large chunk of their EM exposure in wholly or partly owned subsidiaries. This means that while an EM crisis will definitely have an important impact on Spanish bank earnings, the impact on the balance sheet of Spanish banks is likely to be more limited. However, Spanish banks now trade in line with the levels that prevailed in Q1 2009, Q3 2012 and Q1 2016 (Chart I-6). In other words, Spanish banks are already pricing in a crisis, especially after the Spanish Supreme Court ruled that banks - not customers - must pay mortgage duties. Chart I-6Spanish Banks Are Discounting Plenty Of Bad News
Spanish Banks Are Discounting Plenty Of Bad News
Spanish Banks Are Discounting Plenty Of Bad News
While markets may not be the most efficient mechanism when it comes to pricing future shocks, markets are very efficient at lateral pricing - i.e. the pricing of an event in one market, even if wrong, will be equally reflected in other markets. If the impact of an EM crisis is fully priced into Spanish banks, the impact of such a crisis is likely to also be reflected in the expectations of what the European Central Bank will do over the coming quarters, and thus it is also priced into the euro. The pessimism already present in Spanish banks and euro area financial equities may explain why the euro has not cracked below its August 17 lows, while global stock prices have. The bad news could simply already be baked into the cake! If Spanish bank stocks rebound, the dollar is likely to suffer; if they break down, the dollar will likely rally more. 5) Speculators Are Already Long The Dollar For the dollar to rise further, someone needs to buy it. The problem is that speculators have already been buying the greenback, and they are now aggressively long the dollar (Chart I-7). This means that it may become more difficult to find new buyers for U.S. dollars, especially as investors may be in the process of unloading their U.S. equities. To be fair, while it is true that the net speculative positions are elevated, they also can remain so for extended periods. Chart I-7Investors Are Long The Dollar
Investors Are Long The Dollar
Investors Are Long The Dollar
Bottom Line: There are important risks to our dollar-bullish view that we need to closely monitor. They are: the global stock selloff migrating to the U.S., which could prompt investors to price out Fed rate hikes; gold rebounding, which might indicate marginal improvement in global liquidity conditions; EM exchange rates and high-yield bonds not weakening anymore, which could result in an easing in financial conditions, ending the deterioration in global growth; Spanish banks potentially already pricing in a dire outcome in EM; and speculators being already long the dollar. Despite these Risks, Why Do We Still Like The Dollar? The first reason relates to global growth. Ultimately, the dollar is a counter-cyclical currency. When global growth weakens, the dollar strengthens. China continues to generate potent headwinds for the world economy. Beijing has been stimulating the Chinese economy, but this stimulus is having a muted impact. As Arthur Budaghyan writes in the week's Emerging Market Strategy report, China's monetary stimulus is falling flat.3 Not only are excess reserves in the banking sector rather meager, Chinese banks are not showing a deep propensity to lend. It is not just about the behavior of Chinese banks: Chinese firms are also not displaying a high propensity to spend and borrow, which is weighing on the velocity of money in China (Chart I-8). As a result, this means that liquidity injections are not generating much impact in terms of loan growth and economic activity. Chart I-8Chinese Stimulus Is Falling Flat Because Economic Agents Are Cautious
bca.fes_wr_2018_10_26_s1_c8
bca.fes_wr_2018_10_26_s1_c8
This is evident when looking at two variables. China's Li-Keqiang Index, our preferred measure of Chinese industrial activity, has stopped rebounding. In fact, it is currently weakening anew, which suggests that Chinese growth, despite all the supposed easing in monetary conditions, is not responding (Chart I-9, top panel). Moreover, Chinese infrastructure spending is also contracting at its fastest pace in 14 years (Chart I-9, bottom panel). Further, the slowing in Chinese real estate sales suggests that construction will not come to the rescue, especially as vacancy rates in Chinese major cities currently stand at elevated levels. Chart I-9Chinese Growth Outlook Is Deteriorating Anew
Chinese Growth Outlook Is Deteriorating Anew
Chinese Growth Outlook Is Deteriorating Anew
We continue to monitor our China Play index (Chart I-10) to see if China is showing any underlying improvement, but the rally evident from June to October is now dissipating. The impact of stimulus thus looks like it is leaving investors wanting for more. Yet, as Matt Gertken and Roukaya Ibrahim argue in this week's Geopolitical Strategy service, additional stimulus will be limited as Xi Jinping is not yet abandoning his three battles against indebtedness, pollution and poverty.4 Hence, we expect China to remain a significant drag on global growth over the coming two to three quarters. Chart I-10China-Related Plays Are Losing Momentum
China-Related Plays Are Losing Momentum
China-Related Plays Are Losing Momentum
The second issue that supports our bullish-dollar stance is the mechanism required for U.S. and global growth to converge. As Ryan Swift argues in BCA's U.S. Bond Strategy service, U.S. growth will not be able to avoid the gravitational pull of a weaker global economy.5 The type of divergence currently on display between the global and U.S. Leading Economic Indicators (LEIs) is generally followed by a deteriorating U.S. growth outlook (Chart I-11). Chart I-11U.S. Growth Ultimately Converges With The Rest Of The World
U.S. Growth Ultimately Converges With The Rest Of The World
U.S. Growth Ultimately Converges With The Rest Of The World
However, this weakening in U.S. growth won't happen out of nowhere. Either there will be domestic vulnerabilities that prompt the U.S. to become more sensitive to foreign shocks, or the dollar will force this adjustment. Today, unlike in 2015 and 2016, the sales-to-inventory ratio does not point to any imminent decline in U.S. industrial activity; to the contrary, it suggests further improvements in the coming months (Chart I-12). This leaves the dollar as the main culprit to put the brakes on U.S. growth. Chart I-12U.S. Domestic Fundamentals Are Fine
U.S. Domestic Fundamentals Are Fine
U.S. Domestic Fundamentals Are Fine
Since 2009, the greenback has been very responsive to the relative growth outlook between the U.S. and the rest of the world. The accumulated gap between the U.S. and global LEIs shows the total impact of growth divergences. This indicator has done a good job at foretelling how the dollar will trade (Chart I-13). The dollar tends to respond to U.S. growth outperformance. Only once the dollar has rallied enough to meaningfully tighten U.S. financial conditions does the U.S. growth outlook deteriorate vis-Ã -vis the rest of the world. Currently, this chart suggests we are nowhere near having reached a chokepoint for U.S. growth. Chart I-13A Higher Dollar Needed For U.S. Growth To Resist The Gravitational Pull From The Rest Of The World
A Higher Dollar Needed For U.S. Growth To Resist The Gravitational Pull From The Rest Of The World
A Higher Dollar Needed For U.S. Growth To Resist The Gravitational Pull From The Rest Of The World
Since the Fed remains quite unconcerned by the weakness in global growth and global stock prices, we expect that world financial markets will have to plunge deeper, the dollar to rally higher and U.S. financial conditions to tighten further before the FOMC shows enough concern to hurt the dollar. We are not there yet. Bottom Line: The absence of a meaningful response by the Chinese economy to stimulus suggests that China may have hit a debt wall. This implies that Chinese growth remains fragile and therefore a drag on global growth. Hence, international economic activity and trade will continue to provide an important tailwind for the U.S. dollar. Meanwhile, the U.S. economy is not displaying enough domestic vulnerabilities to be overly sensitive to the softness in global growth. Instead, more rounds of dollar strength will be required to force U.S. growth to converge lower toward global economic activity. As such, these two forces remain powerful enough to overweight currency exposure to the USD within global portfolios. That said, the five risks described in the previous section must be kept in mind. At the current juncture, they only warrant buying a few hedges, such as our long NZD/USD recommendation, but they do not warrant underweighting the greenback. Mathieu Savary, Vice President Foreign Exchange Strategy mathieu@bcaresearch.com 1 Please see Global Investment Strategy Special Report, "Chinese Stimulus: Not so Stimulating", dated October 26, 2018, available at gis.bcaresearch.com 2 Please see Foreign Exchange Strategy Special Report, "The Bear And The Two Travelers", dated August 17, 2018, available at fes.bcaresearch.com 3 Please see Emerging Markets Strategy Weekly Report, "China: Stimulus, Deleveraging And Growth", dated October 25, 2018, available at ems.bcaresearch.com 4 Please see Geopolitical Strategy Special Report, "China Sticks To The "Three Battles", dated October 24, 2018, available at gps.bcaresearch.com 5 Please see U.S. Bond Strategy Weekly Report, "Waiting For Peak Divergence", dated October 23, 2018, available at usbs.bcaresearch.com Currencies U.S. Dollar Chart II-1USD Technicals 1
USD Technicals 1
USD Technicals 1
Chart II-2USD Technicals 2
USD Technicals 2
USD Technicals 2
Recent data in the U.S. has been mixed: Markit Services PMI outperformed expectations, coming in at 54.7. This measure also increased from the previous month's reading of 53.5. However, durable good ex-defense month-on-month growth underperformed expectations, coming in at -0.6%. Finally, monthly new homes sales underperformed expectations, coming in at an annualized pace of 553 thousand. DXY has appreciated by 0.8% this week. We are bullish on the U.S. dollar on a cyclical basis. Furthermore, momentum, one of the strongest predictive factors for the dollar continues to be positive. Finally, global growth should continue to slowdown, as the monetary tightening by Chinese authorities starts to weigh on the global industrial cycle. Report Links: In Fall, Leaves Turn Red, The Dollar Turns Green - October 12, 2018 Policy Divergences Are Still The Name Of The Game - August 14, 2018 The Dollar And Risk Assets Are Beholden To China's Stimulus - August 3, 2018 The Euro Chart II-3EUR Technicals 1
EUR Technicals 1
EUR Technicals 1
Chart II-4EUR Technicals 2
EUR Technicals 2
EUR Technicals 2
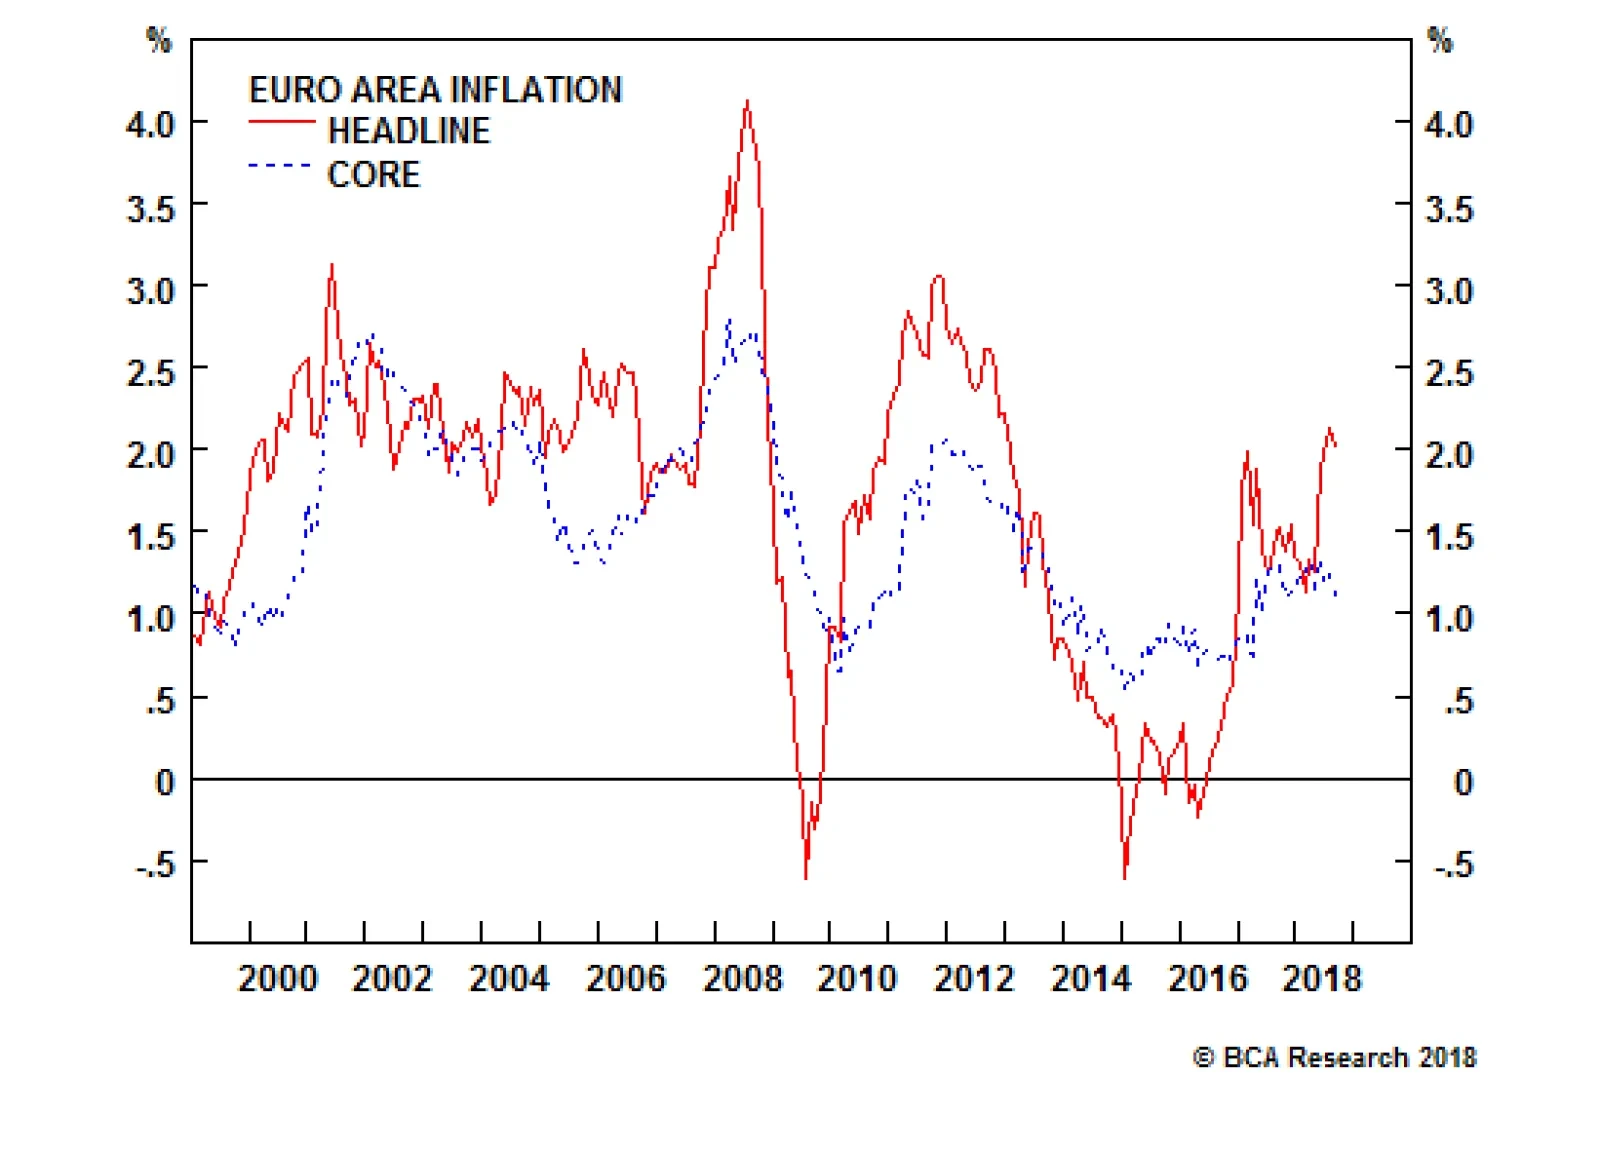
Recent data in the euro area has been negative: Markit Manufacturing PMI surprised to the downside, coming in at 52.1. Moreover, Markit Services PMI also underperformed expectations, coming in at 53.3. Finally, private loan yearly growth surprised negatively, coming in at 3.1%. EUR/USD has fallen by 0.8% this week. We are bearish on the euro on a cyclical basis, as inflationary pressures continue to be too weak in the euro area for the ECB to start raising rates. Moreover, the fact that the euro area's economy is highly dependent on exports, makes it very sensitive to global growth and emerging markets. This means that the tightening by Chinese authorities should impact the euro area economy negatively, and consequently, put downward pressure on EUR/USD. Report Links: Will Rising Wages Cause An Imminent Change In Policy Direction In Europe And Japan? - October 5, 2018 Policy Divergences Are Still The Name Of The Game - August 14, 2018 Time To Pause And Breathe - July 6, 2018 The Yen Chart II-5JPY Technicals 1
JPY Technicals 1
JPY Technicals 1
Chart II-6JPY Technicals 2
JPY Technicals 2
JPY Technicals 2
Recent data in Japan has been mixed: The leading economic Index outperformed expectations, coming in at 104.5. However, the coincident index surprised to the downside, coming in at 116.7. USD/JPY has been flat this week. We are neutral on the yen on a tactical basis, given that the current risk-off environment should continue to help safe havens like the yen. However, we are bearish on the yen on a cyclical basis, as inflation expectations are not well anchored in Japan. This means that the BoJ will continue to conduct ultra-dovish monetary policy for the foreseeable future, putting a cap on how high the yen can rise. Report Links: Will Rising Wages Cause An Imminent Change In Policy Direction In Europe And Japan? - October 5, 2018 Rhetoric Is Not Always Policy - July 27, 2018 Updating Our Long-Term FX Fair Value Models - June 22, 2018 British Pound Chart II-7GBP Technicals 1
GBP Technicals 1
GBP Technicals 1
Chart II-8GBP Technicals 2
GBP Technicals 2
GBP Technicals 2
GBP/USD has decreased by 1.5% this week. Given the lack of a geopolitical risk premium embedded into the pound, we expect GBP volatility to remain elevated. This means that any hiccups in Brexit negotiations could bring about some downside for the pound. Furthermore, inflation should remain contained, even amid a tight labour market. This is mainly because inflation dynamics in the U.K. are much more driven by the external sector, as imports represent a very large portion of British final demand. Given that the pound has remained stable this year, inflation will remain subdued. We are currently short GBP/NZD in our portfolio, to take advantage of the dynamics mentioned above. Report Links: Clashing Forces: The Fed And EM Financial Conditions - October 19, 2018 Updating Our Long-Term FX Fair Value Models - June 22, 2018 Inflation Is In The Price - June 15, 2018 Australian Dollar Chart II-9AUD Technicals 1
AUD Technicals 1
AUD Technicals 1
Chart II-10AUD Technicals 2
AUD Technicals 2
AUD Technicals 2
AUD/USD has been flat this week. We are most bearish on this currency within the G10, given that the AUD is highly sensitive to the Chinese industrial cycle, which will continue to slow down, as Chinese authorities keep cleaning credit excesses in the economy. Moreover, policy tightening by the Fed will provide a further headwind to cyclical plays like the AUD. We are short AUD/CAD within our portfolio, as we believe that the oil currencies should fare better than other commodity currencies, given that OPEC supply cuts, as long as Iranian sanction in oil will keep upward pressure on oil prices. Report Links: Policy Divergences Are Still The Name Of The Game - August 14, 2018 What Is Good For China Doesn't Always Help The World - June 29, 2018 Updating Our Long-Term FX Fair Value Models - June 22, 2018 New Zealand Dollar Chart II-11NZD Technicals 1
NZD Technicals 1
NZD Technicals 1
Chart II-12NZD Technicals 2
NZD Technicals 2
NZD Technicals 2
NZD/USD has been flat this week. We are positive on the New Zealand dollar, particularly against the GBP, as there is very little room for kiwi rate expectations to fall. Moreover, this currency should also outperform the Australian dollar, given that New Zealand is less exposed to the Chinese industrial cycle than Australia. Nevertheless, we remain bearish on the NZD on a long-term basis, given that the new government proposals to reduce immigration and add an unemployment mandate to the RBNZ will lower the neutral rate in New Zealand, which will limit the central bank's ability to tighten monetary policy. Report Links: Clashing Forces: The Fed And EM Financial Conditions - October 19, 2018 In Fall, Leaves Turn Red, The Dollar Turns Green - October 12, 2018 Updating Our Long-Term FX Fair Value Models - June 22, 2018 Canadian Dollar Chart II-13CAD Technicals 1
CAD Technicals 1
CAD Technicals 1
Chart II-14CAD Technicals 2
CAD Technicals 2
CAD Technicals 2
Recent data in Canada has been negative: Core inflation underperformed expectations, coming in at 1.5%. This measure also decreased form 1.7% last month. Headline inflation also surprised to the downside, coming in at 2.2%. This measure decreased significantly, coming down from 2.8% the previous month. The Bank of Canada increased rates to tk% on Wednesday, and highlighted the potential for additional rate hikes over the coming 12 months. USD/CAD has been mostly flat this week. The upside in the CAD versus the USD is likely to be limited as the policy tightening by the BoC now seems well anticipated by market participants. To take advantage of this reality, we went short CAD/NOK in our portfolio. This cross also serves as a hedge to our long dollar view, given its positive correlation to the DXY. Despite some headwinds, the CAD should outperform the AUD, as we expect that oil will do better than base metals within the commodity complex. Report Links: Clashing Forces: The Fed And EM Financial Conditions - October 19, 2018 Updating Our Long-Term FX Fair Value Models - June 22, 2018 Inflation Is In The Price - June 15, 2018 Swiss Franc Chart II-15CHF Technicals 1
CHF Technicals 1
CHF Technicals 1
Chart II-16CHF Technicals 2
CHF Technicals 2
CHF Technicals 2
EUR/CHF has fallen by 0.5% this week, as investors have grown worried with the recent sell off in equities. We are bearish on the franc on a cyclical basis, given that inflation in Switzerland is still too weak for the SNB to move away from their ultra-dovish monetary policy. Moreover, Helvetic real estate prices should continue to fall, as the restrictions on immigration put forth by the Swiss government since 2014 should continue to weigh on housing demand. This will further hamper the ability of the SNB to tighten its extraodinarly accommodative monetary policy. That being said, EUR/CHF could continue to fall in the near term, as money flows into safe heaven assets amid the current sell off in equities. Report Links: Updating Our Long-Term FX Fair Value Models - June 22, 2018 Updating Our Intermediate Timing Models - May 18, 2018 Value Strategies In FX Markets: Putting PPP To The Test - May 11, 2018 Norwegian Krone Chart II-17NOK Technicals 1
NOK Technicals 1
NOK Technicals 1
Chart II-18NOK Technicals 2
NOK Technicals 2
NOK Technicals 2
USD/NOK has risen by 0.9% this week. As expected, yesterday the Norges Bank left rates unchanged at 0.75%. In its report, the Norwegian central bank highlighted that although economic growth has been a little lower than anticipated, inflation has been somewhat higher than expectations. We are bullish on the krona against the Canadian dollar, given that rate hike expectation in Canada are much more fully priced in than in Norway even though the inflationary backdrop is very similar. Moreover, we are positive on the krone relatively to other commodity currencies like the AUD or the NZD, as we expect oil to outperform other commodities thanks to supply cuts by OPEC and sanctions against Iran. Report Links: Clashing Forces: The Fed And EM Financial Conditions - October 19, 2018 Updating Our Long-Term FX Fair Value Models - June 22, 2018 Updating Our Intermediate Timing Models - May 18, 2018 Swedish Krona Chart II-19SEK Technicals 1
SEK Technicals 1
SEK Technicals 1
Chart II-20SEK Technicals 2
SEK Technicals 2
SEK Technicals 2
USD/SEK has rallied by 1% this week. We are positive on USD/SEK on a short-term basis, given that the SEK is the currency which is most negatively affected by the strength of the U.S. dollar. Furthermore, tightening by Chinese authorities should also weigh on the krona, given that the Swedish economy is very levered to the global industrial cycle, as many of its exports are intermediate goods that are then re-exported to emerging markets. That being said, we are bullish on the krona on a longer-term basis, as the Riksbank is on the verge of beginning a tightening cycle as imbalances in the Swedish economy are only growing more dangerous. Report Links: Updating Our Long-Term FX Fair Value Models - June 22, 2018 Updating Our Intermediate Timing Models - May 18, 2018 Value Strategies In FX Markets: Putting PPP To The Test - May 11, 2018 Trades & Forecasts Forecast Summary Core Portfolio Tactical Trades Closed Trades
Highlights We do not view October's equity downdraft as a signal to further trim risk assets to underweight. Nonetheless, stocks have not yet fallen enough to justify buying either. The economic divergence between the U.S. and the rest of the world is intensifying and showing up in relative EPS trends. We believe earnings growth is set to drop sharply in the Eurozone and Japan. The viciousness of the bond selloff in October is worrying. The good news is that the Treasury curve steepened and the selloff mostly reflected higher real yields, rather than inflation expectations. Both facts suggest that the Treasury rout was reflective of strong U.S. growth, rather than a signal that the Fed is overly restrictive. Our sense is that the fed funds rate has not yet reached the economic choke point, but it is critical to watch for signs of trouble. This month we focus on key monetary indicators. Our "R-Star" indicator is deteriorating, but is not yet in the danger zone for risk assets. It is possible that we will upgrade risk assets back to overweight if stocks in the developed markets cheapen further, as long as our monetary indicators are not flashing red and the U.S. earnings backdrop remains upbeat. However, the risks are formidable and show no signs of abating. Indeed, our global economic indicators continue to deteriorate and we might be headed for a brief manufacturing recession outside of the U.S. A Democratic win in the U.S. mid-terms might spark a knee-jerk equity selloff, but Congress is unlikely to unravel any of the fiscal stimulus currently in place through 2019. The Administration's foreign policy remains a larger risk for equities. Our high conviction view is that President Trump will continue to use a "maximum pressure" approach for Iran and China that will spark additional fireworks. Another growing risk is an oil price spike above US$100/bbl in early 2019, causing significant economic damage. Chinese policy stimulus is underwhelming and the credit impulse remains weak. In the absence of real policy action in China, the prospect of continuing Fed tightening means that it is too early to bottom-fish in emerging markets. The market is still underestimating the U.S. inflation outlook and the amount of Fed tightening over the next 12-18 months. We continue to recommend a neutral stance on global equities (with a preference for developed over emerging markets), a below-benchmark duration bias, and an overweight allocation in cash. Feature October's market action confirmed that we have entered a period of elevated volatility as investors digest the inevitability of rising U.S. interest rates. We do not view the downdraft in equity markets as a signal to further trim risk asset exposure to underweight. Nonetheless, stocks have not yet fallen enough to justify buying either. We took profits and downgraded risk assets to benchmark in June, placing the proceeds into cash. Our primary motivation was the advanced nature of the U.S. economic cycle, stretched valuations, heightened geopolitical tensions, the risk of a Chinese "hard landing" and upside potential for U.S. inflation and global bond yields. We did not foresee a recession either in the U.S. or the other major economies in the near future. Nonetheless, we concluded that the risk/reward balance did not favor staying overweight risk assets. A number of culprits could be blamed for October's pullback, but in reality the market has been primed for some profit-taking for a long while and so any little excuse could have been used by investors to sell. Fed Chair Powell's "long way to go" comment seemed to push the teetering equity market over the edge. He challenged the market's view that the fed funds rate is getting close to neutral, implying that the Fed is not close to pushing the pause button. The Treasury curve steepened as the market discounted a higher cyclical peak in the fed funds rate. Could it be that bond yields have reached a "choke point" where tightening financial conditions are derailing the economic expansion? The global economic deceleration is intensifying, but the U.S. economy still appears to be enjoying solid momentum outside of housing. We do not yet see any major dark clouds forming in the U.S. corporate earnings picture either, as discussed below. Moreover, the bond selloff in October mostly reflected rising real yields (rather than inflation expectations), and the curve steepened. Both facts suggest that the Treasury selloff was reflective of U.S. strong growth, rather than a signal that the Fed is now outright restrictive. Nonetheless, the issue is particularly tricky in this cycle because the equilibrium, or neutral, fed funds rate is undoubtedly somewhat lower than in past expansions. Given the uncertain level of the neutral rate, investors must be on the lookout for signs that interest rates are beginning to bite. Markets And The Fed Cycle BCA has long viewed financial markets through the lens of money and credit. This includes a framework that involves the Fed policy cycle. We begin by decomposing the fed funds rate cycle into four phases based on the interaction between the level of rates and their direction, as follows (Chart I-1 and Chart I-2): Phase I begins with the first rate hike of a new tightening cycle and ends when the fed funds rate crosses above our estimate of the equilibrium rate (shown as a dashed line in Charts I-1 and I-2). Phase II represents the latter stages of the tightening cycle, when the Fed hikes its target rate above equilibrium in a deliberate effort to cool an overheating economy. Phase III represents the early stage of the easing cycle. It begins with the first rate cut from the peak and lasts until the Fed cuts its target rate below equilibrium. Phase IV represents the late stage of the easing cycle. It encompasses both the period when the fed funds rate breaks below its equilibrium level until it bottoms. Chart I-1Stylized Fed Rate Cycle
November 2018
November 2018
Chart I-2Fed Funds Rate And Equilibrium
Fed Funds Rate And Equilibrium
Fed Funds Rate And Equilibrium
The tough part is estimating the neutral level of the fed funds rate. It is a theoretical concept - the level that is consistent with an economy at full employment with no upward or downward pressure on inflation or growth. The Fed lifts the fed funds rate above neutral when it wishes to dampen the economy and temper inflationary pressure. Economic theory ties the equilibrium interest rate to the pace of expansion of the supply side of the economy, or potential GDP growth. Our approach is to combine the CBO's estimate of potential GDP growth with a smoothed version of the actual fed funds rate, to account for the fact that the equilibrium rate periodically deviates from potential growth. The historical track record of this framework is compelling. The latest update of our analysis of equity returns during the four phases was published by BCA's U.S. Investment Strategy Service.1 The level of the fed funds rate relative to its equilibrium has mattered much more than the direction of rates for historical S&P 500 price returns (Table I-1 and I-2). Price returns during Phases I and IV (when the fed funds rate is below equilibrium) trounce returns during Phases II and III (when the funds rate is in restrictive territory). This is especially the case after adjusting returns for inflation. Table I-1Tight Policy Is Hazardous To Stocks' Health, ...
November 2018
November 2018
Table I-2...Especially In Real Terms
November 2018
November 2018
Further breaking down the historical returns into 12-month forward EPS estimates and 12-month forward multiples, it turns out that multiples usually contract when the Fed is tightening. However, during Phase I this is more than offset by the increase in forward earnings estimates, such that equity investors enjoy positive returns until rates move into restrictive territory in Phase II. Our sense is that we are still in Phase I, implying that it is too early to expect more than a correction in risk assets based solely on the U.S. monetary policy cycle. The fed funds rate has been rising, but so too has the equilibrium rate according on our measure. Powell's latest comments suggest that the Fed agrees. That said, it is a cliche to say that this cycle has been different in many ways. Nobody knows exactly where the neutral rate is today. This means that we must be on watch for signs that the fed funds rate has already crossed into restrictive territory. We looked at the behavior of a raft of monetary and credit indicators around the time that the fed funds rate broke above the estimated neutral rate in the past. None of them have been reliable across all business cycles since the 1970s, but the best ones are shown in Chart I-3: Growth in M1 generally begins to decelerate as the fed funds rate approaches neutral and falls into negative territory shortly thereafter. Bank liquidity is defined as short-term assets as a percent of total bank credit. It usually peaks just before rates become restrictive, and begins to fall quickly as the fed funds rate surpasses the equilibrium level. We interpret bank liquidity as a proxy for banks' willingness to provide funding liquidity that enables institutional investors to take positions. The peak level of bank liquidity differs across tightening cycles, but it is never a good sign when it begins to trend lower. Consumer credit growth has a somewhat spotty track record as an indicator of monetary restraint, but it has often peaked around the time that the Fed enters Phase II. The BCA Fed Monitor is an indicator designed to gauge the pressure on the Fed to adjust policy one way or the other. It generally peaks in "tight money required" territory just before, or coincident with, the shift from Phase I to Phase II. A shift of the Monitor into "easy money required" territory would suggest that policy has become outright restrictive, and that a peak in the fed funds rate is approaching. Chart I-3BCA R-Star Indicator And Its Components
BCA R-Star Indicator And Its Components
BCA R-Star Indicator And Its Components
Combining the four into one indicator removes some of the noise of the individual series. The BCA "R-Star" Indicator is shown in the top panel of Chart I-3. A dip in this indicator below the zero line would warn that we have entered Phase II and that the equity bull market is out of time. Chart I-4 shows the BCA R-Star indicator again, along with the S&P 500, EPS growth and profit margins. It is shaded for periods when the R-Star indicator is below zero. The lead time has varied across the economic cycles and it is far from a perfect predictor. Nonetheless, when the indicator is negative it has generally been associated with falling stock prices, decelerating profit growth and eroding profit margins. The indicator has edged lower this year, but is not yet in the danger zone. Chart I-4BCA R-Star Indicator And The U.S. Profit Cycle
BCA R-Star Indicator And The U.S. Profit Cycle
BCA R-Star Indicator And The U.S. Profit Cycle
Finally, we are of course watching the yield curve. Its recent steepening suggests that U.S. growth justifies higher bond yields and that policy has not yet become outright restrictive. Global Growth Divergence Continues... We do not see compelling evidence from the flow of U.S. economic data that higher rates are derailing the expansion, although there are a couple of worrying signs, suggesting that growth has peaked. The backdrop is quite supportive for consumer spending: tax cuts, robust employment gains, rising wages and elevated confidence. The fact that the household saving rate is relatively high means that consumers have the wherewithal to boost the pace of spending if they wish. Motor vehicle sales have moderated, but this is to be expected when the economic cycle is advanced. The replacement cycle for U.S. business investment still has further to run. The average age of the non-residential housing stock is the highest since 1963. Both capex intention surveys and the recent easing in lending standards for commercial and industrial loans suggest that U.S. capital expenditures will be well supported, although there has been some softness in the former recently (Chart I-5). Chart I-5U.S. Capex Outlook Is Bright
U.S. Capex Outlook Is Bright
U.S. Capex Outlook Is Bright
That said, the soft U.S. housing data are a concern, especially because a peak in residential investment as a share of GDP has been a good (albeit quite early) leading indicator of recessions. It is difficult to fully explain why housing is losing altitude given all the tailwinds supporting demand, including solid household formation (see last month's Overview). Mortgage rates have increased but affordability is still favorable. It could be that the supply side, rather than demand, is the problem: tight lending standards, zoning restrictions and the high cost of building. Still, a continued housing downtrend relative to GDP would be a challenge to our view that there will be no recession in 2019. While the U.S. economy is enjoying strong momentum, the same cannot be said for the rest of the global economy. A raft of items has weighed on CEO confidence outside of the U.S., including trade wars, a strong dollar, rising oil prices, emerging market turbulence, the return of Italian debt woes and the continuing slowdown in the Chinese economy. The global PMI is beginning to erode from a high level (Chart I-6). The softening in world activity appears to be concentrated in capital spending. Growth in capital goods imports for an aggregate of 20 countries continues to decelerate, along with industrial production for capital goods and machinery & electrical equipment in the major advanced economies. Chart I-6Global Capex Is Softening
Global Capex Is Softening
Global Capex Is Softening
Meanwhile, our favorite global leading indicators are flashing red (Chart I-7). BCA's Global LEI has broken below the boom/bust line and its diffusion index suggests further downside. The Global ZEW and the BCA Boom/Bust indicator are holding just below zero. The global credit impulse is also still pointing down. Chart I-7Global Leading Indicators Flashing Red
Global Leading Indicators Flashing Red
Global Leading Indicators Flashing Red
Among the advanced economies, Europe and Japan are most vulnerable to the slowdown in global trade and capital spending. Industrial production growth has already stalled in both economies and their respective LEIs are heading south fast (Chart I-8). Chart I-8Global Divergence
Global Divergence
Global Divergence
...Affecting Relative Earnings Trends It is thus not surprising that corporate EPS growth has peaked in the Eurozone and Japan. The macro data that drive our top-down EPS growth models suggest that the profit situation is going to deteriorate quickly in the coming quarters. The peak in industrial production growth suggests that the corporate top line will lose more steam. Meanwhile, nominal GDP growth has decelerated sharply in both economies, in absolute terms and relative to the aggregate wage bill (Chart I-9). These trends suggest that profit margins are coming under significant downward pressure. Even when we build in a modest growth pickup and slight rebound in margins in 2019, EPS growth falls close to zero by year-end according to our model (Chart I-10). Chart I-9Diverging Macro Trends...
Diverging Macro Trends...
Diverging Macro Trends...
Chart I-10...Implies Different EPS Outlook
...Implies Different EPS Outlook
...Implies Different EPS Outlook
The earnings situation is completely different in the U.S. It is still early in Q3 earnings season, but company reports have been upbeat so far. The macro variables that feed into our top-down U.S. EPS model point to both continuing margin expansion and robust top line growth (Chart I-9). Nominal GDP growth has surged to more than 5% on a year-ago basis, while the expansion in the economy's wage bill has been steady at under 5%. It is also very impressive that industrial production growth continues to accelerate, bucking the global trend. We assume that U.S. GDP growth moderates from this year's hectic pace in 2019, but stays well above-trend because of the lingering fiscal tailwind. Impressively, the indicators we are following suggest that S&P 500 profit margins still have some upside potential, at least in the next quarter or two (Chart I-11). Nonetheless, we make the conservative assumption that margins will narrow somewhat in 2019. Plugging this macro scenario into our model, it suggests that EPS growth will decelerate to a still-solid 10% pace by the end of 2019. The impact on corporate profits from the rise in bond yields so far will be minimal. It is only now that the yield on the average corporate bond has reached the average coupon on outstanding debt. This means that it will require further increases in yields from here to have any meaningful impact on corporate interest expense. Chart I-11U.S. Margin Indicators Still Upbeat
U.S. Margin Indicators Still Upbeat
U.S. Margin Indicators Still Upbeat
The U.S. economic and earnings backdrop is robust enough that we would be tempted to upgrade our risk asset allocation back to overweight if the S&P 500 moves even lower in the near term. Nonetheless, a number of key risks keep us at benchmark for now. (1) U.S. Foreign Policy The U.S. mid-term election is less than two weeks away as we go to press. Our geopolitical team places the odds of a Democratic House takeover at 65%, and the odds of a Senate takeover at 40%. Investors should expect a knee-jerk equity selloff if the Democrats manage to grab both parts of Congress. However, any damage to risk assets should be fleeting because the Democrats would not be able to unravel any of President Trump's main economic policies. Voters are not demanding budget discipline from either party, despite the surging federal deficit (Chart I-12). We highlighted in a recent Special Report that we foresee little political backlash against fiscal profligacy because of the shift-to-the-left by the median voter.2 The Trump tax cuts are here to stay. Chart I-12No Political Backlash To Big Deficits
No Political Backlash To Big Deficits
No Political Backlash To Big Deficits
In fact, our geopolitical team argues that the odds would increase for an infrastructure plan and even of an immigration deal, if President Trump comes to the middle ground on some of his demands.3 The implication is that fiscal policy will remain highly stimulative in 2019, before the initial thrust begins to wear off in 2020. The Administration's foreign policy, however, remains a key risk for equities. Our high conviction view is that President Trump will continue pursuing unorthodox foreign and trade policies regardless of the midterm outcome. The just-announced 10% tariff on $200 billion of Chinese imports confirms our alarmist view on trade tensions. President Trump has threatened to lift the tariff to 25% by the end of the year in order to pile even more pressure on Beijing. This would represent a significant escalation in the trade war, one that we do not expect Chinese policymakers to simply roll over and accept. The risk is that the Chinese government not only hikes tariffs on U.S. exports, but also retaliates against U.S. firms with operations in China. Even more dangerously, a trade war with China could escalate into a military conflict in the South China Sea. Meanwhile, the U.S. embargo on Iranian oil exports will officially begin on November 4, just two days before the midterm election. We expect President Trump to turn the screws on Iranian exports in ways that President Obama did not. Once the election is out of the way, President Trump will refocus on his "maximum pressure" tactic, which he believes led to a breakthrough with North Korea. Unfortunately for the markets, we do not expect that this tactic will work as smoothly with Iran and China. (2) Rising Probability Of An Oil Shock The Administration's pressure on Iran adds to the already high risk of an oil price spike above US$100 per barrel in early 2019. While oil demand growth is slowing somewhat, exports from two of OPEC's largest producers - Iran and Venezuela - are falling precipitously. Global oil inventories are drawing down, while spare capacity is perilously low, leaving little in the way of readily available backup supply to deal with an unplanned production outage. The confluence of these factors is setting the global oil market up for a supply shock according to our energy experts (Chart I-13). Chart I-13Increasing Risk Of An Oil Spike
Increasing Risk Of An Oil Spike
Increasing Risk Of An Oil Spike
It is important to differentiate between a steady demand-driven rise in the price of oil and a rapid supply-driven oil price spike. The former can be bond-bearish by forcing inflation expectations higher at a time when strong economic growth is also pushing up real bond yields. Nonetheless, equity prices could continue rising in this scenario as the robust economic backdrop outweighs the impact of higher yields. In contrast, an oil price spike that is driven by supply restrictions might initially be negative for bond prices, but ultimately would produce a deflationary impulse by depressing real economic activity. It could even be the catalyst for a recession. A supply-driven oil spike would be outright bearish for risk assets and may prove to be the trigger for a shift from benchmark to underweight for global stocks and corporate bonds. The risk facing corporates in the next economic downturn is one of the topics covered in this month's Special Report, beginning on page 21. The report looks at the structural changes to the economy and financial markets that have occurred because of the Great Recession and financial crisis. (3) EM Pain Is Not Over In the absence of policy stimulus in China, the prospect of continuing Fed tightening means that it is too early to bottom-fish in emerging markets. Emerging Asia is at the epicenter of the global trade and capital spending slowdown. The sharp deceleration in Taiwanese and Korean export growth rates suggests that growth in world industrial production and forward earnings estimates are not yet near a bottom (Chart I-14). Chart I-14Asian Exports Softening...
Asian Exports Softening...
Asian Exports Softening...
Softening Chinese domestic demand is adding to the gloom. Chart I-15 shows that efforts by the Chinese authorities to curtail corporate debt have been bearing fruit. In response to the regulatory and administrative tightening, smaller financial institutions are not building up the working capital required to expand their loan book. As a result, the Chinese credit impulse remains weak and shows no sign of a bottom, despite the uptick in the latest reading on M3 growth. Chinese policy stimulus is underwhelming, confirming the view we expressed in the September BCA Overview. Xi Jinping has not yet abandoned his structural goals and shadow bank crackdown, which are weighing on overall credit expansion. Chart I-15...And No Growth Impulse From China
Chinese Policy Tightening In Action ...And No Growth Impulse From China
Chinese Policy Tightening In Action ...And No Growth Impulse From China
Second, EM financial conditions continue to tighten (Chart I-15). Our currency strategists point out that many factors lie behind this deterioration in the EM financial conditions index, including the collapse in performance of carry trades, the dollar's ascent, and rising U.S. interest rates that are boosting the cost of servicing foreign currency EM debt. In turn, tighter EM financial conditions are contributing to the global manufacturing slowdown in a self-reinforcing negative feedback loop. EM Asia is particularly at risk to this loop, but Europe, Japan and commodity producers are also vulnerable. Some market commentators have argued that the Fed will soon have to back off its rate hike campaign in the face of global financial market stress. However, the FOMC's pain threshold is higher than at any time since the Great Recession because the domestic economy is showing signs of overheating. The correction in risk assets would have to get a lot worse before the Fed blinks. Meanwhile, the U.S. again passed on the chance to label China a currency manipulator. This opens the door to another downleg in the RMB, especially if the U.S./China trade war escalates. Additional RMB weakness would spell more trouble for EM assets. The implication is that any bounce in EM currencies or asset prices represents a selling opportunity for those investors not already short. Our EM strategists expect at least another 15% drop in share prices before the risk-reward profile of this asset class improves. (4) Italian Debt Crisis The main problem with the Italian economy is that the private sector saves too much and spends too little. A shrinking population has reduced the need for firms to invest in new capacity. Unlike Germany, Italy cannot export its savings to the rest of the world through a large trade surplus because it does not have a hypercompetitive economy. Nor can the Italian government risk running afoul of the bond vigilantes by emulating Japan's strategy of absorbing private-sector savings with large budget deficits. The implication is that Italy is stuck in a low-growth trap that is feeding political pressure to shed the EU's fiscal straight jacket. We believe that the populist government will be the first to blink, but it may require more bouts of financial stress to force capitulation. A 4% level on the 10 year BTP yield is a likely threshold for a compromise. Above that level, Italian banks become insolvent based on the market value of their holdings of Italian debt. In the meantime, rising global bond yields worsen Italy's tenuous financial situation, with possible contagion into global financial markets. Investment Conclusions: The U.S. bond market is waking up to the likelihood that U.S. short-term rates are going higher than previously expected, suggesting that recent investment themes will persist for a while longer. We continue to recommend a neutral stance on global equities (with a preference for developed over emerging markets), a below-benchmark duration bias, and an overweight allocation in cash. The bond market is only priced for the Fed to maintain its quarterly rate hike pace until June of next year (Chart I-16). Investors judge that some combination of tepid global economic momentum and tame U.S. core inflation temper the Fed's need or ability to take rates much higher. We disagree, based our own assessment of the U.S. economy and our out-of-consensus inflation view (see this month's Special Report). Rising volatility and/or a weaker global growth pulse are unlikely to prompt the Fed to bail out of its tightening campaign as quickly as it did in early 2016. Chart I-16Market Expectations For The Fed Still Too Complacent
Market Expectations For The Fed Still Too Complacent
Market Expectations For The Fed Still Too Complacent
Meanwhile, our indicators suggest that the divergence between the red-hot U.S. economy and cooling global activity will continue, implying more upside potential for the U.S. dollar. We expect another 5-10% rise against most currencies, with the possible exception of the Canadian dollar. It is difficult to identify a "choke point" for bond yields in advance. A 10-year Treasury yield north of 3.7% might cause us to call the peak in yields and to become even more defensive on risk assets, but it will be critical to watch our monetary indicators. Indeed, we would be tempted to upgrade stocks back to overweight if the global selloff progresses much further, in the absence of negative reading from the monetary indicators or an inverted yield curve. The earnings backdrop will continue to be a tailwind for the U.S. equity market at least into early 2019. In contrast, profit growth in the Eurozone and Japan is set to disappoint market expectations. The U.S. equity market will therefore outperform, particularly in unhedged terms. Stay at benchmark on corporate bonds versus governments in the U.S. and Eurozone. Avoid emerging market assets and commodities. The main exception is oil, which is increasingly at risk of a spike above $100/bbl. Mark McClellan Senior Vice President The Bank Credit Analyst October 25, 2018 Next Report: November 29, 2018 1 Please see U.S. Investment Strategy Special Report "Revisiting The Fed Funds Rate Cycle," dated September 3, 2018, available at usis.bcaresearch.com 2 Please see The Bank Credit Analyst "U.S. Fiscal Policy: An Unprecedented Macro Experiment," dated July 2018, available at bca.bcaresearch.com 3 Please see BCA Geopolitical Strategy Weekly Report "A Story Told Through Charts: The U.S. Midterm Election," dated September 19, 2018, available at gps.bcaresearch.com II. The Long Shadow Of The Financial Crisis The Great Recession and financial crisis cast a long shadow that will affect economies, policymakers and investors for years to come. The roots of the crisis are already well known. The first of a two-part series looks forward by examining the areas where we believe structural change has occurred related to the economy or financial markets. First, the financial crisis transformed the corporate bond market in several ways that heighten the risk for quality spreads in the next downturn. Debt and market liquidity are two key concerns. Corporate leverage will not cause the next recession. Nonetheless, when one does occur, corporate spreads in the U.S. and (to a lesser extent) the Eurozone will widen by more for any given degree of recession. This reflects a low interest coverage ratio, poor market liquidity, the downward trend in credit quality and covenant erosion. Second, the shock of the Great Recession and its aftermath appears to have affected the relationship between economic slack and inflation. Firms have been extra reluctant to grant wage gains. However, we argue that the "shell shock" effect will wane. The fact that inflation has been depressed for so long may actually cultivate the risk that inflation will surprise on the upside in the coming years. Investors should hold inflation-protection in the inflation swaps market, or by overweighting inflation-linked bonds versus conventional issues. Third, the events of the last decade have left a lasting impression on monetary policymakers. They will err on the side of allowing the economy to overheat and inflation to modestly overshoot the target in the major economies, despite signs of financial froth. The Fed will respond only with a lag to the current fiscally-driven surge in U.S. growth, leading to a boom/bust economic scenario. Central bankers will have no trouble employing unorthodox policies again in the future, and will be willing to push the boundaries even further during the next recession. Expect aggressive manipulation of the long-end of the yield curve when the time arrives to ease policy. We may also observe more coordination between monetary and fiscal policies. Fourth, global bond yields fell to unprecedented levels, reflecting both structural and cyclical headwinds to demand growth. A dismal productivity performance is another culprit. Productivity growth is poised to recover to some extent, while some of the growth headwinds have reached an inflection point. We do not expect nominal bond yields to return to pre-Lehman norms, and yields could even fall back to previous lows in the case of a recession. Nonetheless, we expect a yield pattern of higher lows and higher highs over the coming business cycles. The 10-year anniversary of the Lehman shock this autumn sparked an avalanche of analysis on the events and underlying causes of the Great Recession and financial crisis. It is a woeful story of greed, a classic bubble, inadequate regulation, new-fangled financial instruments, and a globalized financial system that spread the shock around the world. The crisis cast a long shadow that will affect economies, policymakers and investors for many years to come. The roots of the crisis are well known, so we will not spend any time going over well-trodden ground. Rather, this Special Report looks forward by examining the areas where we believe structural change has occurred related to the economy or financial markets. In Part I, we cover the corporate bond market, the inflation outlook, central bank policymaking and equilibrium bond yields. Part II will look at the debt overhang, systemic risk in the financial sector, asset correlations, the cult of equity and the rise of populism. While not an exhaustive list, we believe these are the key areas of structural change. (1) Corporate Bond Market: Leverage And Downgrade Risk The financial crisis transformed the corporate bond market in several ways that heighten the risk for quality spreads in the next downturn. Debt and market liquidity are two key concerns. An extraordinarily long period of extremely low interest rates was too much for corporate CEOs to pass up. However, because the durability of the economic recovery was so uncertain, it seemed more attractive to hand over the borrowed cash to shareholders than to use it to aggressively expand productive capacity. The ongoing equity bull market rewarded CEOs for the financial engineering, serving to create a self-reinforcing feedback loop. And so far, corporate bondholders have not policed this activity. The result is that the U.S. corporate bond market has grown in leaps and bounds since 2009 (Chart II-1A and Chart II-1B). The average duration of the Bloomberg Barclays index has also risen as firms locked in attractive financing rates. The same is true, although to a lesser extent, in the Eurozone. Chart II-1AU.S. BBB-Rated Share Rising...
U.S. BBB-Rated Share Rising...
U.S. BBB-Rated Share Rising...
Chart II-1B...Same In The Eurozone
...Same In The Eurozone
...Same In The Eurozone
Balance sheet health is obviously not the key driver of corporate bond relative returns at the moment. Nonetheless, investors will begin to worry about the growth outlook if interest rates continue to rise. The U.S. national accounts data suggest that interest coverage remains relatively healthy, but this includes large companies such as some of the FAANGs that have little debt and a lot of cash. The national accounts data are unrepresentative of the companies that are included in the Bloomberg Barclays corporate bond index, which are heavy debt issuers. To gain a clearer picture, we calculated a bottom-up Corporate Health Monitor (CHM) for a sample of U.S. companies that provides a sector and credit-quality composition that roughly matches the Bloomberg Barclay's index. The CHM is the composite of six critical financial ratios. Chart II-2 highlights that the investment-grade (IG) CHM has improved over the past two years due to the profitability sub-components. However, the debt/equity ratio has been in a steep uptrend. Interest coverage does not appear alarming by historical standards at the moment, but one can argue that it should be much higher given the extremely low average coupon on corporate bonds, and given that profit margins are extraordinarily high in the U.S. The rapid accumulation of debt has overwhelmed these other factors. Evidence of rising leverage is broadly based across sectors and ratings. Chart II-2U.S. IG Corporate Health
U.S. IG Corporate Health
U.S. IG Corporate Health
Unfortunately, the profit tailwind won't last forever. At some point, earnings growth will stall and this cycle's debt accumulation will start to bite in the context of rising interest rates. To gauge the risk, we estimate the change in the interest coverage ratio over the next three years for a 100 basis-point rise in interest rates across the corporate curve, taking into consideration the maturity distribution of the debt.1 For our universe of Investment-grade U.S. companies, the interest coverage ratio would drop from a little over 7 to under 6, which is close to the lows of the Great Recession (denoted as "x" in Chart II-3). Of course, the decline in interest coverage will be much worse if the Fed steps too far and monetary tightening sparks a recession. The "o" in Chart II-3 denotes the combination of a 100 basis-point interest rate shock and a mild recession in which the S&P 500 suffers a 25% peak-to-trough decline in EPS. The overall interest coverage ratio plunges close to all-time lows at 4½. Chart II-3Interest Coverage To Plunge...
Interest Coverage To Plunge...
Interest Coverage To Plunge...
These simulations imply that, for any given size of recession, the next economic downturn will have a larger negative impact on corporate health than in the past. Rating agencies have undertaken some downgrading related to shareholder-friendly activity, but downgrades will proliferate when the agencies realize that the economy is turning and the profit boom is over (Chart II-4). Banks will belatedly tighten lending standards, adding to funding pressure for the corporate sector. Chart II-4...And Ratings To Be Slashed
...And Ratings To Be Slashed
...And Ratings To Be Slashed
Fallen Angels The potential for a large wave of fallen angels means that downgrade activity will be particularly painful for corporate bond investors. The surge in lower-quality issuance has led to a downward trend in the average credit rating and has significantly raised the size of the BBB-rated bonds relative to the IG index and relative to the broader universe of corporate bonds including high yield (Chart II-5, and Chart II-1A).2 The downward trend in credit quality predates Lehman, but events since the Great Recession have likely reinforced the trend. Chart II-5Lower Ratings And Longer Duration
Lower Ratings And Longer Duration
Lower Ratings And Longer Duration
Studies show that bonds that get downgraded into junk status can perform well for a period thereafter, suggesting that investors holding a fallen angel should not necessarily sell immediately. Nonetheless, the process of transitioning from investment-grade to high-yield involves return underperformance as the spread widens. Poor market liquidity and covenant erosion will intensify pressure for corporate spreads to widen when the bear market arrives. Market turnover has decreased substantially since the pre-Lehman years, especially for IG (Chart II-6). The poor liquidity backdrop appears to be structural, reflecting regulation that has curtailed banks' market-making activity and prop trading, among other factors. Chart II-6Poor Market Liquidity
Poor Market Liquidity
Poor Market Liquidity
The Eurozone corporate bond market has also seen rapid growth and a deterioration in the average credit rating. Liquidity is an issue there as well. That said, the Eurozone corporate sector is less advanced in the leverage cycle than the U.S. Interest coverage ratios will fall during the next recession, but this will be concentrated among foreign issuers - domestic issuers are much less at risk to rising interest rates and/or an economic downturn.3 Bottom Line: Corporate leverage will not cause the next recession. Nonetheless, when one does occur, corporate spreads in the U.S. and (to a lesser extent) Eurozone will widen by more for any given degree of recession. Current spreads do not compensate for this risk. (2) Inflation Undershoot Breeds Overshoot Inflation in the U.S. and other developed economies has been sticky since the financial crisis. First, inflation did not fall as much in the recession and early years of the recovery as many had predicted, despite the worst economic contraction in the post-war period. Subsequently, central banks have had trouble raising inflation back to target. In the U.S., core PCE inflation has only recently returned to 2%. Several structural factors have been blamed, but continuing tepid wage growth in the face of a very tight labor market raises the possibility that the inflation-generating process has been fundamentally altered by the Great Recession. In other words, the relationship between slack in the labor market (or market for goods and services) and inflation has changed. In theory, inflation should rise when the economy's output is above its potential level or when the unemployment rate is below its full-employment level. Inflation should fall when the reverse is true. This means that the change (not the level) in inflation should be positively correlated with the level of the output gap or the labor market gap. Chart II-7 presents the change in U.S. core inflation with the output gap. Although inflation appears to have become less responsive to shifts in the output gap after 1990, it has been particularly insensitive in the post-Lehman period. Chart II-7The U.S. Phillips Curve: RIP?
The U.S. Phillips Curve: RIP?
The U.S. Phillips Curve: RIP?
One reason may be that the business sector was shell-shocked by the Great Recession and financial crisis to such an extent that business leaders have been more reluctant to grant wage gains than in past cycles. Equally-unnerved workers felt lucky just to have a job, and have been less willing to demand raises. Dampened inflation expectations meant that low actual inflation became self-reinforcing. We have some sympathy with this view. Long-term inflation expectations have been sticky at levels that are inconsistent with the major central banks meeting their inflation targets over the long term. This suggests that people believe that central banks lack the tools necessary to overwhelm the deflationary forces. The lesson for investors and policymakers is that, while unorthodox monetary policies helped to limit the downside for inflation and inflation expectations during and just after the recession, these policies have had limited success in reversing even the modest decline that did occur. That said, readers should keep in mind a few important points: One should not expect inflation to rise much until economies break through their non-inflationary limits. The major advanced economies have only recently reached that point to varying degrees; Inflation lags the business cycle (Chart II-8). This is especially the case in long 'slow burn' economic expansions, as we have demonstrated in previous research; and The historical relationship between inflation and economic slack has been non-linear. As shown in Chart II-9, U.S. inflation has tended to accelerate quickly when unemployment drops below 4½%. Chart II-8U.S. Inflation Lags The Cycle
November 2018
November 2018
Chart II-9A Kinked Phillips Curve
November 2018
November 2018
Shell Shock Is Fading We believe that the "shell shock" effect of the Great Recession on inflation will wane over time. Indeed, my colleague Peter Berezin has made the case that the fact that inflation has been depressed for so long actually cultivates the risk that inflation will surprise on the upside in the coming years.4 Central bankers have been alarmed by the economic and financial events of the last decade. They also cast a wary eye on Japan's inability to generate inflation even in the face of massive and prolonged monetary stimulus. Policymakers at the FOMC are determined to boost inflation and inflation expectations before the next economic downturn strikes. They are also willing to not only tolerate, but actively encourage, an overshoot of the 2% inflation target in order to ensure that long-term inflation expectations return "sustainably" to a level consistent with meeting the 2% target over the long term. In other words, the Fed is going to err on the side of too much stimulus rather than too little. This is an important legacy of the last recession (see below). Meanwhile, other structural explanations for low inflation are less powerful than many believe. For example, globalization has leveled off and rising tariff and non-tariff barriers will hinder important global supply chains. Our research also suggests that the rising industrial use of robots and the e-commerce effect on retail prices have had only a small depressing effect on U.S. inflation. Bottom Line: The Phillips curve relationship has probably not changed in a permanent way since Lehman went down. It is quite flat when the labor market is not far away from full employment, but the relationship is probably non-linear. As the unemployment rate drops further, the business sector will have no choice but to lift wages as labor becomes increasingly scarce. The kinked nature of the Phillips curve augments the odds that the Fed will eventually find itself behind the curve, and inflation will rise more than the market is expecting. The same arguments apply to the Bank of England and possibly even the European Central Bank. Gold offers some protection against inflation risk, but the precious metal is still quite expensive in real terms. Investors would be better off simply buying inflation-protection in the inflation swaps market or overweighting inflation-linked bonds over conventional issues. (3) Monetary Policy: Destined To Fight The Last War There are several reasons to believe that the shocking events of the crisis and its aftermath have left a lasting impression on monetary policymakers. Several factors suggest that they will err on the side of allowing the economy to overheat and inflation to modestly overshoot the target: Inflation Persistence: As discussed above, there is a greater awareness that it is difficult to lift both actual inflation and inflation expectations once they have fallen. Some FOMC members believe that long-term inflation expectations are still too low to be consistent with the Fed meeting its 2% inflation target over the long term. A modest inflation overshoot in this cycle would be beneficial, according to this view, in the sense that it would boost inflation expectations and thereby raise the probability that the FOMC will indeed meet its goals over the long term. It might also encourage some discouraged workers to re-enter the labor market. Some policymakers also believe that the Fed is not taking much of a risk by pushing the economy hard, because the Phillips curve is so flat. Zero Bound: Low inflation expectations, among other factors, have combined to dramatically reduce the level of so-called r-star - the short-term rate of interest that is neither accommodative nor restrictive in terms of growth and inflation. R-star is thought to be rising now, at least for the U.S., but it is probably still low by historical standards across the major economies. This increases the risk that policy rates will again hit the lower bound during the next recession, making it difficult for central banks to engineer a real policy rate that is low enough to generate faster growth.5 Fighting the Last War: Memories of the crisis linger in the minds of policymakers. The global economy came dangerously close to a replay of the Great Depression, and policymakers want to ensure that it never happens again. Some monetary officials have argued that a risk-based approach means that it is better to take some inflation risks to limit the possibility of making a deflationary policy mistake down the road. Fears that the major economies are now more vulnerable to deflationary shocks seem destined to keep central banks too-easy-for-too-long. Central bankers will also be quicker and more aggressive in responding when negative shocks arrive in the future. This applies more to the U.S., the U.K. and Japan than the European Central Bank, but even for the latter there has been a clear change in the monetary committee's reaction function since Mario Draghi took over the reins. Financial Stability Concerns Policymakers are also more concerned about financial stability. Pre-crisis, the consensus among the monetary elite was that financial stability should play second fiddle to the inflation target. It was felt that central banks should focus on the latter, and pay attention to signs of financial froth only when they affect the inflation outlook. In practice, this meant paying only lip service to financial excess until it was too late. It was difficult to justify rate increases when inflation was not threatening. It was thought that macro-prudential regulation on its own was enough to contain financial excesses. Today, policymakers see financial stability as playing a key role in meeting the inflation target. It is abundantly clear that a burst bubble can be highly deflationary. Some policymakers still believe that aggressive macro-prudential policies can be effective in directly targeting financial excesses. However, others feel there is no substitute for higher interest rates; as ex-Governor Jeremy Stein stated, interest rates get "in all the cracks". Moreover, the Fed does not regulate the shadow banking sector. The Fed is thus balancing concerns over signs of financial froth against the zero-bound problem and fears of the next deflationary shock. We believe that the latter will dominate their policy choices, because it will still be difficult to justify rate hikes to the public when there is no obvious inflation problem. In the U.S., this implies that the economic risks are skewed toward a boom/bust scenario in which the FOMC is slow to respond to a fiscally-driven late cycle mini-boom. Inflation and inflation expectations react with a lag, but a subsequent acceleration in both forces the Fed to aggressively choke off growth. Policy Toolkit Central bankers will be quite willing to employ their new-found policy tools again in the next recession. The new toolbox includes asset purchases, aggressive forms of forward guidance, negative interest rates, and low-cost direct lending to banks and non-banks in some countries. Policymakers generally view these tools as being at least somewhat effective, although some have argued that the costs of using negative interest rates have outweighed the benefits in Europe and Japan. The debate on how to deal with the zero-bound problem in the U.S. has focused on lifting r-star, including raising the inflation target, adopting a price level target, policies to boost productivity, and traditional fiscal stimulus. Nonetheless, ex-Fed Chair Yellen's comments at the Jackson Hole conference in 2016 underscored that it will be more of the same in the event that the zero bound is again reached - quantitative easing and forward guidance.6 No doubt, the major central banks will rely heavily on both of these tools in order to manipulate yields far out the curve. Forward guidance may be threshold-based. For example, policymakers could promise to keep the policy rate frozen until unemployment or inflation reaches a given level. Now that central bankers have crossed the line into unorthodox monetary policy and inflation did not surge, future policymakers will be willing to stretch the boundaries even further in the event of a recession. For example, they may consider price-level targeting, which would institutionalize inflation overshoots to make up for past inflation undershoots. It is also possible that we will observe more coordination between monetary and fiscal policies in the next recession. The combination of fiscal stimulus and a cap on bond yields would be highly stimulative in theory, in part by driving the currency lower. Japan has gone half way in this direction by implementing a yield curve control (YCC) policy. However, it has failed so far to provide any meaningful fiscal stimulus since the yield cap has been in place. It also appears likely that central bank balance sheets will not return to levels as a percent of GDP that existed before the crisis. An abundance of bank deposits at the central bank will help to satisfy a structural increase in the demand for cash-like risk-free assets. Maintaining a bloated balance sheet will also allow central banks to provide substantial amounts of reverse repos (RRPs) into the market, which should improve the functioning of money markets that have been impaired to some degree by regulation. We do not expect that a structural increase in central bank balance sheets will have any material lasting impact on asset prices or inflation. We believe that inflation will surprise on the upside, but not because central banks will continue to hold significant amounts of government bonds on their balance sheets over the medium term. Bottom Line: The implication is that the monetary authorities will have a greater tolerance for an overshoot of the inflation target than in the past. The Fed will respond only with a lag to the fiscally-driven surge in U.S. growth, leading to a boom/bust economic scenario. During the next recession, policymakers will rely heavily on quantitative easing and forward guidance to manipulate the yield curve (after the policy rate reaches the lower bound). (4) Bond Prices: Structural Factors Turning Less Bullish Perhaps the most dramatic and lasting impact of the GFC has been evident in the global bond market. Government yields fell to levels never before observed across the developed countries and have remained extremely depressed, even as the expansion matured and economic slack was gradually absorbed. Real government bond yields are still negative even at the medium and long parts of the curve in the Eurozone and Japan (Chart II-10). It is tempting to conclude that there has been a permanent shift down in global bond yields. Chart II-10Real Yields Still Depressed
Real Yields Still Depressed Real Yields Still Depressed
Real Yields Still Depressed Real Yields Still Depressed
Equilibrium bond yields are tied to the supply side of the economy. Potential GDP growth is the sum of trend productivity growth and the pace of expansion of the labor force. Equilibrium bond yields may fall below the potential growth rate for extended periods to the extent that aggregate demand faces persistent headwinds. The headwinds in place over the past decade include fiscal austerity, demographics, household deleveraging, increased regulation and lingering problems in the banking sector that limited the expansion of credit, among others. These headwinds either affect the desire to save or the desire to invest, the interplay of which affects equilibrium bond yields. Some of these economic headwinds predate 2007, but the financial crisis reinforced the desire to save more and invest less. Space limitations prevent a full review of the forces that depressed bond yields, but a summary is contained in Appendix 1 and we encourage interested readers to see our 2017 Special Report for full details.7 The Great Supply-Side Shortfall Falling potential output growth in the major advanced economies also helped to drag down equilibrium bond yields. The pace of expansion in the global labor force has plunged from 1¾% in 2005, to under 1% today (Chart II-11). The labor force has peaked in absolute terms in the G7, and is already shrinking in China. Chart II-11Slower Labor Force Expansion...
Slower Labor Force Expansion...
Slower Labor Force Expansion...
Productivity growth took a dramatic turn for the worst after 2007 (Chart II-12). The dismal productivity performance is not fully understood, but likely reflected the peaking in globalization, increased regulation and the dramatic decline in capital spending relative to GDP. The latter was reflected in a collapse in the growth rate of the global capital stock (Chart II-13). In the U.S., for which we have a longer history of data, growth in the capital stocks has lead shifts in productivity growth with a 3-year lag. Firms have also been slower to adopt new technologies over the past decade. Chart II-12...And Lower Productivity
November 2018
November 2018
Chart II-13Productivity And Investment
Productivity And Investment
Productivity And Investment
The resulting impact on the level of GDP today has been nothing short of remarkable. The current IMF estimate for the level of potential GDP in 2018 is 10% lower than was projected by the IMF in 2008 (Chart II-14). There has been a similar downgrading of capacity in Europe, Japan and the U.K. Actual GDP has closed the gap with potential GDP to varying degrees in the major countries, but at a much lower level than was projected a decade ago. Paul Krugman has dubbed this the "Great Shortfall". Chart II-14A Permanent Loss Of Output
A Permanent Loss Of Output
A Permanent Loss Of Output
The Great Shortfall was even greater with respect to capital spending. For 2017, the IMF estimates that global investment was more than 20% below the level implied by the pre-crisis trend (Chart II-15). Reduced credit intermediation, from a combination of supply and demand factors, was a significant factor behind the structural loss of economic capacity according to the IMF study.8 Chart II-15Permanent Scars On Capital Spending
Permanent Scars On Capital Spending
Permanent Scars On Capital Spending
By curtailing the business investment relative to GDP for a prolonged period, major economic slumps can have a permanent effect on an economy's long-term prospects. The loss of output since the financial crisis will never be regained. That said, bond yields in theory are related to the growth rate of productivity, not its level. The IMF report noted that there may even be some long-lasting effects on the growth rate of productivity. The crisis left lingering scars on future growth due to both reduced global labor force migration and fertility rates. The latter rose in the decade before the crisis in several advanced economies, only to decline afterward. Households postponed births in the face of the economic and financial upheaval. The IMF argues that not all of the decline in fertility rates will be reversed. An Inflection Point In Global Bond Yields On a positive note, the pickup in business capital spending in the major countries in recent years implies an acceleration in the growth rate of the capital stock and, thus, productivity. In the U.S., this relationship suggests that productivity growth could rise by a percentage point over the coming few years (Chart II-13). This should correspond to a roughly equivalent rise in equilibrium bond yields. Moreover, some of the other structural factors behind ultra-low interest rates have waned, while others have reached an inflection point. For example, the age structure of world population is transitioning from a period in which aging added to the global pool of savings to one in which aging will begin to drain that pool as people retire and begin to deplete their nest eggs. Household savings rates will trend sharply lower in the coming years. Again, we encourage readers to read the 2017 Special Report for a full account of the structural factors that are shifting in a less bond-bullish direction. QE Reversal To Weigh On Bond Prices And let's not forget the unwinding of central bank balance sheets. The idea that central bank asset purchases on their own had a significant depressing effect on global bond yields is controversial. Some argue that the impact on yields occurred more via forward guidance; quantitative easing was a signal to markets that the central bank would stay on hold for an extended period, which pulled down yields far out the curve. This publication believes that QE had a meaningful impact on global bond yields on its own (Chart II-16). Nonetheless, either way, the Fed is now shrinking its balance sheet and the European Central Bank will soon end asset purchases. This means that the private sector this year is being forced to absorb a net increase in government bonds available to the private sector for the first time since 2014 (Chart II-17). Investors may demand juicier yields in order to boost their allocation to fixed-income assets. Chart II-16Reverse QE To Weigh On Bonds
Reverse QE To Weigh On Bonds
Reverse QE To Weigh On Bonds
Chart II-17Private Investors Will Have To Buy More
November 2018
November 2018
We are not making the case that real global bond yields are going to quickly revert to pre-Lehman averages. Global yields could even drop back to previous lows in the event of another recession. Nonetheless, from a long-term perspective, current market expectations suggest that investors still have an overly benign view on the outlook for yields. For example, implied real short-term rates remain negative until 2027 in the Eurozone, while they stay negative out to 2030 in the U.K. (Chart II-18). The implied path of real rates in the U.S. looks more reasonable, but there is still upside potential. Moreover, there is room for the inflation expectations component of nominal yields to shift up, as discussed above. Chart II-18Real Yields Still Too Low
Real Yields Still Too Low
Real Yields Still Too Low
Another way of making this point is shown in Chart II-19. The market expects the 10-year Treasury yield in ten years to be only slightly above today's spot yield, which itself is still very low by historical standards. Market expectations are equally depressed for the 5-year/5-year forward rate for the U.S. and the other major economies. Chart II-19Market Expectations Still Low
Market Expectations Still Low
Market Expectations Still Low
Bottom Line: Global bond yields fell to unprecedented levels due to a combination of cyclical and structural factors. The bond-bullish structural factors were reinforced by shifts in desired savings and business investment as a result of the Great Recession and financial crisis. Some of these structural factors will linger in the coming years, but others are shifting in a less bond-bullish direction. We do not expect nominal bond yields to return to pre-Lehman norms, and yields could even return close to previous lows in the case of a recession. Nonetheless, we expect a yield pattern of higher lows and higher highs over the coming business cycles. Mark McClellan Senior Vice President The Bank Credit Analyst Appendix 1: Key Factors Behind The Decline In Equilibrium Global Bond Yields The so-called Global Savings Glut has been a bullish structural force for bonds for the past couple of decades. A key factor is population aging in the advanced economies. Ex-ante desired savings rose as baby boomers entered their high-income years. China became a major source of global savings after it joined the WTO, and its large trade surplus was recycled into the global pool of savings. A slower pace of labor force growth in the developed countries resulted in a permanently lower level of capital spending relative to GDP. Slower consumer spending growth, as a result of a more moderate expansion in the working-age population, meant a reduced appetite for new factories, malls, and apartment buildings. The integration of the Chinese and Eastern European workforces into the global labor pool during the 1990s and 2000s resulted in an effective doubling of global labor supply in a short period of time. The sudden abundance of cheap labor depressed real wages from what they otherwise would have been, thus incentivizing firms to use more labor and less capital at the margin. The combination of slower working-age population growth in the advanced economies and a surge in the global labor force resulted in a decline in desired global capital spending. The increase in ex-ante savings and reduction in ex-ante capital spending resulted in a substantial drop in equilibrium global interest rates. The wave of cheap labor also aggravated the trend toward greater inequality in the advanced economies and the downward trend in labor's share of the income pie. A positive labor supply shock should benefit global living standards in the long run, but the adjustment costs related to China's integration into the global economy imposed on the advanced economies were huge and long-lasting. The lingering adjustment phase contributed to greater inequality in the major countries. Management was able to use the threat of outsourcing to gain the upper hand in wage negotiations. Moreover, technology appears to be resulting in faster, wider and deeper degrees of hollowing-out than in previous periods of massive technological change. The result has been a rise in the share of income going to high-income earners in the Advanced Economies, at the expense of low- and middle-income earners. This represents a headwind to growth that requires lower interest rates all along the curve. In other words, firms in the developed world either replaced workers with machinery in areas where technology permitted, or outsourced jobs to lower-wage countries in areas that remained labor-intensive. Both trends undermined labor's bargaining power, depressed labor's share of income, and contributed to inequality. 1 We make the simplifying assumptions that companies do not issue any more debt over the three years, and that EBIT is unchanged, in order to isolate the impact of higher interest rates. 2 The average credit rating for the U.S. is unavailable before 2000 in the Bloomberg Barclays index. However, other data sources confirm the long-term downward trend. 3 Please see The Bank Credit Analyst Special Report "Leverage And Sensitivity To Rising Rates: The Eurozone Corporate Sector," dated May 31, 2018, available at bca.bcaresearch.com 4 Please see Global Investment Strategy Special Reports "1970s-Style Inflation: Could It Happen Again? (Part 1)," dated August 10, 2018 and "1970s-Style Inflation: Could It Happen Again? (Part 2)," dated August 24, 2018, available at gis.bcaresearch.com 5 The lower bound is zero in the U.S., but is in negative territory for those central banks willing to impose negative rates on the banking sector. 6 For more background on the zero bound debate, the usefulness of a large central bank balance sheet and ways to lift r-star, please see The Bank Credit Analyst Special Report "Herding Cats At the Fed," dated October 2016, available at bca.bcaresearch.com 7 Please see The Bank Credit Analyst Special Report "Beware Inflection Points In The Secular Drivers Of Global Bonds," dated April 27, 2017, available at bca.bcaresearch.com 8 The Global Economic Recovery 10 Years After the 2008 Financial Meltdown. IMF World Economic Outlook, October 2018. III. Indicators And Reference Charts Our proprietary equity indicators remained bearish in October and valuation is still stretched, suggesting that it is too early to buy stocks. Our Willingness-to-Pay (WTP) indicators for the U.S. and Japan are both heading down. The Eurozone WTP has flattened-off recently, but is certainly not bullish. The WTP indicators track flows, and this provides information on what investors are actually doing, as opposed to sentiment indexes that track how investors are feeling. Our Revealed Preference Indicator (RPI) for stocks continues to issue a sell signal. The RPI combines the idea of market momentum with valuation and policy measures. It provides a powerful bullish signal if positive market momentum lines up with constructive signals from the policy and valuation measures. Conversely, if constructive market momentum is not supported by valuation and policy, investors should lean against the market trend. Momentum remains out of sync with valuation and policy, underlining the idea that caution is warranted. Our Monetary Indicator continues to hover in negative territory for stocks, but interestingly it is not deteriorating even as the Fed tightening campaign endures and bond yields have risen. Our Technical Equity Indicator appears poised to break down, but as of the end of October it was not giving a sell signal. The Speculation Indicator is still elevated, but the Composite Sentiment Indicator is in the middle of the range. It does not appear that the latest equity selloff was driven mainly by an unwinding of frothy market sentiment. Nonetheless, value has not improved enough to justify bottom-feeding on its own. On balance, our indicators continue to suggest that the underlying supports of the U.S. equity bull market are eroding. The U.S. earnings backdrop is still providing support overall, although there was a tick down in October in the U.S. net earnings revisions ratio and in positive-minus-negative earnings surprises. The backdrop for Treasurys has not changed, despite October's painful selloff. Valuation (still slightly cheap) and technicals (oversold by almost 2 standard deviations) imply that the countertrend pullback near month-end will continue into November. Beyond a near-term correction, though, complacency about inflation and the Fed's ability to hike rates to at least the level of the FOMC voters' median projection points to looming capital losses. The dollar is quite expensive on a purchasing power parity basis, and its long-term outlook is not constructive, but policy and growth divergences with other major economies will likely keep the wind at its back in the near term. EQUITIES: Chart III-1U.S. Equity Indicators
U.S. Equity Indicators
U.S. Equity Indicators
Chart III-2Willingness To Pay For Risk
Willingness To Pay For Risk
Willingness To Pay For Risk
Chart III-3U.S. Equity Sentiment Indicators
U.S. Equity Sentiment Indicators
U.S. Equity Sentiment Indicators
Chart III-4Revealed Preference Indicator
Revealed Preference Indicator
Revealed Preference Indicator
Chart III-5U.S. Stock Market Valuation
U.S. Stock Market Valuation
U.S. Stock Market Valuation
Chart III-6U.S. Earnings
U.S. Earnings
U.S. Earnings
Chart III-7Global Stock Market And Earnings: Relative Performance
Global Stock Market And Earnings: Relative Performance
Global Stock Market And Earnings: Relative Performance
Chart III-8Global Stock Market And Earnings: Relative Performance
Global Stock Market And Earnings: Relative Performance
Global Stock Market And Earnings: Relative Performance
FIXED INCOME: Chart III-9U.S. Treasurys And Valuations
U.S. Treasurys And Valuations
U.S. Treasurys And Valuations
Chart III-10Yield Curve Slopes
Yield Curve Slopes
Yield Curve Slopes
Chart III-11Selected U.S. Bond Yields
Selected U.S. Bond Yields
Selected U.S. Bond Yields
Chart III-1210-Year Treasury Yield Components
10-Year Treasury Yield Components
10-Year Treasury Yield Components
Chart III-13U.S. Corporate Bonds And Health Monitor
U.S. Corporate Bonds And Health Monitor
U.S. Corporate Bonds And Health Monitor
Chart III-14Global Bonds: Developed Markets
Global Bonds: Developed Markets
Global Bonds: Developed Markets
Chart III-15Global Bonds: Emerging Markets
Global Bonds: Emerging Markets
Global Bonds: Emerging Markets
CURRENCIES: Chart III-16U.S. Dollar And PPP
U.S. Dollar And PPP
U.S. Dollar And PPP
Chart III-17U.S. Dollar And Indicator
U.S. Dollar And Indicator
U.S. Dollar And Indicator
Chart III-18U.S. Dollar Fundamentals
U.S. Dollar Fundamentals
U.S. Dollar Fundamentals
Chart III-19Japanese Yen Technicals
Japanese Yen Technicals
Japanese Yen Technicals
Chart III-20Euro Technicals
Euro Technicals
Euro Technicals
Chart III-21Euro/Yen Technicals
Euro/Yen Technicals
Euro/Yen Technicals
Chart III-22Euro/Pound Technicals
Euro/Pound Technicals
Euro/Pound Technicals
COMMODITIES: Chart III-23Broad Commodity Indicators
Broad Commodity Indicators
Broad Commodity Indicators
Chart III-24Commodity Prices
Commodity Prices
Commodity Prices
Chart III-25Commodity Prices
Commodity Prices
Commodity Prices
Chart III-26Commodity Sentiment
Commodity Sentiment
Commodity Sentiment
Chart III-27Speculative Positioning
Speculative Positioning
Speculative Positioning
ECONOMY: Chart III-28U.S. And Global Macro Backdrop
U.S. And Global Macro Backdrop
U.S. And Global Macro Backdrop
Chart III-29U.S. Macro Snapshot
U.S. Macro Snapshot
U.S. Macro Snapshot
Chart III-30U.S. Growth Outlook
U.S. Growth Outlook
U.S. Growth Outlook
Chart III-31U.S. Cyclical Spending
U.S. Cyclical Spending
U.S. Cyclical Spending
Chart III-32U.S. Labor Market
U.S. Labor Market
U.S. Labor Market
Chart III-33U.S. Consumption
U.S. Consumption
U.S. Consumption
Chart III-34U.S. Housing
U.S. Housing
U.S. Housing
Chart III-35U.S. Debt And Deleveraging
U.S. Debt And Deleveraging
U.S. Debt And Deleveraging
Chart III-36U.S. Financial Conditions
U.S. Financial Conditions
U.S. Financial Conditions
Chart III-37Global Economic Snapshot: Europe
Global Economic Snapshot: Europe
Global Economic Snapshot: Europe
Chart III-38Global Economic Snapshot: China
Global Economic Snapshot: China
Global Economic Snapshot: China
Mark McClellan Senior Vice President The Bank Credit Analyst
Highlights Asset allocation: overweight industrial commodities versus equities... ...and neutral equities versus bonds. The euro: neutral for a broad basket but stay long JPY/EUR. The pound: long-term upside, but a better entry point awaits for those who can fine tune. Italian assets: buy when the 10-year BTP yield moves closer to 3 percent. Feature Some people ascribe this year's market action to economics, others ascribe it to geopolitics, but we put it down to mathematics (Chart of the Week). Chart of the WeekEquities Are In 'No Man's Land'
Equities Are In 'No Man's Land'
Equities Are In 'No Man's Land'
As my colleague Peter Berezin recently pointed out, economies and markets can undergo disruptive 'phase transitions' analogous to when water transitions to ice. For water, a 4 degree drop in temperature from 6 degrees to 2 degrees produces no discernible effect, but the same 4 degree drop from 2 degrees to minus 2 degrees produces major disruption, as roads freeze over, pipes burst, and so forth.1 Similarly, as economic or financial stresses build, nothing discernible happens until a phase transition is reached, at which point everything goes haywire. Our thesis is that markets may be near such a phase transition. To explain why, we first need to correct the great misunderstanding of finance, the misunderstanding of risk. The Evolutionary Basis Of Investment Risk One of the major breakthroughs in behavioural finance was the discovery that we care deeply about the asymmetry of an investment's potential returns. Rationally, this asymmetry shouldn't matter if the expected value of the gains equals or exceeds the expected value of the losses. But it does matter, and the reason is that we significantly overestimate the probabilities of extreme tail-events (Chart I-2). Chart I-2We Overestimate The Probability Of Tail-Events
Risk: The Great Misunderstanding Of Finance
Risk: The Great Misunderstanding Of Finance
Evolutionary biologists argue that this bias originated tens of thousands of years ago, when our distant ancestors had to survive daily 'fight or flight' threats. Faced with constant mortal danger, there was no time for measured analysis. Survival depended on a quick processing of choices into simple chunks: no risk, low risk, high risk. Thereby, our brains evolved to process a one in thousand and, say, a one in hundred chance of danger simply into the 'low risk' chunk, meaning that the 0.1 percent risk is overestimated to 1 percent - or whatever we define as low risk. Fast forward to today's financial markets, and our brains still overestimate extreme tail-events. It follows that for investments whose return distributions are asymmetric, the more extreme tail dominates the perception of its risk. Put simply, investors assess the risk of an investment in terms of its most extreme potential loss versus its most extreme potential gain in a short space of time (Chart I-3). Chart I-3Investors Assess Risk As The Most Extreme Potential Loss Versus Gain
Risk: The Great Misunderstanding Of Finance
Risk: The Great Misunderstanding Of Finance
Why in a short space of time? The answer is that while most professional investors have long-term objectives, they must report mark-to-market performances every quarter or half-year. Unfortunately, a fund manager who delivers a deep short-term loss is in grave danger of being fired - the modern day equivalent of our distant ancestors' daily fight for survival. And it is nominal losses that matter because even in a period of deflation, any decline in the price level is unlikely to boost real returns over a period of a few months. Correcting The Great Misunderstanding Of Finance So the great misunderstanding of finance is to equate risk with volatility. Risky assets, such as equities, are risky not because they are volatile in the conventional (root mean squared) sense. After all, nobody worries if the price goes up sharply! Also, it is a great misunderstanding to think that equities do not provide diversification benefits. They clearly do - witness the protection that equities provided to bondholders in the bond bloodbath that followed President Trump's surprise victory in 2016 (Chart I-4). Chart I-4Equities Protected Bondholders In The Post Trump Victory Bond Bloodbath
Equities Protected Bondholders In The Post Trump Victory Bond Bloodbath
Equities Protected Bondholders In The Post Trump Victory Bond Bloodbath
The real reason that risky assets are risky is because they have the propensity to experience much larger short-term losses than short-term gains - captured in the saying: equities climb up the stairs on the way up, but they jump out of the window on the way down. But here's the key point. At very low bond yields, bond returns develop the same (or worse) asymmetry as equity returns. Given the lower bound to yields, bond prices have no more stairs to climb... only a window to jump out of! (Chart I-5) The upshot is that equities lose their excess riskiness versus bonds, meaning that their valuations experience a phase transition sharply upwards. The corollary is that when bond yields normalise, equities regain their excess riskiness versus bonds - and their valuations must suffer a phase transition sharply downwards. Chart I-5At A 2% Bond Yield, Bond Returns Have the Same Negative Asymmetry As Equity Returns
Risk: The Great Misunderstanding Of Finance
Risk: The Great Misunderstanding Of Finance
According to our empirical and theoretical analysis, this phase transition sharply downwards is most pronounced when the global (10-year) bond yield rises through 2 percent. In rule of thumb terms, this is when the sum of the yields on the T-bond, German bund and JGB breaches and remains above 4 percent (Chart I-6). At such a phase transition, it would be prudent to de-risk portfolios and sit aside, at least for a while. Chart I-6When The Sum Of 10-Year Yields On The T-Bond, Bund, And JGB = 4%, The Global 10-Year Yield = 2%
When The Sum Of 10-Year Yields On The T-Bond, Bund, And JGB = 4%, The Global 10-Year Yield = 2%
When The Sum Of 10-Year Yields On The T-Bond, Bund, And JGB = 4%, The Global 10-Year Yield = 2%
Just below this level, a sum in the 3-4 percent range defines a kind of 'no man's land' in which equities drift sideways, perfectly explaining the behaviour of the market through the past year. With the sum now at 3.75 percent, the current message is to remain at neutral allocation to equities versus bonds. Instead, our main asset allocation recommendation is a relative value position: long industrial commodities versus equities - and the position has already gained 4 percent in the past two weeks. The Main Risk For European Institutions Is Existential Sticking with this week's theme of risk, the main risk confronting Europe's major institutions such as the ECB, the EU Council, and the EU Commission is an existential risk. This is because the very existence of the pan-European project relies on the ongoing (largely) unanimous support of a collection of sovereign European nations. As these sponsoring nations often have conflicting claims and interests, Europe's major institutions have intentionally designed themselves as rules-based organisations. Adherence to the rules is essential to avoid the bias, exceptionalism, and moral hazard that could tear apart the pan-European project. And this simple unifying principle explains the current stance of the ECB towards monetary policy, the stance of the EU Council towards Brexit, and the stance of the EU Commission towards the Italian budget. For the ECB, its main policy tools - interest rates, forward guidance on interest rates, and asset purchases - are calibrated to deliver its single objective: aggregate euro area CPI inflation 'below but close to 2 percent'. After a recent wobble in euro area growth, the 6-month credit impulse has ticked up (Chart I-7). Hence, it would be hard for the ECB to conclude that the convergence of inflation to its medium-term target has been blown off course (Chart I-8) - so we expect no major changes to the ECB's forward guidance. Leaving our overall stance to the EUR as neutral, with a preferred long exposure to JPY/EUR. Chart I-7The Euro Area 6-Month Credit Impulse Has Ticked Up
The Euro Area 6-Month Credit Impulse Has Ticked Up
The Euro Area 6-Month Credit Impulse Has Ticked Up
Chart I-8Euro Area Inflation Has Been Drifting Up To Target
Euro Area Inflation Has Been Drifting Up To Target
Euro Area Inflation Has Been Drifting Up To Target
Turning to the EU Council's strategy for Brexit, it will be unyielding on the indivisibility of the EU's four freedoms: goods, services, capital, and people. To do otherwise would be to undermine the strength and integrity of one of the EU's greatest achievements: the largest single market in the world. To give the U.K. special favours would risk giving it an unfair competitive advantage, as well as setting a dangerous precedent for other EU countries that wanted out. Hence, to avoid a hard North/South or East/West border for Ireland, the U.K.'s only option will be to remain indefinitely in a customs union with the EU. Once this is recognised and accepted by the U.K. parliament, the pound will rally.2 Finally, relating to the Italian budget, the EU Commission will adhere to the broad principle of its fiscal rules - again, because it cannot set a dangerous precedent for others. However, there may be some 'give' on the 2019 deficit in return for some 'take' on the 2020 and 2021 deficits. Ultimately, we expect de-escalation and compromise in this battle - but we recommend remaining neutral towards Italian assets until the 10-year BTP yield moves closer to 3 percent (Chart I-9). Chart i-9Remain Neutral Italian Assets Until The 10-Year BTP Yield Moves Closer To 3%
Remain Neutral Italian Assets Until The 10-Year BTP Yield Moves Closer To 3%
Remain Neutral Italian Assets Until The 10-Year BTP Yield Moves Closer To 3%
Dhaval Joshi, Senior Vice President Chief European Investment Strategist dhaval@bcaresearch.com 1 Please see the Global Investment Strategy Weekly Report 'Phase Transitions In Financial Markets: Lessons For Today' October 19, 2018 available at gis.bcaresearch.com 2 Please see the European Investment Strategy Weekly Report 'Understanding Brexit, Scandinavian Markets, And Semiconductors' October 18, 2018 available at eis.bcaresearch.com Fractal Trading Model* This week we note that the sharp sell-off in the Portuguese stock market is technically exhausted and ripe for a countertrend move. We prefer to express this as a market neutral pair-trade: long Portugal/short Hungary. Set the profit target at 6% with a symmetrical stop-loss. For any investment, excessive trend following and groupthink can reach a natural point of instability, at which point the established trend is highly likely to break down with or without an external catalyst. An early warning sign is the investment's fractal dimension approaching its natural lower bound. Encouragingly, this trigger has consistently identified countertrend moves of various magnitudes across all asset classes. Chart I-10
Long Portugal Equity Market
Long Portugal Equity Market
The post-June 9, 2016 fractal trading model rules are: When the fractal dimension approaches the lower limit after an investment has been in an established trend it is a potential trigger for a liquidity-triggered trend reversal. Therefore, open a countertrend position. The profit target is a one-third reversal of the preceding 13-week move. Apply a symmetrical stop-loss. Close the position at the profit target or stop-loss. Otherwise close the position after 13 weeks. Use the position size multiple to control risk. The position size will be smaller for more risky positions. * For more details please see the European Investment Strategy Special Report "Fractals, Liquidity & A Trading Model," dated December 11, 2014, available at eis.bcaresearch.com Fractal Trading Model Recommendations Equities Bond & Interest Rates Currency & Other Positions Closed Fractal Trades Trades Closed Trades Asset Performance Currency & Bond Equity Sector Country Equity Indicators Bond Yields Chart II-1Indicators To Watch - Bond Yields
Indicators To Watch - Bond Yields
Indicators To Watch - Bond Yields
Chart II-2Indicators To Watch - Bond Yields
Indicators To Watch - Bond Yields
Indicators To Watch - Bond Yields
Chart II-3Indicators To Watch - Bond Yields
Indicators To Watch - Bond Yields
Indicators To Watch - Bond Yields
Chart II-4Indicators To Watch - Bond Yields
Indicators To Watch - Bond Yields
Indicators To Watch - Bond Yields
Interest Rate Chart II-5Indicators To Watch - Interest Rate Expectations
Indicators To Watch - Interest Rate Expectations
Indicators To Watch - Interest Rate Expectations
Chart II-6Indicators To Watch - Interest Rate Expectations
Indicators To Watch - Interest Rate Expectations
Indicators To Watch - Interest Rate Expectations
Chart II-7Indicators To Watch - Interest Rate Expectations
Indicators To Watch - Interest Rate Expectations
Indicators To Watch - Interest Rate Expectations
Chart II-8Indicators To Watch - Interest Rate Expectations
Indicators To Watch - Interest Rate Expectations
Indicators To Watch - Interest Rate Expectations
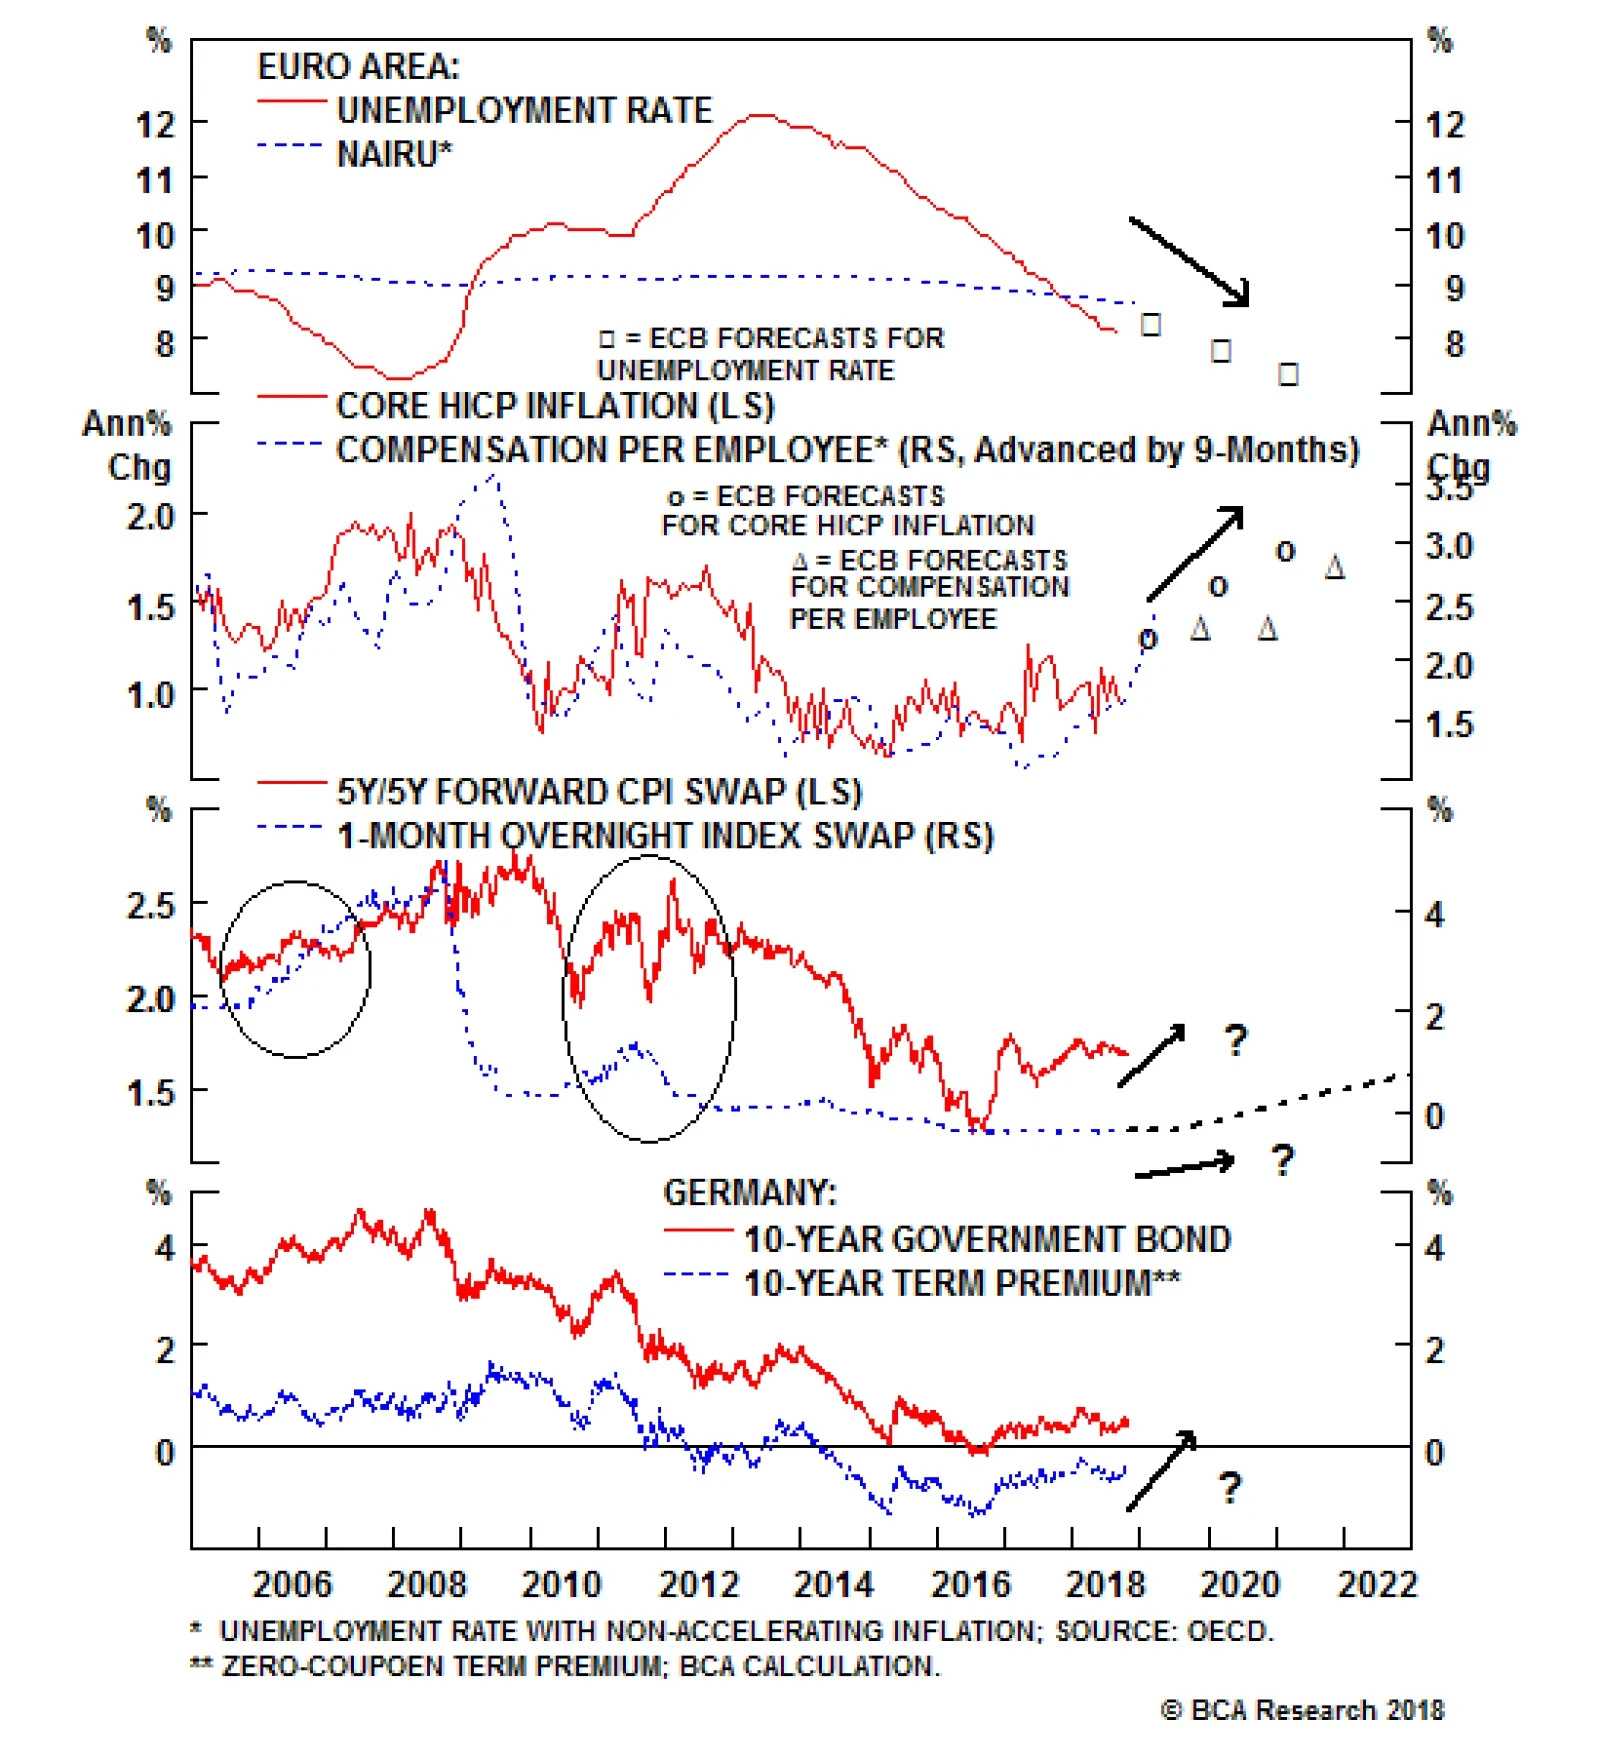
Our Global Fixed Income Strategy team is currently underweight euro area government bonds. They recommend tracking the following indicators to determine if the view remains appropriate. In its latest set of economic projections published last month, the…
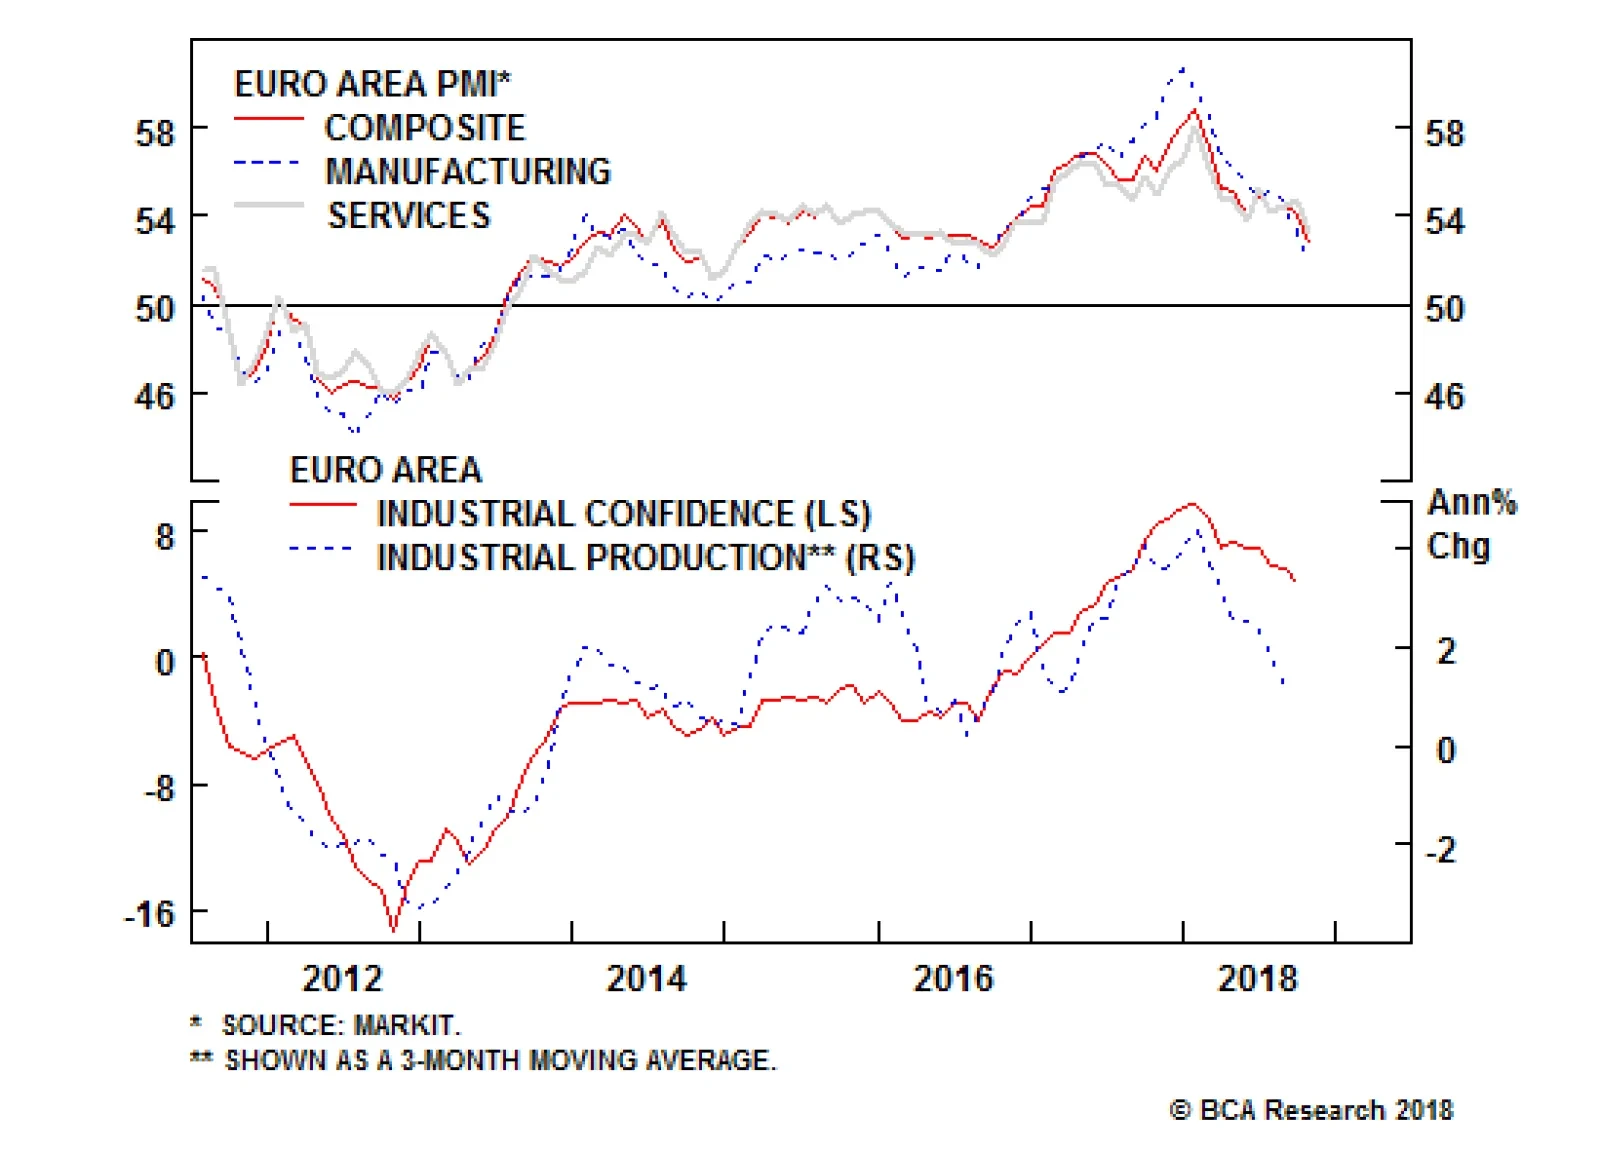
The growth and policy divergence between the U.S. and China remains a key investment theme at BCA. A weaker Chinese economy should produce a greater headwind for non-U.S. economies, including the euro area. This is why looking at the European PMI data is…
Highlights Duration Strategy: The recent market turmoil was a long overdue risk asset correction that does not change any fundamental underpinnings for rising global bond yields. Stay below-benchmark on overall global duration exposure, concentrated in an underweight stance on U.S. Treasuries. Country Allocations: Continue allocating duration risk for global government bond portfolios in favor of countries where central banks will have difficulty raising interest rates (Australia, U.K., Japan core Europe) relative to countries where rate hikes are more necessary and likely to happen (U.S., Canada). Feature Repricing "Central Banker Puts" Can Be Painful By a quirk of our scheduling, we have not published a regular Weekly Report since September, during what became a period of more turbulent global financial markets. While we trust that our clients have enjoyed the Special Reports that we have published instead, we are certain that many are asking an obvious question: have the more jittery markets triggered any change in BCA's views on global fixed income? The answer is "no". Just like the sharp "Vol-mageddon" risk asset selloff back in early February, the origin of the recent volatility spike was soaring U.S. Treasury yields driven by a rapid upward revision of Fed rate hike expectations (Chart of the Week). We had been expecting such an adjustment based on our positive assessment of the underlying momentum of both economic growth and inflation in the U.S. This remains a critical underpinning for our below-benchmark call on U.S. duration exposure, and our increased caution on U.S. spread product. Chart of the WeekRisk Assets Struggling As Bond Yields Rise
Risk Assets Struggling As Bond Yields Rise
Risk Assets Struggling As Bond Yields Rise
There is more to the story than just the Fed, however. Throughout the course of 2018, we have been warning that global central banks moving away from accommodative monetary policies would be the greatest threat to market stability. This is not only a story of Fed rate hikes. A reduction in the pace of asset purchases by the European Central Bank (ECB) and the Bank of Japan (BoJ), combined with outright contraction of the Fed's swollen balance sheet, has created a backdrop more conducive to volatile spikes - especially if the global economy is losing upward momentum at the same time. The OECD leading economic indicator has been steadily declining throughout 2018, a reflection of the more challenging backdrop for non-U.S. growth. It is no coincidence that, without the support from accelerating liquidity or positive economic momentum, many of last year's best performing investments (Italian government bonds, the Turkish lira, Emerging Market (EM) hard currency corporate debt) have been some of 2018's worst (Chart 2). Investors were willing to ignore the poor structural fundamentals underlying those markets when times were good, but have been much more cautious in 2018 with a less supportive macro environment. Chart 2The Darlings Of 2017 Are The Duds Of 2018
The Darlings Of 2017 Are The Duds Of 2018
The Darlings Of 2017 Are The Duds Of 2018
While there have been numerous political headlines that have caused bouts of market turbulence in the past few months - the escalating U.S.-China "tariff war", the Italian fiscal debate with the European Union - the short-term impact of these moves is magnified when global monetary policy is being tightened and global growth is cooling. The reason why central banks have been forced to turn more hawkish (or at least less dovish) is that diminished economic slack has forced their hands. For policymakers with an inflation-targeting mandate, the Phillips curve framework remains the primary analytical framework. When they see low unemployment, they get nervous. When they see low unemployment AND rising inflation, then become hawkish. Three-quarters of OECD countries now have an unemployment rate below the estimate of the full-employment NAIRU - the highest level in a decade - and realized inflation rates are accelerating in the major developed economies (Chart 3). Our own Central Bank Monitors are signaling the need for tighter monetary policy in most countries, while yields at the front-ends of government bond curves are steadily rising. Chart 3Central Bankers Still Believe In The Phillips Curve
Central Bankers Still Believe In The Phillips Curve
Central Bankers Still Believe In The Phillips Curve
Looking ahead, we continue to see more upward pressure on global bond yields in the next 6-12 months. Market pricing for the future policy actions of the major central bank did not move much even with the surge in volatility earlier this month. The markets now understand that the "policymaker put" that central bankers have implicitly sold to investors has a much lower strike price when labor markets are tight and inflation is accelerating. It will take much larger selloffs to cause central banks to become less hawkish. We still see the decisions we made in late June, moving to a more cautious recommended stance on overall risk in fixed income portfolios, as appropriate. Staying below-benchmark on overall global duration risk, while underweighting those countries where the central banks are under the greatest pressure to tighten policy, is the most sensible way to allocate a fully-investment government bond portfolio. That means underweighting the U.S. and Canada and overweighting Japan, Australia and the U.K. (Chart 4). In terms of credit, we are maintaining an overall neutral stance, but favoring the U.S. versus European equivalents and a maximum underweight on EM credit. Chart 4Interest Rates Remain Unfazed By More Jittery Markets
Interest Rates Remain Unfazed By More Jittery Markets
Interest Rates Remain Unfazed By More Jittery Markets
Bottom Line: The recent market turmoil was a long-overdue risk asset correction that does not change any fundamental underpinnings for rising global bond yields. Stay below-benchmark on overall global duration exposure, concentrated in an underweight stance on U.S. Treasuries. The Most Important Charts For Our Most Important Country Duration Views When determining our recommended fixed income country allocation, there are a few critical indicators we are watching to assess if those views should be maintained. We now go over each of those indicators for the most important developed economy bond markets: U.S. (Underweight): Watch TIPS Breakevens & The Employment/Population Ratio U.S. Treasuries have been the one major government bond market this year that has seen a rise in both inflation expectations and real yields. The breakeven inflation rate implied by the spread between 10-year nominal Treasuries and TIPS has gone up from 1.97% to 2.10% since the start of 2018, while the real 10-year TIPS yield has climbed from 0.44% to 1.09% over the same period. The rise in inflation expectations has occurred alongside an acceleration of U.S. economic growth and a generalized rise in inflation pressures. Reliable cyclical leading indicators like the ISM Manufacturing index and the New York Fed's Underlying Inflation Gauge are pointing to an acceleration of U.S. core CPI inflation towards the 2.5-3% range over the next year (Chart 5). This would be enough to push 10-year TIPS breakevens comfortably into the 2.3-2.5% range that we deem consistent with the Fed's price stability target (core PCE inflation at 2%). Chart 5U.S.: Both Real Yields & Inflation Expectations Are Rising
U.S.: Both Real Yields & Inflation Expectations Are Rising
U.S.: Both Real Yields & Inflation Expectations Are Rising
Any larger move in inflation expectations would only occur if the Fed were to accommodate it by not continuing to hike rates at the current 25bps/quarter pace. That is unlikely with the strength of the U.S. labor market suggesting that the Fed is behind the curve on rate hikes. The U.S. employment/population ratio for prime age (25-54 years old) workers has almost returned back to the peak levels of the mid-2000s near 80% (bottom panel). The Fed had to push the real funds rate to over 3% during that cycle to get policy to a restrictive setting above the Fed's estimate of the r-star neutral real rate. While it is unlikely that the Fed will need to push the real funds rate to as high a level as in the mid-2000s, the current real rate has not even caught up to the Fed's r-star estimate, which is starting to slowly increase alongside the stronger U.S. economy. That implies a higher nominal funds rate would be needed to push up the real rate to neutral levels, with even more nominal increases needed if inflation continues to accelerate. With only 62bps of rate hikes over the next year currently discounted in the USD Overnight Index Swap (OIS) curve, there is scope for Treasury yields to rise further over the next 6-12 months. Core Europe (Underweight): Watch Realized Inflation Relative to ECB Forecasts In the euro area, the evolution of unemployment, wage growth and core inflation compared to the ECB's positive forecasts will be the critical driver of the future direction of government bond yields. In its latest set of economic projections published last month, the ECB expects the overall euro area unemployment rate to be 8.3% in 2018, 7.8% in 2019 and 7.4% in 2020.1 With the actual unemployment rate falling to 8.1% in August, the realized outcomes are already exceeding the ECB's forecasts (Chart 6). The same can be said for euro area wages, where the growth in compensation per employee (2.45%) is already running above the 2018 ECB projection of 2.2%. The ECB expects no acceleration of wage growth in 2019 (2.2%), but a further ratcheting up in 2020 (2.7%). Chart 6Euro Area: Expect Higher Yields If ECB Forecasts Materialize
Euro Area: Expect Higher Yields If ECB Forecasts Materialize
Euro Area: Expect Higher Yields If ECB Forecasts Materialize
In a recent Special Report, we identified a leading relationship between wage growth and core HICP inflation in the euro area of around nine months.2 This would suggest that core HICP inflation should rise towards 1.5% within the next six months based on the current acceleration of wage growth (second panel). This would be above the ECB's current projection for 2018 (1.1%), but in line with the 2019 forecast (1.5%). Core inflation is projected to rise to 1.8% in 2020. If unemployment and inflation even just match the ECB's forecasts, there is likely to be a material repricing of core European bond yields through higher inflation expectations. At 1.7%, 10-year EUR CPI swaps are well below the +2% levels that occurred during the past two ECB rate hike cycles in the mid-2000s and 2010-11 (third panel). Both wage and core price inflation in the euro area were around the ECB's current 2019-2020 projections during both of those prior tightening episodes, suggesting that the past may indeed be prologue when it comes to inflation expectations. Given growing U.S.-China trade tensions, and uncertainties over the future path for Chinese economic growth, there is a risk that the ECB's growth and unemployment forecasts are too optimistic. The euro area economy remains highly levered to exports, and to Chinese demand in particular. Furthermore, the ECB continues to provide very dovish forward guidance, with no rate hikes expected until at least September 2019. Yet with a mere 12bps of rate hikes over the next year currently discounted in the EUR OIS curve, there is scope for core European bond yields to rise further over the next 6-12 months if euro area inflation surprises to the upside. Italy (Underweight): Watch Non-Italian Bond Spreads & The Euro The Italian budget battle with the European Union has been a gripping drama for investors in recent months. Italian bond yields have been under steady upward pressure, with the benchmark 10-year yield getting as high as 3.78%. Yet the story remains as much about sluggish Italian growth as it is about Italian fiscal policy. The populist Italian government has pushed for larger deficits, but has toned down the anti-euro language that dominated the election campaign earlier this year. This is why there has been very minimal contagion from higher Italian bond yields into other Peripheral European bond yields or euro area corporate bond spreads, or into the euro itself which remains very firm on a trade-weighted basis (Chart 7). Chart 7Italy: A Story Of Weak Growth, Not Euro Break-Up
Italy: A Story Of Weak Growth, Not Euro Break-Up
Italy: A Story Of Weak Growth, Not Euro Break-Up
We continue to view Italian government bonds as a growth-sensitive credit instrument, like corporate bonds. In other words, faster Italian economic growth implies greater tax revenues, smaller budget deficits and a less worrisome trajectory for Italy's debt/GDP ratio. The opposite holds true when Italian economic growth is slowing. This is why there is a reliable directional relationship between Italy-Germany bond yield spreads and the OECD's leading economic indicator (LEI) for Italy (top panel). With the Italy LEI still in a downtrend, we do not yet see a cyclical case for shifting away from an underweight stance on Italian government bonds. Yet if the 10-year Italian yield were to reach 4%, the implied mark-to-market loss would wipe out the capital of Italy's banks, who own large quantities of government bonds. In that scenario, the ECB would likely get involved to stem the crisis, possibly by further delaying rate hikes of ramping up asset purchases. This would especially be likely if there was significant widening of non-Italian credit spreads and a sharply weaker euro. Hence, watch those markets for signs that the Italy fiscal crisis could trigger a monetary policy response. U.K. (Overweight): Watch Real Wage Growth & Business Confidence In the U.K., our non-consensus call to stay overweight Gilts has not been based on any long-run value considerations. Real yields remain depressed and the Bank of England (BoE) has kept monetary policy settings at extremely accommodative levels. The BoE continues to expect that a rise in real wage growth is likely due to the very tight U.K. labor market. This would support consumer spending and eventually require higher interest rates. The only problem is that this is happening very slowly. The annual growth in U.K. wage growth is now up to 3.1%, the fastest rate since 2008. This is above the pace of headline CPI inflation of 2.5%, thus real wages are finally starting to perk up (Chart 8). A continuation of this trend would feed into faster consumer spending and, eventually, trigger BoE rate hikes. Chart 8U.K.: Brexit Uncertainty + Middling Inflation = BoE Doing Little
U.K.: Brexit Uncertainty + Middling Inflation = BoE Doing Little
U.K.: Brexit Uncertainty + Middling Inflation = BoE Doing Little
One other big impediment to the BoE turning more hawkish is the uncertainty over the U.K. government's Brexit negotiations with the EU. The extended Brexit drama has weighed on both U.K. business and consumer confidence, both of which have struggled since the 2016 Brexit vote (third panel). With the March 2019 deadline for the U.K. "officially" leaving the EU fast approaching, the odds of no deal being reached in time are increasing. U.K. Prime Minister Theresa May is desperately trying to avoid a no-deal Brexit, but such an outcome would create further instability in U.K. financial markets and close any near-term window of opportunity for the BoE to try and hike rates. For now, we see the depressed confidence from Brexit uncertainty offsetting the bump up in real wage growth, leaving Gilts on a path to continue modestly outperforming as they have throughout 2018 (bottom panel). An announcement of a Brexit deal would be a likely trigger for us to downgrade Gilts to neutral, and perhaps even to underweight given the developing uptrend in real wage growth. Bottom Line: Continue allocating duration risk for global government bond portfolios in favor of countries where central banks will have difficulty raising interest rates (Australia, U.K., Japan core Europe) relative to countries where rate hikes are more necessary and likely to happen (U.S., Canada). Robert Robis, CFA, Senior Vice President Global Fixed Income Strategy rrobis@bcaresearch.com 1https://www.ecb.europa.eu/pub/pdf/other/ecb.ecbstaffprojections201809.en.pdf 2 Please see BCA Foreign Exchange Strategy/Global Fixed Income Strategy Special Report, "Will Rising Wages Cause An Imminent Change In Policy Direction In Europe And Japan?", dated October 5th 2018, available at fes.bcaresearch.com and gfis.bcaresearch.com. Recommendations The GFIS Recommended Portfolio Vs. The Custom Benchmark Index
Expect More Volatility, More Often
Expect More Volatility, More Often
Duration Regional Allocation Spread Product Tactical Trades Yields & Returns Global Bond Yields Historical Returns
Highlights Rising U.S. bond yields will continue to put downward pressure on global stocks in the near term, but will not trigger an equity bear market until rates reach restrictive territory. We are still at least 12 months away from that point. The blowout in Italian bond yields has further to go, which will also weigh on global risk assets. Nevertheless, we would buy BTPs for a tactical trade if the 10-year yield rose above 4%, because at that level EU policymakers will call out the fire engines. We downgraded global equities from overweight to neutral in June, while maintaining our bias for DM stocks over EM stocks. Barring any major new developments, we would turn bullish again if global stocks were to fall by 8% from current levels. Remain cyclically underweight interest rate duration. We would move to neutral on duration if the U.S. 10-year yield were to rise to 3.7%. We are still bullish on the dollar, but would shift to neutral if the DXY rose above 100. Feature Bond Yields: Up, Up, And Away Global risk assets remained on the back foot this week. The MSCI All-Country World stock market index has now fallen by 6.3% in dollar terms since last Wednesday. Even the mighty S&P 500 has finally buckled under the pressure. The vulnerability of U.S. stocks had been accumulating beneath the surface for some time, as evidenced by the fact that the advance-decline line has been deteriorating since the late summer. The small cap Russell 2000 is down 11.3% from its August 31st highs (Charts 1A& 1B). Chart 1ABreadth Deteriorated In The Lead-Up To The Correction
Breadth Deteriorated In The Lead-Up To The Correction
Breadth Deteriorated In The Lead-Up To The Correction
Chart 1BStocks Under Pressure
Stocks Under Pressure
Stocks Under Pressure
Bond yields usually fall when equities swoon. This time around, it is the increase in bond yields itself that has undermined stocks. In the U.S., yields have risen in response to better-than-expected growth, a wider budget deficit, rising oil prices, and an increasingly hawkish Fed. In Italy, worries about debt sustainability have been the primary driver of rising yields. Neither factor spells doom for global risk assets. However, a period of indigestion is likely over the coming weeks, which could see global equities go down before they go up again. The U.S. Economy: Too Much Winning? We have argued for much of this year that investors were underappreciating the extent to which the Federal Reserve can raise rates without choking off growth. The past few weeks have seen a growing recognition among investors that the Fed may be behind the curve in normalizing monetary policy. This has led to a steepening in the expected path of U.S. short-term rates, which, together with an increase in the term premium, have pushed up yields at the longer-dated maturities. Both better economic data and Fedspeak contributed to the bond sell-off. On the data front, the non-manufacturing ISM index clocked in at 61.6. The all-important employment component of the index hit a record high. Confirming the encouraging labor market signal from the ISM, the unemployment rate fell to a 48-year low of 3.68% in September. While average hourly earnings ticked down to 2.75% on a year-over-year basis, this was entirely due to base effects. On a month-over-month basis, average hourly earnings have risen by 0.3% for three straight months. If this trend continues, the year-over-year rate will rise to 3.2% by the end of this year. Tellingly, recent wage growth has been concentrated among workers at the bottom of the income distribution (Chart 2). This is important because not only do the wages of low-income workers correlate better with labor market slack than those of high-income workers, but low-income workers are also more likely to spend the bulk of their paychecks. Chart 2Wage Growth Has Accelerated At The Bottom Of The Income Distribution
Wage Growth Has Accelerated At The Bottom Of The Income Distribution
Wage Growth Has Accelerated At The Bottom Of The Income Distribution
Higher wage growth will boost consumer spending. Indeed, it is probable that consumption will rise more than income, given that the personal savings rate has plenty of scope to fall from the current elevated level of 6.6%. Rising wages will incentivize companies to invest more in labor-saving technologies, translating into an increase in capital spending.1 Add in ongoing fiscal stimulus, and we have a recipe for an overheated economy. Starstruck No More As of today, the market has priced in one Fed rate hike in December but only two rate hikes in 2019 (Chart 3). Investors expect no rate hikes in 2020 and beyond. That still seems implausible to us, which suggests that the bond sell-off has further to go. Chart 3The Market Still Thinks The Fed Can't Raise Rates Above 3%
Bond Bears Maul Goldilocks
Bond Bears Maul Goldilocks
In contrast to the past, the Fed no longer seems interested in talking down rate expectations. Speaking with Judy Woodruff at The Atlantic Festival, Chairman Powell stated the Fed "may go past neutral, but we are a long way from neutral at this point, probably."2 Even uber-dove Chicago Fed President Charles Evans appears to have jettisoned his worries about deflation, noting in a speech last Wednesday that "I am more comfortable with the inflation outlook today than I have been for the past several years."3 The Fed has also increasingly downplayed the importance of estimates of the neutral rate of interest, the concept on which the long-term "dots" in the Summary of Economic Projections are based. The Fed's new mantra is that economic data, rather than some theoretical model, should guide monetary policy. Ironically, it was New York Fed President John Williams, who developed one of the most widely used models of r-star, the eponymously named Holston-Laubach-Williams model, that best articulated the Fed's position. At a speech last Monday, Williams argued that the neutral rate of interest, or r-star, has "gotten too much attention in commentary about Fed policy." He went on to say that "Back when interest rates were well below neutral, r-star appropriately acted as a pole star for navigation. But, as we have gotten closer to the range of estimates of neutral, what appeared to be a bright point of light is really a fuzzy blur, reflecting the inherent uncertainty in measuring r-star."4 Trump And Bonds President Trump was quick to blame the Fed for this week's stock market sell-off. Within the span of 24 hours, he used the words "crazy," "loco," "ridiculous," "too cute," "too aggressive," and "big mistake" to describe recent Fed policy. We doubt Trump's rhetoric will have any immediate effect on Fed decision-making. But even if it did sway the Fed to slow the pace of rate hikes, the result will be higher bond yields, not lower yields. This is simply because any further delays in raising rates will lead to even more overheating, and ultimately, higher inflation and the need for higher rates down the road. Bond Sell-Off Will Produce A Correction In Stocks, Not A Bear Market At the height of this week's bond sell-off, the 10-year Treasury yield breached its 200-month moving average for the first time since ... October 1987 (Chart 4). While that sounds pretty ominous, keep in mind that the 10-year yield had reached almost 10% on the eve of the 1987 stock market crash, or about 6% in real terms. Chart 4Two Lines Meet After Three Decades
Two Lines Meet After Three Decades
Two Lines Meet After Three Decades
As my colleague, Doug Peta, discussed two weeks ago, it is the level of interest rates that tends to matter more for stocks rather than the change in rates.5 Specifically, equity returns tend to be lowest at times when monetary policy is already in restrictive territory (Chart 5 and Tables 1 and 2). That was the case in 1987. It is not the case today. Chart 5The Fed Funds Rate Cycle
Bond Bears Maul Goldilocks
Bond Bears Maul Goldilocks
Table 1Tight Policy Is Hazardous To Stocks' Health...
Bond Bears Maul Goldilocks
Bond Bears Maul Goldilocks
Table 2...Especially In Real Terms
Bond Bears Maul Goldilocks
Bond Bears Maul Goldilocks
The fact that stocks do worse in environments where monetary policy is tight makes perfect sense. A restrictive monetary policy is usually a prelude to a recession. As Chart 6 illustrates, bear markets and recessions almost always coincide, with the latter usually leading the former by about six-to-twelve months. None of our favorite leading recession indicators are flashing red now (Chart 7). Even the yield curve has steepened in recent weeks. Chart 6Recessions And Bear Markets Usually Overlap
Recessions And Bear Markets Usually Overlap
Recessions And Bear Markets Usually Overlap
Still, higher long-term bond yields do reduce the long-term attractiveness of stocks compared with bonds. The S&P 500 earnings yield has risen modestly since 2016 due to the fact that earnings have grown somewhat more quickly than equity prices. However, the U.S. real 10-year yield has surged by almost 120 basis points over this period. On balance, this has caused the equity risk premium to decline (Chart 8).6 In order to bring the equity risk premium back down to mid-2016 levels, the S&P 500 would need to fall by about 15% from today's levels. We do not expect stocks to fall by that much, partly because the economic environment is more robust than back then, but a further drop of 5%-to-10% from current levels is certainly plausible. Chart 7A U.S. Recession Is Not Imminent
A U.S. Recession Is Not Imminent
A U.S. Recession Is Not Imminent
Chart 8Stocks Versus Bonds
Stocks Versus Bonds
Stocks Versus Bonds
Italy: Heading For A Debt Crisis? The rise in Treasury yields has reduced the attractiveness of other global government bond markets, causing them to sell off in sympathy. Notably, German bund yields have increased by 33 basis points since their May lows (Chart 9). Chart 9Global Bond Yields Moving Higher
Global Bond Yields Moving Higher
Global Bond Yields Moving Higher
Rising German bund yields are bad news for Italy. All things equal, a higher "risk free" bund yield implies a higher Italian bond yield. To make matters worse, as Italian borrowing costs have risen, the perceived likelihood that Italy will be unable to repay its debt has increased. This has caused the spread between German bunds and Italian BTPs to widen, thereby magnifying the effect on Italian bond yields from the increase in risk-free yields. All this has happened at the worst possible moment. Italy's populist government and the European Commission are locked in a battle of wills over next year's budget. The Italian government is targeting a fiscal deficit of 2.4% of GDP for 2019, compared with a deficit of 0.8% that the outgoing caretaker government had proposed in May. Strictly speaking, the new deficit target is still consistent with the 3% limit under the Maastricht Treaty. Nevertheless, it is still causing consternation in Brussels. There are at least three reasons for this: While the government's program has a lot of specifics about how it will increase the deficit - more public investment; a universal minimum income scheme; the ability to retire earlier than under current law; corporate tax cuts; no VAT hike in 2019, etc. - it does not specify which items in the budget will be cut. The program also provides few details on revenue measures, other than proposing a one-off tax amnesty, which will arguably reduce tax receipts over the long haul. The proposed budget assumes real GDP growth of 1.5% in 2019. This is higher than the May projection of 1.4%, and well above the IMF's most recent projection of 1%. The government's real GDP projections for 2020-21 are also about 0.7 percentage points above the IMF's estimates. While Italy's proposed fiscal deficit is below the Maastricht Treaty limit, its current debt-to-GDP ratio of 132% is well above the ceiling of 60% (Chart 10). This implies that Italy should be aiming for a smaller deficit target than what it is currently proposing. Chart 10Italy's Public Debt Mountain
Italy's Public Debt Mountain
Italy's Public Debt Mountain
We expect the Italian government to ultimately acquiesce to the EU's demands, but not before the bond vigilantes have pushed them into a corner. For their part, the EU establishment would love nothing more than to embarrass the Five Star-Lega coalition in order to send a message to voters across Europe about the dangers of voting for populist parties. This means that the Italian 10-year yield may need to break above 4% - the level at which Italian banks would likely be technically insolvent based on the market value of their BTP holdings - before a compromise is reached. We would put on a tactical trade to buy 10-year BTPs at that level, but not before then. Investment Conclusions Goldilocks will survive, but the next couple of months will be challenging. Our soon-to-be-launched MacroQuant model is signaling a bearish outlook for stocks over the next 30 days (Chart 11). On the bond side, the model currently pegs the fair value for the U.S. 10-year yield at 3.7% (Chart 12). Bond sentiment is quite bearish at the moment, which makes a brief countertrend bond rally quite likely. However, the cyclical trend in yields remains to the upside. Chart 11MacroQuant* Recommends That Caution Is Warranted Towards Equities
Bond Bears Maul Goldilocks
Bond Bears Maul Goldilocks
Chart 12MacroQuant Sees 10-Year Treasury Yields Still Below Fair Value
Bond Bears Maul Goldilocks
Bond Bears Maul Goldilocks
We stated last week that investors should consider scaling back risk if they are currently overweight risk assets. We continue to favor this more cautious stance. For the first time in over a decade, short-term U.S. rates are above the dividend yield on the S&P 500 (Chart 13). Holding a bit more cash is finally an attractive option, at least for U.S.-based investors. Chart 13Cash Anyone?
Cash Anyone?
Cash Anyone?
If the sell-off in global equities continues, it will present a buying opportunity, given that the next major global economic downturn is probably at least another two years away. Barring any major new developments, we would turn bullish on stocks again if the MSCI All-Country World Index were to fall by 12% 10% 8% from current levels.7 We would recommend that investors move from an underweight to a neutral interest rate duration position in global bond portfolios if the U.S. 10-year Treasury yield rose to 3.7%. We are still bullish on the dollar, but would shift to neutral if the DXY rose above 100. Peter Berezin, Chief Global Strategist Global Investment Strategy peterb@bcaresearch.com 1 It is true that additional investment spending will raise aggregate supply, but normally it takes a while for that to happen. For example, it may take a few years to build an office tower or a new factory. Corporate R&D investment may not generate tangible benefits for a long time, especially in cases where the research is focused on something complicated (i.e., the design of new computer chips or pharmaceuticals). And even if investment spending could be transformed into additional productive capacity instantaneously, aggregate demand would still rise more than aggregate supply, at least temporarily. Here is the reason: The nonresidential private-sector capital stock is about 120% of GDP in the United States. As such, a one percent increase in investment spending would raise the capital stock by four-fifths of a percentage point. Assuming a capital share of income of 40% of national income, a one percent increase in the capital stock would lift output by 0.4%. Thus, a one-dollar increase in business investment would boost aggregate demand by one dollar in the year it is undertaken, while increasing supply by only 4/5*0.4 = roughly 32 cents. 2 Please see "WATCH: Powell says Fed is focused on 'controlling the controllable,' not politics," PBS News Hour, October 3, 2018; and Jeff Cox, "Powell says we're 'a long way' from neutral on interest rates, indicating more hike are coming," CNBC, October 3, 2018. 3 Charles Evans, "Monetary Policy 2.0?" OMFIF City Lecture on the U.S. Economic Outlook, London, England, October 3, 2018. 4 John C. Williams, "Remarks at the 42nd Annual Central Banking Seminar," Bank for International Settlements, October 1, 2018. 5 Please see U.S. Investment Strategy Special Report, "When Will Higher Rates Hurt Stocks?" dated September 24, 2018; and Special Report, "Revisiting The Fed Funds Rate Cycle," dated September 3, 2018. 6 For this exercise, we define the equity risk premium as the difference between the S&P 500 earnings yield (the inverse of the forward P/E ratio) and the real 10-year bond yield (using CPI swaps as our measure of expected inflation). 7 The perils of writing a report during a week when markets are moving fast. Strategy & Market Trends Tactical Trades Strategic Recommendations Closed Trades
Highlights Historically, the dollar exhibits positive seasonality in October and November. Technical and valuation indicators suggest that this year will be no exception. Continuing divergence between U.S. and global growth, rising interest rates, and Italian risks point in this direction as well. However, long positioning in the dollar along with the rebound in the China Play Index are creating non-negligible risks to this bullish dollar view. As a result, investors should overweight dollar exposure in their portfolio, but hedge the above risks by buying NZD/USD and selling EUR/JPY. Feature Through most of September, the dollar traded on the heavy side. However, in the last two trading days of the month, the greenback managed to regain some composure. As October and November have historically been strong months for the DXY (Chart I-1), this week we review if this seasonal pattern will once again hold. The balance of evidence suggests that the historical norm is likely to repeat itself, and that the dollar will continue to rally for the next six months or so, though there are a few risks that should be hedged against. Chart I-1Entering A Seasonally Strong Period For The Dollar
Entering A Seasonally Strong Period For The Dollar
Entering A Seasonally Strong Period For The Dollar
Technicals: No Obstacle For A Strong Dollar An argument rooted in seasonality is a reasoning based on technical factors. Currently, technical indicators continue to paint a supportive backdrop for the greenback. First, by the beginning of the summer, based on its 13-week rate-of-change measure, the dollar index had reached overbought levels. Faced with this hurdle, the dollar's rally essentially took a pause, with the DXY rising only 0.5% since June 28, compared to its 6.4% rally between April 10 and June 28. However, through this side-move, the dollar's overbought conditions resolved themselves, and now the greenback's 13-week rate of change is back in neutral territory (Chart I-2, top two panels). Normally, a sideways correction tends to be a sign that a currency's underlying support remains strong. On the other hand, the euro's oversold correction is also now complete, but the euro has remained on a slightly more pronounced downward path over the same period (Chart I-2, bottom two panels). Chart I-2Short-Term Overbought Conditions Have Been Cleared
Short-Term Overbought Conditions Have Been Cleared
Short-Term Overbought Conditions Have Been Cleared
Second, the fractal dimension measure for the trade-weighted dollar shows that despite the recent phase of dollar strength that began in September, the dollar's uptrend is not yet ready to exhaust itself (Chart I-3). The fractal dimension is a measure of groupthink promoted by Dhaval Joshi, head of BCA's European Investment Strategy. It compares the short-term and long-term variance of any asset to gauge if long-term and short-term investors are holding the same positions. If they do, risks are high that a paucity of buyers (or sellers in bear markets) may develop, resulting in a trend reversal as all investors are already similarly positioned. This fractal dimension flagged a yellow card for the dollar in June, but it was only followed by the sideways move described above. Now that the dollar is gaining some vigor, the recent pickup in this indicator suggests that this rally can run further. Chart I-3No Groupthink In The Dollar
No Groupthink In The Dollar
No Groupthink In The Dollar
Third, while the dollar needed to digest some short-term overbought conditions, cyclical indicators like the Coppock Oscillator are still nowhere near overbought (Chart I-4, top two panels). By the spring of 2018, the dollar had reached massively oversold territory on a cyclical basis, and it is now in the midst of a powerful rebound. If history is any guide, once the Coppock Oscillator turns, it is likely to move much more than it has so far, indicating that the dollar rally has legs. However, the euro's Coppock Oscillator looks like it still possesses ample downside, as downdrafts never end at the current level of readings (Chart I-4, bottom two panels). Chart I-4Cyclical Oscillators Still Favor The USD
Cyclical Oscillators Still Favor The USD
Cyclical Oscillators Still Favor The USD
Bottom Line: Technical indicators are currently not arguing against the normal seasonal strength in the USD. The short-term overbought conditions present at the beginning of the summer have evaporated, the dollar's trading action does not show meaningful evidences of groupthink, and a key cyclical momentum measure has further upside. Short-Term Valuations: No Obstacle Here Either An additional factor that might prevent the dollar's normal seasonal strength from realizing itself is the current valuation picture. Here again, there is little to worry about. As Chart I-5 illustrates, our Fundamental Intermediate Term Model and our Intermediate-Term Timing Model do not show any mispricing in the USD. The dollar is trading in line with our two augmented interest rate parity valuation metrics - two indicators that have historically been useful in spotting potential periods of USD risk. Chart I-5No Evident Mispricing In The Dollar
No Evident Mispricing In The Dollar
No Evident Mispricing In The Dollar
Economic And Financial Market Developments Still Support The Dollar With no danger for the dollar from a technical and valuation standpoint, economic and financial market developments will likely hold the key to the dollar's outlook. First, economic divergences remains fully at play. As Chart I-6 illustrates, the U.S. economy is handily outperforming the rest of the world as the ISM Manufacturing Index has not been dragged down by the weakness observed outside the U.S. Historically, the gap between the ISM and the world's PMI leads the dollar's gyrations as the greenback is ultimately the factor forcing U.S. and global growth to converge. This time around, the growth gap suggests that the dollar has a few more months of strength ahead of itself. Moreover, Arthur Budaghyan writes in BCA's Emerging Market Strategy service that China's deleveraging campaign will continue to hinder global export growth (Chart I-7) - a sector of the economy with little weight in the U.S. This means that the growth gap between the U.S. and the rest of the world may widen further. Chart I-6Economic Divergences Support The Dollar
Economic Divergences Support The Dollar
Economic Divergences Support The Dollar
Chart I-7China Deleveraging Points To Weaker Trade
China Deleveraging Points To Weaker Trade
China Deleveraging Points To Weaker Trade
Second, the U.S.'s economic strength may be a problem for a large swath of the global economy. It is often assumed that strong U.S. growth lifts global demand through exports, undoing some of China's negative impact in the process. However, this does not take into account that U.S. rates determine the global cost of capital. The U.S. economy is currently much stronger than the rest of the world, and the U.S. private sector is not as burdened by debt as is the case outside the U.S. (Chart I-8). This makes the U.S. more capable of handling higher interest rates than the rest of the world. As a result, this year, the rise in both 10-year Treasury yields and TIPS yields has been met with pain in assets levered to global growth, like the German DAX and EM stock prices, as well as EM and commodity currencies (Chart I-9). Chart I-8The U.S. Has A More Robust Balance Sheet
The U.S. Has A More Robust Balance Sheet
The U.S. Has A More Robust Balance Sheet
Chart I-9Higher U.S. Yields Hurt Assets Levered To Global Growth
Higher U.S. Yields Hurt Assets Levered To Global Growth
Higher U.S. Yields Hurt Assets Levered To Global Growth
This is in sharp contrast with the U.S. The market and the Federal Reserve are coming to grips with the reality that the U.S. neutral rate is increasing, courtesy of robust household balance sheets, strong capex intentions, rising inflationary pressures and a large dose of fiscal stimulus. Thus, despite the rise in interest rates, the U.S. yield curve has started to steepen anew, even as global asset markets have been suffering (Chart I-10). Fed Chairman Jerome Powell has even given his subtle acquiescence to this move. Indeed, last week he argued that the Fed's policy might still be quite accommodative as the neutral rate may be sitting well above the current level of the fed funds rate. Chart I-10The U.S. Yield Curve Is Steepening Anew
The U.S. Yield Curve Is Steepening Anew
The U.S. Yield Curve Is Steepening Anew
Third is the question of Italy. Italian yields continue to rise both in absolute terms and relative to German bunds. Some of this reflects the stress created by higher global real yields, which hurt the outlook for Italian growth and hence point toward a worsening debt load, which requires a higher risk premium in BTPs. But there is more to the widening in Italian spreads. Italy is setting its budget for next year, and is engaging in a war of words with Brussels. The Five Star Movement / Lega Nord Coalition wants to set a 2.4% of GDP deficit for 2019, much more than the previously agreed 0.8% penciled by the previous government this past spring. This is still within the 3% limit of the EU's Growth and Stability pact, but the European Commission and investors are concerned as Italy's public debt-to-GDP is already 133% - and this 2.4% deficit rests on extremely rosy growth assumptions. As a result, markets are punishing Italian bonds. This is a problem because when Italian yields rise, Italian banks suffer. Dhaval Joshi has argued in BCA's European Investment Strategy that a move in BTP yields to 4% could render the whole Italian banking system insolvent, as it would wipe out excess capital of EUR30 billion.1 Since the entire German, French, Spanish, Dutch, Austrian, Belgian, Greek, Irish and Portuguese banking systems still have low capital reserves, their combined EUR 479 billion exposure to Italy is fast becoming a Sword of Damocles. As a result, a war of words between Rome and Brussels - one that could last until December - could cause further tumult in European bank shares, and force the European Central Bank to stay on the defensive longer than it wishes to. This would hurt the euro and by symmetry, help the dollar. Bottom Line: Economic and financial market developments still support the dollar. The outperformance of U.S. growth relative to the rest of the world is likely to continue to be felt in the form of a stronger dollar in the coming months, especially as global exports remains negatively affected by China's deleveraging. Moreover, rising U.S. borrowing costs are so far having a limited impact on U.S. growth, but generating potent headwinds for activity outside the U.S. Finally, Italy is likely to remain a sore spot for Europe over the next two to three months, one that may weigh on the ECB's ability to provide any hawkish guidance this year. Risks To The View The view that the dollar can continue to rally is not without impediments. The first and most obvious one is that speculators have already aggressively bought the dollar (Chart I-11, top panel). This makes the greenback vulnerable to any unexpected improvement in global growth. Chart I-11Risks For The Dollar
Risks For The Dollar
Risks For The Dollar
The second impediment is that a temporary reprieve in the global growth slowdown could well be materializing as we speak. G10 economic surprises have regain some vigor, and the diffusion index of BCA's Global Leading Economic Indicator has been rebounding (Chart I-11, bottom two panels). The third risk is that the China Play Index we introduced 10 weeks ago is rebounding (Chart I-12). This indicator, based on AUD/JPY, Swedish industrial stocks denominated in dollars, iron ore prices, Brazilian stocks and EM high-yield bonds, is very sensitive to Chinese reflation, or at the very least to how investors expect Chinese reflation to evolve going forward. This may reflect the fact that the People's Bank of China has injected liquidity into the banking system by cutting the Reserve Requirement Ratio four times this year, or that local government borrowings have increased. Chart I-12Investors May Be Betting On Chinese Reflation
Investors May Be Betting On Chinese Reflation
Investors May Be Betting On Chinese Reflation
However, these three factors remain risks, not our base case. After all, net speculative positions in the dollar can stay elevated for extended periods, and the Chinese stimulus that is helping the China Play Index and maybe even the G10 surprise index still pales in comparison to the size of the aggregate deleveraging that is causing total social financing to weaken. Another risk to monitor is Fed Chairman Powell. The likelihood that he dials down his hawkish rhetoric on the elevated neutral fed funds rate in the coming weeks is significant. This could cause a temporary setback in Treasury yields and global rates - one that is likely to be welcomed by global risk assets but that may cause temporary indigestion for the dollar. Bottom Line: Three key risks could invalidate our thesis that the dollar strengthens this fall. They are: the large overhang of speculative longs in the greenback, a potential temporary stabilization in global growth, and markets pricing in Chinese stimulus. Additionally, Fed Chairman Powell may walk back some of his hawkish comments from last week, which would impact global bond yields and help global risk assets, but weigh on the dollar. Investment Implications Faced with this outlook, what should investors do? We continue to recommend holding a cyclically bullish dollar stance. Long DXY makes sense at this juncture, with upside toward 102 by Q1 2019, Implying a fall in EUR/USD below 1.10. However, the risks highlighted above are also non-negligible. This means that holding some hedges makes perfect sense. This summer, we recommended selling USD/CAD. As Chart I-13 illustrates, the loonie has been the best performing G10 currency - the only one that managed to eke out a gain against the greenback this summer (top panel of Chart I-13). This means that mean-reversion is not likely to be the CAD's friend going forward. It may thus not be the best instrument anymore to hedge against USD weakness. Instead, Chart I-13 proposes that the three currencies best placed to benefit from any mean reversion if the USD weakens are the SEK, the AUD, and especially the NZD. The NZD is extremely oversold now, which suggests that it could benefit greatly if the dollar were to experience any period of weakness. Moreover, the NZD has traditionally been highly levered to EM asset prices and Asian growth conditions. As a result, if the rebound in the China Play Index ends up hurting the USD, the NZD is likely to be the prime beneficiary. Chart I-13G10 Currency Returns
In Fall, Leaves Turn Red, The Dollar Turns Green
In Fall, Leaves Turn Red, The Dollar Turns Green
Moreover, the kiwi money markets are currently pricing in a 12% probability of interest rate cuts by the Reserve Bank of New Zealand over the coming four months. While a lack of inflation means that the environment is not propitious for the RBNZ to increase rates, a rate cuts seems farfetched: the Official Cash Rate remains well below the average level of growth experienced over the past three years, whether in nominal or real terms. In other words, monetary policy remains extremely accommodative, despite the fact that the output gap is closed and the unemployment rate stands below full employment (Chart I-14). Chart I-14The RBNZ Will Not Cut Rates
The RBNZ Will Not Cut Rates
The RBNZ Will Not Cut Rates
Finally, shorting EUR/JPY may well prove to be the best protection if the Fed's leadership guides bond yields lower. As Chart I-15 shows, EUR/JPY performs well when bond yield rise, which explains why this cross has managed to strengthen despite the recent weakness in EM asset prices this year. Hence, if a dollar correction is not driven by global growth converging upward toward the U.S., but instead is driven by the Fed backtracking from its recent hawkish rhetoric, then EUR/JPY will suffer considerably. Chart I-15Short EUR/JPY: A Hedge Against Falling Bond Yields
Short EUR/JPY: A Hedge Against Falling Bond Yields
Short EUR/JPY: A Hedge Against Falling Bond Yields
As a result, we recommend investors with long USD exposure hedge their bets by taking on a bit of long NZD/USD exposure and some short EUR/JPY exposure as well. Bottom Line: Since the seasonal and cyclical outlook is favorable to the greenback, it makes sense for investors to maintain a dollar-bullish bias in their portfolio. However, the tactical risks to the dollar created by a potential rebound in non-U.S. growth or a potentially dovish Fed are meaningful. As a result, some hedges should be maintained to mitigate net positive exposure to the dollar. We recommend buying NZD/USD and selling EUR/JPY in order to achieve optimal protection from these risk factors. Mathieu Savary, Vice President Foreign Exchange Strategy mathieu@bcaresearch.com 1 Please see European Investment Strategy Weekly Report, titled "Italy, Bond Vigilantes, And Bubbles", dated October 4, 2018, available at fes.bcaresearch.com Currencies U.S. Dollar Chart II-1USD Technicals 1
USD Technicals 1
USD Technicals 1
Chart II-2USD Technicals 2
USD Technicals 2
USD Technicals 2
Recent data in the U.S. has been mixed: The unemployment rate surprised positively, coming in at 3.7%. Moreover, initial jobless claims also surprised positively, coming in at 207 thousand. However, while nonfarm payrolls underperformed expectations, coming in at 134 thousand, this miss was compensated by important positive revisions to 270 thousand for August. DXY has risen by roughly 1.4% this week. Overall, we continue to be positive on the dollar, given that inflationary pressures in the U.S. will continue to put upward pressure on interest rates. Moreover, China is tightening monetary conditions, which will continue to act as a drag on global growth. This environment will benefit the green back until at least the beginning of 2019. Report Links: Policy Divergences Are Still The Name Of The Game - August 14, 2018 The Dollar And Risk Assets Are Beholden To China's Stimulus - August 3, 2018 Rhetoric Is Not Always Policy - July 27, 2018 The Euro Chart II-3EUR Technicals 1
EUR Technicals 1
EUR Technicals 1
Chart II-4EUR Technicals 2
EUR Technicals 2
EUR Technicals 2
Recent data in the euro area has been mixed: Retail sales yearly growth surprised to the upside, coming in at 1.8%. However, core inflation underperformed expectations, coming in at 0.9%. Finally, both the composite and manufacturing Markit PMI, also surprised negatively, coming in at 54.1 and 53.2 respectively. Rising U.S. yields as well as renewed concerns about Italy have lowered EUR/USD by roughly 2% this past couple of weeks. We are negative on the euro on a cyclical basis, given that euro area inflationary dynamics are tightly linked to global economic activity, which will likely be armed by China's monetary tightening. Thus, inflation, and consequently rates, will stay low in the euro area for the time being. Report Links: Will Rising Wages Cause An Imminent Change In Policy Direction In Europe And Japan? - October 5, 2018 Policy Divergences Are Still The Name Of The Game - August 14, 2018 Time To Pause And Breathe - July 6, 2018 The Yen Chart II-5JPY Technicals 1
JPY Technicals 1
JPY Technicals 1
Chart II-6JPY Technicals 2
JPY Technicals 2
JPY Technicals 2
Recent data in Japan has been positive: Machinery orders yearly growth outperformed expectations, coming in at 12.6%. Moreover, the leading economic Index also surprised to the upside, coming in at 104.4. Finally, overall household spending yearly growth also surprised to the upside, coming in at 2.8%. USD/JPY has been falling for the past week and a half. We are negative on the yen on a cyclical basis, given that YCC is likely to stay in place for the foreseeable. After all, Japanese inflation expectations remain moribund. Moreover, the expected negative fiscal shock next year will also weigh on aggregate demand. All of these factors, combined with slowing global growth will continue to widen rate differentials, which will create upside in USD/JPY. Report Links: Will Rising Wages Cause An Imminent Change In Policy Direction In Europe And Japan? - October 5, 2018 Rhetoric Is Not Always Policy - July 27, 2018 Updating Our Long-Term FX Fair Value Models - June 22, 2018 British Pound Chart II-7GBP Technicals 1
GBP Technicals 1
GBP Technicals 1
Chart II-8GBP Technicals 2
GBP Technicals 2
GBP Technicals 2
Recent data in the U.K. has been mixed: Manufacturing production yearly growth surprised to the upside, coming in at 1.3%. However, Halifax house prices yearly growth underperformed expectations, coming in at 2.5%. Finally, Markit Services PMI underperformed expectations, coming in at 53.9. GBP/USD has been flat since the middle of September. The European Union has been much more conciliatory than anticipated, causing the pound to rally. However, we will continue to watch the negotiations closely, given that very little geopolitical risk is currently priced into the pound at the moment, which means it will continue to be whipshawed with inevitable setbacks in the negotiations. We remain long GBP vol. Report Links: Updating Our Long-Term FX Fair Value Models - June 22, 2018 Inflation Is In The Price - June 15, 2018 Updating Our Intermediate Timing Models - May 18, 2018 Australian Dollar Chart II-9AUD Technicals 1
AUD Technicals 1
AUD Technicals 1
Chart II-10AUD Technicals 2
AUD Technicals 2
AUD Technicals 2
AUD/USD has fallen by roughly 2.5% over the past couple of weeks, mostly due to the spike in U.S. real yields and the fall in emerging market assets. We continue to be bearish on the Australian dollar, as the Australian economy is the most sensitive G10 currency to policy tightening in China. Moreover, the Australian economy has a very indebted household sectors, which makes it difficult for the RBA to hike rates in the current environment. Investors who wish to express this bearish view on the AUD can do so by shorting AUD/CAD, as the CAD will likely benefit from rising oil prices. Report Links: Policy Divergences Are Still The Name Of The Game - August 14, 2018 What Is Good For China Doesn't Always Help The World - June 29, 2018 Updating Our Long-Term FX Fair Value Models - June 22, 2018 New Zealand Dollar Chart II-11NZD Technicals 1
NZD Technicals 1
NZD Technicals 1
Chart II-12NZD Technicals 2
NZD Technicals 2
NZD Technicals 2
NZD/USD has fallen by nearly 3%. Overall, we are bearish the kiwi, as continued tightening by both the fed and Chinese authorities will keep putting pressure on risk assets like the NZD. Moreover, the momentum in volatility continues to be a negative sign for high yield currencies like NZD. That being said, once volatility momentum becomes negative high carry trades like NZD/CHF will prove to be attractive. Moreover, investors looking to hedge their long dollar positions should look to buy the NZD, as rate expectations in New Zealand have likely hit a bottom. Report Links: Updating Our Long-Term FX Fair Value Models - June 22, 2018 Updating Our Intermediate Timing Models - May 18, 2018 Value Strategies In FX Markets: Putting PPP To The Test - May 11, 2018 Canadian Dollar Chart II-13CAD Technicals 1
CAD Technicals 1
CAD Technicals 1
Chart II-14CAD Technicals 2
CAD Technicals 2
CAD Technicals 2
Recent data in Canada has been mixed: While the net change in employment outperformed expectations significantly, coming in at 63.3 thousand, the devil was in the detail; full time employment contracted by 17 thousand jobs. On the other hand, the participation rate also surprised to the upside, coming in at 65.4%. However, housing starts surprised negatively, coming in at 189 thousand. USD/CAD has gone up by roughly 1.2% the past 2 weeks. We are closing our short USD/CAD trade this week, as we think the tactical upside for the CAD is now limited. Investors looking to hedge their long dollar exposure should instead look to buy the kiwi. That being said we continue to be positive on the Canadian dollar against the Australian dollar, as oil will further outperform base metals. Report Links: Updating Our Long-Term FX Fair Value Models - June 22, 2018 Inflation Is In The Price - June 15, 2018 Rome Is Burning: Is It The End? - June 1, 2018 Swiss Franc Chart II-15CHF Technicals 1
CHF Technicals 1
CHF Technicals 1
Chart II-16CHF Technicals 2
CHF Technicals 2
CHF Technicals 2
Recent data in Switzerland has been negative: Headline inflation underperformed expectations, coming in at 1%. Moreover, the SVMW Purchasing manager's Index also surprised negatively, coming in at 59.7. Finally, real retail sales yearly growth also underperformed expectations, coming in at 0.3%. EUR/CHF has risen by roughly 1.7% this past two weeks. Overall, we are bearish on the franc on a long-term basis, as inflationary forces are too tepid in Switzerland for the SNB to move away from its ultra-dovish monetary policy. Moreover, the strength in the franc over the past few months will likely drive prices down, adding further fuel to the SNB's easy money campaign. Report Links: Updating Our Long-Term FX Fair Value Models - June 22, 2018 Updating Our Intermediate Timing Models - May 18, 2018 Value Strategies In FX Markets: Putting PPP To The Test - May 11, 2018 Norwegian Krone Chart II-17NOK Technicals 1
NOK Technicals 1
NOK Technicals 1
Chart II-18NOK Technicals 2
NOK Technicals 2
NOK Technicals 2
Recent data in Norway has been mixed: Headline and core inflation both outperformed expectations, coming in at 3.4% and 1.9% respectively. Moreover, manufacturing output growth also surprised to the upside, coming in at -0.1%. However, register unemployment surprised negatively, ticking up to 2.3%. USD/NOK has risen by roughly 1% the past couple of weeks, in spite of rising oil prices. We have long argued that USD/NOK is more sensitive to real rate differentials than to oil prices. Given that we expect real U.S. rates to have additional upside, we continue to be bullish on this cross. That being said, the NOK could outperform other commodity currencies like the AUD and the NZD, as the relative performance of oil in the commodity space will provide a cyclical lift to the NOK against these currencies. Report Links: Updating Our Long-Term FX Fair Value Models - June 22, 2018 Updating Our Intermediate Timing Models - May 18, 2018 Value Strategies In FX Markets: Putting PPP To The Test - May 11, 2018 Swedish Krona Chart II-19SEK Technicals 1
SEK Technicals 1
SEK Technicals 1
Chart II-20SEK Technicals 2
SEK Technicals 2
SEK Technicals 2
Recent data in Sweden has been mixed: Retail sales yearly growth outperformed expectations, coming in at 2%. Moreover, consumer confidence also surprised to the upside, coming in at 103.6. However, manufacturing PMI underperformed expectations, coming in at 55.2. USD/SEK has risen by roughly 2.7% the past couple of weeks. Overall, we are bullish on the krona on a long term basis, as monetary policy is too easy in Sweden given Sweden's current inflationary backdrop, which means that the path of least resistance for rates is up. Nevertheless, the policy tightening by Chinese authorities could continue to weigh on global growth. This means that the SEK could have some downside on a 3 to 6 month horizon. Report Links: Updating Our Long-Term FX Fair Value Models - June 22, 2018 Updating Our Intermediate Timing Models - May 18, 2018 Value Strategies In FX Markets: Putting PPP To The Test - May 11, 2018 Trades & Forecasts Forecast Summary Core Portfolio Tactical Trades Closed Trades
Highlights Asset allocation: Go long industrial commodities versus equities on a 6-month horizon. If an inflationary impulse is dominating, beaten-down industrial commodities have more upside than richly valued equities; and if a disinflationary impulse is dominating, its main casualty will be equities. Currencies: Take profits on long EUR/CNY. Maintain a broadly neutral stance to EUR, with short EUR/JPY counterbalancing long EUR/USD. Equity sectors: overweight basic materials versus the market. And within the basic materials sector, overweight basic resources versus chemicals. Chart of the WeekChina's 6-Month Credit Impulse Provides A Perfect Explanation For Commodity Inflation
China's 6-Month Credit impulse Provides A Perfect Explanation For Commodity Inflation
China's 6-Month Credit impulse Provides A Perfect Explanation For Commodity Inflation
Feature Equity markets are entering the crossfire between two opposing forces: an inflationary impulse coming from the global economy; and a disinflationary impulse as higher bond yields threaten to deflate the very rich valuations of equities and other risk-assets. As this battle plays out in the coming months a good strategy is to go long commodities versus equities. The logic is simple: if the inflationary impulse from the economy is dominating, then beaten-down industrial commodities have more upside than richly valued equities; and if the disinflationary impulse from higher bond yields is dominating, then commodities have less downside than equities, because commodities have a much weaker valuation link with bond yields. Therefore, going long industrial commodities versus equities on a 6-month horizon should be a good strategy however the battle between inflationary and disinflationary impulses plays out. Inflationary Impulse Battles Disinflationary Impulse Chart I-2 shows the credit impulse oscillations in the euro area, U.S., and China since the start of the millennium, all expressed in dollars to allow a comparison between the three major economies. It is a fascinating chart because the change in the dominant oscillation - the one with the highest amplitude - perfectly illustrates the shift in global economic power and influence from Europe and the U.S. to China. Chart I-2The Shift In Economic Power From Europe And The U.S. To China
The Shift In Economic Power From Europe And The U.S. To China
The Shift In Economic Power From Europe And The U.S. To China
Through 2000-08 the impulses in the euro area and the U.S. dominated. But during the global financial crisis that all changed: the credit stimulus from China dwarfed the responses from the western economies. Then through 2009-12 the impulse oscillations from the three major economies were briefly the same size, before China took on the undisputed mantle of dominant impulse, which it has held consistently since 2013. The world's three major economies are now all in 'up' oscillations according to their credit impulses. This means the global economy will experience an inflationary impulse for the next couple of quarters or so. However, battling the inflationary impulse is a disinflationary impulse. As the inflationary impulse pushes up bond yields, it threatens to deflate the very rich valuations of equities (and other risk-assets). Crucially, this disinflationary force is particularly vicious when bond yields are rising from ultra-low levels. We have described this dynamic exhaustively in previous reports, so we will not go into the detail here. But in a nutshell, both parts of an equity's required return - the risk-free component and the risk premium - go up together when bond yields are rising from ultra-low levels. Meaning that rising yields deflate equity valuations exponentially (Chart I-3).1 Chart I-3At Low Bond Yields The Valuation Of Equities Changes Exponentially
Go Long Commodities Versus Equities
Go Long Commodities Versus Equities
But Which Inflationary Impulse? At our recent investment conference in Toronto, the three speakers on the China panel gave three different conclusions on China: aggressively bullish, moderately bullish, and bearish! The aggressive bull pointed out that the 3-month credit impulse has gone vertical (Chart I-4); the moderate bull pointed out that the 6-month credit impulse appears to be turning up (Chart I-5); while the bearish argument was that the level of the 12-month credit and fiscal impulse remains depressed. Chart I-4The 3-Month Impulse Is Up Sharply...
The 3-Month Impulse Is Up Sharply...
The 3-Month Impulse Is Up Sharply...
Chart I-5But The 6-Month Impulse Is Just Turning
But The 6-Month Impulse Is Just Turning
But The 6-Month Impulse Is Just Turning
So which narrative should we use? The answer is the one that provides the best explanatory power for the cycles that we actually observe in the economic and financial market data. As we described in our Special Report The Cobweb Theory And Market Cycles, the theory and evidence powerfully identifies the 6-month credit impulse as the one with the best explanatory power for the oscillations that we actually observe in the economy and markets - because the 6-month period aligns most closely with the lag between credit demand and credit supply.2 In any case, as we use the 6-month impulse to powerful effect in Europe, consistency demands that we must use the 6-month impulses in U.S. and China too. For the sceptics, the Chart of the Week should finally obliterate any lingering doubts. China's 6-month impulse gives a spookily perfect explanation for the industrial commodity inflation cycle. The important takeaway right now is that if the 6-month impulse is turning up, so will industrial commodity inflation. What Does All Of This Mean For Investors? This brings us to our central message. As we have just seen, an up-oscillation in 6-month impulses, especially in China, will lift industrial commodity inflation. But it will likely have a much smaller influence on developed market equities which, in these circumstances, will be under the strong constraining spell of higher bond yields. On this basis the asset allocation recommendation is to go long industrial commodities versus equities on a 6-month horizon (Chart I-6). Chart I-6Go Long Commodities Vs. Equities
Go Long Commodities Vs. Equities
Go Long Commodities Vs. Equities
Interestingly, technical analysis also supports this recommendation over the next three months or so. Our tried and tested measure of excessive trending and groupthink suggests that the recent underperformance of industrial commodities relative to developed market equities is extreme and at a point which indicates a countertrend move, or at least a trend exhaustion (Chart I-7). Chart I-7The Underperformance Of Industrial Commodities Is Technically Stretched
The Underperformance Of Industrial Commodities Is Technically Stretched
The Underperformance Of Industrial Commodities Is Technically Stretched
For currencies, the foregoing analysis and charts means it is time to take profits in our long position in the euro versus the Chinese yuan. This leaves us with a broadly neutral exposure to the euro, with a short position versus the yen counterbalancing a long position versus the dollar. As for European equities, many years ago they were a pure play on events in Europe. Today, this might still be true for European 'tail-events' such as the euro sovereign debt crisis, or a potential 'no deal' Brexit. However, for the most part, European equity markets are tightly integrated with global equity markets - at least in direction if not level. Given that industrial commodity inflation takes its cue from the 6-month credit impulse - especially in China - it is hardly surprising that the European basic materials sector follows exactly the same cycle, both in absolute terms (Chart I-8) and relative to the broader equity market (Chart I-9). Therefore the equity sector recommendation is to overweight basic materials versus the market. Chart I-8China's 6-Month Credit Impulse Drives Europe's Basic Material Equities In Absolute Terms...
China's 6-Month Credit Impulse Drives Europe's Basic Material Equities In Absolute Terms...
China's 6-Month Credit Impulse Drives Europe's Basic Material Equities In Absolute Terms...
Chart I-9...And In Relative Terms
...And In Relative Terms
...And In Relative Terms
Interestingly, there is also a play within the basic materials sector. The basic resources sector which represents the miners and extractors of raw materials should fare better than the chemicals sector which uses these raw materials as an input (Chart I-10). Hence, overweight basic resources versus chemicals. Chart I-10Overweight Basic Resources Vs. Chemicals
Overweight Basic Resources Vs. Chemicals
Overweight Basic Resources Vs. Chemicals
Readers may argue that most of the foregoing charts illustrate the same cycle. But that's precisely the point! Never forget that financial markets follow the Pareto principle: the most important 20 percent of analysis explains 80 percent of the moves across all asset classes across all geographies across all times. The key to successful investing is to find the most important 20 percent of analysis. Dhaval Joshi, Senior Vice President Chief European Investment Strategist dhaval@bcaresearch.com 1 Please see the European Investment Strategy Weekly Reports 'Trapped: Have Equities Trapped Bonds?' September 13, 2018 and 'The Rule Of 4 For Equities And Bonds' August 2, 2018 available at eis.bcaresearch.com 2 Please see the European Investment Strategy Special Report 'The Cobweb Theory And Market Cycles' January 11, 2018 available at eis.bcaresearch.com Fractal Trading Model* It was a busy week for our trades. Long basic resources versus chemicals achieved its profit target, but short U.S. telecom versus U.S. autos hit its stop-loss. Meanwhile, short trade-weighted dollar reached the end of its 65 day holding period broadly flat. All three trades are now closed. In line with the main body of the report, this week's trade recommendation is to go long industrial commodities (represented by the CRB industrials index) versus equities (represented by the MSCI World Index in USD). The profit target is 2% with a symmetrical stop-loss. For any investment, excessive trend following and groupthink can reach a natural point of instability, at which point the established trend is highly likely to break down with or without an external catalyst. An early warning sign is the investment's fractal dimension approaching its natural lower bound. Encouragingly, this trigger has consistently identified countertrend moves of various magnitudes across all asset classes. Chart 11
Long CRB Industrials Vs. MSCI World
Long CRB Industrials Vs. MSCI World
The post-June 9, 2016 fractal trading model rules are: When the fractal dimension approaches the lower limit after an investment has been in an established trend it is a potential trigger for a liquidity-triggered trend reversal. Therefore, open a countertrend position. The profit target is a one-third reversal of the preceding 13-week move. Apply a symmetrical stop-loss. Close the position at the profit target or stop-loss. Otherwise close the position after 13 weeks. Use the position size multiple to control risk. The position size will be smaller for more risky positions. * For more details please see the European Investment Strategy Special Report "Fractals, Liquidity & A Trading Model," dated December 11, 2014, available at eis.bcaresearch.com Fractal Trading Model Recommendations Equities Bond & Interest Rates Currency & Other Positions Closed Fractal Trades Trades Closed Trades Asset Performance Currency & Bond Equity Sector Country Equity Indicators Bond Yields Chart II-1Indicators To Watch - Bond Yields
Indicators To Watch - Bond Yields
Indicators To Watch - Bond Yields
Chart II-2Indicators To Watch - Bond Yields
Indicators To Watch - Bond Yields
Indicators To Watch - Bond Yields
Chart II-3Indicators To Watch - Bond Yields
Indicators To Watch - Bond Yields
Indicators To Watch - Bond Yields
Chart II-4Indicators To Watch - Bond Yields
Indicators To Watch - Bond Yields
Indicators To Watch - Bond Yields
Interest Rate Chart II-5Indicators To Watch - Interest Rate Expectations
Indicators To Watch - Interest Rate Expectations
Indicators To Watch - Interest Rate Expectations
Chart II-6Indicators To Watch - Interest Rate Expectations
Indicators To Watch - Interest Rate Expectations
Indicators To Watch - Interest Rate Expectations
Chart II-7Indicators To Watch - Interest Rate Expectations
Indicators To Watch - Interest Rate Expectations
Indicators To Watch - Interest Rate Expectations
Chart II-8Indicators To Watch - Interest Rate Expectations
Indicators To Watch - Interest Rate Expectations
Indicators To Watch - Interest Rate Expectations