Europe

Highlights 2020 Model Bond Portfolio Positioning: Translating our 2020 global fixed income Key Views into recommended positioning within our model bond portfolio comes up with the following conclusions: target a moderately aggressive level of overall portfolio risk, with below-benchmark duration exposure alongside meaningful overweight allocations to global corporate credit. Country Allocations: The cyclical improvement in global growth heralded by leading indicators should put upward pressure on overall global bond yields in 2020. With central banks likely to maintain accommodative policy settings to try and boost depressed inflation expectations, government bond allocations should reflect each country’s “beta” to global yield changes. That means favoring lower-beta countries (Japan, Germany, Spain, Australia, the UK) over higher-beta countries (the US, Canada, Italy). Spread Product: Better global growth, combined with stimulative monetary conditions, will provide an ideal backdrop for growth-sensitive spread product like corporate bonds to outperform government debt this year. We are maintaining an overweight stance on US high-yield credit, while increasing overweights to euro area corporates (both investment grade and high-yield). With the US dollar likely to soften as 2020 evolves, emerging market hard currency debt, both sovereign and corporate, is poised to outperform – we are upgrading both to overweight. Feature Welcome to our first report of the New Year. Just before our holiday break last month, we published our 2020 “Key Views” report, outlining the thematic implications of the BCA 2020 Outlook for global bond markets.1 In this follow-up report, we turn those themes into specific investment recommendations for the next twelve months. We will also make any necessary changes to the allocations in the Global Fixed Income Strategy (GFIS) model bond portfolio to reflect our themes. The main takeaway is that 2020 will be a much different year than 2019, when virtually all global fixed income classes delivered solid absolute returns. The unusual combination of rapidly falling government bond yields and stable-to-narrowing spreads on the majority of credit products – especially in developed market corporate debt – will not be repeated in 2020. Absolute returns from fixed income will be far lower than in 2019, forcing bond investors to focus on relative returns across maturities, countries and credit sectors to generate outperformance. With global monetary policy to remain stimulative, alongside improved global growth, market volatility should remain subdued over the next 6-12 months. Being more aggressive on overall levels of portfolio risk, particularly through higher allocations to markets like high-yield corporates and emerging market (EM) credit, is a solid strategy in a world of low risk-free interest rates and tame volatility. Top-Down Bond Market Implications Of Our Key Views As a reminder, the main fixed income investment themes from our 2020 Key Views report were the following: Global growth will rebound in 2020, led by the US and China, putting upward pressure on global bond yields. Central banks will stay dovish until policy reflation has clearly turned into inflation, limiting how high bond yields can climb in 2020 but sowing the seeds for a far more bond-bearish backdrop in 2021. Accommodative monetary policy and faster growth will delay the peak in the aging global credit cycle. Returns on global fixed income will be far lower in 2020 than in 2019, given rich valuation starting points. Country and sector selection will be more important in driving fixed income outperformance. We now present the specific fixed income investment recommendations that derive from those themes, described along the following lines: overall portfolio risk, overall duration exposure, country allocations within government bonds, yield curve allocations within countries, and corporate credit allocations by country and credit rating. Overall Portfolio Risk: MODERATELY AGGRESSIVE Global growth is in the process of bottoming out after the sharp manufacturing-driven slowdown in 2019. The cumulative lagged impact of monetary easing by central banks last year, led by the US Federal Reserve cutting rates and the European Central Bank (ECB) restarting its Asset Purchase Program, is a main reason why growth is set to rebound. Reduced trade uncertainty between the US and China should augment the impact of easier monetary policy through improved business confidence. Our global leading economic indicator (LEI), which has increased for nine consecutive months, is already heralding this improvement in the global economy. Our global LEI diffusion index – which measures the number of countries with a rising LEI and is itself a leading indicator of the LEI – suggests more gains ahead as 2020 progresses. The LEI diffusion index is also a reliable leading indicator of bond market volatility, with the former signaling that the latter will remain quiescent in 2020 (Chart 1). At the same time, cross-asset correlations across fixed income sectors should drift a bit higher alongside a more broad-based upturn in global economic growth and expanding monetary liquidity via central bank asset purchases (Chart 2). This pickup in correlations suggests that there is scope for markets that lagged the 2019 global credit rally, like EM USD-denominated sovereign debt, to make up for that underperformance in 2020. Chart 1Improving Global Growth Will Keep Volatility Subdued
Improving Global Growth Will Keep Volatility Subdued
Improving Global Growth Will Keep Volatility Subdued
Chart 2Cross-Asset Correlations Should Increase In 2020
Cross-Asset Correlations Should Increase In 2020
Cross-Asset Correlations Should Increase In 2020
The combination of better growth, stable volatility – but with only a mild rise in correlations – is a good backdrop to take a somewhat more aggressive investment stance in fixed income portfolios in 2020. The combination of better growth, stable volatility – but with only a mild rise in correlations – is a good backdrop to take a somewhat more aggressive investment stance in fixed income portfolios in 2020. We prefer to take that additional risk by adding to our recommended overweight to global credit, rather than further reducing our below-benchmark overall duration exposure. Overall Portfolio Duration Exposure: BELOW BENCHMARK Chart 3Global Bond Yields Poised To Move Higher
Global Bond Yields Poised To Move Higher
Global Bond Yields Poised To Move Higher
The improvement in global growth that we are anticipating in 2020 would normally be expected to put upward pressure on the real component of global government bond yields (Chart 3, top panel). This would initially manifest itself through asset allocation shifts out of bonds into equities and, later, through expectations of rate hikes and tighter monetary policy. However, with all major developed market central banks now expressing a desire to keep policy as easy as possible to try and boost inflation expectations, the cyclical move higher in real yields is likely to be more muted in 2020. However, given our expectation that the US dollar is likely to see a moderate decline, as global capital flows move into more growth-sensitive markets in EM and Europe, there is scope for global bond yields to rise via higher inflation expectations – especially with global oil prices likely to move a bit higher, as our commodity strategists expect (bottom two panels). We recommend only a moderate below-benchmark overall duration exposure in global fixed income portfolios in 2020, given that real yields will likely stay relatively muted. Investors should maintain core allocations to inflation-linked bonds, however, to benefit from the pickup in inflation expectations that is likely to occur this year. We recommend only a moderate below-benchmark overall duration exposure in global fixed income portfolios in 2020, given that real yields will likely stay relatively muted. Investors should maintain core allocations to inflation-linked bonds, however, to benefit from the pickup in inflation expectations that is likely to occur this year. Government Bond Country Allocation: UNDERWEIGHT HIGHER-BETA MARKETS, OVERWEIGHT LOWER-BETA MARKETS At the country level, we would typically let our expectations of monetary policy changes guide our recommended allocations. Yet in 2020, we see very little potential for any change in monetary policy outside of Australia (where rate cuts can happen early in the year) and Canada (where a rate hike may be possible later in the year). Thus, we think that a more useful framework for making fixed income country allocation decisions in 2020 is to rely on the “yield betas” of each country to changes in the overall level of global bond yields. Chart 4 shows the three-year trailing yield betas for 10-year government bonds of the major developed markets. Changes in the 10-year yields are compared to the yield of the 7-10 year maturity bucket of the Bloomberg Barclays Global Treasury Index (as a proxy for the unobservable “global bond yield”). On that basis, the higher-beta markets are the US, Canada and Italy, while the lower-beta markets are Japan, Germany, France, Spain, Australia and the UK. Thus, we want to maintain underweight positions in the former group and overweight positions in the latter group. At the moment, we already have most of those tilts within our model bond portfolio, with two exceptions: we are currently neutral (benchmark index weight) in the UK and Canada. For the UK, Brexit uncertainty has made it difficult to take a strong view on the direction of Gilt yields - a problem now compounded further with Andrew Bailey set to take over from Mark Carney as the new Governor of the Bank of England. Staying neutral, for now, still seems like the best strategy until all the policy uncertainties are fully resolved. Canadian bond yields are more likely to maintain their “higher-beta” status as global yields rise, as we discussed in a recent report.2 Thus, this week, we move our recommended allocation for Canadian government bonds to underweight from neutral. For Canada, the growth and inflation data continue to print strong enough to keep the Bank of Canada on a relatively more hawkish path than the other developed market central banks. This suggests that Canadian bond yields are more likely to maintain their “higher-beta” status as global yields rise, as we discussed in a recent report.2 Thus, this week, we move our recommended allocation for Canadian government bonds to underweight from neutral. Applying Our Global Golden Rule To Government Bond Allocations In September 2018, we published a Special Report introducing a government bond return forecasting methodology called the “Global Golden Rule.”3 This is an extension of a framework introduced by our sister service, US Bond Strategy, that links US Treasury returns (versus cash) to changes in the fed funds rate not already discounted in the US Overnight Index Swap (OIS) curve. That relationship also holds in other developed market countries, where there is a clear correlation between the level of bond yields and our 12-month discounters, which measure the change in policy rates over the next year priced into OIS curves (Chart 5). Chart 4Favor Lower-Beta Government Bond Markets In 2020
Favor Lower-Beta Government Bond Markets In 2020
Favor Lower-Beta Government Bond Markets In 2020
In Table 1, we show the expected returns generated by the Global Golden Rule (shown hedged into US dollars) for the countries in our model bond portfolio universe, based on monetary policy scenarios that we deem to be most plausible for 2020. Chart 5Monetary Policy Expectations Will Remain Critical For Bond Yields
Monetary Policy Expectations Will Remain Critical For Bond Yields
Monetary Policy Expectations Will Remain Critical For Bond Yields
In Table 2, we show the returns on a duration-adjusted basis (expected total return divided by duration). We then rank the return scenarios for overall country indices, aggregating the returns of the individual yield curve maturity buckets shown in those two tables, in Table 3. Table 1Global Golden Rule Forecasts For 2020
Our Model Bond Portfolio Strategy For 2020: Selectively Aggressive
Our Model Bond Portfolio Strategy For 2020: Selectively Aggressive
The results in Table 1 show that expected returns are still expected to be positive across most countries, although this is largely due to the gains from hedging into higher-yielding US dollars. The duration-adjusted returns shown in Table 2 look most attractive at the front-end of yield curves across all the countries. This is somewhat consistent with our view, discussed in the 2020 Key Views report, that investors should expect some “bear-steepening” of global yield curves over the course of this year as inflation expectations drift higher (Chart 6). Table 2Global Golden Rule Duration-Adjusted Forecasts For 2020
Our Model Bond Portfolio Strategy For 2020: Selectively Aggressive
Our Model Bond Portfolio Strategy For 2020: Selectively Aggressive
Chart 6Expect A Mild Reflationary Bear Steepening Of Global Yield Curves
Expect A Mild Reflationary Bear Steepening Of Global Yield Curves
Expect A Mild Reflationary Bear Steepening Of Global Yield Curves
Table 3Ranking The 2020 Return Scenarios
Our Model Bond Portfolio Strategy For 2020: Selectively Aggressive
Our Model Bond Portfolio Strategy For 2020: Selectively Aggressive
The results in Table 3 show that the best expected returns would come in rate cutting scenarios – an unsurprising outcome given that there is very little change in policy rates currently discounted in OIS curves in all countries in our model bond portfolio universe. We see rates more likely to remain stable across all countries, however, making the “rates flat” scenarios in the middle of Table 3 more likely in 2020. After our downgrade of Canada this week, our recommended country allocations now reflect both yield betas and the results of our Global Golden Rule. Spread Product Allocation: OVERWEIGHT GLOBAL CORPORATES VERSUS GOVERNMENT BONDS, IN THE US, EURO AREA AND EM Chart 7Stay Overweight US High-Yield
Stay Overweight US High-Yield
Stay Overweight US High-Yield
Turning to credit markets, the shift of global central banks to a more accommodative stance – with global growth improving – has opened a window for another year of outperformance versus sovereign bonds in 2020. With market volatility likely to remain low, as discussed earlier, there is a strong case to increase credit allocations relative to government debt as 2020 begins. Turning to credit markets, the shift of global central banks to a more accommodative stance – with global growth improving – has opened a window for another year of outperformance versus sovereign bonds in 2020. We already have a recommended overweight allocation to US high-yield corporate debt within our model bond portfolio. As we discussed in a recent report, the conditions that would lead us to become more cautious on US junk bonds – deteriorating corporate health, restrictive Fed policy and tightening bank lending standards – are currently not in place (Chart 7).4 If US economic growth starts to rebound in the first half of 2020, as we expect, then the case for US junk bond outperformance is even stronger. We are maintaining only a neutral allocation to US investment grade corporates, however, but this is part of a relative value view versus US Agency mortgage backed securities, which look more attractive on a volatility-adjusted basis.5 We are comfortable with our US credit views, but we are making the following changes this week to raise the credit allocation in our model bond portfolio: Upgrade EM USD-denominated sovereign and corporate debt to overweight. The two conditions that typically must be in place before EM hard currency debt can outperform – a softer US dollar and improving global growth – are now both in place. The two conditions that typically must be in place before EM hard currency debt can outperform – a softer US dollar and improving global growth – are now both in place (Chart 8). The momentum in the US dollar has clearly rolled over and even in level terms, the trade-weighted dollar is peaking. Add in the improvement in both our global LEI and the global manufacturing PMI (and the China PMI, most importantly) and the case for upgrading EM hard currency debt for 2020 is a strong one. Increase the size of overweights to euro area investment grade and high-yield corporate debt. We already have a modest overweight stance on euro area corporate bonds in our model bond portfolio, based on our expectations that the ECB will maintain a highly-accommodative stance – which could include buying more corporate debt in its Asset Purchase Program. Yet with an increasing body of evidence highlighting that the sharp downturn in European growth seen in 2019 is bottoming out, the argument for raising euro area corporate bond allocations for this year is compelling. This is especially true for euro area high-yield, where the backdrop looks even more constructive (Chart 9) compared to US junk bonds using the same metrics described above – corporate health (not deteriorating), monetary policy (not restrictive) and lending standards (not tightening). Chart 8Upgrade EM Credit To Overweight
Upgrade EM Credit To Overweight
Upgrade EM Credit To Overweight
Chart 9Increase Overweights To European Credit
Increase Overweights To European Credit
Increase Overweights To European Credit
Summing It All Up: Our Model Bond Portfolio Adjustments To Begin 2019 The outlook described in our 2020 Key Views report, and in this week’s report, lead us to make several adjustments to our model bond portfolio weightings seen in the table on Pages 15 and 16. The results of those changes are the following: Duration: We are maintaining an overall portfolio duration of 6.5 years, which is 0.5 years below that of our custom benchmark portfolio index (Chart 10). Credit Allocation: We are increasing the allocation to EM USD-denominated debt, funded by reducing exposure to US Treasuries. We are also increasing the size of the overweight positions in euro area investment grade and high-yield corporate debt, funded by cutting allocations to German and French government bonds. The net effect of these changes is to increase our total spread product weighting to 57% of the portfolio (Chart 11), which represents an overweight tilt versus the benchmark of +15% (versus a +8% overweight prior to this week’s changes). Chart 10Stay Below-Benchmark On Duration Exposure
Stay Below-Benchmark On Duration Exposure
Stay Below-Benchmark On Duration Exposure
Chart 11A Larger Recommended Allocation To Spread Product For 2020
Our Model Bond Portfolio Strategy For 2020: Selectively Aggressive
Our Model Bond Portfolio Strategy For 2020: Selectively Aggressive
Country Allocation: We are cutting the Canadian government bond allocation to underweight, while making additional modest adjustments to yield curve positioning in the US, Japan, and the UK to reflect the output from our Global Golden Rule. The net result of these changes, combined with the increased allocation to corporate bonds, is to boost the overall portfolio yield to 3%, which represents a positive carry of +43bps versus our benchmark index (Chart 12). Chart 12Greater Portfolio Yield To Begin 2020
Greater Portfolio Yield To Begin 2020
Greater Portfolio Yield To Begin 2020
Chart 13Move To A Moderately Aggressive Level Of Portfolio Risk
Move To A Moderately Aggressive Level Of Portfolio Risk
Move To A Moderately Aggressive Level Of Portfolio Risk
Overall Portfolio Risk: All of the above changes represent an increase in the usage of the “risk budget” of our model bond portfolio, which is now running a tracking error (or excess volatility versus that of the benchmark) of 73bps (Chart 13). This is higher than the 58bps prior to this week’s changes, but is still below the maximum allowable tracking error of 100bps that we have imposed on the model portfolio since its inception. This is consistent with our view that investors should maintain a “moderately aggressive” level of risk in fixed income portfolios in 2020. Robert Robis, CFA Chief Fixed Income Strategist rrobis@bcaresearch.com Footnotes 1 Please see BCA Global Fixed Income Strategy Weekly Report, “2020 Key Views: Delay Of Reckoning”, dated December 12th 2019, available at gfis.bcarsearch.com. 2 Please see BCA Research Global Fixed Income Strategy Weekly Report, “How Sweet It Is”, dated November 6, 2019, available at gfis.bcaresearch.com. 3 Please see BCA Research Global Fixed Income Strategy Special Report, “The Global Golden Rule Of Bond Investing”, dated September 25th 2018, available at gfis.bcaresearch.com. 4 Please see BCA Research Global Fixed Income Strategy Weekly Report, “The Lowdown On Low-Rated High-Yield”, dated November 27, 2019, available at gfis.bcaresearch.com. 5 Please see BCA Research Global Fixed Income Strategy Weekly Report, “Big Mo(mentum) Is Turning Positive”, dated October 29, 2019, available at gfis.bcaresearch.com. Recommendations The GFIS Recommended Portfolio Vs. The Custom Benchmark Index
Our Model Bond Portfolio Strategy For 2020: Selectively Aggressive
Our Model Bond Portfolio Strategy For 2020: Selectively Aggressive
Duration Regional Allocation Spread Product Tactical Trades Yields & Returns Global Bond Yields Historical Returns
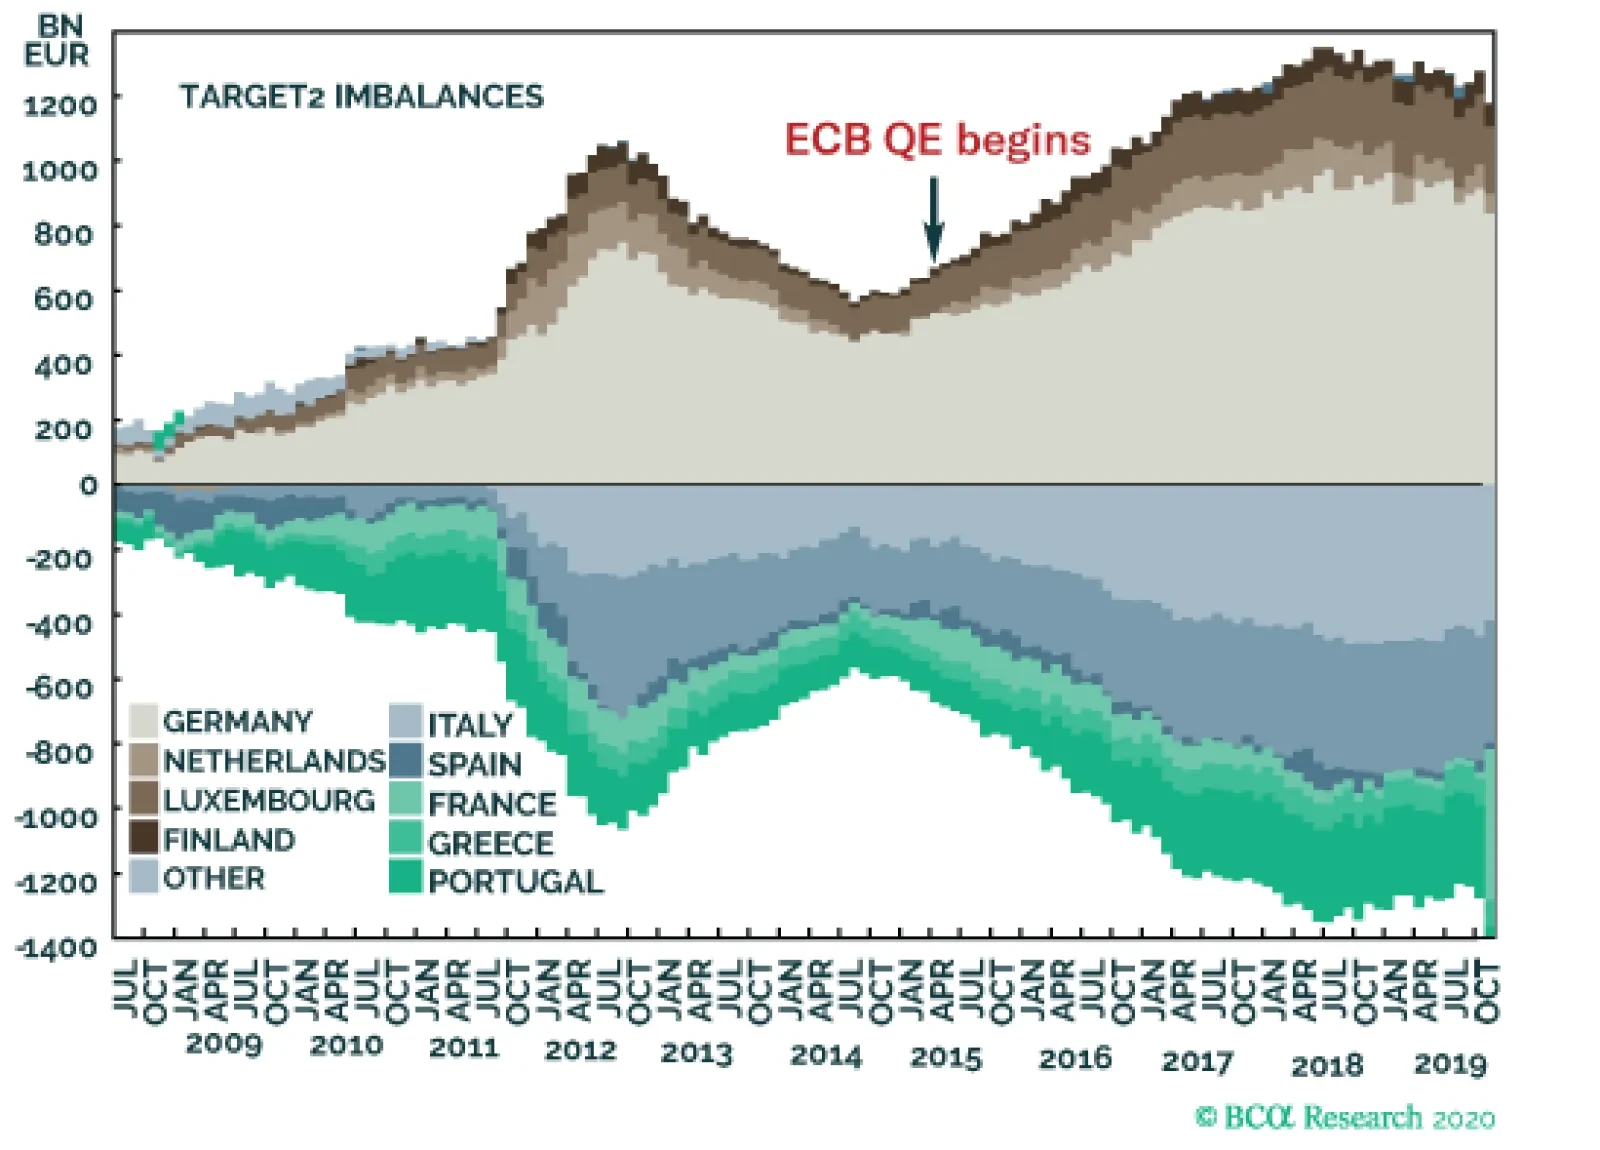
A force holding the European nucleus together has strengthened. In 2010, the Target2 banking imbalance stood at €0.3 trillion; in 2020, it stands close to €1.5 trillion. In simple terms, this means Germany’s exposure to ‘Italian euro’ assets has surged via…
Feature Recommended Allocation
Monthly Portfolio Update: Counting The Milestones
Monthly Portfolio Update: Counting The Milestones
Since BCA published its 2020 Outlook,1 and the December GAA Monthly Portfolio Update,2 nothing has happened to make us fundamentally change our views. We see the global manufacturing cycle rebounding over the coming quarters, but major central banks remaining dovish. This combination of accelerating growth and easy monetary policy should be positive for risk assets. We accordingly continue to recommend an overweight on equities versus bonds, prefer the more cyclical euro zone and EM equity markets over the US, and selectively like credit (particularly the riskier end of the US junk bond universe). In the 2020 Outlook, we laid out a series of milestones that would indicate how our scenario is playing out: whether we need to reconsider it, or whether we should be adding further to risk (Table 1). Here is how those milestones are progressing. Table 1Milestones For The 2020 Outlook
Monthly Portfolio Update: Counting The Milestones
Monthly Portfolio Update: Counting The Milestones
Chinese growth. Total Social Financing picked up in November (CNY1.75 trillion versus CNY619 billion the previous month) and the most recent hard data (notably retail sales and industrial production) showed improvement. But the momentum of credit creation and activity generally remain weak (Chart 1). We expect that Chinese growth will begin to accelerate in early 2020, due to the lagged effect of monetary stimulus in the first half of last year, and easier fiscal policy. Moreover, December’s annual Central Economic Work Conference pointed to greater government emphasis on growth stability.3 The clampdown on shadow banking also seems to be easing (Chart 2). However, we need to see further signs of Chinese growth accelerating before, for example, we become more bullish on Emerging Markets and commodities. Chart 1Chinese Credit And Activity Remain Weak
Chinese Credit And Activity Remain Weak
Chinese Credit And Activity Remain Weak
Chart 2Clampdown On Shadow Banking Easing?
Clampdown On Shadow Banking Easing?
Clampdown On Shadow Banking Easing?
Trade war. The last-minute agreement to cancel the December 15 rise in US tariffs on Chinese imports represents the “ceasefire” we expected, rather than “phase one” of a more profound agreement. It is still unclear whether previous tariffs will be rolled back (Chart 3). China’s supposed promise to increase imports of US agricultural products from $10 billion a year to $40 billion-$50 billion seems unrealistic. Progress on more fundamental topics such as China’s subsidies for state-owned companies seems far off. For now, President Trump has done enough to minimize the negative impact on the US economy in an election year. But there remains a possibility that trade war reemerges as a risk during 2020. Chart 3How Far The Rollback?
How Far The Rollback?
How Far The Rollback?
Progress against these milestones suggests that our current asset allocation recommendation structure – moderately risk-on, but with hedges against downside risk – is appropriate for now. Global growth. Data confirming the rebound in the manufacturing cycle remain mixed. Economic surprises have generally been positive in the euro zone, but have slipped in the US and Japan, and remain soft in the Emerging Markets (Chart 4). In Germany, the manufacturing PMI slipped back to 43.7 in December, but the Ifo and ZEW surveys both rebounded (Chart 5). There is, however, still little sign that the weakness in manufacturing is spilling over into consumption and services. In Germany, unemployment remains at a record low and wages are strong. In the US, wage growth continues to trend up, and there is no indication in the weekly initial claims data that companies are starting to lay off workers at more than the seasonally normal pace (Chart 6). Market indicators of the cycle are also showing some positive signs. Among commodities, the price of copper – the most cyclical metal – has begun to rise. Chinese cyclical stocks are outperforming defensives. But the US dollar has not yet showed any significant depreciation (Chart 7). Chart 4Economic Surprises Mixed
Economic Surprises Mixed
Economic Surprises Mixed
Chart 5Germany Showing Signs Of Bottoming
Germany Showing Signs Of Bottoming
Germany Showing Signs Of Bottoming
Chart 6No Problems In The Labor Market
No Signs Of Weakening Labor Market No Problems In The Labor Market
No Signs Of Weakening Labor Market No Problems In The Labor Market
Chart 7Some Positive Signs From The Markets
Some Positive Signs From The Markets
Some Positive Signs From The Markets
US politics. President Trump’s approval rating has picked up slightly – we warned that its slipping might cause him to get aggressive on trade or foreign policy (Chart 8). Markets might worry at the possibility of “President Warren” given her focus on increased regulation of industries such as finance, energy, and technology. But she has fallen a little in the polls. Even in liberal California (where the primary will be unusually early next year – March 3), she is only level with Biden and Sanders in opinion polls. Our geopolitical strategists see US politics as one of the key geopolitical risks this year,4 but the risk seems subdued for now. Chart 8Trump’s Approval Rating Stable To Rising
Monthly Portfolio Update: Counting The Milestones
Monthly Portfolio Update: Counting The Milestones
Fed tightening. Expansions usually end when inflation rises, either causing the Fed to raise rates to choke it off, or with the Fed ignoring the inflation and allowing debt and asset bubbles to form. Any signs, therefore, that inflation, or inflation expectations, are rising would signal that we are truly in the “end game”. For now, there are no such signs. US inflation is likely to soften over the next six months, as a result of the economic slowdown and strong dollar. And TIPS breakevens imply the market believes the Fed will miss its inflation target by an average of 80-90 BPs a year over the next decade (Chart 9). The Fed is likely to sound very dovish over the coming year. The review of its monetary policy framework, probably to be announced in July, may result in some sort of “catch-up” policy: under this, if inflation undershoots the Fed’s target, the target automatically rises the following year.5 Its efforts to support the repo market, including short-term Treasury securities purchases of $60 billion a month, will increase the Fed’s balance-sheet, and represent a “mini-QE” (Chart 10). The Fed is likely to be reluctant to turn more hawkish ahead of the presidential election. These dovish moves – and continued accommodative policies from the ECB and Bank of Japan – mean that monetary policy will be supportive for risk assets throughout 2020. Chart 9Inflation Remains Subdued
Inflation Expectations Driven By Oil Inflation Remains Subdued
Inflation Expectations Driven By Oil Inflation Remains Subdued
These milestones suggest, therefore, that our current asset allocation recommendation structure – moderately risk-on, but with hedges (long cash and gold) against downside risk – is appropriate for now. Chart 10A "Mini-QE"?
A Mini-"QE"?
A Mini-"QE"?
Equities: We shifted last month to an underweight on US equities, with an overweight on the euro zone, and neutral on Emerging Markets. The US tends to underperform during upswings in the global manufacturing cycle (Chart 11). Europe looks attractive because of its heavy weighting in sectors we like such as Financials, Autos and Capital Goods. Europe’s returns will also be boosted by the appreciation in the euro and pound that we expect (our equity recommendations assume no currency hedging). For EM, we would turn more positive if we saw a clear pickup in Chinese credit and economic growth. Chart 11US Underperforms When Growth Picks Up
US Underperforms When Growth Picks
US Underperforms When Growth Picks
Chart 12Fed Won't Cut As The Market Expects
Fed Won't Cut As The Market Expects
Fed Won't Cut As The Market Expects
Fixed Income: Our positive view on global growth implies that long-term rates will rise. We see the US Treasury 10-year yield reaching 2.5% by mid-2020. The market still expects the Fed to cut rates once over the next 12 months. If it stays on hold, as we expect, that slight hawkish surprise would be compatible with a moderate rise in rates (Chart 12). Core euro zone rates might rise by a little less, perhaps by 30-40 BPs, and Japanese government bond yields by 10-15 BPs. We, therefore, continue to recommend a small underweight on duration and an overweight on TIPS which look particularly cheaply valued. Within credit, our preferences are for European investment grade (not as expensive as in the US, and with the ECB buying corporate debt again) and the lower end of the US junk-bond universe (since CCC-rated bonds missed out on 2019’s rally). In a rebounding global economy, the US dollar should depreciate, particularly since it looks somewhat over-valued, and with speculative positions long the dollar. Currencies: In a rebounding global economy, the US dollar should depreciate, particularly since it looks somewhat over-valued (Chart 13), and with speculative positions long the dollar (Chart 14). But its performance is likely to vary depending on the currency pair. Our FX strategists expect the dollar to weaken to 1.18 against the euro and 1.40 against the pound over the next 12 months, and even more against currencies such as the NOK, SEK, and AUD.6 But the dollar is likely to strengthen against the yen (an even more counter-cyclical currency) and against currencies in EM, where central banks will continue to cut rates and inject liquidity aggressively to support their economies. Chart 13Dollar Looks Expensive...
Dollar Looks Expensive...
Dollar Looks Expensive...
Chart 14...And Speculators Are Long
Monthly Portfolio Update: Counting The Milestones
Monthly Portfolio Update: Counting The Milestones
Commodities: Supply in the oil market remains tight, with OPEC deepening its production cuts to 1.7 million barrels/day. The crude oil price was held down in 2019 by weakening demand, which should recover along with the cycle in 2020 (Chart 15). Our energy strategists expect Brent to average $67 a barrel in 2020 (compared to $66 now), with WTI $4 lower. Metal prices could rise in 2020 as Chinese growth recovers and the US dollar depreciates – the two most important factors that drive them (Chart 16). Given the uncertainty over both, we remain neutral for now, but would turn more positive (including on commodity-related assets, such as Australian or EM equities) if we see clear signs of their moving in the right direction. We see gold as a good downside hedge in a world of ultra-low interest rates, especially since central banks may allow inflation to overshoot over the coming years. Chart 15Supply/Demand Balance Points To Higher Oil Price
Markets Will Tighten In 2020 Supply/Demand Balance Points To Higher Oil Price
Markets Will Tighten In 2020 Supply/Demand Balance Points To Higher Oil Price
Chart 16Metals Are Driven By The Dollar And China
Metals Are Driven By The Dollar And China
Metals Are Driven By The Dollar And China
Garry Evans, Senior Vice President Chief Global Asset Allocation Strategist garry@bcaresearch.com Footnotes 1 Please see "Outlook 2020: Heading Into The End Game," dated 22 November 2019, available at bca.bcaresearch.com. 2 Please see "GAA Monthly Portfolio Update: How To Position For The End Game," dated 2 December 2019, available at gaa.bcaresearch.com. 3 Please see China Investment Strategy Weekly Report, "A Year-End Tactical Upgrade," dated 18 December 2019, available at cis.bcaresearch.com 4 Please see Geopolitical Strategy "Strategic Outlook: 2020 Key Views: The Anarchic Society," dated 6 December 2019, available at gps.bcaresearch.com 5 For example, if the Fed's inflation target is 2% but inflation is only 1.7% one year, the target would automatically rise to 2.3% the following year. 6 Please see Foreign Exchange Strategy, "2020 Key Views: Top Trade Ideas," dated December 13, 2019, available at fes.bcaresearch.com GAA Asset Allocation
The Riskbank finally did it. In an environment where major central banks are cutting interest rates, the Swedish central bank went against the flow and lifted the repo rate by 25bps to zero. At first glance, this seems surprising. The Swedish economy is…
Highlights Mega-theme 1: A hypersensitivity to higher interest rates. Overweight equities versus bonds until 10-year bond yields rise 75 bps. At which point, switch into bonds. Mega-theme 2: Europe conquers its disintegration forces. Overweight European currencies, and underweight core European bonds within a fixed income portfolio. Mega-theme 3: Non-China exposed investments outperform structurally. Overweight non-China plays, underweight materials and resources, and underweight commodity currencies. Mega-theme 4: The rise of blockchain and alternative energy. Overweight alternative energy, underweight oil and gas, and underweight financials. Feature Feature ChartUnderweight Materials And Resources In The 2020s
Underweight Materials And Resources In The 2020s
Underweight Materials And Resources In The 2020s
“Study the past if you would divine the future” – Confucius To paraphrase Confucius, we must study the mega-themes of the 2010s if we are to identify the mega-themes of the 2020s. From an economic, financial, and political perspective, the mega-themes of the past decade were: ‘universal QE’; Europe’s threatened disintegration; China becoming the world’s ‘stimulator of last resort’; and the decentralization of information, which threatened the established hierarchies in politics and society. These mega-themes of the 2010s point the way to four mega-themes for the 2020s: A hypersensitivity to higher interest rates. Europe conquers its disintegration forces. Non-China exposed investments outperform structurally. The rise of blockchain and alternative energy. Mega-Theme 1: A Hypersensitivity To Higher Interest Rates The 2010s was the decade of ‘universal QE’. One after another, the world’s major central banks bought trillions of dollars of government bonds (Chart I-2). Yet for all its apparent mystique, QE is nothing more than a signalling mechanism – signalling that central banks intend to keep policy interest rates depressed for a long time. Thereby, QE depresses long-term bond yields – which themselves are nothing more than the expected path of policy interest rates. Chart I-2The 2010s Was The Decade Of 'Universal QE'
The 2010s Was The Decade Of 'Universal QE'
The 2010s Was The Decade Of 'Universal QE'
Something else happens. Close to the lower bound of interest rates, bonds become riskier investments. As holders of Swiss bonds discovered in 2019, low-yielding bonds become a ‘lose-lose’ proposition: prices can no longer rise much, but they can fall a lot. The upshot is that all long-duration assets become risky, and the much higher return required on formerly riskier assets – such as equities – collapses to the feeble return offered on equally-risky bonds. 'Universal QE' has boosted the valuation of all risky assets. Ten years ago, when the global 10-year bond yielded 3.5 percent, equities offered a prospective 10-year return of 9 percent (per annum). Today, when the bond is yielding around 1.5 percent, equities are offering a paltry 3 percent (Chart I-3 and Chart I-4). Meaning that while the present value of the 10-year bond is up around 20 percent, the present value of equities has surged by 60 percent.1 Chart I-3Equities Are Offering A Paltry 3 Percent Return
Equities Are Offering A Paltry 3 Percent Return
Equities Are Offering A Paltry 3 Percent Return
Chart I-4The Return Offered By Equities Has Collapsed To The Feeble Return Offered By Bonds
The Return Offered By Equities Has Collapsed To The Feeble Return Offered By Bonds
The Return Offered By Equities Has Collapsed To The Feeble Return Offered By Bonds
This exponential dynamic has applied to all risky assets in the 2010s. Most notably, real estate prices have sky-rocketed: Shenzhen 325 percent; Beijing 285 percent; Berlin 125 percent; Bangkok 120 percent; San Francisco 90 percent; Los Angeles 85 percent; Sydney 75 percent; and so on. From 2010 to 2020, the value of global real estate surged from an estimated $160 trillion to $300 trillion.2 The market value of equities also doubled from $35 trillion to $70 trillion.3 But global GDP grew by less than a third from $66 trillion to $85 trillion.3 The upshot is that in 2010 the value of real estate plus equities stood at 2.9 times GDP, whereas in 2020 it stands at 4.5 times GDP. Now add in the aforementioned exponentiality of risk-asset valuations at low bond yields. In 2010, a 1 percent rise in yields required a 10 percent decline in present values, whereas in 2020 it might require a 30 percent decline. In 2010, this meant a decline equivalent to 29 percent of global GDP, but in 2020 it means a decline equivalent to a staggering 135 percent of global GDP.4 So mega-theme 1 for the early 2020s is that any monetary policy tightening – in response to, say, wage inflation fears – will unleash a massive deflationary impulse into the economy from falling stock and real estate prices. This deflationary sledgehammer will annihilate the inflationary peanut, and almost certainly trigger the next major recession. But the good news is that it is unlikely to be a 2020 story, as all the major central banks are in ‘wait-and-see’ mode. Structural recommendation: Overweight equities versus bonds until 10-year bond yields rise 75 bps. At which point, switch into bonds. Mega-Theme 2: Europe Conquers Its Disintegration Forces In sub-atomic physics, a nucleus disintegrates when the electrostatic forces pulling it apart becomes stronger than the nuclear forces holding it together. Using the nucleus as a metaphor for Europe, two of the forces pulling it apart have weakened, while one of the forces holding it together has strengthened. We now know that Europe’s biggest rebel – the UK – is leaving the European Union in 2020. In the sub-atomic metaphor, the UK has become a free radical which will try and attach itself to the largest attractive body it can find. But in losing its most wayward member the European nucleus has, by definition, become more cohesive. A second destructive force has been the economic divergences between the ‘core’ and ‘periphery’ European member states. But over the past decade, these divergences have narrowed substantially. Relative to Germany, unit labour costs have declined by 25 percent in Spain, and 15 percent in Italy. More convergence is needed, but the economic forces pulling the European nucleus apart are much weaker in 2020 than they were in 2010 (Chart I-5). Chart I-5The Economic Divergence Between Europe's Core And Periphery Has Narrowed
The Economic Divergence Between Europe's Core And Periphery Has Narrowed
The Economic Divergence Between Europe's Core And Periphery Has Narrowed
Meanwhile, a force holding the European nucleus together has strengthened. In 2010, the Target2 banking imbalance stood at €0.3 trillion; in 2020, it stands close to €1.5 trillion. In simple terms, this means Germany’s exposure to ‘Italian euro’ assets has surged via the ECB’s massive purchases of Italian BTPs. At the same time, Italian investors have parked their cash in German banks, meaning they are owed ‘German euros’ (Chart I-6). Chart I-6Europe’s Target2 Banking Imbalance Stands Close To €1.5 Trillion
2020s Key Views: Four Mega-Themes For The 2020s
2020s Key Views: Four Mega-Themes For The 2020s
With such a massive Target2 imbalance, the biggest casualty of the euro’s disintegration would be Germany, whose 2008 recession would look like a stroll in the park. Giving Germany a huge incentive to become more conciliatory to its partners, for example on the use of fiscal stimulus. The best way to play mega-theme 2 is through the currency and bond markets. European equity markets are plays on their dominant sectors, and as we are about to see, many of the sectors over-weighted in Europe face structural headwinds. Structural recommendation: Overweight European currencies, and underweight core European bonds within a fixed income portfolio. Mega-Theme 3: Non-China Exposed Investments Outperform Structurally The 2010s was the decade when China became the global ‘stimulator of last resort’. Prior to the 2010s, the credit impulse in China was inconsequential compared to the credit impulses in the US and Europe. But in the 2010s the tables turned. The credit impulses in the US and Europe became inconsequential, as the amplitude of China’s waves of stimulus swamped all others (Chart I-7). Chart I-7In The 2010s, China Became The Global 'Stimulator Of Last Resort'
In The 2010s, China Became The Global 'Stimulator Of Last Resort'
In The 2010s, China Became The Global 'Stimulator Of Last Resort'
China became the global stimulator of last resort because in 2010 its indebtedness was significantly less than in other major economies. But today, China’s indebtedness has overtaken the others, and is levelling off at a point that has proved to be a reliable upper bound (Chart I-8). Chart I-8China's Indebtedness Is Reaching Its Upper Bound
China's Indebtedness Is Reaching Its Upper Bound
China's Indebtedness Is Reaching Its Upper Bound
An upper bound to indebtedness exists because further debt creates mal-investments whose returns are lower than the cost of the debt. And as indebtedness approaches the upper bound, each wave of stimulus loses potency compared to the preceding wave. For example, in 2011 China’s nominal GDP growth accelerated to 20 percent, but in 2017 it accelerated to 10 percent. In the financial markets, China’s waves of stimulus enabled short bursts of countertrend outperformance within the structural bear market in materials and resources – sectors which feature large in European markets. However, as Chinese stimulus loses its potency in the 2020, the structural bear markets in China-exposed investments will re-establish (Chart I-1). Structural recommendation: Overweight non-China plays, underweight materials and resources, and underweight commodity currencies. Mega Theme 4: The Rise Of Blockchain And Alternative Energy Historian Niall Ferguson describes history as a perpetual oscillation between periods dominated by centralized hierarchies and periods dominated by decentralized networks. And quite often, he says, the switch is enabled by a revolutionary new technology. For example, the advent of the printing press in the mid-15th century catalysed the Protestant Reformation and turbocharged the Renaissance by unleashing a decentralization of knowledge, information, and news. Sound familiar? In the early-21st century the internet has similarly decentralized the production and consumption of knowledge, information, and news. And the new networked age has threatened the established hierarchies in politics and society, fuelled populism, and disrupted many sectors in the economy. Yet Ferguson points out that it is futile (as well as Luddite) to resist such shifts from hierarchical structures towards decentralized networks. In the 2020s the decentralization baton will pass from the internet to the blockchain. Just as the internet decentralizes information, the blockchain decentralizes intermediation and trust functions. Hence, the blockchain will be maximally disruptive to any economic sector whose raison d’être is intermediation and trust – most notably finance and law. The blockchain will be maximally disruptive to any economic sector whose raison d’être is intermediation and trust – most notably finance and law. By the end of the decade, you will no longer need a bank to intermediate your excess savings to a borrower. And you will no longer need a lawyer to oversee a change of ownership. The blockchain will do these for you just as securely and much more cost effectively. One consequence is that the nature of the world’s energy requirements will change. The blockchain is very energy intensive, but unlike the internal combustion engine, the energy does not have to be portable. Hence, there will be a structural shift towards energy in the form of ‘moving electrons’ and away from energy in the form of the ‘chemical bonds’ in fossil fuels. This will be a boon for the alternative energy sector at the expense of oil and gas (Chart I-9). Chart I-9Underweight Oil And Gas In The 2020s
Underweight Oil And Gas In The 2020s
Underweight Oil And Gas In The 2020s
We will cover this mega-theme in more detail in a Special Report next year. Structural recommendation: Overweight alternative energy, underweight oil and gas, underweight financials. And with that, it’s time to sign off for this year and for this decade. I do hope that you have found the past decade’s reports insightful, sometimes provocative, but always enjoyable. We promise to continue in the same vein in the 2020s. It just remains for me and the team to wish you a happy new year and a happy new decade! Fractal Trading System* The Conservatives won a surprise landslide victory in the UK election last week, but fractal structures suggest that some of the market euphoria is now overdone. Specifically, the 30 percent rally in UK homebuilders through the last 65 days is vulnerable to a short-term countertrend move. Accordingly, this week’s recommended trade is short UK homebuilders / long UK oil and gas. Set the profit target at 9 percent with a symmetrical stop-loss. Chart I-10UK: Homebuilders Vs. Oil and Gas
UK: Homebuilders Vs. Oil and Gas
UK: Homebuilders Vs. Oil and Gas
In other trades, short MSCI AC World versus the global 10-year bond was closed at its 2.5 percent stop-loss, leaving three trades in comfortable profit, one neutral, and one in loss. When the fractal dimension approaches the lower limit after an investment has been in an established trend it is a potential trigger for a liquidity-triggered trend reversal. Therefore, open a countertrend position. The profit target is a one-third reversal of the preceding 13-week move. Apply a symmetrical stop-loss. Close the position at the profit target or stop-loss. Otherwise close the position after 13 weeks. Use the position size multiple to control risk. The position size will be smaller for more risky positions. * For more details please see the European Investment Strategy Special Report “Fractals, Liquidity & A Trading Model,” dated December 11, 2014, available at eis.bcaresearch.com. Dhaval Joshi Chief European Investment Strategist dhaval@bcaresearch.com Footnotes 1 In simple terms, if the 10-year yield declines by 2 percent, a 2 percent a year lower return for 10 years requires the present value to rise by 2 percent times 10, which equals 20 percent. In the case of equities, the equivalent calculation is 6 percent times 10, which equals 60 percent. 2 Source: Savills 3 Source: Thomson Reuters 4 2.9 times 10 percent equals 29 percent, 4.5 times 30 percent equals 135 percent. Fractal Trading System
2020s Key Views: Four Mega-Themes For The 2020s
2020s Key Views: Four Mega-Themes For The 2020s
2020s Key Views: Four Mega-Themes For The 2020s
2020s Key Views: Four Mega-Themes For The 2020s
Cyclical Recommendations Structural Recommendations
2020s Key Views: Four Mega-Themes For The 2020s
2020s Key Views: Four Mega-Themes For The 2020s
2020s Key Views: Four Mega-Themes For The 2020s
2020s Key Views: Four Mega-Themes For The 2020s
2020s Key Views: Four Mega-Themes For The 2020s
2020s Key Views: Four Mega-Themes For The 2020s
2020s Key Views: Four Mega-Themes For The 2020s
2020s Key Views: Four Mega-Themes For The 2020s
Trades Closed Trades Asset Performance Currency & Bond Equity Sector Country Equity
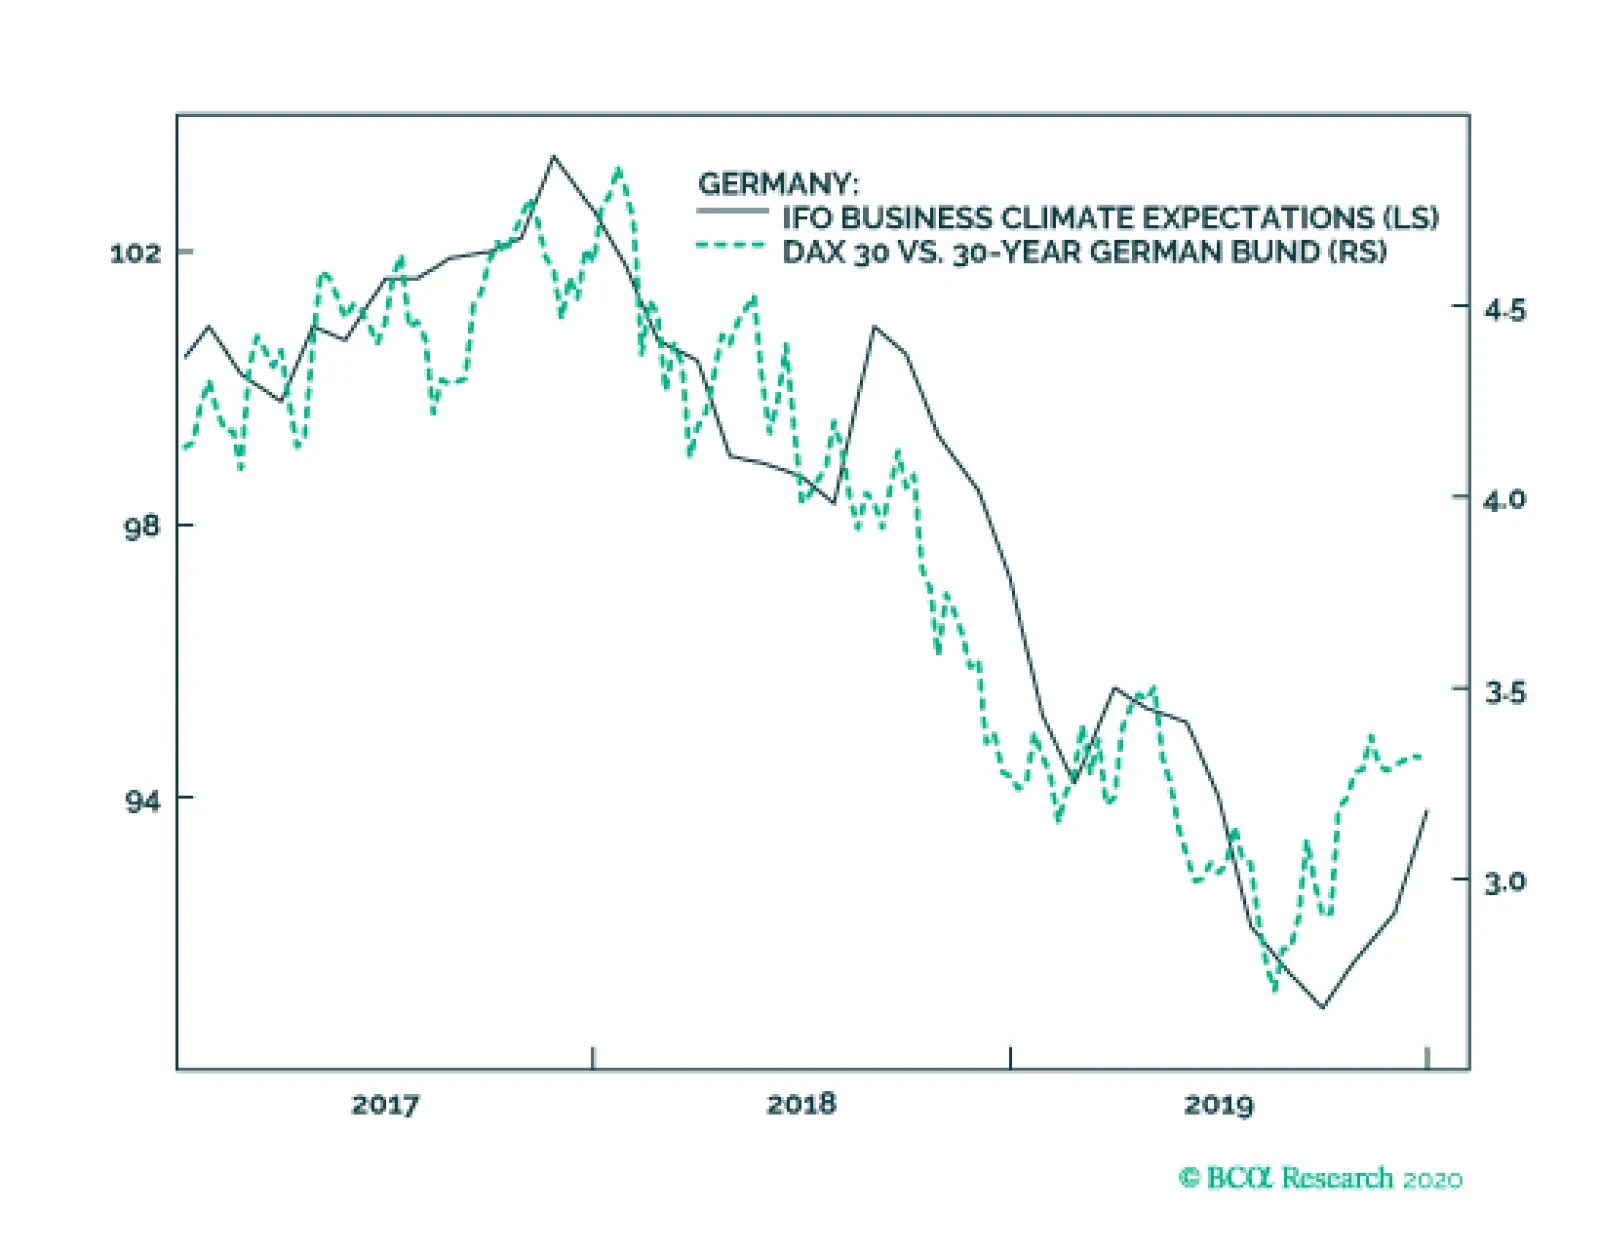
The December German Ifo not only rebounded, but also beat expectations. Business climate increased from 95.1 to 96.3 and the expectations component climbed to 93.8 from 92.3. The German Ifo tends to provide a lead on the PMI numbers as well as industrial…
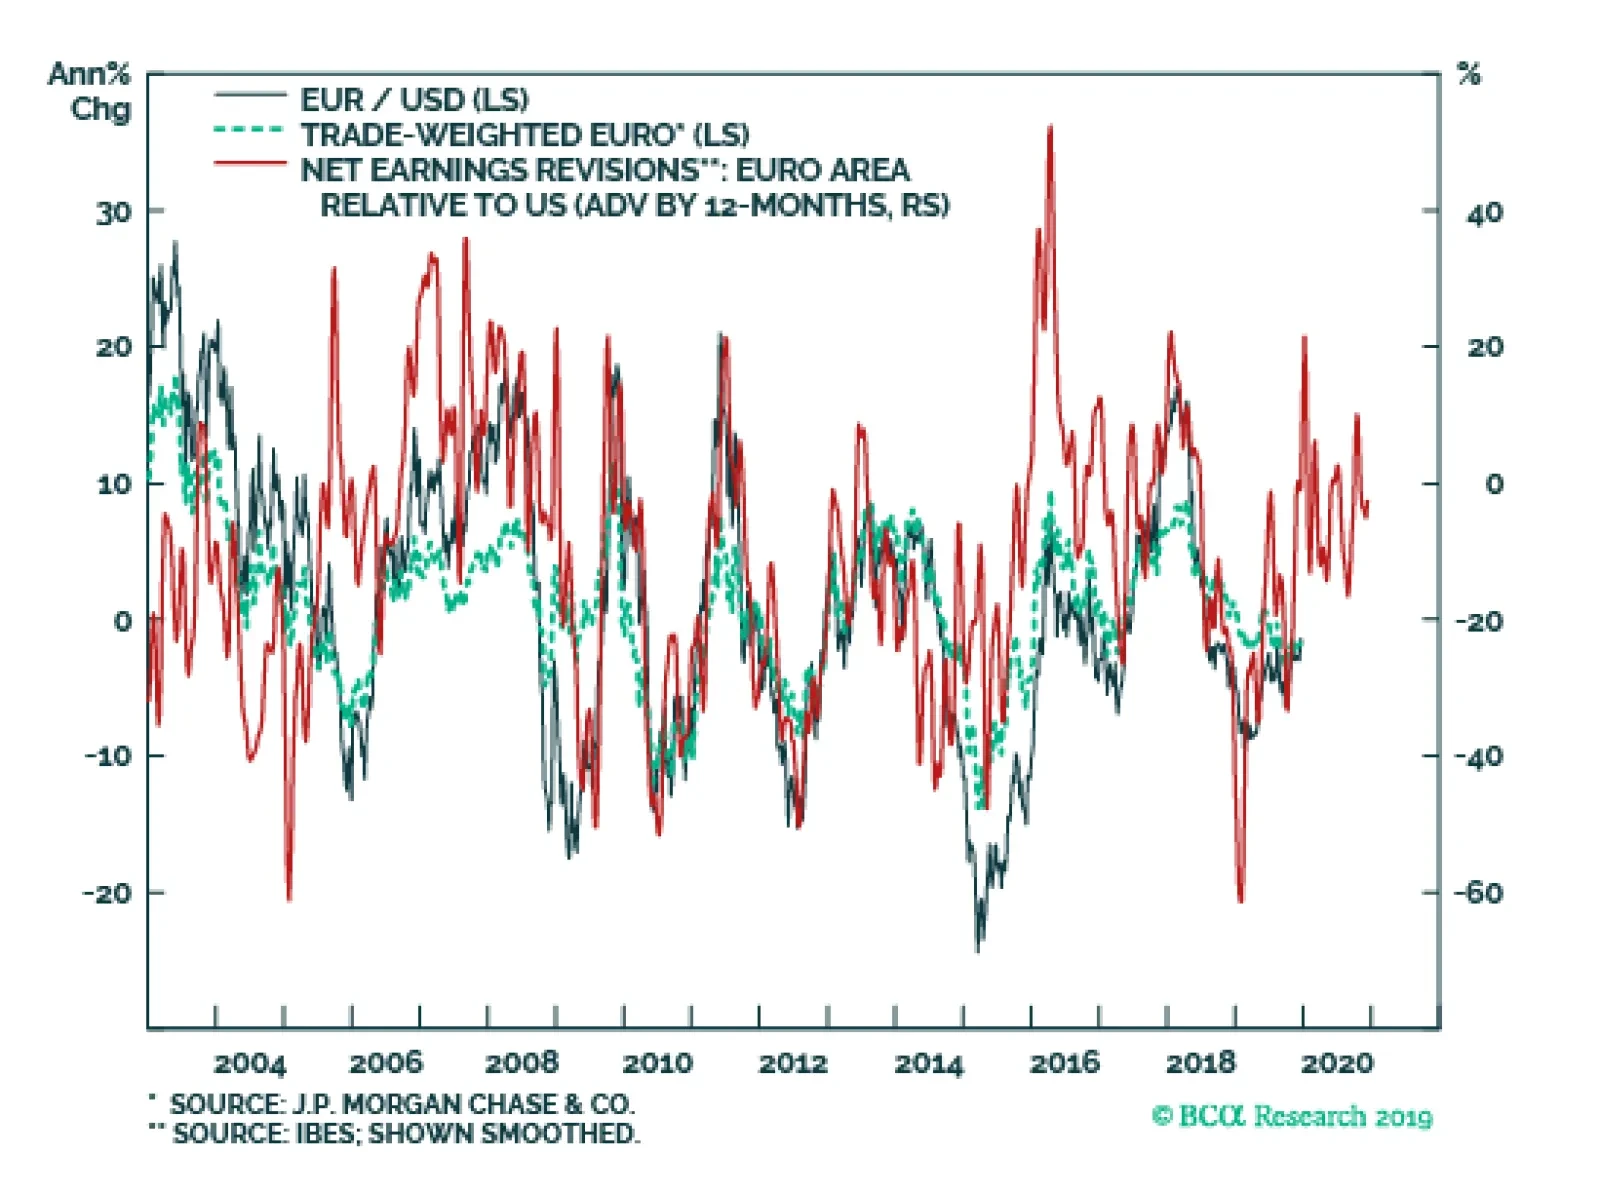
Our near-term target for EUR/USD is 1.18. This level will retest the downward sloping trendline in place since the Great Financial Crisis. The collapse in the euro since the financial crisis has been driven by falling growth differentials between the…
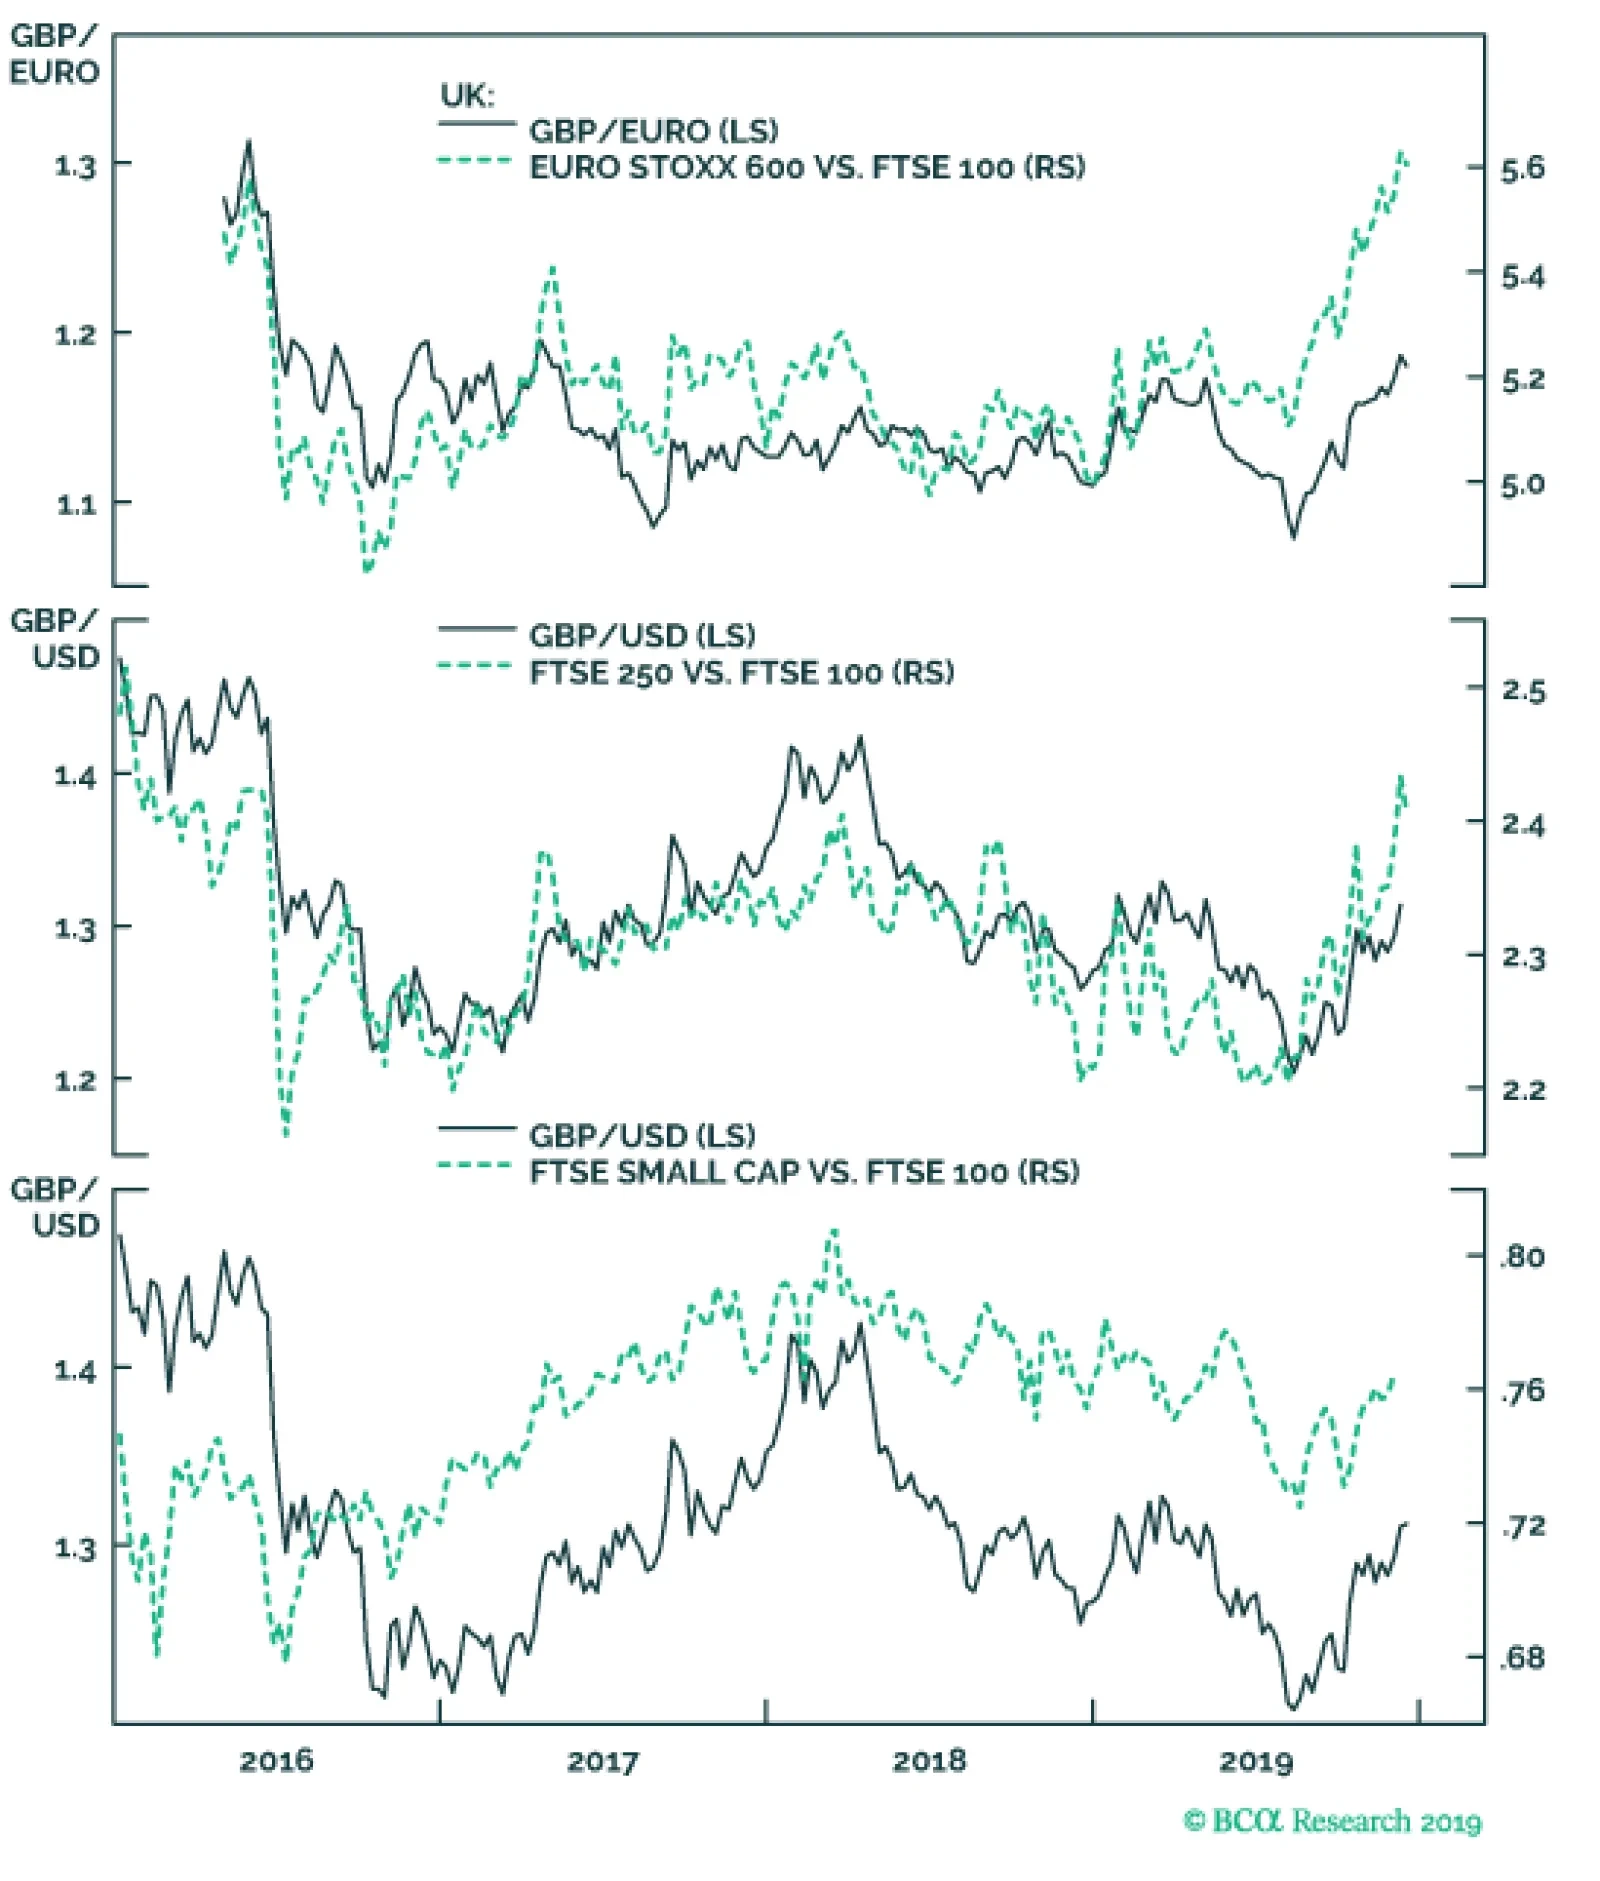
Conservatives won 364 seats last night. This comfortable majority for the Conservatives is a medium-term positive for UK exposed investments, as Prime Minister Boris Johnson is not dependent on the 20 or so hard Brexit extremists to pass any free trade…
Highlights Go short the DXY index with a target of 90 and a stop loss of 100. The top-performing G10 currencies in 2020 will be the NOK and SEK. Remain short USD/JPY as portfolio insurance. USD/JPY and the DXY are usually positively correlated. A weak dollar will lend support to gold prices. Gold will also benefit from abundant liquidity and persistently low/negative real rates. EUR/USD should touch 1.18, while GBP/USD will retest 1.40. There are abundant trade opportunities at the crosses. Our favorites are long AUD/NZD and short CAD/NOK. Feature The DXY index has been trading on the weaker side in recent months and is breaking below the upward-sloped channel in place since the middle of last year. In a nutshell, the performance of the dollar DXY index has been unimpressive for this year (Chart 1). The decisive break down represents an important fundamental shift, since the next level of support lies all the way towards the 90-92 zone. Given additional confirmation from a few of our indicators in recent weeks, we are selling the DXY at current levels, with a tight stop at 100. Chart 1A Report Card On Currency Performance
2020 Key Views: Top Trade Ideas
2020 Key Views: Top Trade Ideas
Green Shoots On Global Growth Frequent readers of our bulletin are well aware of the observation that the dollar is a countercyclical currency. As such, when global growth is rebounding, more cyclical economies benefit most from this growth dividend. This tends to weaken the dollar. Recent data confirms that this trend remains firmly intact. We expect continued improvement in both the ISM and global manufacturing PMI, but for now, the message is that the epicenter of the growth recovery is from outside the US. Chart 2Major Dollar Tailwinds Have Peaked
Major Dollar Tailwinds Have Peaked
Major Dollar Tailwinds Have Peaked
We expect continued improvement in both the ISM and global manufacturing PMI, but for now, the message is that the epicenter of the growth recovery is from outside the US (Chart 2). This has typically been synonymous with a lower dollar. In the euro area, the expectations components of the ZEW and Sentix surveys continue to outpace current conditions, which tends to lead European PMIs by about six months. It is becoming more and more evident that we will be out of a manufacturing recession in the euro area early next year (Chart 3). Chinese imports surprised to the upside for the month of November, in line with the message from easing in financial conditions (Chart 4). Should stimulus continue to be frontloaded into next year, this should continue to support global growth. The perk-up in copper prices is a good confirmatory signal. Chart 3A V-Shaped Recovery In European Manufacturing
A V-Shaped Recovery In European Manufacturing?
A V-Shaped Recovery In European Manufacturing?
Chart 4Chinese Growth Will Benefit From Stimulus
Chinese Imports Could Soon Rebound
Chinese Imports Could Soon Rebound
Japanese GDP saw a big upward revision for the third quarter, and a few leading indicators suggest nascent green shoots despite the October consumption tax hike. A new fiscal package was announced recently and should go a long way in boosting domestic demand (Chart 5). Chart 5Japanese Growth
The Story Of Japan In One Chart
The Story Of Japan In One Chart
Chart 6USD/SEK Has Peaked
USD/SEK Has Peaked
USD/SEK Has Peaked
The currencies of small, open economies such as the SEK and the NZD have started to stage meaningful reversals. These currencies are usually good at sensing shifts in the investment landscape, and our suspicion is that they were primary funding vehicles for long USD trades (Chart 6). The slowdown in the global economy has been driven by the manufacturing sector, so it is fair to assume that this is the part of the economy that is ripe for mean reversion. Not to mention, cyclical swings in most economies tend to be driven by manufacturing and exports rather than services. More specifically, the currencies that have borne the brunt of the manufacturing slowdown should also experience the quickest reversals. This is already being manifested in a very steep rise in their bond yields vis-à-vis those in the US (Chart 7A and 7B). For example, yields in Norway, Sweden, Switzerland and Japan have risen significantly versus those in the US since the bottom. Should the nascent pickup in global growth morph into a synchronized recovery, this will go a long way in further eroding the US’s yield advantage. Chart 7AInterest Differentials And Exchange Rates
Interest Differentials And Exchange Rates
Interest Differentials And Exchange Rates
Chart 7BInterest Differentials And Exchange Rates
Interest Differentials And Exchange Rates
Interest Differentials And Exchange Rates
The key risk to a bearish dollar view is a US-led global growth rebound, allowing the Federal Reserve to adopt a much more hawkish stance relative to other central banks. This would be an environment in which US inflation would also surprise to the upside. This is not our baseline view, especially following the dovish revisions of the Summary of Economic projections made by the Fed this week. Bottom Line: Given further confirmation from a swath of indicators, we are going short the DXY index at current levels with an initial target of 90 and a stop loss at 100. Go Long SEK Our highest-conviction views on currencies are being long the NOK and SEK. Our highest-conviction views on currencies are being long the NOK and SEK. This view has been in place for a few months via other crosses, but we are taking the leap today in putting these positions on versus the dollar. Less aggressive investors can still stick to NOK and SEK trades as the crosses. Chart 8Soft Data Is Much Worse
Soft Data Is Much Worse
Soft Data Is Much Worse
Of all the G10 currencies we follow, the Swedish krona is probably the most perplexing. The Riksbank is one of the few central banks to have raised rates this year, but the krona remains the weakest G10 currency. Admittedly, the performance of the Swedish manufacturing sector has been dismal, especially so in October (Chart 8). That said, the euro area, which has also experienced a deep manufacturing recession, has seen a better currency performance this year despite a more dovish European Central Bank. The big question for Sweden is whether the manufacturing sector is just in a volatile bottoming process, or about to contract much further. Domestically, retail sales were strong for the month of October and inflation is surprising to the upside. Exchange rates tend to be extremely fluid in discounting a wide swath of economic data, and in the case of Sweden, in discounting the outcome for global growth. This suggests that the quick reversals in the EUR/SEK and USD/SEK – from levels close to or above their 2008 highs – means that it will take anything but a deep recession to justify a weaker krona. Bottom Line: In terms of SEK trading strategy, short USD/SEK and short NZD/SEK are good bets, since the SEK has a higher beta to global growth than the US dollar and the kiwi (Sweden exports 45% of its GDP versus 27% for New Zealand). However, an additional trade suggestion is to go short EUR/SEK for Europe-centric investors. Go Long NOK As Well Chart 9Opportunity Or Regime Shift?
Opportunity Or Regime Shift?
Opportunity Or Regime Shift?
Since the middle of the last decade, another perplexing disconnect has been the divergence between the price of oil and the performance of petrocurrencies. From the 2016 bottom, oil prices have more than doubled, but the petrocurrency basket has massively underperformed versus the US dollar (Chart 9). We agree with our commodity strategists that the outlook for oil prices is to the upside. Oil demand tends to follow the ebbs and flows of the business cycle, with demand having slowed sharply on the back of a manufacturing recession. Transport constitutes the largest share of global petroleum demand. A manufacturing pickup will therefore boost oil demand. Rising oil prices are bullish for petrocurrencies but being long versus the US dollar is no longer an appropriate strategy. This is because the landscape for oil production is rapidly shifting, with the US shale revolution grabbing market share from both OPEC and non-OPEC members. In 2010, only about 6% of global crude output came from the US. Fast forward to today and the US produces almost 15% of global crude, having grabbed market share from many other countries. In short, as the now-largest oil producer in the world, the US dollar is itself becoming a petrocurrency (Chart 10). Chart 10US Has Grabbed Oil Production Market Share
US Has Grabbed Oil Production Market Share
US Has Grabbed Oil Production Market Share
Chart 11Buy Oil Producers Versus Oil Consumers
Buy Oil Producers Versus Oil Consumers
Buy Oil Producers Versus Oil Consumers
The strategy going forward will be twofold. First, buying a petrocurrency basket versus the dollar will require perfect timing in the dollar down leg. The second strategy is to be long a basket of oil producers versus oil consumers. Chart 11 shows that a currency basket of oil producers versus consumers has had both a strong positive correlation with the oil price and has outperformed a traditional petrocurrency basket. Our recommendation is that NOK long positions should be played both via selling the CAD and USD (Chart 12). The discount between Western Canadian Select crude oil and Brent has also widened, which has historically heralded a lower CAD/NOK exchange rate (Chart 13). We are also long the NOK/SEK, given our belief that interest rate differentials and momentum will favor this cross over the next three months. Chart 12CAD/NOK And DXY
CAD/NOK And DXY
CAD/NOK And DXY
Chart 13NOK Will Outperform CAD
NOK Will Outperform CAD
NOK Will Outperform CAD
Bottom Line: Remain short CAD/NOK for a trade, but more aggressive investors should begin accumulating long NOK positions versus the US dollar outright. The Yen As Portfolio Insurance Chart 14Short USD/JPY: A Contrarian Bet
Short USD/JPY: A Contrarian Bet
Short USD/JPY: A Contrarian Bet
The yen tends to underperform at the crosses as global growth rebounds but still outperform versus the dollar, at least, until the Bank of Japan is forced to act (Chart 14). This places short USD/JPY bets in an enviable “heads I win, tails I do not lose too much,” position. Economic data from Japan over the past few weeks suggests the economy is weakening, but not fully succumbing to pressures of weak external growth and the consumption tax hike. The labor market remains relatively tight, and Tokyo office vacancies are hitting post-crisis lows, suggesting the demand for labor remains tight. The final print of third-quarter GDP growth rose to 1.8%. Wages are inflecting higher as well. The new fiscal spending package is likely to lend support to these trends. What these developments suggest is that the BoJ is likely to stand pat in the interim, a course of action that will eventually reignite deflationary pressures in Japan (Chart 15). A return towards falling prices will eventually force the BoJ’s hand, but might see a knee-jerk rise in the yen before. Total annual asset purchases by the BoJ are currently a far cry from the central bank’s soft target of ¥80 trillion, and unlikely to change anytime soon (Chart 16). Chart 15What More Could The BoJ Do?
What More Could The BoJ Do?
What More Could The BoJ Do?
Chart 16Stealth Tapering By The BoJ
Stealth Tapering By The BoJ
Stealth Tapering By The BoJ
It is important to remember why deflation is so pervasive in Japan, making the BoJ’s target of 2% a bit of a pipedream if it stands pat. The overarching theme for prices in Japan is a rapidly falling (and rapidly ageing) population, leading to deficient demand (Chart 17). Meanwhile, domestically, an aging population (that tends to be the growing voting base), prefers falling prices. What is needed is to convince the younger population to save less and consume more, but that is difficult when high debt levels lead to insecurity about the social safety net. On the other side of the coin, the importance of financial stability to the credit intermediation process has been a recurring theme among Japanese policymakers, with the health of the banking sector an important pillar. YCC and negative interest rates have been anathema for Japanese net interest margins and share prices (Chart 18). Any policy shift that is increasingly negative for banks could easily tip them over. This suggests the shock needed for the BoJ to act may be greater than history. Chart 172% Inflation = Mission Impossible?
2% Inflation = Mission Impossible?
2% Inflation = Mission Impossible?
Chart 18Negative Rates Are Anathema To Banks
Negative Rates Are Anathema To Banks
Negative Rates Are Anathema To Banks
We believe global growth is bottoming, but the traditional yen/equity correlation can also shift. Inflows into Japan could accelerate, given cheap equity valuations and improved corporate governance that has been lifting the relative return on capital. The propensity of investors to hedge these purchases will be less if the dollar is in a broad-based decline. Bottom Line: An external shock could tip the Japanese economy back into deflation. The risk is that if the dollar falls, the yen remains flat to lower in the interim. Given cheap valuations and a lack of ammunition by the BoJ, our view is that it is a low cost for portfolio insurance. EUR/USD As The Anti-Dollar Our near-term target for EUR/USD is 1.18. This level will retest the downward sloping trendline in place since the Great Financial Crisis (Chart 19). Chart 20 plots the relative growth performance of the euro area versus the US, superimposed with the exchange rate. The result is very evident: The collapse in the euro since the financial crisis has been driven by falling growth differentials between the Eurozone and the US. There is little the central bank can do about deteriorating demographic trends, but it can at the margin stem falling productivity. One of its levers is to lower the cost of capital in the entire Eurozone, such that it makes sense even for the less productive peripheral countries to borrow and invest. Chart 19EUR/USD
EUR/USD
EUR/USD
Chart 20Structural Slowdown In European Growth
Structural Slowdown In European Growth
Structural Slowdown In European Growth
Importantly, yields across the periphery are rapidly converging towards those in Germany, solving a critical dilemma that has long plagued the Eurozone in general and the euro in particular. In simple terms, ECB policy has historically always been too easy for some member countries while too stimulative for others. This has traditionally led to internal friction for the currency. However, with 10-year government bond yields in France, Spain and even Portugal now close to the neutral rate of interest for the entire Eurozone, this dilemma is slowly fading. Labor market reforms in Mediterranean Europe have seen unit labor costs in Greece, Ireland, Portugal and Spain collectively contract by almost 10%. This has effectively eliminated the competitiveness gap that had accumulated over the past two decades. Italy remains saddled with a rigid and less productive workforce, but overall adjustments have still come a long way to closing a key fissure plaguing the common currency area. Earnings estimates for euro zone equities versus the US are rising. This tends to firmly lead the euro by about nine to 12 months, suggesting we are due for a pop in the coming quarters. Chart 21Relative R-Star* In The Eurozone Could Rebound
Relative R-Star* In The Eurozone Could Rebound
Relative R-Star* In The Eurozone Could Rebound
The bottom line is that the various forces that may have been keeping the neutral rate of interest artificially low in the euro area are ebbing. The proverbial saying is that a chain is only as strong as its weakest link. This means that if the forces pressuring equilibrium rates in the periphery are slowly dissipating, this should lift the neutral rate of interest in the entire euro zone. Over a cyclical horizon, this should be bullish for the euro (Chart 21). Bottom Line: European equities, especially those in the periphery, remain unloved, given they are trading at some of the cheapest cyclically adjusted price-to-earnings multiples in the developed world. Earnings estimates for euro zone equities versus the US are rising. This tends to firmly lead the euro by about nine to 12 months, suggesting we are due for a pop in the coming quarters (Chart 22). Chart 22The Euro Might Soon Pop
The Euro Might Soon Pop
The Euro Might Soon Pop
Concluding Thoughts Being long Treasurys and the dollar has been a consensus trade for many years now (Chart 23). According to CFTC data, this has been expressed mostly through the aussie and kiwi, although our bias is that the Swedish krona and Norwegian krone have been the real victims. Chart 23Unfavorable Dollar Technicals
Unfavorable Dollar Technicals
Unfavorable Dollar Technicals
Chart 24The US Dollar Is Overvalued
The US Dollar Is Overvalued
The US Dollar Is Overvalued
Various models have shown valuation to be a very poor tool for managing currencies, but an excellent one at extremes (Chart 24). The results show the US dollar as overvalued, especially versus the Swedish krona, Japanese yen and Norwegian krone. Commodity currencies are closer to fair value, and within the safe-haven complex the Japanese yen is more attractive than the Swiss franc. The euro is less undervalued than implied by the overvaluation in the DXY index. Finally, we are keeping our long GBP/JPY position for now, but with a new target of 155, and tightening the stop to 145 (near our initial target). Inflows into the UK should improve given more clarity from the political overhang, which can lead to an overshoot in the cross. Reviving global growth will also benefit inflows into sterling assets. On a tactical basis however, EUR/GBP is ripe for mean revision given oversold conditions. Chester Ntonifor Foreign Exchange Strategist chestern@bcaresearch.com Forecast Summary Core Portfolio Tactical Trades Limit Orders Closed Trades
Highlights 2019 was a good year for our constraint-based method of political analysis. Trump was impeached, the trade war escalated, and China (modestly) stimulated – all as predicted. Nevertheless Trump caught us by surprise in Q2, with sanctions on Iran and tariffs on China. Our best trades were long defense stocks, gold, and Swiss bonds. Our worst trade was long rare earth miners. Feature Jean Buridan’s donkey starved to death because, faced with equal bundles of grain on both sides, it could not decide which to eat. So the legend goes. Investors face indecision all the time. This is especially the case when a geopolitical sea change is disrupting the global economy. Two or more political outcomes may seem equally plausible, heightening uncertainty. What is needed is a method for eliminating the options that require the farthest stretch. That’s what we offer in these pages, but we obviously make mistakes. The purpose of our annual report card is to identify our biggest hits and misses so we can hone our ability to combine fundamental macro and market analysis with the “art of the possible,” delivering better research and greater returns for clients. This is our last report for 2019. Next week we will publish a joint report with Anastasios Avgeriou of BCA Research’s US Equity Strategy. We will resume publication in early January. We wish all our clients a merry Christmas, happy holidays, and a happy new year! American Politics: Unsurprising Surprises Chart 1Our 2019 Forecast Held Up
Our 2019 Forecast Held Up
Our 2019 Forecast Held Up
On the whole our 2019 forecast held up very well. We argued that the global growth divergence that began in 2018 would extend into 2019 with the Fed hiking rates, a lack of massive stimulus from China, and an escalation in the US-China trade war. The biggest miss was that the Fed actually cut rates three times – addressed at length in our BCA Research annual outlook. But the bulk of the geopolitical story panned out: the US dollar, US equities, and developed market equities all outperformed as we expected (Chart 1). Geopolitical risk in the Trump era is centered on Trump himself. Beginning in 2017, we argued that the Democrats would take the House of Representatives in the midterm elections and impeach the president. Congress would not be totally gridlocked: while we argued for a government shutdown in late 2018, we expected a large bipartisan budget agreement in late 2019 and always favored the passage of the USMCA trade deal. Still, Congress would encourage Trump to go abroad in pursuit of policy victories, increasing geopolitical risks. We also argued that, barring “smoking gun” evidence of high crimes, the Republican-held Senate would acquit Trump – assuming his popularity held up among Republican voters themselves (Chart 2). These views either transpired or remain on track. The implication is that Trump-related risk continues and yet that Trump’s policies are ultimately constrained by the guardrails of the election. The latter factor helped propel the equity rally in the second half of the year. We largely sat out that rally, however. We overestimated the chances that Senator Bernie Sanders would falter and Senator Elizabeth Warren would swallow his votes, challenging former Vice President Joe Biden for the leading position in the early Democratic Party primary. We expected a significant bout of equity volatility via fears of a sharp progressive-populist turn in US policy (Chart 3). Instead, Sanders staged a recovery, Warren fell back, Biden maintained his lead, and markets rallied on other news. Chart 2Trump Will Be Acquitted
How Are We Doing? ... Geopolitical Strategy 2019 Report Card
How Are We Doing? ... Geopolitical Strategy 2019 Report Card
Chart 3Fears Of A Progressive Turn Did Not Derail The H2 Rally
How Are We Doing? ... Geopolitical Strategy 2019 Report Card
How Are We Doing? ... Geopolitical Strategy 2019 Report Card
Warren could still recover and win the nomination next year. But the Democratic Primary was not a reason to remain neutral toward equities, as we did in September and October. China’s Tepid Stimulus In recent years China first over-tightened and then under-stimulated the economy – as we predicted. But we misread the credit surge in the first quarter as a sign that policymakers had given up on containing leverage. In total this year’s credit surge amounts to 3.4% of GDP, about 1.2% short of what we expected (based on half of the 9.2% surge in 2015-16) (Chart 4). China’s credit surge was about 1.2% short of what we expected, but the direction was correct. While the government maintained easy monetary policy as expected, its actions combined with negative sentiment to snuff out the resurgence in shadow banking by mid-year (Chart 5). Chart 4China's Credit Surge Was Underwhelming
China's Credit Surge Was Underwhelming
China's Credit Surge Was Underwhelming
Still, China’s policy direction is clear – and fiscal policy is indeed carrying a greater load. The authorities are extremely unlikely to reverse course next year, so global activity should turn upward (Chart 6). Our “China Play Index” – iron ore prices, Swedish industrials, Brazilian stocks, and EM junk bonds, all in USD terms – has appreciated steadily (Chart 7). Chart 5China's Shadow Banking Remained Under Pressure
China's Shadow Banking Remained Under Pressure
China's Shadow Banking Remained Under Pressure
Chart 6Global Activity Should Turn Upward In 2020
Global Activity Should Turn Upward In 2020
Global Activity Should Turn Upward In 2020
Chart 7Our 'China Play Index' Performed Well
Our 'China Play Index' Performed Well
Our 'China Play Index' Performed Well
US-China: Underestimating Trump’s Risk Appetite We have held a pessimistic assessment of US-China relations since 2012. We rejected the trade truces agreed at the G20 summits in December 2018 and June 2019 as unsustainable. Our subjective probabilities of Trump achieving a bilateral trade agreement with China have never risen above 50%. Since September we have expected a ceasefire but not a full-fledged deal. Nevertheless we struggled with the timing of the trade war ups and downs (Chart 8). In particular we accepted China's new investment law as a sufficient concession and were surprised on May 5 when talks collapsed and Trump increased the tariffs. The lack of constraints on tariffs prevailed in 2019 but in 2020 the electoral constraint will prevail as long as Trump still has a chance of winning. Our worst trade recommendation of the year emerged from our correct view that the June G20 summit would lead to trade war escalation. We went long rare earth miners based outside of China. We expected China to follow through on threats to impose a rare earth embargo on the US in retaliation for sanctions against Chinese telecom giant Huawei. Not only did the US grant Huawei a reprieve, but China’s rare earth companies outperformed their overseas rivals. The trade went deeply into the red as global sentiment and growth fell (Chart 9). Only with global growth turning a corner have these high-beta stocks begun to turn around. Chart 8Expect A Ceasefire, Not A Full-Fledged Trade Agreement
Expect A Ceasefire, Not A Full-Fledged Trade Agreement
Expect A Ceasefire, Not A Full-Fledged Trade Agreement
Chart 9Our Worst Call: Long Rare Earth Miners
Our Worst Call: Long Rare Earth Miners
Our Worst Call: Long Rare Earth Miners
Chart 10North Korean Diplomacy Has Not Collapsed (Yet)
North Korean Diplomacy Has Not Collapsed (Yet)
North Korean Diplomacy Has Not Collapsed (Yet)
Our sanguine view on North Korea was largely offside this year. Setbacks in US negotiations with North Korea have often preceded setbacks in US-China talks. This was the case with the failed Hanoi summit in February and the inconsequential summit at the demilitarized zone in June. This could also be the case in 2020, as Washington and Pyongyang are now on the verge of breaking off talks with the latter threatening a “Christmas surprise” such as a nuclear or missile test. It is not too late to return to talks. Beijing is the critical player and is still enforcing crippling sanctions on North Korea (Chart 10). Beijing would benefit if North Korea submitted to nuclear and missile controls while the US reduced its military presence on the peninsula. We view this year as a hiccup in North Korean diplomacy but if talks utterly collapse and military tensions break out then it would undermine our view on US-China talks, Trump’s reelection odds, and US Treasuries in 2020. Hong Kong, rather than Taiwan, became the site of the geopolitical “Black Swan” that we expected surrounding Xi Jinping’s aggressive approach to domestic dissent. We have never downplayed Hong Kong. The loss of faith in the governing arrangement with the mainland began with the Great Recession and shows no sign of abating (Chart 11). We shorted the Hang Seng after the protests began, but closed at the appropriate time (Chart 12). The problem is not resolved. Also, Taiwan can test its autonomy much farther than Hong Kong and we still expect Taiwan to become ground zero of Greater China political risk and the US-China conflict. Chart 11Hong Kong Discontent Is Structural
How Are We Doing? ... Geopolitical Strategy 2019 Report Card
How Are We Doing? ... Geopolitical Strategy 2019 Report Card
Chart 12Our Hang Seng Short Is Done
Our Hang Seng Short Is Done
Our Hang Seng Short Is Done
Chart 13Trump Needs A Trade Ceasefire
Trump Needs A Trade Ceasefire
Trump Needs A Trade Ceasefire
Trump is unlikely to seek another trade war escalation given the negative impact it would have on sentiment and the economy (Chart 13). He could engage in another round of “fire and fury” saber-rattling against North Korea, as the economic impact is small, but he will prefer a diplomatic track. Taiwan, however, cannot be contained so easily if tempers flare. As we go to press it is not clear if Trump will hike the tariff on China on December 15. Some investors would point to his tendency to take aggressive action when the market gives him ammunition (Chart 14). We doubt he will, as this would be a policy mistake – possibly quickly reversed or possibly fatal for Trump. Trump’s electoral constraint is more powerful in 2020 than it was in 2019. Chart 14Trump Ceasefire Will Last As Long As Economy Is At Risk
Trump Ceasefire Will Last As Long As Economy Is At Risk
Trump Ceasefire Will Last As Long As Economy Is At Risk
Chart 15Our 'Doomsday Basket' Captured Trump's First Three Years
Our 'Doomsday Basket' Captured Trump's First Three Years
Our 'Doomsday Basket' Captured Trump's First Three Years
Our best tactical trade of the year stemmed from the geopolitical risk in Asia (and the Fed’s pause): we recommended a long gold position this summer that gained 16%. We also closed out our “Doomsday Basket” of gold and Swiss bonds, initiated in Trump’s first year, for a gain of 14% (Chart 15). Now that the market has digested Trump’s tactical retreat, we have reinitiated the gold trade as a long-term strategic hedge against both short-term geopolitical crises and the long-term theme of populism. Iran: Fool Me Once, Shame On You … This is the second year in a row that we are forced to explain our analysis of Iran – we were only half-right. Our long-held view is that grand strategy will push the US to pivot to Asia to counter China while scaling back its military activity in the Middle East. Two American administrations have confirmed this trend. That said, there is still a risk that President Trump will get entangled in Iran and that risk is growing. Global oil volatility – which spiked during the market share wars of 2014 – declined through the beginning of 2018, until the Trump administration took clearer steps toward a policy of “maximum pressure” on Iran. The constraints on Trump are obvious: the US economy is still affected by oil prices, which are set globally, and Iran can damage supply and push up prices. Therefore Trump should back down prior to the 2020 election. Yet Trump imposed sanctions, waivered on them, and then re-imposed them in May 2019 – catching us by surprise each time (Chart 16). Chart 16Trump Flip-Flopped On Iran Policy
Trump Flip-Flopped On Iran Policy
Trump Flip-Flopped On Iran Policy
Chart 17Iran Tensions Backwardated Oil Markets
Iran Tensions Backwardated Oil Markets
Iran Tensions Backwardated Oil Markets
This saga is not resolved – we are witnessing what could become a secular bull market in Iran tensions. True, a Democratic victory in 2020 could lead to an eventual restoration of the 2015 nuclear deal. True, the Trump administration could strike a deal with the Iranians (especially after reelection). But no, it cannot be assumed that the US will restore the historic 2015 détente with Iran. Within Iran the regime hardliners are likely to regain control in advance of the extremely uncertain succession from Supreme Leader Ali Khamenei and this will militate against reform and opening up. We went long Brent crude Q1 2020 futures relative to Q1 2021 to show that tensions were not resolved (Chart 17) – the attack on Saudi Arabia in September confirmed this view. And yet the oil price shock was fleeting as global supply was adequate and demand was weak. Our current long Brent spot trade is not only about Iran. Global growth is holding up and likely to rebound thanks to monetary stimulus and trade ceasefire, OPEC 2.0 has strong incentives to maintain production discipline (driven by both Saudi Arabian and Russian interests), and the Iranian conflict has led to instability in Iraq, as we expected. The UK: Not Dead In A Ditch British Prime Minister Boris Johnson proclaimed this year that he would "rather be dead in a ditch” than extend the deadline for the UK to leave the EU. The relevant constraint was that a disorderly “no deal” exit would have meant a recession, which we used as our visual illustration of why Johnson would not actually die in a ditch (Chart 18). The test was whether parliament could overcome its coordination problems when it reconvened in September, which it immediately did, prompting us to go long GBP-USD on September 6 (Chart 19). This trade was successful and we remain long GBP-JPY. Chart 18The Reason We Rejected
How Are We Doing? ... Geopolitical Strategy 2019 Report Card
How Are We Doing? ... Geopolitical Strategy 2019 Report Card
Chart 19UK Parliament Voted Down No-Deal Brexit
UK Parliament Voted Down No-Deal Brexit
UK Parliament Voted Down No-Deal Brexit
Populism faltered in Europe, as expected. As we go to press, the UK Christmas election is reported to have produced a whopping Conservative majority. This year Johnson mounted the most credible threat of a no-deal Brexit that we are ever likely to see and yet ultimately delayed Brexit. The Conservative victory will produce an orderly Brexit. The trade deal that needs to be negotiated next year will bring volatility but it does not have a firm deadline and is not harder to negotiate than Brexit itself. The UK has passed through the murkiest parts of Brexit uncertainty. Moreover, our high-conviction view that more dovish fiscal policy would be the end-result of the Brexit saga is now becoming consensus. Europe: Not The Crisis You Were Looking For The European Union was a geopolitical “red herring” in 2019 as we expected. Anti-establishment feeling remained contained. Italy remains the weakest link in the Euro Area, but the political “turmoil” of 2018-19 is the populist exception that mostly proves the rule: Europeans are not as a whole rebelling against the EU or the euro. On France, Italy, and Spain our views were fundamentally correct. Even in the European parliament, where anti-establishment players have a better chance of taking seats than in their home governments, the true Euroskeptics who want to exit the union only make up about 16% of the seats (Chart 20). This is up from 11% prior to the elections in May this year. Chart 20Euroskepticism Was Overstated
How Are We Doing? ... Geopolitical Strategy 2019 Report Card
How Are We Doing? ... Geopolitical Strategy 2019 Report Card
Yet the European political establishment is losing precious time to prepare for the next wave of serious agitation, likely when a full-fledged recession comes. Chart 21Trump Did Not Pile Tariffs Onto Auto Sector
Trump Did Not Pile Tariffs Onto Auto Sector
Trump Did Not Pile Tariffs Onto Auto Sector
Germany is experiencing a slow transition from the long reign of Angela Merkel, whose successor has plummeted in opinion polls. The shock of the global slowdown – particularly heavy in the auto sector (Chart 21) – hastened Germany’s succession crisis. Chart 22Overstated EU Political Risk, Understated Chinese Risk
Overstated EU Political Risk, Understated Chinese Risk
Overstated EU Political Risk, Understated Chinese Risk
There is a silver lining: this shock is forcing the Germans to reckon with de-globalization. Attitudes across the country are shifting on the critical question of fiscal policy. Even the conservative Christian Democrats are loosening their belts in the face of the success of the Green Party and a simultaneous change in leadership among the Social Democrats to embrace bigger spending. The Trump administration refrained from piling car tariffs onto Europe amidst this slowdown in the automobile sector and overall economy. We expected this delay, as there is little support in the US for a trade war with Europe, contra China, and it is bad strategy to fight a two-front war. But if the US economy recovers robustly and Trump is emboldened by a China deal then this risk could reignite in future. With European political risk overstated, and Chinese mainland risk understated, we initiated a long European equities relative to Chinese equities trade (Chart 22), as recommended by our colleagues at BCA Research European Investment Strategy. And now we are initiating the strategic long EUR/USD recommendation that we flagged in September with a stop at 1.18. Japan: Shinzo Abe Has Peaked Japanese Prime Minister Shinzo Abe is still in power and still very popular, whether judged by the average prime minister in modern memory or his popular predecessor Junichiro Koizumi. But he is at his peak and 2019 did indeed mark the turning point – it is all downhill from here. First, he lost his historic double super-majority in the Diet by falling to a mere majority in the upper house (Chart 23). He is still capable of revising the constitution, but now it is now harder – and the high water mark of his legislative power has been registered. Chart 23Abe Lost His Double Super Majority
How Are We Doing? ... Geopolitical Strategy 2019 Report Card
How Are We Doing? ... Geopolitical Strategy 2019 Report Card
Chart 24Consumption Tax Hike Shows Limits Of Abenomics
Consumption Tax Hike Shows Limits Of Abenomics
Consumption Tax Hike Shows Limits Of Abenomics
Second, he proceeded with a consumption tax from 8% to 10% that predictably sent the economy into a tailspin given the global slowdown (Chart 24). We thought the tax hike would be delayed, but Abe opted to hike the tax and then pass a stimulus package to compensate. This decision further supports the view that Abe’s power will decline going forward. It is now incontrovertible that the Liberal Democrats are eschewing a radical plan of debt monetization in which they coordinate ultra-dovish fiscal policy with ultra-dovish monetary policy. “Abenomics” has not necessarily failed but it is a fully known quantity. Abe will next preside over the 2020 summer Olympics and prepare to step down as Liberal Democratic party leader in September 2021. It is conceivable he will stay longer, but the likeliest successors have been put into cabinet positions, including Shinjiro Koizumi, son of the aforementioned, whom we would not rule out as a future prime minister. Constitutional revision or a Russian peace deal could mark the high point of his premiership, but the peak macro consequences have been felt. Japan suffered a literal and figurative earthquake in 2011. Over the long run Tokyo will resort to more unorthodox economic policies and redouble its efforts at reflation. But not until the external environment demands it. This suggests that the JPY-USD is a good hedge against risks to the cyclically bullish House View in 2020 and supports an overweight stance on Japanese government bonds. Emerging Markets: Notable Mentions India: We were correct that Narendra Modi would be reelected as prime minister, but we did not expect that he would win a single-party majority for a second time (Chart 25). The risk is that this result leads to hubris – particularly in foreign policy and domestic social policy – rather than accelerating structural reform. But for now we remain optimistic about reform. Chart 25
How Are We Doing? ... Geopolitical Strategy 2019 Report Card
How Are We Doing? ... Geopolitical Strategy 2019 Report Card
East Asia: We are optimistic on Southeast Asia in the context of US-China competition. But we proved overly optimistic on Malaysia and Indonesia this year, while we missed a chance to close our long Thai equity trade when it would have been very profitable to do so. Turkey: Domestic political challenges to President Recep Tayyip Erdoğan have led to a doubling down on unorthodox monetary policy and profligate fiscal policy, as expected. Early in the year we advised clients that Erdoğan would delay deployment of the Russian S-400 air defense system in deference to the US but it quickly became clear that this was not the case. Thus we correctly anticipated the sharp drop in the lira over the autumn (Chart 26). The US-Turkey relationship continues to fray and additional American sanctions are likely. Russia: President Vladimir Putin focused on maintaining domestic stability amid tight fiscal and monetary policy in 2019. This solidified our positive relative view of Russian currency and equities (Chart 27). But it also highlighted longer-term political risks. We expect this trend to continue, but by the same token Russia is a potential “Black Swan” risk in 2020. Chart 26The Lira's Autumn Relapse
The Lira's Autumn Relapse
The Lira's Autumn Relapse
Chart 27Russia's Eerie Quiet In 2019
Russia's Eerie Quiet In 2019
Russia's Eerie Quiet In 2019
Venezuela: Venezuela’s President Nicolas Maduro eked out another year of regime survival in 2019 despite our high-conviction view since 2017 that he would be finished. However, the economy is still collapsing and Russian and Chinese assistance is still limited (Chart 28). Before long the military will need to renovate the regime, even if our global growth and oil outlook for next year is positive for the regime on the margin. Chart 28Maduro Clung To Power
Maduro Clung To Power
Maduro Clung To Power
Chart 29Our 2019 Winner: Global Defense Stocks
Our 2019 Winner: Global Defense Stocks
Our 2019 Winner: Global Defense Stocks
Brazil: We were late to the Brazilian equity rally. While we have given the Jair Bolsonaro administration the benefit of the doubt, a halt to structural reforms in 2020 would prove us wrong. Our worst trade of the year was long rare earth miners, mentioned above. Our best trade was long global defense stocks (Chart 29), a structural theme stemming from the struggle of multiple powerful nations in the twenty-first century. Matt Gertken Vice President Geopolitical Strategist mattg@bcaresearch.com Roukaya Ibrahim Editor/Strategist Geopolitical Strategy RoukayaI@bcaresearch.com Ekaterina Shtrevensky Research Analyst ekaterinas@bcaresearch.com Jingnan Liu Research Associate jingnan@bcaresearch.com Marko Papic Consulting Editor marko@bcaresearch.com