Europe

Highlights The Cold War is a limited analogy for the U.S.-China conflict; In a multipolar world, complete bifurcation of trade is difficult if not impossible; History suggests that trade between rivals will continue, with minimal impediments; On a secular horizon, buy defense stocks, Europe, capex, and non-aligned countries. Feature There is a growing consensus that China and the U.S. are hurtling towards a Cold War. BCA Research played some part in this consensus – at least as far as the investment community is concerned – by publishing “Power and Politics in East Asia: Cold War 2.0?” in September 2012.1 For much of this decade, Geopolitical Strategy focused on the thesis that geopolitical risk was rotating out of the Middle East, where it was increasingly irrelevant, to East Asia, where it would become increasingly relevant. This thesis remains cogent, but it does not mean that a “Silicon Curtain” will necessarily divide the world into two bifurcated zones of capitalism. Trade, capital flows, and human exchanges between China and the U.S. will continue and may even grow. But the risk of conflict, including a military one, will not decline. In this report, we first review the geopolitical logic that underpins Sino-American tensions. We then survey the academic literature for clues on how that relationship will develop vis-à-vis trade and economic relations. The evidence from political theory is surprising and highly investment relevant. We then look back at history for clues as to what this means for investors. Our conclusion is that it is highly likely that the U.S. and China will continue to be geopolitical rivals. However, due to the geopolitical context of multipolarity, it is unlikely that the result will be “Bifurcated Capitalism.” Rather, we expect an exciting and volatile environment for investors where geopolitics takes its historical place alongside valuation, momentum, fundamentals, and macroeconomics in the pantheon of factors that determine investment opportunities and risks. The Thucydides Trap Is Real … Speaking in the Reichstag in 1897, German Foreign Secretary Bernhard von Bülow proclaimed that it was time for Germany to demand “its own place in the sun.”2 The occasion was a debate on Germany’s policy towards East Asia. Bülow soon ascended to the Chancellorship under Kaiser Wilhelm II and oversaw the evolution of German foreign policy from Realpolitik to Weltpolitik. While Realpolitik was characterized by Germany’s cautious balancing of global powers under Chancellor Otto von Bismarck, Weltpolitik saw Bülow and Wilhelm II seek to redraw the status quo through aggressive foreign and trade policy. Imperial Germany joined a long list of antagonists, from Athens to today’s People’s Republic of China, in the tragic play of human history dubbed the “Thucydides Trap.”3 Chart II-1Imperial Overstretch
Imperial Overstretch
Imperial Overstretch
The underlying concept is well known to all students of world history. It takes its name from the Greek historian Thucydides and his seminal History of the Peloponnesian War. Thucydides explains why Sparta and Athens went to war but, unlike his contemporaries, he does not moralize or blame the gods. Instead, he dispassionately describes how the conflict between a revisionist Athens and established Sparta became inevitable due to a cycle of mistrust. Graham Allison, one of America’s preeminent scholars of international relations, has argued that the interplay between a status quo power and a challenger has almost always led to conflict. In 12 out of the 16 cases he surveyed, actual military conflict broke out. Of the four cases where war did not develop, three involved transitions between countries that shared a deep cultural affinity and a respect for the prevailing institutions.4 In those cases, the transition was a case of new management running largely the same organizational structure. And one of the four non-war outcomes was nothing less than the Cold War between the Soviet Union and the U.S. The fundamental problem for a status quo power is that its empire or “sphere of influence” remains the same size as when it stood at the zenith of power. However, its decline in a relative sense leads to a classic problem of “imperial overstretch.” The hegemonic or imperial power erroneously doubles down on maintaining a status quo that it can no longer afford (Chart II-1). The challenger power is not blameless. It senses weakness in the hegemon and begins to develop a regional sphere of influence. The problem is that regional hegemony is a perfect jumping off point towards global hegemony. And while the challenger’s intentions may be limited and restrained (though they often are ambitious and overweening), the status quo power must react to capabilities, not intentions. The former are material and real, whereas the latter are perceived and ephemeral. The challenging power always has an internal logic justifying its ambitions. In China’s case today, there is a sense among the elite that the country is merely mean-reverting to the way things were for many centuries in China’s and Asia’s long history (Chart II-2). In other words, China is a “challenger” power only if one describes the status quo as the past three hundred years. It is the “established” power if one goes back to an earlier state of affairs. As such, the consensus in China is that it should not have to pay deference to the prevailing status quo given that the contemporary context is merely the result of western imperialist “challenges” to the established Chinese and regional order. Chart II-2China’s Mean Reverting Narrative
November 2019
November 2019
In addition, China has a legitimate claim that it is at least as relevant to the global economy as the U.S. and therefore deserves a greater say in global governance. While the U.S. still takes a larger share of the global economy, China has contributed 23% to incremental global GDP over the past two decades, compared to 13% for the U.S. (Chart II-3). Chart II-3The Beijing Consensus
November 2019
November 2019
Bottom Line: The emerging tensions between China and the U.S. fit neatly into the theoretical and empirical outlines of the Thucydides Trap. We do not see any way for the two countries to avoid struggle and conflict on a secular or forecastable horizon. What does this mean for investors? For one, the secular tailwinds behind defense stocks will persist. But what beyond that? Is the global economy destined to witness complete bifurcation into two armed camps separated by a Silicon Curtain? Will the Alibaba and Amazon Pacts suspiciously glare at each other the way that NATO and Warsaw Pacts did amidst the Cold War? The answer, tentatively, is no. … But It Will Not Lead To Economic Bifurcation President Trump’s aggressive trade policy also fits neatly into political theory, to a point. Realism in political science focuses on relative gains over absolute gains in all relationships, including trade. This is because trade leads to economic prosperity, prosperity to the accumulation of economic surplus, and economic surplus to military spending, research, and development. Two states that care only about relative gains due to rivalry produce a zero-sum game with no room for cooperation. It is a “Prisoner’s Dilemma” that can lead to sub-optimal economic outcomes in which both actors chose not to cooperate. Diagram II-1 illustrates the effects of relative gain calculations on the trade behavior of states. In the absence of geopolitics, demand (Q3) is satisfied via trade (Q3-Q0) due to the inability of domestic production (Q0) to meet it. Diagram II-1Trade War In A Bipolar World
November 2019
November 2019
However, geopolitical externality – a rivalry with another state – raises the marginal social cost of imports – i.e. trade allows the rival to gain more out of trade and “catch up” in terms of geopolitical capabilities. The trading state therefore eliminates such externalities with a tariff (t), raising domestic output to Q1, while shrinking demand to Q2, thus reducing imports to merely Q2-Q1, a fraction of where they would be in a world where geopolitics do not matter. The dynamic of relative gains can also have a powerful pull on the hegemon as it begins to weaken and rethink its originally magnanimous trade relations. As political scientist Duncan Snidal argued in a 1991 paper, When the global system is first set up, the hegemon makes deals with smaller states. The hegemon is concerned more with absolute gains, smaller states are more concerned with relative, so they are tougher negotiators. Cooperative arrangements favoring smaller states contribute to relative hegemonic decline. As the unequal distribution of benefits in favor of smaller states helps them catch up to the hegemonic actor, it also lowers the relative gains weight they place on the hegemonic actor. At the same time, declining relative preponderance increases the hegemonic state’s concern for relative gains with other states, especially any rising challengers. The net result is increasing pressure from the largest actor to change the prevailing system to gain a greater share of cooperative benefits.5 The reason small states are initially more concerned with relative gains is because they are far more concerned with national security than the hegemon. The hegemon has a preponderance of power and is therefore more relaxed about its security needs. This explains why Presidents George Bush Sr., Bill Clinton, and George Bush Jr. all made “bad deals” with China. Writing nearly thirty years ago, Snidal cogently described the current U.S.-China trade war. Snidal thought he was describing a coming decade of anarchy. But he and fellow political scientists writing in the early 1990s underestimated American power. The “unipolar moment” of American supremacy was not over, it was just beginning! As such, the dynamic Snidal described took thirty years to come to fruition. When thinking about the transition away from U.S. hegemony, most investors anchor themselves to the Cold War as it is the only world they have known that was not unipolar. Moreover the Cold War provides a simple, bipolar distribution of power that is easy to model through game theory. If this is the world we are about to inhabit, with the U.S. and China dividing the whole planet into spheres like the U.S. and Soviet Union, then the paragraph we lifted from Snidal’s paper would be the end of it. America would abandon globalization in totality, impose a draconian Silicon Curtain around China, and coerce its allies to follow suit. But most of recent human history has been defined by a multipolar distribution of power between states, not a bipolar one. The term “cold war” is applicable to the U.S. and China in the sense that comparable military power may prevent them from fighting a full-blown “hot war.” But ultimately the U.S.-Soviet Cold War is a poor analogy for today’s world. In a multipolar world, Snidal concludes, “states that do not cooperate fall behind other relative gains maximizers that cooperate among themselves. This makes cooperation the best defense (as well as the best offense) when your rivals are cooperating in a multilateral relative gains world.” Snidal shows via formal modeling that as the number of players increases from two, relative-gains sensitivity drops sharply.6 The U.S.-China relationship does not occur in a vacuum — it is moderated by the global context. Today’s global context is one of multipolarity. Multipolarity refers to the distribution of geopolitical power, which is no longer dominated by one or two great powers (Chart II-4). Europe and Japan, for instance, have formidable economies and military capabilities. Russia remains a potent military power, even as India surpasses it in terms of overall geopolitical power. Chart II-4The World Is No Longer Bipolar
The World Is No Longer Bipolar
The World Is No Longer Bipolar
A multipolar world is the least “ordered” and the most unstable of world systems (Chart II-5). This is for three reasons: Chart II-5Multipolarity Is Messy
Multipolarity Is Messy
Multipolarity Is Messy
Math: Multipolarity engenders more potential “conflict dyads” that can lead to conflict. In a unipolar world, there is only one country that determines norms and rules of behavior. Conflict is possible, but only if the hegemon wishes it. In a bipolar world, conflict is possible, but it must align along the axis of the two dominant powers. In a multipolar world, alliances are constantly shifting and producing novel conflict dyads. Lack of coordination: Global coordination suffers in periods of multipolarity as there are more “veto players.” This is particularly problematic during times of stress, such as when an aggressive revisionist power uses force or when the world is faced with an economic crisis. Charles Kindleberger has argued that it was exactly such hegemonic instability that caused the Great Depression to descend into the Second World War in his seminal The World In Depression.7 Mistakes: In a unipolar and bipolar world, there are a very limited number of dice being rolled at once. As such, the odds of tragic mistakes are low and can be mitigated with complex formal relationships (such as U.S.-Soviet Mutually Assured Destruction, grounded in formal modeling of game theory). But in a multipolar world, something as random as an assassination of a dignitary can set in motion a global war. The multipolar system is far more dynamic and thus unpredictable. Diagram II-2 is modified for a multipolar world. Everything is the same, except that we highlight the trade lost to other great powers. The state considering using tariffs to lower the marginal social cost of trading with a rival must account for this “lost trade.” In the context of today’s trade war with China, this would be the sum of all European Airbuses and Brazilian soybeans sold to China in the place of American exports. For China, it would be the sum of all the machinery, electronics, and capital goods produced in the rest of Asia and shipped to the United States. Diagram II-2Trade War In A Multipolar World
November 2019
November 2019
Could Washington ask its allies – Europe, Japan, South Korea, Taiwan, etc. – not to take advantage of the lucrative trade (Q3-Q0)-(Q2-Q1) lost due to its trade tiff with China? Sure, but empirical research shows that they would likely ignore such pleas for unity. Alliances produced by a bipolar system produce a statistically significant and large impact on bilateral trade flows, a relationship that weakens in a multipolar context. This is the conclusion of a 1993 paper by Joanne Gowa and Edward D. Mansfield.8 The authors draw their conclusion from an 80-year period beginning in 1905, which captures several decades of global multipolarity. Unless the U.S. produces a wholehearted diplomatic effort to tighten up its alliances and enforce trade sanctions – something hardly foreseeable under the current administration – the self-interest of U.S. allies will drive them to continue trading with China. The U.S. will not be able to exclude China from the global system; nor will China be able to achieve Xi Jinping’s vaunted “self-sufficiency.” A risk to our view is that we have misjudged the global system, just as political scientists writing in the early 1990s did. To that effect, we accept that Charts II-1 and II-4 do not really support a view that the world is in a balanced multipolar state. The U.S. clearly remains the most powerful country in the world. The problem is that it is also clearly in a relative decline and that its sphere of influence is global – and thus very expensive – whereas its rivals have merely regional ambitions (for the time being). As such, we concede that American hegemony could be reasserted relatively quickly, but it would require a significant calamity in one of the other poles of power. For instance, a breakdown in China’s internal stability alongside the recovery of U.S. political stability. Bottom Line: The trade war between the U.S. and China is geopolitically unsustainable. The only way it could continue is if the two states existed in a bipolar world where the rest of the states closely aligned themselves behind the two superpowers. We have a high conviction view that today’s world is – for the time being – multipolar. American allies will cheat and skirt around Washington’s demands that China be isolated. This is because the U.S. no longer has the preponderance of power that it enjoyed in the last decade of the twentieth and the first decade of the twenty-first century. Insights presented thus far come from formal theory in political science. What does history teach us? Trading With The Enemy In 1896, a bestselling pamphlet in the U.K., “Made in Germany,” painted an ominous picture: “A gigantic commercial State is arising to menace our prosperity, and contend with us for the trade of the world.”9 Look around your own houses, author E.E. Williams urged his readers. “The toys, and the dolls, and the fairy books which your children maltreat in the nursery are made in Germany: nay, the material of your favorite (patriotic) newspaper had the same birthplace as like as not.” Williams later wrote that tariffs were the answer and that they “would bring Germany to her knees, pleading for our clemency.”10 By the late 1890s, it was clear to the U.K. that Germany was its greatest national security threat. The Germany Navy Laws of 1898 and 1900 launched a massive naval buildup with the singular objective of liberating the German Empire from the geographic constraints of the Jutland Peninsula. By 1902, the First Lord of the Royal Navy pointed out that “the great new German navy is being carefully built up from the point of view of a war with us.”11 There is absolutely no doubt that Germany was the U.K.’s gravest national security threat. As a result, London signed in April 1904 a set of agreements with France that came to be known as Entente Cordiale. The entente was immediately tested by Germany in the 1905 First Moroccan Crisis, which only served to strengthen the alliance. Russia was brought into the pact in 1907, creating the Triple Entente. In hindsight, the alliance structure was obvious given Germany’s meteoric rise from unification in 1871. However, one should not underestimate the magnitude of these geopolitical events. For the U.K. and France to resolve centuries of differences and formalize an alliance in 1904 was a tectonic shift — one that they undertook against the grain of history, entrenched enmity, and ideology.12 Political scientists and historians have noted that geopolitical enmity rarely produces bifurcated economic relations exhibited during the Cold War. Both empirical research and formal modeling shows that trade occurs even amongst rivals and during wartime.13 This was certainly the case between the U.K. and Germany, whose trade steadily increased right up until the outbreak of World War One (Chart II-6). Could this be written off due to the U.K.’s ideological commitment to laissez-faire economics? Or perhaps London feared a move against its lightly defended colonies in case it became protectionist? These are fair arguments. However, they do not explain why Russia and France both saw ever-rising total trade with the German Empire during the same period (Chart II-7). Either all three states were led by incompetent policymakers who somehow did not see the war coming – unlikely given the empirical record – or they simply could not afford to lose out on the gains of trade with Germany to each other. Chart II-6The Allies Traded With Germany ...
November 2019
November 2019
Chart II-7… Right Up To WWI
November 2019
November 2019
Chart II-8Japan And U.S. Never Downshifted Trade
November 2019
November 2019
A similar dynamic was afoot ahead of World War Two. Relations between the U.S. and Japan soured in the 1930s, with the Japanese invasion of Manchuria in 1931. In 1935, Japan withdrew from the 1922 Washington Naval Treaty – the bedrock of the Pacific balance of power – and began a massive naval buildup. In 1937, Japan invaded China. Despite a clear and present danger, the U.S. continued to trade with Japan right up until July 26, 1941, few days after Japan invaded southern Indochina (Chart II-8). On December 7, Japan attacked the U.S. A skeptic may argue that precisely because policymakers sleepwalked into war in the First and Second World Wars, they will not (or should not) make the same mistake this time around. First, we do not make policy prescriptions and therefore care not what should happen. Second, we are highly skeptical of the view that policymakers in the early and mid-twentieth century were somehow defective (as opposed to today’s enlightened leaders). Our constraints-based framework urges us to seek systemic reasons for the behavior of leaders. Political science provides a clear theoretical explanation for why London and Washington continued to trade with the enemy despite the clarity of the threat. The answer lies in the systemic nature of the constraint: a multipolar world reduces the sensitivity of policymakers to relative gains by introducing a collective action problem thanks to changing alliances and the difficulty of disciplining allies’ behavior. In the case of U.S. and China, this is further accentuated by President Trump’s strategy of skirting multilateral diplomacy and intense focus on mercantilist measures of power (i.e. obsession with the trade deficit). An anti-China trade policy that was accompanied by a magnanimous approach to trade relations with allies could have produced a “coalition of the willing” against Beijing. But after two years of tariffs and threats against the EU, Japan, and Canada, the Trump administration has already signaled to the rest of the world that old alliances and coordination avenues are up for revision. There are two outcomes that we can see emerging over the course of the next decade. First, U.S. leadership will become aware of the systemic constraints under which they operate, and trade with China will continue – albeit with limitations and variations. However, such trade will not reduce the geopolitical tensions, nor will it prevent a military conflict. In facts, the probability of military conflict may increase even as trade between China and the U.S. remains steady. Second, U.S. leadership will fail to correctly assess that they operate in a multipolar world and will give up the highlighted trade gains from Diagram II-2 to economic rivals such as Europe and Japan. Given our methodological adherence to constraint-based forecasting, we highly doubt that the latter scenario is likely. Bottom Line: The China-U.S. conflict is not a replay of the Cold War. Systemic pressures from global multipolarity will force the U.S. to continue to trade with China, with limitations on exchanges in emergent, dual-use technologies that China will nonetheless source from other technologically advanced countries. This will create a complicated but exciting world where geopolitics will cease to be seen as exogenous to investing. A risk to the sanguine conclusion is that the historical record is applicable to today, but that the hour is late, not early. It is already July 26, 1941 – when U.S. abrogated all trade with Japan – not 1930. As such, we do not have another decade of trade between U.S. and China remaining, we are at the end of the cycle. While this is a risk, it is unlikely. American policymakers would essentially have to be willing to risk a military conflict with China in order to take the trade war to the same level they did with Japan. It is an objective fact that China has meaningfully stepped up aggressive foreign policy in the region. But unlike Japan in 1941, China has not outright invaded any countries over the past decade. As such, the willingness of the public to support such a conflict is unclear, with only 21% of Americans considering China a top threat to the U.S. Investment Implications This analysis is not meant to be optimistic. First, the U.S. and China will continue to be rivals even if the economic relationship between them does not lead to global bifurcation. For one, China continues to be – much like Germany in the early twentieth century – concerned with access to external markets on which 19.5% of its economy still depend. China is therefore developing a modern navy and military not because it wants to dominate the rest of the world but because it wants to dominate its near abroad, much as the U.S. wanted to, beginning with the Monroe Doctrine. This will continue to lead to Chinese aggression in the South and East China Seas, raising the odds of a conflict with the U.S. Navy. Given that the Thucydides Trap narrative remains cogent, investors should look to overweight S&P 500 aerospace and defense stocks relative to global equity markets. An alternative way that one could play this thesis is by developing a basket of global defense stocks. Multipolarity may create constraints to trade protectionism, but it engenders geopolitical volatility and thus buoys defense spending. Second, we would not expect another uptick in globalization. Multipolarity may make it difficult for countries to completely close off trade with a rival, but globalization is built on more than just trade between rivals. Globalization requires a high level of coordination among great powers that is only possible under hegemonic conditions. Chart II-9 shows that the hegemony of the British and later American empires created a powerful tailwind for trade over the past two hundred years. Chart II-9The Apex Of Globalization Is Behind Us
The Apex Of Globalization Is Behind Us
The Apex Of Globalization Is Behind Us
The Apex of Globalization has come and gone – it is all downhill from here. But this is not a binary view. Foreign trade will not go to zero. The U.S. and China will not completely seal each other’s sphere of influence behind a Silicon Curtain. Instead, we focus on five investment themes that flow from a world that is characterized by the three trends of multipolarity, Sino-U.S. geopolitical rivalry, and apex of globalization: Europe will profit: As the U.S. and China deepen their enmity, we expect some European companies to profit. There is some evidence that the investment community has already caught wind of this trend, with European equities modestly outperforming their U.S. counterparts whenever trade tensions flared up in 2019 (Chart II-10). Given our thesis, however, it is unlikely that the U.S. would completely lose market share in China to Europe. As such, we specifically focus on tech, where we expect the U.S. and China to ramp up non-tariff barriers to trade regardless of systemic pressures to continue to trade. A strategic long in the secularly beleaguered European tech companies relative to their U.S. counterparts may therefore make sense (Chart II-11). Chart II-10Europe: A Trade War Safe Haven
Europe: A Trade War Safe Haven
Europe: A Trade War Safe Haven
Chart II-11Is Europe Really This Incompetent?
Is Europe Really This Incompetent?
Is Europe Really This Incompetent?
USD bull market will end: A trade war is a very disruptive way to adjust one’s trade relationship. It opens one to retaliation and thus the kind of relative losses described in this analysis. As such, we expect that U.S. to eventually depreciate the USD, either by aggressively reversing 2018 tightening or by coercing its trade rivals to strengthen their currencies. Such a move will be yet another tailwind behind the diversification away from the USD as a reserve currency, a move that should benefit the euro. Bull market in capex: The re-wiring of global manufacturing chains will still take place. The bad news is that multinational corporations will have to dip into their profit margins to move their supply chains to adjust to the new geopolitical reality. The good news is that they will have to invest in manufacturing capex to accomplish the task. One way to articulate this theme is to buy an index of semiconductor capital companies (AMAT, LRCX, KLAC, MKSI, AEIS, BRIKS, and TER). Given the highly cyclical nature of capital companies, we would recommend an entry point once trade tensions subside and green shoots of global growth appear. “Non-aligned” markets will benefit: The last time the world was multipolar, great powers competed through imperialism. This time around, a same dynamic will develop as countries seek to replicate China’s “Belt and Road Initiative.” This is positive for frontier markets. A rush to provide them with exports and services will increase supply and thus lower costs, providing otherwise forgotten markets with a boon of investments. India, and Asia-ex-China more broadly, stand as intriguing alternatives to China, especially with the current administration aggressively reforming to take advantage of the rewiring of global manufacturing chains. Capital markets will remain globalized: With interest rates near zero in much of the developed world and the demographic burden putting an ever-greater pressure on pension plans to generate returns, the search for yield will continue to be a powerful drive that keeps capital markets globalized. Limitations are likely to grow, especially when it comes to cross-border private investments in dual-use technologies. But a completely bifurcation of capital markets is unlikely. The world we are describing is one where geopolitics will play an increasingly prominent role for global investors. It would be convenient if the world simply divided into two warring camps, leaving investors with neatly separated compartments that enabled them to go back to ignoring geopolitics. This is unlikely. Rather, the world will resemble the dynamic years at the end of the nineteenth century, a rough-and-tumble era that required a multi-disciplinary approach to investing. Marko Papic Consulting Editor, BCA Research Chief Strategist, Clocktower Group Footnotes 1 Please see BCA Research Geopolitical Strategy, “Power And Politics In East Asia: Cold War 2.0?,” September 25, 2012, “Sino-American Conflict: More Likely Than You Think,” October 4, 2013, “The Great Risk Rotation,” December 11, 2013, and “Strategic Outlook 2014 – Stay The Course: EM Risk – DM Reward,” January 23, 2014, “Underestimating Sino-American Tensions,” November 6, 2015, “The Geopolitics Of Trump,” December 2, 2016, “How To Play The Proxy Battles In Asia,” March 1, 2017, and others available at gps.bcaresearch.com or upon request. 2 Please see German Historical Institute, “Bernhard von Bulow on Germany’s ‘Place in the Sun’” (1897), available at http://germanhistorydocs.ghi-dc.org/ 3 See Graham Allison, Destined For War: Can America and China Escape Thucydides’s Trap? (New York: Houghton Miffin Harcourt, 2017). 4 The three cases are Spain taking over from Portugal in the sixteenth century, the U.S. taking over from the U.K. in the twentieth century, and Germany rising to regional hegemony in Europe in the twenty-first century. 5 Duncan Snidal, “Relative Gains and the Pattern of International Cooperation,” The American Political Science Review, 85:3 (September 1991), pp. 701-726. 6 We do not review Snidal’s excellent game theory formal modeling in this paper as it is complex and detailed. However, we highly encourage the intrigued reader to pursue the study on their own. 7 See Charles P. Kindleberger, The World In Depression, 1929-1939 (Berkeley: University of California Press, 2013). 8 Joanne Gowa and Edward D. Mansfield, “Power Politics and International Trade,” The American Political Science Review, 87:2 (June 1993), pp. 408-420. 9 See Ernest Edwin Williams, Made in Germany (reprint, Ithaca: Cornell University Press), available at https://archive.org/details/cu31924031247830. 10 Quoted in Margaret MacMillan, The War That Ended Peace (Toronto: Allen Lane, 2014). 11 Peter Liberman, “Trading with the Enemy: Security and Relative Economic Gains,” international Security, 21:1 (Summer 1996), pp. 147-175. 12 Although France and Russia overcame even greater bitterness due to the ideological differences between a republic founded on a violent uprising against its aristocracy – France – and an aristocratic authoritarian regime – Russia. 13 See James Morrow, “When Do ‘Relative Gains’ Impede Trade?” The Journal of Conflict Resolution, 41:1 (February 1997), pp. 12-37; and Jack S. Levy and Katherine Barbieri, “Trading With the Enemy During Wartime,” Security Studies, 13:3 (December 2004), pp. 1-47.
Highlights Declining uncertainty over policy, stabilizing growth in China and improvements in international liquidity, all will allow global economic activity to pick up in the months ahead. A weak dollar will reinforce this positive economic outlook; investors should favor pro-cyclical currencies such as the AUD, NZD and SEK. Bond yields will rise and stocks will outperform bonds on a 12- to 18-month basis. Cyclical stocks are more attractive than defensives. European stocks will outperform U.S. equities and European financials will shine. Copper is a promising buy; stay long the silver-to-gold ratio. Feature The outlook for risk assets and bond yields hinges on global economic activity. The S&P 500 has hit a new high, but our BCA Equity Scorecard Indicator remains non-committal towards stocks (Chart I-1). If global economic activity improves, the Scorecard will begin to flash a clear buy signal, but if growth deteriorates, the indicator will point towards sell. Chart I-1Stocks Could Go Either Way
Stocks Could Go Either Way
Stocks Could Go Either Way
Cautious optimism is in order. Politics, China, liquidity conditions and the dollar collectively will determine the global economic outlook. The liquidity backdrop has significantly improved, political uncertainty should recede and China will morph from a headwind to a modest tailwind. A weak dollar will indicate that the world is healing, and also will ease global financial conditions which will facilitate economic strength. We remain committed to a positive stance on equities on a 12- to 18-month horizon, and recommend below-benchmark duration in fixed-income portfolios. Cyclicals should outperform defensives, European banks offer an attractive tactical buying opportunity and European equities will outperform their U.S. counterparts. Heightened Risks… Chart I-2Risks To The Economy And Stocks
Risks To The Economy And Stocks
Risks To The Economy And Stocks
Many domestic indicators overstate the intrinsic fragility in the U.S. The Duncan LEI, which is the ratio of consumer durable spending and residential and business investment to final sales, has flattened. Therefore, the S&P 500 looks vulnerable and real GDP may contract (Chart I-2). CEO confidence and small business capex intentions warn of a looming retrenchment in household income (Chart I-2, bottom two panels). If consumer spending weakens, then a recession will be unavoidable. As worrisome as these indicators may be, we previously discussed that the major debt imbalances that often precede U.S. recessions are absent,1 the rebound in housing starts and homebuilding confidence is inconsistent with a restrictive monetary stance,2 and pipeline inflationary pressures are absent.3 Instead, business confidence and the Duncan LEI have been eroded by heightened political uncertainty and weak global manufacturing and trade. … Meet Receding Policy Uncertainty … The two biggest sources of policy uncertainty affecting markets, the Sino-U.S. trade war and Brexit, are diminishing. However, the U.S. election will continue to lurk in the background. Chart I-3Weaker Brexit Support = No Hard Brexit Support
Weaker Brexit Support = No Hard Brexit Support
Weaker Brexit Support = No Hard Brexit Support
Brexit Westminster and Britain’s Supreme Court have rebuked U.K. Prime Minister Boris Johnson’s threat of a “No-Deal” Brexit. Moreover, parliamentary support for his latest plan, which essentially keeps Northern Ireland’s economy within the EU, indicates that the probability of a “No-Deal” Brexit has collapsed to less than 5%. This assessment is reinforced by the delay of Brexit to January 31, 2020. An election is scheduled for December 12 and the chance of a new referendum to vet the deal is escalating. According to Matt Gertken, BCA’s Geopolitical Strategist, an election does not increase the risk of a hard Brexit. Meanwhile, support for Brexit is near its lowest point since the June 2016 referendum (Chart I-3). Thus, a new plebiscite would not favor a “No Deal” Brexit. Sino-U.S. Trade War Chart I-4Why The Trade-War Ceasefire?
Why The Trade-War Ceasefire?
Why The Trade-War Ceasefire?
The trade war truce will also greatly diminish economic uncertainty. Uncertainty created by the China-U.S. conflict accentuated the collapse in business confidence and capex intentions. The “phase one deal” announced earlier this month will likely materialize. The White House’s tactical retreat on trade is tied to U.S. President Donald Trump’s desire for a second term. He cannot risk inflicting further economic pain on his base of constituents. Weekly earnings are decreasing for workers in swing states located in the industrial rust belt, especially in those areas that Trump carried in 2016 (Chart I-4). Those swing states are most affected by the slowdown in the global manufacturing and trade sectors. Beijing is also motivated to agree to truce due to its soft economy and deflationary pressures. An easing in trade uncertainty will be positive for the domestic economy. China’s willingness to replace Carrie Lam, the embattled Chief Executive of Hong Kong, and to withdraw the extradition bill at the heart of the protests confirms its eagerness to come to an agreement with the U.S. China’s readiness to make a deal is also made evident by its increasing imports of U.S. agricultural products (Chart I-4, bottom panel). Ultimately, the U.S. will not implement tariffs in December on $160 billion of Chinese shipments. Consequently, investors and businesses should become less concerned about the chances of a worsening trade war. Moreover, chances are growing of a decrease (but not a complete annulation) of the previously imposed U.S. tariffs on China. … And A Q1 2020 Acceleration In Global Growth Global economic activity will improve in Q1 2020 because the drag from China will dissipate and global liquidity conditions will improve. Many activity indicators increasingly reflect these fundamental supports. China China’s economy has reached a new low point: Q3 annual GDP growth is at a 27-year low of 6%, capital spending is weak, industrial production and profits show little life, the labor market is soft, and imports and exports continue to contract. However, a turn in policy has materialized, which will protect the domestic economy. Moreover, this summer’s Politburo and State Council statements showed an increased willingness to reflate the economy. The global economy will accelerate in Q1 2020. Credit creation has stabilized and monetary conditions have eased (Chart I-5). Faced with producer price inflation of -1.2% and employment PMIs of 47.3 and 48.2 in the manufacturing and non-manufacturing sectors, respectively, authorities have allowed the credit impulse to improve to 26% of GDP from a low of 23.8%. In accordance with this new policy direction, the drag from the shadow banking system’s contraction will slow considerably, thanks to a stabilization in both the growth rate of deposits of non-depository financial institutions and the issuance of bonds by small financial institutions. Additionally, the emission of local government bonds will accelerate. Beijing has also meaningfully eased fiscal policy, which is its preferred reflationary tool. Policymakers have cut taxes by 2.8% of GDP in the past two years. The marginal propensity of households to consume is trying to bottom (Chart I-5, bottom). If history is a guide, the acceleration in the rate of change of public-sector capex will fuel this turnaround in China’s marginal propensity to consume, and push up BCA’s China Activity Indicator (Chart I-6). Chart I-5Overlooked Chinese Improvements
Overlooked Chinese Improvements
Overlooked Chinese Improvements
Chart I-6Public Investment Matters
Public Investment Matters
Public Investment Matters
Chart I-7A Bottom In Chinese Exports Growth?
A Bottom In Chinese Exports Growth?
A Bottom In Chinese Exports Growth?
China’s economy is unlikely to bounce back as violently as in 2009, 2012 or 2016. Authorities are much more circumspect in their use of credit to reflate the economy than they were previously. Moreover, the regulatory environment will prevent a boom in the shadow banking system. Nonetheless, the fiscal push and the end of the decline in aggregate credit growth will allow the Chinese economy to stabilize and maybe pick up a bit. Therefore, China will move from a large headwind to a slight tailwind for global activity (Chart I-7, top panel). Mounting public capex also points toward a modest global recovery (Chart I-7, middle panel). Finally, the upturn in our Chinese reflation indicator, which incorporates both fiscal and monetary policy, points to a re-acceleration in U.S. capex intentions (Chart I-7, bottom panel). Global Liquidity Global liquidity conditions continue to improve and the global economy should soon respond within normal policy lags. 95% of central banks are loosening policy, which normally leads to an escalation in global activity (Chart I-8). The dominant central banks (the Federal Reserve, the European Central Bank and the Bank of Japan) will not tighten anytime soon. Inflation expectations in the U.S., the euro area and Japan stand at 1.9%, 1.1%, and 0.2%, respectively, well below levels consistent with a 2% inflation target. Moreover, U.S. core CPI has been perky, but both the ISM and the performance of transportation equities relative to utilities indicate that a deceleration in inflation is imminent (Chart I-9). Salaries are not yet inflationary either because U.S. real wages are growing in line with productivity (Chart I-9, bottom panel). In the euro area and Japan, realized core inflation remains at 1.0% and 0.5%, respectively, and supports the dovish message emanating from inflation expectations. Chart I-8Easier Global Policy Is Important
Easier Global Policy Is Important
Easier Global Policy Is Important
Chart I-9If Inflation Peaks, The U.S. Economy Will Breath A Sigh Of Relief
If Inflation Peaks, The U.S. Economy Will Breath A Sigh Of Relief
If Inflation Peaks, The U.S. Economy Will Breath A Sigh Of Relief
Liquidity indicators are reflecting this accommodative policy setting. The growth of U.S. and European bank deposits has reaccelerated from 2.5% to 6%, a development linked to the exit of a soft patch (Chart I-10). Moreover, BCA’s U.S. Financial Liquidity Indicator is still moving higher and flashing a resurgence in the BCA Global Leading Economic Indicator (LEI), the ISM Manufacturing Index, commodity prices, and EM export prices (Chart I-11). Finally, U.S. and global excess money reinforce the message of BCA’s U.S. Financial liquidity Indicator (Chart I-12). Chart I-10Deposits Suggest The Worst Of The Slowdown Is Behind Us
Deposits Suggest The Worst Of The Slowdown Is Behind Us
Deposits Suggest The Worst Of The Slowdown Is Behind Us
Chart I-11Continued Pick-Up In Financial Liquidity
Continued Pick-Up In Financial Liquidity
Continued Pick-Up In Financial Liquidity
The Fed will add to the supply of global liquidity by tackling the repo market’s seize-up. Depleting excess reserves and mounting financing needs among primary dealers resulted in the September surge in the Secured Overnight Financing Rate (SOFR). The Fed announced three weeks ago it would buy $60 billion per month of T-Bills and T-Notes, which will lead to a climbing stock of excess reserves. Higher excess reserves create a weaker dollar, stronger EM currencies and firming global PMIs (Chart I-13). Ultimately, EM currency strength eases EM financial conditions, which supports global growth (Chart I-13, bottom panel). Chart I-12Excess Liquidity Is Accelerating
Excess Liquidity Is Accelerating
Excess Liquidity Is Accelerating
Chart I-13U.S. Excess Reserves Will Grow Again
U.S. Excess Reserves Will Grow Again
U.S. Excess Reserves Will Grow Again
Borrowing activity in Advanced Economies is showing signs of life. Bank credit is already responding to the drop in global yields, and global corporate bond issuance in September 2019 rose to $434 billion. In the U.S., new issues of corporate bonds have also reaccelerated (Chart I-14). Global Growth Indicators Crucial indicators of global economic activity are picking up on this improving fundamental backdrop. The list includes: A sharp takeoff in the annualized three-month rate of change of capital goods orders in the U.S., the Eurozone and Japan (Chart I-15, top panel). Improvement in this indicator precedes progress in the annual growth rate of orders and in capex itself. Chart I-14Borrowers Are Responding To Easier Financial Conditions
Borrowers Are Responding To Easier Financial Conditions
Borrowers Are Responding To Easier Financial Conditions
Chart I-15Some Green Shoots Are Coming Through
Some Green Shoots Are Coming Through
Some Green Shoots Are Coming Through
Chart I-16Positive Market Signals
Positive Market Signals
Positive Market Signals
A significant upturn in the Philly Fed, Empire State, and Richmond Fed manufacturing surveys for October, which sends a positive signal for the ISM Manufacturing Index (Chart I-15, second panel). Moreover, the new orders and employment components of these surveys indicate that cyclical sectors of the economy will recover and the recent deterioration in employment conditions will be fleeting. A rebound in BCA’s EM economic diffusion index, which incorporates 23 variables. Such an increase usually precedes inflections in global industrial production (Chart I-15, bottom panel). An acceleration – both in absolute and relative terms - in the annual appreciation of Taiwanese stocks. A strong and outperforming Taiwanese equity market is a harbinger of firmer PMIs (Chart I-16, top two panels). A solid performance of EM carry trades financed in yen, European luxury equities, and the relative performance of global semiconductors, materials and industrial stocks, which signal stronger global PMIs (Chart I-16, bottom three panels). Bottom Line: The global economy will accelerate in Q1 2020. A melting probability of a “No-Deal” Brexit and a truce in the Sino-U.S. trade war will allow global uncertainty to recede. Concurrently, China’s economic slowdown is ending and global liquidity conditions are improving. The Dollar As The Arbiter Of Growth Chart I-17The Dollar Is A Counter-Cyclical Currency
The Dollar Is A Counter-Cyclical Currency
The Dollar Is A Counter-Cyclical Currency
The dollar faces potent headwinds. The greenback is a countercyclical currency; a business cycle upswing and a weak USD go hand in hand (Chart I-17). The tightness of this relationship results from a powerful feedback loop: weak growth boosts the dollar, but the dollar’s strength foments additional economic slowdown. Global liquidity and activity indicators signal a weaker dollar because they point toward an economic recovery. BCA’s U.S. Financial Liquidity Index, which foresaw a deceleration in the greenback’s rate of appreciation, is calling for an outright depreciation (Chart I-18, top panel). The expanding holdings of securities on U.S. commercial banks’ balance sheets (a key measure of liquidity) corroborates this message. According to a model based on the U.S., Eurozone, Japanese and Chinese broad money supply, the USD should significantly depreciate in the coming 12 months (Chart I-18, third panel). Finally, our EM Economic Diffusion Index validates pressures on the greenback, especially against commodity currencies (Chart I-18, bottom two panels). Chart I-18Liquidity And Growth Indicators Point To A Weaker Dollar
Liquidity And Growth Indicators Point To A Weaker Dollar
Liquidity And Growth Indicators Point To A Weaker Dollar
Growth differentials support this picture. Late last year, the stimulating effect of President Trump’s tax cuts allowed the U.S. to temporarily diverge from a weak global economy, but the U.S. manufacturing sector is now succumbing to the global slowdown. Once global growth snaps back, the U.S. is likely to lag behind as fiscal policy is becoming more stimulative outside the U.S. than in the U.S. Based on historical delays, this will continue to hurt the dollar (Chart I-19, top panel). Finally, the European economy generally outperforms the U.S. when China reflates, especially if Beijing’s push lifts the growth rate of M1 relative to M2, a proxy for China’s aggregate marginal propensity to consume (Chart I-20). Europe’s greater cyclicality reflects is larger exposure to both trade and manufacturing compared with the U.S. Chart I-19A Global Growth Convergence Will Hurt The Dollar
A Global Growth Convergence Will Hurt The Dollar
A Global Growth Convergence Will Hurt The Dollar
Chart I-20European Growth To Rise Vis-A-Vis The U.S.
European Growth To Rise Vis-A-Vis The U.S.
European Growth To Rise Vis-A-Vis The U.S.
The greenback is expensive and technically vulnerable, which compounds its cyclical risk. The trade-weighted dollar is at a 25% premium to its purchasing power parity equilibrium (PPP), an overvaluation comparable to its 1985 and 2002 peaks. Moreover, our Composite Technical Indicator is overextended and has formed a negative divergence with the price of the dollar (see page 54, Section III). Finally, speculators are massively long the U.S. Dollar Index (DXY). Balance-of-payment flows also flash a significant downside in the dollar (Chart I-21). The U.S. current account deficit stands at 2.5% of GDP, but it is widening in response to the dollar’s overvaluation and the White House’s expansive fiscal policy. Since 2011, foreign direct investments (FDI) have been the main driver of the dollar’s gyrations. Last year, net FDI surged in response to profit repatriations encouraged by the Tax Cuts and Jobs Act of 2017, while portfolio flows stayed in neutral territory. This regulatory change had a one-off impact and FDI will begin to dry out. Therefore, financing the widening current account deficit will become harder. Finally, after years in the red, net portfolio flows into Europe have turned positive (Chart I-21, bottom panel). The USD’s depreciation will ease global financial conditions and supports growth further. In this context, interest rate differentials are noteworthy. The two-year spread in real rates between the U.S. and the rest of the G-10 has fallen significantly since October 2018. Reversals in real rates herald a weaker dollar, especially when it faces valuation, technical and flow handicaps. Moreover, European five-year forward short rate expectations are near record lows. If global growth can stabilize, then the five-year forward one-month OIS will pick up, especially relative to the U.S. An uptick will boost the EUR/USD pair and hurt the dollar (Chart I-22). Chart I-21Balance-Of-Payments Dynamics Turning Against The USD
Balance-Of-Payments Dynamics Turning Against The USD
Balance-Of-Payments Dynamics Turning Against The USD
Chart I-22Relative Long-Term Rate Expectations And The Euro
Relative Long-Term Rate Expectations And The Euro
Relative Long-Term Rate Expectations And The Euro
The three most pro-cyclical currencies in the G-10 – the AUD, NZD and SEK - strengthen the most when BCA’s Global LEI bottoms but global inflation slows (Chart I-23). The GBP will likely generate a much stronger-than-normal performance next year. Cable trades at a 22% discount to PPP. It is also 19% cheap versus short-term interest rate parity models. The absence of a “No-Deal” Brexit should allow these risk premia to dissipate and the pound to recover. The CAD is also more attractive than Chart I-23 implies. The loonie is trading 10% below its PPP, and the USD/CAD often lags the EUR/CAD, a pair that has broken down (Chart I-24). Chart I-23Currency Performance As A Function Of Growth And Inflation
November 2019
November 2019
Chart I-24EUR/CAD Flashing A Bearish USD/CAD Signal
EUR/CAD Flashing A Bearish USD/CAD Signal
EUR/CAD Flashing A Bearish USD/CAD Signal
Bottom Line: A rebound in the global manufacturing sector next year will hurt the USD. The dollar is particularly vulnerable because growth differentials between the U.S. and the rest of the world have melted, the greenback is expensive, balance-of-payment dynamics are deteriorating and interest rate differentials are becoming less supportive. The USD’s depreciation will ease global financial conditions and supports growth further. Additional Investment Implications Bond Yields Have More Upside While the short-term outlook for bonds remains murky, the 12- to 18-month outlook is unambiguously bearish. The BCA Bond Valuation Index is still consistent with much higher U.S. yields in the next 12-18 months (see Section III, page 51). BCA’s Composite Technical Indicator for T-Notes is massively overbought and sentiment, as approximated by the Long-Term Interest Rates component of the ZEW survey, is overly bullish (Chart I-25). Thus, bonds represent an attractive cyclical sell. The Fed will not cut rates aggressively enough for bonds to ignore these valuation and technical risks. Treasurys have outperformed cash by 7.5% in the past year. Based on historical relationships, the Fed needs to cut rates to zero for bonds to beat cash in the coming 12 months (Chart I-26). After this week’s Fed cut to 1.75%, our base case is none to maybe one more rate cut. Chart I-25Sentiment Points To Yield Upside
Sentiment Points To Yield Upside
Sentiment Points To Yield Upside
Chart I-26The Fed Must Cut To Zero For T-Notes To Outperform Cash Further
The Fed Must Cut To Zero For T-Notes To Outperform Cash Further
The Fed Must Cut To Zero For T-Notes To Outperform Cash Further
Bond yields will need a recession to move lower. The deviation of 10-year Treasury yields from their two-year moving average closely tracks the Swedish Economic Diffusion Index (Chart I-27, top panel). Sweden, a small, open economy highly levered to the global industrial cycle, is a good gauge of the global business cycle. The broad weakness in the Swedish economy is unlikely to worsen unless the global slowdown morphs into a deep recession. Even if global growth remains mediocre, Sweden’s Economic Diffusion Index will rise along with yields. The expansion in securities holdings of U.S. commercial banks and the stabilization in China’s credit flows both support this notion (Chart I-27, bottom panel). Financial market developments also point to higher yields. Sectors that typically capture the momentum in the global economy are perking up. For example, bottoms in the annual performance of European luxury equities or Taiwanese stocks have preceded increases in yields (Chart I-28). Chart I-27Yields Have Upside
Yields Have Upside
Yields Have Upside
Chart I-28Key Financial Market Signals For Yields
Key Financial Market Signals For Yields
Key Financial Market Signals For Yields
Stocks Will Outperform Bonds Our conviction is strengthening that equities will outperform bonds. The total return of the stock-to-bond ratio has upside. BCA’s Global Economic and Financial Diffusion Index has rallied sharply, which often precedes an ascent in the stock-to-bond ratio, both in the U.S. and globally (Chart I-29). Bonds are much more expensive than stocks, therefore, only a recession will allow stocks to underperform in the coming 12 to 18 months. The environment is positive for equities. BCA’s Monetary Indicator is very elevated and our Composite Sentiment Indicator shows little complacency toward stocks among investors (see Section III, page 47). Finally, the strength in the U.S. Financial Liquidity Indicator supports the S&P 500’s returns (Chart I-30). Chart I-29Cyclical Indicators Argue In Favor Of Stocks Over Bonds
Cyclical Indicators Argue In Favor Of Stocks Over Bonds
Cyclical Indicators Argue In Favor Of Stocks Over Bonds
Chart I-30Liquidity Tailwind For The S&P 500
Liquidity Tailwind For The S&P 500
Liquidity Tailwind For The S&P 500
A few market developments are noteworthy. 55.6% of the S&P 500’s constituents have reported Q3 earnings, and 74% of those firms are beating estimates. Moreover, the market is generously rewarding firms with the largest positive earnings surprises. Additionally, the Value Line Geometric Index is forming a reverse head-and-shoulder pattern, while the relative performance of the Russell 2000 has formed a double bottom (Chart I-31). The environment also favors cyclicals relative to defensive equities. By lifting bond yields, stronger economic activity leads to a contraction in the multiples of defensives relative to cyclicals. The latter’s earnings expectations respond more positively to reviving economic activity, which creates an offset to climbing discount rates. As a result, cyclicals often outperform defensives when the stock-to-bond ratio increases, or after Taiwanese equities gain momentum (Chart I-32). Chart I-31Improving Equity Market Dynamics
Improving Equity Market Dynamics
Improving Equity Market Dynamics
Chart I-32Favor Cyclicals Over Defensives
Favor Cyclicals Over Defensives
Favor Cyclicals Over Defensives
Compared to other equity markets, the U.S. faces the most challenges. Our model forecasts a 3% annual drop in the S&P 500’s operating earnings in June 2020, and the deviation of U.S. equities from their 200-day moving average has greatly diverged from net earnings revisions (Chart I-33). U.S. equities have already discounted a turnaround in earnings. Moreover, the S&P 500’s margins have downside, a topic covered by BCA’s Chief Equity Strategist Anastasios Avgeriou.4 Our Composite Margin Proxy, Operating Margins Diffusion Index and Corporate Pricing Power Indicator all remain weak (Chart I-34). Downward pressure on margins will limit how rapidly earnings respond when a rebound in global economic activity lifts revenues. Finally, the S&P 500 trades at a historically elevated forward P/E ratio of 18.4, the MSCI EAFE trade at a much more reasonable 14-times forward earnings. Chart I-33Headwinds For U.S. Stocks
Headwinds For U.S. Stocks
Headwinds For U.S. Stocks
Chart I-34Headwinds For U.S. Margins
Headwinds For U.S. Margins
Headwinds For U.S. Margins
The tech sector will also weigh on the performance of U.S. equities relative to international stocks. Tech stocks represent 22.5% of the U.S. benchmark, compared with 9.7% for the euro area. Anastasios recently argued that software spending has remained surprisingly resilient despite the global economic slowdown; it will likely lag spending on machinery and structures when the cycle picks up.5 Consequently, tech earnings will lag other traditional cyclical sectors. Moreover, tech multiples will suffer when the dollar depreciates and bond yields rise (Chart I-35). As high-growth stocks, tech equities derive a large proportion of their intrinsic value from long-term deferred cash flows and their terminal value. Thus, tech multiples are highly sensitive to discount factors. Unaffected by those negatives, European equities will benefit most from the outperformance of stocks relative to bonds. A weak dollar will be the first positive for the common-currency returns of European equities. Valuations are the second tailwind. The risk premium for European equities is 300 basis points higher than for U.S. stocks. Moreover, U.S. margins will likely diminish relative to the Eurozone’s because of stronger unit labor costs in the U.S. Sector composition will also dictate the performance of European equities. Compared with the U.S., Europe is underweight tech and healthcare stocks, a defensive sector (Table I-1). Investors who favor Europe will also bet against these two sectors. Europe is a wager on the other cyclical sectors: materials, industrials, energy and financials. Chart I-35Tech P/Es Are At Risk
Tech P/Es Are At Risk
Tech P/Es Are At Risk
Table I-1Europe Overweights The Correct Cyclicals
November 2019
November 2019
European financials are particularly attractive. Negative European yields are a major handicap for European financials, but this handicap is already reflected in their price. European banks trade at a price-to-book ratio of 0.6 versus 1.3 for the U.S. This discount should be narrowing, not widening. Yields are bottoming and European loan growth is contracting at a -2% annual rate relative to the U.S. versus -8.6% five years ago. Meanwhile, the annual rate of change of European deposits is in line with the U.S. The attraction of European banks comes from the outlook for their return on tangible equity. A model shows that three variables govern European banks’ ROE: German yields, Italian spreads and the momentum of the silver-to-gold ratio (SGR). German yields impact net interest margins, Italian spreads drive peripheral financial conditions and thus, loan generation in the European periphery, and the SGR tracks the global manufacturing cycle (silver has more industrial uses than gold, but is equally sensitive to real yields), which affects loan flows in the European core. This model logically tracks the performance of European banks and financials (Chart I-36). Our positive outlook on global growth and yields, along with the fall in Italian spreads, augurs well for cheap European financial equities and banks in particular. Commodities Our constructive stance on the global business cycle and yields, plus our negative view on the greenback, is consistent with higher industrial commodity prices. Copper looks particularly attractive. Speculators are aggressively selling the metal, whose price stands at an important technical juncture (Chart I-37). Chart I-36The Drivers Of RoE Point To Higher European Bank Stock Prices
The Drivers Of RoE Point To Higher European Bank Stock Prices
The Drivers Of RoE Point To Higher European Bank Stock Prices
Chart I-37Cooper Is An Attractive Play On Global Growth
Cooper Is An Attractive Play On Global Growth
Cooper Is An Attractive Play On Global Growth
Chart I-38Favorable Technical Backdrop For Silver-To-Gold Ratio
Favorable Technical Backdrop For Silver-To-Gold Ratio
Favorable Technical Backdrop For Silver-To-Gold Ratio
Finally, we have favored the SGR since late June. Silver is deeply oversold and under-owned relative to the yellow metal (Chart I-38). Consequently, silver’s greater industrial usage should be a potent tailwind for the SGR.6 Mathieu Savary Vice President The Bank Credit Analyst October 31, 2019 Next Report: November 22, 2019 - Outlook 2020 II. Back To The Nineteenth Century The Cold War is a limited analogy for the U.S.-China conflict; In a multipolar world, complete bifurcation of trade is difficult if not impossible; History suggests that trade between rivals will continue, with minimal impediments; On a secular horizon, buy defense stocks, Europe, capex, and non-aligned countries. There is a growing consensus that China and the U.S. are hurtling towards a Cold War. BCA Research played some part in this consensus – at least as far as the investment community is concerned – by publishing “Power and Politics in East Asia: Cold War 2.0?” in September 2012.7 For much of this decade, Geopolitical Strategy focused on the thesis that geopolitical risk was rotating out of the Middle East, where it was increasingly irrelevant, to East Asia, where it would become increasingly relevant. This thesis remains cogent, but it does not mean that a “Silicon Curtain” will necessarily divide the world into two bifurcated zones of capitalism. Trade, capital flows, and human exchanges between China and the U.S. will continue and may even grow. But the risk of conflict, including a military one, will not decline. In this report, we first review the geopolitical logic that underpins Sino-American tensions. We then survey the academic literature for clues on how that relationship will develop vis-à-vis trade and economic relations. The evidence from political theory is surprising and highly investment relevant. We then look back at history for clues as to what this means for investors. The U.S.-China conflict will not lead to complete bifurcation of the global economy. Our conclusion is that it is highly likely that the U.S. and China will continue to be geopolitical rivals. However, due to the geopolitical context of multipolarity, it is unlikely that the result will be “Bifurcated Capitalism.” Rather, we expect an exciting and volatile environment for investors where geopolitics takes its historical place alongside valuation, momentum, fundamentals, and macroeconomics in the pantheon of factors that determine investment opportunities and risks. The Thucydides Trap Is Real … Speaking in the Reichstag in 1897, German Foreign Secretary Bernhard von Bülow proclaimed that it was time for Germany to demand “its own place in the sun.”8 The occasion was a debate on Germany’s policy towards East Asia. Bülow soon ascended to the Chancellorship under Kaiser Wilhelm II and oversaw the evolution of German foreign policy from Realpolitik to Weltpolitik. While Realpolitik was characterized by Germany’s cautious balancing of global powers under Chancellor Otto von Bismarck, Weltpolitik saw Bülow and Wilhelm II seek to redraw the status quo through aggressive foreign and trade policy. Imperial Germany joined a long list of antagonists, from Athens to today’s People’s Republic of China, in the tragic play of human history dubbed the “Thucydides Trap.”9 Chart II-1Imperial Overstretch
Imperial Overstretch
Imperial Overstretch
The underlying concept is well known to all students of world history. It takes its name from the Greek historian Thucydides and his seminal History of the Peloponnesian War. Thucydides explains why Sparta and Athens went to war but, unlike his contemporaries, he does not moralize or blame the gods. Instead, he dispassionately describes how the conflict between a revisionist Athens and established Sparta became inevitable due to a cycle of mistrust. Graham Allison, one of America’s preeminent scholars of international relations, has argued that the interplay between a status quo power and a challenger has almost always led to conflict. In 12 out of the 16 cases he surveyed, actual military conflict broke out. Of the four cases where war did not develop, three involved transitions between countries that shared a deep cultural affinity and a respect for the prevailing institutions.10 In those cases, the transition was a case of new management running largely the same organizational structure. And one of the four non-war outcomes was nothing less than the Cold War between the Soviet Union and the U.S. The fundamental problem for a status quo power is that its empire or “sphere of influence” remains the same size as when it stood at the zenith of power. However, its decline in a relative sense leads to a classic problem of “imperial overstretch.” The hegemonic or imperial power erroneously doubles down on maintaining a status quo that it can no longer afford (Chart II-1). The challenger power is not blameless. It senses weakness in the hegemon and begins to develop a regional sphere of influence. The problem is that regional hegemony is a perfect jumping off point towards global hegemony. And while the challenger’s intentions may be limited and restrained (though they often are ambitious and overweening), the status quo power must react to capabilities, not intentions. The former are material and real, whereas the latter are perceived and ephemeral. In a multipolar world, the U.S. will not be able to exclude China from the global system. The challenging power always has an internal logic justifying its ambitions. In China’s case today, there is a sense among the elite that the country is merely mean-reverting to the way things were for many centuries in China’s and Asia’s long history (Chart II-2). In other words, China is a “challenger” power only if one describes the status quo as the past three hundred years. It is the “established” power if one goes back to an earlier state of affairs. As such, the consensus in China is that it should not have to pay deference to the prevailing status quo given that the contemporary context is merely the result of western imperialist “challenges” to the established Chinese and regional order. Chart II-2China’s Mean Reverting Narrative
November 2019
November 2019
In addition, China has a legitimate claim that it is at least as relevant to the global economy as the U.S. and therefore deserves a greater say in global governance. While the U.S. still takes a larger share of the global economy, China has contributed 23% to incremental global GDP over the past two decades, compared to 13% for the U.S. (Chart II-3). Chart II-3The Beijing Consensus
November 2019
November 2019
Bottom Line: The emerging tensions between China and the U.S. fit neatly into the theoretical and empirical outlines of the Thucydides Trap. We do not see any way for the two countries to avoid struggle and conflict on a secular or forecastable horizon. What does this mean for investors? For one, the secular tailwinds behind defense stocks will persist. But what beyond that? Is the global economy destined to witness complete bifurcation into two armed camps separated by a Silicon Curtain? Will the Alibaba and Amazon Pacts suspiciously glare at each other the way that NATO and Warsaw Pacts did amidst the Cold War? The answer, tentatively, is no. … But It Will Not Lead To Economic Bifurcation President Trump’s aggressive trade policy also fits neatly into political theory, to a point. Realism in political science focuses on relative gains over absolute gains in all relationships, including trade. This is because trade leads to economic prosperity, prosperity to the accumulation of economic surplus, and economic surplus to military spending, research, and development. Two states that care only about relative gains due to rivalry produce a zero-sum game with no room for cooperation. It is a “Prisoner’s Dilemma” that can lead to sub-optimal economic outcomes in which both actors chose not to cooperate. Diagram II-1 illustrates the effects of relative gain calculations on the trade behavior of states. In the absence of geopolitics, demand (Q3) is satisfied via trade (Q3-Q0) due to the inability of domestic production (Q0) to meet it. Diagram II-1Trade War In A Bipolar World
November 2019
November 2019
However, geopolitical externality – a rivalry with another state – raises the marginal social cost of imports – i.e. trade allows the rival to gain more out of trade and “catch up” in terms of geopolitical capabilities. The trading state therefore eliminates such externalities with a tariff (t), raising domestic output to Q1, while shrinking demand to Q2, thus reducing imports to merely Q2-Q1, a fraction of where they would be in a world where geopolitics do not matter. The dynamic of relative gains can also have a powerful pull on the hegemon as it begins to weaken and rethink its originally magnanimous trade relations. As political scientist Duncan Snidal argued in a 1991 paper, When the global system is first set up, the hegemon makes deals with smaller states. The hegemon is concerned more with absolute gains, smaller states are more concerned with relative, so they are tougher negotiators. Cooperative arrangements favoring smaller states contribute to relative hegemonic decline. As the unequal distribution of benefits in favor of smaller states helps them catch up to the hegemonic actor, it also lowers the relative gains weight they place on the hegemonic actor. At the same time, declining relative preponderance increases the hegemonic state’s concern for relative gains with other states, especially any rising challengers. The net result is increasing pressure from the largest actor to change the prevailing system to gain a greater share of cooperative benefits.11 History teaches us that trade occurs even amongst rivals and during wartime. The reason small states are initially more concerned with relative gains is because they are far more concerned with national security than the hegemon. The hegemon has a preponderance of power and is therefore more relaxed about its security needs. This explains why Presidents George Bush Sr., Bill Clinton, and George Bush Jr. all made “bad deals” with China. Writing nearly thirty years ago, Snidal cogently described the current U.S.-China trade war. Snidal thought he was describing a coming decade of anarchy. But he and fellow political scientists writing in the early 1990s underestimated American power. The “unipolar moment” of American supremacy was not over, it was just beginning! As such, the dynamic Snidal described took thirty years to come to fruition. When thinking about the transition away from U.S. hegemony, most investors anchor themselves to the Cold War as it is the only world they have known that was not unipolar. Moreover the Cold War provides a simple, bipolar distribution of power that is easy to model through game theory. If this is the world we are about to inhabit, with the U.S. and China dividing the whole planet into spheres like the U.S. and Soviet Union, then the paragraph we lifted from Snidal’s paper would be the end of it. America would abandon globalization in totality, impose a draconian Silicon Curtain around China, and coerce its allies to follow suit. But most of recent human history has been defined by a multipolar distribution of power between states, not a bipolar one. The term “cold war” is applicable to the U.S. and China in the sense that comparable military power may prevent them from fighting a full-blown “hot war.” But ultimately the U.S.-Soviet Cold War is a poor analogy for today’s world. In a multipolar world, Snidal concludes, “states that do not cooperate fall behind other relative gains maximizers that cooperate among themselves. This makes cooperation the best defense (as well as the best offense) when your rivals are cooperating in a multilateral relative gains world.” Snidal shows via formal modeling that as the number of players increases from two, relative-gains sensitivity drops sharply.12 The U.S.-China relationship does not occur in a vacuum — it is moderated by the global context. Today’s global context is one of multipolarity. Multipolarity refers to the distribution of geopolitical power, which is no longer dominated by one or two great powers (Chart II-4). Europe and Japan, for instance, have formidable economies and military capabilities. Russia remains a potent military power, even as India surpasses it in terms of overall geopolitical power. Chart II-4The World Is No Longer Bipolar
The World Is No Longer Bipolar
The World Is No Longer Bipolar
A multipolar world is the least “ordered” and the most unstable of world systems (Chart II-5). This is for three reasons: Chart II-5Multipolarity Is Messy
Multipolarity Is Messy
Multipolarity Is Messy
Math: Multipolarity engenders more potential “conflict dyads” that can lead to conflict. In a unipolar world, there is only one country that determines norms and rules of behavior. Conflict is possible, but only if the hegemon wishes it. In a bipolar world, conflict is possible, but it must align along the axis of the two dominant powers. In a multipolar world, alliances are constantly shifting and producing novel conflict dyads. Lack of coordination: Global coordination suffers in periods of multipolarity as there are more “veto players.” This is particularly problematic during times of stress, such as when an aggressive revisionist power uses force or when the world is faced with an economic crisis. Charles Kindleberger has argued that it was exactly such hegemonic instability that caused the Great Depression to descend into the Second World War in his seminal The World In Depression.13 Mistakes: In a unipolar and bipolar world, there are a very limited number of dice being rolled at once. As such, the odds of tragic mistakes are low and can be mitigated with complex formal relationships (such as U.S.-Soviet Mutually Assured Destruction, grounded in formal modeling of game theory). But in a multipolar world, something as random as an assassination of a dignitary can set in motion a global war. The multipolar system is far more dynamic and thus unpredictable. Diagram II-2 is modified for a multipolar world. Everything is the same, except that we highlight the trade lost to other great powers. The state considering using tariffs to lower the marginal social cost of trading with a rival must account for this “lost trade.” In the context of today’s trade war with China, this would be the sum of all European Airbuses and Brazilian soybeans sold to China in the place of American exports. For China, it would be the sum of all the machinery, electronics, and capital goods produced in the rest of Asia and shipped to the United States. Diagram II-2Trade War In A Multipolar World
November 2019
November 2019
Could Washington ask its allies – Europe, Japan, South Korea, Taiwan, etc. – not to take advantage of the lucrative trade (Q3-Q0)-(Q2-Q1) lost due to its trade tiff with China? Sure, but empirical research shows that they would likely ignore such pleas for unity. Alliances produced by a bipolar system produce a statistically significant and large impact on bilateral trade flows, a relationship that weakens in a multipolar context. This is the conclusion of a 1993 paper by Joanne Gowa and Edward D. Mansfield.14 The authors draw their conclusion from an 80-year period beginning in 1905, which captures several decades of global multipolarity. Unless the U.S. produces a wholehearted diplomatic effort to tighten up its alliances and enforce trade sanctions – something hardly foreseeable under the current administration – the self-interest of U.S. allies will drive them to continue trading with China. The U.S. will not be able to exclude China from the global system; nor will China be able to achieve Xi Jinping’s vaunted “self-sufficiency.” A risk to our view is that we have misjudged the global system, just as political scientists writing in the early 1990s did. To that effect, we accept that Charts II-1 and II-4 do not really support a view that the world is in a balanced multipolar state. The U.S. clearly remains the most powerful country in the world. The problem is that it is also clearly in a relative decline and that its sphere of influence is global – and thus very expensive – whereas its rivals have merely regional ambitions (for the time being). As such, we concede that American hegemony could be reasserted relatively quickly, but it would require a significant calamity in one of the other poles of power. For instance, a breakdown in China’s internal stability alongside the recovery of U.S. political stability. Bottom Line: The trade war between the U.S. and China is geopolitically unsustainable. The only way it could continue is if the two states existed in a bipolar world where the rest of the states closely aligned themselves behind the two superpowers. We have a high conviction view that today’s world is – for the time being – multipolar. American allies will cheat and skirt around Washington’s demands that China be isolated. This is because the U.S. no longer has the preponderance of power that it enjoyed in the last decade of the twentieth and the first decade of the twenty-first century. Insights presented thus far come from formal theory in political science. What does history teach us? Trading With The Enemy In 1896, a bestselling pamphlet in the U.K., “Made in Germany,” painted an ominous picture: “A gigantic commercial State is arising to menace our prosperity, and contend with us for the trade of the world.”15 Look around your own houses, author E.E. Williams urged his readers. “The toys, and the dolls, and the fairy books which your children maltreat in the nursery are made in Germany: nay, the material of your favorite (patriotic) newspaper had the same birthplace as like as not.” Williams later wrote that tariffs were the answer and that they “would bring Germany to her knees, pleading for our clemency.”16 By the late 1890s, it was clear to the U.K. that Germany was its greatest national security threat. The Germany Navy Laws of 1898 and 1900 launched a massive naval buildup with the singular objective of liberating the German Empire from the geographic constraints of the Jutland Peninsula. By 1902, the First Lord of the Royal Navy pointed out that “the great new German navy is being carefully built up from the point of view of a war with us.”17 There is absolutely no doubt that Germany was the U.K.’s gravest national security threat. As a result, London signed in April 1904 a set of agreements with France that came to be known as Entente Cordiale. The entente was immediately tested by Germany in the 1905 First Moroccan Crisis, which only served to strengthen the alliance. Russia was brought into the pact in 1907, creating the Triple Entente. In hindsight, the alliance structure was obvious given Germany’s meteoric rise from unification in 1871. However, one should not underestimate the magnitude of these geopolitical events. For the U.K. and France to resolve centuries of differences and formalize an alliance in 1904 was a tectonic shift — one that they undertook against the grain of history, entrenched enmity, and ideology.18 Political scientists and historians have noted that geopolitical enmity rarely produces bifurcated economic relations exhibited during the Cold War. Both empirical research and formal modeling shows that trade occurs even amongst rivals and during wartime.19 This was certainly the case between the U.K. and Germany, whose trade steadily increased right up until the outbreak of World War One (Chart II-6). Could this be written off due to the U.K.’s ideological commitment to laissez-faire economics? Or perhaps London feared a move against its lightly defended colonies in case it became protectionist? These are fair arguments. However, they do not explain why Russia and France both saw ever-rising total trade with the German Empire during the same period (Chart II-7). Either all three states were led by incompetent policymakers who somehow did not see the war coming – unlikely given the empirical record – or they simply could not afford to lose out on the gains of trade with Germany to each other. Chart II-6The Allies Traded With Germany ...
November 2019
November 2019
Chart II-7… Right Up To WWI
November 2019
November 2019
Chart II-8Japan And U.S. Never Downshifted Trade
November 2019
November 2019
A similar dynamic was afoot ahead of World War Two. Relations between the U.S. and Japan soured in the 1930s, with the Japanese invasion of Manchuria in 1931. In 1935, Japan withdrew from the 1922 Washington Naval Treaty – the bedrock of the Pacific balance of power – and began a massive naval buildup. In 1937, Japan invaded China. Despite a clear and present danger, the U.S. continued to trade with Japan right up until July 26, 1941, few days after Japan invaded southern Indochina (Chart II-8). On December 7, Japan attacked the U.S. A skeptic may argue that precisely because policymakers sleepwalked into war in the First and Second World Wars, they will not (or should not) make the same mistake this time around. First, we do not make policy prescriptions and therefore care not what should happen. Second, we are highly skeptical of the view that policymakers in the early and mid-twentieth century were somehow defective (as opposed to today’s enlightened leaders). Our constraints-based framework urges us to seek systemic reasons for the behavior of leaders. Political science provides a clear theoretical explanation for why London and Washington continued to trade with the enemy despite the clarity of the threat. The answer lies in the systemic nature of the constraint: a multipolar world reduces the sensitivity of policymakers to relative gains by introducing a collective action problem thanks to changing alliances and the difficulty of disciplining allies’ behavior. In the case of U.S. and China, this is further accentuated by President Trump’s strategy of skirting multilateral diplomacy and intense focus on mercantilist measures of power (i.e. obsession with the trade deficit). An anti-China trade policy that was accompanied by a magnanimous approach to trade relations with allies could have produced a “coalition of the willing” against Beijing. But after two years of tariffs and threats against the EU, Japan, and Canada, the Trump administration has already signaled to the rest of the world that old alliances and coordination avenues are up for revision. There are two outcomes that we can see emerging over the course of the next decade. First, U.S. leadership will become aware of the systemic constraints under which they operate, and trade with China will continue – albeit with limitations and variations. However, such trade will not reduce the geopolitical tensions, nor will it prevent a military conflict. In facts, the probability of military conflict may increase even as trade between China and the U.S. remains steady. Second, U.S. leadership will fail to correctly assess that they operate in a multipolar world and will give up the highlighted trade gains from Diagram II-2 to economic rivals such as Europe and Japan. Given our methodological adherence to constraint-based forecasting, we highly doubt that the latter scenario is likely. Bottom Line: The China-U.S. conflict is not a replay of the Cold War. Systemic pressures from global multipolarity will force the U.S. to continue to trade with China, with limitations on exchanges in emergent, dual-use technologies that China will nonetheless source from other technologically advanced countries. This will create a complicated but exciting world where geopolitics will cease to be seen as exogenous to investing. A risk to the sanguine conclusion is that the historical record is applicable to today, but that the hour is late, not early. It is already July 26, 1941 – when U.S. abrogated all trade with Japan – not 1930. As such, we do not have another decade of trade between U.S. and China remaining, we are at the end of the cycle. While this is a risk, it is unlikely. American policymakers would essentially have to be willing to risk a military conflict with China in order to take the trade war to the same level they did with Japan. It is an objective fact that China has meaningfully stepped up aggressive foreign policy in the region. But unlike Japan in 1941, China has not outright invaded any countries over the past decade. As such, the willingness of the public to support such a conflict is unclear, with only 21% of Americans considering China a top threat to the U.S. Investment Implications This analysis is not meant to be optimistic. First, the U.S. and China will continue to be rivals even if the economic relationship between them does not lead to global bifurcation. For one, China continues to be – much like Germany in the early twentieth century – concerned with access to external markets on which 19.5% of its economy still depend. China is therefore developing a modern navy and military not because it wants to dominate the rest of the world but because it wants to dominate its near abroad, much as the U.S. wanted to, beginning with the Monroe Doctrine. This will continue to lead to Chinese aggression in the South and East China Seas, raising the odds of a conflict with the U.S. Navy. Given that the Thucydides Trap narrative remains cogent, investors should look to overweight S&P 500 aerospace and defense stocks relative to global equity markets. An alternative way that one could play this thesis is by developing a basket of global defense stocks. Multipolarity may create constraints to trade protectionism, but it engenders geopolitical volatility and thus buoys defense spending. Second, we would not expect another uptick in globalization. Multipolarity may make it difficult for countries to completely close off trade with a rival, but globalization is built on more than just trade between rivals. Globalization requires a high level of coordination among great powers that is only possible under hegemonic conditions. Chart II-9 shows that the hegemony of the British and later American empires created a powerful tailwind for trade over the past two hundred years. Chart II-9The Apex Of Globalization Is Behind Us
The Apex Of Globalization Is Behind Us
The Apex Of Globalization Is Behind Us
The Apex of Globalization has come and gone – it is all downhill from here. But this is not a binary view. Foreign trade will not go to zero. The U.S. and China will not completely seal each other’s sphere of influence behind a Silicon Curtain. Instead, we focus on five investment themes that flow from a world that is characterized by the three trends of multipolarity, Sino-U.S. geopolitical rivalry, and apex of globalization: Europe will profit: As the U.S. and China deepen their enmity, we expect some European companies to profit. There is some evidence that the investment community has already caught wind of this trend, with European equities modestly outperforming their U.S. counterparts whenever trade tensions flared up in 2019 (Chart II-10). Given our thesis, however, it is unlikely that the U.S. would completely lose market share in China to Europe. As such, we specifically focus on tech, where we expect the U.S. and China to ramp up non-tariff barriers to trade regardless of systemic pressures to continue to trade. A strategic long in the secularly beleaguered European tech companies relative to their U.S. counterparts may therefore make sense (Chart II-11). Chart II-10Europe: A Trade War Safe Haven
Europe: A Trade War Safe Haven
Europe: A Trade War Safe Haven
Chart II-11Is Europe Really This Incompetent?
Is Europe Really This Incompetent?
Is Europe Really This Incompetent?
USD bull market will end: A trade war is a very disruptive way to adjust one’s trade relationship. It opens one to retaliation and thus the kind of relative losses described in this analysis. As such, we expect that U.S. to eventually depreciate the USD, either by aggressively reversing 2018 tightening or by coercing its trade rivals to strengthen their currencies. Such a move will be yet another tailwind behind the diversification away from the USD as a reserve currency, a move that should benefit the euro. Bull market in capex: The re-wiring of global manufacturing chains will still take place. The bad news is that multinational corporations will have to dip into their profit margins to move their supply chains to adjust to the new geopolitical reality. The good news is that they will have to invest in manufacturing capex to accomplish the task. One way to articulate this theme is to buy an index of semiconductor capital companies (AMAT, LRCX, KLAC, MKSI, AEIS, BRIKS, and TER). Given the highly cyclical nature of capital companies, we would recommend an entry point once trade tensions subside and green shoots of global growth appear. “Non-aligned” markets will benefit: The last time the world was multipolar, great powers competed through imperialism. This time around, a same dynamic will develop as countries seek to replicate China’s “Belt and Road Initiative.” This is positive for frontier markets. A rush to provide them with exports and services will increase supply and thus lower costs, providing otherwise forgotten markets with a boon of investments. India, and Asia-ex-China more broadly, stand as intriguing alternatives to China, especially with the current administration aggressively reforming to take advantage of the rewiring of global manufacturing chains. Capital markets will remain globalized: With interest rates near zero in much of the developed world and the demographic burden putting an ever-greater pressure on pension plans to generate returns, the search for yield will continue to be a powerful drive that keeps capital markets globalized. Limitations are likely to grow, especially when it comes to cross-border private investments in dual-use technologies. But a completely bifurcation of capital markets is unlikely. The world we are describing is one where geopolitics will play an increasingly prominent role for global investors. It would be convenient if the world simply divided into two warring camps, leaving investors with neatly separated compartments that enabled them to go back to ignoring geopolitics. This is unlikely. Rather, the world will resemble the dynamic years at the end of the nineteenth century, a rough-and-tumble era that required a multi-disciplinary approach to investing. Marko Papic Consulting Editor, BCA Research Chief Strategist, Clocktower Group III. Indicators And Reference Charts The S&P 500 is making marginally new all-time highs. Seasonality is becoming very favorable for stock prices. However, our U.S. profit model continues to point south and expanding multiples have already driven this year’s equity gains. The S&P 500 has therefore already priced in a significant improvement in profits. Further P/E expansion will be harder to come by with bond yields set to rise. Thus, until the dollar falls and creates another tailwind for profits, stocks will not be as strong as seasonality suggests and will only make marginal new highs. Our Revealed Preference Indicator (RPI) remains cautious towards equities. The RPI combines the idea of market momentum with valuation and policy measures. It provides a powerful bullish signal if positive market momentum lines up with constructive readings from the policy and valuation measures. Conversely, if strong market momentum is not supported by valuations and policy, investors should lean against the market trend. Until global growth bottoms and boosts the earnings forecasts of our models, stock gains will stay limited. The outlook for next year remains constructive for stocks. Our Willingness-to-Pay (WTP) indicator for the U.S. continues to improve. This same indicator has recently turned lower in Japan. Meanwhile, it is deteriorating further in Europe. The WTP indicator tracks flows, and thus provides information on what investors are actually doing, as opposed to sentiment indexes that track how investors are feeling. Global yields have turned higher but they remain at exceptionally stimulating levels. Moreover, money and liquidity growth has picked up around the world, and global central banks continue to conduct very dovish policies. As a result, our Monetary Indicator remains at extremely elevated levels. Furthermore, our Composite Technical Indicator is still flashing a buy signal. Also, our BCA Composite Valuation index is still improving. As a result, our Speculation Indicator is back in the neutral zone. 10-year Treasury yields continue to rise, but they remain very expensive. Moreover, both our Bond Valuation Index and our Composite Technical Indicators are still flashing high-conviction sell signals. If the strengthening of the Commodity Index Advance/Decline line results in higher natural resource prices, then, inflation breakevens will also climb meaningfully. Therefore, the current setup argues for a below-benchmark duration in fixed-income portfolios. Weak global growth has been the key support for the dollar in recent months. On a PPP basis, the U.S. dollar remains extremely expensive. Additionally, our Composite Technical Indicator has lost momentum and has formed a negative divergence with the Greenback’s level. Moreover, the U.S. current account deficit has begun to widen anew. This backdrop makes the dollar highly vulnerable to a rebound in global growth. In fact, a breakdown in the greenback will be the clearest signal yet that global growth is rebounding for good. EQUITIES: Chart III-1U.S. Equity Indicators
U.S. Equity Indicators
U.S. Equity Indicators
Chart III-2Willingness To Pay For Risk
Willingness To Pay For Risk
Willingness To Pay For Risk
Chart III-3U.S. Equity Sentiment Indicators
U.S. Equity Sentiment Indicators
U.S. Equity Sentiment Indicators
Chart III-4Revealed Preference Indicator
Revealed Preference Indicator
Revealed Preference Indicator
Chart III-5U.S. Stock Market Valuation
U.S. Stock Market Valuation
U.S. Stock Market Valuation
Chart III-6U.S. Earnings
U.S. Earnings
U.S. Earnings
Chart III-7Global Stock Market And Earnings: Relative Performance
Global Stock Market And Earnings: Relative Performance
Global Stock Market And Earnings: Relative Performance
Chart III-8Global Stock Market And Earnings: Relative Performance
Global Stock Market And Earnings: Relative Performance
Global Stock Market And Earnings: Relative Performance
FIXED INCOME: Chart III-9U.S. Treasurys And Valuations
U.S. Treasurys And Valuations
U.S. Treasurys And Valuations
Chart III-10Yield Curve Slopes
Yield Curve Slopes
Yield Curve Slopes
Chart III-11Selected U.S. Bond Yields
Selected U.S. Bond Yields
Selected U.S. Bond Yields
Chart III-1210-Year Treasury Yield Components
10-Year Treasury Yield Components
10-Year Treasury Yield Components
Chart III-13U.S. Corporate Bonds And Health Monitor
U.S. Corporate Bonds And Health Monitor
U.S. Corporate Bonds And Health Monitor
Chart III-14Global Bonds: Developed Markets
Global Bonds: Developed Markets
Global Bonds: Developed Markets
Chart III-15Global Bonds: Emerging Markets
Global Bonds: Emerging Markets
Global Bonds: Emerging Markets
CURRENCIES: Chart III-16U.S. Dollar And PPP
U.S. Dollar And PPP
U.S. Dollar And PPP
Chart III-17U.S. Dollar And Indicator
U.S. Dollar And Indicator
U.S. Dollar And Indicator
Chart III-18U.S. Dollar Fundamentals
U.S. Dollar Fundamentals
U.S. Dollar Fundamentals
Chart III-19Japanese Yen Technicals
Japanese Yen Technicals
Japanese Yen Technicals
Chart III-20Euro Technicals
Euro Technicals
Euro Technicals
Chart III-21Euro/Yen Technicals
Euro/Yen Technicals
Euro/Yen Technicals
Chart III-23Euro/Pound Technicals
Euro/Pound Technicals
Euro/Pound Technicals
COMMODITIES: Chart III-23Broad Commodity Indicators
Broad Commodity Indicators
Broad Commodity Indicators
Chart III-24Commodity Prices
Commodity Prices
Commodity Prices
Chart III-25Commodity Prices
Commodity Prices
Commodity Prices
Chart III-26Commodity Sentiment
Commodity Sentiment
Commodity Sentiment
Chart III-27Speculative Positioning
Speculative Positioning
Speculative Positioning
ECONOMY: Chart III-28U.S. And Global Macro Backdrop
U.S. And Global Macro Backdrop
U.S. And Global Macro Backdrop
Chart III-29U.S. Macro Snapshot
U.S. Macro Snapshot
U.S. Macro Snapshot
Chart III-30U.S. Growth Outlook
U.S. Growth Outlook
U.S. Growth Outlook
Chart III-31U.S. Cyclical Spending
U.S. Cyclical Spending
U.S. Cyclical Spending
Chart III-32U.S. Labor Market
U.S. Labor Market
U.S. Labor Market
Chart III-33U.S. Consumption
U.S. Consumption
U.S. Consumption
Chart III-34U.S. Housing
U.S. Housing
U.S. Housing
Chart III-35U.S. Debt And Deleveraging
U.S. Debt And Deleveraging
U.S. Debt And Deleveraging
Chart III-36U.S. Financial Conditions
U.S. Financial Conditions
U.S. Financial Conditions
Chart III-37Global Economic Snapshot: Europe
Global Economic Snapshot: Europe
Global Economic Snapshot: Europe
Chart III-38Global Economic Snapshot: China
Global Economic Snapshot: China
Global Economic Snapshot: China
Mathieu Savary Vice President The Bank Credit Analyst Footnotes 1 Please see The Bank Credit Analyst "September 2019," dated August 29, 2019, available at bca.bcaresearch.com 2 Please see The Bank Credit Analyst "June 2019," dated May 30, 2019, available at bca.bcaresearch.com 3 Please see The Bank Credit Analyst "August 2019," dated July 25, 2019, available at bca.bcaresearch.com 4 Please see U.S. Equity Strategy Special Report "Peak Margins," dated October 7, 2019, available at uses.bcaresearch.com 5 Please see U.S. Equity Strategy Weekly Report "Follow The Profit Trail," dated October 15, 2019, available at uses.bcaresearch.com 6 Please see Foreign Exchange Strategy Weekly Report "On Money Velocity, EUR/USD And Silver," dated October 11, 2019, available on fes.bcaresearch.com 7 Please see BCA Research Geopolitical Strategy, “Power And Politics In East Asia: Cold War 2.0?,” September 25, 2012, “Sino-American Conflict: More Likely Than You Think,” October 4, 2013, “The Great Risk Rotation,” December 11, 2013, and “Strategic Outlook 2014 – Stay The Course: EM Risk – DM Reward,” January 23, 2014, “Underestimating Sino-American Tensions,” November 6, 2015, “The Geopolitics Of Trump,” December 2, 2016, “How To Play The Proxy Battles In Asia,” March 1, 2017, and others available at gps.bcaresearch.com or upon request. 8 Please see German Historical Institute, “Bernhard von Bulow on Germany’s ‘Place in the Sun’” (1897), available at http://germanhistorydocs.ghi-dc.org/ 9 See Graham Allison, Destined For War: Can America and China Escape Thucydides’s Trap? (New York: Houghton Miffin Harcourt, 2017). 10 The three cases are Spain taking over from Portugal in the sixteenth century, the U.S. taking over from the U.K. in the twentieth century, and Germany rising to regional hegemony in Europe in the twenty-first century. 11 Duncan Snidal, “Relative Gains and the Pattern of International Cooperation,” The American Political Science Review, 85:3 (September 1991), pp. 701-726. 12 We do not review Snidal’s excellent game theory formal modeling in this paper as it is complex and detailed. However, we highly encourage the intrigued reader to pursue the study on their own. 13 See Charles P. Kindleberger, The World In Depression, 1929-1939 (Berkeley: University of California Press, 2013). 14 Joanne Gowa and Edward D. Mansfield, “Power Politics and International Trade,” The American Political Science Review, 87:2 (June 1993), pp. 408-420. 15 See Ernest Edwin Williams, Made in Germany (reprint, Ithaca: Cornell University Press), available at https://archive.org/details/cu31924031247830. 16 Quoted in Margaret MacMillan, The War That Ended Peace (Toronto: Allen Lane, 2014). 17 Peter Liberman, “Trading with the Enemy: Security and Relative Economic Gains,” international Security, 21:1 (Summer 1996), pp. 147-175. 18 Although France and Russia overcame even greater bitterness due to the ideological differences between a republic founded on a violent uprising against its aristocracy – France – and an aristocratic authoritarian regime – Russia. 19 See James Morrow, “When Do ‘Relative Gains’ Impede Trade?” The Journal of Conflict Resolution, 41:1 (February 1997), pp. 12-37; and Jack S. Levy and Katherine Barbieri, “Trading With the Enemy During Wartime,” Security Studies, 13:3 (December 2004), pp. 1-47.

A variety of pro-cyclical financial variables are pointing toward an improving global growth outlook. The AUD/JPY has clearly bottomed, the USD/KRW is weakening, and the silver to gold ratio has been strengthening. The most eye-catching development has…
Highlights Rising recession risk, shaky economic fundamentals, and absence of positive yielding assets motivate us to reexamine which assets can be counted on to protect a portfolio in the future. We analyze 10 safe havens on four different dimensions: consistency, versatility, efficiency, and costs. Using this framework, we examine the historical performance of each safe haven and provide an outlook on their likely effectiveness over the next decade. We conclude that U.S. TIPS and farmland should provide the best portfolio protection. Cash, U.S. Treasuries and gold are other good alternatives. Meanwhile, U.S. investment-grade bonds, global ex-U.S. bonds, silver, and currency futures are likely to be poor protection choices. Feature For most investors, capital preservation is the most important goal when managing money. However, how to go about it remains a difficult question. Investing in safe havens can be painful during bull markets, as their returns are usually lower than those of equities. Moreover, economic, political, and financial regimes change over time, which means that an asset that protected your portfolio in the past might not do so in the future. Therefore, it becomes good practice to review one’s safety measures periodically, even if one does not think that a crash is imminent. The current environment in particular, is a propitious time to review safe havens given that: Chart I-1A Great Time To Review Safety Measures
A Great Time To Review Safety Measures
A Great Time To Review Safety Measures
A key recession signal is flashing red: The yield curve inverted in the United States in August (Chart I-1 – top panel). An inversion of the yield curve does not necessarily imply a recession, but historically it has been a very reliable signal of one, given that it indicates that monetary policy is too tight for the economy. Structural risks are rising: Rich equity valuations in the U.S. and high leverage levels elsewhere are signs that the pillars supporting this bull market might be fragile (Chart I-1 – middle panel). In addition, protectionism and populism, forces that BCA has long argued are here to stay, threaten to upend the regime of free trade that has benefited equities since the 1950s.1 Yields are near all-time lows: Historically, investors have been able to endure bear markets by hiding in safe assets with positive yield, as these assets will normally provide a reliable cash flow regardless of the economic situation. However, these type of assets are increasingly hard to find, particularly in the government bond space, where 50% of developed country bonds have negative yields (Chart I-1 – bottom panel). Considering these factors, how should investors protect their portfolios in the next decade? To answer this question, we analyze 10 safe havens divided into five broad asset classes: Nominal government bonds: U.S. Treasuries and global ex-U.S. government bonds. Other fixed income: U.S. investment-grade credit and U.S. TIPS.2 Currencies: yen futures and Swiss franc futures. Precious metals: gold futures and silver futures. Other assets: farmland and U.S. cash. We look at historical performance since 1973 for all safe havens except for global ex-U.S. bonds and farmland. For these assets, we look at performance since 1991 due to limited data availability. We mainly look at quarterly returns in order to compare illiquid assets to publicly traded ones. We do not consider each safe haven in isolation, but rather as an addition to equities within a portfolio. Specifically, we explore our safe haven universe relative to the MSCI All Country World equity index from the perspective of a U.S. investor. For our non-U.S. clients, we will release a report from the perspective of other countries if there is sufficient interest. Importantly, we do not look only at historical performance. We also examine whether there is a reason to believe that future returns will be different from past ones, by analyzing how the properties of each safe haven might have changed. When evaluating each safe haven, we focus on four properties: Consistency: a safe haven should generate consistent positive returns during periods of negative equity performance, with returns increasing with the severity of the equity drawdown. Versatility: safe havens should perform well across different types of crises. Efficiency: a safe haven should produce enough upside during crises, so only a small allocation to the safe haven is necessary to reduce losses. Costs: drag to portfolio overall performance (opportunity costs) should be as small as possible. Readers who wish to see just our overall conclusions should read our Summary Of Results section below. For our analysis of how safe havens have performed in the past, please see the Historical Performance section. Finally, for our analysis of how we expect the performance of safe havens to change, please see our Outlook section. Summary Of Results The Best Safe Havens U.S. TIPS should be an excellent safe haven to protect a portfolio in the next decade. While TIPS might not be as cheap to hold as they have been in the past, upside potential remains strong, which means that a moderate allocation can provide substantial protection to an equity portfolio. Moreover, U.S. TIPS are one of the best hedges against crises triggered by rising rates and inflation, which in our view are the biggest structural risks that asset allocators face. Farmland could also be a great safe haven for investors who have the ability to allocate to illiquid assets given that it is the cheapest safe haven in terms of portfolio drag. However, investors should be aware that the current low yield could potentially affect its performance during crises. Good Alternatives Cash can be a good alternative to protect an equity portfolio, given its outstanding performance during equity drawdowns caused by inflation. Moreover, its opportunity costs should decrease relative to the past. However, investors should take into account that the efficiency of cash at the current juncture is poor, which means that a relatively large allocation is needed in order to achieve meaningful portfolio protection. A portfolio with a 30% allocation to Treasuries historically provided the same downside protection as a portfolio with a 44% allocation to gold. We also like gold futures as a safe haven since they offer some of the most attractive opportunity costs. In addition, their upside is greater than that of most safe havens due to their negative correlations with real rates. However, gold’s volatility makes it an unreliable asset, which prevents us from placing it higher in the safe haven hierarchy. Historically, U.S. Treasuries have been one of the best safe havens to hedge an equity portfolio. Will this performance continue in the future? We do not think so. While yields are still high enough to provide plenty of upside potential, they have fallen to the point where they have increased the opportunity costs of U.S. Treasuries and reduced their consistency. The Rest Global ex-U.S. bonds have very limited upside due to their low yields. Meanwhile U.S. investment-grade credit remains at risk from poor corporate balance sheets, compounded by the fact that credit no longer has an attractive yield cushion. Currencies like the yen and the Swiss franc will continue to be unreliable and very expensive safe havens. Finally, while silver’s costs and reliability could improve, its high cyclicality relative to other safe havens will make silver a poor protection choice. Historical performance Consistency How did safe havens perform when equities lost money? To assess consistency, we plot the performance of each safe haven during all quarters when global equities had losses (Chart I-2). Cash and farmland were the only assets to have positive returns during every equity drawdown. U.S. Treasuries and U.S. TIPS were also very consistent, and had the additional advantage that their returns tended to increase as equity losses worsened. Global ex-U.S. bonds, while not as consistent, generated positive returns most of the time. Chart I-2Safe Haven Returns During Drawdowns In Global Equities
Safe Haven Review: A Guide To Portfolio Protection In The 2020s
Safe Haven Review: A Guide To Portfolio Protection In The 2020s
On the other hand, investment-grade bonds, the yen, the Swiss franc, gold, and silver were much more inconsistent. In general, even though these assets had larger positive returns than other assets, they were prone to deep selloffs concurrent with equity drawdowns. Silver was the worst of all safe havens, being mostly a negative return asset during quarters of negative equity performance. Versatility How did the type of crisis affect the performance of safe havens? We classify crises according to their catalyst into the following four categories: bursts of U.S. asset bubbles (tech bubble, 2008 housing crisis), ex-U.S. crises (1998 EM crisis, European debt crisis), flash crashes/political events (1987 Black Monday, 9/11 terrorist attack), rate/inflation shocks (1974 oil crisis, 1980 Fed shock) and others (every other equity drawdown we could not classify).3 We look at the performance of seven safe havens since 1973 (Chart I-3A) and of all 10 since 19914 (Chart I-3B): Chart I-3ASafe Haven Return During Different Type Of Crisis (1973 - Present)
Safe Haven Review: A Guide To Portfolio Protection In The 2020s
Safe Haven Review: A Guide To Portfolio Protection In The 2020s
Chart I-3BSafe Haven Return During Different Type Of Crisis (1991 - Present)
Safe Haven Review: A Guide To Portfolio Protection In The 2020s
Safe Haven Review: A Guide To Portfolio Protection In The 2020s
During bursts of U.S. asset bubbles, U.S. Treasuries were the most effective hedge in both sample periods, followed by U.S. TIPS and farmland. Corporate bonds, cash, gold, and the Swiss franc also had positive returns, though they were small. Finally, the yen and silver had negative returns. During crises happening outside of the U.S., U.S. Treasuries were once again the best option. U.S. TIPS, yen futures, farmland, gold, and U.S. investment-grade bonds also provided strong returns. Meanwhile, global ex-U.S. bonds and cash provided relatively weak returns, while both the Swiss franc and silver accrued losses. During flash crashes/political events, the Swiss franc had the best performance followed by global ex-U.S. bonds, though in general all safe havens but silver provided positive returns. Rate/inflation shocks were the most difficult type of crisis to hedge. Cash and U.S. TIPS were by far the best performers. Moreover, while U.S. Treasuries were able to eke out a small positive return, all other safe havens lost money during these crises. Efficiency How much allocation to each safe haven was needed to protect an equity portfolio? Chart I-4 show how adding incremental amounts of each safe haven5 to an equity portfolio reduced the overall portfolio’s 10% conditional VaR (the average of the bottom decile of returns).6 Since 1973, U.S. TIPS and U.S. nominal government bonds were the most efficient safe havens, providing the most protection per unit of allocation (Chart I-4 – top panel). Conditional VaR was reduced by almost half when allocating 40% to either Treasuries or TIPS. Cash, U.S. investment-grade, the yen, the Swiss franc, gold, and silver followed in that order. The difference between the safe havens was significant. As an example, a portfolio with a 30% allocation to U.S. Treasuries historically provided the same downside protection as a portfolio with a 36% allocation to U.S. IG credit, a 39% allocation to the yen or a 44% allocation to gold. Meanwhile, there was no allocation to silver which would have provided the same level of protection. When using a sample from 1991, the main difference was the reduced efficiency of cash – the result of lower average interest rates when using a more recent sample. Other than cash, the efficiency of most safe havens remained unchanged: U.S. Treasuries were the best option, followed by U.S. TIPS, farmland, U.S. investment-grade bonds, global ex-U.S. government bonds, cash, the yen, gold, the Swiss franc, and silver in that order (Chart I-4 – bottom panel). Chart I-4Historically, Fixed-Income Assets Were The Most Efficient Safe Havens
Safe Haven Review: A Guide To Portfolio Protection In The 2020s
Safe Haven Review: A Guide To Portfolio Protection In The 2020s
Costs How do safe haven returns compare to equities? To evaluate opportunity costs, we compare the difference of the historical return of each safe haven versus global equities. Overall, hedging with currencies was extremely costly, as their return was well below that of equities in both samples (Chart I-5). Cash was also an expensive safe haven to hedge with, particularly in the most recent sample. On the other hand, fixed-income assets like U.S Treasuries, investment-grade credit, and U.S. TIPS had very low costs (global ex-U.S. bonds also had cost of around 2% in a limited sample). Farmland had negative opportunity costs because it outperformed equities during the sample period.7 Chart I-5Historically Fixed Income Assets And Farmland Had The Lowest Opportunity Cost
Safe Haven Review: A Guide To Portfolio Protection In The 2020s
Safe Haven Review: A Guide To Portfolio Protection In The 2020s
Outlook Chart I-6No More Yield Cushion
Safe Haven Review: A Guide To Portfolio Protection In The 2020s
Safe Haven Review: A Guide To Portfolio Protection In The 2020s
Chart I-7Silver Has Become Less Cyclical
Silver Has Become Less Cyclical
Silver Has Become Less Cyclical
For our outlook, we assess how the four traits under study have changed for all safe havens: Consistency: Will safe havens continue to be reliable in the absence of high coupons? Many of the safe havens in our sample were effective at hedging equities due to their high yield. Even if they had negative capital appreciation, total returns stayed positive thanks to the offsetting effect of the yield return. However, as rates have declined, yield return has also decreased substantially (Chart I-6). Therefore, safe havens, like cash, government bonds, and even farmland will not be as consistent as they were in the past. Credit could be even more vulnerable: the combination of a low yield, and unhealthy fundamentals will turn U.S. corporate bonds into a negative-return asset in the next crisis. Silver might be the lone safe haven to improve its consistency. Industrial use for silver has fallen substantially in the past 10 years, decreasing its cyclical nature (Chart I-7). Thus, while silver might still be an erratic safe haven, it should be more consistent in the future than its historical performance would suggest. Versatility: What will the next crisis look like? Chart I-8Inflation and Political Crisis Will Plague The 2020s
Inflation and Political Crisis Will Plague The 2020s
Inflation and Political Crisis Will Plague The 2020s
Determining what the next crisis will look like is crucial for safe haven selection. Below we rank the types of crises in order of how likely and severe we think they will be in the future: Inflation/rate shock: We expect inflation to be significantly higher over the next decade. This will be the highest risk for asset allocators in the future. As we explained in our May 2019 report, a change in monetary policy framework, procyclical fiscal policy, waning Fed independence, declining globalization, and demographic forces are all conspiring to lift inflation in the next decade.8 Importantly, we believe that the Fed will be dovish initially, as it cannot let inflation continue to underperform its target after missing the mark for the last 10 years (Chart I-8 – top panel). However, this will cause an inflationary cycle, which will eventually lead the Fed to raise rates significantly and trigger a recession. Political events/flash crashes: Political events will also pose a risk to the markets on a structural basis. The rise of China as a superpower has shifted the world into a paradigm of multipolarity, which historically has resulted in military conflict. Moreover, animus for conflict is not dependent on President Trump. The American public in general feels that the economic relationship with China is detrimental to the United States (Chart I-8 – bottom panel). This means that any president, Democrat or Republican will have a political incentive to jostle with China for economic and political supremacy for years to come. Ex-U.S. crises: We expect Emerging Markets in general, and China in particular, to be among the most vulnerable parts of the global economy as we enter the next decade. Over the last 10 years, China’s money supply has increased four-fold, becoming larger than the money supply of the U.S. and the euro area combined. In addition, corporate debt as a % of GDP stands at 155%, higher than Japan at the peak of its bubble and higher than any country in recorded history (Chart I-9). We rank this type of crisis slightly below the first two because Emerging Market assets are depressed already. Thus, while we believe that there is further downside to come for these economies, some weakness has already been priced in. U.S. asset bubble burst: We believe that there are no systemic excesses in the U.S. economy, making a U.S. asset bubble burst a lesser risk than other types of crises. Although it is true that U.S. corporate debt stands at all-time highs, it is still at a much lower level than in other countries. Moreover, weakness of corporate credit is not likely to have systemic consequences on the economy, given that leveraged institutions like banks and households hold only a small amount of outstanding corporate debt (Chart I-10). Chart I-9EM crises Are Also A Risk
EM crises Are Also A Risk
EM crises Are Also A Risk
Chart I-10A U.S. Corporate Debt Deblacle Will Not Have Systemic Consequences
A U.S. Corporate Debt Deblacle Will Not Have Systemic Consequences
A U.S. Corporate Debt Deblacle Will Not Have Systemic Consequences
What does this ranking mean in terms of safe haven performance? U.S. TIPS and cash should be held in high regard as they will be some of the only assets that will perform well during an inflation/rate shock. The Swiss franc and global ex-U.S. bonds should be best performers during political crises, although U.S. TIPS could also provide adequate protection. Efficiency: Is there any upside left for safe havens when interest rates are near zero? As yields go below the zero bound it becomes harder for bonds to generate large positive returns. European or Japanese government bonds in particular would need their yields to go deep into negative territory to counteract a large selloff in equities (Table I-1). But can interest rates go that low? We do not think so. The recent auction of German bunds, where a 0%-yielding 30-year bond attracted the weakest demand since 2011, suggests that interest rates in these countries might be close to their lower bound. On the other hand, though U.S. yields are low, they are still high enough for U.S. Treasuries to provide high returns in case of a crisis. Table I-1No Room For Positive Returns In The Government Bond Space Outside Of The U.S.
Safe Haven Review: A Guide To Portfolio Protection In The 2020s
Safe Haven Review: A Guide To Portfolio Protection In The 2020s
Low rates also have an effect on the efficiency of U.S. investment-grade bonds, cash, and farmland because their upside during crises does not come from capital appreciation but rather from their yield, (the price of IG credit actually declines during most crisis). As mentioned earlier, their yield has declined substantially compared to the past, which means that a larger allocation will be necessary to counteract a selloff. Chart I-11Switzerland Has A High Incentive To Prevent The Franc From Appreciating
Safe Haven Review: A Guide To Portfolio Protection In The 2020s
Safe Haven Review: A Guide To Portfolio Protection In The 2020s
The upside of the yen could also be compromised. The Bank of Japan is likely to intervene aggressively in the currency market to prevent the Japanese economy from falling into a deflationary spiral, since it is very difficult for it to lower Japanese rates further. The Swiss franc is even more vulnerable. In contrast to Japan, Switzerland is a small open economy that has to import most of its products (Chart I-11). This means that the Swiss National Bank has a very high incentive to intervene in currency markets during a crisis, given that a rally in the franc could depress inflation severely. What about U.S. TIPS? In contrast to nominal government bond yields or even yields on corporate debt, U.S. real rates are not limited by the zero bound (Chart I-12). This makes TIPS a more attractive option than other fixed-income assets, since real rates can have much more room for further downside than nominal ones. To be clear, this will only be the case if our forecast of an inflationary crisis materializes. Likewise, since gold is heavily influenced by real rates, it should also offer significant upside during the next crisis.9 Chart I-12Real Rates Have More Downside Potential Than Nominal Ones
Real Rates Have More Downside Potential Than Nominal Ones
Real Rates Have More Downside Potential Than Nominal Ones
Costs: Can I afford to hold safe havens in a world of low returns? To provide an outlook for the expected cost of each safe haven, we use the return assumptions from our June Special Report.10 We subtract the expected return on global equities from the expected return for each safe haven to reach an expected cost value. However, three of the safe havens (global ex-U.S. government bonds, the Swiss franc and silver) did not have a return estimate. We compute their expected returns as follows: For the Swiss franc we use the methodology we used for all other currencies in our report. We base the expected return on the current divergence from the IMF PPP value, as well as the IMF inflation estimates. In addition, we add the relative cash rate assumed return for both our yen and Swiss franc estimates, as futures take into account carry return. For global ex-U.S. bonds we take the weighted average of the expected return of the euro area, Japan, U.K., Canada, and Australia government bonds. We weight the returns according to their market capitalization in the Bloomberg/Barclays government bond index. Due to silver’s dual role as an inflation hedge and industrial metal, silver prices are a function of both gold prices and global growth. To obtain a return estimate we run a regression on silver against these two variables and use our growth and gold return estimate to arrive at an assumed return for silver. Chart I-13 shows our results: while their cost will improve, currency futures remain the most expensive hedge. The opportunity cost of precious metals and cash will decrease, making them more attractive options than in the past. Meanwhile, low yields will increase the opportunity costs of most fixed-income assets. Finally, farmland will remain the cheapest safe haven, even with decreased performance. Chart I-13Oportunity Cost For Fixed Income Safe Havens Will Be Higher Than In The Past
Safe Haven Review: A Guide To Portfolio Protection In The 2020s
Safe Haven Review: A Guide To Portfolio Protection In The 2020s
Juan Manuel Correa Ossa Senior Analyst juanc@bcaresearch.com Appendix A
Safe Haven Review: A Guide To Portfolio Protection In The 2020s
Safe Haven Review: A Guide To Portfolio Protection In The 2020s
Footnotes 1 Please see Geopolitical Strategy Special Report, "The Apex Of Globalization – All Downhill From Here, " dated November 12, 2014, available at gps.bcaresearch.com. 2 We use a synthetic TIPS series for data prior to 1997. For details on the methodology, please see: Kothari, S.P. and Shanken, Jay A., “Asset Allocation with Inflation-Protected Bonds,” Financial Analysts Journal, Vol. 60, No. 1, pp. 54-70, January/February 2004. 3 For a detailed list of how we classified each equity drawdown, please see Appendix A. 4 The only crises caused by a rate/inflation shock occurred in 1974 and 1980. Thus we have this type of drawdown only in Chart 3A and not in Chart 3B. 5 For yen, Swiss franc, silver and gold futures we assume an allocation to an ETF which follows their performance. Since futures have zero initial costs they cannot be directly compared to traditional assets in terms of percentage allocation. 6 We prefer this measure over VaR given that it captures the properties of the left tail of returns more accurately. 7 While the farmland index subtracts management fees, we recognize that there are costs involved in holding these illiquid assets which are not necessarily captured by the return indices. Thus, the real historical cost of holding farmland was not negative but likely close to zero. 8 Please see Global Asset Allocation Strategy Special Report "Investors’ Guide To Inflation Hedging: How To Invest When Inflation Rises," dated May 22, 2019, available at gaa.bcaresearch.com. 9 Please see Commodity & Energy Strategy Special Report "All that Glitters…And Then Some" dated July 25, 2019, available at ces.bcaresearch.com. 10 Please see Global Asset Allocation Strategy Special Report "Return Assumptions - Refreshed and Refined" dated June 25, 2019,
Highlights Equities & Bonds: The accelerating upward momentum of global equities – the ultimate “leading economic indicator” – suggests that the current rise in global bond yields can continue. Maintain below-benchmark overall duration exposure, while staying overweight global corporate credit versus government bonds. U.S. Agency MBS: U.S. agency MBS spreads are now attractive relative to high-quality U.S. corporate bonds, both in absolute terms and on a risk-adjusted basis. Increase allocations to agency MBS, while reducing exposure to Aaa-, Aa- and A-rated U.S. corporates. Feature The U.S. Federal Reserve and European Central Bank (ECB) are both set to ease monetary policy this week. The Fed is almost certain to deliver a third consecutive 25bp rate cut at tomorrow’s FOMC meeting, while the ECB will restart its bond buying program on Friday. Yet government bond yields around the world continue to drift higher, as markets reduce expectations of incremental rate cuts moving forward. Equity prices are an excellent leading indicator of global growth, while bond yields typically reflect current economic conditions. Thus, equity prices should be considered a leading indicator of bond yields. Chart of the WeekMore Upside For Global Bond Yields
More Upside For Global Bond Yields
More Upside For Global Bond Yields
Yields are finally responding to the evidence that global growth is troughing - a dynamic that we have been telegraphing in recent weeks. Global equity markets are rallying, with the U.S. S&P 500 hitting a new all-time high yesterday. The year-over-year increase in global equities, using the MSCI World Index, is now at +10%, the fastest pace of upward acceleration seen since January 2017. Some of that rally in U.S. stock markets can be chalked up to 3rd quarter earnings beating depressed expectations. Yet there is also a forward-looking component of the rally that bond markets are starting to notice. Equity prices are an excellent leading indicator of global growth, while bond yields typically reflect current economic conditions. Thus, equity prices should be considered a leading indicator of bond yields. We see no reason to discount the positive message on growth from rallying equity markets, especially when confirmed by an improvement in our global leading economic indicator (LEI), led by the more cyclical emerging market (EM) countries (Chart of the Week). Falling stock prices in 2018 accurately heralded the global growth slowdown of 2019 which triggered the huge decline in bond yields. Why should rising stock prices not be interpreted in the same light, predicting better global growth – and higher bond yields – over the next 6-12 months? Multiple Signals Point To Higher Bond Yields The more optimistic message on growth is not only confined to developed market (DM) stock prices. EM equities and currencies have begun to perk up, with EM corporate credit spreads remaining stable, as well, mimicking the moves seen in U.S. credit markets. Bond volatility measures like the U.S. MOVE index of Treasury options are retreating to the lower levels implied by equity volatility indices like the U.S. VIX index, which is now just above the 2019 low (Chart 2). Markets are clearly pricing out some of the more negative tail-risk outcomes that prevailed through much of 2019. Some of that reduction in volatility can be attributed to the recent de-escalation of U.S.-China trade tensions and U.K. Brexit risks, both important developments that can help lift depressed global business confidence. A reduction in trade/political uncertainty should help fortify the transmission mechanism between easing global financial conditions and economic activity – an outcome that could extend the rise in yields given stretched bond-bullish duration positioning (Chart 3). Chart 2A More Pro-Risk Global Market Backdrop
A More Pro-Risk Global Market Backdrop
A More Pro-Risk Global Market Backdrop
Chart 3Less Uncertainty = Higher Yields
Less Uncertainty = Higher Yields
Less Uncertainty = Higher Yields
The improving global growth story remains the bigger factor pushing bond yields higher, though. While the manufacturing PMI data within the DM world remain weak, the downward momentum is starting to bottom out on a rate-of-change basis (Chart 4). The EM aggregate PMI index is showing even more improvement, sitting at 51 and above the year-ago level, helping confirm the pickup in EM equity market momentum (bottom panel). Importantly, if this is indeed the trough in the EM PMI, the index would have bottomed above the 2015 trough of 48.5. Given the improvement seen in “Big Mo” for global equities and global LEIs and PMIs, we remain comfortable with our current below-benchmark stance on global interest rate duration exposure. Given the improvement seen in “Big Mo” for global equities and global LEIs and PMIs, we remain comfortable with our current below-benchmark stance on global interest rate duration exposure. How high could yields rise in the near term? Looking at yields on a country-by-country level, a reasonable initial target for yields would be a return to the medium-term trend as defined by the 200-day moving average (MA). For benchmark 10-year DM government yields, those targets are: U.S. Treasuries: the 200-day MA is 2.18%, +23bps above the current level German Bunds: the 200-day MA is -0.22%, +11bps above the current level U.K. Gilts: the 200-day MA is 0.89%, +17bps above the current level Japanese government bonds (JGBs): the 200-day MA is -0.10%, +2bps above the current level Canadian government bonds: the 200-day MA is 1.59%, -2bps below the current level Australian government bonds: the 200-day MA is 1.53%, +43bps above the current level Among those markets, the U.S. is likely to reach the level implied by the 200-day MA, led by the market pricing out the -53bps of rate cuts over the next twelve months discounted in the U.S. Overnight Index Swap curve (Chart 5) – a number that includes the likely -25bp cut tomorrow. A move beyond that 200-day MA may take longer to develop, as it would require markets to begin pricing in some reversal of the Fed’s “mid-cycle cuts” of 2019. That outcome would first require a pickup in TIPS breakevens. The Fed would not feel justified in risking a tightening of financial conditions by signaling rate hikes without the catalyst of higher inflation expectations. Chart 4EM Growth Leading The Way?
EM Growth Leading The Way?
EM Growth Leading The Way?
Chart 5UST Yields Have More Upside
UST Yields Have More Upside
UST Yields Have More Upside
German Bund yields are even closer to that 200-day MA than Treasuries but, as in the U.S., a sustained move beyond that level would require an increase in bombed-out inflation expectations, with the 10-year EUR CPI swap rate now sitting at only 1.05% (Chart 6). As for other markets, the likelihood of reaching, or breaching, the 200-day MA is more varied (Chart 7). Chart 6Bund Yield Upside Limited By Inflation
Bund Yield Upside Limited By Inflation
Bund Yield Upside Limited By Inflation
The move in the Canadian 10-year yield to just above its 200-day MA fits with Canada’s status as a “high-beta” bond market, as we discussed in last week’s report.1 Chart 7Which Yields Will Test The 200-day MA?
Which Yields Will Test The 200-day MA?
Which Yields Will Test The 200-day MA?
The Bank of Canada also meets this week and, while no change in policy is expected, the central bank will be publishing a new Monetary Policy Report that will update their current line of thinking about the Canadian economy and inflation. U.K. Gilts should easily blow through the 200-day MA if and when a final Brexit deal is signed, as the Bank of England remains highly reluctant to consider any policy easing even as political uncertainty weighs on economic growth. With the European Union now agreeing to an extension of the Brexit deadline to January 31, and with U.K. prime minister Boris Johnson now pursuing an early election in December, the political risk premium in Gilts will persist. Thus, Gilt yields will likely lag the move higher seen in higher-beta markets like the U.S. and Canada. JGBs remain the ultimate low-beta bond market with the Bank of Japan continuing to anchor the 10-yield around 0%, making Japan a good overweight candidate in an environment of rising global bond yields. Australian bond yields have the largest distance to the 200-day MA, but the Reserve Bank of Australia is giving little indication that it is ready to shift away from its dovish bias anytime soon, while inflation remains subdued. We do not expect a rapid jump in yields back towards the medium-term trend in the near term, and Australian yields will continue to lag the pace of the uptrend in the higher-beta global bond markets. Net-net, a climb in yields over the next 3-6 months to (or beyond) the 200-day MA is most likely in the U.S. and Canada, and least likely in Japan, Germany and Australia (and the U.K. until the Brexit uncertainty is finally sorted out). Bottom Line: The accelerating momentum of global equities – the ultimate “leading economic indicator” – is suggesting that the current rise in global bond yields can continue. Maintain below-benchmark overall duration exposure, while staying overweight global corporate credit versus government bonds. Raise Allocations To U.S. Agency MBS Out Of Higher Quality Corporate Credit Chart 8U.S. MBS More Attractive Than High-Rated U.S. Corporates
U.S. MBS More Attractive Than High-Rated U.S. Corporates
U.S. MBS More Attractive Than High-Rated U.S. Corporates
Our colleagues at our sister service, BCA Research U.S. Bond Strategy, recently initiated a recommendation to favor U.S. agency MBS versus high-rated (Aaa, Aa, A) U.S. corporate bonds.2 This week, we are adding this position to the BCA Research Global Fixed Income Strategy recommended model bond portfolio. There are three factors supporting this recommendation: 1) The absolute level of MBS spreads is competitive The average option-adjusted spread (OAS) for conventional 30-year U.S. agency MBS – rated Aaa and with the backing of U.S. government housing agencies - is currently 57bps. That is only 3bps below the spread on Aa-rated corporates and 26bps below that of A-rated credit. (Chart 8). 2) Risk-adjusted MBS spreads look very attractive Agency MBS exhibit negative convexity, with an interest rate duration that declines when yields fall. The opposite is true for positively convex investment grade corporate bonds, where the duration rises as yields decrease. This makes agency MBS look attractive on a risk-adjusted basis after the kind of big decline in bond yields seen in 2019. The average duration of the Bloomberg Barclays U.S. agency MBS index is now only 3.4 compared to 7.9 for an A-rated corporate bond. Both of those durations were around similar levels at the 2018 peak in U.S. bond yields, but now the gap between them is large. With those new durations, it would take a 17bp widening of the agency MBS spread for an investor to see losses versus duration-matched U.S. Treasuries, compared to only an 11bp widening of the A-rated corporate spread (bottom panel). This is a big change in the relative risk profile of agency MBS versus high-rated U.S. corporates compared to a year ago, making the former look relatively more attractive. That was not the case the last time agency MBS duration fell so sharply in 2015/16, since corporate bond spreads were widening (getting cheaper) at that time. Today, corporate bond spreads have been stable as corporate duration has increased and agency MBS duration has plunged, making risk-adjusted MBS spreads more attractive. Given our view that U.S. Treasury yields will continue to grind higher, favoring lower duration assets like agency MBS over higher duration investment grade corporates makes sense. Given our view that U.S. Treasury yields will continue to grind higher, favoring lower duration assets like agency MBS over higher duration investment grade corporates makes sense. 3) Macro risks are reduced Mortgage refinancing activity remains the biggest macro driver of MBS spreads, particularly in an environment when mortgage rates are falling and prepayments are accelerating. There was a pickup in refinancing activity over the past year as mortgage rates fell, but the increase has been small relative to similar-sized rate declines in the past (Chart 9). We interpret this as an indication that, after the sustained period of low mortgage rates seen in the decade since the Great Financial Crisis, most homeowners have already had an opportunity to refinance. In other words, the so-called “refi burnout“ is now quite high. Chart 9Muted Refi Activity Keeping Nominal U.S. MBS Spreads Low
Muted Refi Activity Keeping Nominal U.S. MBS Spreads Low
Muted Refi Activity Keeping Nominal U.S. MBS Spreads Low
Beyond refinancing, the other macro risks for agency MBS are subdued. The credit quality of outstanding U.S. mortgages remains solid. The median credit (FICO) score for newly-issued mortgages remains high and stable near the post-2008 crisis highs, while mortgage lending standards have mostly been easing over that same period according to the Federal Reserve Senior Loan Officers Survey. In addition, U.S. housing activity remains solid, with the most reliable indicators like single-family new home sales and the National Association of Home Builders activity surveys all up solidly following this year’s sharp drop in mortgage rates (Chart 10). This makes MBS less risky for two reasons: a) stronger housing activity typically leads to higher mortgage rates, which limits future refi activity; and b) more robust housing demand will boost home prices, the value of the underlying collateral for MBS securities. Chart 10U.S. Housing Activity Hooking Up
U.S. Housing Activity Hooking Up
U.S. Housing Activity Hooking Up
Chart 11Relative Value Favoring U.S. MBS Over U.S. Corporates
Relative Value Favoring U.S. MBS Over U.S. Corporates
Relative Value Favoring U.S. MBS Over U.S. Corporates
Given the improved risk-reward balance of agency MBS versus higher-quality U.S. corporates, we recommend that dedicated fixed income investors make this shift within bond portfolios, reducing allocations to Aaa-rated, Aa-rated and A-rated corporates while increasing exposure to agency MBS. Agency MBS is part of the investment universe of our model bond portfolio. Thus, we are increasing the recommended weighting of agency MBS while reducing the exposure to U.S. investment grade corporates in the portfolio. The changes can be seen in the table on Page 11. We do not split out the investment grade exposure by credit tier in the portfolio, as we prefer to allocate by broad sector groupings (Financials, Industrials, Utilities). So we cannot implement the precise “MBS for high-rated corporates” switch in the model portfolio. There is still a case for reducing overall investment grade exposure and adding to MBS weightings, however. The relative option-adjusted spread of agency MBS and investment grade corporates typically leads the relative excess returns (over duration-matched U.S. Treasuries) between the two by around one year (Chart 11). Thus, the compression of the spread differential between MBS and corporates over the past year is signaling that agency MBS should be expected to outperform the broad U.S. investment grade universe over the next twelve months. Bottom Line: U.S. agency MBS spreads are now attractive relative to high-quality U.S. corporate bonds, both in absolute terms and on a risk-adjusted basis. Increase allocations to agency MBS, while reducing exposure to Aaa-, Aa- and A-rated U.S. corporates. Robert Robis, CFA Chief Fixed Income Strategist rrobis@bcaresearch.com Footnotes 1 Please see BCA Research Global Fixed Income Strategy Weekly Report, “Cracks Are Forming In The Bond-Bullish Narrative”, dated October 23, 2019, available at gfis.bcaresearch.com. 2 Please see BCA Research U.S. Bond Strategy Weekly Report, “Two Themes And Two Trades”, dated October 1, 2019, available at usbs.bcaresarch.com. Recommendations The GFIS Recommended Portfolio Vs. The Custom Benchmark Index
Big Mo(mentum) Is Turning Positive
Big Mo(mentum) Is Turning Positive
Duration Regional Allocation Spread Product Tactical Trades Yields & Returns Global Bond Yields Historical Returns
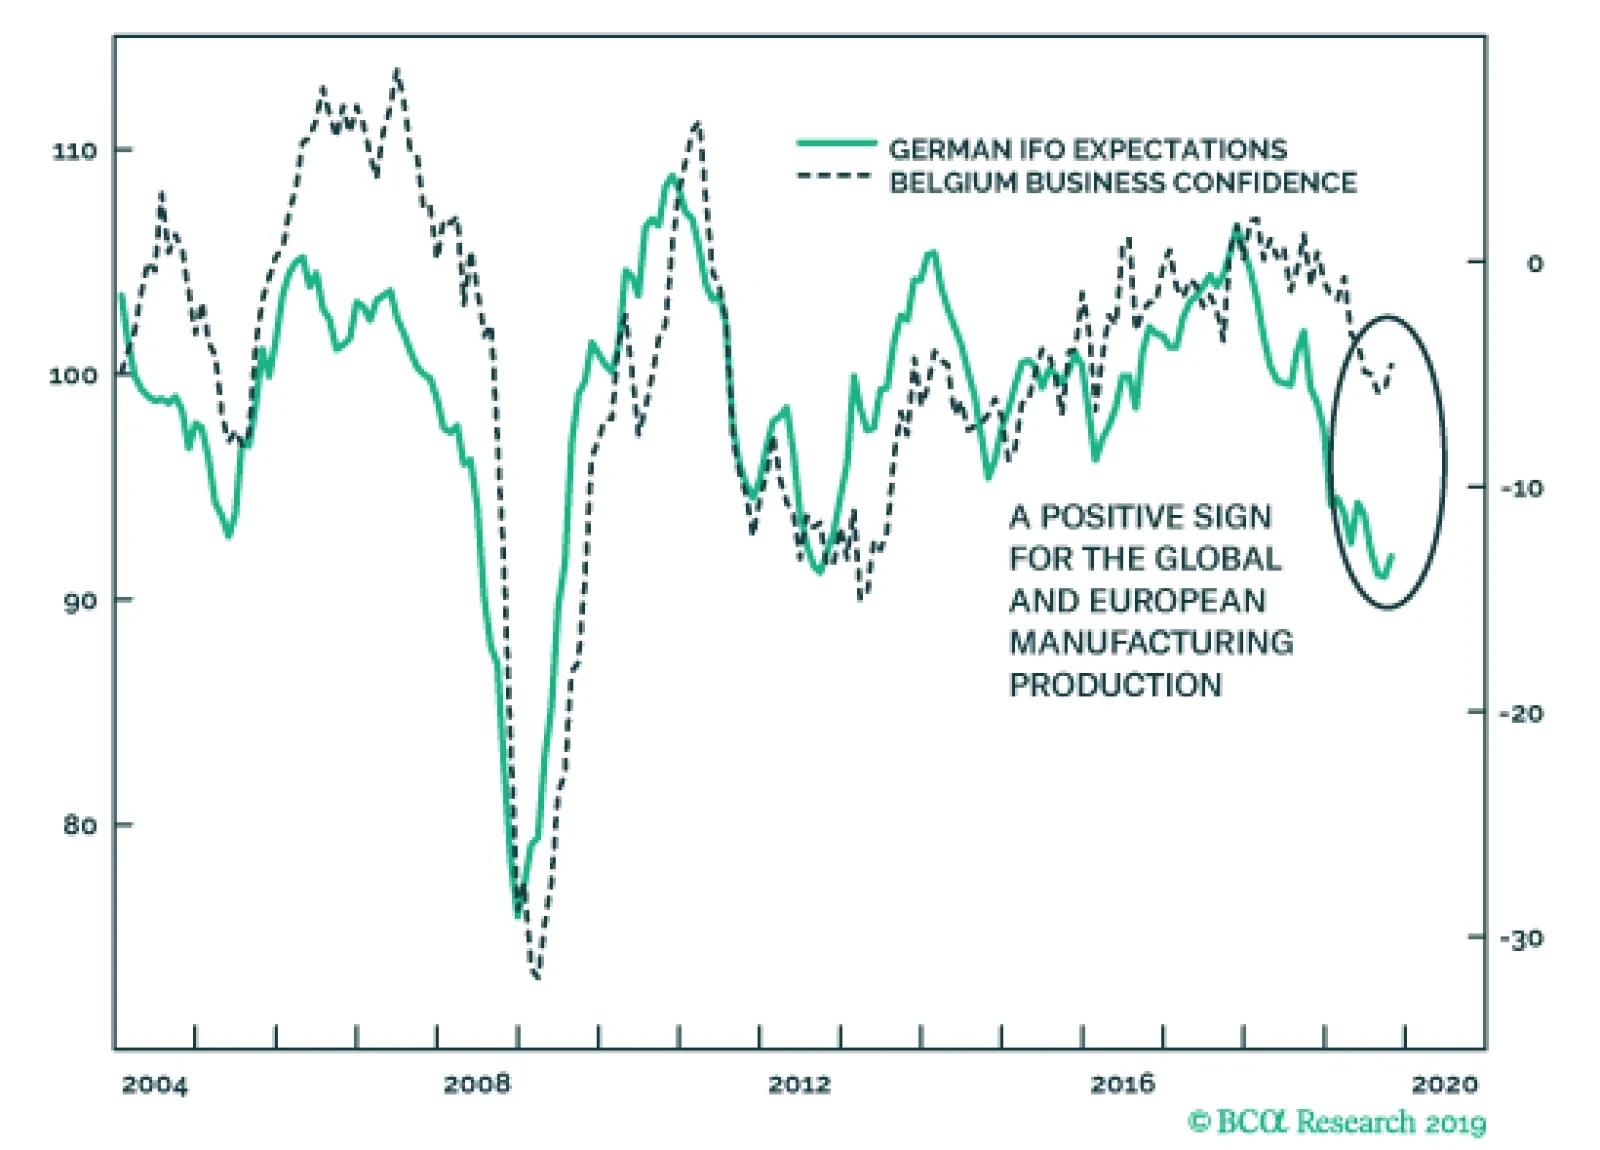
On the heels of yesterday’s disappointing German PMIs, the October Belgian Business Confidence and German IFO surveys will help alleviate fears towards the European economy. While the current assessment component of the IFO softened from 98.5 to 97.8, the…
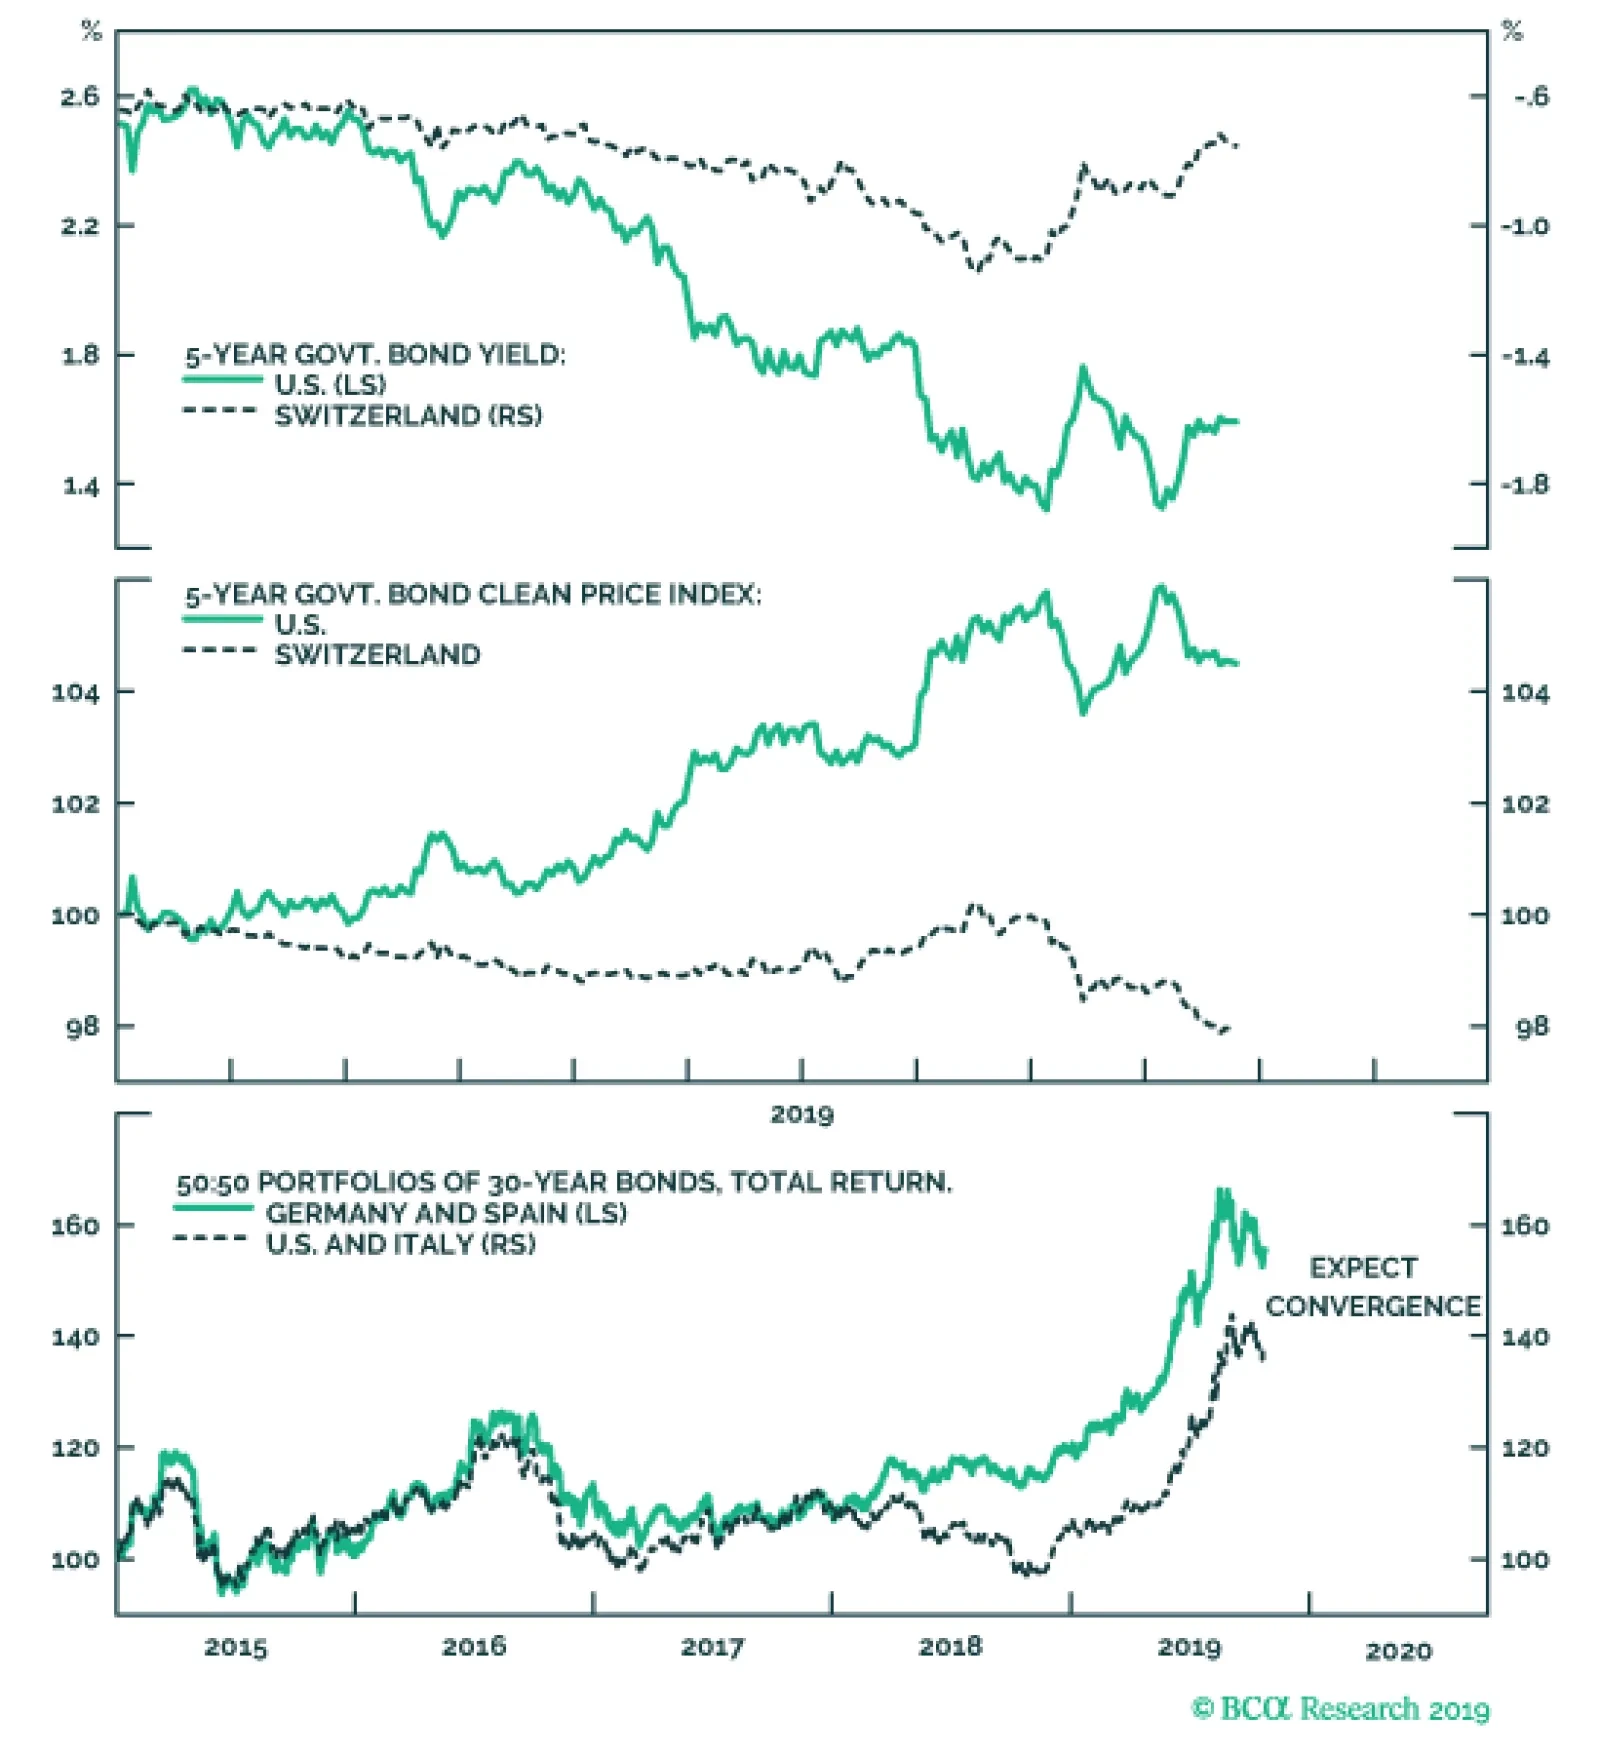
The closer a bond yield gets to the -1 percent lower bound, the more limited becomes the possibility for a further yield decline (capital gain), while the possibility for a yield increase (capital loss) stays unlimited. This creates a negative skew or…
Highlights The U.S. and China are moving toward formalizing a trade ceasefire that reduces geopolitical risk in the near term. The risk of a no-deal Brexit is finished – removing a major downside to European assets. Spanish elections reinforce our narrative of general European political stability. Go long 10-year Italian BTPs / short 10-year Spanish bonos for a trade. Geopolitical risks will remain elevated in Turkey, rise in Russia, but remain subdued in Brazil. A post-mortem of Canada’s election suggests upside to fiscal spending but further downside to energy sector investment over the short to medium term. Feature After a brief spike in trade war-related geopolitical risk just prior to the resumption of U.S.-China negotiations, President Trump staged a tactical retreat in the trade war. Chart 1Proxy For Trade War Shows Falling Risk
Proxy For Trade War Shows Falling Risk
Proxy For Trade War Shows Falling Risk
Negotiating in Washington, President Trump personally visited the top Chinese negotiator Liu He and the two sides announced an informal “phase one deal” to reverse the summer’s escalation in tensions: China will buy $40-$50 billion in U.S. agricultural goods while the U.S. will delay the October 15 tariff hike. More difficult issues – forced tech transfer, intellectual property theft, industrial subsidies – were punted to later. The RMB is up 0.7% and our own measures of trade war-related risk have dropped off sharply (Chart 1). We think these indicators will be confirmed and Trump’s retreat will continue – as long as he has a chance to save the 2020 economic outlook and his reelection campaign. Odds are low that Trump will be removed from office by a Republican-controlled senate – the looming election provides the republic with an obvious recourse for Trump’s alleged misdeeds. However, Trump’s approval rating is headed south. While it is around the same level as President Obama’s at this point in his first term, Obama’s started a steep and steady rise around now and ended above 50% for the election, a level that is difficult to foresee for Trump (Chart 2). So Trump desperately needs an economic boost and a policy victory to push up his numbers. Short of passing the USMCA, which is in the hands of the House Democrats, a deal with China is the only way to get a major economic and political win at the same time. Hence the odds of Presidents Trump and Xi actually signing some kind of agreement are the highest they have been since April (when we had them pegged at 50/50). Trump will have to delay the December 15 tariff hike and probably roll back some of the tariffs over next year as continuing talks “make progress,” though we doubt he will remove restrictions on tech companies like Huawei. Still, we strongly believe that what is coming is a détente rather than the conclusion of the Sino-American rivalry crowned with a Bilateral Trade Agreement. Strategic tensions are rising on a secular basis between the two countries. These tensions could still nix Trump’s flagrantly short-term deal-making, and they virtually ensure that some form of trade war will resume in 2021 or 2022, if indeed a ceasefire is maintained in 2020. Both sides are willing to reduce immediate economic pain but neither side wants to lose face politically. Trump will not forge a “grand compromise.” Our highest conviction view all along has been – and remains – that Trump will not forge a “grand compromise” ushering in a new period of U.S.-China economic reengagement in the medium or long term. China’s compliance, its implementation of structural changes, will be slow or lacking and difficult to verify at least until the 2020 verdict is in. This means policy uncertainty will linger and business confidence and capex intentions will only improve on the margin, not skyrocket upward (Chart 3). Chart 2Trump Needs A Policy Win And Economic Boost
How Much To Buy An American President? – GeoRisk Update: October 25, 2019
How Much To Buy An American President? – GeoRisk Update: October 25, 2019
Chart 3Sentiment Will Improve ... Somewhat
Sentiment Will Improve ... Somewhat
Sentiment Will Improve ... Somewhat
The problem for bullish investors is that even if global trade uncertainty falls, and the dollar’s strength eases, fear will shift from geopolitics to politics, and from international equities to American equities (Chart 4). Trump, hit by impeachment and an explosive reaction to his Syria policy, is entering into dangerous territory for the 2020 race. Trump’s domestic weakness threatens imminent equity volatility for two reasons. Chart 4American Outperformance Falls With Trade Tensions
bca.gps_wr_2019_10_25_c4
bca.gps_wr_2019_10_25_c4
Chart 5Democratic Win In 2020 Is Market-Negative
Democratic Win In 2020 Is Market-Negative
Democratic Win In 2020 Is Market-Negative
First, if Trump’s approval rating falls below today’s 42%, investors will begin pricing a Democratic victory in 2020, i.e. higher domestic policy uncertainty, higher taxes, and the re-regulation of the American economy (Chart 5). This re-rating may be temporarily delayed or mitigated by the fact that former Vice President Joe Biden is still leading the Democratic Party’s primary election race. Biden is a known quantity whose policies would simply restore the Obama-era status quo, which is only marginally market-negative. Contrary to our expectations Biden's polling has not broken down due to accusations of foul play in Ukraine and China. Nevertheless, Senator Elizabeth Warren will gradually suck votes away from fellow progressive Senator Bernie Sanders and in doing so remain neck-and-neck with Biden (Chart 6). When and if she pulls ahead of Biden, markets face a much greater negative catalyst. (Yes, she is also capable of beating Trump, especially if his polling remains as weak as it is.) Chart 6Warren Will Rise To Front-Runner Status With Biden
How Much To Buy An American President? – GeoRisk Update: October 25, 2019
How Much To Buy An American President? – GeoRisk Update: October 25, 2019
Second, if Trump becomes a “lame duck” he will eventually reverse the trade retreat above and turn into a loose cannon in his final months in office. Right now we see a decline in geopolitical risk, but if the economy fails to rebound or the China ceasefire offers little support, then Trump will at some point conclude that his only chance at reelection is to double down on his confrontation with America’s enemies and run as a “war president.” A cold war crisis with China, or a military confrontation with Iran (or North Korea, Venezuela, or some unexpected target) could occur. But since September we have been confirmed in believing that Trump is trying to be the dealmaker one last time before any shift to the war president. Bottom Line: The “phase one” trade deal is really just a short-term ceasefire. Assuming it is signed by Trump and Xi, it suggests no increase in tariffs and some tariff rollback next year. However, as recessionary fears fade, and if Trump’s reelection chances stabilize, U.S.-China tensions on a range of issues will revive – and there is no getting around the longer-term conflict between the two powers. For this and other reasons, we remain strategically short RMB-USD, as the flimsy ceasefire will only briefly see RMB appreciation. BoJo's Brexit Bluff Is Finished Our U.K. indicator captured a sharp decline in political risk in the past two weeks and our continental European indicators mirrored this move (Chart 7). The risk that the U.K. would fall out of the EU without a withdrawal agreement has collapsed even further than in September, when parliament rejected Prime Minister Boris Johnson’s no-deal gambit and we went long GBP-USD. We have since added a long GBP-JPY trade. Chart 7Collapse In No-Deal Risk Will Echo Across Europe
Collapse In No-Deal Risk Will Echo Across Europe
Collapse In No-Deal Risk Will Echo Across Europe
Chart 8Unlikely To See Another Tory/Brexit Rally Like This
Unlikely To See Another Tory/Brexit Rally Like This
Unlikely To See Another Tory/Brexit Rally Like This
The risk of “no deal” is the only reason to care about Brexit from a macro point of view, as the difference between “soft Brexit” and “no Brexit” is not globally relevant. What matters is the threat of a supply-side shock to Europe when it is already on the verge of recession. With this risk removed, sentiment can begin to recover (and Trump’s trade retreat also confirms our base case that he will not impose tariffs on European cars on November 14). Since Brexit was the only major remaining European political risk, European policy uncertainty will continue to fall. The Halloween deadline was averted because the EU, on the brink of recession, offered a surprising concession to Johnson, enabling him to agree to a deal and put it up for a vote in parliament. The deal consists of keeping Northern Ireland in the European Customs Union but not the whole of the U.K., effectively drawing a new soft border at the Irish Sea. The bill passed the second reading but parliament paused before finalizing it, rejecting Johnson’s rapid three-day time table. The takeaway is that even if an impending election returns Johnson to power, he will seek to pass his deal rather than pull the U.K. out without a deal. This further lowers the odds of a no-deal Brexit as it illuminates Johnson's preferences, which are normally hidden from objective analysis. True, there is a chance that the no-deal option will reemerge if Johnson’s deal totally collapses due to parliamentary amendments, or if the U.K. and EU have failed to agree to a future relationship by the end of the transition period on December 31, 2020 (which can be extended until the end of 2022). However, the chance is well below the 30% which we deemed as the peak risk of no-deal back in August. Johnson created the most credible threat of a no-deal exit that we are likely to see in our lifetimes – a government with authority over foreign policy determined to execute the outcome of a popular referendum – and yet parliament stopped it dead in its tracks. Johnson does not want a no-deal recession and his successors will not want one either. After all, the support for Brexit and for the Tories has generally declined since the referendum, and the Tories are making a comeback on the prospect of an orderly Brexit (Chart 8). All eyes will now turn toward the impending election. Opinion polls still show that Johnson is likely to be returned to power (Chart 9). The Tories have a prospect of engrossing the pro-Brexit vote while the anti-Brexit opposition stands divided. No-deal risk only reemerges if the Conservatives are returned to power with another weak coalition that paralyzes parliament. Chart 9Tory Comeback As BoJo Gets A Deal
Tory Comeback As BoJo Gets A Deal
Tory Comeback As BoJo Gets A Deal
Chart 10Brexit Means Greater Fiscal Policy
Brexit Means Greater Fiscal Policy
Brexit Means Greater Fiscal Policy
Whatever the election result, we maintain our long-held position that Brexit portends greater fiscal largesse (Chart 10). The agitated swath of England that drove the referendum result will not be assuaged by leaving the European Union – the rewards of Brexit are not material but philosophical, so material grievances will return. Voter frustration will rotate from the EU to domestic political elites. Voters will demand more government support for social concerns. Johnson’s own government confirms this point through its budget proposals. A Labour-led government would oversee an even more dramatic fiscal shift. Our GeoRisk indicator will fall on Brexit improvements but the question of the election and next government will ensure it does not fall too far. Our long GBP trades are tactical and we expect volatility to remain elevated. But the greatest risk, of no deal, is finished, so it does make sense for investors with a long time horizon to go strategically long the pound. The greatest risk, of a no deal Brexit, is finished. Bottom Line: Brexit posed a risk to the global economy only insofar as it proved disorderly. A withdrawal agreement by definition smooths the process. Continental Europe will not suffer a further shock to net exports. The Brexit contribution to global policy uncertainty will abate. The pound will rise against the euro and yen and even against the dollar as long as Trump’s trade retreat continues. Spain: Further Evidence Of European Stability We have long argued that the majority of Catalans do not want independence, but rather a renegotiation of the region's relationship with Spain (Chart 11). This month’s protests in Barcelona following the Catalan independence leaders’ sentencing are at the lower historical range in terms of size – protest participation peaked in 2015 along with support for independence (Table 1). Table 1October Catalan Protests Unimpressive
How Much To Buy An American President? – GeoRisk Update: October 25, 2019
How Much To Buy An American President? – GeoRisk Update: October 25, 2019
Our Spanish risk indicator is showing a decline in political risk (Chart 12). However, we believe that this fall is slightly overstated. While the Catalan independence movement is losing its momentum, the ongoing protests are having an impact on seat projections for the upcoming election. Chart 11Catalonians Not Demanding Independence
Catalonians Not Demanding Independence
Catalonians Not Demanding Independence
Chart 12Right-Wing Win Could Surprise Market, But No Worries
Right-Wing Win Could Surprise Market, But No Worries
Right-Wing Win Could Surprise Market, But No Worries
Since the April election, the right-wing bloc of the People’s Party, Ciudadanos, and Vox has been gaining in the seat projections at the expense of the Socialist Party and Podemos. Over the course of the protests, the left-wing parties’ lead over the right-wing parties has narrowed from seven seats to one (Chart 13). If this momentum continues, a change of government from left-wing to right-wing becomes likely. However, a right-wing government is not a market-negative outcome, and any increase in risk on this sort of election surprise would be short-lived. The People’s Party has moderated its message and focused on the economy. Besides pledging to limit the personal tax rate to 40% and corporate tax rate to 20%, the People’s Party platform supports innovation, R&D spending, and startups. The party is promising tax breaks and easier immigration rules to firms and employees pursuing these objectives. Chart 13Spanish Right-Wing Parties Narrow Gap With Left
How Much To Buy An American President? – GeoRisk Update: October 25, 2019
How Much To Buy An American President? – GeoRisk Update: October 25, 2019
Another outcome of the election would be a governing deal between PSOE and Podemos, along with case-by-case support from Ciudadanos. After a shift to the right lost Ciudadanos 5% in support since the April election, leader Albert Rivera announced in early October that he would be lifting the “veto” on working with the Socialist Party. If the right-wing parties fall short of a majority, then Rivera would be open to talks with Socialist leader Pedro Sanchez. A governing deal between PSOE, Podemos, and Ciudadanos would have 175 seats, as of the latest projections, which is just one seat short of a majority. As we go to press, this is the only outcome that would end Spain’s current political gridlock, and would therefore be the most market-positive outcome. Bottom Line: Despite having a fourth election in as many years, Spanish political risk is contained. This is reinforced by a relatively politically stable backdrop in continental Europe, and marginally positive developments in the U.K. and on the trade front. We remain long European versus U.S. technology, and long EU versus Chinese equities. We will also be looking to go long EUR/USD when and if the global hard data turn. Following our European Investment Strategy, we recommend going long 10-year Italian BTPs / short 10-year Spanish bonos for a trade. Turkey, Brazil, And Russia Chart 14Turkish Risk Will Rise Despite 'Ceasefire'
Turkish Risk Will Rise Despite 'Ceasefire'
Turkish Risk Will Rise Despite 'Ceasefire'
Turkey’s political risk skyrocketed upward after we issued our warning in September (Chart 14). We maintain that the Trump-Erdogan personal relationship is not a basis for optimism regarding Turkey’s evading U.S. sanctions. Both chambers of the U.S. Congress are preparing a more stringent set of sanctions, focusing on the Turkish military, in the wake of Trump’s decision to withdraw U.S. forces from northeast Syria. At a time when Trump needs allies in the senate to defend him against eventual impeachment articles, he is not likely to veto and risk an override. Moreover, Turkey’s military incursion into Syria, which may wax and wane, stems from economic and political weakness at home and will eventually exacerbate that weakness by fueling the growing opposition to Erdogan’s administration and requiring more unorthodox monetary and fiscal accommodation. It reinforces our bearish outlook on Turkish lira and assets. Chart 15Brazilian Risk Will Not Re-Test 2018 Highs
Brazilian Risk Will Not Re-Test 2018 Highs
Brazilian Risk Will Not Re-Test 2018 Highs
Brazil’s political risk has rebounded (Chart 15). The Senate has virtually passed the pension reform bill, as expected, which raises the official retirement age for men and women to 65 and 63 respectively. This will generate upwards of 800 billion Brazilian real in savings to improve the public debt profile. Of course, the country will still run primary deficits and thus the public debt-to-GDP ratio will still rise. Now the question shifts to President Jair Bolsonaro and his governing coalition. Bolsonaro’s approval rating has ticked up as we expected (Chart 16). If this continues then it is bullish for Brazil because it suggests that he will be able to keep his coalition together. But investors should not get ahead of themselves. Bolsonaro is not an inherently pro-market leader, there is no guarantee that he will remain disciplined in pursuing pro-productivity reforms, and there is a substantial risk that his coalition will fray without pension reform as a shared goal (at least until markets riot and push the coalition back together). Therefore we expect political risk to abate only temporarily, if at all, before new trouble emerges. Furthermore, if reform momentum wanes next year, then Brazil’s reform story as a whole will falter, since electoral considerations emerge in 2021-22. Hence it will be important to verify that policymakers make progress on reforms to tax and trade policy early next year. Our Russian geopolitical risk indicator is also lifting off of its bottom (see Appendix). This makes sense given Russia’s expanding strategic role (particularly in the Middle East), its domestic political troubles, and the risks of the U.S. election. The latter is especially significant given the risk (not our base case, however) that a Democratic administration could take a significantly more aggressive posture toward Russia. Political risk in Turkey and Russia will continue to rise. Bottom Line: Political risk in Turkey and Russia will continue to rise. Russia is a candidate for a “black swan” event, given the eerie quiet that has prevailed as Putin devotes his fourth term to reducing domestic political instability. Brazil, on the other hand, has a 12-month window in which reform momentum can be reinforced, reducing whatever spike in risk occurs in the aftermath of the ruling coalition’s completion of pension reform. Canada: Election Post-Mortem Prime Minister Justin Trudeau returned to power at the head of a minority government in Canada’s federal election (Chart 17). The New Democratic Party (NDP) lost 15 seats from the last election, but will have a greater role in parliament as the Liberals will need its support to pass key agenda items (and a formal governing coalition is possible). The NDP’s result would have been even worse if not for its last-minute surge in the polls after the election debates and Trudeau’s “blackface” scandal. Chart 17Liberals Need The New Democrats Now
How Much To Buy An American President? – GeoRisk Update: October 25, 2019
How Much To Buy An American President? – GeoRisk Update: October 25, 2019
The Conservative Party won the popular vote but only 121 seats in parliament, leaving the western provinces of Alberta and Saskatchewan aggrieved. The Bloc Québécois, the Quebec nationalist party, gained 22 seats to become the third-largest party in the House. Energy investment faces headwinds in the near-term. The Liberal Party will face resistance from the Left over the Trans Mountain pipeline. Trudeau will not necessarily have to sacrifice the pipeline to appease the NDP. He may be able to work with Conservatives to advance the pipeline while working with the NDP on the rest of his agenda. But on the whole the election result is the worst-case scenario for the oil sector and political questions will have to be resolved before Canada can take advantage of its position as a heavy crude producer near the U.S. Gulf refineries in an era in which Venezuela is collapsing and Saudi Arabia is exposed to geopolitical risk and attacks. More broadly, the Liberals will continue to endorse a more expansive fiscal policy than expected, given Canada’s low budget deficits and the need to prevent minor parties from eating away at the Liberal Party’s seat count in future. Bottom Line: The Liberal Party failed to maintain its single-party majority. Trudeau’s reliance on left-wing parties in parliament may prove market-negative for the Canadian energy sector, though that is not a forgone conclusion. Over the longer term the sector has a brighter future. Matt Gertken Geopolitical Strategist mattg@bcaresearch.com Ekaterina Shtrevensky Research Analyst ekaterinas@bcaresearch.com Appendix GeoRisk Indicator
TRADE WAR GEOPOLITICAL RISK INDICATOR
TRADE WAR GEOPOLITICAL RISK INDICATOR
U.K.: GeoRisk Indicator
U.K.: GEOPOLITICAL RISK INDICATOR
U.K.: GEOPOLITICAL RISK INDICATOR
France: GeoRisk Indicator
FRANCE: GEOPOLITICAL RISK INDICATOR
FRANCE: GEOPOLITICAL RISK INDICATOR
Germany: GeoRisk Indicator
GERMANY: GEOPOLITICAL RISK INDICATOR
GERMANY: GEOPOLITICAL RISK INDICATOR
Spain: GeoRisk Indicator
SPAIN: GEOPOLITICAL RISK INDICATOR
SPAIN: GEOPOLITICAL RISK INDICATOR
Italy: GeoRisk Indicator
ITALY: GEOPOLITICAL RISK INDICATOR
ITALY: GEOPOLITICAL RISK INDICATOR
Canada: GeoRisk Indicator
CANADA: GEOPOLITICAL RISK INDICATOR
CANADA: GEOPOLITICAL RISK INDICATOR
Russia: GeoRisk Indicator
RUSSIA: GEOPOLITICAL RISK INDICATOR
RUSSIA: GEOPOLITICAL RISK INDICATOR
Turkey: GeoRisk Indicator
TURKEY: GEOPOLITICAL RISK INDICATOR
TURKEY: GEOPOLITICAL RISK INDICATOR
Brazil: GeoRisk Indicator
BRAZIL: GEOPOLITICAL RISK INDICATOR
BRAZIL: GEOPOLITICAL RISK INDICATOR
Taiwan: GeoRisk Indicator
TAIWAN: GEOPOLITICAL RISK INDICATOR
TAIWAN: GEOPOLITICAL RISK INDICATOR
Korea: GeoRisk Indicator
KOREA: GEOPOLITICAL RISK INDICATOR
KOREA: GEOPOLITICAL RISK INDICATOR
What's On The Geopolitical Radar?
How Much To Buy An American President? – GeoRisk Update: October 25, 2019
How Much To Buy An American President? – GeoRisk Update: October 25, 2019
Section III: Geopolitical Calendar
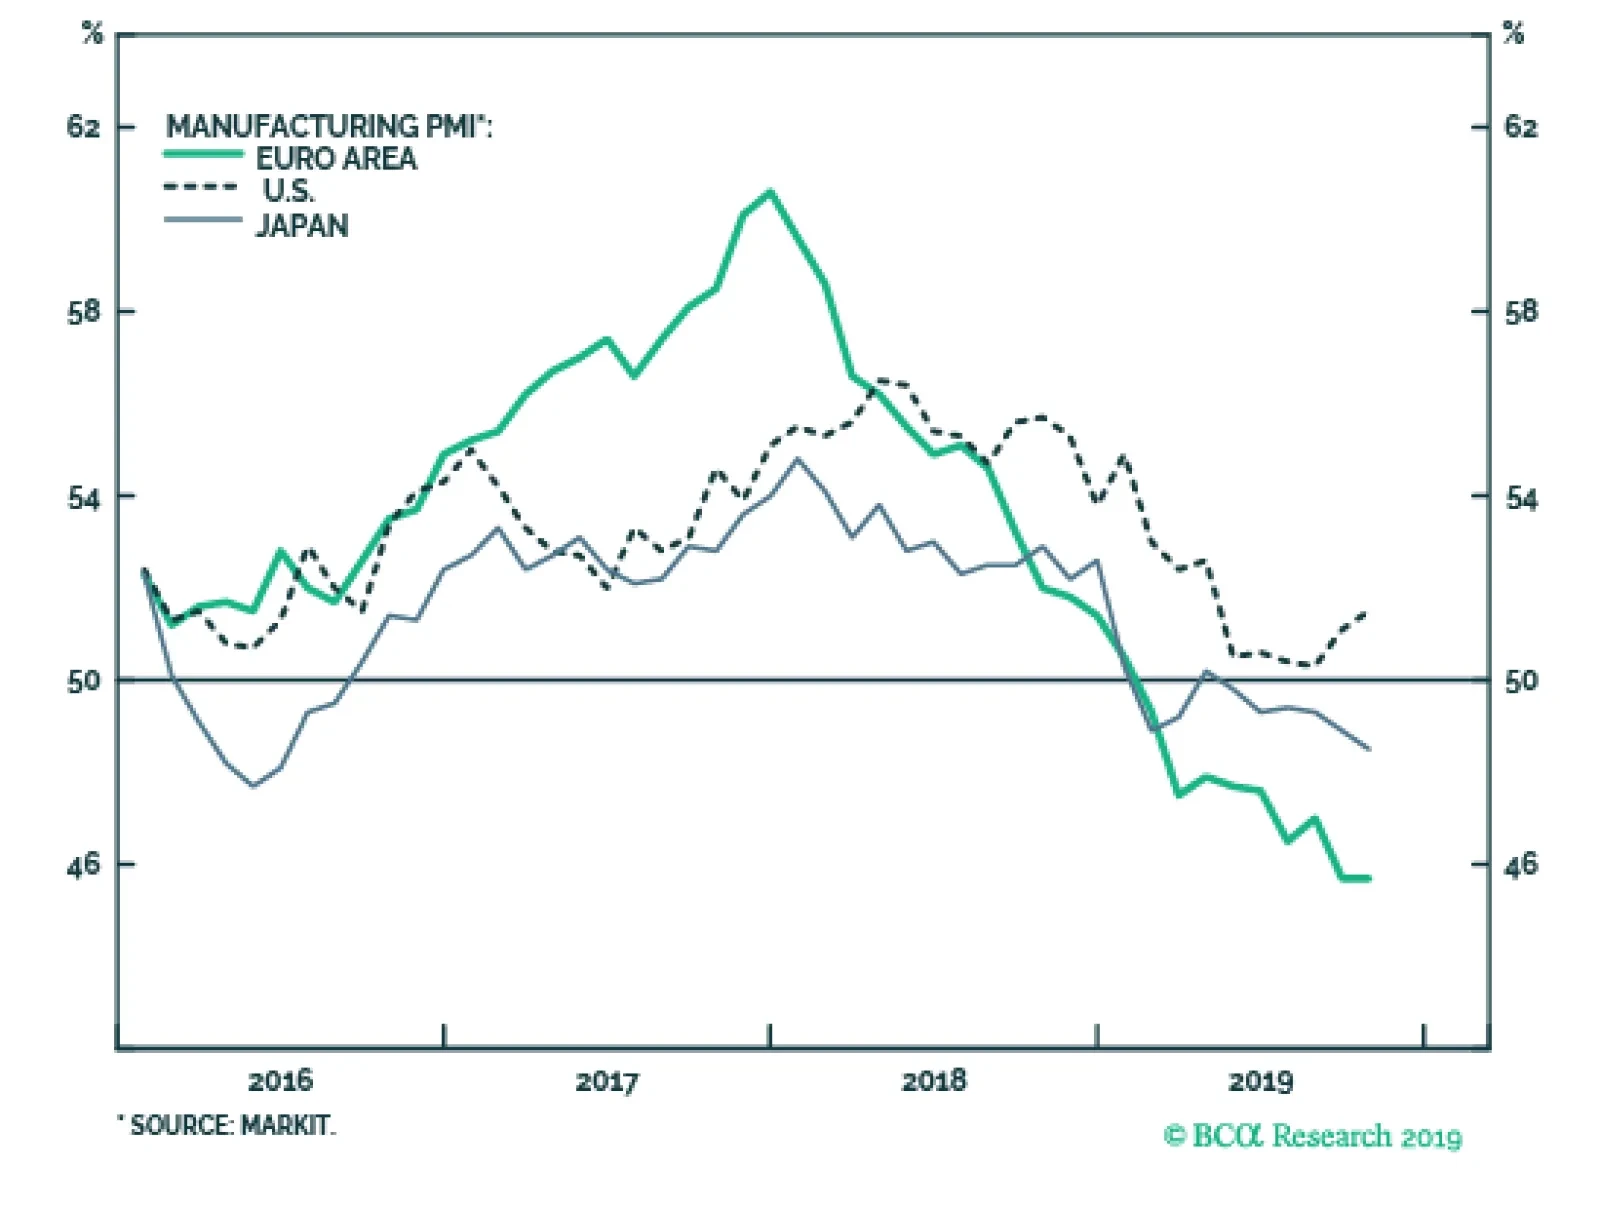
The October flash PMIs released this morning show a very modest stabilization. The Eurozone manufacturing gauge was stable at 45.7, as was Germany’s which increased slightly from 41.7 to 41.9. France’s manufacturing index rebounded from 50.5 to 50.1. Japanese…
Highlights On a tactical horizon, underweight bonds versus cash, especially those bonds with deeply negative yields… …and underweight bonds versus equities. On a strategic horizon, remain overweight a 50:50 combination of U.S. T-bonds and Italian BTPs versus a 50:50 combination of German Bunds and Spanish Bonos, at either 10-year or 30-year bond maturities. Investors could also play the component pairs: overweight U.S. T-bonds versus German bunds; and overweight Italian BTPs versus Spanish Bonos. New recommendation: switch Japanese yen long exposure into Swedish krona long exposure. Fractal trade: long SEK/JPY. Feature Chart of the WeekSwiss Bond Yields Have Found It Difficult To Go Down, But Easy To Go Up!
Swiss Bond Yields Have Found It Difficult To Go Down, But Easy To Go Up!
Swiss Bond Yields Have Found It Difficult To Go Down, But Easy To Go Up!
Anybody who has dared to bet that JGB yields would rise has ended up being carried out of their job, feet first. Shorting Japanese government bonds (JGBs) is known as the widow maker trade. Over the past 20 years, any investment manager who has dared to bet that JGB yields would rise – whether starting from 2 percent, 1 percent, or even 0.5 percent – has ended up being carried out of their job in a box, feet first. Today, the Bank of Japan’s policy of ‘yield curve control’ means that JGB yields are constrained within a tight range around zero, limiting their immediate scope to break higher. The European equivalent of the widow maker trade has been to short Swiss government bonds. Just as with JGB’s during the past two decades, anybody who has dared to bet that Swiss government bond yields would rise – whether starting from 2 percent, 1 percent, or 0.5 percent – has been proved fatally wrong (Chart I-2). Chart I-2Widow Makers: Shorting Japanese And Swiss Bonds
Widow Makers: Shorting Japanese And Swiss Bonds
Widow Makers: Shorting Japanese And Swiss Bonds
That is, until this year, when Swiss government bond yields reached -1 percent. The Lower Bound To Bond Yields Is Around -1 Percent According to several senior central bankers who have spoken to us, the practical lower bound to the policy interest rate is -1 percent, because “-1 percent counterbalances the storage cost of holding physical cash and/or other stores of value”. They argue that if bank deposit rates were to fall much below -1 percent, it would be logical for bank depositors to flee wholesale into physical cash, and such a deposit flight would destroy the banking system.1 Still, couldn’t central banks just abolish physical cash, forcing us all into ‘digital cash’ with unlimited negative interest rates? No, because that would just push us into other stores of value: for example, gold, or the rapidly growing ‘decentralised’ cryptocurrency asset-class. The common counterargument is that cryptocurrencies’ volatility makes them a poor store of value. But that is also true for gold: during a few months in 2013, gold lost one third of its value (Chart I-3). Yet who has ever argued that gold cannot be a store of value just because its price is volatile! Chart I-3Gold Is A Store Of Value ##br## Despite Its Volatility
Gold Is A Store Of Value Despite Its Volatility
Gold Is A Store Of Value Despite Its Volatility
The practical lower bound to the policy interest rate is around -1 percent because the central bank policy rate establishes the banking system’s funding rate – for example, the Eonia rate in the euro area (Chart I-4). If the funding rate fell well below the rate that the banks were paying on deposits, the banking system would come under severe strain and ultimately go bust. The lower bound of the policy rate also sets the lower bound of the bond yield, because a bond yield is just the expected average policy rate over the bond’s lifetime. Chart I-4The Policy Interest Rate Establishes The Banking System's Funding Rate
The Policy Interest Rate Establishes The Banking System's Funding Rate
The Policy Interest Rate Establishes The Banking System's Funding Rate
There is one important exception. If bond investors price in the possibility of being repaid in a different and more valuable currency, the bond yield will carry a further redenomination discount as an offset for the potential currency gain. This is relevant to euro area bonds because there remains the remote possibility of euro disintegration. Bonds which would expect to see a currency redenomination gain – notably, German bunds – therefore carry an additional discount on their yields. But for bonds where no currency redenomination is possible, the practical lower bound to bond yields is around -1 percent. Overweight High Yielding Bonds Versus Low Yielding Bonds To state the obvious, the closer that a bond yield gets to the -1 percent lower bound, the more limited becomes the possibility for a further yield decline (capital gain), while the possibility for a yield increase (capital loss) stays unlimited. This unattractive lack of upside combined with plenty of potential downside is called negative skew or negative asymmetry. It follows that, close to the lower bound of yields, the cyclicality or ‘beta’ of bond prices also becomes asymmetric. In risk-off phases, the bond prices cannot rally; while in risk-on phases, bond prices can plummet. Making such bonds a ‘lose-lose’ proposition. Case in point: Swiss bond yields have found it difficult to go down this year, but very easy to go up (Chart of the Week). Because their yields were already so close to -1 percent, Swiss bond yields could not decline much during the bond market’s recent strong rally – meaning, Swiss bond prices were very low beta on the way up. But in the recent reversal, Swiss bond yields have risen much more than others – meaning, Swiss bond prices are high beta on the way down (Chart I-5). Chart I-5Swiss Bond Prices Are Low Beta Going Up, But High Beta Going Down
Swiss Bond Prices Are Low Beta Going Up, But High Beta Going Down
Swiss Bond Prices Are Low Beta Going Up, But High Beta Going Down
Does this mean the widow maker trade can finally work? Yes, but only on a tactical horizon. For the full rationale, which we will not repeat here, please see Growth To Rebound In The Fourth Quarter, But Fade In 2020. However in summary, expect bond yields to edge modestly higher, and especially those yields that are deeply in negative territory. Also on a tactical horizon, prefer equities over bonds. On a longer term horizon, a much safer way to play the asymmetric beta is to short low yielding bonds in relative terms. In other words, overweight high yielding bonds versus low yielding bonds.2 Close to the lower bound of yields, the cyclicality or ‘beta’ of bond prices becomes asymmetric. Our strategic recommendation is to overweight a 50:50 combination of U.S. T-bonds and Italian BTPs versus a 50:50 combination of German Bunds and Spanish Bonos, at either 10-year or 30-year bond maturities. Since initiation five months ago, the recommendation at the 30-year maturity is already up by almost 7 percent. Nevertheless, it has a lot further to go (Chart I-6). Investors could also play the component pairs: overweight U.S. T-bonds versus German bunds; and overweight Italian BTPs versus Spanish Bonos (Chart I-7 and Chart I-8), but the combined two bonds versus two bonds recommendation has better return to risk characteristics. Chart I-6Expect High Yielding Bonds To Outperform Low Yielding Bonds
Expect High Yielding Bonds To Outperform Low Yielding Bonds
Expect High Yielding Bonds To Outperform Low Yielding Bonds
Chart I-7Expect Yield Spread Convergence At 10-Year Maturities...
Expect Yield Spread COnvergence At 10-Year Maturities...
Expect Yield Spread COnvergence At 10-Year Maturities...
Chart I-8...And At 30-Year ##br##Maturities
...And At 30-Year Maturities
...And At 30-Year Maturities
Switch Into The Swedish Krona Bond yield spreads are also an important driver of currency moves. The currency corollary of overweighting high yielding versus low yielding bonds is to tilt towards low yielding currencies, because these are the currencies that have the most scope for substantial upside. Our favourite low yielding currency has been the Japanese yen, and this has worked very well. Since early 2018, the yen has been the strongest major currency, and is up 16 percent versus the euro. But our favourite currency is now changing to the Swedish krona, for three reasons: The SEK is depressed from a valuation perspective. For example, it is the only major currencies that is weaker than the GBP compared to before the Brexit vote in 2016 (Chart I-9). Chart I-9The Swedish Krona Has Underperformed The Pound Despite Brexit
The Swedish Krona Has Underperformed The Pound Despite Brexit
The Swedish Krona Has Underperformed The Pound Despite Brexit
Unlike other major central banks, the Riksbank is seeking to normalise the policy rate upwards. The SEK is technically oversold on its 130-day fractal dimension, signalling over-pessimism in the price (Chart I-10), while the JPY is showing the opposite tendency. Chart I-10The Swedish Krona Is Due A Countertrend Move
The Swedish Krona Is Due A Countertrend Move
The Swedish Krona Is Due A Countertrend Move
Bottom Line: switch Japanese yen long exposure into Swedish krona long exposure. Fractal Trading System* (Chart 1-11) As just discussed, this week's recommended trade is long SEK/JPY. Set the profit target at 1.5 percent with a symmetrical stop-loss. In other trades, long NZD/JPY has started off very well and long Spain versus Belgium achieved its 3.5 percent profit target, at which it was closed, leaving five open positions. For any investment, excessive trend following and groupthink can reach a natural point of instability, at which point the established trend is highly likely to break down with or without an external catalyst. An early warning sign is the investment’s fractal dimension approaching its natural lower bound. Encouragingly, this trigger has consistently identified countertrend moves of various magnitudes across all asset classes. Chart I-11
NZD VS. JPY
NZD VS. JPY
The post-June 9, 2016 fractal trading model rules are: When the fractal dimension approaches the lower limit after an investment has been in an established trend it is a potential trigger for a liquidity-triggered trend reversal. Therefore, open a countertrend position. The profit target is a one-third reversal of the preceding 13-week move. Apply a symmetrical stop-loss. Close the position at the profit target or stop-loss. Otherwise close the position after 13 weeks. Use the position size multiple to control risk. The position size will be smaller for more risky positions. For more details please see the European Investment Strategy Special Report “Fractals, Liquidity & A Trading Model,” dated December 11, 2014, available at eis.bcaresearch.com. Dhaval Joshi Chief European Investment Strategist dhaval@bcaresearch.com Footnotes 1 The cost of holding physical cash is the cost of its safe storage. 2 Please see the European Investment Strategy Weekly Report ‘Growth To Rebound In The Fourth Quarter, But Fade In 2020’, October 3, 2019 available at eis.bcaresearch.com. Fractal Trading Model Cyclical Recommendations Structural Recommendations Fractal Trades
The ‘Widow Maker’ Trade: Can It Finally Work?
The ‘Widow Maker’ Trade: Can It Finally Work?
The ‘Widow Maker’ Trade: Can It Finally Work?
The ‘Widow Maker’ Trade: Can It Finally Work?
The ‘Widow Maker’ Trade: Can It Finally Work?
The ‘Widow Maker’ Trade: Can It Finally Work?
The ‘Widow Maker’ Trade: Can It Finally Work?
The ‘Widow Maker’ Trade: Can It Finally Work?
Trades Closed Trades Asset Performance Currency & Bond Equity Sector Country Equity Indicators Bond Yields Chart II-1Indicators To Watch - Bond Yields
Indicators To Watch - Bond Yields
Indicators To Watch - Bond Yields
Chart II-2Indicators To Watch - Bond Yields
Indicators To Watch - Bond Yields
Indicators To Watch - Bond Yields
Chart II-3Indicators To Watch - Bond Yields
Indicators To Watch - Bond Yields
Indicators To Watch - Bond Yields
Chart II-4Indicators To Watch - Bond Yields
Indicators To Watch - Bond Yields
Indicators To Watch - Bond Yields
Interest Rate Chart II-5Indicators To Watch - Interest Rate Expectations
Indicators To Watch - Interest Rate Expectations
Indicators To Watch - Interest Rate Expectations
Chart II-6Indicators To Watch - Interest Rate Expectations
Indicators To Watch - Interest Rate Expectations
Indicators To Watch - Interest Rate Expectations
Chart II-7Indicators To Watch - Interest Rate Expectations
Indicators To Watch - Interest Rate Expectations
Indicators To Watch - Interest Rate Expectations
Chart II-8Indicators To Watch - Interest Rate Expectations
Indicators To Watch - Interest Rate Expectations
Indicators To Watch - Interest Rate Expectations