Europe

Highlights Geopolitical risks are starting to abate as a result of material constraints influencing policymakers. China needs to ensure its economy bottoms and a debt-deflationary tendency does not take hold. President Trump needs to avoid further economic deterioration arising from the trade war. The U.K. is looking to prevent a recession induced by leaving the EU without an agreement. Iran and the risk of an oil price shock is the outstanding geopolitical tail risk. Feature Readers of BCA’s Geopolitical Strategy know that what defines our research is our analytical framework – specifically the theory of constraints. Chart 1The Electoral College – An Overlooked Constraint
Five Constraints For The Fourth Quarter
Five Constraints For The Fourth Quarter
The theory holds that policymakers are trapped by the pressures of their office, their nation’s global position, and the stream of events. These pressures emerge from the material world that we inhabit and as such are measurable. If a leader lacks popular approval, cannot command a majority in the legislature, rides atop a sinking economy, or suffers under stronger or smarter foreign enemies, then his policy preferences will be compromised. He will have to change his preferences to accommodate the constraints, rather than the other way around. Case in point is the U.S. electoral college: it proved an insurmountable political constraint on the Democratic Party in 2016. The college is intended to restrain direct democracy or popular passions; it also restrains the concentration of regional power. In 2012, Barack Obama won a larger share of the electoral college than the popular vote, while in 2016 Hillary Clinton won a smaller share (Chart 1). Clinton’s lack of appeal in the industrial Midwest turned the college and deprived her of the prize. The rest is history. In this report we highlight five key constraints that will shape the direction of the major geopolitical risks in the fourth quarter. We recommend investors remain tactically cautious on risk assets, although we have not yet extended this recommendation to the cyclical, 12-month time frame. China’s Policy: The Debt-Deflation Constraint We have a solid record of pessimism regarding Chinese President Xi Jinping’s willingness and ability to stimulate the economy – but even we were surprised by his tenacity this year. His administration’s effort to contain leverage, while still stimulating the economy, has prevented a quick rebound in the global manufacturing cycle. The constraint limiting this approach is the need to avoid a debt-deflation spiral. This is a condition in which households and firms become pessimistic about the future and cut back their spending and borrowing. The general price level falls and drives up real debt burdens, which motivates further cutbacks. A classic example is Japan, which saw a property bubble burst, destroying corporate balance sheets and forcing the country into a long phase of paying down debt amid falling prices. China has not seen its property bubble burst yet. Prices have continued to rise despite the recent pause in the non-financial debt build-up (Chart 2). Looser monetary and fiscal policy have sustained this precarious balance. But the result is a tug-of-war between the government and the private sector. If the government miscalculates, and the asset bubble bursts, then it will be extremely difficult for the government to change the mindset of households and companies bent on paying down debt. It will be too late to avoid the vicious spiral that Japan experienced – with the critical proviso that Chinese people are less wealthy than the Japanese in 1990 and the country’s political system is less flexible. A Japan-sized economic problem would lead to a China-sized political problem. This is why the recent drop in Chinese producer prices below zero is a worrisome sign (Chart 3). Policymakers have loosened monetary and fiscal policy incrementally since July 2018 and they are signaling that they will continue to do so. This is particularly likely in an environment in which trade tensions are reduced but remain fundamentally unresolved – which is our base case. Chart 2China's Property Bubble Intact
China's Property Bubble Intact
China's Property Bubble Intact
Chart 3China's Constraint Is Debt-Deflation
China's Constraint Is Debt-Deflation
China's Constraint Is Debt-Deflation
Are policymakers aware of this constraint? Absolutely. If the trade talks collapse, or the global economy slumps regardless, then China will have to stimulate more aggressively. Xi Jinping is not truly a Chairman Mao, willing to impose extreme austerity. He oversaw the 2015-16 stimulus and would do it again if he came face to face with the debt-deflation constraint. Is China still capable of stimulating? High debt levels, the reassertion of centralized state power, and the trade war have all rendered traditional stimulus levers less effective by dampening animal spirits. Yet policymakers are visibly “riding the brake,” so they can remove restraints and increase reflation if necessary. Most obviously, authorities can inject larger fiscal stimulus. They have insisted that they will prevent easy monetary and credit policies from feeding into property prices – and this could change. They could also pick up the pace when it comes to reducing average bank lending rates for small and medium-sized businesses.1 In short, stimulus is less effective, but the government is also preferring to save dry powder. This preference will be thrown by the wayside if it hits the critical constraint. The implication is that Chinese stimulus will continue to pick up over a cyclical, 12-month horizon. There is impetus to reduce trade tensions with the U.S., discussed below, but a lack of final resolution will ensure that policy tightening is not called for. Bottom Line: China’s chief economic constraint is a debt-deflation trap. This would engender long-term economic difficulties that would eventually translate into political difficulties for Communist Party rule. If a trade deal is reached, it is unlikely alone to require a shift to tighter policy. If the trade talks collapse, stimulus will overshoot to the upside. Trade War: The Electoral Constraint The U.S. and China are holding the thirteenth round of trade negotiations this week after a summer replete with punitive measures, threats, and failed restarts. Tensions spiked just ahead of the talks, as expected. Immediately thereafter President Trump declared he will meet with Chinese negotiators to give a boost to the process and reassure the markets.2 Trump’s major constraint in waging the trade war is economic, not political. Americans are generally sympathetic to his pressure campaign against China. Public opinion polls show that a strong majority believes it is necessary to confront China even though the bulk of the economic pain will be borne by consumers themselves (Chart 4). Yet Americans could lose faith in Trump’s approach once the economic pain fully materializes. Critically, the decline in wage growth that is occurring as a result of the global and manufacturing slowdown is concentrated in the states that are most likely to swing the 2020 election, e.g. the “purple” or battleground states (Chart 5). Chart 4Americans To Confront China Despite The Costs?
Five Constraints For The Fourth Quarter
Five Constraints For The Fourth Quarter
Chart 5Trump Faces Pressure To Stage A Tactical Trade Retreat
Trump Faces Pressure To Stage A Tactical Trade Retreat
Trump Faces Pressure To Stage A Tactical Trade Retreat
Furthermore, a rise in unemployment, which is implied by the recent decline in the University of Michigan’s survey of consumer confidence regarding the purchase of large household goods, would devastate voters’ willingness to give Trump’s tariff strategy the benefit of the doubt (Chart 6). Wisconsin and Pennsylvania, two critical states, have seen a net loss of manufacturing jobs on the year. The fear of an uptick in U.S. unemployment will prevent Trump from escalating the trade war. An uptick in unemployment would be a major constraint on Trump’s trade war – he cannot escalate further until the economy has stabilized. And that may very well require tariff rollback while trade talks “make progress.” We expect that Trump is willing to do this in the interest of staying in power. As highlighted above, the Xi administration is not without its own constraints. Our proxies for China’s marginal propensity to consume show that Chinese animal spirits are still vulnerable, particularly on the household side, which has not responded to stimulus thus far (Chart 7). Since this constraint is less immediate than Trump’s election date, Xi cannot be expected to capitulate to Trump’s biggest demands. Hence a ceasefire or détente is more likely than a full bilateral trade agreement. Chart 6Waning Consumer Confidence On Big Ticket Items Foreshadows Rise In Unemployment
Waning Consumer Confidence On Big Ticket Items Foreshadows Rise In Unemployment
Waning Consumer Confidence On Big Ticket Items Foreshadows Rise In Unemployment
Trump’s electoral constraint also suggests that he needs to remove trade risks such as car tariffs on Europe and Japan (which we expect he will do). We have been optimistic on the passage of the USMCA trade deal but impeachment puts this forecast in jeopardy. Chart 7China's Trade War Constraint? Animal Spirits
China's Trade War Constraint? Animal Spirits
China's Trade War Constraint? Animal Spirits
Bottom Line: Trump will stage a tactical retreat on trade in order to soften the negative impact on the economy and reduce the chances of a recession prior to the November 3, 2020 election. China’s economic constraints are less immediate and it is unlikely to make major structural concessions. Hence we expect a ceasefire that temporarily reduces tensions and boosts sentiment rather than a bilateral trade agreement that initiates a fundamental deepening of U.S.-China economic engagement. U.S. Policy: The Economic Constraint The 2020 U.S. election is a critical political risk both because of the volatility it will engender and because of what we see as a 45% chance that it will lead to a change in the ruling party governing the world’s largest economy. Will Trump be the candidate? Yes. If Trump’s approval among Republicans breaks beneath the lows plumbed during the Charlottesville incident in 2017 (Chart 8A), then Trump has an impeachment problem, but otherwise he is safe from removal. Judging by the Republican-leaning pollster Rasmussen, which should reflect the party’s mood, Trump’s approval rating has not broken beneath its floor and may already be bouncing back from the initial hit of the impeachment inquiry (Chart 8B). The rise in support for impeachment and removal in opinion polls is notable, but it is also along party lines and will fade if the Democrats are seen as dragging on the process or trying to circumvent an election that is just around the corner. Chart 8ARepublican Opinion Precludes Trump’s Removal
Five Constraints For The Fourth Quarter
Five Constraints For The Fourth Quarter
Chart 8BRepublican-Leaning Pollster Shows Support Holding Thus Far
Five Constraints For The Fourth Quarter
Five Constraints For The Fourth Quarter
How will all of this bear on the 2020 election? Turnout will be high so everything depends on which side will be more passionate. A critical factor will be the Democratic nominee. Former Vice President Joe Biden, the establishment pick, has broken beneath his floor in the polling. His rambling debate performances have reinforced the narrative that he is too old, while the impeachment of Trump will fuel counteraccusations of corruption that will detract from Biden’s greatest asset: his electability. According to a Harvard-Harris poll from late September, 61% of voters believe it was inappropriate for Biden to withhold aid from Ukraine to encourage the firing of a Ukrainian prosecutor even when the polling question makes no mention of any connection with Biden’s son’s business interest there. Moreover, 77% believe it is inappropriate that Biden’s son Hunter traveled with his father to China while soliciting investments there. With Vermont Senator Bernie Sanders’s candidacy now defunct as a result of his heart attack and old age, Elizabeth Warren, the progressive senator from Massachusetts, will become the indisputable front runner (which she is not yet). In the fourth primary debate on October 15, she will face attacks from all sides reflecting this new status. Given her debate performances thus far, she will sustain the heightened scrutiny and come out stronger. This is not to say that Warren is already the Democratic candidate. Biden is still polling like a traditional Democratic primary front runner (Chart 9), while Warren has some clear weaknesses in electability, as reflected in her smaller lead over Trump in head-to-head polls in swing states. Nevertheless Warren is likely to become the front runner. Chart 9Biden Polling About Average Relative To Previous Democratic Primary Front Runners
Five Constraints For The Fourth Quarter
Five Constraints For The Fourth Quarter
The recession call remains the U.S. election call. Two further considerations: Impeachment and removal of President Trump ensure a Democratic victory. There are hopes in some quarters that President Trump could be impeached and removed and yet his Vice President Mike Pence could go on to win the 2020 election, preserving the pro-business policy status quo. The problem with this logic is that Trump cannot be removed unless Republican opinion shifts. This will require an earthquake as a result of some wrongdoing by Trump. Such an earthquake will blacken Pence’s and the GOP’s name and render them toxic in the general election. Not to mention that Pence’s only act as president in the brief interim would likely be to pardon Trump and his accomplices. He would suffer Gerald Ford’s fate in 1976. Which means that a significant slide in Trump’s approval among Republicans will translate to higher odds of a Democratic win in 2020 and hence higher taxes and regulation, i.e. a hit to corporate earnings expectations. We expect this approval to hold up, but the market can sell off anyway because … The market is overrating the Senate as a check on Warren in the event she wins the White House. It is true that relative to Biden, Warren is less likely to carry the Senate. Democrats need to retain their Senate seat in Alabama, while capturing Maine, Colorado, and Arizona (or Georgia) in addition to the White House in order to control the Senate. Biden is more competitive in Arizona and Georgia than Warren. But this is a flimsy basis to feel reassured that a Warren presidency will be constrained. In fact, it is very difficult to unseat a sitting president. If the Democrats can muster enough votes to kick out an incumbent and elect an outspoken left-wing progressive from the northeast, they most likely will have mustered enough votes to take the Senate as well. For instance, unemployment could be rising or Trump’s risky foreign policy could have backfired. Chart 10Business Sentiment Threatens Trump Re-Election
Business Sentiment Threatens Trump Re-Election
Business Sentiment Threatens Trump Re-Election
In our estimation the Democrats have about a 45% chance of winning the presidency, and Warren does not significantly reduce this chance. The resilient U.S. economy is Trump’s base case for success. But Trump’s trade policy and the global slowdown are rapidly eating away at the prospect that voters see improvement (Chart 10). This speaks to the constraint driving a ceasefire with China above, but it also speaks to the broader probability of policy continuity in the U.S. As Warren’s path to the White House widens, there is a clear basis for equities to sell off in the near term. Bottom Line: Trump’s approval among Republicans is a constraint on his removal via impeachment. But the status of the economy is the greater constraint. The recession call remains the election call. While we expect downside in the near term, we are still constructive on U.S. equities on a cyclical basis. War With Iran: The Oil Price Constraint The Senate will remain President Trump’s bulwark amid impeachment, notwithstanding the controversial news that Trump is moving forward with the withdrawal of troops from Syria, specifically from the so-called “safe zone” agreed with Turkey, giving Ankara license to stage a larger military offensive in Syria. This abandonment of the U.S.’s Kurdish allies at the behest of Turkey (which is a NATO ally but has been at odds with Washington) has provoked flak from Republican senators. However, it is well supported in U.S. public opinion (Chart 11). Trump is threatening to impose economic sanctions on Turkey if it engages in ethnic cleansing. The Turkish lira is the marginal loser, Trump’s approval rating is the marginal winner. The withdrawal sends a signal to the world that the U.S. is continuing to deleverage from the Middle East – a corollary with the return of focus on Asia Pacific. While the Iranians are key beneficiaries of this pivot, the Trump administration is maintaining maximum sanctions pressure on the Iranians. The firing of hawkish National Security Adviser John Bolton did not lead to a détente, as President Rouhani has too much to risk from negotiating with Trump. Instead the Iranians smelled U.S. weakness and went on the attack in Saudi Arabia, briefly shuttering 6 million barrels of oil per day. The response to the attack – from both Saudi Arabia and the U.S. – revealed an extreme aversion to military conflict and escalation. Instead the U.S. has tightened its sanctions regime – China is reportedly withdrawing from its interest in the South Pars natural gas project, a potentially serious blow to Iran, which had been hyping its strategic partnership with China. This reinforces the prospect for a U.S.-China ceasefire even as it redoubles the economic pressure on Iran. As long as the U.S. maintains the crippling sanctions on Iran, there is no guarantee that Tehran will not strike out again in an effort to weaken President Trump’s resolve. The fact that about 18% of global oil supply flows through the critical chokepoint of the Strait of Hormuz is Iran’s ace in the hole (Chart 12). It is the chief constraint on Trump’s foreign policy, as greater oil supply disruptions could shock the U.S. economy ahead of the election. Trump can benefit from minor or ephemeral disruptions but he is likely to get into trouble if a serious shock weakens the economy at this juncture. Chart 11U.S. Opinion Constrains Foreign Policy
Five Constraints For The Fourth Quarter
Five Constraints For The Fourth Quarter
Chart 12Oil Price Constrains U.S. Policy Toward Iran
Five Constraints For The Fourth Quarter
Five Constraints For The Fourth Quarter
An oil shock does not have to originate in Hormuz shipping or sneak attacks on regional oil infrastructure. Iran is uniquely capable of fomenting the anti-government protests that have erupted in southern Iraq. The restoration of stability in Iraq has resulted in around 2 million barrels of oil per day coming onto international markets (Chart 13). If this process is reversed through political instability or sabotage, it will rapidly push up against global spare oil capacity and exert an upward pressure on oil prices that would come at an awkward time for a global economy experiencing a manufacturing recession (Chart 14). Chart 13Iran's Leverage Over Iraq
Iran's Leverage Over Iraq
Iran's Leverage Over Iraq
Chart 14Global Oil Spare Capacity Constrains Response To Crisis
Five Constraints For The Fourth Quarter
Five Constraints For The Fourth Quarter
Bottom Line: Iran’s power over regional oil production is the biggest constraint on Trump’s foreign policy in the region, yet Trump is apparently tightening rather than easing the sanctions regime. The failure of the Abqaiq attack to generate a lasting impact on oil prices amid weak global demand suggests that Iran could feel emboldened. The U.S. preference to withdraw from Middle Eastern conflicts could also encourage Iran, while the tightening of the sanctions regime could make it desperate. An oil shock emanating from the conflict with Iran is still a significant risk to the global bull market. Brexit: The No-Deal Constraint The fifth and final constraint to discuss in this report pertains to the U.K. and Brexit. We do not consider the October 31 deadline a no-deal exit risk. Parliament will prevail over a prime minister who lacks a majority. Nevertheless the expected election can revive no-deal risk, especially if Boris Johnson is returned to power with a weak minority government. Chart 15U.K.: Public Opinion Constrains Parliament And No-Deal Brexit
U.K.: Public Opinion Constrains Parliament And No-Deal Brexit
U.K.: Public Opinion Constrains Parliament And No-Deal Brexit
While parliament is the constraint on the prime minister, the public is the constraint on parliament. From this point of view, support for Brexit has weakened and the Conservative Party is less popular than in the lead up to the 2015 and 2017 general elections. The public is aware that no-deal exit is likely to cause significant economic pain and that is why a majority rejects no-deal, as opposed to a soft Brexit. Unless the Tory rally in opinion polling produces another coalition with the Northern Irish, albeit with Boris Johnson at the helm, these points make it likely that a no-deal Brexit will become untenable when all is said and done (Chart 15). If Johnson achieves a single party majority the EU will be more likely to grant concessions enabling him to get a withdrawal deal over the line. We remain long GBP-USD but will turn sellers at the $1.30 mark. Investment Implications The path of least resistance is for China’s stimulus efforts to increase – incrementally if trade tensions are contained, and sharply if not. This should help put a floor beneath growth, but the Q1 timing of this floor means that global risk assets face additional downside in the near term. We continue to recommend going long our “China Play” index. U.S.-China trade tensions should decline as President Trump looks to prevent higher unemployment ahead of his election. China has reason to follow through on small concessions to encourage Trump’s tactical trade retreat, but it does not face pressure to make new structural concessions. We expect a ceasefire – with some tariff rollback likely – but not a big bang agreement that removes all tariffs or deepens the overall bilateral economic engagement. Stay long our “China Play” index. We remain short CNY-USD on a strategic basis but recognize that a ceasefire presents a short term (maximum 12-month) risk to this view, so clients with a shorter-term horizon should close that trade. We are long European equities relative to Chinese equities as a result of the view that China will stimulate but that a trade ceasefire will leave lingering uncertainties over Chinese corporates. U.S. politics are highly unpredictable but constraint-based analysis indicates that while the House may impeach, the Senate will not remove. This, combined with Warren’s likely ascent to the head of the pack in the Democratic primary race, means that Trump remains favored to win reelection, albeit with low conviction (55% chance) due to a weak general approval rating and economic risks. The risk to U.S. equities is immediate, but should dissipate. The U.S. is rotating its strategic focus from the Middle East to Asia Pacific, which entails a continued rotation of geopolitical risk. However, recent developments reinforce our argument in July that Iranian geopolitical risk is frontloaded relative to the China risk. This is true as long as Trump maintains crippling sanctions. Iran may be emboldened by its successes so far and has various mechanisms – including Iraqi instability – by which it can threaten oil supply to pressure Trump. This is a tail risk, but it does support our position of being long EM energy producers. Matt Gertken, Vice President Geopolitical Strategist mattg@bcaresearch.com Footnotes 1 Please see BCA Research, China Investment Strategy Weekly Report, “Mild Deflation Means Timid Easing,” October 9, 2019, available at cis.bcaresearch.com. 2 China knows that Trump wants to seal a deal prior to November 2020 to aid his reelection campaign, while Trump needs to try to convince China that he does not care about election, the stock market, or anything other than structural concessions from China. Hence the U.S. blacklisted several artificial intelligence companies and sanctioned Chinese officials in advance of the talks. The U.S. opened a new front in the conflict by invoking China’s human rights abuses in Xinjiang, which is also an implicit warning not to create a humanitarian incident in Hong Kong where protests continue to rage. These are pressure tactics but have not yet derailed the attempt to seal a deal in Q4.
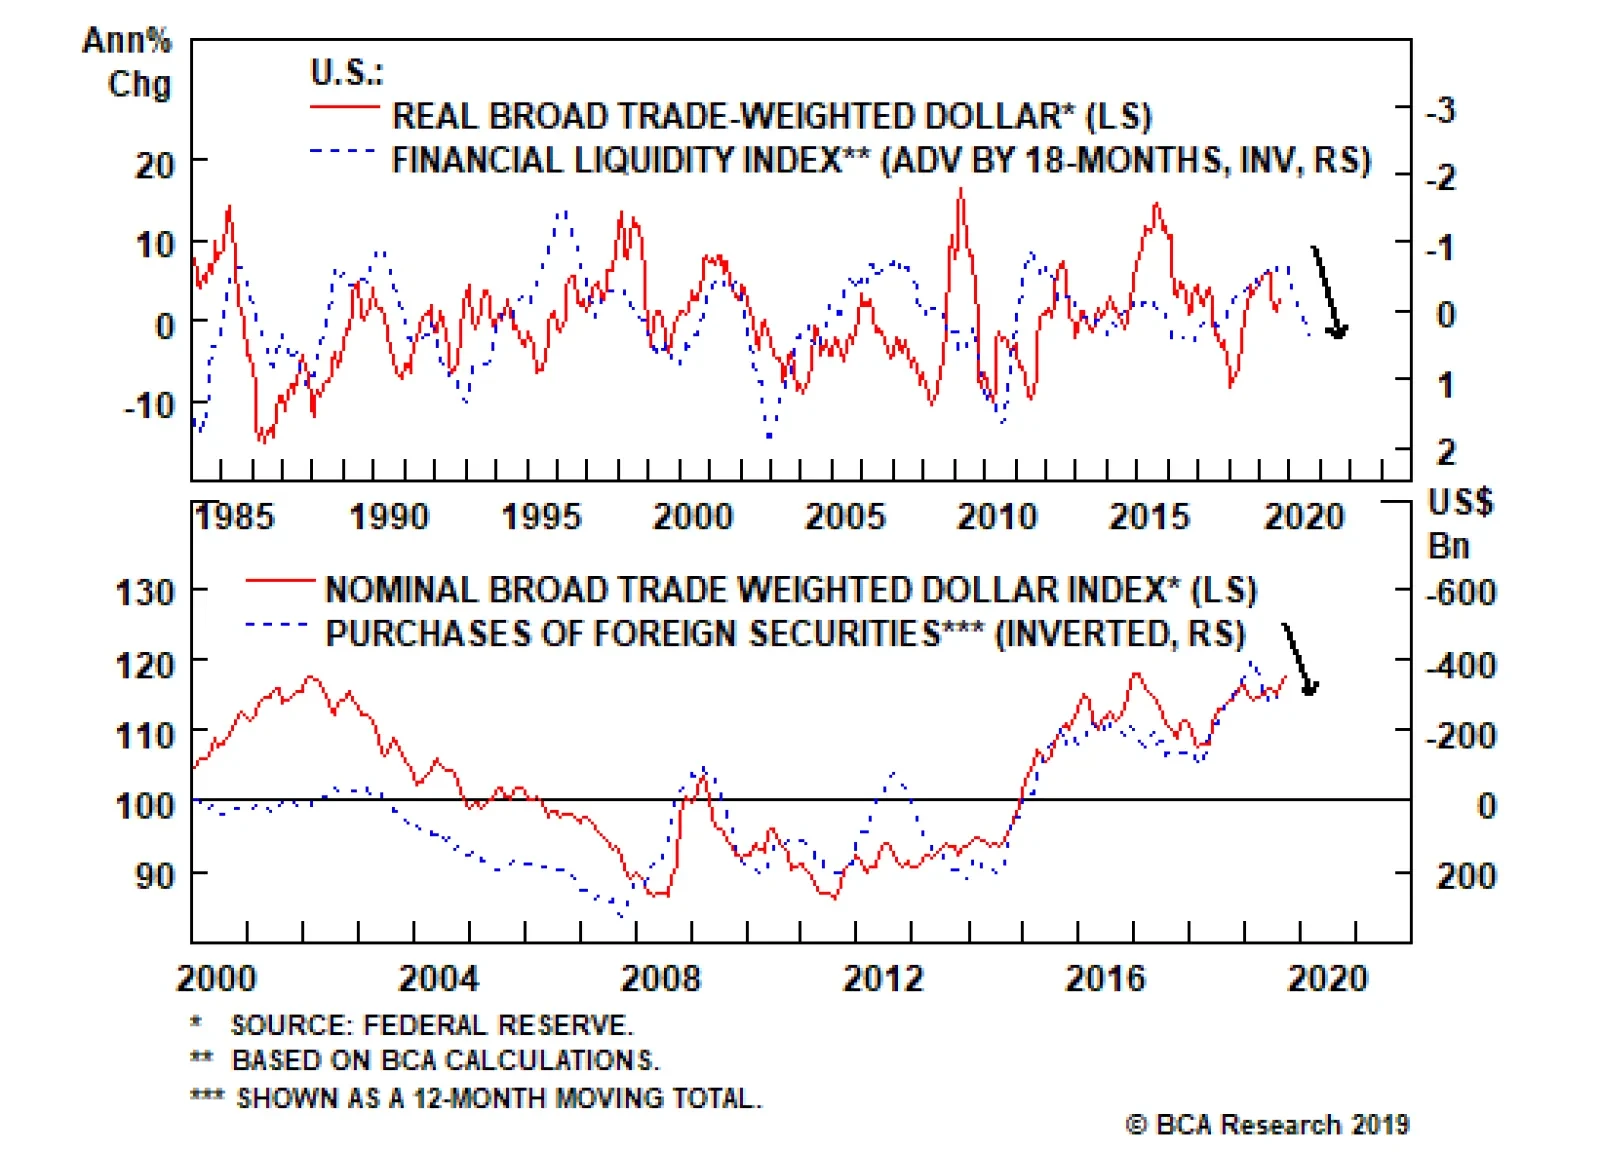
has significant downside. The greenback is very expensive and will decline as global liquidity conditions improve. These dynamics reflect the countercyclical nature of the dollar and also lead to strong greenback momentum, both on the way up and down. The…
Highlights Q3/2019 Performance Breakdown: Our recommended model bond portfolio underperformed the custom benchmark by -30bps during the third quarter of the year. Winners & Losers: The biggest underperformance came from underweight positions in U.S. Treasuries (-28bps) and Italian government bonds (-18bps) as yields plunged, dwarfing gains from overweights in corporate bonds in the U.S. (+11bps) and euro area (+4bps). Scenario Analysis For The Next Six Months: We are maintaining our current positioning, staying below-benchmark on duration while overweighting U.S. and euro area corporates vs. government debt. In our base case scenario, global growth will begin to stabilize but the Fed will deliver one more “insurance” rate cut by year-end, leading to corporate bond outperformance. Feature Global bond markets have enjoyed a powerful bull run throughout 2019, as yields have plummeted alongside weakening global growth and growing political uncertainty. Those two forces came to a head in the third quarter of the year, with U.S.-China trade tensions ratcheting up another notch after the imposition of higher U.S. tariffs in early August and global manufacturing PMI data moving into contraction territory – especially in the U.S. The result was a significant fall in government bond yields as markets discounted both lower inflation expectations and more aggressive monetary easing from global central banks, led by the Fed and ECB. The benchmark 10-year U.S. Treasury yield and 10-year German Bund yield plunged -40bps and -25bps, respectively, during the July-September period. Yet at the same time, global credit markets remained surprisingly stable, as the option-adjusted spread on the Bloomberg Barclays Global Corporates index was unchanged over the same three months. In this report, we review the performance of the BCA Global Fixed Income Strategy (GFIS) model bond portfolio during the eventful third quarter of 2019. We also present our updated scenario analysis, and total return projections, for the portfolio over the next six months. As a reminder to existing readers (and to new clients), the model portfolio is a part of our service that complements the usual macro analysis of global fixed income markets. The portfolio is how we communicate our opinion on the relative attractiveness between government bond and spread product sectors. This is done by applying actual percentage weightings to each of our recommendations within a fully invested hypothetical bond portfolio. Q3/2019 Model Portfolio Performance Breakdown: Good News On Credit Trumped By Bad News On Duration Chart of the WeekDuration Losses Dwarf Credit Gains In Q3/19
Duration Losses Dwarf Credit Gains In Q3/19
Duration Losses Dwarf Credit Gains In Q3/19
The total return for the GFIS model portfolio (hedged into U.S. dollars) in the third quarter was 2.0%, lagging the custom benchmark index by -30 bps (Chart of the Week).1 This brings the cumulative year-to-date total return of the portfolio to +7.8%, which has underperformed the benchmark by a disappointing –67bps. The Q3 drag on relative returns came entirely from the government bond side of the portfolio; specifically, the underweight allocation to U.S. Treasuries and Italian government bonds (Table 1). Those allocations reflected our views on overall portfolio duration (below benchmark) and a relative value consideration within European spread product (preferring corporates to Italy). Both those recommendations went against us as global bond yields dropped during Q3, with Italian yields collapsing (the benchmark 10-year yield was down –126bps) as investors chased any positive yield denominated in euros after the ECB signaled a new round of policy easing. The total return for the GFIS model portfolio (hedged into U.S. dollars) in the third quarter was 2.0%, lagging the custom benchmark index by -30 bps Table 1GFIS Model Bond Portfolio Q3/2019 Overall Return Attribution
Q3/2019 GFIS Model Bond Portfolio Performance Review: More Duration/Credit Divergence
Q3/2019 GFIS Model Bond Portfolio Performance Review: More Duration/Credit Divergence
Providing some partial offset to the U.S. and Italy allocations were gains from overweight positions in government bonds in the U.K., Australia and Japan. More importantly, our overweights in corporate debt in the U.S. and euro area made a strong positive contribution to the performance of the portfolio. The bar charts showing the total and relative returns for each individual government bond market and spread product sector are presented in Charts 2 and 3. The most significant movers were: Chart 2GFIS Model Bond Portfolio Q3/2019 Government Bond Performance Attribution
Q3/2019 GFIS Model Bond Portfolio Performance Review: More Duration/Credit Divergence
Q3/2019 GFIS Model Bond Portfolio Performance Review: More Duration/Credit Divergence
Chart 3GFIS Model Bond Portfolio Q3/2019 Spread Product Performance Attribution By Sector
Q3/2019 GFIS Model Bond Portfolio Performance Review: More Duration/Credit Divergence
Q3/2019 GFIS Model Bond Portfolio Performance Review: More Duration/Credit Divergence
Biggest outperformers Overweight U.S. high-yield Ba-rated (+4bps) Overweight U.S. high-yield B-rated (+3bps) Overweight U.S. investment grade industrials (+3bps) Overweight Japanese government bonds with maturity of 5-7 years (+2bps) Overweight euro area corporates, both investment grade (+2bps) and high-yield (+2bps) Biggest underperformers Underweight U.S. government bonds with maturity beyond 10+ years (-15bps) Underweight Italy government bonds with maturity beyond 10+ years (-10bps) Underweight U.S. government bonds with maturity of 7-10 years (-5bps) Underweight Japanese government bonds with maturity beyond 10+ years (-4bps) Underweight U.S. government bonds with maturity of 3-5 years (-4bps) Chart 4 presents the ranked benchmark index returns of the individual countries and spread product sectors in the GFIS model bond portfolio for Q3/2019. The returns are hedged into U.S. dollars (we do not take active currency risk in this portfolio) and are adjusted to reflect duration differences between each country/sector and the overall custom benchmark index for the model portfolio. We have also color-coded the bars in each chart to reflect our recommended investment stance for each market during Q3/2019 (red for underweight, blue for overweight, gray for neutral).2 Ideally, we would look to see more blue bars on the left side of the chart where market returns are highest, and more red bars on the right side of the chart were returns are lowest. Chart 4Ranking The Winners & Losers From The Model Bond Portfolio In Q3/2019
Q3/2019 GFIS Model Bond Portfolio Performance Review: More Duration/Credit Divergence
Q3/2019 GFIS Model Bond Portfolio Performance Review: More Duration/Credit Divergence
One thing that stands out from Chart 4 is that every fixed income sector generated a positive return, except for EM USD-denominated corporates. This is a fascinating outcome given the sharp falls in risk-free government bond yields which typically would correlate to a selloff in risk assets and widening of credit spreads. The soothing balm of looser global monetary policy seems to have offset the impact of elevated uncertainty on trade and future economic growth, allowing both bond yields and credit spreads to stay low. The soothing balm of looser global monetary policy seems to have offset the impact of elevated uncertainty on trade and future economic growth, allowing both bond yields and credit spreads to stay low. We maintained an overweight stance on global spread product throughout Q3, as we felt that the monetary policy effect would continue to overwhelm uncertainty. We did, however, make some tactical adjustments to our duration stance after the U.S. raised tariffs on Chinese imports, upgrading to neutral on August 6th.3 We had felt that higher tariffs were a sign that a potential end to the U.S.-China trade conflict was now even less likely, which raised the odds of a potential risk-off financial market event that would temporarily push bond yields lower. We shifted back to a below-benchmark duration stance on September 17th, given signs of de-escalation in the trade dispute and, more importantly, some improvement evident in global leading economic indicators.4 Bottom Line: Our recommended model bond portfolio underperformed the custom benchmark index during the third quarter of the year, with the drag on performance from an underweight stance on U.S. Treasuries and Italian BTPs overwhelming the gains from corporate credit overweights in the U.S. and euro area. Future Drivers Of Portfolio Returns Looking ahead, the performance of the model bond portfolio will continue to be driven by two main factors: our below-benchmark duration bias and our overweight stance on global corporate debt versus government bonds. Chart 5Overall Portfolio Allocation: Overweight Credit
Q3/2019 GFIS Model Bond Portfolio Performance Review: More Duration/Credit Divergence
Q3/2019 GFIS Model Bond Portfolio Performance Review: More Duration/Credit Divergence
In terms of the specific high-level weightings in the model portfolio, we currently have a moderate overweight, equal to eight percentage points, on spread product versus government debt (Chart 5). This reflects a more constructive view on future global growth. Early leading economic indicators are starting to bottom out and global central bankers are maintaining a dovish policy bias despite low unemployment rates – both factors that will continue to benefit growth-sensitive assets like corporate debt. Early leading economic indicators are starting to bottom out and global central bankers are maintaining a dovish policy bias despite low unemployment rates – both factors that will continue to benefit growth-sensitive assets like corporate debt. We are maintaining our below-benchmark duration tilt at 0.6 years short of the custom benchmark (Chart 6). We recognize, however, that the underperformance from duration in the model portfolio will not begin to be clawed back until there are signs of a bottoming in widely-followed cyclical economic indicators like the U.S. ISM index and the German ZEW. We think that will happen given the uptick in our global leading economic indicator (LEI), but that may take a few more months to develop based on the usual lead time from the LEI to the survey data like the ISM. The hook up in the global LEI does still gives us more confidence that the big decline in global bond yields seen this year is over, especially if a potential truce in the U.S.-China trade war is soon reached, as our political strategists believe to be increasingly likely. Chart 6Overall Portfolio Duration: Moderately Below Benchmark
Overall Portfolio Duration: Moderately Below Benchmark
Overall Portfolio Duration: Moderately Below Benchmark
Turning to country allocation, we are sticking with overweights in countries where central banks are likely to be more dovish than the Fed over the next 6-12 months (Germany, France, the U.K., Japan, and Australia). We are staying underweight the U.S. where inflation expectations appear too low and Fed rate cut expectations look too extreme. The Italy underweight has become a trickier call. We have long viewed Italian debt as a growth-sensitive credit instrument rather than the yield-driven rates vehicle it became in Q3 as markets priced in fresh monetary easing measures from the ECB (including restarting government purchases). We will revisit our Italy views in an upcoming report but, until then, we will continue to view Italian BTPs within the context of our European spread product allocation. Thus, we are maintaining an overweight on euro area corporate debt (by 1% each in investment grade and high-yield) while having an equal-sized underweight (-2%) in Italian government bonds. Our combined positioning generates a portfolio that has “positive carry”, with a yield of 3.1% (hedged into U.S. dollars) that is +25bps over that of the custom benchmark index (Chart 7). That same portfolio, however, generates an estimated tracking error (excess volatility of the portfolio versus its benchmark) of 55bps - well below our self-imposed 100bps ceiling and still within the 40-60bps range we have targeted since the start of 2019 (Chart 8). Chart 7Portfolio Yield: Positive Carry From Credit
Portfolio Yield: Positive Carry From Credit
Portfolio Yield: Positive Carry From Credit
Chart 8Portfolio Risk Budget Usage: Cautious
Portfolio Risk Budget Usage: Cautious
Portfolio Risk Budget Usage: Cautious
Scenario Analysis & Return Forecasts In April 2018, we introduced a framework for estimating total returns for all government bond markets and spread product sectors, based on common risk factors.5 For credit, returns are estimated as a function of changes in the U.S. dollar, the Fed funds rate, oil prices and market volatility as proxied by the VIX index (Table 2A). For government bonds, non-U.S. yield changes are estimated using historical betas to changes in U.S. Treasury yields (Table 2B). Table 2AFactor Regressions Used To Estimate Spread Product Yield Changes
Q3/2019 GFIS Model Bond Portfolio Performance Review: More Duration/Credit Divergence
Q3/2019 GFIS Model Bond Portfolio Performance Review: More Duration/Credit Divergence
Table 2BEstimated Government Bond Yield Betas To U.S. Treasuries
Q3/2019 GFIS Model Bond Portfolio Performance Review: More Duration/Credit Divergence
Q3/2019 GFIS Model Bond Portfolio Performance Review: More Duration/Credit Divergence
This framework allows us to conduct scenario analysis of projected returns for each asset class in the model bond portfolio by making assumptions on those individual risk factors. In Tables 3A & 3B, we present our three main scenarios for the next six months, defined by changes in the risk factors, and the expected performance of the model bond portfolio in each case. The scenarios, described below, all revolve around our expectation that the most important drivers of future market returns will continue to be the momentum of global growth and the path of U.S. monetary policy. The scenario inputs for the four main risk factors (the fed funds rate, the price of oil, the U.S. dollar and the VIX index) are shown visually in Chart 9. Table 3AScenario Analysis For The GFIS Model Bond Portfolio For The Next Six Months
Q3/2019 GFIS Model Bond Portfolio Performance Review: More Duration/Credit Divergence
Q3/2019 GFIS Model Bond Portfolio Performance Review: More Duration/Credit Divergence
Table 3BU.S. Treasury Yield Assumptions For The 6-Month Forward Scenario Analysis
Q3/2019 GFIS Model Bond Portfolio Performance Review: More Duration/Credit Divergence
Q3/2019 GFIS Model Bond Portfolio Performance Review: More Duration/Credit Divergence
Chart 9Risk Factor Assumptions For The Scenario Analysis
Risk Factor Assumptions For The Scenario Analysis
Risk Factor Assumptions For The Scenario Analysis
Base Case (Global Growth Bottoms): The Fed delivers one more -25bp rate cut by the end of 2019, the U.S. dollar weakens by -3%, oil prices rise by +10%, the VIX hovers around 15, and there is a bear-steepening of the UST curve. This is a scenario where the U.S. economy ends up avoiding recession and grows at roughly a trend-like pace. The Fed, however, still delivers one more “insurance” rate cut to mitigate the risk of low inflation expectations becoming more entrenched. Global growth is expected to bottom out as heralded by the global leading indicators. A truce (but not a full deal) is expected on the U.S.-China trade front, helping to moderately soften the U.S. dollar through reduced risk aversion. The model bond portfolio is expected to beat the benchmark index by +91bps in this case. Global Growth Strongly Rebounds: The Fed stays on hold, the U.S. dollar weakens by -5%, oil prices rise by +20%, the VIX declines to 12, there is a modest bear-steepening of the UST curve. In this tail-risk scenario, global growth starts to reaccelerate in lagged response to the global monetary easing seen this year, combined with some fiscal stimulus in major countries (China, the U.S., perhaps even Germany). The U.S. dollar weakens as global capital flows shift to markets which are more sensitive to global growth. The model bond portfolio is expected to beat the benchmark index by +106bps in this case. U.S. Downturn Intensifies: The Fed cuts rates by -75bps, the U.S. dollar is flat, oil prices fall by -15%, the VIX rises to 30; there is a bull-steepening of the UST curve. Under this tail-risk scenario, the current slowing of U.S. growth momentum gains speed, pushing the economy towards recession. The Fed cuts rates aggressively in response, helping weaken the U.S. dollar, but not before global risk assets sell off sharply to discount a worldwide recession. The model portfolio will underperform the benchmark by -38bps in this scenario. In terms of our conviction level among the main drivers of the model portfolio returns – duration allocation (across yield curves and countries) and asset allocation (credit versus government bonds) – we are most confident that credit returns will exceed those of sovereign debt over the next six months. In terms of our conviction level among the main drivers of the model portfolio returns – duration allocation (across yield curves and countries) and asset allocation (credit versus government bonds) – we are most confident that credit returns will exceed those of sovereign debt over the next six months. The underweight duration position, however, will also eventually begin to pay off if the message from the budding improvement in global leading economic indicators turns out to be correct. A collapse of the U.S.-China trade negotiations is the biggest threat to our base case, which would make the “U.S. Downturn Intensifies” scenario a more likely outcome. Bottom Line: We are maintaining our current positioning, staying below-benchmark on duration while overweighting U.S. and euro area corporates governments. In our base case scenario, global growth will begin to stabilize but the Fed will deliver one more “insurance” rate cut by year-end, leading to spread product outperformance. Robert Robis, CFA, Chief Fixed Income Strategist rrobis@bcaresearch.com Ray Park, CFA, Research Analyst ray@bcaresearch.com Footnotes 1 The GFIS model bond portfolio custom benchmark index is the Bloomberg Barclays Global Aggregate Index, but with allocations to global high-yield corporate debt replacing very high quality spread product (i.e. AA-rated). We believe this to be more indicative of the typical internal benchmark used by global multi-sector fixed income managers. 2 Note that sectors where we made changes to our recommended weightings during Q3/2019 will have multiple colors in the respective bars in Chart 4. 3 Please see BCA Global Fixed Income Strategy Weekly Report, “Trade War Worries: Once More, With Feeling”, dated August 6, 2019, available at gfis.bcaresearch.com. 4 Please see BCA Global Fixed Income Strategy Weekly Report, “The World Is Not Ending: Return To Below-Benchmark Portfolio Duration”, dated September 17, 2019, available at gfis.bcaresearch.com. 5 Please see BCA Global Fixed Income Strategy Weekly Report, “GFIS Model Bond Portfolio Q1/2018 Performance Review: A Rough Start”, dated April 10th 2018, available at gfis.bcareseach.com. Recommendations The GFIS Recommended Portfolio Vs. The Custom Benchmark Index
Q3/2019 GFIS Model Bond Portfolio Performance Review: More Duration/Credit Divergence
Q3/2019 GFIS Model Bond Portfolio Performance Review: More Duration/Credit Divergence
Duration Regional Allocation Spread Product Tactical Trades Yields & Returns Global Bond Yields Historical Returns
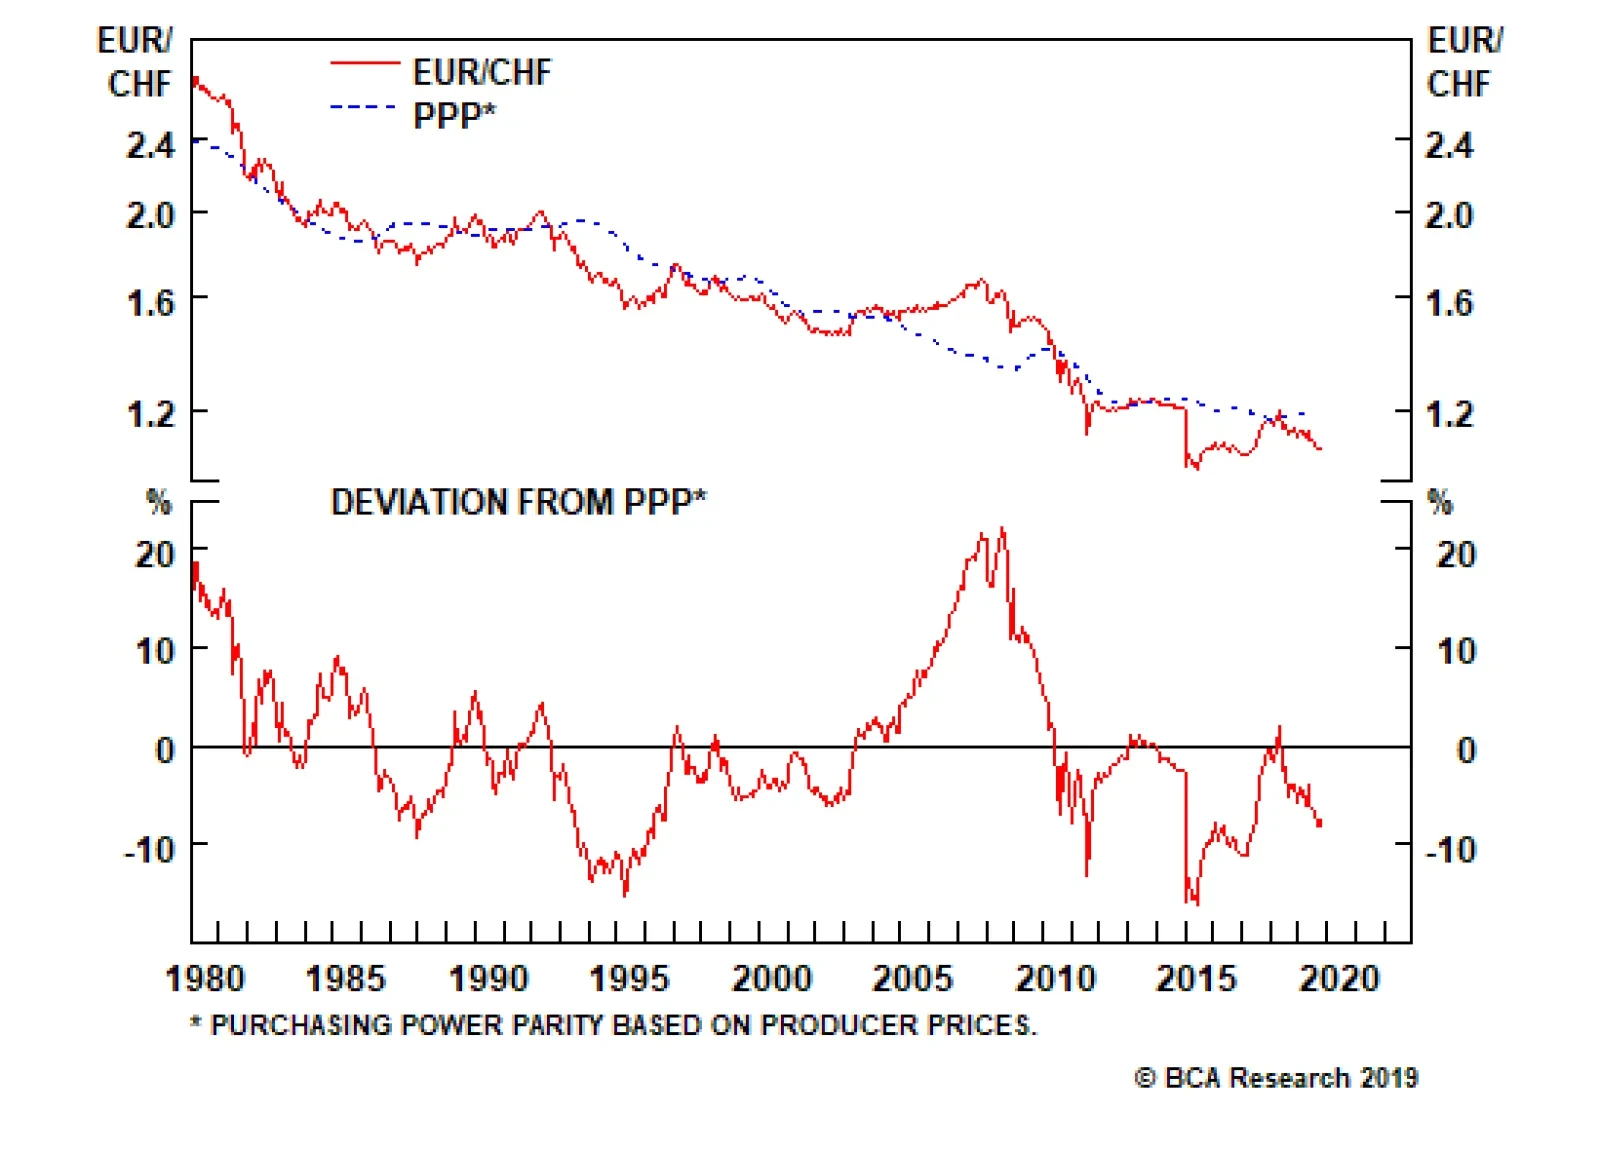
The four key factors that suggest the Swiss economy needs a weaker currency, especially versus the euro are: The Swiss trade balance has held up well in the face of the global slowdown, but this has been largely driven by terms of trade. However, in a…
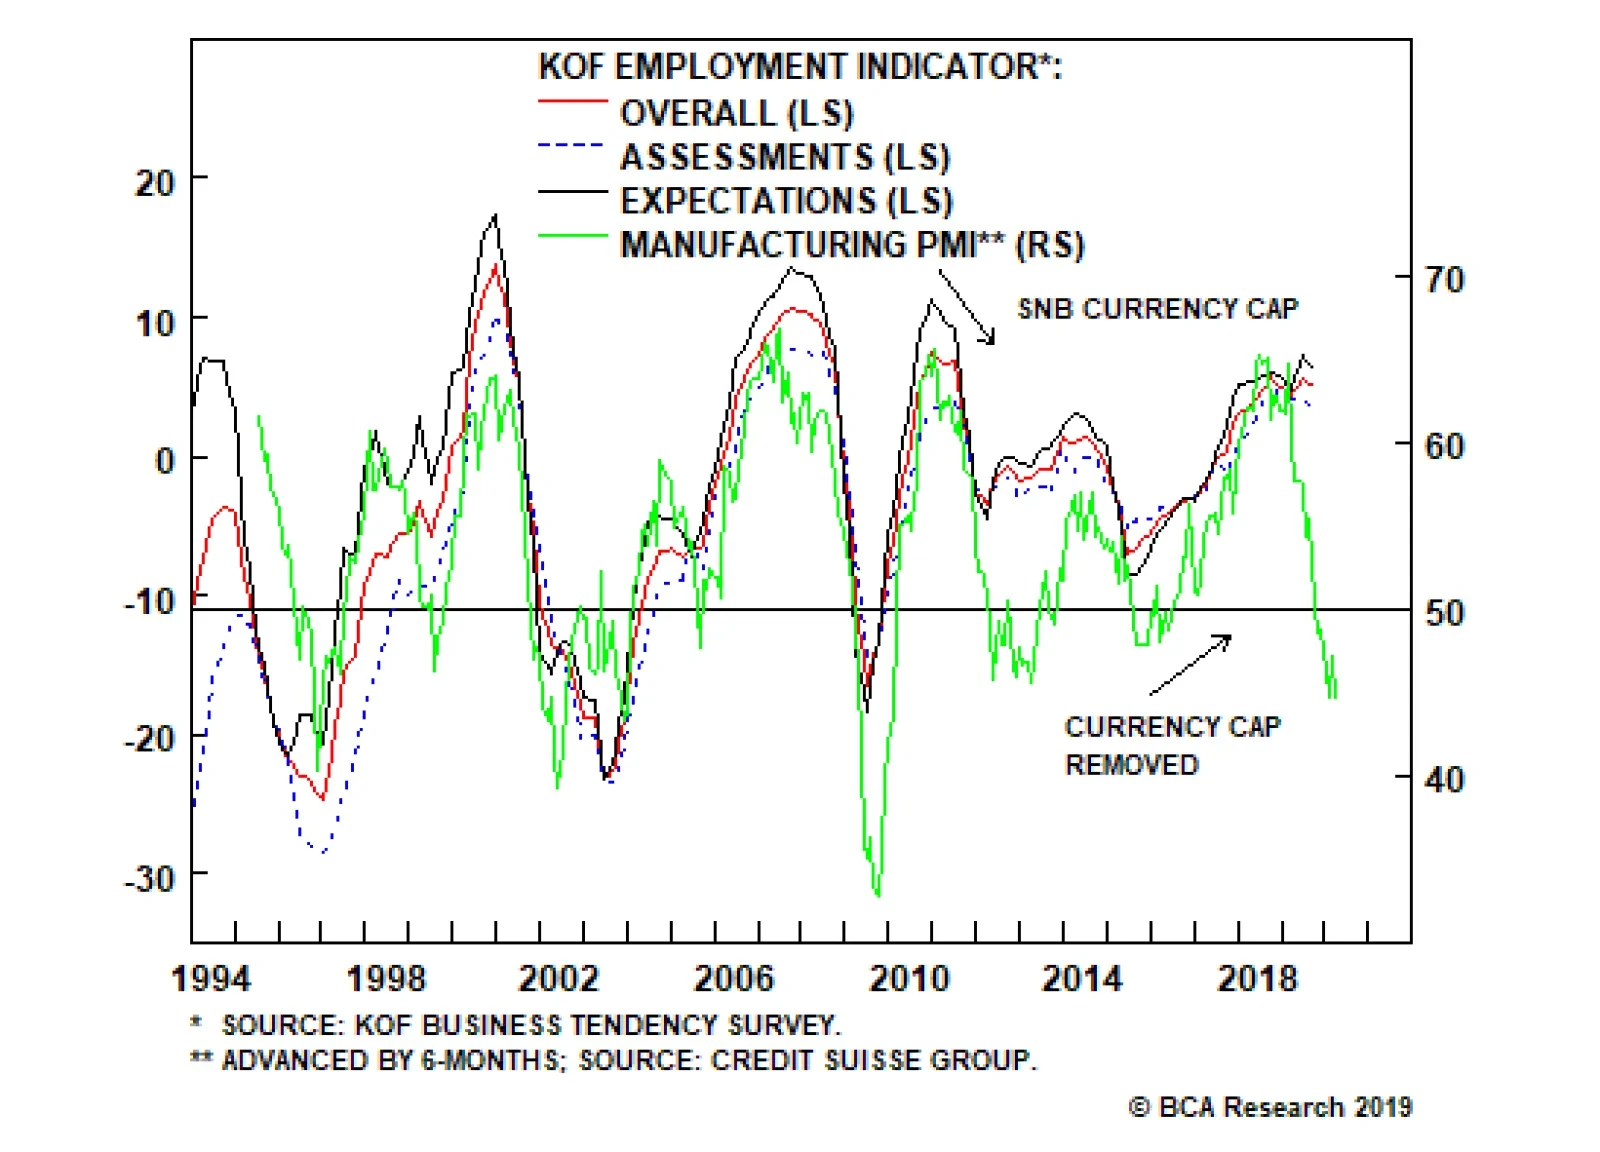
Domestically, the Swiss economy is holding up well, but how much longer will it defy a slowing external sector. The KOF employment indicator is at its highest level since 2010, and the expectations component continues to exceed the current assessment.…
Highlights The Cold War is a limited analogy for the U.S.-China conflict; In a multipolar world, complete bifurcation of trade is difficult if not impossible; History suggests that trade between rivals will continue, with minimal impediments; On a secular horizon, buy defense stocks, Europe, capex, and non-aligned countries. Feature There is a growing consensus that China and the U.S. are hurtling towards a Cold War. BCA Research played some part in this consensus – at least as far as the investment community is concerned – by publishing “Power and Politics in East Asia: Cold War 2.0?” in September 2012.1 For much of this decade, Geopolitical Strategy focused on the thesis that geopolitical risk was rotating out of the Middle East, where it was increasingly irrelevant, to East Asia, where it would become increasingly relevant. This thesis remains cogent, but it does not mean that a “Silicon Curtain” will necessarily divide the world into two bifurcated zones of capitalism. Trade, capital flows, and human exchanges between China and the U.S. will continue and may even grow. But the risk of conflict, including a military one, will not decline. In this report, we first review the geopolitical logic that underpins Sino-American tensions. We then survey the academic literature for clues on how that relationship will develop vis-à-vis trade and economic relations. The evidence from political theory is surprising and highly investment relevant. We then look back at history for clues as to what this means for investors. Our conclusion is that it is highly likely that the U.S. and China will continue to be geopolitical rivals. However, due to the geopolitical context of multipolarity, it is unlikely that the result will be “Bifurcated Capitalism.” Rather, we expect an exciting and volatile environment for investors where geopolitics takes its historical place alongside valuation, momentum, fundamentals, and macroeconomics in the pantheon of factors that determine investment opportunities and risks. The Thucydides Trap Is Real … Speaking in the Reichstag in 1897, German Foreign Secretary Bernhard von Bülow proclaimed that it was time for Germany to demand “its own place in the sun.”2 The occasion was a debate on Germany’s policy towards East Asia. Bülow soon ascended to the Chancellorship under Kaiser Wilhelm II and oversaw the evolution of German foreign policy from Realpolitik to Weltpolitik. While Realpolitik was characterized by Germany’s cautious balancing of global powers under Chancellor Otto von Bismarck, Weltpolitik saw Bülow and Wilhelm II seek to redraw the status quo through aggressive foreign and trade policy. Imperial Germany joined a long list of antagonists, from Athens to today’s People’s Republic of China, in the tragic play of human history dubbed the “Thucydides Trap.”3 Chart 1Imperial Overstretch
Imperial Overstretch
Imperial Overstretch
The underlying concept is well known to all students of world history. It takes its name from the Greek historian Thucydides and his seminal History of the Peloponnesian War. Thucydides explains why Sparta and Athens went to war but, unlike his contemporaries, he does not moralize or blame the gods. Instead, he dispassionately describes how the conflict between a revisionist Athens and established Sparta became inevitable due to a cycle of mistrust. Graham Allison, one of America’s preeminent scholars of international relations, has argued that the interplay between a status quo power and a challenger has almost always led to conflict. In 12 out of the 16 cases he surveyed, actual military conflict broke out. Of the four cases where war did not develop, three involved transitions between countries that shared a deep cultural affinity and a respect for the prevailing institutions.4 In those cases, the transition was a case of new management running largely the same organizational structure. And one of the four non-war outcomes was nothing less than the Cold War between the Soviet Union and the U.S. The fundamental problem for a status quo power is that its empire or “sphere of influence” remains the same size as when it stood at the zenith of power. However, its decline in a relative sense leads to a classic problem of “imperial overstretch.” The hegemonic or imperial power erroneously doubles down on maintaining a status quo that it can no longer afford (Chart 1). The challenger power is not blameless. It senses weakness in the hegemon and begins to develop a regional sphere of influence. The problem is that regional hegemony is a perfect jumping off point towards global hegemony. And while the challenger’s intentions may be limited and restrained (though they often are ambitious and overweening), the status quo power must react to capabilities, not intentions. The former are material and real, whereas the latter are perceived and ephemeral. The challenging power always has an internal logic justifying its ambitions. In China’s case today, there is a sense among the elite that the country is merely mean-reverting to the way things were for many centuries in China’s and Asia’s long history (Chart 2). In other words, China is a “challenger” power only if one describes the status quo as the past three hundred years. It is the “established” power if one goes back to an earlier state of affairs. As such, the consensus in China is that it should not have to pay deference to the prevailing status quo given that the contemporary context is merely the result of western imperialist “challenges” to the established Chinese and regional order. Chart 2China’s Mean Reverting Narrative
Back To The Nineteenth Century
Back To The Nineteenth Century
In addition, China has a legitimate claim that it is at least as relevant to the global economy as the U.S. and therefore deserves a greater say in global governance. While the U.S. still takes a larger share of the global economy, China has contributed 23% to incremental global GDP over the past two decades, compared to 13% for the U.S. (Chart 3). Chart 3The Beijing Consensus
Back To The Nineteenth Century
Back To The Nineteenth Century
Bottom Line: The emerging tensions between China and the U.S. fit neatly into the theoretical and empirical outlines of the Thucydides Trap. We do not see any way for the two countries to avoid struggle and conflict on a secular or forecastable horizon. What does this mean for investors? For one, the secular tailwinds behind defense stocks will persist. But what beyond that? Is the global economy destined to witness complete bifurcation into two armed camps separated by a Silicon Curtain? Will the Alibaba and Amazon Pacts suspiciously glare at each other the way that NATO and Warsaw Pacts did amidst the Cold War? The answer, tentatively, is no. … But It Will Not Lead to Economic Bifurcation President Trump’s aggressive trade policy also fits neatly into political theory, to a point. Realism in political science focuses on relative gains over absolute gains in all relationships, including trade. This is because trade leads to economic prosperity, prosperity to the accumulation of economic surplus, and economic surplus to military spending, research, and development. Two states that care only about relative gains due to rivalry produce a zero-sum game with no room for cooperation. It is a “Prisoner’s Dilemma” that can lead to sub-optimal economic outcomes in which both actors chose not to cooperate. The U.S.-China conflict will not lead to complete bifurcation of the global economy. Diagram 1 illustrates the effects of relative gain calculations on the trade behavior of states. In the absence of geopolitics, demand (Q3) is satisfied via trade (Q3-Q0) due to the inability of domestic production (Q0) to meet it. Diagram 1Trade War In A Bipolar World
Back To The Nineteenth Century
Back To The Nineteenth Century
However, geopolitical externality – a rivalry with another state – raises the marginal social cost of imports – i.e. trade allows the rival to gain more out of trade and “catch up” in terms of geopolitical capabilities. The trading state therefore eliminates such externalities with a tariff (t), raising domestic output to Q1, while shrinking demand to Q2, thus reducing imports to merely Q2-Q1, a fraction of where they would be in a world where geopolitics do not matter. The dynamic of relative gains can also have a powerful pull on the hegemon as it begins to weaken and rethink its originally magnanimous trade relations. As political scientist Duncan Snidal argued in a 1991 paper, When the global system is first set up, the hegemon makes deals with smaller states. The hegemon is concerned more with absolute gains, smaller states are more concerned with relative, so they are tougher negotiators. Cooperative arrangements favoring smaller states contribute to relative hegemonic decline. As the unequal distribution of benefits in favor of smaller states helps them catch up to the hegemonic actor, it also lowers the relative gains weight they place on the hegemonic actor. At the same time, declining relative preponderance increases the hegemonic state’s concern for relative gains with other states, especially any rising challengers. The net result is increasing pressure from the largest actor to change the prevailing system to gain a greater share of cooperative benefits.5 The reason small states are initially more concerned with relative gains is because they are far more concerned with national security than the hegemon. The hegemon has a preponderance of power and is therefore more relaxed about its security needs. This explains why Presidents George Bush Sr., Bill Clinton, and George Bush Jr. all made “bad deals” with China. Writing nearly thirty years ago, Snidal cogently described the current U.S.-China trade war. Snidal thought he was describing a coming decade of anarchy. But he and fellow political scientists writing in the early 1990s underestimated American power. The “unipolar moment” of American supremacy was not over, it was just beginning! As such, the dynamic Snidal described took thirty years to come to fruition. When thinking about the transition away from U.S. hegemony, most investors anchor themselves to the Cold War as it is the only world they have known that was not unipolar. Moreover the Cold War provides a simple, bipolar distribution of power that is easy to model through game theory. If this is the world we are about to inhabit, with the U.S. and China dividing the whole planet into spheres like the U.S. and Soviet Union, then the paragraph we lifted from Snidal’s paper would be the end of it. America would abandon globalization in totality, impose a draconian Silicon Curtain around China, and coerce its allies to follow suit. But most of recent human history has been defined by a multipolar distribution of power between states, not a bipolar one. The term “cold war” is applicable to the U.S. and China in the sense that comparable military power may prevent them from fighting a full-blown “hot war.” But ultimately the U.S.-Soviet Cold War is a poor analogy for today’s world. In a multipolar world, Snidal concludes, “states that do not cooperate fall behind other relative gains maximizers that cooperate among themselves. This makes cooperation the best defense (as well as the best offense) when your rivals are cooperating in a multilateral relative gains world.” Snidal shows via formal modeling that as the number of players increases from two, relative-gains sensitivity drops sharply.6 The U.S.-China relationship does not occur in a vacuum — it is moderated by the global context. Today’s global context is one of multipolarity. Multipolarity refers to the distribution of geopolitical power, which is no longer dominated by one or two great powers (Chart 4). Europe and Japan, for instance, have formidable economies and military capabilities. Russia remains a potent military power, even as India surpasses it in terms of overall geopolitical power. Chart 4The World Is No Longer Bipolar
The World Is No Longer Bipolar
The World Is No Longer Bipolar
A multipolar world is the least “ordered” and the most unstable of world systems (Chart 5). This is for three reasons: Chart 5Multipolarity Is Messy
Multipolarity Is Messy
Multipolarity Is Messy
Math: Multipolarity engenders more potential “conflict dyads” that can lead to conflict. In a unipolar world, there is only one country that determines norms and rules of behavior. Conflict is possible, but only if the hegemon wishes it. In a bipolar world, conflict is possible, but it must align along the axis of the two dominant powers. In a multipolar world, alliances are constantly shifting and producing novel conflict dyads. Lack of coordination: Global coordination suffers in periods of multipolarity as there are more “veto players.” This is particularly problematic during times of stress, such as when an aggressive revisionist power uses force or when the world is faced with an economic crisis. Charles Kindleberger has argued that it was exactly such hegemonic instability that caused the Great Depression to descend into the Second World War in his seminal The World In Depression.7 Mistakes: In a unipolar and bipolar world, there are a very limited number of dice being rolled at once. As such, the odds of tragic mistakes are low and can be mitigated with complex formal relationships (such as U.S.-Soviet Mutually Assured Destruction, grounded in formal modeling of game theory). But in a multipolar world, something as random as an assassination of a dignitary can set in motion a global war. The multipolar system is far more dynamic and thus unpredictable. In a multipolar world, the U.S. will not be able to exclude China from the global system. Diagram 2 is modified for a multipolar world. Everything is the same, except that we highlight the trade lost to other great powers. The state considering using tariffs to lower the marginal social cost of trading with a rival must account for this “lost trade.” In the context of today’s trade war with China, this would be the sum of all European Airbuses and Brazilian soybeans sold to China in the place of American exports. For China, it would be the sum of all the machinery, electronics, and capital goods produced in the rest of Asia and shipped to the United States. Diagram 2Trade War In A Multipolar World
Back To The Nineteenth Century
Back To The Nineteenth Century
Could Washington ask its allies – Europe, Japan, South Korea, Taiwan, etc. – not to take advantage of the lucrative trade (Q3-Q0)-(Q2-Q1) lost due to its trade tiff with China? Sure, but empirical research shows that they would likely ignore such pleas for unity. Alliances produced by a bipolar system produce a statistically significant and large impact on bilateral trade flows, a relationship that weakens in a multipolar context. This is the conclusion of a 1993 paper by Joanne Gowa and Edward D. Mansfield.8 The authors draw their conclusion from an 80-year period beginning in 1905, which captures several decades of global multipolarity. Unless the U.S. produces a wholehearted diplomatic effort to tighten up its alliances and enforce trade sanctions – something hardly foreseeable under the current administration – the self-interest of U.S. allies will drive them to continue trading with China. The U.S. will not be able to exclude China from the global system; nor will China be able to achieve Xi Jinping’s vaunted “self-sufficiency.” A risk to our view is that we have misjudged the global system, just as political scientists writing in the early 1990s did. To that effect, we accept that Charts 1 and 4 do not really support a view that the world is in a balanced multipolar state. The U.S. clearly remains the most powerful country in the world. The problem is that it is also clearly in a relative decline and that its sphere of influence is global – and thus very expensive – whereas its rivals have merely regional ambitions (for the time being). As such, we concede that American hegemony could be reasserted relatively quickly, but it would require a significant calamity in one of the other poles of power. For instance, a breakdown in China’s internal stability alongside the recovery of U.S. political stability. Bottom Line: The trade war between the U.S. and China is geopolitically unsustainable. The only way it could continue is if the two states existed in a bipolar world where the rest of the states closely aligned themselves behind the two superpowers. We have a high conviction view that today’s world is – for the time being – multipolar. American allies will cheat and skirt around Washington’s demands that China be isolated. This is because the U.S. no longer has the preponderance of power that it enjoyed in the last decade of the twentieth and the first decade of the twenty-first century. Insights presented thus far come from formal theory in political science. What does history teach us? Trading With The Enemy In 1896, a bestselling pamphlet in the U.K., “Made in Germany,” painted an ominous picture: “A gigantic commercial State is arising to menace our prosperity, and contend with us for the trade of the world.”9 Look around your own houses, author E.E. Williams urged his readers. “The toys, and the dolls, and the fairy books which your children maltreat in the nursery are made in Germany: nay, the material of your favorite (patriotic) newspaper had the same birthplace as like as not.” Williams later wrote that tariffs were the answer and that they “would bring Germany to her knees, pleading for our clemency.”10 By the late 1890s, it was clear to the U.K. that Germany was its greatest national security threat. The Germany Navy Laws of 1898 and 1900 launched a massive naval buildup with the singular objective of liberating the German Empire from the geographic constraints of the Jutland Peninsula. By 1902, the First Lord of the Royal Navy pointed out that “the great new German navy is being carefully built up from the point of view of a war with us.”11 There is absolutely no doubt that Germany was the U.K.’s gravest national security threat. As a result, London signed in April 1904 a set of agreements with France that came to be known as Entente Cordiale. The entente was immediately tested by Germany in the 1905 First Moroccan Crisis, which only served to strengthen the alliance. Russia was brought into the pact in 1907, creating the Triple Entente. In hindsight, the alliance structure was obvious given Germany’s meteoric rise from unification in 1871. However, one should not underestimate the magnitude of these geopolitical events. For the U.K. and France to resolve centuries of differences and formalize an alliance in 1904 was a tectonic shift — one that they undertook against the grain of history, entrenched enmity, and ideology.12 History teaches us that trade occurs even amongst rivals and during wartime. Political scientists and historians have noted that geopolitical enmity rarely produces bifurcated economic relations exhibited during the Cold War. Both empirical research and formal modeling shows that trade occurs even amongst rivals and during wartime.13 This was certainly the case between the U.K. and Germany, whose trade steadily increased right up until the outbreak of World War One (Chart 6). Could this be written off due to the U.K.’s ideological commitment to laissez-faire economics? Or perhaps London feared a move against its lightly defended colonies in case it became protectionist? These are fair arguments. However, they do not explain why Russia and France both saw ever-rising total trade with the German Empire during the same period (Chart 7). Either all three states were led by incompetent policymakers who somehow did not see the war coming – unlikely given the empirical record – or they simply could not afford to lose out on the gains of trade with Germany to each other. Chart 6The Allies Traded With Germany…
Back To The Nineteenth Century
Back To The Nineteenth Century
Chart 7… Right Up To WWI
Back To The Nineteenth Century
Back To The Nineteenth Century
Chart 8Japan And U.S. Never Downshifted Trade
Back To The Nineteenth Century
Back To The Nineteenth Century
A similar dynamic was afoot ahead of World War Two. Relations between the U.S. and Japan soured in the 1930s, with the Japanese invasion of Manchuria in 1931. In 1935, Japan withdrew from the 1922 Washington Naval Treaty – the bedrock of the Pacific balance of power – and began a massive naval buildup. In 1937, Japan invaded China. Despite a clear and present danger, the U.S. continued to trade with Japan right up until July 26, 1941, few days after Japan invaded southern Indochina (Chart 8). On December 7, Japan attacked the U.S. A skeptic may argue that precisely because policymakers sleepwalked into war in the First and Second World Wars, they will not (or should not) make the same mistake this time around. First, we do not make policy prescriptions and therefore care not what should happen. Second, we are highly skeptical of the view that policymakers in the early and mid-twentieth century were somehow defective (as opposed to today’s enlightened leaders). Our constraints-based framework urges us to seek systemic reasons for the behavior of leaders. Political science provides a clear theoretical explanation for why London and Washington continued to trade with the enemy despite the clarity of the threat. The answer lies in the systemic nature of the constraint: a multipolar world reduces the sensitivity of policymakers to relative gains by introducing a collective action problem thanks to changing alliances and the difficulty of disciplining allies’ behavior. In the case of U.S. and China, this is further accentuated by President Trump’s strategy of skirting multilateral diplomacy and intense focus on mercantilist measures of power (i.e. obsession with the trade deficit). An anti-China trade policy that was accompanied by a magnanimous approach to trade relations with allies could have produced a “coalition of the willing” against Beijing. But after two years of tariffs and threats against the EU, Japan, and Canada, the Trump administration has already signaled to the rest of the world that old alliances and coordination avenues are up for revision. There are two outcomes that we can see emerging over the course of the next decade. First, U.S. leadership will become aware of the systemic constraints under which they operate, and trade with China will continue – albeit with limitations and variations. However, such trade will not reduce the geopolitical tensions, nor will it prevent a military conflict. In facts, the probability of military conflict may increase even as trade between China and the U.S. remains steady. Second, U.S. leadership will fail to correctly assess that they operate in a multipolar world and will give up the highlighted trade gains from Diagram 2 to economic rivals such as Europe and Japan. Given our methodological adherence to constraint-based forecasting, we highly doubt that the latter scenario is likely. Bottom Line: The China-U.S. conflict is not a replay of the Cold War. Systemic pressures from global multipolarity will force the U.S. to continue to trade with China, with limitations on exchanges in emergent, dual-use technologies that China will nonetheless source from other technologically advanced countries. This will create a complicated but exciting world where geopolitics will cease to be seen as exogenous to investing. A risk to the sanguine conclusion is that the historical record is applicable to today, but that the hour is late, not early. It is already July 26, 1941 – when U.S. abrogated all trade with Japan – not 1930. As such, we do not have another decade of trade between U.S. and China remaining, we are at the end of the cycle. While this is a risk, it is unlikely. American policymakers would essentially have to be willing to risk a military conflict with China in order to take the trade war to the same level they did with Japan. It is an objective fact that China has meaningfully stepped up aggressive foreign policy in the region. But unlike Japan in 1941, China has not outright invaded any countries over the past decade. As such, the willingness of the public to support such a conflict is unclear, with only 21% of Americans considering China a top threat to the U.S. Investment Implications This analysis is not meant to be optimistic. First, the U.S. and China will continue to be rivals even if the economic relationship between them does not lead to global bifurcation. For one, China continues to be – much like Germany in the early twentieth century – concerned with access to external markets on which 19.5% of its economy still depend. China is therefore developing a modern navy and military not because it wants to dominate the rest of the world but because it wants to dominate its near abroad, much as the U.S. wanted to, beginning with the Monroe Doctrine. This will continue to lead to Chinese aggression in the South and East China Seas, raising the odds of a conflict with the U.S. Navy. Given that the Thucydides Trap narrative remains cogent, investors should look to overweight S&P 500 aerospace and defense stocks relative to global equity markets. An alternative way that one could play this thesis is by developing a basket of global defense stocks. Multipolarity may create constraints to trade protectionism, but it engenders geopolitical volatility and thus buoys defense spending. Second, we would not expect another uptick in globalization. Multipolarity may make it difficult for countries to completely close off trade with a rival, but globalization is built on more than just trade between rivals. Globalization requires a high level of coordination among great powers that is only possible under hegemonic conditions. Chart 9 shows that the hegemony of the British and later American empires created a powerful tailwind for trade over the past two hundred years. Chart 9The Apex Of Globalization Is Behind Us
The Apex Of Globalization Is Behind Us
The Apex Of Globalization Is Behind Us
The Apex of Globalization has come and gone – it is all downhill from here. But this is not a binary view. Foreign trade will not go to zero. The U.S. and China will not completely seal each other’s sphere of influence behind a Silicon Curtain. Instead, we focus on five investment themes that flow from a world that is characterized by the three trends of multipolarity, Sino-U.S. geopolitical rivalry, and apex of globalization: Europe will profit: As the U.S. and China deepen their enmity, we expect some European companies to profit. There is some evidence that the investment community has already caught wind of this trend, with European equities modestly outperforming their U.S. counterparts whenever trade tensions flared up in 2019 (Chart 10). Given our thesis, however, it is unlikely that the U.S. would completely lose market share in China to Europe. As such, we specifically focus on tech, where we expect the U.S. and China to ramp up non-tariff barriers to trade regardless of systemic pressures to continue to trade. A strategic long in the secularly beleaguered European tech companies relative to their U.S. counterparts may therefore make sense (Chart 11). Chart 10Europe: A Trade War Safe Haven
Europe: A Trade War Safe Haven
Europe: A Trade War Safe Haven
Chart 11Is Europe Really This Incompetent?
Is Europe Really This Incompetent?
Is Europe Really This Incompetent?
USD bull market will end: A trade war is a very disruptive way to adjust one’s trade relationship. It opens one to retaliation and thus the kind of relative losses described in this analysis. As such, we expect that U.S. to eventually depreciate the USD, either by aggressively reversing 2018 tightening or by coercing its trade rivals to strengthen their currencies. Such a move will be yet another tailwind behind the diversification away from the USD as a reserve currency, a move that should benefit the euro. Bull market in capex: The re-wiring of global manufacturing chains will still take place. The bad news is that multinational corporations will have to dip into their profit margins to move their supply chains to adjust to the new geopolitical reality. The good news is that they will have to invest in manufacturing capex to accomplish the task. One way to articulate this theme is to buy an index of semiconductor capital companies (AMAT, LRCX, KLAC, MKSI, AEIS, BRIKS, and TER). Given the highly cyclical nature of capital companies, we would recommend an entry point once trade tensions subside and green shoots of global growth appear. “Non-aligned” markets will benefit: The last time the world was multipolar, great powers competed through imperialism. This time around, a same dynamic will develop as countries seek to replicate China’s “Belt and Road Initiative.” This is positive for frontier markets. A rush to provide them with exports and services will increase supply and thus lower costs, providing otherwise forgotten markets with a boon of investments. India, and Asia-ex-China more broadly, stand as intriguing alternatives to China, especially with the current administration aggressively reforming to take advantage of the rewiring of global manufacturing chains. Capital markets will remain globalized: With interest rates near zero in much of the developed world and the demographic burden putting an ever-greater pressure on pension plans to generate returns, the search for yield will continue to be a powerful drive that keeps capital markets globalized. Limitations are likely to grow, especially when it comes to cross-border private investments in dual-use technologies. But a completely bifurcation of capital markets is unlikely. The world we are describing is one where geopolitics will play an increasingly prominent role for global investors. It would be convenient if the world simply divided into two warring camps, leaving investors with neatly separated compartments that enabled them to go back to ignoring geopolitics. This is unlikely. Rather, the world will resemble the dynamic years at the end of the nineteenth century, a rough-and-tumble era that required a multi-disciplinary approach to investing. Marko Papic, Consulting Editor, BCA Research Chief Strategist, Clocktower Group Marko@clocktowergroup.com Footnotes 1 Please see BCA Research Geopolitical Strategy, “Power And Politics In East Asia: Cold War 2.0?,” September 25, 2012, “Sino-American Conflict: More Likely Than You Think,” October 4, 2013, “The Great Risk Rotation,” December 11, 2013, and “Strategic Outlook 2014 – Stay The Course: EM Risk – DM Reward,” January 23, 2014, “Underestimating Sino-American Tensions,” November 6, 2015, “The Geopolitics Of Trump,” December 2, 2016, “How To Play The Proxy Battles In Asia,” March 1, 2017, and others available at gps.bcaresearch.com or upon request. 2 Please see German Historical Institute, “Bernhard von Bulow on Germany’s ‘Place in the Sun’” (1897), available at http://germanhistorydocs.ghi-dc.org/ 3 See Graham Allison, Destined For War: Can America and China Escape Thucydides’s Trap? (New York: Houghton Miffin Harcourt, 2017). 4 The three cases are Spain taking over from Portugal in the sixteenth century, the U.S. taking over from the U.K. in the twentieth century, and Germany rising to regional hegemony in Europe in the twenty-first century. 5 Duncan Snidal, “Relative Gains and the Pattern of International Cooperation,” The American Political Science Review, 85:3 (September 1991), pp. 701-726. 6 We do not review Snidal’s excellent game theory formal modeling in this paper as it is complex and detailed. However, we highly encourage the intrigued reader to pursue the study on their own. 7 See Charles P. Kindleberger, The World In Depression, 1929-1939 (Berkeley: University of California Press, 2013). 8 Joanne Gowa and Edward D. Mansfield, “Power Politics and International Trade,” The American Political Science Review, 87:2 (June 1993), pp. 408-420. 9 See Ernest Edwin Williams, Made in Germany (reprint, Ithaca: Cornell University Press), available at https://archive.org/details/cu31924031247830. 10 Quoted in Margaret MacMillan, The War That Ended Peace (Toronto: Allen Lane, 2014). 11 Peter Liberman, “Trading with the Enemy: Security and Relative Economic Gains,” international Security, 21:1 (Summer 1996), pp. 147-175. 12 Although France and Russia overcame even greater bitterness due to the ideological differences between a republic founded on a violent uprising against its aristocracy – France – and an aristocratic authoritarian regime – Russia. 13 See James Morrow, “When Do ‘Relative Gains’ Impede Trade?” The Journal of Conflict Resolution, 41:1 (February 1997), pp. 12-37; and Jack S. Levy and Katherine Barbieri, “Trading With the Enemy During Wartime,” Security Studies, 13:3 (December 2004), pp. 1-47.
Highlights The slowdown in the U.S. manufacturing sector is at risk of becoming deeper than elsewhere. This is not bearish for the U.S. dollar, given that it is a countercyclical currency, but it is not a constructive development, either. This impasse can be solved by an easier Federal Reserve, which would knock down the dollar. For now, we are maintaining our trade focus on the crosses rather than on outright dollar bets. The Swiss National Bank is likely to start weaponizing its currency, given the domestic slowdown: Go long EUR/CHF at 1.06. Long yen positions have become a consensus trade, but we will await a better exit point for our short USD/JPY positions. Feature The Swiss economy is slowly stepping into deflation. The latest inflation print this week stood at 0.1%, well below the SNB’s central forecast of 0.4% for this year. Goods inflation has completely ground to a halt, while service inflation is now at the lowest level since 2016. If left unchecked, this could begin to un-anchor inflation expectations, leading to a negative feedback loop that the SNB will likely find very difficult to lean against (Chart I-1). Chart I-1The SNB Will Have To Lean ##br##Against This
The SNB Will Have To Lean Against This
The SNB Will Have To Lean Against This
Chart I-2A Strong Franc Is Exerting A Powerful Deflationary Impulse
A Strong Franc Is Exerting A Powerful Deflationary Impulse
A Strong Franc Is Exerting A Powerful Deflationary Impulse
Global disinflationary trends are definitely playing a role, but the strong currency has been front and center at exacerbating these trends. As a small, open economy, tradeable goods prices are important for Switzerland. Import prices are deflating by over 3% year-on-year, in part driven by a strong trade-weighted currency (Chart I-2). This is increasing the odds that the SNB will begin to use the currency to stimulate monetary conditions. Operation Weak Franc Chart I-3How Long Can You Defy The Pull Of Gravity?
How Long Can You Defy The Pull Of Gravity?
How Long Can You Defy The Pull Of Gravity?
Domestically, the Swiss economy is holding up well, but it is an open question as to how much longer it will continue to defy the pull of a slowing external sector. The KOF employment indicator is at its highest level since 2010, and the expectations component continues to exceed the current assessment. During normal times, this is a bullish development. However, for a highly export-driven economy, the manufacturing sector usually dictates trends in the overall economy (Chart I-3). The manufacturing PMI print is currently sitting at 44.6, the worst since the financial crisis. These levels have usually rung loud alarm bells along SNB corridors. Back in 2011, Switzerland was rapidly stepping back into deflation, having just barely escaped it a year earlier. The SNB quickly realized that for a small, open economy, the exchange rate often dictates the trend in domestic inflation. Ergo, sitting and watching the trade-weighted Swiss franc continue to appreciate, especially given the euro was in a cascading downdraft, appeared to be a recipe for disaster. This sounds eerily similar to today. With the European Central Bank resuming quantitative easing and with an SNB that left rates unchanged at its most recent policy meeting, the signal is that interest rates have probably hit a floor. This view is further reinforced by the SNB’s additional tiering of reserves. In other words, rates have probably begun to teeter on the edge of financial stability. This leaves the currency as the policy tool of choice. Our bias is that the whisper floor of 1.08-1.10 for EUR/CHF will continue to persist until the Swiss economy decisively exits deflation. However, markets can tilt the Swiss exchange rate to an overshoot. If that happens, four key factors suggest the Swiss economy needs a weaker currency, especially versus the euro: The Swiss trade balance has held up well in the face of the global slowdown, but this has been largely driven by terms of trade. The Swiss trade balance has held up well in the face of the global slowdown, but this has been largely driven by terms of trade (Chart I-4). However, in a downturn, while commoditized goods prices are the first shoe to drop, the slowdown eventually starts to infect more specialized goods prices. Swiss goods are not easily substitutable, but other countries such as Sweden that have dropped their currency will benefit more from any recovery. Chart I-4Rising Terms Of Trade Have Helped ##br##Support Exports
Rising Terms Of Trade Have Helped Support Exports
Rising Terms Of Trade Have Helped Support Exports
Chart I-5A Gold ##br##Haven
A Gold Haven
A Gold Haven
Part of the improvement in the Swiss trade balance has been driven by precious metals exports. For example, exports of precious metals to the U.K. are soaring towards new highs as storage demand for ETF accounts rises (Chart I-5). However, there has been a lack of physical demand in Asia, while the riots in Hong Kong are causing gold to be rerouted to Switzerland, then London. This might soon end. Our models suggest the franc is now almost 10% overvalued versus the euro. Over the history of the model, franc overvaluation peaks at a high of 15%, and is often followed by intervention by the SNB (Chart I-6). While the unemployment rate is at 2.3%, domestic wage pressures are none existent. It will be difficult for service inflation to pick up without a build-up in wage pressures. This is unlikely to happen over the next six to nine months. Part-time employment continues to dominate job gains, meaning the need for precautionary savings will continue to restrain spending. Meanwhile, the manufacturing sector is unlikely to start raising wages before a recovery is in sight. However, more recently, foreign exchange reserves have started reaccelerating and the stability in the monetary base suggests some spectre of sterilization. It has been surprising that in the global race towards lower rates and amidst the potential for global currency devaluation, the SNB has been sitting and watching other central banks like the ECB and the Riksbank eat part of its lunch. The message from SNB Central Bank Chair Thomas Jordan has been very clear: Interest rates could be lowered further, along with powerful intervention in the foreign exchange market if necessary. This might slightly suggest disagreement within the governing council. Chart I-6The Franc Is ##br##Expensive
The Franc Is Expensive
The Franc Is Expensive
Chart I-7Is The SNB Sterilizing Reserve Accumulation?
Is The SNB Sterilizing Reserve Accumulation?
Is The SNB Sterilizing Reserve Accumulation?
Interestingly, the SNB has not had to ramp up its balance sheet significantly in recent years. Part of the reason is that the slowdown in global trade eased natural demand for francs, which meant the SNB was no longer accumulating foreign exchange reserves at a rampant pace. This has helped drain excess liquidity from the system and somewhat renormalize policy. This means that the wiggle room for more FX intervention has reopened. However, more recently, foreign exchange reserves have started reaccelerating, and the stability in the monetary base suggests some spectre of sterilization (Chart I-7). Economically, the SNB has to walk a fine line between a predominantly deflationary backdrop in Switzerland and a rising debt-to-GDP ratio that pins it among the highest in the G-10. Too little stimulus and the economy runs the risk of entering a debt-deflation spiral, as inflation expectations continue to be anchored strongly to the downside. Too much stimulus, and the result will be a build-up of imbalances, leading to an eventual bust. Currency Cap Post-Mortem While the SNB may favor stealth depreciation of the franc, there are both political and economic constraints to an outright cap. The good news is that the economic forces are ebbing as the economy slows down. Meanwhile, there had already been a rising chorus of discontent among right-wing politicians in 2014, specifically those within the Swiss People’s Party (SVP) who wanted the central bank to stop buying foreign currencies and significantly lift its gold holdings instead. With the SVP currently ahead in opinion polls ahead of this month’s elections, this is likely to remain a constraint. The good news is that new issues such as climate change have taken the fore, rather than whether Switzerland should start backing it reserves via gold (Chart I-8). The key risk to a cap is that if the euro drops substantially, it will invite speculation back into the Swiss economy. This risk is clearly unpalatable for both Swiss politicians and the SNB, which is why two-way asymmetry was reintroduced into the system in 2015. Chart I-8The Swiss People's Party Will ##br##Like This Up!
The Swiss People's Party Will Like This Up!
The Swiss People's Party Will Like This Up!
Chart I-9A Healthy ##br##Rebalancing
A Healthy Rebalancing
A Healthy Rebalancing
On a positive note, housing market speculation has been somewhat cleansed. Growth in rental housing units, which usually constitutes the bulk of investment homes, has grown to a standstill, and this is positively deviating from growth in owner-occupied homes. The message from this is clear: Macro-prudential measures such as a cap on second homes as well as stricter lending standards have helped (Chart I-9). Back in 2015, the SNB smartly surprised the market by abandoning the EUR/CHF floor. This helped rebalance the market as European investors who used the SNB put to speculate on properties in Zurich and Geneva were dis-incentivized once the euro collapsed. Demand for Swiss real estate has largely stabilized since then, eliminating this key source of risk for the SNB. The SVP’s curb on immigration has neutered a meaningful source of demand. Vacancy rates for rental properties have started to inflect meaningfully higher. More importantly, vacancy rates for rental properties have started to inflect meaningfully higher. This has usually led to lower housing prices, with a lag of about 12 months (Chart I-10). With the SVP unlikely to become more pro-immigration anytime soon, this will likely remain a headwind (Chart I-11). This suggests the political capital for the SNB to use stealth depreciation of the currency to stimulate the economy is high, especially as the global economy remains mired in a manufacturing downturn. A history of budget surpluses suggests that the SVP is unlikely to pass any significant pro-fiscal policies at any time soon. Chart I-10Slowing Migration Is Curbing Housing Demand
Slowing Migration Is Curbing Housing Demand
Slowing Migration Is Curbing Housing Demand
Chart I-11A Slowing Workforce Is Curbing Housing Demand
A Slowing Workforce Is Curbing Housing Demand
A Slowing Workforce Is Curbing Housing Demand
Claims on bank balance sheets from foreigners are relatively low, meaning the risk from an inflow of capital into the housing market on a lower exchange rate is low (Chart I-12). With bank lending margins likely to be depressed for the next few years, some foreign inflows into the real estate sector would help, alongside stricter macro prudential measures. Chart I-12Banks Have Low Foreign Mortgage Liabilities
Banks Have Low Foreign Mortgage Liabilities
Banks Have Low Foreign Mortgage Liabilities
On EUR/CHF And USD/CHF Switzerland ticks off all the characteristics of a safe-haven currency. Its large net international investment position of 115% of GDP generates huge income inflows. Meanwhile, rising productivity over the years has led to a structural surplus in its trading balance and a rising fair value for the currency. Consequently, the franc has tended to have an upward bias over the years, supercharged during periods of risk aversion (Chart I-13). Meanwhile, hedging costs for short CHF trades are less attractive than a year ago. They might get more prohibitive but until then, we suggest prudence in going short the franc versus the euro or USD (Chart I-14). Our bias however, is that the SNB will significantly start to lean against the franc at 1.06. Chart I-13Risk: Swiss Franc Tends ##br##To Appreciate
Risk: Swiss Franc Tends To Appreciate
Risk: Swiss Franc Tends To Appreciate
Chart I-14Hedging Costs Are ##br##Prohibitive
Hedging Costs Are Prohibitive
Hedging Costs Are Prohibitive
Investment Conclusions Chart I-15Major Dollar Tailwinds Have Peaked
Major Dollar Tailwinds Have Peaked
Major Dollar Tailwinds Have Peaked
We continue to focus on trades at the crosses, and holding portfolio insurance such as the Swiss franc remains what the doctor ordered. Our objective in this week’s report was to highlight that investors and traders may not want to overstay their welcome, and as such keep a watchful eye on tentative signs of a reversal. Typically, the growth divergence between the U.S. and the rest of the world has been a good explanatory variable for medium-term fluctuations in the dollar. Ergo, the deceleration in the U.S. manufacturing PMI usually foretells a bad omen for the dollar (Chart I-15). The franc tends to do well at the crosses during dollar bull markets and poorly during dollar bear markets. However, there are benign adjustments and malignant ones, and a drop in the U.S. manufacturing PMI, driven by much slower global growth, looks like the malignant type. What we will need to see, if the weak dollar narrative is to pan out, is stabilization in the U.S. manufacturing sector, as the rest of the world’s manufacturing sector inflects higher. This will also weaken the franc at the crosses. Stay tuned. Chester Ntonifor, Foreign Exchange Strategist chestern@bcaresearch.com Currencies U.S. Dollar Chart II-1USD Technicals 1
USD Technicals 1
USD Technicals 1
Chart II-2USD Technicals 2
USD Technicals 2
USD Technicals 2
There was a flurry of U.S. data releases, the balance of which was negative: Headline PCE was unchanged at 1.4% year-on-year in August. Core PCE increased to 1.8% year-on-year. Chicago purchasing managers’ index fell to 47.1 in September from 50.4 in August. Dallas Fed manufacturing business index fell to 1.5 in September from 2.7 in August. ISM manufacturing PMI plunged to 47.8 in September, the second consecutive month below 50. Moreover, ISM non-manufacturing PMI fell to 52.6 in September from 56.4, well below expectations of 55. Admittedly, the Markit composite PMI was up at 51 versus 50.7 the prior month. ADP non-farm payrolls were below expectations at 135K in September, versus 157K in August. Durable goods orders monthly growth slowed to 0.2% in August. Factory orders contracted by 0.1% month-on-month in August. DXY index rose by 0.6% initially, then plunged, losing 0.4% this week. The deterioration in both ISM manufacturing and non-manufacturing PMIs spurred worry about an imminent recession. We get the jobs report this Friday, which is one of the last pillars of support for a relatively hawkish Fed policy. On the monetary policy front, the Fed will resume the balance sheet expansion. The increase in supply of dollars will add to the forces that might eventually pull the dollar lower. Report Links: Preserving Capital During Riot Points - September 6, 2019 Has The Currency Landscape Shifted? - August 16, 2019 USD/CNY And Market Turbulence - August 9, 2019 The Euro Chart II-3EUR Technicals 1
EUR Technicals 1
EUR Technicals 1
Chart II-4EUR Technicals 2
EUR Technicals 2
EUR Technicals 2
Recent data in the euro area have been negative: Inflation remains subdued across euro area countries in August. Headline inflation in the euro area fell to 0.9% year-on-year from 1%. In France, the headline inflation declined to 1.1% year-on-year from 1.3%. In Spain, it fell to 0.1% year-on-year from 0.3%. In Germany, it also decreased to 1.2% year-on-year from 1.4%. The unemployment rate in the euro area marginally decreased to 7.4% in August from 7.5%. The economic sentiment indicator in the euro area fell to 101.7 in September from 103.1. Producer price index fell by 0.8% year-on-year in August. Retail sales growth was little changed at 2.1% year-on-year in August. EUR/USD increased by 0.6% this week. On the inflation front, the steeper drop in CPI for core countries rather than the peripheral ones suggests that the redistributive efforts needed to hold the euro area together are somewhat working. ECB president Mario Draghi called for an “investment-led stimulus at the euro area level” in a speech in Athens on Tuesday evening, but the reality is that the peripheral countries are already using lower rates to deploy capital. J.P. Morgan analysts have upgraded European equities this week. If equity fund flows start to rise, the euro is likely to rebound against the U.S. dollar. Report Links: A Few Trade Ideas - Sept. 27, 2019 Battle Of The Central Banks - June 21, 2019 EUR/USD And The Neutral Rate Of Interest - June 14, 2019 Japanese Yen Chart II-5JPY Technicals 1
JPY Technicals 1
JPY Technicals 1
Chart II-6JPY Technicals 2
JPY Technicals 2
JPY Technicals 2
Recent data in Japan have been disappointing: The all-important Tankan survey came out this week. There was deterioration in both the manufacturer and service outlook in Q3, but it was admittedly above expectations. Plans for capex remained relatively elevated. Industrial production contracted by 4.7% year-on-year in August. Retail sales increased by 2% year-on-year in August, but we are downplaying this because of the consumption tax hike. Housing starts decreased by 7.1% year-on-year in August. Construction orders fell by 25.9% year-on-year (the latter being extremely volatile). The unemployment rate was unchanged at 2.2% in August. Jobs-to-applicants ratio was also unchanged at 1.59. Consumer confidence fell to 35.6 in August, from 37.1 in July. We have discussed in length the significance of this in a Ricardian equivalence framework. Services PMI fell to 52.8 in September, while still above the 50 expansionary territory. USD/JPY fell by 1% this week. In the recent Summary of Opinions, the BoJ highlighted risks of lower external demand due to delayed economic growth. On the positive side, various countermeasures are set to mitigate the negative effects of the tax hike. We remain positive on the safe-haven Japanese yen as a hedge with limited downside. Report Links: A Few Trade Ideas - Sept. 27, 2019 Has The Currency Landscape Shifted? - August 16, 2019 Portfolio Tweaks Into Thin Summer Trading - July 5, 2019 British Pound Chart II-7GBP Technicals 1
GBP Technicals 1
GBP Technicals 1
Chart II-8GBP Technicals 2
GBP Technicals 2
GBP Technicals 2
Recent data in the U.K. have been mixed: GDP growth increased to 1.3% year-on-year in Q2. On a quarter-on-quarter basis however, GDP growth contracted by 0.2% in Q2. Current account deficit narrowed to £25.2 billion in Q2, from £33.1 billion in Q1. Nationwide house prices grew by 0.2% year-on-year in September, compared with 0.6% in August. Markit manufacturing PMI increased to 48.3 in September from 47.4; Construction PMI fell to 43.3 from 45; Services PMI fell below 50 to 49.5. GBP/USD increased by 0.8% this week. PM Boris Johnson gave a speech this week and introduced the details of a Brexit proposal that was an easy target for the firing squads in this imbroglio. Another Brexit delay and re-election seem highly likely. The improvement in the Markit manufacturing PMI reflects higher confidence over the lower probability of a hard Brexit in our view. We recently upgraded the outlook for U.K. and went long the GBP/JPY. Stay with it. Report Links: A Few Trade Ideas - Sept. 27, 2019 United Kingdon: Cyclical Slowdown Or Structural Malaise? - Sept. 20, 2019 Battle Of The Central Banks - June 21, 2019 Australian Dollar Chart II-9AUD Technicals 1
AUD Technicals 1
AUD Technicals 1
Chart II-10AUD Technicals 2
AUD Technicals 2
AUD Technicals 2
Recent data in Australia have been mixed: Headline inflation slowed from 1.7% to 1.5% year-on-year in September. Private sector credit grew by 2.9% year-on-year in August. AiG manufacturing PMI increased to 54.7 in September from 53.1 in August. AiG services PMI marginally increased to 51.5 from 51.4. Commonwealth manufacturing PMI fell slightly to 50.3, from an upward-adjusted 50.9 in August. Commonwealth services PMI was little changed at 52.4. Building permits keep contracting by 21.5% year-on-year in August. Exports fell by 3% month-on-month in August, while imports were unchanged. The trade surplus narrowed to A$5.9 billion from A$7.3 billion. AUD/USD fell by 1.3% initially post RBA, then recovered with broad U.S. dollar weakness, returning flat this week. The RBA lowered interest rates by another 25 basis points on Tuesday, and stated that “the Australian economy is at a gentle turning point.” Lower rates, though not fully transferred to mortgage rates, could help to stabilize the housing market to some extent, and lift wage growth. We maintain a pro-cyclical stance and remain positive on the Australian dollar. Report Links: A Contrarian View On The Australian Dollar - May 24, 2019 Beware Of Diminishing Marginal Returns - April 19, 2019 Not Out Of The Woods Yet - April 5, 2019 New Zealand Dollar Chart II-11NZD Technicals 1
NZD Technicals 1
NZD Technicals 1
Chart II-12NZD Technicals 2
NZD Technicals 2
NZD Technicals 2
Recent data in New Zealand have been mostly negative: Building permits increased by 0.8% month-on-month in August. Activity outlook fell by 1.8% month-on-month in September. Business confidence fell further to -53.5 in September, from -52.3 in August. NZD/USD increased by 0.3% this week. The latest Quarterly Survey of Business Opinion, conducted by the New Zealand Institute of Economic Research, has shown that business conditions point to further slowing in economic activity. The manufacturing sector remains the most problematic. Moreover, firms are cautious about expanding, due to the combination of intense cost pressures, and weak pricing power. Australia has lowered interest rates giving ammunition to their antipodean neighbors to follow suit. The probability of rate cuts by RBNZ in its next policy meeting on November 13th reached 100%: 90% for a 25 bps cut and 10% for 50 bps. Report Links: USD/CNY And Market Turbulence - August 9, 2019 Where To Next For The U.S. Dollar? - June 7, 2019 Not Out Of The Woods Yet - April 5, 2019 Canadian Dollar Chart II-13CAD Technicals 1
CAD Technicals 1
CAD Technicals 1
Chart II-14CAD Technicals 2
CAD Technicals 2
CAD Technicals 2
Recent data in Canada have been mixed: On a month-on-month basis, the GDP stagnated in July. On a year-on-year basis, GDP growth slowed from 1.5% to 1.3% in July. Markit manufacturing PMI increased to 51 in September, from 49.1 in August. Bloomberg Nanos confidence increased to 57.8 for the week ended September 27th. Raw material prices fell by 1.8% month-on-month in August. USD/CAD increased by 0.5% this week. Canadian GDP growth in July was led by the services sector. The divergence was 2.5% year-on-year in July for services GDP, while goods GDP continued to deteriorate, contracting by 1.8% year-on-year. GDP in the energy sector, a focal industry in the country, fell by 3.4% year-on-year in July, affected by the fluctuations in oil prices. Moreover, as our colleagues in Commodity & Energy Strategy point out, the price differential between Canadian crude oil and WTI would likely to deepen further, possibly reaching a discount of $20/bbl into 1Q20, due to transportation constraints in the west. Report Links: Preserving Capital During Riot Points - September 6, 2019 Portfolio Tweaks Into Thin Summer Trading - July 5, 2019 On Gold, Oil And Cryptocurrencies - June 28, 2019 Swiss Franc Chart II-15CHF Technicals 1
CHF Technicals 1
CHF Technicals 1
Chart II-16CHF Technicals 2
CHF Technicals 2
CHF Technicals 2
Recent data in Switzerland have been negative: KOF leading indicator fell to 93.2 in September. Real retail sales contracted by 1.4% year-on-year in August. Manufacturing PMI fell to 44.6 in September from 47.2 in August. Headline inflation decreased to 0.1% year-on-year in September, from 0.3%. USD/CHF increased by 0.7% this week. While the Swiss economy is highly linked to global developments, especially those in the euro area, the positive current account balance makes it less vulnerable on a relative basis. We continue to favor the franc as a safe-haven hedge. We discuss the franc in this week’s front section. Report Links: What To Do About The Swiss Franc? - May 17, 2019 Beware Of Diminishing Marginal Returns - April 19, 2019 Balance Of Payments Across The G10 - February 15, 2019 Norwegian Krone Chart II-17NOK Technicals 1
NOK Technicals 1
NOK Technicals 1
Chart II-18NOK Technicals 2
NOK Technicals 2
NOK Technicals 2
There are scant data from Norway this week: Retail sales were unchanged in August. USD/NOK appreciated by 0.3% this week. The recent decline in oil prices has pushed our petrocurrency basket trade offside, weighed by the quick oil facility recovery in Saudi and demand concerns over a possible recession. That said, we continue to overweight energy prices and the Norwegian krone. The looming tension in the Middle East could lead to further escalation, which will again disrupt oil supplies and lift oil prices. Report Links: A Few Trade Ideas - Sept. 27, 2019 Portfolio Tweaks Into Thin Summer Trading - July 5, 2019 On Gold, Oil And Cryptocurrencies - June 28, 2019 Swedish Krona Chart II-19SEK Technicals 1
SEK Technicals 1
SEK Technicals 1
Chart II-20SEK Technicals 2
SEK Technicals 2
SEK Technicals 2
Recent data in Sweden have been negative: Retail sales grew by 2.7% year-on-year in August, compared to a 3.9% yearly growth in July. Manufacturing PMI plunged to 46.3 in September, from 52.4 in August. USD/SEK increased by 0.5% this week. While the PMI employment component increased to 52.4 from 51.9, the new orders index plunged below 50 to 45.8. The new orders-to-inventory ratio also continues to decrease, which usually leads the euro area manufacturing PMI by a few months. This is one of the key data points we follow, so are heeding to the message from this indicator. Report Links: Where To Next For The U.S. Dollar? - June 7, 2019 Balance Of Payments Across The G10 - February 15, 2019 A Simple Attractiveness Ranking For Currencies - February 8, 2019 Trades & Forecasts Forecast Summary Core Portfolio Tactical Trades Limit Orders Closed Trades
Highlights MARKET FORECASTS
Fourth Quarter 2019 Strategy Outlook: A "Show Me" Market
Fourth Quarter 2019 Strategy Outlook: A "Show Me" Market
Investment Strategy: Markets have entered a “show me” phase. Better economic data and meaningful progress on the trade negotiations will be necessary for stocks to move sustainably higher. We think both preconditions will be realized. Until then, risk assets could come under pressure. Global Asset Allocation: Investors should overweight stocks relative to bonds over a 12-month horizon, but maintain higher-than-normal cash positions in the near term as a hedge against downside risks. Equities: EM and European stocks will outperform once global growth bottoms out. Cyclical sectors, including financials, will also start to outperform defensives when the growth cycle turns. Bonds: Central banks will remain dovish, but yields will nevertheless rise modestly on the back of stronger global growth. Favor high-yield corporate credit over government bonds. Currencies: As a countercyclical currency, the U.S. dollar should peak later this year. Commodities: Oil and industrial metals prices will move higher. Gold prices have entered a holding pattern, but should shine again late next year or in 2021 when inflation finally breaks out. Feature Dear Client, In lieu of this report, I hosted a webcast on Monday, October 7th at 10:00 AM EDT, where I discussed the major investment themes and views I see playing out for the rest of the year and beyond. Best regards, Peter Berezin, Chief Global Strategist I. Global Macro Outlook A Testing Phase For The Global Economy The global economy has reached a critical juncture. Growth has been slowing since early 2018, reaching what many would regard as “stall speed.” This is the point where economic weakness begins to feed on itself, potentially triggering a recession. Will the growth slowdown worsen? Our guess is that it won’t. Global financial conditions have eased significantly over the past four months, thanks in part to the dovish pivot by most central banks. Looser financial conditions usually bode well for global growth (Chart 1). Our global leading indicator has hooked up, mainly due to a marginal improvement in emerging markets’ data (Chart 2). Chart 1Easier Financial Conditions Will Boost Global Growth
Easier Financial Conditions Will Boost Global Growth
Easier Financial Conditions Will Boost Global Growth
Chart 2Global LEI Has Moved Off Its Lows
Global LEI Has Moved Off Its Lows
Global LEI Has Moved Off Its Lows
An important question is whether the weakness in the manufacturing sector will spread to the much larger services sector. There is some evidence that this is happening, with yesterday’s weaker-than-expected ISM non-manufacturing release being the latest example. Nevertheless, the deceleration in service sector activity has been limited so far (Chart 3). Even in Germany, with its large manufacturing base, the service sector PMI remains in expansionary territory. This is a key difference with the 2001/02 and 2008/09 periods, when service sector activity collapsed in lockstep with manufacturing activity. Chart 3AThe Service Sector Has Softened Less Than Manufacturing (I)
The Service Sector Has Softened Less Than Manufacturing (I)
The Service Sector Has Softened Less Than Manufacturing (I)
Chart 3BThe Service Sector Has Softened Less Than Manufacturing (II)
The Service Sector Has Softened Less Than Manufacturing (II)
The Service Sector Has Softened Less Than Manufacturing (II)
The Drive-By Slowdown If one were to ask most investors the reasons behind the manufacturing slowdown, they would probably cite the trade war or the Chinese deleveraging campaign. These are both valid reasons, but there is a less well-known culprit: autos. According to WardsAuto, global auto sales fell by over 5% in the first half of the year, by far the biggest decline since the Great Recession (Chart 4). Production dropped by even more. Chart 4Weakness In The Auto Sector Has Exacerbated The Manufacturing Downturn
Weakness In The Auto Sector Has Exacerbated The Manufacturing Downturn
Weakness In The Auto Sector Has Exacerbated The Manufacturing Downturn
Chart 5U.S. Auto Demand Is Recovering
U.S. Auto Demand Is Recovering
U.S. Auto Demand Is Recovering
The weakness in the global auto sector reflects a variety of factors. New stringent emission requirements, expiring tax breaks, lagged effects from tighter auto loan lending standards, and trade tensions have all played a role. In addition, the decline in gasoline prices in 2015/16 probably brought forward some automobile purchases. This suggests that the 2015/16 global manufacturing downturn may have helped sow the seeds for the current one. The fact that automobile output is falling faster than sales is encouraging because it means that excess inventories are being worked off. U.S. auto loan lending standards have started to normalize, with banks reporting stronger demand for auto loans in the latest Senior Loan Officer Survey (Chart 5). In China, auto sales have troughed after having declined by as much as 14% earlier this year (Chart 6). The Chinese automobile ownership rate is a fifth of what it is in the U.S., a quarter of what it is in Japan, and a third of what it is in Korea (Chart 7). Given the low starting point, Chinese auto sales are likely to resume their secular uptrend. Chart 6Auto Sector In China Is Finding A Floor
Auto Sector In China Is Finding A Floor
Auto Sector In China Is Finding A Floor
Chart 7China: Structural Outlook For Autos Is Bright
China: Structural Outlook For Autos Is Bright
China: Structural Outlook For Autos Is Bright
The Trade War: Tracking Towards A Détente? Chart 8A Fairly Regular Three-Year Manufacturing Cycle
A Fairly Regular Three-Year Manufacturing Cycle
A Fairly Regular Three-Year Manufacturing Cycle
Manufacturing cycles typically last about three years – 18 months of slowing growth followed by 18 months of rising growth (Chart 8). To the extent that the global manufacturing PMI peaked in the first half of 2018, we should be nearing the end of the current downturn. Of course, much depends on policy developments. As we go to press, high-level negotiations between the U.S. and China have resumed. While it is impossible to predict the outcome of these talks, it does appear that both sides have an incentive to de-escalate the trade conflict. President Trump gets much better marks from voters on his management of the economy than on anything else, including his handling of trade negotiations with China (Chart 9). A protracted trade war would hurt U.S. growth, while weakening the stock market. Both would undermine Trump’s re-election prospects. Chart 9Trump Gets Reasonably High Marks On His Handling Of The Economy, But Not Much Else
Fourth Quarter 2019 Strategy Outlook: A "Show Me" Market
Fourth Quarter 2019 Strategy Outlook: A "Show Me" Market
Chart 10Who Will Win The 2020 Democratic Nomination?
Fourth Quarter 2019 Strategy Outlook: A "Show Me" Market
Fourth Quarter 2019 Strategy Outlook: A "Show Me" Market
China also wants to bolster growth. As difficult as it has been for the Chinese leadership to deal with Donald Trump, trying to secure a trade deal with him after he has been re-elected would be even more challenging. This would especially be the case if Trump thought that the Chinese had tried to sabotage his re-election bid. Even if Trump were to lose the election, it is not clear that China would end up with someone more pliant to deal with on trade matters. Does the Chinese government really want to negotiate over environmental standards and human rights with President Warren, who betting markets now think has a better chance of becoming the Democratic nominee than Joe Biden (Chart 10)? The Democrats’ initiative to impeach President Trump make a trade resolution somewhat more likely. First, it brings attention to Joe Biden’s (and his son’s) own dubious dealings in Ukraine, thus delivering a blow to China’s preferred U.S. presidential candidate. Second, it makes Trump more inclined to want to put the China spat behind him in order to focus his energies on domestic matters. More Chinese Stimulus? Strategically, China has a strong incentive to stimulate its economy in order to prop up growth and gain greater leverage in the trade negotiations. The Chinese credit impulse bottomed in late 2018. The impulse leads Chinese nominal manufacturing output and most other activity indicators by about nine months (Chart 11). So far, the magnitude of China’s credit/fiscal easing has come nowhere close to matching the stimulus that was unleashed on the economy both in 2015/16 and 2008/09. This is partly because the authorities are more worried about excessive debt levels today than they were back then, but it is also because the economy is in better shape. The shock from the trade war has not been nearly as bad as the Great Recession – recall that Chinese exports to the U.S. are only 2.7% of GDP in value-added terms. Unlike in 2015/16, when China lost over $1 trillion in external reserves, capital outflows have remained muted this time around (Chart 12). Chart 11Chinese Stimulus Should Boost Global Growth
Chinese Stimulus Should Boost Global Growth
Chinese Stimulus Should Boost Global Growth
Chart 12China: No Major Capital Outflows
China: No Major Capital Outflows
China: No Major Capital Outflows
Better-than-expected Chinese PMI data released earlier this week offers a glimmer of hope. Nevertheless, in light of the disappointing August activity numbers, China is likely to increase the pace of stimulus in the coming months. The authorities have already reduced bank reserve requirements. We expect them to cut policy rates further in the coming months. They will also front-load local government bond issuance, which should help boost infrastructure spending. European Growth Should Improve A pickup in global growth will help Europe later this year. Germany, with its trade-dependent economy, will benefit the most. Chart 13Spreads Have Come In Across Southern Europe
Spreads Have Come In Across Southern Europe
Spreads Have Come In Across Southern Europe
Chart 14Faster Money Growth Bodes Well For GDP Growth In The Euro Area
Faster Money Growth Bodes Well For GDP Growth In The Euro Area
Faster Money Growth Bodes Well For GDP Growth In The Euro Area
Falling sovereign spreads should also support Southern Europe (Chart 13). The Italian 10-year spread with German bunds has narrowed by almost a full percentage point since mid-August, taking the Italian 10-year yield down to 0.83%. Greek 10-year bonds are now yielding less than U.S. Treasurys (the Greek manufacturing PMI is currently the strongest in the world). With the ECB back in the market buying sovereign and corporate debt, borrowing rates should remain low. Euro area money growth, which leads GDP growth, has already picked up (Chart 14). Bank lending to the private sector should continue to accelerate. A modest serving of fiscal stimulus will also help. The European Commission estimates that the fiscal thrust in the euro area will increase by 0.5% of GDP in 2019 (Chart 15). Assuming, conservatively, a fiscal multiplier of one, this would boost euro area growth by half a percentage point. Owing to lags between changes in fiscal policy and their impact on the real economy, most of the gains to GDP growth will occur over the remainder of this year and in 2020. Chart 15Euro Area Fiscal Stimulus Will Also Boost Growth
Euro Area Fiscal Stimulus Will Also Boost Growth
Euro Area Fiscal Stimulus Will Also Boost Growth
Chart 17Brexit Angst: A Case Of Bremorse
Brexit Angst: A Case Of Bremorse
Brexit Angst: A Case Of Bremorse
Chart 16U.K.: Brexit Uncertainty Is Weighing On Growth
U.K.: Brexit Uncertainty Is Weighing On Growth
U.K.: Brexit Uncertainty Is Weighing On Growth
In the U.K., Brexit uncertainty continues to weigh on growth. U.K. business investment has been especially hard hit (Chart 16). Prime Minister Boris Johnson remains insistent that he will take the U.K. out of the EU with or without a deal at the end of October. We would downplay his bluster. The Supreme Court has already denied his attempt to shutter parliament. The public is having second thoughts about the desirability of Brexit (Chart 17). While we do not have a strong view on the exact plot twists in the Brexit saga, we maintain that the odds of a no-deal Brexit are low. This is good news for U.K. growth and the pound. Japan: Own Goal Recent Japanese data releases have not been encouraging: Machine tool orders declined by 37% year-over-year in August. Exports contracted by over 8%, with imports recording a drop of 12%. The September PMI print exposed further deterioration in manufacturing, with the index falling to 48.9 from 49.3 in August. In addition, industrial production contracted by more than expected in August, falling by 1% month-over-month, and close to 5% year-over-year. The ongoing uncertainty surrounding the U.S.-China trade negotiations, as well as Japan’s own tensions with neighboring South Korea, have also weighed on the Japanese economy. Japanese industrial activity will improve later this year as global growth rebounds. But the government has not helped growth prospects by raising the consumption tax on October 1st. While various offsets will blunt the full effect of the tax hike, it still amounts to unwarranted tightening in fiscal policy. Nominal GDP has barely increased since the early 1990s. What Japan needs are policies that boost nominal income. Such reflationary policies may be the only way to stabilize debt-to-GDP without pushing the economy back into a deflationary spiral.1 The U.S.: Hanging Tough Chart 18U.S. Has A Smaller Share Of Manufacturing Than Most Other Developed Economies
Fourth Quarter 2019 Strategy Outlook: A "Show Me" Market
Fourth Quarter 2019 Strategy Outlook: A "Show Me" Market
The U.S. economy has fared relatively well during the latest global economic downturn, partly because manufacturing represents a smaller share of GDP than in most other economies (Chart 18). According to the Atlanta Fed GDPNow model, real GDP is on track to rise at a trend-like pace of 1.8% in the third quarter (Chart 19). Personal consumption is set to increase by 2.5%, after having grown by 4.6% in the second quarter. Consumer spending should stay robust, supported by rising wage growth. The personal savings rate also remains elevated, which should help cushion households from any adverse shocks (Chart 20). Chart 19U.S. Growth Has Softened, But Is Still Close To Trend
Fourth Quarter 2019 Strategy Outlook: A "Show Me" Market
Fourth Quarter 2019 Strategy Outlook: A "Show Me" Market
Residential investment finally looks as though it is turning the corner. Housing starts, building permits, and home sales have all picked up. Given the tight relationship between mortgage rates and homebuilding, construction activity should accelerate over the next few quarters (Chart 21). Low inventory and vacancy rates, rising household formation, and reasonable affordability all bode well for the housing market (Chart 22). Chart 20The Savings Rate Has (A Lot Of) Room To Drop, Judging From The Historical Relationship With Wealth
The Savings Rate Has (A Lot Of) Room To Drop, Judging From The Historical Relationship With Wealth
The Savings Rate Has (A Lot Of) Room To Drop, Judging From The Historical Relationship With Wealth
Chart 21U.S. Housing Will Rebound
U.S. Housing Will Rebound
U.S. Housing Will Rebound
Chart 22U.S. Housing: On A Solid Foundation
U.S. Housing: On A Solid Foundation
U.S. Housing: On A Solid Foundation
Chart 23U.S. Capex Plans Have Come Off Their Highs, But Are Nowhere Close to Recessionary Levels
U.S. Capex Plans Have Come Off Their Highs, But Are Nowhere Close to Recessionary Levels
U.S. Capex Plans Have Come Off Their Highs, But Are Nowhere Close to Recessionary Levels
In contrast to residential investment, business capex continues to be weighed down by the manufacturing recession, a strong dollar, and trade policy uncertainty. Core durable goods orders declined in August. Capex intention surveys have also weakened, although they remain well above recessionary levels (Chart 23). The ISM manufacturing index hit its lowest level since July 2009 in September. The internals of the report were not quite as bad as the headline. The new orders-to-inventories component, which leads the ISM by two months, moved back into positive territory. The weak ISM print also stands in contrast to the more upbeat Markit U.S. manufacturing PMI, which rose to its highest level since April. Statistically, the Markit PMI does a better job of tracking official measures of U.S. manufacturing output, factory orders, and employment than the ISM. Taking everything together, the U.S. economy is likely to see modestly stronger growth later this year, as the global manufacturing recession comes to an end, while strong consumer spending and an improving housing market bolster domestic demand. II. Financial Markets Global Asset Allocation Markets have entered a “show me” phase. Better economic data and meaningful progress on the trade negotiations will be necessary for stocks to move sustainably higher. As such, investors should maintain larger-than-normal cash positions for the time being to guard against downside risks. Chart 24Stocks Will Outperform Bonds If Growth Recovers
Stocks Will Outperform Bonds If Growth Recovers
Stocks Will Outperform Bonds If Growth Recovers
Fortunately, any pullback in risk asset prices is likely to be temporary. If trade tensions subside and global growth rebounds later this year, as we expect, stocks and spread product should handily outperform government bonds over a 12-month horizon (Chart 24). Admittedly, there are plenty of things that could upend this sanguine 12-month recommendation: Global growth could continue to deteriorate; the trade war could intensify; supply-side shocks could cause oil prices to spike up again; the U.K. could end up leaving the EU in a “hard Brexit” scenario; and last but not least, Elizabeth Warren or some other far-left candidate could end up becoming the next U.S. president. The key question for investors today is whether these risks have been fully discounted in financial markets. We think they have. Chart 25 shows our estimates for the global equity risk premium (ERP), calculated as the difference between the earnings yield and the real bond yield. Our calculations suggest that stocks still look quite cheap compared to bonds. Chart 25AEquity Risk Premia Remain Quite High (I)
Equity Risk Premia Remain Quite High (I)
Equity Risk Premia Remain Quite High (I)
Chart 25BEquity Risk Premia Remain Quite High (II)
Equity Risk Premia Remain Quite High (II)
Equity Risk Premia Remain Quite High (II)
One might protest that the ERP is high only because today’s ultra-low bond yields are reflecting very poor growth prospects. There is some truth to that claim, but not as much as one might think. While trend GDP growth has fallen in the U.S. over the past decade, bond yields have declined by even more. The gap between U.S. potential nominal GDP growth, as estimated by the Congressional Budget Office, and the 10-year Treasury yield is close to two percentage points, the highest since 1979 (Chart 26). Chart 26Bond Yields Have Fallen More Than Trend Nominal GDP Growth
Bond Yields Have Fallen More Than Trend Nominal GDP Growth
Bond Yields Have Fallen More Than Trend Nominal GDP Growth
At the global level, trend GDP growth has barely changed since 1980, largely because faster-growing emerging markets now make up a larger share of the global economy (Chart 27). For large multinational companies, global growth, rather than domestic growth, is the more relevant measure of economic momentum. Gauging Future Equity Returns A high ERP simply says that equities are attractive relative to bonds. To gauge the prospective return to stocks in absolute terms, one should look at the absolute level of valuations. Chart 27The Trend In Global Growth Has Remained Steady Thanks To Faster-Growing EM
chart 27
The Trend In Global Growth Has Remained Steady Thanks To Faster-Growing EM
The Trend In Global Growth Has Remained Steady Thanks To Faster-Growing EM
Chart 28S&P 500: All Of The Increase In Margins Has Occurred In The IT Sector
S&P 500: All Of The Increase In Margins Has Occurred In The IT Sector
S&P 500: All Of The Increase In Margins Has Occurred In The IT Sector
As we argued in a recent report entitled “TINA To The Rescue?,”2 the earnings yield can be used as a proxy for the expected real total return on equities. Empirically, the evidence seems to bear this out: Since 1950, the earnings yield on U.S. equities has averaged 6.7%, compared to a real total return of 7.2%. Today, the trailing and forward PE ratio for U.S. stocks stand at 21.1 and 17.4, respectively. Using a simple average of the two as a guide for future returns, U.S. stocks should deliver a long-term real total return of 5.2%. While this is below its historic average, it is still a fairly decent return. One might complain that this calculation overstates prospective equity returns because the U.S. earnings yield is temporarily inflated by abnormally high profit margins. The problem with this argument is that virtually all of the increase in S&P 500 margins has occurred in just one sector: technology. Outside of the tech sector, S&P 500 margins are not far from their historic average (Chart 28). If high IT margins reflect structural changes in the global economy – such as the emergence of “winner take all” companies that benefit from powerful network effects and monopolistic pricing power – they could remain elevated for the foreseeable future. Regional And Sector Equity Allocation The earnings yield is roughly two percentage points higher outside the U.S., suggesting that non-U.S. stocks will best their U.S. peers over the long haul. In the developed market space, Germany, Spain, and the U.K. appear especially cheap. In the EM realm, China, Korea, and Russia stand out as being very attractively priced (Chart 29). At the sector level, cyclical stocks look more appealing than defensives (Chart 30). Chart 29U.S. Stocks Appear Expensive Compared To Their Peers
Fourth Quarter 2019 Strategy Outlook: A "Show Me" Market
Fourth Quarter 2019 Strategy Outlook: A "Show Me" Market
Chart 31Economic Growth Drives Stocks Over A 12-Month Horizon
Economic Growth Drives Stocks Over A 12-Month Horizon
Economic Growth Drives Stocks Over A 12-Month Horizon
Chart 30Cyclical Stocks Are More Attractive Than Defensives
Cyclical Stocks Are More Attractive Than Defensives
Cyclical Stocks Are More Attractive Than Defensives
Chart 32EM And Euro Area Equities Usually Outperform When Global Growth Improves
EM And Euro Area Equities Usually Outperform When Global Growth Improves
EM And Euro Area Equities Usually Outperform When Global Growth Improves
Valuations are useful mainly as a guide to long-term returns. Over a horizon of say, 12 months, cyclical factors – i.e., what happens to growth, interest rates, and exchange rates – matter more (Chart 31). Fortunately, our cyclical views generally line up with our valuation assessment. Stronger global growth, a weaker dollar, and rising commodity prices should benefit cyclical stocks relative to defensives. To the extent that EM and European stock markets have more of a cyclical sector skew than U.S. stocks, the former should end up outperforming (Chart 32). We would put financials on our list of sectors to upgrade by year end once global growth begins to reaccelerate. Falling bond yields have hurt bank profits (Chart 33). The drag on net interest margins should recede as yields start rising. European banks, which currently trade at only 7.6 times forward earnings, 0.6 times book value, and sport a hefty dividend yield of 6.3%, could fare particularly well (Chart 34). Chart 33AHigher Bond Yields And Steeper Yield Curves Will Benefit Financials (I)
Higher Bond Yields And Steeper Yield Curves Will Benefit Financials (I)
Higher Bond Yields And Steeper Yield Curves Will Benefit Financials (I)
Chart 33BHigher Bond Yields And Steeper Yield Curves Will Benefit Financials (II)
Higher Bond Yields And Steeper Yield Curves Will Benefit Financials (II)
Higher Bond Yields And Steeper Yield Curves Will Benefit Financials (II)
As Chart 35 illustrates, a bet on financials is similar to a bet on value stocks. Growth has trounced value over the past 12 years, but a bit of respite for value is in order over the next 12-to-18 months. Chart 34European Banks Are Attractive
European Banks Are Attractive
European Banks Are Attractive
Chart 35Is Value Turning The Corner?
Is Value Turning The Corner?
Is Value Turning The Corner?
Fixed Income Chart 36AYields Should Rise On Stronger Growth (I)
Yields Should Rise On Stronger Growth (I)
Yields Should Rise On Stronger Growth (I)
Dovish central banks and, for the time being, still-subdued inflation will help keep government bond yields in check over the next 12 months. Nevertheless, yields will still rise from currently depressed levels on the back of stronger global growth (Chart 36). Chart 36BYields Should Rise On Stronger Growth (II)
Yields Should Rise On Stronger Growth (II)
Yields Should Rise On Stronger Growth (II)
Bond yields tend to rise or fall depending on whether central banks adjust rates by more or less than is anticipated (Chart 37). Investors currently expect the Fed to cut rates by another 80 basis points over the next 12 months. While we think the Fed will bring down rates by 25 basis points on October 30th, we do not anticipate any further cuts beyond then. The cumulative 75 basis points in cuts during this easing cycle will be equivalent to the amount of easing delivered during the two mid-cycle slowdowns in the 1990s (1995/96 and 1998). All told, the U.S. 10-year Treasury yield is likely to move back into the low 2% range by the middle of 2020. Chart 37AStronger Economic Growth Will Put Upward Pressure On Government Bond Yields (I)
Stronger Economic Growth Will Put Upward Pressure On Government Bond Yields (I)
Stronger Economic Growth Will Put Upward Pressure On Government Bond Yields (I)
Chart 36BStronger Economic Growth Will Put Upward Pressure On Government Bond Yields (II)
Stronger Economic Growth Will Put Upward Pressure On Government Bond Yields (II)
Stronger Economic Growth Will Put Upward Pressure On Government Bond Yields (II)
Chart 38U.S. Government Bond Yields Are More Procyclical Than Yields Abroad
U.S. Government Bond Yields Are More Procyclical Than Yields Abroad
U.S. Government Bond Yields Are More Procyclical Than Yields Abroad
Unlike U.S. equities, which tend to have a low beta compared to stocks abroad, U.S. bonds possess a high beta. This means that U.S. Treasury yields usually rise more than yields abroad when global bond yields, in aggregate, are increasing, and fall more than yields abroad when global bond yields are decreasing (Chart 38). Moreover, U.S. Treasurys currently yield less than other bond markets once currency-hedging costs are taken into account (Table 1). If U.S. yields were to rise more than those abroad over the next 12-to-18 months, this would further detract from Treasury returns. As a result, investors should underweight Treasurys within a global government bond portfolio. Stronger global growth should keep corporate credit spreads at bay. Lending standards for U.S. commercial and industrial loans have moved back into easing territory, which is usually bullish for corporate credit (Chart 39). According to our U.S. bond strategists, high-yield corporate spreads, and to a lesser extent, Baa-rated investment-grade spreads, are still wider than is justified by the economic fundamentals (Chart 40).3 Better-rated investment-grade bonds, in contrast, offer less relative value. Table 1Bond Markets Across The Developed World
Fourth Quarter 2019 Strategy Outlook: A "Show Me" Market
Fourth Quarter 2019 Strategy Outlook: A "Show Me" Market
Chart 39Easier Lending Standards Bode Well For Corporate Credit
Easier Lending Standards Bode Well For Corporate Credit
Easier Lending Standards Bode Well For Corporate Credit
Chart 40U.S. Corporates: Focus On Baa And High-Yield Credit
U.S. Corporates: Focus On Baa And High-Yield Credit
U.S. Corporates: Focus On Baa And High-Yield Credit
Looking beyond the next 18 months, there is a high probability that inflation will start to move materially higher. The unemployment rate across the G7 has fallen to a multi-decade low (Chart 41). The share of developed economies that have reached full employment has hit a new cycle high (Chart 42). For all the talk about how the Phillips curve is dead, wage growth has remained tightly correlated with labor market slack (Chart 43). Chart 41Unemployment Rates Keep Trending Lower
Unemployment Rates Keep Trending Lower
Unemployment Rates Keep Trending Lower
Chart 42Developed Markets: Full Employment Reaching New Cycle Highs
Developed Markets: Full Employment Reaching New Cycle Highs
Developed Markets: Full Employment Reaching New Cycle Highs
Chart 43The Phillips Curve Is Alive And Well
The Phillips Curve Is Alive And Well
The Phillips Curve Is Alive And Well
As wages continue to rise, prices will start to move up, potentially setting off a wage-price spiral. The Fed, and eventually other central banks, will have to start raising rates at that point. Once interest rates move into restrictive territory, equities will fall and credit spreads will widen. A global recession could ensue in 2022. Currencies And Commodities Chart 44The Dollar Is A Countercyclical Currency
The Dollar Is A Countercyclical Currency
The Dollar Is A Countercyclical Currency
The U.S. dollar is a countercyclical currency, meaning that it tends to move in the opposite direction of the global business cycle (Chart 44). We do not have a strong near-term view on the direction of the dollar at the moment, but expect the greenback to begin to weaken by year end as global growth starts to rebound. EUR/USD should increase to around 1.13 by mid-2020. GBP/USD will rise to 1.29. USD/CNY will move back to 7. USD/JPY is likely to be flat, reflecting the yen’s defensive nature and the drag on Japanese growth from the consumption tax hike. The trade-weighted dollar will continue to depreciate until late-2021, after which time a more aggressive Fed and a slowdown in global growth will cause the dollar to rally anew. During the period in which the dollar is weakening, commodity prices will move higher (Chart 45). Chart 45Dollar Weakness Is A Boon For Commodities
Dollar Weakness Is A Boon For Commodities
Dollar Weakness Is A Boon For Commodities
BCA’s commodity strategists are particularly bullish on oil over a 12-month horizon (Chart 46). They see Brent crude prices rising to $70/bbl by the end of this year and averaging $74/bbl in 2020 based on the expectation that stronger global growth and production discipline will drive down oil inventory levels. OPEC spare capacity – the difference between what the cartel is capable of producing and what it is actually producing – is currently below its historic average (Chart 47). Crude oil reserves have also been trending lower within the OECD. Saudi Arabia’s own reserves have fallen by over 40% since peaking in 2015 (Chart 48). Chart 46Supply Deficit To Continue
Supply Deficit To Continue
Supply Deficit To Continue
Chart 47Limited Availability Of Spare Capacity To Offset Outages
Fourth Quarter 2019 Strategy Outlook: A "Show Me" Market
Fourth Quarter 2019 Strategy Outlook: A "Show Me" Market
Chart 48Key Strategic Petroleum Reserves
Key Strategic Petroleum Reserves
Key Strategic Petroleum Reserves
Higher oil prices should benefit currencies such as the Canadian dollar, Norwegian krone, Russian ruble and Colombian peso. Finally, a few words on gold. We closed our long gold trade on August 29th for a 20-week gain of 20.5%. We still see gold as an excellent long-term hedge against higher inflation. In the near term, however, rising bond yields may take the wind out of gold’s sails, even if a weaker dollar does help bullion at the margin. We will reinitiate our long gold position towards the end of next year or in 2021 once inflation begins to break out. Peter Berezin, Chief Global Strategist Global Investment Strategy peterb@bcaresearch.com Footnotes 1Please see Global Investment Strategy Weekly Report, “Are High Debt Levels Deflationary Or Inflationary?” dated February 15, 2019. 2Please see Global Investment Strategy Special Report, “TINA To The Rescue?” dated August 23, 2019. 3Please see U.S. Bond Strategy Weekly Report, “Corporate Bond Investors Should Not Fight The Fed,” dated September 17, 2019. Strategy & Market Trends MacroQuant Model And Current Subjective Scores
Fourth Quarter 2019 Strategy Outlook: A "Show Me" Market
Fourth Quarter 2019 Strategy Outlook: A "Show Me" Market
Tactical Trades Strategic Recommendations Closed Trades
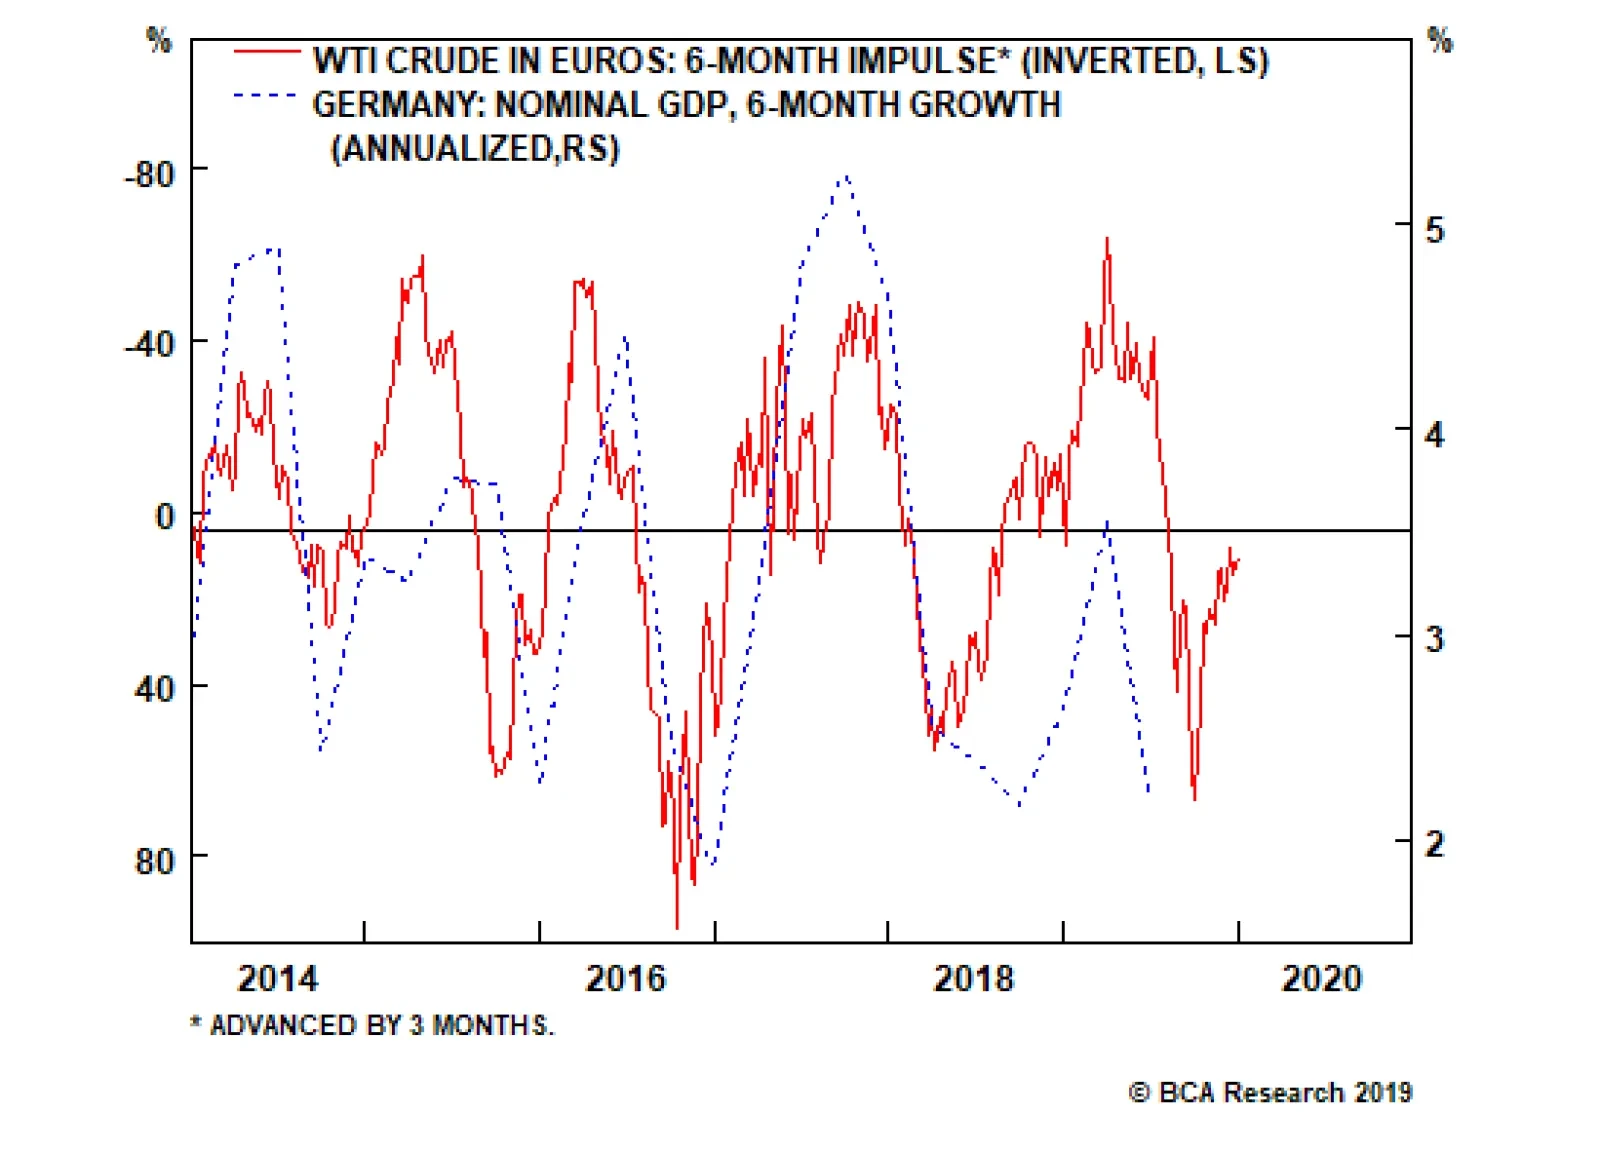
The oil price impulse has a major bearing on Germany’s short term growth accelerations and decelerations. The six months ending in June 2019 constituted a severe headwind impulse. A 30% increase in oil prices in that period followed a 40% decline in the…
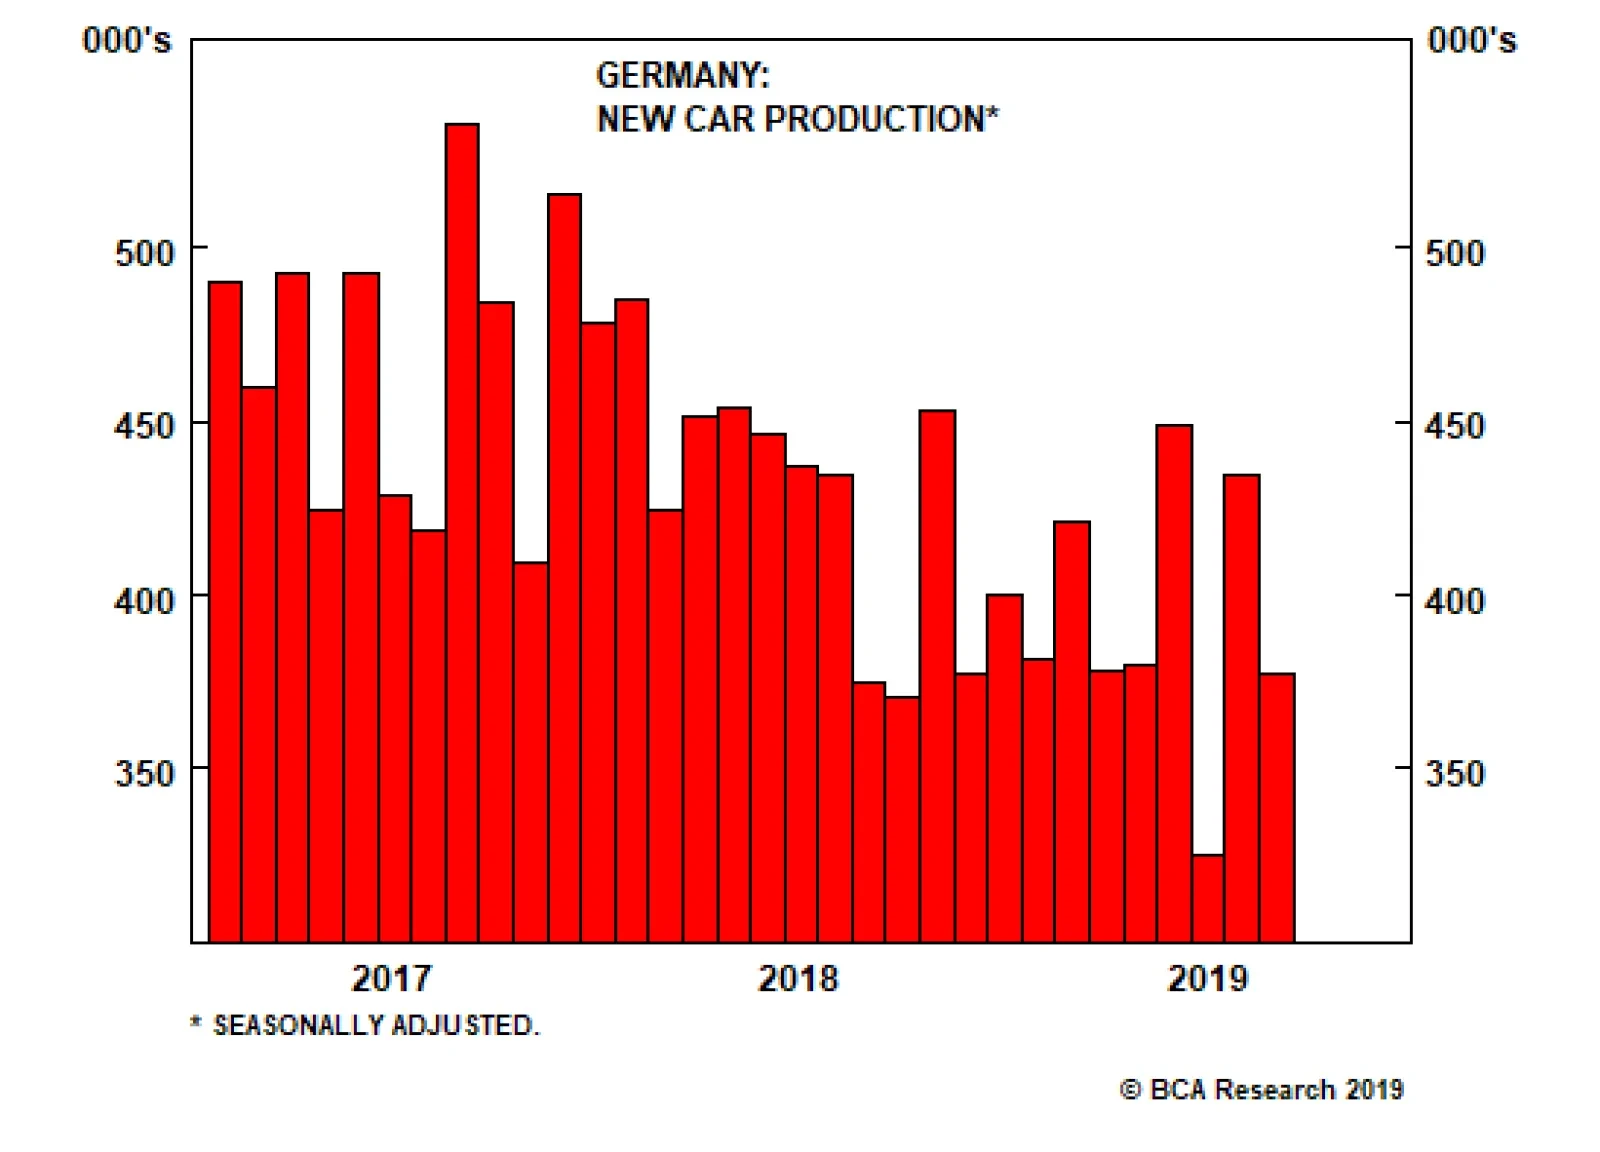
If the German economy contracts in the third quarter and thereby enters a technical recession, the knee-jerk response will be to blame the troubles in the auto industry. But the evidence does not support this story. German new car production rebounded in the…