Inflation/Deflation

Highlights Indian stocks need more time to digest and consolidate the significant gains from earlier this year. However, the country’s medium and long-term growth outlook remains positive. Indian firms’ profit margins will likely settle at a higher level than usual. That will also put a floor on its equity multiples. With an imminent topline recovery, the main driver of Indian stocks next year will be profits, in contrast with multiple expansions during the last year and a half. India is beginning a cyclical expansion with a cheap rupee. Stay neutral Indian stocks in an EM equity basket for now. Investors should overweight India in an EM domestic bond portfolio. Feature Chart 1Indian Stocks Are Overbought
Indian Stocks Are Overbought
Indian Stocks Are Overbought
We tactically downgraded Indian stocks from overweight to neutral in EM and emerging Asian equity portfolios in early October this year. This call has worked out well so far as India’s absolute and relative share prices seem to have peaked. The primary reason for our tactical “neutral” call on Indian equities was this market’s vertical rise earlier this year, both in absolute and relative terms. Similar spikes – in terms of magnitude and duration back in 2007 and in 2014 – were followed by a period of underperformance (Chart 1). Yet, we recommended downgrading to only a neutral allocation. The reason is that the country’s cyclical outlook remains constructive, and the profit expansion cycle has further to run. That forbade us from turning too bearish on this bourse. A neutral stance on India also makes sense for the next several months as this bourse digests and consolidates its previous gains. In this report, we detail the various nuances of our analysis. Meanwhile, the Indian currency is cheap versus the greenback and will likely be one of the best performing currencies in the EM world over the next year. A positive currency outlook also makes Indian government bonds attractive for foreign investors, as Indian bonds also offer a high yield amid a benign domestic inflation backdrop. Dedicated EM domestic bond portfolios should stay overweight India. Equity Multiple Compression Ahead? Chart 2India's Profit Margin Expansion Has Led To Its Equity Re-Rating
India's Profit Margin Expansion Has Led To Its Equity Re-Rating
India's Profit Margin Expansion Has Led To Its Equity Re-Rating
An upshot to the steep equity rally earlier this year has been India’s stretched valuations. That made many investors question the sustainability of the outperformance. A pertinent question, therefore, is how overvalued have Indian stocks become? And how much multiple compression can investors expect in this bourse? Before we answer this question, it’s useful to understand what drove the cyclical re-rating of Indian markets in the first place. The solid black line in Chart 2 shows the gross profit margins of all Indian listed non-financial firms. They have risen substantially since spring 2020 to reach decade-high levels. Margin expansions of this magnitude are indicative of material efficiency gains; and are usually rewarded with an equity re-rating. This is indeed what happened since spring 2020: stock multiples rose following the expanding margins. The same can be said if we only consider the major non-financial corporations’ EBITDA margins (Chart 2, bottom panel). If one looks at the cyclically adjusted P/E ratio (CAPE) instead, we see a very similar thing: the CAPE ratio has also risen in line with rising profit margins (Chart 3). Chart 3Profit Margins Have A Bearing On Equity Valuations
Profit Margins Have A Bearing On Equity Valuations
Profit Margins Have A Bearing On Equity Valuations
Charts 2 and 3 show that the positive correlations between profit margins and stock multiples held steady over past several cycles. Hence, it will be reasonable to expect that should Indian firms hold on to wide margins, they will not suffer a significant de-rating going forward. Can Margins Stay Wide? Chart 4Indian Firms' Borrowing Costs Will Likely Stay Low
Indian Firms' Borrowing Costs Will Likely Stay Low
Indian Firms' Borrowing Costs Will Likely Stay Low
Before we delve into the question of whether margins can stay wide, we need to understand what caused such a margin expansion in the first place. That cause is cost cutting: wage bills have gone down as businesses slashed employees. Data from Oxford economics show that there had been 9% fewer workers in India as of September 2021 compared to March 2020, just before the pandemic. Interest expense has also gone down – both relative to sales and profits (Chart 4) – as interest rates were cut aggressively. In our view, the latest rollover in profit margins will likely be temporary and limited. It is probably due to hiring back of some employees. Beyond a near-term limited drop in margins, the more relevant question to ask is, can Indian corporations maintain high margins? Our bias is that, to a large extent, they can. The main reason is that firms’ costs are slated to stay under control: Chart 5Indian Companies Do Not Face Any Wage Pressures
Indian Companies Do Not Face Any Wage Pressures Firms' Costs Will Likely Stay Low As Wage Pressures Are Muted...
Indian Companies Do Not Face Any Wage Pressures Firms' Costs Will Likely Stay Low As Wage Pressures Are Muted...
Wage expectations are low. Going forward, as millions of new job seekers and workers temporarily discouraged by the pandemic enter the job market, wages have little chance of much of an increase. The top panel of Chart 5 shows salary expectations from an industrial survey by RBI. Both the assessment for the current quarter and expectations for the next quarter have been a net negative for a while. Rural wages are also similarly timid (Chart 5, bottom panel). Notably, companies’ hiring back of employees is slow. It seems they prefer to substitute labor by capital by investing in new machines and equipment. This will boost productivity and cap wages. Overall, high productivity growth will keep companies’ profit margins wide and excess labor will suppress wages. Higher margins and low inflation are bullish for the stock market. Critically, headline inflation is within the central bank target bands, and our model shows that it will likely remain as such (Chart 6, top panel). Core inflation is also likely to stay flattish (Chart 6, bottom panel). This means the odds are that the central bank will not raise rates anytime soon. Flattish inflation and policy rates mean firms’ borrowing costs, in both nominal and real terms, are slated to stay approximately as low as they are now. Low real borrowing costs are usually a tailwind for stocks (Chart 7).
Chart 6
Chart 7Low Borrowing Costs Are Bullish For Stocks
Low Borrowing Costs Are Bullish For Stocks
Low Borrowing Costs Are Bullish For Stocks
All put together, Indian companies will likely see their costs largely under control. That, in turn, should keep profit margins wider than usual. Wide profit margins should limit multiple compression. Can The Topline Rise Further? Wider margins will boost total profits if and once the topline (revenues) recovers. So, the next question is, how much topline recovery is in the cards? Chart 8Indian Economy Is In A Rapid Expansion Mode
Indian Economy Is In A Rapid Expansion Mode
Indian Economy Is In A Rapid Expansion Mode
There are already signs that sales will likely accelerate in the months to come: PMI indexes for both the manufacturing and services sectors have recovered strongly since the Delta variant-induced lockdowns in spring. They are now hovering around a very high level of close to 60. This indicates that the economy is in a rapid expansion mode (Chart 8). The Industrial Outlook survey (conducted by the RBI) shows that the order books for the September quarter was already at a decade-high level. The expectation for the next few quarters is even more elevated – indicating strong momentum (Chart 9, top panel). In other surveys, such as the PMI and Business Expectation survey (from Dun & Bradstreet), we see similar strong order books (Chart 9, bottom panel). While orders are strong, inventory of finished goods is low. Not surprisingly, businesses are expecting very high-capacity utilization in the next few quarters (Chart 10, top two panels). Chart 9Firms' Order Books Are Quite Robust
Firms' Order Books Are Quite Robust
Firms' Order Books Are Quite Robust
Chart 10Low Inventories Mean Stronger Economic Activity Ahead
Low Inventories Mean Stronger Economic Activity Ahead
Low Inventories Mean Stronger Economic Activity Ahead
They are expecting to hire more people. Companies also believe consumer demand will revive which will enable wider profit margins. In sum, firms are optimistic about accelerating economic activity (Chart 10, bottom two panels). Chart 11A Positive Bank Credit Impulse Is Bullish For Industrial Activity
A Positive Bank Credit Impulse Is Bullish For Industrial Activity
A Positive Bank Credit Impulse Is Bullish For Industrial Activity
This, in turn, is encouraging them to make capital investments. Finally, the commercial banks’ credit impulse has also turned positive. Rising bank credit impulses usually signal stronger industrial production (Chart 11). To summarize, chances are that firms’ top lines are set to rise materially. Coupled with high margins, this will translate into strong profit acceleration in the next several quarters. Put differently, over the past year and a half, Indian firms witnessed rising margins. Going forward, they will likely see rising profits. Higher profits, in turn, will propel Indian share prices cyclically beyond any short-term consolidation. A Sustainable Expansion? In a notable departure from most developed countries, India’s recovery from the pandemic-induced recession has been more capex-led, rather than consumption-led (Chart 12). One reason for that is the Indian government did not supplement the lost household incomes during the lockdowns nearly as much as developed countries did. That, in turn, kept household demand low. And it also contributed to keeping inflation in check – even though India’s supply side was also paralyzed due to strict lockdown measures. On the other hand, firms’ profits soared owing to rigorous cost-cutting. Higher profits in turn have encouraged firms to expand their production capacity. Companies are ramping up capital spending as they expect sales to accelerate in the future (Chart 13). Chart 12A Capex-Led Recovery Will Prolong The Economic Expansion
A Capex-Led Recovery Will Prolong The Economic Expansion
A Capex-Led Recovery Will Prolong The Economic Expansion
Chart 13Strong Profits Are Encouraging Firms To Ramp Up Capital Spending
Strong Profits Are Encouraging Firms To Ramp Up Capital Spending
Strong Profits Are Encouraging Firms To Ramp Up Capital Spending
Notably, the combination of curtailed household demand and robust capital expenditure has set India’s inflation dynamics apart from many other countries in Latin America and EMEA. While India’s inflation remains largely contained, countries in those regions are witnessing accelerating inflation. Also, over a cyclical horizon, a capex-led expansion is very crucial for India as this will determine the duration and magnitude of the cycle. Strong investment expenditures do not only boost firms’ competitiveness and profitability, but they also help keep inflationary pressures at bay. Lower inflation for a longer period means the central bank need not raise rates as soon and/or as much as otherwise would be the case. That in turn allows the economic and profit expansion to continue for longer. An extended period of expansion is also positive for multiples as investors extrapolate profit growth over many years ahead. India’s current dynamics are a case in point. Given the country is facing no imminent interest rate hikes, stock multiples can stay higher for longer. This is because multiple de-rating commences only after meaningful rate hikes have already been accorded (Chart 14). Since that is quite far off, valuations are not facing any immediate and considerable headwinds. Finally, India is beginning the new cycle with a rather inexpensive currency. Chart 15 shows that the rupee is currently cheaper by about 10% than what would be its “fair value” vis-à-vis the US dollar. The fair value has been derived from a regression analysis of the exchange rate on the relative manufacturing producer prices of India and the US. Chart 14It Takes Several Rate Hikes Before It Hurts Stock Multiples
It Takes Several Rate Hikes Before It Hurts Stock Multiples
It Takes Several Rate Hikes Before It Hurts Stock Multiples
Chart 15India's Cyclical Expansion Has A Tailwind From Cheap Currency
India's Cyclical Expansion Has A Tailwind From Cheap Currency
India's Cyclical Expansion Has A Tailwind From Cheap Currency
Investment Conclusions Equities: Given the vertical rise earlier this year, Indian stocks would likely need a few more months to digest previous gains and consolidate. Hence, even though the country’s cyclical outlook remains constructive, we recommend that dedicated EM and Asian equity portfolios stay neutral on this market for now. Absolute return investors should stay on the sidelines and wait for a better entry point. Currency and Bonds: The rupee is cheap and could be one of the best performers within the EM world over a cyclical horizon. Indian government bonds also offer a good value with a rather high yield (6.4% for 10-year securities) amid a benign inflation outlook. A positive rupee outlook also makes Indian bonds more appealing for foreign investors. Investors should stay overweight India in an EM local currency bond portfolio. Rajeeb Pramanik Senior EM Strategist rajeeb.pramanik@bcaresearch.com Footnotes
Highlights Omicron vs. The Fed: The new COVID variant has thrown a growth scare into markets, but the bigger concern is the Fed belated playing catch up to high inflation and low unemployment. Fade the Omicron bond rally, and position for higher US Treasury yields over the next year with the Fed threatening to taper faster, and potentially hike sooner, than markets expect. New Zealand: Underlying growth and inflation fundamentals, soaring house prices, and the central bank’s historical reaction function indicate that the Reserve Bank of New Zealand will lift the cash rate to 2% by the end of 2022. However, markets are already priced for this, leaving little room for New Zealand debt to continue underperforming on a relative basis. We are upgrading New Zealand sovereigns to neutral and initiating a long NZ/short US 10-year spread trade. A Year-End Bout Of Uncertainty Chart of the WeekMarkets Have Been Worried About The Fed Since September
Markets Have Been Worried About The Fed Since September
Markets Have Been Worried About The Fed Since September
Over the past two weeks, we have published Special Reports and thus have not had an opportunity to comment on market moves and news. Needless to say, it has been an eventful period! The emergence of the new Omicron variant, and the hawkish shift in the Fed’s guidance on future policy moves, have injected fresh uncertainty and volatility into global financial markets. Since the existence of Omicron was revealed to the world on Nov 26, 30-year US Treasury yields have fallen by as much as -23bps and the S&P 500 index has been down by as much as -4.4%. Yet the evolving Fed stance, with Fed Chair Jerome Powell hinting last week that the end of tapering and start of rate hikes could begin sooner than expected next year, is having a more lasting influence on risk asset performance. Dating back to the September 23 FOMC meeting, when the Fed first signaled an imminent tapering of bond purchases and pulled forward the timing of liftoff into 2022, the 2-year US Treasury yield has gone up from 0.22% to 0.63%. Importantly, there has been little pullback on the pricing at the front-end of the US Treasury curve due to the Omicron shock. That pre-September-FOMC low in the 2-year Treasury yield also marked the peak in riskier fixed income market performance for 2021, with the Bloomberg Global High-Yield and Emerging Market USD-Denominated Sovereign total return indices down -2.0% and -1.8%, respectively, since Sept 23 (Chart of the Week). Other risk assets also appear to be responding more to news about the Fed than Omicron. Equity markets stopped climbing since the Fed announced the first taper of bond purchases at the November 3 FOMC meeting – three weeks before the world knew of Omicron - which also coincided with troughs in the VIX index and corporate credit spreads, not only in the US but in Europe and emerging markets as well (Chart 2). Of course, it is difficult to disentangle which is having a greater impact, the variant or the Fed, when details on both are evolving at the same time. Omicron Investors are understandably right to be nervous about a new COVID variant that can reportedly evade existing vaccines and even infect those who have had COVID previously. The whole idea of “putting COVID in the rearview mirror’ that has helped fuel booming equity and credit markets was predicated on vaccines being both effective and widely available. However, when investors see COVID case numbers start to pick up in the US and Europe, with vaccination rates twice that of South Africa where Omicron was first detected (Chart 3), this raises concern about a return to pre-vaccine economic restrictions and uncertainty. Chart 2A Typical Risk-Off Response To The Emergence Of Omicron
A Typical Risk-Off Response To The Emergence Of Omicron
A Typical Risk-Off Response To The Emergence Of Omicron
Chart 3Omicron Putting A Dent In Vaccine Optimism
Omicron Putting A Dent In Vaccine Optimism
Omicron Putting A Dent In Vaccine Optimism
The “Omicron effect” on fixed income markets has been most evident in the repricing of interest rate expectations. Since the presence of Omicron was revealed on November 26, there has been a reduction in the cumulative amount of tightening discounted to the end of 2024 in the overnight index swap (OIS) curves of the major developed economies (Table 1). The moves were most evident in the US (32bps of hikes priced out), Canada (37bps) and Australia (37bps). Table 1Pricing Out Some Rate Hikes Because Of Omicron
Blame The Fed, Not Omicron, For More Volatile Markets
Blame The Fed, Not Omicron, For More Volatile Markets
Much is still unknown about the dangers of the Omicron variant. The admittedly very early data out of South Africa, however, indicates that there has not been a major surge in hospitalizations related to Omicron cases. A new COVID strain that proves to be more virulent, but that does not strain health care systems, should help allay investor concerns over a major economic hit from Omicron. This presents an opportunity to put on positions that will profit from a rebound in global bond yields led by higher US Treasury yields. The Fed The Omicron threat to date has not been enough to move the Fed off its plans to rein in the monetary accommodation put in place in 2020 to fight the pandemic. If Omicron is to have any impact on the US economy, it will do so at a time when the economy continues to grow well above trend. The November reading on the ISM Manufacturing survey showed strength in the overall index, with a stabilization of the New Orders/Inventory ratio that leads overall growth, and only a very modest reduction in the still-elevated Prices Paid and Supplier Deliveries indices (Chart 4). The Atlanta Fed’s GDPNow model is suggesting that US real GDP growth could come in at a whopping 9.7% in Q4. As further evidence that the US economy is growing at a pace well above trend, just look to labor market data. New US jobless claims are at the lowest level since 1969. The November US Payrolls report showed that the headline unemployment rate fell 0.4 percentage points on the month to 4.2% - within the range of full employment estimates of the FOMC - even with actual job growth falling short of consensus forecasts (Chart 5, top panel). Chart 4Nothing Bond-Bullish In US Manufacturing
Nothing Bond-Bullish In US Manufacturing
Nothing Bond-Bullish In US Manufacturing
The improving health of the labor market is being felt more broadly, with big declines seen in unemployment rates for minorities and less-educated Americans (second panel). That point is of critical importance to the Powell Fed that has emphasized reducing racial and educational gaps in US unemployment as part of reaching its goal of “maximum employment”. Chart 5Nothing Bond-Bullish In US Labor Markets
Nothing Bond-Bullish In US Labor Markets
Nothing Bond-Bullish In US Labor Markets
Tightening labor markets are also evident in accelerating wage momentum. Excluding the 2020 spike driven by labor force compositional effects related to COVID lockdowns, the year-over-year growth in average hourly earnings reached a 39-year high of 5.9% in November (third panel). The Fed now seems willing to finally confront high US inflation and strong economic growth with some tightening of monetary policy. Chart 6A Near-Term Break From Supply-Fueled Inflation?
A Near-Term Break From Supply-Fueled Inflation?
A Near-Term Break From Supply-Fueled Inflation?
Powell caused some investor agita last week when he indicated that the taper could end before mid-2022, the previous FOMC guidance, which would open the door for rate hikes. We see Powell’s comments as less about signaling an intensifying hawkishness and more about giving the Fed optionality on when to start lifting rates next year in the event the US economy continues to overheat. The Fed strongly believes that tapering must end before rate hikes can begin, so a more accelerated taper allows for an earlier liftoff date, if necessary. To that end, the supply fueled surge in inflation this year, which has lingered for far longer than the Fed anticipated, may be showing some signs of easing. Several indices of global shipping container prices are off the highs, while there is a reduced backlog of container ships off key US ports like Los Angeles. Overall commodity price momentum has peaked, in line with slower, but still strong, global industrial activity (Chart 6). An easing of supply-driven price pressures would be welcome by the FOMC. It would allow time to evaluate both the Omicron threat and evolving US labor market dynamics, instead of being forced to fight a rearguard action against accelerating inflation. However, a shift away from goods/commodity inflation to more domestically driven inflation would not lessen the need for the Fed to begin lifting rates next year – in fact, it could even strengthen the case for the Fed to hike rates faster, and by more, than currently discounted in markets. Importantly, forward looking indicators are still pointing to solid US growth next year (Chart 7): The Conference Board’s leading economic indicator continues to grow at a pace signaling above-trend growth US financial conditions remain highly accommodative even with the recent market turbulence The New York Fed’s yield curve based recession probability model is indicating that the spread between the 10-year US Treasury yield and the 3-month US Treasury bill rate, currently 138bps, is consistent with only a 9% chance of a US recession over the next year (bottom panel) We continue to recommend a below-benchmark duration stance within US fixed income portfolios, with a yield target on the 10-year benchmark US Treasury yield of 2-2.25% to be reached by the end of 2022. We also continue to recommend positioning in Treasury curve steepening trades. This is admittedly a counter-intuitive suggestion given that the Fed is moving towards a rate hiking cycle, but we see too much flattening priced into the Treasury forward curve over the next year (Chart 8). Chart 7A Positive Message From US Leading Growth Indicators
A Positive Message From US Leading Growth Indicators
A Positive Message From US Leading Growth Indicators
Chart 8Our Favorite Bearish US Rates Trades
Our Favorite Bearish US Rates Trades
Our Favorite Bearish US Rates Trades
For global bond investors, our favorite trade that will benefit from higher US bond yields next year is to position for a wider 10-year US Treasury-German Bund spread (bottom panel). We expect the ECB to avoid any rate increases until at least mid-2023, well after the Fed has begun to tighten. Forward curves in the US and Germany currently discount a relatively stable Treasury-Bund spread in 2022, thus there is no negative carry incurred by positioning for a wider spread. Bottom Line: Omicron has thrown a growth scare into markets, but the bigger concern is that the Fed is belated starting to play catch up to high inflation and low unemployment. Fade the Omicron bond rally, and position for higher US Treasury yields over the next year. New Zealand: How Much Further Can The Bond Selloff Go? Chart 9NZ Sovereign Underperformance Has Been Driven By RBNZ Hawkishness
NZ Sovereign Underperformance Has Been Driven By RBNZ Hawkishness
NZ Sovereign Underperformance Has Been Driven By RBNZ Hawkishness
Over the past year, New Zealand bonds have sold off much faster than developed market peers (Chart 9). Markets correctly recognized the Reserve Bank Of New Zealand (RBNZ) as a central bank that would move more aggressively to tamp down on inflation and manage the financial stability and political risks arising from soaring house prices. The RBNZ has already delivered back-to-back hikes at its October and November meetings, after its plans to hike at the August meeting were thrown off by the Delta variant. Markets are now pricing in a further 172bps of tightening over the coming year, having largely faded any downside growth risk from the Omicron variant. Expectations of continued tightening have been buoyed by the response of New Zealand policymakers, who are largely looking past the Omicron variant. Restrictions have already begun to ease, with the country having entered its “Traffic Light” COVID-19 Protection Framework. The new variant is also unlikely to affect the RBNZ’s tightening path, with Chief Economist Yuong Ha stating that, given the lifting of restrictions, the RBNZ would have raised rates even if Omicron had become known before its November 24 meeting. Given the bond-bearish backdrop, New Zealand government bonds have underperformed substantially this year. On a relative hedged and duration-matched basis, New Zealand sovereigns have underperformed by -6.6% year-to-date with -4.0 percentage points of that underperformance coming after July 21 when we formally moved to an underweight stance on New Zealand debt within global government bond portfolios (Chart 9, bottom panel). However, with monetary policy entering a new phase, led by an increasingly hawkish Fed, we believe it is appropriate to re-assess our New Zealand call and judge whether this underperformance can continue into 2022. The growth picture is broadly supportive of the RBNZ’s stated policy path. Real GDP as of Q2 was above its pre-Covid trend and 2.6% over the RBNZ’s own estimate of potential GDP, supported by an easing of travel restrictions and strong consumer spending (Chart 10). On a forward-looking basis, however, the risk is now that the economy is running too hot, jeopardizing future growth. Consumer and business sentiment has been worsening as inflation expectations soar, with consumers fearing a hit to purchasing power and businesses concerned about the impact of rising input costs on profit margins. Household and business inflation fears also have a strong basis in the realized inflation data, which has soared to a 10-year high of 4.9% (Chart 11). More troublingly, underlying inflation measures such as the trimmed mean and core (excluding food and energy) are now at series highs of 4.8% and 4%, respectively, indicating that higher inflation could prove to be sticky. The RBNZ now sees headline inflation peaking at 5.7% in Q1/2022 before settling to 2% by the end of its forecast horizon in 2024. Chart 10The NZ Economy Is Overheating
The NZ Economy Is Overheating
The NZ Economy Is Overheating
Chart 11The RBNZ Will Welcome A Slight Growth Slowdown
The RBNZ Will Welcome A Slight Growth Slowdown
The RBNZ Will Welcome A Slight Growth Slowdown
The RBNZ clearly attributes higher inflation to an economy running above longer-term capacity rather than short-term supply factors. The Bank’s measure of the output gap is now at the most positive level since 2007, and survey measures of capacity utilization remain elevated. In contrast to the Fed, which is still nominally focused on maximum employment, the RBNZ actually believes that employment is above its maximum sustainable level, and sees a rising unemployment rate as necessary to ease capacity constraints. Given that the RBNZ is clearly comfortable with, and will likely welcome, a gradual rise in unemployment, it will take much more than a slight growth shock to deter the RBNZ from its tightening path. Chart 12Higher Rates Necessary To Stabilize The NZ Housing Market
Higher Rates Necessary To Stabilize The NZ Housing Market
Higher Rates Necessary To Stabilize The NZ Housing Market
The newest, and most politically potent, part of the RBNZ’s remit—house prices – has further supported a bias to tighten monetary policy. However, while still dramatically elevated, house price growth looks to have peaked (Chart 12). The central bank’s hawkish shift earlier in the year has made a clear impact, with house price growth peaking shortly after mortgage rates started picking up in April of this year. Overall household mortgage credit has also begun to decelerate, indicating that the passthrough from monetary policy to credit demand and housing via the mortgage rate is working as intended. However, there is likely further to go. The last time house price growth was somewhat stable around 6.6% in the 2012-2019 period, benchmark 5-year mortgage rates averaged 6.1%. Assuming the spread between the 5-year mortgage and policy rates remains around 4%, history indicates that we would need to see the policy rate rise to at least 2% to cool down the housing market. That 2% level is also the RBNZ’s mean estimate of a “neutral” cash rate—a level at which policy would be neither accommodative nor restrictive (Chart 13). Current market pricing is quite consistent with the RBNZ’s own projected path of rates as of the November meeting—both of which are set to exceed the neutral rate by the end of 2022. Historical experience from the pre-crisis period indicates that this is not uncommon, and that a bout of restrictive policy might be needed to cool down an overheating economy.
Chart 13
Indeed, if the RBNZ’s historical reaction to inflation is any guide, it seems likely that policymakers will want to push rates above inflation. The top two panels of Chart 14 show how anomalous deeply negative real policy rates are in New Zealand. Even if we make the case that developed market real rates are in a structural downtrend, as realized real rates have peaked out at successively lower levels with each tightening cycle, the current gap between the cash rate and core inflation seems obviously unsustainable and requires a tightening of policy. Chart 14NZ Real Rates Are Too Low
NZ Real Rates Are Too Low
NZ Real Rates Are Too Low
Chart 15Go Long The 10-Year NZ Government Bond/US Treasury Spread
Go Long The 10-Year NZ Government Bond/US Treasury Spread
Go Long The 10-Year NZ Government Bond/US Treasury Spread
Another way to think about where policy rates are in relation to a “neutral” level is to look at the yield curve (Chart 14, bottom panel). Typically, the yield curve inverts when markets judge that monetary policy is too restrictive and that short rates are too high relative to a long-run average. However, the New Zealand government bond curve has historically remained inverted for extended periods of time, troughing at around -100bps. This again indicates that the RBNZ is comfortable raising rates above neutral and keeping policy restrictive when needed. Putting together the four factors we have looked at—growth, inflation, asset prices, and the RBNZ’s reaction function—it looks likely that the RBNZ will continue along the tightening path it has set out and chances of any dovish surprise seem slim. At the same time, markets are priced to perfection in terms of the pace and amount of tightening discounted. For New Zealand sovereigns to continue underperforming, however, we will need to see markets price in, on the margin, even more tightening from the RBNZ relative to its peers. With the Fed and other central banks having become more focused on responding to US inflation dynamics, bond-bearish upside shocks to market rate expectations will increasingly come from outside New Zealand. At the same time, in the event of a negative global growth shock, perhaps relating to COVID-19, there is relatively more room for hikes to be priced out in New Zealand. Given our view that bond and rates markets have appropriately priced in the extent of the RBNZ’s likely tightening cycle, we are upgrading New Zealand sovereign debt to neutral, taking profits on our current underweight stance. While we do not include New Zealand debt in our model bond portfolio, we are expressing our view via a new tactical cross-country spread trade: long New Zealand 10-Year government bonds vs. US 10-Year Treasuries (Chart 15). Forwards are currently pricing in a flat spread between the two countries, meaning that any future spread tightening will put our trade in the black. Given that there is more space for markets to price in increased hawkishness from the Fed, we believe that spread compression is likely. We are implementing this trade by going long New Zealand cash bonds and shorting 10-year US Treasury futures. Details can be found on Page 18. Bottom Line: Underlying growth and inflation fundamentals, soaring house prices, and the central bank’s historical reaction function indicate that the Reserve Bank of New Zealand will lift the cash rate to 2% by the end of 2022. However, markets are already priced for this, leaving little room for New Zealand debt to continue underperforming on a relative basis. We are upgrading New Zealand sovereigns to neutral and initiating a long NZ/short US 10-year spread trade. Robert Robis, CFA Chief Fixed Income Strategist rrobis@bcaresearch.com Shakti Sharma Senior Analyst ShaktiS@bcaresearch.com GFIS Model Bond Portfolio Recommended Positioning Active Duration Contribution: GFIS Recommended Portfolio Vs. Custom Performance Benchmark
Image
The GFIS Recommended Portfolio Vs. The Custom Benchmark Index Global Fixed Income - Strategic Recommendations* Duration Regional Allocation Spread Product Tactical Overlay Trades
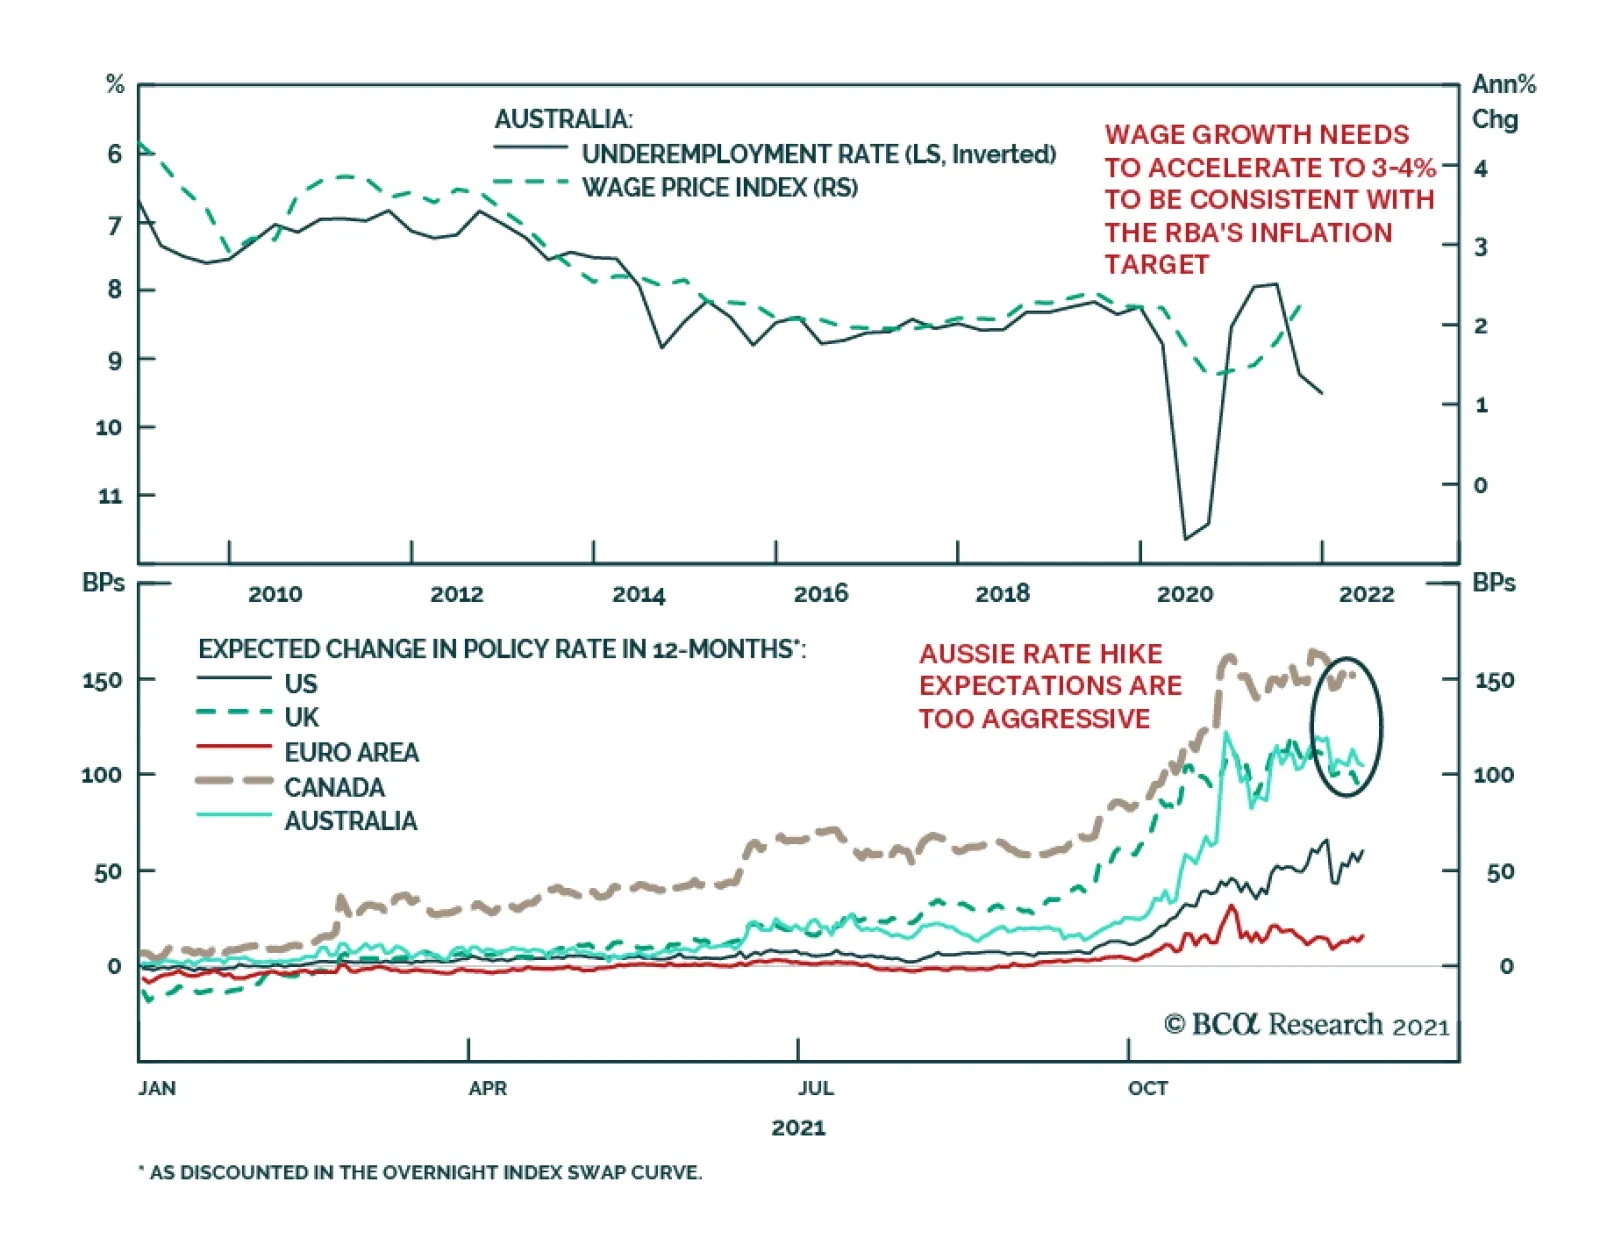
The RBA kept monetary policy unchanged at its Tuesday meeting. Governor Philip Lowe sounded cautiously optimistic in his policy statement. He noted that the Australian economy is on track towards recovery following the Delta-induced setback and that although…
The US Bureau of Labor Statistics revised down its estimate for Q3 nonfarm labor productivity which fell by 5.2% on an annualized basis in Q3 from its earlier estimate of -5.0%. This translated into an upwards revision in unit labor costs to 9.6% from 8.3%. …
Dear Client, We are sending you our Strategy Outlook today where we outline our thoughts on the global economy and the direction of financial markets for 2022 and beyond. Next week, please join me for a webcast on Friday, December 10th at 10:00 AM EST (3:00 PM GMT, 4:00 PM CET, 11:00 PM HKT) to discuss the outlook. Also, we published a report this week transcribing our annual conversation with Mr. X, a long-standing BCA client. Please join my fellow BCA strategists and me on Tuesday, December 7th for a follow-up discussion hosted by my colleague, Jonathan LaBerge. Finally, you will receive a Special Report prepared by our Global Asset Allocation service on Monday, December 13th. Similarly to previous years, Garry Evans and his team have prepared a list of books and articles to read over the holiday period. This year they recommend reading materials on key themes of the moment, such as climate change, cryptocurrencies, supply-chain disruption, and gene technology. Included in this report are my team’s recommendations on what to read to understand the underlying causes of inflation. Best regards, Peter Berezin, Chief Global Strategist Highlights Macroeconomic Outlook: Despite the risks posed by the Omicron variant, global growth should remain above trend in 2022. Inflation will temporarily dip next year as goods prices come off the boil. However, the structural trend for inflation is to the upside, especially in the US. Equities: Remain overweight stocks in 2022, favoring cyclicals, small caps, value stocks, and non-US equities. Look to turn more defensive in mid-2023 in advance of a stagflationary recession in 2024 or 2025. Fixed income: Maintain below-average interest rate duration exposure. The US 10-year Treasury yield will rise to 2%-to-2.25% by the end of 2022. Underweight the US, UK, Canada, and New Zealand in a global bond portfolio. Credit: Corporate debt will outperform high-quality government bonds next year. Favor HY over IG. Spreads will widen again in 2023. Currencies: As a momentum currency, the US dollar could strengthen some more over the next month or two. Over a 12-month horizon, however, the trade-weighted dollar will weaken. The Canadian dollar will be the best performing G10 currency next year. Commodities: Oil prices will rise, with Brent crude averaging $80/bbl in 2022. Metals prices will remain resilient thanks to tight supply and Chinese stimulus. We prefer gold over cryptos. I. Macroeconomic Outlook Running out of Greek Letters Just as the world was looking forward to “life as normal”, a new variant of the virus has surfaced. While little is known about the Omicron variant, preliminary indications suggest that it is more transmissible than Delta. The emergence of the Omicron variant is coming in the midst of yet another Covid wave. The number of new cases has skyrocketed across parts of northern and central Europe, prompting governments to re-introduce stricter social distancing measures (Chart 1). New cases have also been trending higher in many parts of the US and Canada since the start of November.
Chart 1
Despite the risks posed by Omicron, there are reasons for hope. BioNTech has said that its vaccine, jointly developed with Pfizer, will provide at least partial immunity against the new strain. At present, 55% of the world’s population has had at least one vaccine shot; 44% is fully vaccinated (Chart 2). China is close to launching its own mRNA vaccine next year, which it intends to administer as a booster shot.
Chart 2
In a worst-case scenario, BioNTech has said that it could produce a new version of its vaccine within six weeks, with initial shipments beginning in about three months. New antiviral medications are also set to hit the market. Pfizer claims its newly developed pill cuts the risk of hospitalization by nearly 90% if taken within three days from the onset of symptoms. The drug-maker has announced its intention to produce enough of the medication to treat 50 million people in 2022. In addition, it is allowing generic versions to be manufactured in developing countries. The company has indicated that its antiviral pills will be effective in treating the new strain. Global Growth: Slowing but from a High Level Assuming the vaccines and antiviral drugs are able to keep the new strain at bay, global growth should remain solidly above trend in 2022. Table 1 shows consensus GDP growth projections for the major economies. G7 growth is expected to tick up from 3.6% in 2021Q3 to 4.5% in 2021Q4. Growth is set to cool to 4.1% in 2022Q1, 3.6% in 2022Q2, 2.9% in 2022Q3, 2.3% in 2022Q4, and 2.1% in 2023Q1. Table 1Growth Is Slowing, But From Very High Levels
Strategy Outlook - 2022 Key Views: The Beginning Of The End
Strategy Outlook - 2022 Key Views: The Beginning Of The End
Chart 3
According to the OECD, potential real GDP growth in the G7 is about 1.4% (Chart 3). Thus, while growth in developed economies will slow next year, it is unlikely to return to trend until the second half of 2023. Emerging markets face a more daunting outlook. The Chinese property market is weakening, and the recent collapse of the Turkish lira highlights the structural problems that some EMs face. Nevertheless, the combination of elevated commodity prices, forthcoming Chinese stimulus, and the resumption of the US dollar bear market starting next year should support EM growth. Relative to consensus, we think the risks to growth in both developed and emerging markets are tilted to the upside in 2022. Growth will likely start surprising to the downside in late 2023, however. The United States: No Shortage of Demand US growth slowed to only 2.1% in the third quarter, reflecting the impact of the Delta variant wave and supply-chain bottlenecks. The semiconductor shortage hit the auto sector especially hard. The decline in vehicle spending alone shaved 2.2 percentage points off Q3 GDP growth. Chart 4Durable Goods Spending Is Still Above Pre-Pandemic Trend, While Services Spending Is Catching Up
Durable Goods Spending Is Still Above Pre-Pandemic Trend, While Services Spending Is Catching Up
Durable Goods Spending Is Still Above Pre-Pandemic Trend, While Services Spending Is Catching Up
The fourth quarter is shaping up to be much stronger. The Bloomberg consensus estimate is for real GDP to expand by 4.9%. The Atlanta Fed’s GDPNow model is even more optimistic. It sees growth hitting 9.7%. The demand for goods will moderate in 2022. As of October, real goods spending was still 10% above its pre-pandemic trendline (Chart 4). In contrast, the demand for services will continue to rebound. While restaurant sales have recovered all their lost ground, spending on movie theaters, amusement parks, and live entertainment in October was still down 46% on a seasonally-adjusted basis compared to January 2020. Hotel spending was down 23%. Spending on public transport was down 25%. Spending on dental services was down 16% (Chart 5).
Chart 5
US households have accumulated $2.3 trillion in excess savings over the course of the pandemic. Some of this money will be spent over the course of 2022 (Chart 6). Increased borrowing should also help. After initially plunging during the pandemic, credit card balances are rising again (Chart 7). Banks are eager to make consumer loans (Chart 8). Chart 6Plenty Of Pent-Up Demand
Plenty Of Pent-Up Demand
Plenty Of Pent-Up Demand
Chart 7Credit Card Spending Is Recovering Following The Pandemic Slump
Credit Card Spending Is Recovering Following The Pandemic Slump
Credit Card Spending Is Recovering Following The Pandemic Slump
Household net worth has risen by over 100% of GDP since the start of the pandemic (Chart 9). In an earlier report, we estimated that the wealth effect alone could boost annual consumer spending by up to 4% of GDP. Chart 8Banks Are Easing Credit Standards For Consumer Loans
Banks Are Easing Credit Standards For Consumer Loans
Banks Are Easing Credit Standards For Consumer Loans
Chart 9A Record Rise In Household Net Worth
A Record Rise In Household Net Worth
A Record Rise In Household Net Worth
Business investment will rebound in 2022, as firms seek to build out capacity, rebuild inventories, and automate more production in the face of growing labor shortages. After moving sideways for the better part of two decades, core capital goods orders have broken out to the upside. Surveys of capex intentions have improved sharply (Chart 10). Nonresidential investment was 6% below trend in Q3 – an even bigger gap than for consumer services spending – so there is plenty of scope for capex to increase. Residential investment should also remain strong in 2022 (Chart 11). The homeowner vacancy rate has dropped to a record low, as have inventories of new and existing homes for sale. Homebuilder sentiment rose to a 6-month high in November. Building permits are 7% above pre-pandemic levels. Chart 10Business Investment Should Be Strong In 2022
Business Investment Should Be Strong In 2022
Business Investment Should Be Strong In 2022
Chart 11Residential Construction Will Be Well Supported
Residential Construction Will Be Well Supported
Residential Construction Will Be Well Supported
US Monetary and Fiscal Policy: Baby Steps Towards Tightening Policy is unlikely to curb US aggregate demand by very much next year. While the Federal Reserve will expedite the tapering of asset purchases and begin raising rates next summer, the Fed is unlikely to raise rates significantly until inflation gets out of hand. As we discuss in the Feature section later in this report, the next leg in inflation will be to the downside, even if the long-term trend for inflation is to the upside. The respite from inflation next year will give the Fed some breathing space. A major tightening campaign is unlikely until mid-2023. Reflecting the Fed’s dovish posture, long-term real bond yields hit record low levels in November (Chart 12). Despite giving up some of its gains in recent days, Goldman’s US Financial Conditions Index stands near its easiest level in history (Chart 13). Chart 12US Real Bond Yields Hitting Record Lows
US Real Bond Yields Hitting Record Lows
US Real Bond Yields Hitting Record Lows
Chart 13Easy Financial Conditions In The US
Easy Financial Conditions In The US
Easy Financial Conditions In The US
US fiscal policy will get tighter next year, but not by very much. In November, President Biden signed a $1.2 trillion infrastructure bill into law, containing $550 billion in new spending. BCA’s geopolitical strategists expect Congress to pass a $1.5-to-$2 trillion social spending bill using the reconciliation process. The emergence of the Omicron strain will facilitate passage of the bill because it will allow the Democrats to add some “indispensable” pandemic relief to the package. All in all, the IMF foresees the US cyclically-adjusted primary budget deficit averaging 4.9% of GDP between 2022 and 2026, compared to 2.0% of GDP between 2014 and 2019 (Chart 14).
Chart 14
It should also be noted that government spending on goods and services has been quite weak over the past two years (Chart 15). The budget deficit surged because transfer payments exploded. Unlike direct government spending, which is set to accelerate over the next few years, households saved a large share of transfer payments. Thus, the fiscal multiplier will increase next year, even as the budget deficit shrinks. Chart 15While Overall Consumption Has Recovered, Business Spending and Direct Government Expenditures Remain Below Trend
While Overall Consumption Has Recovered, Business Spending and Direct Government Expenditures Remain Below Trend
While Overall Consumption Has Recovered, Business Spending and Direct Government Expenditures Remain Below Trend
Chart 16European Banks Have Cleaned Up Their Act
European Banks Have Cleaned Up Their Act
European Banks Have Cleaned Up Their Act
Europe: Room to Grow The European economy faces near-term growth pressures. In addition to Covid-related lockdowns, high energy costs will take a bite out of growth. After having dipped in October, natural gas prices have jumped again due to delays in the opening of the Nord Stream 2 pipeline, strong Chinese gas demand, and rising risks of a colder winter due to La Niña. The majority of Germans are in favor of opening the pipeline, suggesting that it will ultimately be approved. This should help reduce gas prices. Meanwhile, the winter will pass and Chinese demand for gas should abate as domestic coal production increases. The combination of increased energy supplies, easing supply-chain bottlenecks, and hopefully some relief on the pandemic front, should all pave the way for better-than-expected growth across the euro area next year. After a decade of housecleaning, European banks are in much better shape (Chart 16). Capex intentions have risen (Chart 17). Consumer confidence is even stronger in the euro area than in the US (Chart 18).
Chart 17
Chart 18Consumer Confidence Is At Pre-Pandemic Levels In The Euro Area, Unlike In The US
Consumer Confidence Is At Pre-Pandemic Levels In The Euro Area, Unlike In The US
Consumer Confidence Is At Pre-Pandemic Levels In The Euro Area, Unlike In The US
Euro area fiscal policy should remain supportive. Infrastructure spending is set to increase as the Next Generation EU fund begins operations. Germany’s “Traffic Light” coalition will pursue a more expansionary fiscal stance. The IMF expects the euro area to run a cyclically-adjusted primary deficit of 1.2% of GDP between 2022 and 2026, compared to a surplus of 1.2% of GDP between 2014 and 2019. For its part, the ECB will maintain a highly accommodative monetary policy. While net asset purchases under the PEPP will end next March, the ECB is unlikely to raise rates until 2023 at the earliest. In contrast to the US, trimmed-mean inflation has barely risen in the euro area (Chart 19). Moreover, unlike their US counterparts, European firms are reporting few difficulties in finding qualified workers (Chart 20). In fact, euro area wage growth slowed to an all-time low of 1.35% in Q3 (Chart 21). Chart 19Trimmed-Mean Inflation: Higher In The US Than In The Euro Area And Japan
Trimmed-Mean Inflation: Higher In The US Than In The Euro Area And Japan
Trimmed-Mean Inflation: Higher In The US Than In The Euro Area And Japan
Chart 20
Chart 21Wage Growth Remains Contained Across The Euro Area
Wage Growth Remains Contained Across The Euro Area
Wage Growth Remains Contained Across The Euro Area
The UK finds itself somewhere between the US and the euro area. Trimmed-mean inflation is running above euro area levels, but below that of the US. UK labor market data remains very strong, as evidenced by robust employment gains, firm wage growth, and a record number of job vacancies. The PMIs stand at elevated levels, with the new orders component of November’s manufacturing PMI rising to the highest level since June. While worries about the impact of the Omicron variant will likely cause the Bank of England to postpone December’s rate hike, we expect the BoE to begin raising rates in February. Japan: Short-Term Stimulus Boost A major Covid wave during the summer curbed Japanese growth. Consumer spending rebounded after the government removed the state of emergency on October 1 but could falter again if the Omicron variant spreads. The government has already told airlines to halt reservations for all incoming international flights for at least one month. On the positive side, the economy will benefit from new fiscal measures. Following the election on October 31, the new government led by Prime Minister Fumio Kishida announced a stimulus package worth 5.6% of GDP. As with most Japanese stimulus packages, the true magnitude of fiscal support will be much lower than the headline figure. Nevertheless, the combination of increased cash payments to households, support for small businesses, and subsidies for domestic travel should spur consumption in 2022. The capex recovery in Japan has lagged other major economies. This is partly due to the outsized role of the auto sector in Japan’s industrial base. Motor vehicle shipments fell 37% year-over-year in October, dragging down export growth with it. As automotive chip supplies increase, Japan’s manufacturing sector should gain some momentum. Despite the prospect of stronger growth next year, the Bank of Japan will stand pat. Core inflation remains close to zero, while long-term inflation expectations remain far below the BOJ’s 2% target. We do not expect the BOJ to raise rates until 2024 at the earliest. China: Crosswinds The Chinese economy faces crosswinds going into 2022. On the one hand, the energy crisis should abate, helping to boost growth. China has reopened 170 coal mines and will probably begin re-importing Australian coal. Chinese coal prices have fallen drastically over the past 6 weeks (Chart 22). Coal accounts for about two-thirds of Chinese electricity generation. Chart 22Coal Prices Are Renormalizing In China
Coal Prices Are Renormalizing In China
Coal Prices Are Renormalizing In China
Chart 23China's Property Market Has Weakened
China's Property Market Has Weakened
China's Property Market Has Weakened
The US may also trim tariffs on Chinese goods, as Treasury Secretary Yellen hinted this week. This will help Chinese manufacturers. On the other hand, the property market remains under stress. Housing starts, sales, and land purchases were down 34%, 21%, and 24%, respectively, in October relative to the same period last year. The proportion of households planning to buy a home has plummeted. Loan growth to real estate developers has decelerated to the lowest level on record (Chart 23). Nearly half of their offshore bonds are trading at less than 70 cents on the dollar. The authorities have taken steps to stabilize the property market. They have relaxed restrictions on mortgage lending and land sales, cut mortgage rates in some cities, and have allowed some developers to issue asset backed securities to repay outstanding debt. Most Chinese property is bought “off-plan”. The government does not want angry buyers to be deprived of their property. Thus, the existing stock of planned projects will be built. Chart 24 shows that this is a large number; in past years, developers have started more than twice as many projects as they have completed. The longer-term problem is that China builds too many homes. Like Japan in the early 1990s, China’s working-age population has peaked (Chart 25). According to the UN, it will decline by over 400 million by the end of the century. China simply does not need to construct as many new homes as it once did. Chart 24Chinese Construction: Halfway Done
Chinese Construction: Halfway Done
Chinese Construction: Halfway Done
Chart 25Demographic Parallels Between China And Japan
Demographic Parallels Between China And Japan
Demographic Parallels Between China And Japan
Chart 26
Japan was unable to fill the gap that a shrinking property sector left in aggregate demand in the early 1990s. As a result, the economy fell into a deflationary trap. China is likely to have more success. Unlike Japan, which waited too long to pursue large-scale fiscal stimulus, China will be more aggressive. The authorities will raise infrastructure spending next year with a focus on clean energy. They will also boost social spending. A frayed social safety net has forced Chinese households to save more than they would otherwise for precautionary reasons. This has weighed on consumption. The fact that China is a middle-income country helps. In 1990, Japan’s output-per-worker was nearly 70% of US levels; China’s output-per-worker is still 20% of US levels (Chart 26). If Chinese incomes continue to grow at a reasonably brisk pace, this will make it easier to improve home affordability. It will also allow China to stabilize its debt-to-GDP ratio without a painful deleveraging campaign. II. Feature: The Long-Term Inflation Outlook Two Steps Up, One Step Down We expect inflation in the US, and to a lesser degree abroad, to follow a “two steps up, one step down” trajectory of higher highs and higher lows. The US is currently near the top of those two steps. Inflation should dip over the next 6-to-9 months as the demand for goods moderates and supply-chain disruptions abate. Chart 27 shows that container shipping costs have started to come down. The number of ships anchored off the ports of Los Angeles and Long Beach is falling. US semiconductor firms are working overtime (Chart 28). Chip production in Japan and Korea is rising swiftly. DRAM chip prices have already started to decline. Chart 27Signs Of Easing Supply Issues On The Rough Seas
Signs Of Easing Supply Issues On The Rough Seas
Signs Of Easing Supply Issues On The Rough Seas
Chart 28Semiconductor Manufacturers Are Stepping Up Their Game
Semiconductor Manufacturers Are Stepping Up Their Game
Semiconductor Manufacturers Are Stepping Up Their Game
Reflecting the easing of supply-chain bottlenecks, both the “prices paid” and “supplier delivery” components of the manufacturing ISM declined in November. The respite from inflation will not last long, however. The US labor market is heating up. So far, most of the wage growth has been at the bottom end of the income distribution (Chart 29). Wage growth will broaden out over the course of 2022, pushing up service price inflation in the process. Chart 29Wage Growth Has Picked Up, But Mainly At The Bottom Of The Income Distribution
Wage Growth Has Picked Up, But Mainly At The Bottom Of The Income Distribution (I)
Wage Growth Has Picked Up, But Mainly At The Bottom Of The Income Distribution (I)
Chart 30Rent Inflation Has Increased
Rent Inflation Has Increased
Rent Inflation Has Increased
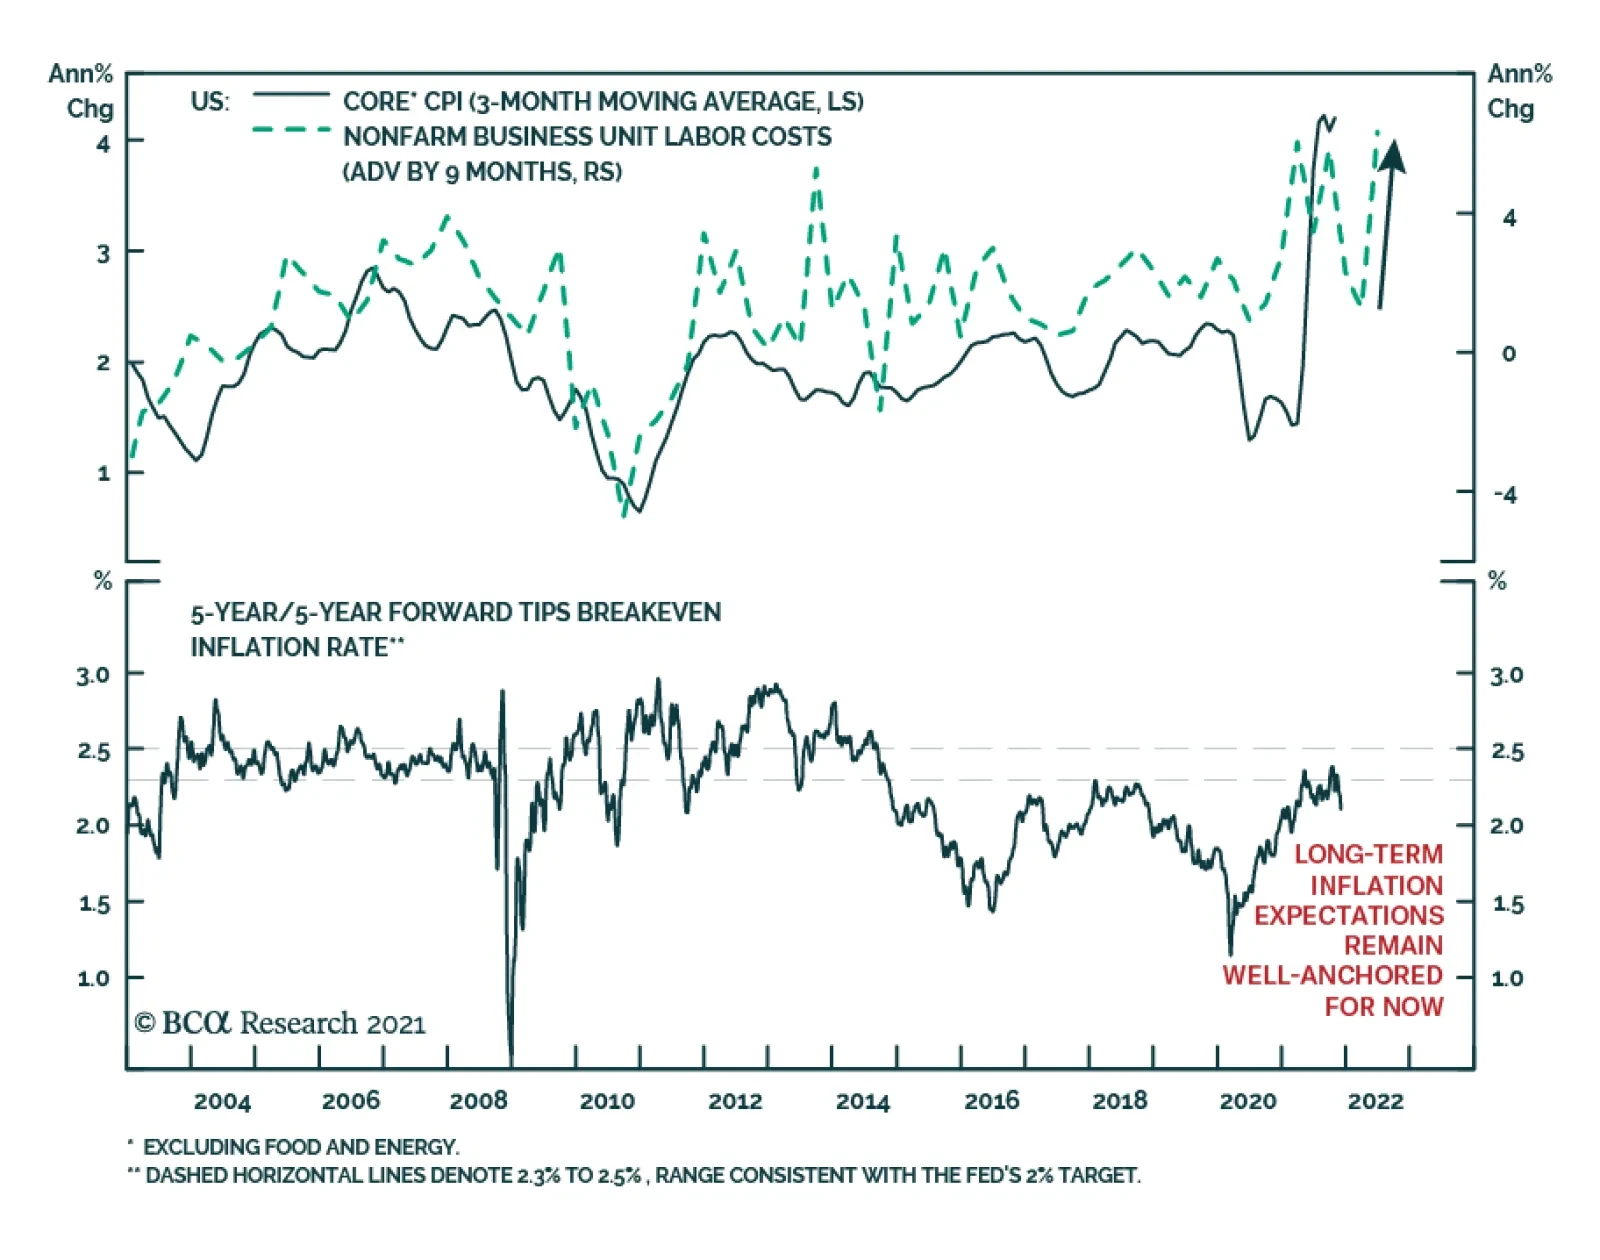
Rent inflation will also rise, as the unemployment rate falls further. The Zillow rent index has spiked 14% (Chart 30). Rents account for 8% of the US CPI basket and 4% of the PCE basket. Biased About Neutral? Investors are assuming that the Fed will step in to extinguish any inflationary fires before they get out of hand. The widely-followed 5-year/5-year forward TIPS breakeven inflation rate has fallen back below the Fed’s comfort zone (Chart 31). Chart 31Long-Term Inflation Expectations Are Not A Source Of Worry For The Fed
Long-Term Inflation Expectations Are Not A Source Of Worry For The Fed (II)
Long-Term Inflation Expectations Are Not A Source Of Worry For The Fed (II)
Chart 32Both The Fed And Investors Have Lowered Their Estimate Of The Neutral Rate
Both The Fed And Investors Have Lowered Their Estimate Of The Neutral Rate
Both The Fed And Investors Have Lowered Their Estimate Of The Neutral Rate
This may be wishful thinking. Back in 2012, when the Fed began publishing its “dots”, it thought the neutral rate of interest was 4.25%. Today, it considers it to be around 2.5% (Chart 32). Market participants broadly agree. Both investors and policymakers have bought into the secular stagnation thesis hook, line, and sinker. If the neutral rate turns out to be higher than widely believed, the Fed could find itself woefully behind the curve. Given the “long and variable” lags between changes in monetary policy and the resulting impact on the economy, inflation is liable to greatly overshoot the Fed’s target. Structural Forces Turning More Inflationary Meanwhile, the forces that have underpinned low inflation over the past few decades are starting to fray: Globalization is in retreat: The ratio of global trade-to-manufacturing output has been flat for over a decade (Chart 33). Looking out, the ratio could decline as geopolitical tensions between China and the rest of the world continue to simmer, and more companies shift production back home in order to gain greater control over the supply chains of essential goods. Baby boomers are leaving the labor force en masse: As a group, baby boomers hold more than half of US household wealth (Chart 34). They will continue to run down their wealth once they retire. However, since they will no longer be working, they will no longer contribute to national output. Spending that is not matched by output tends to drive up inflation. Chart 33Globalization Plateaued Over a Decade Ago
Globalization Plateaued Over a Decade Ago
Globalization Plateaued Over a Decade Ago
Chart 34
Social stability is in peril: The US homicide rate increased by 27% in 2020, the biggest one-year jump on record. All indications suggest that crime has continued to rise in 2021, coinciding with the ongoing decline in the incarceration rate (Chart 35). Amazingly, the murder rate and inflation are highly correlated (Chart 36). If the government cannot credibly commit to keeping people safe, how can it credibly commit to keeping inflation low? Without trust in government, inflation expectations could quickly become unmoored. Chart 35The Homicide Rate Has Tended To Rise When The Institutionalization Rate Has Declined
The Homicide Rate Has Tended To Rise When The Institutionalization Rate Has Declined
The Homicide Rate Has Tended To Rise When The Institutionalization Rate Has Declined
Chart 36Bouts Of Inflation Tend To Coincide With Rising Crime
Bouts Of Inflation Tend To Coincide With Rising Crime
Bouts Of Inflation Tend To Coincide With Rising Crime
The temptation to monetize debt will rise: Public-sector debt levels have soared to levels last seen during World War II. If bond yields rise as the Congressional Budget Office expects, debt-servicing costs will triple by the end of the decade (Chart 37). Faced with the prospect of having to divert funds from social programs to pay off bondholders, the government may apply political pressure on the Fed to keep rates low.
Chart 37
A Post-Pandemic Productivity Boom?
Chart 38
Might faster productivity growth bail out the economy just like it did following the Second World War? Don’t bet on it. US labor productivity did increase sharply during the initial stages of the pandemic. However, that appears to have been largely driven by composition effects that saw many low-skilled, poorly-paid service workers lose their jobs. As these low-skilled workers have returned to the labor force, productivity growth has dropped. The absolute level of productivity declined by 5.0% at an annualized rate in the third quarter, leading to an 8.3% increase in labor costs. Productivity growth has been extremely weak outside the US (Chart 38). This gives weight to the view that the pandemic-induced changes in business practices have not contributed to higher productivity, at least so far. It is worth noting that a recent study of 10,000 skilled professionals at a major IT company revealed that work-from-home policies decreased productivity by 8%-to-19%, mainly because people ended up working longer. Increased investment spending should eventually boost productivity. However, the near-term impact of higher capex will be to boost aggregate demand, stoking inflation in the process. III. Financial Markets A. Portfolio Strategy Above-Trend Global Growth Will Support Equities Our golden rule of investing is about as simple as they come: Don’t bet against stocks unless you think that there is a recession around the corner. As Chart 39 shows, recessions and equity bear markets almost always overlap.
Chart 39
Chart 40Sentiment Towards Equities Is Already Bearish
Sentiment Towards Equities Is Already Bearish
Sentiment Towards Equities Is Already Bearish
Equity corrections can occur outside of recessionary periods. In fact, we are experiencing such a correction right now. Yet, with the percentage of bearish investors reaching the highest level in over 12 months in this week’s AAII survey, chances are that the correction will not last much longer (Chart 40). A sustained decline in stock prices requires a sustained decline in corporate earnings; the latter normally only happens during economic downturns. Admittedly, it is impossible to know for sure if a recession is lurking around the corner. If the Omicron variant is able to completely evade the vaccines, growth will slow considerably over the coming months. Yet, even in that case, the global economy is unlikely to experience a sudden-stop of the sort that occurred last March. As noted at the outset of this report, pharma companies have the tools to tweak the vaccines, and most experts believe that the soon-to-be-released antivirals will be effective against the new strain. If economic growth remains above trend, earnings will rise (Chart 41). S&P 500 companies generated $53.82 per share in profits in Q3. The bottom-up consensus is for these companies to generate an average of $54.01 in quarterly profits between 2021Q4 and 2022Q3, implying almost no growth from 2021Q3 levels. This is a very low bar to clear. We expect global equities to produce high single-digit returns next year. Chart 41Analysts Increased Earnings Estimates This Year
Analysts Increased Earnings Estimates This Year
Analysts Increased Earnings Estimates This Year
The Beginning of the End Our guess is that 2022 will be the last year of the secular equity bull market that began in 2009. In mid-2023 or so, the Fed will come around to the view that the neutral rate is higher than it once thought. Unfortunately, by then, it will be too late; a wage-price spiral will have already emerged. A nasty bear flattening of the yield curve will ensue: Long-term bond yields will rise but short-term rate expectations will increase even more. A recession will follow in 2024 or 2025. The most important real-time indicator we are focusing on to gauge when to turn more bearish on stocks is the 5y/5y forward TIPS breakeven rate. As noted earlier, it is still at the bottom end of the Fed’s comfort zone. If it were to rise above 3%, all hell could break loose, especially if this happened without a corresponding increase in crude oil prices. The Fed takes great pride in the success it has had in anchoring long-term expectations. Any evidence that expectations are becoming unmoored would cause the FOMC to panic. B. Equity Sectors, Regions, And Styles Favor Value, Small Caps, and Non-US Markets in 2022 Until the Fed takes away the punch bowl, a modestly procyclical stance towards equity sectors, styles, and regional equity allocation is warranted. Chart 42The Relative Performance Of Value Stocks Has Closely Tracked Bond Yields This Year
The Relative Performance Of Value Stocks Has Closely Tracked Bond Yields This Year
The Relative Performance Of Value Stocks Has Closely Tracked Bond Yields This Year
The relative performance of value versus growth stocks has broadly followed the trajectory of the 30-year Treasury yield this year (Chart 42). Rising yields should buoy value stocks, with banks being the biggest beneficiaries (Chart 43). In contrast, rising yields will weigh on tech stocks. Chart 43Rising Bond Yields Will Help Bank Shares But Hurt Tech Stocks
Rising Bond Yields Will Help Bank Shares But Hurt Tech Stocks
Rising Bond Yields Will Help Bank Shares But Hurt Tech Stocks
Chart 44The Winners And Losers Of Covid Waves
The Winners And Losers Of Covid Waves
The Winners And Losers Of Covid Waves
If we receive some good news on the pandemic front, this should disproportionately help value. As Chart 44 illustrates, the relative performance of value versus growth stocks has tracked the number of new Covid cases globally. The correlation between new cases and the relative performance of IT and energy has been particularly strong. Rising capex spending will buoy industrial stocks. Industrials are overrepresented in value indices both in the US and abroad (Table 2). Along with financials, industrials are also overrepresented in small cap indices (Table 3). US small caps trade at 15-times forward earnings compared to 21-times for the S&P 500. Table 2Breaking Down Growth And Value By Sector
Strategy Outlook - 2022 Key Views: The Beginning Of The End
Strategy Outlook - 2022 Key Views: The Beginning Of The End
Table 3Financials And Industrials Have A Larger Weight In US Small Caps
Strategy Outlook - 2022 Key Views: The Beginning Of The End
Strategy Outlook - 2022 Key Views: The Beginning Of The End
Time to Look Abroad? Given our preference for cyclicals and value in 2022, it stands to reason that we should also favor non-US markets. Table 4 shows that non-US stock markets have more exposure to cyclical and value sectors. Table 4Cyclicals Are Overrepresented Outside The US
Strategy Outlook - 2022 Key Views: The Beginning Of The End
Strategy Outlook - 2022 Key Views: The Beginning Of The End
Admittedly, favoring non-US stock markets has been a losing proposition for the past 12 years. US earnings have grown much faster than earnings abroad over this period (Chart 45). US stock returns have also benefited from rising relative valuations. Chart 45The US Has Been The Earnings Leader In Recent Years
The US Has Been The Earnings Leader In Recent Years
The US Has Been The Earnings Leader In Recent Years
At this point, however, US stocks are trading at a significant premium to their overseas peers, whether measured by the P/E ratio, price-to-book, or price-to-sales (Chart 46). US profit margins are also more stretched than elsewhere (Chart 47).
Chart 46
Chart 47US Profit Margins Look Stretched
US Profit Margins Look Stretched
US Profit Margins Look Stretched
Chart 48Non-US Stocks Tend To Do Best When The US Dollar Is Weakening
Non-US Stocks Tend To Do Best When The US Dollar Is Weakening
Non-US Stocks Tend To Do Best When The US Dollar Is Weakening
The US dollar may be the ultimate arbiter of whether the US or international stock markets outperform in the 2022. Historically, there has been a close correlation between the trade-weighted dollar and the relative performance of US versus non-US equities (Chart 48). In general, non-US stocks do best when the dollar is weakening. The usual relationship between the dollar and the relative performance of US and non-US stocks broke down in 2020 when the dollar weakened but the tech-heavy US stock market nonetheless outperformed. However, if “reopening plays” gain the upper hand over “pandemic plays” in 2022, the historic relationship between the dollar and US/non-US returns will reassert itself. As we discuss later on, while near-term momentum favors the dollar, the greenback is likely to weaken over a 12-month horizon. This suggests that investors should look to increase exposure to non-US stocks in a month or two. Around that time, the energy shortage gripping Europe will begin to abate, China will be undertaking more stimulus, and investors will start to focus more on the prospect of higher US corporate taxes. C. Fixed Income Maintain Below-Benchmark Duration The yield on a government bond equals the expected path of policy rates over the duration of the bond plus a term premium that compensates investors for locking in their savings at a fixed rate rather than rolling them over at the prevailing short-term rate. While expected policy rates have moved up in the US over the past 2 months, the market’s expectations of where policy rates will be in the second half of the decade have not changed much (Chart 49). Investors remain convinced of the secular stagnation thesis which postulates that the neutral rate of interest is very low.
Chart 49
As for the term premium, it remains stuck in negative territory, much where it has been for the past 10 years (Chart 50). Chart 50Negative Term Premium Across The Board
Negative Term Premium Across The Board
Negative Term Premium Across The Board
The Term Premium Will Increase The notion of a negative term premium may seem odd, as it implies that investors are willing to pay to take on duration risk. However, there is a good reason for why the term premium has been negative: The correlation between bond yields and stock prices has been positive (Chart 51). Chart 51Stocks And Bond Yields Have Not Always Been Positively Correlated
Stocks And Bond Yields Have Not Always Been Positively Correlated
Stocks And Bond Yields Have Not Always Been Positively Correlated
When bond yields are positively correlated with stock prices, bonds are a hedge against bad economic news. If the economy falls into recession, equity prices will drop; the value of your home will go down; you may not get a bonus, or even worse, you may lose your job. But at least the value of your bond portfolio will go up! There is a catch, however: Bonds are a hedge against bad economic news only if that news is deflationary in nature. The 2001 and 2008-09 recessions all saw bond yields drop as the economy headed south. Both recessions were due to deflationary shocks: first the dotcom bust, and later, the bursting of the housing bubble. In contrast, bond yields rose in the lead up to the recession in the 1970s and early 80s. Bonds were not a good hedge against falling stock prices back then because it was surging inflation and rising bond yields that caused stocks to fall in the first place. This raises a worrying possibility that investors have largely overlooked: The term premium may increase as it becomes increasingly clear that the next recession will be caused not by inadequate demand but by Fed tightening in response to an overheated economy. A rising term premium would exacerbate the upward pressure on bond yields stemming from higher-than-expected inflation as well as upward revisions to estimates of the real neutral rate of interest. Again, we do not think that a “term premium explosion” is a significant risk for 2022. However, it is a major risk for 2023 and beyond. Investors should maintain a modestly below-benchmark duration stance for now but look to go maximally underweight duration towards the end of next year. Global Bond Allocation BCA’s global fixed-income strategists recommend underweighting the US, Canada, the UK, and New Zealand in 2022. They suggest overweighting Japan, the euro area, and Australia. US Treasuries trade with a higher beta than most other government bond markets (Chart 52). Our bond strategists expect the US 10-year Treasury yield to hit 2%-to-2.25% by the end of next year. Chart 52High-And Low-Beta Bond Yields
High-And Low-Beta Bond Yields
High-And Low-Beta Bond Yields
As discussed earlier, neither the ECB nor the BoJ are in a hurry to raise rates. Both euro area and Japanese bonds have outperformed the global benchmark when Treasury yields have risen (Chart 53).
Chart 53
Chart 54UK Inflation Expectations Are Higher Than In Other Major Developed Economies
UK Inflation Expectations Are Higher Than In Other Major Developed Economies
UK Inflation Expectations Are Higher Than In Other Major Developed Economies
While rate expectations in Australia have come down on the Omicron news, the markets are still pricing in four hikes next year. With wage growth still below the RBA’s target, our fixed-income strategists think the central bank will pursue a fairly dovish path next year. In contrast, they think New Zealand will continue its hiking cycle. Like Canada, the Reserve Bank of New Zealand has become increasingly concerned about soaring home prices and household indebtedness. Inflation expectations are higher in the UK than elsewhere (Chart 54). With the BoE set to raise rates early next year, gilts will underperform the global benchmark. Overweight High-Yield Corporate Bonds… For Now Chart 55High-Yield Spreads Are Pricing In A Default Rate Of Close To 4%
High-Yield Spreads Are Pricing In A Default Rate Of Close To 4%
High-Yield Spreads Are Pricing In A Default Rate Of Close To 4%
The combination of above-trend economic growth and accommodative monetary policy will provide support for corporate bonds in 2022. For now, we prefer high yield over investment grade. According to our bond strategists, while high-yield spreads are quite tight, they are still pricing in a default rate of 3.8% (Chart 55). This is more than their fair value default estimate of 2.3%-to-2.8%. It is also above the year-to-date realized default rate of 1.7%. As with equities, the bull market in corporate credit will end in 2023 as the Fed is forced to accelerate the pace of rate hikes in the face of an overheated economy and rising long-term inflation expectations. D. Currencies and Commodities Dollar Strength Will Reverse in Early 2022 Since bottoming in May, the US dollar has been trending higher. The US dollar is a high momentum currency: When the greenback starts rising, it usually keeps rising (Chart 56). A simple trading rule that buys the dollar when it is trading above its various moving averages has delivered positive returns (Chart 57). This suggests that the greenback could very well strengthen further over the next month or two.
Chart 56
Chart 57
Over a 12-month horizon, however, we think the trade-weighted dollar will weaken. Both speculators and asset managers are net long the dollar (Chart 58). Current positioning suggests we are nearing a dollar peak. Rising US rate expectations have helped the dollar this year. Chart 59 shows that both USD/EUR and USD/JPY have tracked the spread between the yield on the December 2022 Eurodollar and Euribor/Euroyen contracts, respectively. While the Fed will expedite the pace of tapering, the overall approach will still be one of “baby-steps” towards tightening next year. BCA’s bond strategists do not expect US rate expectations for end-2022 to rise from current levels. Chart 58Long Dollar Positions Are Getting Crowded
Long Dollar Positions Are Getting Crowded
Long Dollar Positions Are Getting Crowded
Chart 59Interest Rates Have Played A Major Role On The Dollar's Performance This Year
Interest Rates Have Played A Major Role On The Dollar's Performance This Year
Interest Rates Have Played A Major Role On The Dollar's Performance This Year
The present level of real interest rate differentials is consistent with a much weaker dollar (Chart 60). Using CPI swaps as a proxy for expected inflation, 2-year real rates in the US are 42 basis points below other developed economies. This is similar to where real spreads were in 2013/14, when the trade-weighted dollar was 16% weaker than it is today. Chart 60AThe Dollar And Interest Rate Differentials (I)
The Dollar And Interest Rate Differentials (I)
The Dollar And Interest Rate Differentials (I)
Chart 60BThe Dollar And Interest Rate Differentials (II)
The Dollar And Interest Rate Differentials (II)
The Dollar And Interest Rate Differentials (II)
Meanwhile, growth outside the US will pick up next year as Europe’s energy crisis abates and China ramps up stimulus. If history is any guide, firmer growth abroad will put downward pressure on the dollar (Chart 61). Chart 61The Dollar Will Weaken As Global Growth Rotates From The US To The Rest Of The World
The Dollar Will Weaken As Global Growth Rotates From The US To The Rest Of The World
The Dollar Will Weaken As Global Growth Rotates From The US To The Rest Of The World
Chart 62Dollar Headwinds
Dollar Headwinds
Dollar Headwinds
Pricey Greenback The dollar’s lofty valuation has left it overvalued by nearly 20% on a Purchasing Power Parity (PPP) basis. The PPP exchange rate equalizes the price of a representative basket of goods and services between the US and other economies. Reflecting the dollar’s overvaluation, the US trade deficit has widened sharply. Excluding energy exports, the US trade deficit as a share of GDP is now the largest on record. Equity inflows have helped finance America’s burgeoning current account deficit (Chart 62). However, these inflows are starting to abate, and could drop further if global investors abandon their infatuation with US tech stocks. Favor Commodity Currencies We favor commodity currencies for 2022, especially the Canadian dollar, which we expect to be the best performing G10 currency. Canadian real GDP growth will average nearly 5% in Q4 and the first half of next year. The Bank of Canada will start hiking rates next April. Oil prices should remain reasonably firm next year, helping the loonie and other petrocurrencies. Bob Ryan, BCA’s chief Commodity Strategist, expects the price of Brent crude to average $80/bbl in 2022 and 81$/bbl in 2023, which is well above the forwards (Chart 63). Years of underinvestment in crude oil production have led to tight supply conditions (Chart 64). Proven global oil reserves increased by only 6% between 2010 and 2020, having risen by 26% over the preceding decade.
Chart 63
Chart 64
As with oil, there has been little investment in mining capacity in recent years. While a weaker property market in China will weigh on metals prices, this will be partly offset by Chinese fiscal stimulus. Looking further ahead, the outlook for metals remains bright. Whereas the proliferation of electric vehicles is bad news for oil demand over the long haul, it is good news for many metals. The typical electric vehicle requires about four times as much copper as a typical gasoline-powered vehicle. Huge amounts of copper will also be necessary to expand electrical grids. The RMB Will Be Stable in 2022 It is striking that despite the appreciation in the trade-weighted dollar since June and escalating concerns about the health of the Chinese economy, the RMB has managed to strengthen by 0.3% against the US dollar. Chinese export growth will moderate in 2022 as global consumption shifts from goods to services. Rising global bond yields may also narrow the yield differential between China and the rest of the world. Nevertheless, we doubt the RMB will weaken very much. China wants the RMB to be a global reserve currency. A weak RMB would run counter to that goal. Rather than weakening the yuan, the Chinese authorities will use fiscal stimulus to support growth. Gold Versus Cryptos? Gold prices tend to move closely with real bond yields (Chart 65). Since August 2020, however, the price of gold has slumped from a high of $2,067/oz to $1,768/oz, even though real yields remain near record lows. The divergence between real yields and gold prices may partly reflect growing demand for cryptocurrencies. Investors increasingly see cryptos as not just a disruptive economic force, but as the premier “anti-fiat” hedge. Whether that view pans out remains to be seen. So far, the vast majority of the demand for cryptocurrencies has stemmed from people hoping to get rich by buying cryptos. To the extent that people are using cryptos for online purchases, it is usually for illegal goods (Chart 66). Chart 65Gold Prices Tend To Correlate Closely With Real Interest Rates
Gold Prices Tend To Correlate Closely With Real Interest Rates
Gold Prices Tend To Correlate Closely With Real Interest Rates
Chart 66
Crypto proponents like to say that the supply of cryptos is finite. While this may be true for individual cryptocurrencies, it is not true for the sector as a whole. Over the past 8 years, the number of cryptocurrencies has swollen from 26 in 2013 to 7,877 (Chart 67). At least with gold, they are not adding any new elements to the periodic table.
Chart 67
At any rate, the easy money in the crypto space has already been made. Bitcoin has doubled in price seven times since the start of 2016. If it were to double just one more time to $120,000, it would be worth $2.2 trillion, equal to the entire stock of US dollars in circulation. Investors looking to hedge long-term inflation risk should shift back into gold. Peter Berezin Chief Global Strategist pberezin@bcaresearch.com Global Investment Strategy View Matrix
Image
Special Trade Recommendations
Image
Current MacroQuant Model Scores
Image
Highlights Financial markets in both mainstream EM and China are undergoing an adjustment that is not yet complete. EM equity and currency valuations are neutral. When valuations are neutral, the profit and liquidity cycles become the key drivers of share prices. Both these factors are currently headwinds to equity prices. Our investment strategy is to remain defensive going into the new year. Yet, the longer-term outlook is brighter. We see with high odds that the first half of the year will present an opportunity to turn positive on EM assets in absolute terms, and upgrade EM versus DM within global equity and fixed-income portfolios. Our checklist of fundamental factors that will cause us to turn bullish on EM and China include: (1) significant stimulus in China leading to a strong recovery in its credit impulse; (2) a rollover in Latin America’s core inflation that will open the door for monetary policy easing in these economies; and (3) the Fed abandoning its plans to hike rates, creating conditions for durable US dollar weakness. Feature Introduction: Beyond Omicron There is low visibility regarding the Omicron variant of the COVID-19 virus’s impact on societies and economies. We do not pretend to be experts in virology and on pandemics. So, in this 2022 outlook, we will focus on the macro fundamentals that go beyond Omicron. If the latter proves to be very disruptive for many economies, EM risk assets will sell off materially in the coming weeks. If Omicron proves to be a non-issue, macro fundamentals will prevail. In this case (and if our analysis is correct) EM risk assets will still fare poorly, at least in the early months of 2022. Chart 1The EM Selloff Has Been Occurring Since February 2021
The EM Selloff Has Been Occurring Since February 2021
The EM Selloff Has Been Occurring Since February 2021
Notably, the cross rate between the Swedish krona and Swiss franc correlates well with EM share prices and both had already been falling well before Omicron arrived (Chart 1). Overall, our investment strategy is to remain defensive going into the new year. Nevertheless, odds are significant that in H1 2022 there will be a buying opportunity in EM assets in absolute terms, and a better entry point to upgrade EM relative to DM within global equity and fixed-income portfolios. China’s Business Cycle And Macro Policy Will China ease policy substantially? It depends on how bad the economy, financial markets and business/consumer sentiment get. Beijing has already initiated piecemeal monetary and fiscal easing. However, if the growth slowdown is gradual and orderly, and financial markets do not panic, then policy easing will be measured. On the contrary, if growth tumbles sharply, business and consumer confidence deteriorate markedly and onshore share prices sell off hard, then policymakers will accelerate the stimulus. In a nutshell, substantial policy easing is not likely unless Chinese onshore stocks experience a meaningful deterioration. In the meantime, the Mainland economy will continue disappointing, and the path of least resistance for China-related plays is down: The annual change in excess reserves – that PBOC injects into the banking system – leads the credit impulse by six months (Chart 2, top panel). The former has stabilized but has not yet turned up. Hence, in the near term, the credit impulse will be stabilizing at very low levels but will not revive materially until spring 2022. This entails more growth disappointments in China’s old economy (Chart 2, bottom panel). In turn, the average of the manufacturing PMI’s new orders and backlog of orders series heralds more downside in EM non-TMT share prices (Chart 3). Chart 2China: An Economic Revival Is Not Imminent
China: An Economic Revival Is Not Imminent
China: An Economic Revival Is Not Imminent
Chart 3EM Non-TMT Stocks Remain At Risk
EM Non-TMT Stocks Remain At Risk
EM Non-TMT Stocks Remain At Risk
Property construction will not recover quickly. Marginal easing of real estate regulations and restrictions will not be sufficient to revive animal spirits among property developers and buyers. As we argued in a recent special report on the property market, real estate in China benefited from the biggest carry trade in the world over the past decade. With borrowing costs below the pace of house price appreciation, property developers in China have done what any business would do: they borrowed as much as they could and accumulated real estate assets in the forms of land, incomplete construction, and completed but unsold properties. Chart 4The Carry Trade In China's Real Estate
The Carry Trade In China's Real Estate
The Carry Trade In China's Real Estate
The top panel of Chart 4 illustrates that developers have been starting many more projects than they have been completing. As a result, their unfinished construction has ballooned (Chart 4, bottom panel). Such a business model was profitable since developers’ borrowing costs were below the pace of real estate asset price appreciation. This dynamic will reverse going forward: real estate asset price appreciation will be below developers’ borrowing costs. Thus, property developers have every incentive to shed their assets as quickly as possible. This will discourage new land investment and new construction. In brief, odds are rising that the property market downtrend will be an extended one. In 2015, when property inventories swelled (Chart 4, bottom panel), it took outright monetization of residential properties by the PBOC through the PSL program1 to revive real estate demand and construction. Currently, anything short of aggressive monetization or a very large policy boost will be insufficient to reignite property market sentiment. Thus, the real estate market will continue to struggle. Chart 5 illustrates that real estate developer financing has dried up, heralding a significant contraction in floor space completion, i.e., construction activity. This will weigh on industrial commodities (Chart 5, bottom panel). Even if the government approves a larger special bond quota for local governments, traditional infrastructure spending is unlikely to accelerate meaningfully (Chart 6). The basis is that local governments will continue facing financing constraints from an ongoing slump in their land sales. The RMB 3.65 trillion special bond issuance quota in 2021 accounted for only 18% of local government on- and off-budget revenues. Meanwhile, land sales by local governments account for 40% of their on- and off-budget revenues. As the property market travails continue, local governments will not be able to materially increase traditional infrastructure spending. Chart 5Less Funding = Less Completions = Less Commodity Demand
Less Funding = Less Completions = Less Commodity Demand
Less Funding = Less Completions = Less Commodity Demand
Chart 6China: Traditional Infrastructure Has Been Weak
China: Traditional Infrastructure Has Been Weak
China: Traditional Infrastructure Has Been Weak
In sum, the Chinese economy has developed formidable downward momentum that will not be easy to reverse. That said, authorities will likely begin injecting more stimulus in 2022 to secure a stable economy and financial markets in the second half of 2022, ahead of the important Party Congress. Bottom Line: The slowdown in the Chinese old economy will continue for now with negative ramifications for China-related financial markets. A buying opportunity for China plays leveraged to its old economy is likely sometime in 2022. Chinese Internet Stocks Chart 7Chinese Internet Stocks Are Not Cheap
Chinese Internet Stocks Are Not Cheap
Chinese Internet Stocks Are Not Cheap
The outlook for Chinese TMT stocks remains uninspiring. We maintain that the regulatory changes affecting Chinese internet stocks are structural rather than cyclical in nature. There could be periods when the pace of regulatory clampdown eases, but these regulations will not be rolled back in any meaningful way. While Chinese platform companies’ equity valuations have already de-rated, these stocks are not cheap: their trailing and forward P/E ratios stand at 35 and 30, respectively (Chart 7). Their multiples will compress further for the following reasons: Their business models have to change because of regulatory requirements. Higher uncertainty about their future business models currently entails a higher equity risk premium. Authorities will cap these companies’ profitability like regulators do with monopolies and oligopolies, which heralds a lower return on equity. In addition, in line with the common prosperity policy, these companies will perform social duties – redistributing profits from shareholders to the society. All these will lower their profitability, warranting permanently lower multiples than those in the past 10 years. Beijing’s involvement in their management and the prioritization of national and geopolitical objectives over shareholder interests will lead foreign investors to dis-invest from these companies. Some large companies face non-trivial risks of delisting from the US. Last week, Beijing reportedly asked Didi to delist from the US due to concerns over its data security. For very different reasons, US and Chinese authorities do not want Chinese companies to be listed in the US. And when Chinese and US authorities do not want to see some of these stocks listed in the US, they will not be. Odds are rising that a few of them might be delisted in the coming years. In such a scenario, US institutional investors will offload their holdings of these companies. Chart 8China: Online Retail Sales Have Slowed Down
China: Online Retail Sales Have Slowed Down
China: Online Retail Sales Have Slowed Down
In addition to the risk to multiples, these internet companies’ profits are also under threat. Chart 8 shows that online retail sales of goods and services have been lackluster compared to their torrid pace in the past 10 years. Bottom Line: The path of least resistance for Chinese internet/platform share prices remains down. Mainstream EM Economies In the majority of EM economies ex-China, Korea and Taiwan (herein referred to as mainstream EM), domestic demand will remain in the doldrums in H1 2022: Monetary policy has tightened in Latin America and Russia while real interest rates are elevated/restrictive in the ASEAN region. In countries where central banks have been hiking rates, domestic demand is bound to decelerate (Chart 9, top panel). In fact, domestic demand remains below pre-pandemic levels in many mainstream EMs (Chart 9, bottom panel). Rate hikes and/or high borrowing costs in real terms will continue to weigh on money and credit growth. The annual growth rates of broad money and bank loans have already reached record lows in both nominal and real terms (Chart 10). These are equity market-weighted aggregates for EM ex-China, Korea and Taiwan. Chart 9Mainstream EM: Domestic Demand Is At Risk Of A Relapse
Mainstream EM: Domestic Demand Is At Risk Of A Relapse
Mainstream EM: Domestic Demand Is At Risk Of A Relapse
Chart 10Mainstream EM: Tepid Money And Credit Growth
Mainstream EM: Tepid Money And Credit Growth
Mainstream EM: Tepid Money And Credit Growth
Chart 11Mainstream EM: No Fiscal Reprieve In 2022
Mainstream EM: No Fiscal Reprieve In 2022
Mainstream EM: No Fiscal Reprieve In 2022
For the same universe, the fiscal thrust in 2022 will be around -1% of GDP (Chart 11). Chart 12 illustrates the 2022 fiscal thrust – defined as the yearly change in the cyclically adjusted budget deficit – for individual countries. Only Turkey is projected to have a small positive fiscal thrust next year.
Chart 12
The slowdown in China’s old economy will weigh on Asian economies and commodity producers elsewhere. Table 1 demonstrates that China is the top destination for Asian and commodity producing economies’ exports. Finally, political uncertainty and volatility will remain high in Latin America while geopolitical tensions will linger and escalate from time to time around Russia and Taiwan. We do not think political and geopolitical risks are fully reflected in these financial markets. This leaves these bourses vulnerable to these risks. Bottom Line: Economic growth in mainstream EM economies will disappoint, at least in H1 2022. What We Are Looking To Turn Bullish On EM Assets? Equities: A combination of the following will make us consider issuing a buy recommendation on EM equities: Significant stimulus in China leading to a strong recovery in its credit impulse (shown in Chart 2 above). A rollover in Latin America’s core inflation that will open the door for monetary policy easing in these economies. Regarding indicators, we would need to see all three of the following: EM M1 growth accelerates (Chart 13) Analysts’ net EPS expectations drop to their previous lows (Chart 14) Investor sentiment on EM equities declines to its previous lows (Chart 15). EM equity valuations are neutral in absolute terms. When valuations are neutral, share prices could rise or fall. In these cases, the profit cycle is the key driver of share prices. EM equity market cap-weighted narrow money (M1) growth suggests that EM EPS growth will decelerate well into 2022 (Chart 13 above). Such a profit slump is not yet priced in according to Chart 14. Chart 13An EM Profit Slump Is Imminent
An EM Profit Slump Is Imminent
An EM Profit Slump Is Imminent
Chart 14Analysts Are Not Pricing In An EM Profit Slump
Analysts Are Not Pricing In An EM Profit Slump
Analysts Are Not Pricing In An EM Profit Slump
Chart 15Investor Sentiment On EM Stocks Is Not Downbeat
Investor Sentiment On EM Stocks Is Not Downbeat
Investor Sentiment On EM Stocks Is Not Downbeat
Chart 16Mainstream EM Currencies: Spot And Total Return Indexes
Mainstream EM Currencies: Spot And Total Return Indexes
Mainstream EM Currencies: Spot And Total Return Indexes
Exchange Rates: The mainstream EM equity market cap-weighted currency spot rate versus the US dollar is not far from its 2020 spring lows. On a total return basis – when carry is taken into account – mainstream EM currencies are still above their March 2020 lows (Chart 16). Chart 17Mainstream EM: Real Effective Exchange Rates
Mainstream EM: Real Effective Exchange Rates
Mainstream EM: Real Effective Exchange Rates
Critically, EM currencies are not particularly cheap (Chart 17). Given the lingering headwinds, they are likely to depreciate further. The mainstream EM aggregate real effective exchange rate will likely drop to one or two standard deviations below its mean before these currencies find a bottom (Chart 17). Barring a scenario in which the Omicron variant becomes a major drag on the US economy, the Federal Reserve will maintain its recent hawkish rhetoric due to rising core US inflation. This will support the US dollar and weigh on EM currencies. If Omicron produces a major selloff in financial markets, EM currencies will depreciate. In a nutshell, weak domestic demand and return on capital, political volatility, a slowdown in China and potentially lower commodity prices will all continue depressing EM currencies in the early months of 2022. In the following section about local rates, we list signposts that will make us turn positive on EM currencies Local Rates: EM local rates have gone up a great deal and they offer good value. However, as long as EM currencies do not find a floor, interest rates in high-yield local bond markets will not decline. Critically, US dollar returns on EM local currency bonds are primarily determined by exchange rates. Hence, a buying opportunity for international investors in EM high-yield local bonds will coincide with a bottom in their currencies. We recommend turning positive on mainstream EM currencies versus the US dollar if two out of these three conditions are met: The Fed abandons its intention to hike rates. Significant stimulus in China leading to a strong recovery in its credit impulse Mainstream EM’s aggregate real effective exchange rate drops more than one standard deviation below its mean (Chart 17). Chart 18EM Credit Spreads Are Driven By The EM Business Cycle And Currencies
EM Credit Spreads Are Driven By The EM Business Cycle And Currencies
EM Credit Spreads Are Driven By The EM Business Cycle And Currencies
Credit Markets: As we discussed in a report published earlier this year titled A Primer on EM USD Bonds, the two key drivers of EM sovereign and corporate credit spreads are economic growth and the exchange rate (Chart 18). A positive turn on the EM/China business cycles and their currencies will make us immediately bullish on EM sovereign credit. As for high-yield Chinese USD property developers’ bonds, they are not a buy given their extremely high indebtedness and the dismal outlook for real estate. Investment Strategy Odds are that there will be a buying opportunity in EM equities, fixed income and currencies in 2022. The checklists we highlighted above outline what we will be monitoring to make us turn positive on EM equities, local rates, exchange rates and credit. Our current investment stance is as follows: There is likely to be more downside in EM equities in absolute terms. They will also continue underperforming their DM peers. We downgraded EM equities from neutral to underweight on March 25, 2021 and this strategy remains intact. Within the EM benchmark, our overweights are Korea, Singapore, China (favoring A shares over investable stocks), Vietnam, Russia, central Europe and Mexico. Our equity underweights are Brazil, Chile, Peru, Colombia, South Africa, Turkey and Indonesia. We recommend a neutral allocation to all other bourses in mainstream EM. A word on India, Korea and Mexico is warranted. We will publish a report on India next week. Concerning our overweight in the Korean bourse, lower DRAM prices and China’s slowdown have weighed on its performance in 2021 (Chart 19). However, weakness in semiconductor prices will prove to be short lived as the semiconductor industry is in a structural upswing. Besides, Korea and Mexico are two countries in the EM universe that will benefit from the US industrial boom – one of our major multi-year themes. Chart 20 shows that Korea’s relative equity performance versus the overall EM benchmark closely tracks global industrials relative share prices versus global non-TMT stocks. Chart 19A Soft Spot In The DRAM Industry
A Soft Spot In The DRAM Industry
A Soft Spot In The DRAM Industry
Chart 20Overweight The KOSPI Within The EM Equity Space
Overweight The KOSPI Within The EM Equity Space
Overweight The KOSPI Within The EM Equity Space
The path of least resistance for EM currencies versus the US dollar is presently down. We continue to recommend shorting the following basket of EM currencies versus the US dollar: BRL, CLP, COP, PEN, ZAR, KRW, THB and PHP. Last week, we recommended adding the Indonesian rupiah to this list and today we are booking profits on the short position in TRY. The currencies that we currently favor are CNY, INR, MYR, SGD, TWD, RUB, CZK and MXN. In local rates, we have been betting on the yield curve flattening in Mexico and Russia, have been recommending receiving 10-year swap rates in China and Malaysia as well as paying 10-year rates in the Czech Republic. In the EM credit space, we continue to recommend underweighting EM versus US corporate credit, quality adjusted. As with equities, we downgraded this allocation from neutral to underweight on March 25, 2021. Within the EM credit space, we favor sovereign versus corporate credit, quality adjusted. For EM sovereign credit and domestic bond portfolios, our recommended allocations across various countries are shown in the tables enclosed below. Finally, today we are closing our volatility trades: long EM equity volatility and EM currency volatility. Both positions were initiated on February 4, 2021 and have been profitable. Arthur Budaghyan Chief Emerging Markets Strategist arthurb@bcaresearch.com Footnotes 1Pledged Supplementary Lending was in effect in 2014-2018: The PBOC lent at very low interest rates to the three policy banks who in turn re-lent to local governments and regional property developers (mainly in tier-2 and smaller cities). These entities then bought slums from their owners, putting cash in their hands to purchase new and better properties. Equities Recommendations Currencies, Credit And Fixed-Income Recommendations
Highlights Investors and consumers expect that inflation will remain quite high over the next year, but they are unconcerned that upward price pressures will last: According to surveys and market prices, inflation will exceed 4% next year before subsiding over the longer term to the comfortable levels of the last two decades. The Fed also views elevated inflation as a near-term phenomenon and accordingly expects to hike the fed funds rate at a deliberate pace: The Fed is on the same page as the hoi polloi, and is not gearing up to remove accommodation with any particular haste. While the decade following the financial crisis demonstrated that extremely easy monetary policy does not by itself promote high inflation, the landscape has changed: A decade of ZIRP and QE failed to produce any dire effects, but it remains to be seen how extreme monetary and fiscal accommodation will interact. We expect the bull market will end once the Fed falls behind the curve on inflation and is forced to tighten monetary policy aggressively to catch up: We think the bull has another year to run, but excessive stimulation will eventually bring about its demise. Feature For most of the year, every discussion with our investor-clients has eventually worked its way around to inflation. How high is it going to go? How long will it last? What will it mean for the economy? What will it mean for stocks? How will the Fed react? As the year-over-year change in the Consumer Price Index has climbed steadily higher, breaking above 6% last month for the first time in 31 years (Chart 1), the tenor of the conversations has shifted. Investors have come to recognize that the economy is subject to upward price pressures that are more than the temporary by-product of pandemic base effects. Inflation is nonetheless still largely viewed as a temporary phenomenon that will fade once reopening supply bottlenecks can be resolved. While markets are resigned to another year of high inflation, they are secure in the notion that the disinflationary currents of the last several decades will squelch them over the longer term. Chart 1Long Time, No See
Long Time, No See
Long Time, No See
The tension between the competing ideas that both inflationary and disinflationary currents are real sets up a potential market showdown. If it is only a matter of time before disinflationary forces return to smother today’s post-COVID disruptions, the widely shared consensus view that the fed funds rate will meander its way to a peak of 2% will be validated. The equity bull market will continue, albeit at a slower pace, until it dies of natural causes. Markets could be in for a rude awakening, however, if the forces supporting higher prices outlast the pandemic and overcome the long-running disinflationary trend. This report considers how inflation could ruin the party. Our base-case view is that the Fed will find itself behind the curve. When it does, it will be forced to tighten monetary policy fast and furious, moving more swiftly to a higher terminal fed funds rate than markets currently expect. That will bring down the curtain on the bull market in risk assets and it may also spark the next recession, but we think the good times will last for at least one more year. What Markets Expect: Inflation Despite all the attention higher prices have drawn, investors haven’t gotten too worked up over them. Although they’ve made considerable revisions to their near-term expectations, their expectations for inflation ten years from now haven’t budged since the start of the year. As the Treasury1 (Chart 2) and CPI swaps (Chart 3) markets show, big consumer price increases are expected to be concentrated in the next year, come off the boil in year two and then slowly cool over the next few years. At the back half of the 10-year curve, year-over-year CPI increases are expected to settle into the range that prevailed during the nineties’ and early 2000s’ inflation moderation.
Chart 2
Chart 3
Financial markets do not exist in a vacuum, of course, and the expectations of participants in the real economy matter as well. The University of Michigan’s consumer survey indicates that households’ expectations accord with financial markets’ (Chart 4): inflation will be uncomfortably high over the next year but an afterthought five years from now. Whether the phenomenon is called adaptive expectations or recency bias, everyone’s – investors’, consumers’, businesses’, and economists’ (Chart 5) – expectations of the future are colored by the recent past. It is not a stretch to envision consumer prices rising by more than 4% in 2022 after having watched them surge since March, but apparently economic participants will need to see them remain elevated for a longer stretch before they can picture inflation enduring for two or three years, much less five to ten years. Chart 45% Now, But Only 3% Later
5% Now, But Only 3% Later
5% Now, But Only 3% Later
Chart 5Reliably Anchoring To The Recent Past
Reliably Anchoring To The Recent Past
Reliably Anchoring To The Recent Past
What Markets Expect: Fed Policy Chart 6Faster, Yes; Farther, No
Faster, Yes; Farther, No
Faster, Yes; Farther, No
If inflation isn’t expected to persist at an elevated rate for an extended period, there’s no reason to expect that the Fed will aggressively tighten monetary policy. Higher-than-expected inflation readings have led money markets to bring their first rate hike ETA (the liftoff date) forward to next July, and to price in two rate hikes in the second half of next year (Chart 6, top panel). They continue to expect that the Fed will conclude its tightening cycle once the fed funds rate is around 2% (the terminal rate). They also expect that the Fed will take its time getting to that terminal rate, hiking by no more than 75 basis points (“bps”) in a single year (Chart 6, bottom two panels), roughly in line with the 100-bps annual pace of 2017 and 2018. The Fed concurs. As per the latest Summary of Economic Projections (SEP), released after the September FOMC meeting, the 18 board members and regional presidents casting votes expect the FOMC to take its time hiking rates. With exactly half of the voters calling for no rate hikes next year, the median and mean expectations were for one-half and two-thirds of a 25-bps rate hike in 2022, respectively (Chart 7A). By the end of 2023, the median and mean SEP voter expects a cumulative 3.5 and 3.1 25-bps rate hikes, respectively (Chart 7B). By the end of 2024, median and mean expectations are for a cumulative 6.5 and 6.1 25-bps rate hikes, respectively (Chart 7C).
Chart 7
Chart 7
Chart 7
Table 1Same Terminal Rate, Different Liftoff Date
How Will The Party End?
How Will The Party End?
Conditions have changed since late-September upon the release of September and October inflation data, though Chair Powell didn’t give any ground in his press conference following the November 3rd meeting. Rounding the expectations at each year-end period as of the September 22nd meeting, the median SEP voter expected zero or one rate hike in 2022, three in 2023 and three in 2024, pushing the top end of the fed funds rate range to 2% as of the end of 2024. Market expectations have moved since the last SEP, with the overnight index swap curve going from zero rate hikes in the next twelve months to two, and from two rate hikes in the next 24 months to five, but financial markets and the Fed remain on the same page (Table 1). A Kinder, Gentler Fed Emboldened by the experience of the last expansion, in which worrisome inflation did not materialize despite a zero fed funds rate and 50-year lows in unemployment, the Fed has embarked on a course quite different from the one the late Paul Volcker might have charted. Nagged by persistently low post-crisis inflation, the FOMC has decided that pursuing an average inflation target that makes up for previous shortfalls will best allow it to meet its price stability mandate. Letting undershoot bygones be bygones paved the way for inflation expectations to slide, constraining its ability to stimulate the economy at the zero bound. To re-anchor expectations in its preferred 2.3-2.5% range, and give a zero fed funds rate more zip, the FOMC must convince markets that it will occasionally let inflation run hot. A more aggressive pursuit of its full employment mandate, as outlined in the August 2020 revisions to the FOMC’s Statement on Longer-Run Goals and Monetary Policy Strategy, should also help nudge expectations upward. Per the revisions commentary on the Fed’s website, “The previous expansion demonstrated that a strong labor market can be sustained without inducing an unwanted increase in inflation. To the contrary, when unemployment fell to levels that were previously thought to be unsustainable, the labor market proved remarkably adaptable, bringing many benefits to families and communities that all too often had been left behind. Accordingly, the new Statement … only … [pledges to address] ‘shortfalls of employment from its maximum level’ rather than the [previous] ‘deviations from its maximum level’[.] This change signals that high employment, in the absence of unwanted increases in inflation or the emergence of other risks that could impede the attainment of the Committee’s goals, will not by itself be a cause for policy concern.”2 The Fly In The Ointment Chart 8Wall Street And Main Street
Wall Street And Main Street
Wall Street And Main Street
While we acknowledge that the September 22nd SEP may be somewhat out of date as a guide to the board members’ and regional presidents’ fed funds rate expectations, the easier stance outlined in the revised monetary policy strategy statement remains very much in effect. The upshot, from our perspective, is that the FOMC intends to be behind the inflation curve in the coming rate-hiking cycle. If inflation remains contained after lingering pandemic dislocations are resolved, the behind-the-curve takeaway will not be all that impactful for investors. After all, those who positioned for dollar debasement and runaway inflation when the Bernanke Fed introduced QE and ZIRP were clobbered by investors who loaded up on risk assets and blithely rode easy money tailwinds higher. There is a critical difference this time, however, beyond the increasing magnitude of the Fed’s accumulated asset purchases. Pandemic fiscal stimulus has dwarfed the comparatively meager fiscal response to the global financial crisis. And going forward, the Biden administration’s spate of ambitious spending proposals contrasts sharply with the Obama administration’s deficit reduction focus. The post-crisis era has served as a natural experiment on the effects of unprecedented monetary accommodation on economic activity and consumer price inflation. Asset prices surged, buoyed by a negative real fed funds rate and a ballooning Fed balance sheet (Chart 8, top panel), but the rate of growth in consumption (Chart 8, bottom panel) was unchanged. Although household net worth gains lead consumption growth, the vast majority of financial assets are held by households with a low marginal propensity to consume. Asset price inflation doesn’t necessarily lead to consumer price inflation because it doesn’t necessarily have an observable impact on aggregate demand. Fiscal stimulus is different, however. The stimulus packages created to counter the economic effects of COVID-19 put money directly in the hands of households with high marginal propensities to consume. They have been consuming avidly since emerging from their spring 2020 lockdowns (Chart 9) and we expect that they will continue to do so until they’ve run down at least one half of their $2.3 trillion of excess pandemic savings. Rising wages may additionally promote demand, as will the baby boomers’ shift into their peak consumption years, along with the massive investment required to meet green energy goals. Chart 9Consumers Have Momentum (And The Savings And Borrowing Capacity To Sustain It)
Consumers Have Momentum (And The Savings And Borrowing Capacity To Sustain It)
Consumers Have Momentum (And The Savings And Borrowing Capacity To Sustain It)
Demand was sluggish for an entire decade following the GFC, but it appears as if it will be quite robust for a while after the pandemic. We believe that aggregate demand is on a course to exceed aggregate supply after reopening supply chain issues are resolved. At that point, the transitory inflation view will no longer be credible, and the Fed may find itself having to play catch up. When it does, it will have to hike rates more and faster than financial markets expect. Once the Fed has shifted into fast and furious mode, or markets develop a widespread conviction that it will, the bull markets in risk assets will end and the expansion might, too. In the meantime, setting investment strategy will depend on how long it takes for the inflation inflection point to arrive. We do not yet think the inflection point is in sight and therefore continue to recommend that investors with a twelve-month timeframe overweight equities and credit in multi-asset portfolios. We remain on the alert, however, and will shift our view if events move faster than we currently expect. We would rather leave some upside on the table than stay at the party too long. Doug Peta, CFA Chief US Investment Strategist dougp@bcaresearch.com Footnotes 1 Off-the-run Treasury maturities do not trade all that well, and TIPS other than 1-, 2-, 5- and 10-year maturities are even less liquid. The TIPS inflation expectations curve (Chart 2) is therefore less reliable than the CPI swaps curve (Chart 3) at individual points, but it confirms the broad direction of investors’ inflation expectations. 2 Question 6, How has the review altered how the Federal Reserve will pursue its maximum employment objective? Accessed November 22, 2021. Emphasis added. Federal Reserve Board - Q&As.
Highlights There are a few consistencies with the dollar breakout. Global growth is peaking and the risk of a significant slowdown early next year has risen. As a momentum currency, further gains in the DXY remain very high in the near term. We are shifting our near-term target to 98 (previously 95). That said, the dollar is now close to pricing a global recession, which seems improbable given easy monetary settings and ample fiscal stimulus. High inflation is not a US-centric phenomenon but a global problem. This means that monetary policy in the US cannot sustainably diverge from other central banks. Correspondingly, low US TIPS yields do not confirm the breakout in the dollar. Even if the US 10-year Treasury yield rises towards 2.5%, real interest rates will remain very low compared to history and other G10 economies. While global growth will slow next year, we expect that it will remain robust. And if it rotates from the US to other countries, the dollar will have a very sharp reversal. Our strategy is to stick with trades at the crosses rather than outright dollar bets. These include long AUD/NZD, long CHF/NZD, long EUR/GBP and long a petrocurrency basket versus the euro. Once the majority of our technical indicators start to flag a reversal, we would be sellers of the DXY and buyers of EUR/USD. Feature Chart I-1The Dollar Diverges From Real Rates
The Dollar Diverges From Real Rates
The Dollar Diverges From Real Rates
After spending most of this year range bound between 89 and 94, the DXY index has broken out. The narrative has been centered around rising US inflation, which will trigger much faster interest rate increases from the Fed. This is consistent with recent economic data, where US inflation has indeed blown out, and is also rising at the fastest pace among G10 countries. What has been inconsistent is that US TIPS yields remain very low, and have diverged from the broad dollar trend (Chart I-1). One of the key structural drivers of currencies is real interest rate differentials. If the Fed does move ahead of the inflation curve and aggressively hikes interest rates, then US TIPS yields will rise and catch up with the dollar. Otherwise, the recent rise in the greenback could represent a capitulation phase that will quickly reverse should the inflationary mania subside. Consistencies With The Dollar Rise The market is now pricing in that the Fed will raise interest rates much faster, compared to earlier this year. According to the overnight index swap (OIS) curve, the Fed is now expected to lift rates at least twice by December 2022, compared to earlier this year (Chart I-2). Meanwhile, market pricing is even more aggressive when looking at the December 2022 Eurodollar contract, relative to either the Euribor contract (European equivalent) or Tibor (Japanese equivalent). The market suggests that compared to earlier this year, a 63bps spread difference is now warranted between US and European interest rates, while an 80bps difference is appropriate vis-à-vis Japanese rates. This shift perfectly explains the move in the dollar over the last few weeks (Chart I-3). Chart I-2Markets Now Expect A More Hawkish Fed
Markets Now Expect A More Hawkish Fed
Markets Now Expect A More Hawkish Fed
Chart I-3A Key Driver Of The Dollar Rally
A Key Driver Of The Dollar Rally
A Key Driver Of The Dollar Rally
These market moves have been consistent with economic developments. Upside economic surprises in the US have dominated other G10 economies and supported the dollar (Chart I-4). The slowdown in China has been another hiccup in the global growth story. While global export growth has remained relatively resilient, the narrative is that the slowdown in Chinese demand is metastasizing into a genuine slump that will impact commodity import demand and hurt procyclical currencies liked the AUD (Chart I-5). Chart I-4Positive Economic Surprises Have Supported A Strong USD
Positive Economic Surprises Have Supported A Strong USD
Positive Economic Surprises Have Supported A Strong USD
Chart I-5A Slowing China Has Hurt Currencies Like The AUD
A Slowing China Has Hurt Currencies Like The AUD
A Slowing China Has Hurt Currencies Like The AUD
The slowdown is not unique to China. With new Covid-19 infections surging in various European countries, ex-US economic data is likely to remain underwhelming early next year. Within this context, the US economy remains relatively immune. Exports explain only 10% of US GDP. The IMF projects that the US is one of the first countries to close its output gap (Chart I-6). This will support a tighter monetary stance in the US, compared to other G10 countries.
Chart I-6
Contradictions With The Dollar Rally There are a few contradictions with the dollar rally. First, the Fed is already lagging the US inflation curve. Various DM and EM central banks have calibrated monetary policy higher in response to rising inflation (Chart I-7). While the Fed might accelerate the pace of tapering asset purchases, other central banks in developed economies have already ended QE and are raising rates. At some point, relative monetary policies would matter for currencies, as has historically been the case. Since the start of the year, market pricing for higher rates according to the OIS curve has been lifted for most G10 countries (Table 1). Yet the dollar has rallied, while other currencies have collapsed (Chart I-8). Chart I-7Many Central Banks Are Already Hiking Interest Rates
Many Central Banks Are Already Hiking Interest Rates
Many Central Banks Are Already Hiking Interest Rates
Chart I-
Chart I-8Will The Fed Hike As Much As Is Priced By The Dollar?
Will The Fed Hike As Much As Is Priced By The Dollar?
Will The Fed Hike As Much As Is Priced By The Dollar?
Second, part of that rally has been driven by speculative inflows, and not by underlying economic fundamentals. Net speculative positions in the US dollar are near levels that have usually signaled that the trade is becoming much crowded (Chart I-9). As we highlighted in Chart 1, this has occurred amidst very low nominal and real interest rates. But more importantly, as a reserve currency, the dollar enjoys the priviledge of being the safe-haven asset of choice. It is quite plausible that one of the key drivers of the rally has also been hedging by fund managers for an equity market correction (Chart I-10). Chart I-9Speculators Are Nearing Exhaustion ##br##Levels
Speculators Are Nearing Exhaustion Levels
Speculators Are Nearing Exhaustion Levels
Chart I-10Long Dollar Is Being Used To Hedge Bullish Equity Bets
Long Dollar Is Being Used To Hedge Bullish Equity Bets
Long Dollar Is Being Used To Hedge Bullish Equity Bets
Third, inflation could indeed prove to be transitory. Our sister publication, the Commodity & Energy Strategy, suggests that metals and oil prices will remain well bid in the near term. Inflation however is about rates of change. Natural gas prices rose 100% this year while oil prices rose 60%. Market expectations are that these prices will roll over (Chart I-11). The Baltic Dry Index, a proxy for shipping costs and supply bottlenecks, initially rose 300% and is now down 53% from its peak. A middle ground where prices remain well bid but do not generate the same inflationary impulse next year seems most plausible. This will ease all market expectations for central bank hawkishness, but could sound the death knell for the dollar that has quickly moved to price in the current market narrative. Chart I-11Some' Inflation Will Be Transitory
Some' Inflation Will Be Transitory
Some' Inflation Will Be Transitory
Fourth, a strong US dollar hurts US growth. According to the Fed’s own estimates, a 10% rise in the dollar reduces US growth by 0.5% in the subsequent four quarters and 1.2% over two years. Meanwhile, a strong US dollar will certainly alleviate pressure on the Fed to fight inflation. A Counterpoint View To The Market Narrative Covid-19 will be with us for a while. As such, the volatility of growth forecasts around infection waves will subside. The remarkable thing is that despite fears of a global growth slowdown, there is a pretty robust expectation that the US will fare poorly relative to other developed markets in terms of growth next year. Countries such as Canada, New Zealand, the UK, and Japan are seeing a bottoming in growth momentum relative to the US (Chart I-12). For some, this is occurring at the same time as their local central banks are becoming more orthodox about monetary policy. As we have argued earlier, this is clear real-time evidence that the Fed will lag the inflation curve. Chart I-12AA Global Growth Rebound Outside The US
A Global Growth Rebound Outside The US
A Global Growth Rebound Outside The US
Chart I-12BA Global Growth Rebound Outside The US
A Global Growth Rebound Outside The US
A Global Growth Rebound Outside The US
One key signpost is China. It has tightened policy amidst very low inflation, and the traditional relationship between real rates and the RMB is working like a charm as the currency appreciates in trade-weighted terms. In a nutshell, currency markets tend to reconverge with real interest rate differentials over time. This will eventually be the case with the dollar (Chart I-13). Chart I-13Real Interest Rates Eventually Matter For Currencies
Real Interest Rates Eventually Matter For Currencies
Real Interest Rates Eventually Matter For Currencies
Finally, China might marginally ease policy to sustain growth. In our view, China could stand pat since nominal bond yields are falling and exports are robust suggesting overall financing conditions are not a problem. But if this is a primate cause for fuelling long dollar bets, that will eventually hurt EM demand, China could also shift. This will be bullish for the dollar in the near term (it will require a riot point for China to shift), but bearish the dollar over a cyclical investment horizon, as commodity economies bottom. Investment Strategy Chart I-14Current Dollar Strength Is Pricing In A Manufacturing Recession
Current Dollar Strength Is Pricing In A Manufacturing Recession
Current Dollar Strength Is Pricing In A Manufacturing Recession
In the current environment, the DXY could hit 98. This will be consistent with a blowout in our capitulation index, as well an exhaustion of dollar bulls. That said, the dollar is now close to pricing a global manufacturing recession, which seems improbable given easy monetary settings and ample fiscal stimulus in most DM economies (Chart I-14). Our strategy is to stick with trades at the crosses rather than outright dollar bets. These include long AUD/NZD, long CHF/NZD, long EUR/GBP and long a petrocurrency basket versus the euro. Once the majority of our technical indicators start to flag a reversal, we would be sellers of the DXY and buyers of EUR/USD. Finally, our agnostic trading model continues to suggest short dollar positions (Chart I-15). Admittedly, it is the valuation component driving the calibration, rather than sentiment or appreciation for the investment shift in the macro narrative. In our portfolio, we will sit on the sidelines until most of our intermediate-term indicators stage a reversal. Chart I-15AOur Model Is Short The Dollar, But Stand Aside For Now
Our Model Is Short The Dollar, But Stand Aside For Now
Our Model Is Short The Dollar, But Stand Aside For Now
Chart I-15BOur Model Is Short The Dollar, But Stand Aside For Now
Our Model Is Short The Dollar, But Stand Aside For Now
Our Model Is Short The Dollar, But Stand Aside For Now
Chester Ntonifor Foreign Exchange Strategist chestern@bcaresearch.com Trades & Forecasts Strategic View Cyclical Holdings (6-18 months) Tactical Holdings (0-6 months) Limit Orders Forecast Summary
Highlights Long-term investors should place up to 5 percent of their assets in cryptocurrencies. As the drawdown risk of owning cryptocurrencies converges with that of owning gold, the cryptocurrency asset-class can reasonably displace gold to take half of the $12 trillion anti-fiat investment market… … with BTC, ETH, and the others taking a third of this half – $2 trillion – each. This means that BTC would double to $120,000, while ETH would quadruple to $17,000. Some embryonic blockchain tokens could do even better. In this list of potentials, we would put Solana, Cardano, XRP, and Polkadot. Underweight gold relative to the other precious metals. As cryptocurrencies eat more of gold’s lunch, gold is set to become a pale shadow of its former self. Fractal analysis: Coffee and Cameco. Feature Chart of the WeekCryptos Are Eating Gold's Lunch... And There's Plenty More To Eat
Cryptos Are Eating Gold's Lunch... And There's Plenty More To Eat
Cryptos Are Eating Gold's Lunch... And There's Plenty More To Eat
If you’re wondering just how the market value of cryptocurrencies has surged to $2.5 trillion today from $0.5 trillion barely eighteen months ago, there’s a simple answer. Cryptocurrencies have eaten gold’s lunch – displacing almost $2 trillion from the investment value of the yellow metal. And that’s just so far… Given that the investment value of gold still stands at $9.5 trillion, there is plenty more of gold’s lunch that cryptocurrencies can eat (Chart of the Week). As Mark Twain might put it, rumours of crypto’s demise have been greatly exaggerated. When cryptocurrency prices corrected by 50 percent in May this year, the obituary writers got busy. For the 419th time. But since their birth in 2007, every time that they have ‘died’, cryptocurrencies have proved their detractors wrong, with prices quickly resurrecting and reaching new highs. We expect this pattern to continue (Chart I-2). Chart I-2Rumours Of Crypto's Demise Have Been Greatly Exaggerated
Rumours Of Crypto's Demise Have Been Greatly Exaggerated
Rumours Of Crypto's Demise Have Been Greatly Exaggerated
Cryptocurrencies And Blockchains Are Joined At The Hip To understand the investment case for cryptocurrencies, it is important to realise that the success of a cryptocurrency and the success of its blockchain are inextricably linked. Yet what confuses this matter is that for the best known cryptocurrency of all – Bitcoin – the relationship between the cryptocurrency and its blockchain is ‘back-to-front’. Bitcoin is first and foremost a cryptocurrency BTC, which is secured (against double-spending) by its blockchain network. Meaning that BTC is the main act, and the Bitcoin blockchain is the supporting act. However, for most other cryptocurrencies, the opposite is true. The blockchain is the main act, and the cryptocurrency is the supporting act. For example, Ethereum is first and foremost a blockchain network – a decentralised intermediator of services such as smart-contracts or bond-issuance through decentralised finance (DeFi). Note that over $5 billion of bonds have already been issued on Ethereum and other blockchains, including by the European Investment Bank, the World Bank, and the Bank of China. The users of the Ethereum intermediation services pay the users of Ethereum that validate them in its cryptocurrency, ETH. Crucially, this ability to exchange ETH (and other cryptocurrencies) for intermediation services on the associated blockchain gives the cryptocurrency an economic utility. This economic utility means that the cryptocurrencies of successful blockchain networks can be thought of as ‘digital gold’. Gold derives its utility from its physical attributes – beauty, wear-ability, and electrical conductivity. Whereas, the cryptocurrencies of successful blockchains derive their utility from their means of exchange for the useful intermediation services that the blockchains provide. Furthermore, just as governments and central banks cannot determine the supply of gold, neither can they determine the supply of successful cryptocurrencies. This last point is important because most of the current value of gold comes not from its beauty, wear-ability, and electrical conductivity, but from its investment value as a hedge against the debasement of fiat money. The immediate investment case for cryptocurrencies is that they are set to displace much of this investment value from gold (Chart I-3). Chart I-3Cryptocurrencies Are Displacing Gold's Investment Value
Cryptocurrencies Are Displacing Gold's Investment Value
Cryptocurrencies Are Displacing Gold's Investment Value
Cryptocurrencies Are Displacing Gold As The Anti-Fiat Hedge. Gold is scarce, but we can quantify its scarcity. Geology tells us that, in the earth’s crust, gold is 15 times as scarce as silver. And chemistry tells us that gold sits directly beneath silver in group 11 of the periodic table, meaning that the chemistry to extract gold and silver from their ores is essentially the same. Therefore, based on the geology and chemistry of the precious metals, gold should trade at around 15 times the price of silver. And 15 times the price of silver is precisely where gold did trade for centuries, and broadly where it traded in 1970. Yet by the mid-1970s the gold-to-silver ratio had breached 45, and by the late-1980s it had breached 75, where it stands today (Chart I-4). Why? Chart I-4Gold’s Massive Premium Versus Its Geological And Chemical Fundamentals Comes From Its Investment Value (As A Hedge Against The Debasement Of Fiat Money)
Gold's Massive Premium Versus Its Geological And Chemical Fundamentals Comes From Its Investment Value
Gold's Massive Premium Versus Its Geological And Chemical Fundamentals Comes From Its Investment Value
The gold-to-silver ratio surged because, in 1971, the Bretton Woods ‘pseudo gold standard’ collapsed and the world economy moved to a fiat monetary system. Lest there is any doubt, a similar surge happened forty years earlier in 1931 when the original gold standard collapsed, before being reconstructed at the Bretton Woods conference in 1944. From these two surges, we can deduce that the premium in gold’s value versus its geological and chemical fundamentals constitutes its insurance policy value against the debasement of fiat money. Some people counter that only a small proportion of gold is owned as an explicit investment, and a large proportion is owned for its beauty and status. Yet this has been the case for millennia, and through most of this history gold-to-silver has traded in line with its geological and chemical fundamentals. Given that the gold price surges post-1931 and post-1971 coincided almost precisely with the introduction of fiat money, it is gold’s insurance policy value against the debasement of fiat money that is setting most of its current value. Based on the gold-to-silver ratio of 75 versus the geological and chemical fundamental value of 15, we can deduce that around four-fifths of gold’s $12 trillion above ground market value, or $9.5 trillion, comes from its insurance policy value. Add to that the current $2.5 trillion value of cryptocurrencies, and we can estimate that the total ‘anti-fiat’ investment market is worth $12 trillion. Of which, gold comprises around 80 percent, and cryptocurrencies around 20 percent. But to repeat, cryptocurrencies can eat much more of gold’s lunch (Chart I-5). Chart I-5Cryptocurrencies Can Eat Much More Of Gold's Lunch
Cryptocurrencies Can Eat Much More Of Gold's Lunch
Cryptocurrencies Can Eat Much More Of Gold's Lunch
The Investment Implications: Bitcoin To $120,000, Ethereum To $17,000 We estimate that absent the displacement of investment value into cryptocurrencies since mid-2020, gold would now be trading at an all-time high of $2150 instead of at $1800. But given that there is much more of gold’s lunch for cryptocurrencies to eat, gold is set to become a pale shadow of its former self. Investors should underweight gold relative to the other precious metals. One pushback we get is that governments will ultimately issue a blanket ban on cryptocurrencies. But our pushback to the pushback is that it is a contradiction to be pro-blockchain and the anti- the ‘joined at the hip’ cryptocurrency which secures and validates the transactions on that blockchain. To resolve this contradiction, governments will try and regulate, rather than ban, cryptocurrencies. Another obvious question is: if Bitcoin is ‘back-to-front’ with its underlying blockchain having less utility and versatility than Ethereum and most other cryptocurrencies, should we still own BTC? The answer is yes, for two reasons. First, in time, the Bitcoin blockchain is likely to become more versatile; second, there will be some investors who hold out for the very long-term possibility that a cryptocurrency does displace fiat money. In which case, BTC would be the prime candidate. As the drawdown risk of owning cryptocurrencies converges with that of owning gold (Chart I-6), the cryptocurrency asset-class can reasonably displace gold to take half of the $12 trillion anti-fiat investment market, with BTC, ETH, and the others taking a third of this half – $2 trillion – each. Although BTC would become a smaller slice of the pie, the pie would be much bigger. From current market values, this means that BTC would double to $120,000. Chart I-6Cryptocurrency Corrections Are Becoming Less Extreme
Cryptocurrency Corrections Are Becoming Less Extreme
Cryptocurrency Corrections Are Becoming Less Extreme
But the real action would be in the other cryptocurrencies. ETH would quadruple to $17,000, while some embryonic blockchain tokens could do even better. In this list of potentials, we would put Solana, Cardano, XRP, and Polkadot. In conclusion, we expect the cryptocurrency asset-class to continue its strong structural uptrend, punctuated by short sharp corrections. As such, long-term investors should place up to 5 percent of their assets in cryptocurrencies. Coffee Is Too Expensive In this week’s fractal analysis, we make two observations: First, for those who want a second bite at the cherry for shorting the uranium meme theme, the spectacular rally in the Canadian stock Cameco offers a good opportunity – given its very fragile 260-day fractal structure, which has successfully signalled five previous turning-points (Chart I-7). Chart I-7Cameco Is Overbought
Cameco Is Overbought
Cameco Is Overbought
Second, within the soft commodities, the spectacular rally in coffee combined with the recent sell-off in cocoa has stretched the relative pricing of the two softs to a 10-year extreme, as well as a very fragile 260-day fractal structure (Chart I-8). Chart I-8Coffee Is Too Expensive
Coffee Is Too Expensive
Coffee Is Too Expensive
Accordingly, this week’s recommended trade is to short coffee versus cocoa, setting a profit-target and symmetrical stop-loss at 30 percent. Dhaval Joshi Chief Strategist dhaval@bcaresearch.com Fractal Trading System Fractal Trades 6-Month Recommendations Structural Recommendations Closed Fractal Trades Indicators To Watch - Bond Yields Chart II-1Indicators To Watch - Bond Yields ##br##- Euro Area
Indicators To Watch - Bond Yields - Euro Area
Indicators To Watch - Bond Yields - Euro Area
Chart II-2Indicators To Watch - Bond Yields ##br##- Europe Ex Euro Area
Indicators To Watch - Bond Yields - Europe Ex Euro Area
Indicators To Watch - Bond Yields - Europe Ex Euro Area
Chart II-3Indicators To Watch - Bond Yields ##br##- Asia
Indicators To Watch - Bond Yields - Asia
Indicators To Watch - Bond Yields - Asia
Chart II-4Indicators To Watch - Bond Yields ##br##- Other Developed
Indicators To Watch - Bond Yields - Other Developed
Indicators To Watch - Bond Yields - Other Developed
Indicators To Watch - Interest Rate Expectations Chart II-5Indicators To Watch - Interest Rate Expectations
Indicators To Watch - Interest Rate Expectations
Indicators To Watch - Interest Rate Expectations
Chart II-6Indicators To Watch - Interest Rate Expectations
Indicators To Watch - Interest Rate Expectations
Indicators To Watch - Interest Rate Expectations
Chart II-7Indicators To Watch - Interest Rate Expectations
Indicators To Watch - Interest Rate Expectations
Indicators To Watch - Interest Rate Expectations
Chart II-8Indicators To Watch - Interest Rate Expectations
Indicators To Watch - Interest Rate Expectations
Indicators To Watch - Interest Rate Expectations
Dear Client, There will be no report next week as we will be working on our Quarterly Strategy Outlook, which will be published the following week. In the meantime, please keep an eye out for BCA Research’s Annual Outlook, featuring long-time BCA client Mr. X, who visits towards the end of each year to discuss the economic and financial market outlook for the year ahead. Best regards, Peter Berezin Chief Global Strategist Highlights Inflation in the US, and to a lesser extent, in other major economies, will follow a “two steps up, one step down” trajectory of higher highs and higher lows. While inflation will fall in the first half of next year as goods prices stabilize, an overheated labor market will cause inflation to re-accelerate into 2023. The Fed will be slow to respond to high inflation, implying that monetary policy will remain accommodative next year. This should help propel stocks to new highs. Chinese stimulus will offset much of the drag from a weaker domestic property market. The dollar is a high momentum currency, so we wouldn’t bet against the greenback in the near term. Nevertheless, with “long dollar” now a consensus trade, we would position for a weaker dollar over a 12-month horizon. A depreciating dollar next year should help non-US equities, especially beleaguered emerging market stocks. The dollar will strengthen anew in 2023, as the Fed is forced to turn more hawkish, and global equities begin to buckle. From Ice To Fire In past reports, we have contended that inflation in the US, and to a lesser extent, in other major economies, would follow a “two steps up, one step down” trajectory of higher highs and higher lows. We are currently near the top of those two steps. The pandemic ushered in a major re-allocation of spending from services to goods (Chart 1). US inflation should dip over the next 6-to-9 months as the demand for goods decelerates and supply-chain disruptions abate. Chart 1The Pandemic Caused A Major Shift In Spending From Services To Goods
The Pandemic Caused A Major Shift In Spending From Services To Goods
The Pandemic Caused A Major Shift In Spending From Services To Goods
CHart 2Those With Low Paid Jobs Are Enjoying Stronger Wage Gains
Those With Low Paid Jobs Are Enjoying Stronger Wage Gains
Those With Low Paid Jobs Are Enjoying Stronger Wage Gains
The respite from inflation will not last long, however. The labor market is heating up. So far, most of the wage growth has been at the bottom end of the income distribution (Chart 2). Wage growth will broaden over the course of 2022, setting the scene for a price-wage spiral in 2023. We doubt that either fiscal or monetary policy will tighten fast enough to prevent such a spiral from emerging. As a result, US inflation will surprise meaningfully on the upside. Our view has no shortage of detractors. In this week’s report, we address the main counterarguments in a Q&A format: Q: What makes you think that service spending will rebound fast enough to offset the drag from weaker goods consumption? Chart 3Inventory Restocking Could Be A Source Of Growth Next Year
Inventory Restocking Could Be A Source Of Growth Next Year
Inventory Restocking Could Be A Source Of Growth Next Year
A: There is still a lot of pent-up demand for goods. Try calling any auto dealership. You will hear the same thing: “We have nothing in stock now, but if you put in an order today, you might get a vehicle in 3-to-6 months.” Thus, durable goods sales are unlikely to weaken quickly. And with inventories near record low levels, firms will need to produce more than they sell (Chart 3). Inventory restocking will support GDP growth. As for services, real spending in the US grew by 7.9% in the third quarter, an impressive feat considering that this coincided with the Delta-variant wave. Service growth will stay strong in the fourth quarter. The ISM non-manufacturing index jumped to a record high of 66.7 in October, up from 61.9 in September. The Atlanta Fed’s GDPNow model is tracking real PCE growth of 9.2% in Q4. Goldman’s Current Activity Indicator has hooked up (Chart 4).
Chart 4
Q: Aren’t you worried that spending on services might stall next year? A: Not really. Chart 5 shows the percentage change in real spending for various types of services from January 2020 to September 2021, the last month of available data.
Chart 5
Chart 6
The greatest decline in spending occurred in those sectors that were most directly affected by the pandemic. Notably, spending on movie theaters, amusement parks, and live entertainment in September was still down 46% on a seasonally-adjusted basis compared to last January. Hotel spending was down 22%. Spending on public transport was down 26%. Only spending on restaurants was back to normal. The number of Covid cases has once again started to trend higher in the US, so that path to normalization will take time (Chart 6). Nevertheless, with vaccination rates still edging up and new antiviral drugs set to hit the market, it is reasonable to assume that many of the hardest-hit service categories will recover next year. Q: What about medical services? Some have speculated that the shift to telemedicine will require much lower spending down the road. A: It is true that spending on outpatient services in September was $43 billon below pre-pandemic levels. However, over two-fifths of that shortfall was in dental services, which are not amenable to telemedicine. Spending on dental services was down 16% from its January 2020 levels, compared to 6% for physician services. A more plausible theory is that many people are still worried about venturing to the doctor’s or dentist’s office. In addition, a lot of elective procedures were canceled or postponed due to the pandemic. Clearing that backlog will lift medical spending next year. Chart 7The Flow Of Savings Has Fallen Back To Pre-Pandemic Levels But The Stock Of Accumulated Savings Remains High
The Flow Of Savings Has Fallen Back To Pre-Pandemic Levels But The Stock Of Accumulated Savings Remains High
The Flow Of Savings Has Fallen Back To Pre-Pandemic Levels But The Stock Of Accumulated Savings Remains High
In any case, the cost of a telemedicine appointment is typically no different from an in-person one. And, to the extent that telemedicine does become more widespread, this could encourage more people to seek medical assistance. Lastly, even if spending on certain services does not fully recover after the pandemic, this will probably simply result in a permanent increase in spending on goods. The only way that overall consumer spending will falter is if the savings rate rises, which seems unlikely to us. Q: Why do you say that? The savings rate has been very high throughout the pandemic. A: The savings rate did spike during the pandemic, but that was mainly because fewer services were available, and because households were getting transfer payments from the government. Now that these payments have ended, the savings rate has dropped to 7.5%, roughly where it was prior to the pandemic. There is good reason to think the savings rate will keep falling next year. Households are sitting on $2.3 trillion in excess savings, most of which reside in bank deposits (Chart 7). As they run down those savings, consumption will rise in relation to income. The household deleveraging cycle is over. After initially plunging during the pandemic, credit card balances are rising (Chart 8). Banks are eager to make consumer loans (Chart 9). Household net worth has risen by over 100% of GDP since the start of the pandemic (Chart 10). As we discussed three weeks ago, the wealth effect alone could boost annual consumer spending by up to 4% of GDP. Chart 8APost-GFC Deleveraging Has Ended And People Are Swiping Credit Cards Again Following The Pandemic Scare
Post-GFC Deleveraging Has Ended And People Are Swiping Credit Cards Again Following The Pandemic Scare
Post-GFC Deleveraging Has Ended And People Are Swiping Credit Cards Again Following The Pandemic Scare
Chart 8BPost-GFC Deleveraging Has Ended And People Are Swiping Credit Cards Again Following The Pandemic Scare
Post-GFC Deleveraging Has Ended And People Are Swiping Credit Cards Again Following The Pandemic Scare
Post-GFC Deleveraging Has Ended And People Are Swiping Credit Cards Again Following The Pandemic Scare
Chart 9Banks Are Easing Credit Standards For Consumer Loans
Banks Are Easing Credit Standards For Consumer Loans
Banks Are Easing Credit Standards For Consumer Loans
Chart 10A Record Rise In Household Net Worth
A Record Rise In Household Net Worth
A Record Rise In Household Net Worth
Q: Household wealth could fall as the Fed starts tapering and eventually raising rates. Wouldn’t that cool the economy? A: The taper is a fait accompli, and markets are already pricing in rate hikes starting in the second half of next year. If the Fed were to signal its intention to raise rates more quickly than what has been priced in, then home prices and stocks could certainly weaken. We do not think the Fed will pivot in a more hawkish direction before the end of next year, however. The Fed’s estimate of the neutral rate is only 2.5%, a big step down from its estimate of 4.25% in 2012. The market’s view is broadly in line with the Fed’s (Chart 11). Despite the upward move in realized inflation, long-term inflation expectations remain in check – expected inflation 5-to-10 years out in the University of Michigan survey has increased from 2.3% in late 2019 to 2.9%, bringing it back to where it was between 2010 and 2015. The 5-year/ 5-year forward TIPS breakeven inflation rate is near the bottom end of the Fed’s comfort zone (Chart 12). Chart 11The Fed And Investors Still Believe In Secular Stagnation
The Fed And Investors Still Believe In Secular Stagnation
The Fed And Investors Still Believe In Secular Stagnation
Chart 12Long-Term Inflation Expectations Are Not Yet A Concern For The Fed
Long-Term Inflation Expectations Are Not Yet A Concern For The Fed
Long-Term Inflation Expectations Are Not Yet A Concern For The Fed
Q: What about fiscal policy? Isn’t it set to tighten sharply next year? A: The US budget deficit will decline next year. However, this will happen against the backdrop of strong private demand growth. Moreover, budget deficits are likely to remain elevated in the post-pandemic period. This week, President Biden signed a $1.2 trillion infrastructure bill into law, containing $550 billion in new spending. BCA’s geopolitical strategists expect Congress to pass a $1.5-to-$2 trillion social spending bill using the reconciliation process. All in all, the IMF foresees the US cyclically-adjusted primary budget deficit averaging 4.9% of GDP between 2022 and 2026, compared to 2.0% of GDP between 2014 and 2019 (Chart 13).
Chart 13
Chart 14While Overall Consumption Has Recovered, Business Spending and Direct Government Expenditures Remain Below Trend
While Overall Consumption Has Recovered, Business Spending and Direct Government Expenditures Remain Below Trend
While Overall Consumption Has Recovered, Business Spending and Direct Government Expenditures Remain Below Trend
It should also be noted that government spending on goods and services has been quite weak over the past two years (Chart 14). The budget deficit surged because transfer payments exploded. Unlike direct government spending, which is set to accelerate over the next few years, households saved a large share of transfer payments. Thus, the fiscal multiplier will increase next year, even as the budget deficit shrinks. Q: We have focused a lot on demand, but what about supply? There are over 4 million fewer Americans employed today than before the pandemic and yet the job openings rate is near a record high. Chart 15Despite A Notable Decline, There Are Still A Lot Of People Avoiding Work Because Of Worries About Contracting Or Transmitting Covid
Despite A Notable Decline, There Are Still A Lot Of People Avoiding Work Because Of Worries About Contracting Or Transmitting Covid
Despite A Notable Decline, There Are Still A Lot Of People Avoiding Work Because Of Worries About Contracting Or Transmitting Covid
A: Some people who left the workforce will regain employment. According to the Census Bureau’s Household Pulse Survey, there are still 2.5 million people not working because they are afraid of catching or transmitting the virus (Chart 15). That said, some workers may remain sidelined for a while longer. The very same survey also revealed that about 8 million of the 100 million workers currently subject to vaccine mandates say that “they will definitely not get the vaccine.” In addition, about 3.6 million workers have retired since the start of the pandemic, about 1.2 million more than one would have expected based on pre-existing demographic trends. Most of these retirees will not work again. Lifestyle choices may keep others from seeking employment. Female labor participation has declined much more during the pandemic and than it did during the Great Recession (Chart 16). While many mothers will re-enter the labor force now that schools have reopened, some may simply choose to stay at home.
Chart 16
The bottom line is that the pandemic has reduced labor supply at a time when labor demand remains very strong. This is likely to exacerbate the labor shortage. Q: Any chance that higher productivity will offset some of the damage to the supply side of the economy from decreased labor participation? A: US labor productivity did increase sharply during the initial stages of the pandemic. However, that appears to have been largely driven by composition effects in which low-skilled, poorly-paid service workers lost their jobs. As these low-skilled workers have returned to the labor force, productivity growth has dropped. The absolute level of productivity declined by 5.0% at an annualized rate in the third quarter, leading to an 8.3% increase in labor costs. It is telling that productivity growth has been extremely weak outside the US (Chart 17). This gives weight to the view that the pandemic-induced changes in business practices have not contributed to higher productivity, at least so far. It is also noteworthy that a recent study of 10,000 skilled professionals at a major IT company revealed that work-from-home policies decreased productivity by 8%-to-19%, mainly because people ended up working longer. Increased investment spending should eventually boost productivity. Core capital goods orders, which lead corporate capex, are up 18% since the start of the pandemic (Chart 18). However, the near-term impact of increased investment spending will be to boost aggregate demand, stoking inflation in the process.
Chart 17
Chart 18US Capex Should Pick Up
US Capex Should Pick Up
US Capex Should Pick Up
Q: We have spoken a lot about the US, but the world’s second biggest economy, China, is facing a massive deflationary shock from the implosion of its real estate market. Could that deflationary impulse potentially cancel out the inflationary impulse from an overheated US economy? A: You are quite correct that inflation has risen the most in the US. While inflation has picked up in Europe, this mainly reflects base effects (Chart 19). Inflation in China has fallen since the start of the pandemic despite booming exports. There are striking demographic parallels between China today and Japan in the early 1990s. The bursting of Japan’s property bubble corresponded with a peak in the country’s working-age population (Chart 20). China’s working-age population has also peaked and is set to decline by more than 40% over the remainder of the century. Chart 19The US Stands Out As The Inflation Leader
The US Stands Out As The Inflation Leader
The US Stands Out As The Inflation Leader
Chart 20Demographic Parallels Between China And Japan
Demographic Parallels Between China And Japan
Demographic Parallels Between China And Japan
That said, there are important differences between the two nations. In 1990, Japan was a rich economy; output-per-hour was nearly 70% of US levels. China is still a middle-income economy; output-per-hour is only 20% of US levels (Chart 21). China has the ability to outgrow some of its problems in a way that Japan did not. In addition, Chinese policymakers have learned from some of Japan’s mistakes. They have been trying to curb the economy’s dependence on property development; real estate development investment has fallen from 12% of GDP in 2014 to less than 10% of GDP (Chart 22). China is still building too many new homes, but unlike Japan in the 1990s, the government is likely to pursue stimulus measures to compensate for a shrinking property sector. This should keep the economy from entering a deflationary slump.
Chart 21
Chart 22Real Estate Investment Has Peaked In China
Real Estate Investment Has Peaked In China
Real Estate Investment Has Peaked In China
Q: Let’s bring this back to markets. What is the main investment takeaway from your view? A: The main takeaway is that investors should remain bullish on stocks and other risk assets for the next 12 months but be prepared to turn more cautious in 2023. The neutral rate of interest in the US is higher than generally assumed. This means that monetary policy is currently more accommodative than widely believed, which is good for stocks. Unfortunately, it also means that a policy error is likely: The Fed will keep rates too low for too long, causing the economy to overheat. Chart 23Bank Stocks Tend To Outperform When Yields Rise
Bank Stocks Tend To Outperform When Yields Rise
Bank Stocks Tend To Outperform When Yields Rise
This overheating will not be evident over the next six months. As we noted at the outset of this report, the US economy is currently at the top of the proverbial two steps in our projected “two steps up, one step down” trajectory for inflation. The cresting in durable goods inflation will provide a temporary respite from inflationary worries, even as the underlying long-term driver of higher inflation – an increasingly tight labor market – gains traction. Strong consumer demand and persistent labor shortages will incentivize companies to invest in new capacity and automate production. This will benefit industrial stocks and select tech names. Rising bond yields will also boost bank shares (Chart 23). A country’s current account balance is simply the difference between what it saves and what it invests. With savings on the downswing and investment on the upswing, the US will find it increasingly difficult to finance its burgeoning trade deficit. The US dollar is a high momentum currency, so we wouldn’t necessarily bet against the greenback in the near term (Chart 24). Nevertheless, with “long dollar” now a consensus trade, we would position for a weaker dollar over a 12-month horizon (Chart 25).
Chart 24
Chart 25Long Dollar Is A Crowded Trade
Long Dollar Is A Crowded Trade
Long Dollar Is A Crowded Trade
Chart 26A Depreciating Dollar Next Year Should Help Non-US Equities
A Depreciating Dollar Next Year Should Help Non-US Equities
A Depreciating Dollar Next Year Should Help Non-US Equities
A depreciating dollar next year should help non-US equities, especially beleaguered emerging markets (Chart 26). The dollar will strengthen anew in 2023, as the Fed is forced to turn more hawkish, and global equities begin to buckle. Peter Berezin Chief Global Strategist pberezin@bcaresearch.com Global Investment Strategy View Matrix
Image
Special Trade Recommendations
Image
Current MacroQuant Model Scores
Image