Inflation/Deflation

Dear Client, We had an error in our oil balances/forecasts report from 18 November 2021 resulting from a double counting of select US onshore production figures. This has been corrected below. Highlights Higher oil production will restrain price increases in the short term, and give the impression the burst in inflation is transitory. Re-opening of airline travel and releasing of pent-up demand will absorb much of the higher output by year-end 2022. We are doubtful a US SPR release is forthcoming, as its impact would be trivial. Likewise, we do not expect the US to limit or ban exports of crude oil again, as it would unbalance markets. We are maintaining our Brent forecasts for 2022 and 2023 at $80 and $81/bbl. We again include a caveat, noting upside price risk is increasing going forward, due to inadequate capex (Chart of the Week). Stronger inflation prints going into 1Q22 will test the conviction underpinning central bankers' view that the current bout of price increases is transitory. If inflation appears to be more persistent going into 2H22, the Fed and other systemically important central banks likely will signal earlier-than-expected policy-rate hikes. This would be negative for commodities, as it would raise debt-service costs and investment hurdle rates, and reduce consumption. Higher oil prices and tighter monetary policy will temper demand. If capex is not forthcoming, however, prices will have to rise sharply to destroy demand. Feature It hardly deserves mention that the US has been hectoring the leadership of OPEC 2.0 to increase oil production, in order to reduce the cost of gasoline and home-heating fuels going into the winter … And, there's a mid-term election next year. The Biden administration also has been threatening – if that is the proper term – to release barrels from the US Strategic Petroleum Reserve (SPR), and reportedly asked China to consider a similar release.1 The leadership of OPEC 2.0, on the other hand, is flagging the risk to stronger oil prices from higher production next year. Much to the chagrin of the Biden administration, the coalition led by the Kingdom of Saudi Arabia (KSA) and Russia will not be increasing output by more than the 400k b/d it agreed to earlier this year. OPEC 2.0 will keep this up until June or July 2022, when most of its output sidelined by the COVID-19 pandemic will have been returned to the market. We expect the core Gulf-state producers – mostly KSA – will want to maintain ~ 3mm b/d of spare capacity thereafter. Chart of the WeekStable Oil-Price Trajectory
Stable Oil-Price Trajectory
Stable Oil-Price Trajectory
Chart 2OPEC 2.0 Production Continues To Lift
OPEC 2.0 Production Continues To Lift
OPEC 2.0 Production Continues To Lift
Higher Oil Output Expected Overall OPEC 2.0 production is expected to total 52.3mm b/d next year and 53.1mm b/d in 2023 (Chart 2). Most of the increase in the coalition's production will be accounted for by its core producers – KSA, Russia, Iraq, the UAE and Kuwait (Table 1). The "Other Guys" – i.e., those producers in OPEC 2.0 that can only maintain existing output levels or are managing continual declines in output – will account for a decreasing share of the coalition's production (Chart 3).2
Chart 3
Table 1BCA Global Oil Supply - Demand Balances (MMb/d, Base Case Balances) To Dec23
High Oil Prices, Low Capex, Inflation … Oh, My.
High Oil Prices, Low Capex, Inflation … Oh, My.
Including drilled-but-uncompleted wells (DUCs), we expect an additional 600k b/d from US shale-oil producers next year, which would take their output up to 8.39mm b/d, and another 350k b/d increase in their output in 2023. Output in the Lower 48 (L48) states of the US overall is expected to increase to 9.65mm b/d next year and 9.93mm b/d in 2023 (Chart 4). The increase in L48 output will continue to be led by higher shale-oil production, notably from the prolific Permian Basin play (Chart 5). US Gulf of Mexico and Alaska production tops up our total average output forecasts in the States to 11.89mm b/d next year and 12.20mm b/d in 2023. Chart 4US L48 Production Continues To Grow
US L48 Production Continues To Grow
US L48 Production Continues To Grow
Chart 5
Demand Continues To Expand On the demand side, we continue to expect 2021 consumption growth of ~ 5.0mm b/d this year. Our growth expectation for 2022 and 2023 remains close to ~ 4.6mm b/d and 1.3mm b/d, respectively. We also expect demand to cross back over 100mm b/d in the current quarter, as can be seen in Table 1. As has been our wont during the recovery from the pandemic, we expect DM demand to level off next year after a stout recovery, and for EM demand to pick up the baton and lead global oil-consumption growth in the next two years (Chart 6). We remain bullish re the rollout of COVID-19 vaccines using mRNA technology globally, which will allow EM economies to step up growth. Re-opening of DM and EM economies will continue, pushing refined-product demand above 2019 levels next year, including jet-fuel toward the end of 2H22. Chart 6EM Oil Demand Growth Will Take The Lead
EM Oil Demand Growth Will Take The Lead
EM Oil Demand Growth Will Take The Lead
Oil Market Remains Balanced Our supply-demand balances are largely unchanged from last month. This keeps global crude-oil markets in a physical deficit for most of next year. We expect OPEC 2.0's core producers will maintain their production-management strategy – i.e., keeping the level of supply below the level of demand. Producers in the price-taking cohort outside the coalition – chiefly the US, Canada and Brazil – will lift production subject to capital-market constraints on producing oil profitably (Chart 7). This supply-demand dynamic keeps inventories drawing through this year, then leveling off in 2022 and rebounding slowly in 2023 (Chart 8). Chart 7Global Crude Markets Mostly Balanced
Global Crude Markets Mostly Balanced
Global Crude Markets Mostly Balanced
Chart 8Crude Inventories Continue To Draw
Crude Inventories Continue To Draw
Crude Inventories Continue To Draw
Global crude-oil inventories could come under pressure during the 2021-22 winter, if natural-gas markets remain supply-constrained. This week, the Russian state-owned supplier and operator of Nord Stream 2 (NS2) pipeline delivering Russian gas to Germany was told it must comply with German law before its gas will be allowed to flow. It is unlikely this will be done this year.3 This could keep demand for oil higher at the margin, as we noted earlier.4 Oil's Known Unknowns: Capex, Inflation The big unknowns – and risks – to our view are when and how much capex is going to be deployed in the oil and gas exploration-and-production space, and what we can expect from the Fed and other systematically important central banks if inflation looks to be persistent. OPEC 2.0 leaders and officials from the price-taking cohort agree that the dearth of capex for the industry threatens to destabilize oil and gas markets in the near future. Among the 90 international oil and gas producers tracked quarterly by the US EIA capex has collapsed (Chart 9). The industry appears to have made shareholder and investor interests their priority, so as to be competitive in the pursuit of capital that all firms engage in. This also is true for state-owned entities, which also compete for capital and access to technology.
Chart 9
These firms and producers will continue to work to produce oil and gas profitably. Still, they likely will continue to find an unreceptive audience to invest in these energy sources; Governments and policymakers are actively discouraging investment in fossil fuels. This risks setting in motion a process in which supply erodes much faster than demand – similar to what is happening in coal markets presently – and prices for fossil fuels rocket higher. This is not a strategy, particularly as it disregards the fact there is insufficient renewables capacity and storage to cover the energy from hydrocarbons that is being lost because of the lack of a transition policy at any level. Recent strong inflation prints are a small-scale example of how this process could play out over the next decade or longer. When China eliminated Australian coal imports earlier this year in favor of Indonesian supplies, and forced its coal mines to shut as part of its dual-circulation policy to become more self-reliant, the resulting shortages set off chain reactions in global natural gas markets. European gas prices shot higher, which, along with higher Asian and American natgas prices, sent food prices soaring on the back of higher fertilizer prices.5 Shipping bottlenecks and container shortages worldwide exacerbated these problems. CBs' Inflation View Challenged Going into 2022, central bankers' view that the current bout of price increases is transitory is going to be put to the test. If inflation appears to be more persistent going into 2H22 – after hoped-for one-offs in coal, gas, oil and food markets are worked out – the Fed and other systemically important central banks likely would start signaling earlier-than-expected policy-rate hikes. This would be negative for commodities generally, as it would raise debt-service costs and investment hurdle rates, and reduce consumption. Higher oil prices and tighter monetary policy will temper demand. These inflationary pressures can be addressed, but this will require a serious re-thinking of the strategy the world needs to pursue if it is to pull off a successful energy transition. Such a strategy will have to give greater consideration to the role of fossil fuels in this transition. If capex is not forthcoming, however, oil prices will have to rise to destroy demand. This will feed into inflation, and ultimately could result in stagflation, as economic growth grinds lower. Investment Implications The level of uncertainty surrounding oil and gas prices remains elevated, given the background condition of 90% odds we see a La Niña in the Northern Hemisphere's winter (Nov21 – Mar22), and ~ 50% chance it persists into the Spring (March-May22). This could leave markets with colder-than-normal temperatures past the end of winter, as it did last year. Given this uncertainty, we remain long the S&P GSCI and the COMT ETF, to keep our exposure to higher prices and a return to higher backwardation. Robert P. Ryan Chief Commodity & Energy Strategist rryan@bcaresearch.com Ashwin Shyam Research Associate Commodity & Energy Strategy ashwin.shyam@bcaresearch.com Paula Struk Research Associate Commodity & Energy Strategy paula.struk@bcaresearch.com Commodities Round-Up Energy: Bullish Natural-gas price volatility in Europe and the EU exploded higher once again, following reports the German government would not certify Nord Stream 2 (NS2) unless and until it complies with German law (Chart 10). The European Commission also is setting conditions for its approval. Lastly, outgoing Chancellor Angela Merkel said further sanctions against Russia were possible if the pipeline was used against Ukrainian interests.6 The EU's TTF natural gas benchmark is up 24% this week alone, on the back of this news, while the UK's benchmark Balancing Point index is up 7%. These higher costs will feed into food costs, given the importance of natural gas to fertilizer markets, accounting for ~ 70% of fertilizer costs.7 Given the higher likelihood of another La Niña in the Northern Hemisphere (90% odds from the US Climate Prediction Center), we expect continued volatility in gas prices. Base Metals: Bullish Steel demand in China has been contracting after the government began tightening the supply of credit to the property sector following the Evergrande debt crisis. Construction makes up approximately one-fourth of total Chinese steel demand. At the same time, supply has been falling as, in addition to government regulation to curb carbon emissions, steel mills have voluntarily cut output due to decreasing margins on the back of soft demand. The fact that Chinese steel prices have been falling since their highs in May this year indicates that demand is dropping faster than supply (Chart 11). Reduced Chinese steel demand is feeding through to demand for iron ore – the main steel input in China – while disruptions in the top two iron ore exporters, Australia and Brazil are easing, increasing the possibility of an oversupplied market. Precious Metals: Bullish Gold ended last Thursday above $1,860/oz for the first time since mid-June after the October CPI data release showed that the US had its biggest inflation surge in nearly 30 years. As long as the Federal Reserve does not turn more hawkish, consecutive months of high CPI prints will mean low real rates well into 2022, which will reduce the opportunity cost of holding gold. The high US twin deficits – which as of Q3 2021 was 17.44% of GDP – support the long-term dollar bearish view our colleagues at BCA's Foreign Exchange Strategy hold. A weak dollar over the next 12-18 months will increase the inflation-hedge appeal of the yellow metal relative to the greenback.
Chart 10
Chart 11
GENERIC 1ST MONTH STEEL REBAR FUTURES PRICE LEVEL GOING DOWN
GENERIC 1ST MONTH STEEL REBAR FUTURES PRICE LEVEL GOING DOWN
Footnotes 1 We note in passing the Biden administration has been mostly successful in getting massive fiscal and monetary stimulus deployed into the US economy, which has increased household savings and potential spending power dramatically, as our colleagues in BCA's US Investment Strategy noted in their 1 November 2021 report Half-Empty Or Half-Full?: "Massive fiscal transfers and an unprecedented increase in household wealth will support consumption and keep the economy from stagnating." We cannot view higher gasoline prices in the wake of this stimulus and growth as an economic emergency of the sort the SPR is designed to address. Nor can we view the pick-up in mobility – particularly in air travel expected shortly with the re-opening of routes closed due to the pandemic – as a supply-side emergency. 2 It's worthwhile mentioning here that OPEC 2.0 has been returning less than the 400k b/d every month it agreed due to shortfalls in production outside the core group broken out in Table 1. Reduced capex and maintenance is responsible for this. Higher oil prices might allow this group within the coalition to attract additional capex, but, given the uncertain long-term support for such exploration-production-maintenance investment, this will remain a long-term challenge to these producers. Lastly, we continue to expect Iran to return to markets as a bona fide exporter; we expect its production to return to 3.70-3.85mm b/d by 2H22. 3 Please see Nord Stream 2: Germany halts approval of Russian gas link published on November 16, 2021. 4 Please see last month's oil balances and price-forecast report Short-Term Oil-Price Risk Moves To The Downside, published 21 October 2021. 5 Please see our October 14, 2021 report entitled Inflation Surges, Slows, Then Grinds Higher, and last week's report entitled Risk Of Persistent Food-Price Inflation for additional discussion. 6 Please see fn 3 above. 7 Please see fn 5 above. Investment Views and Themes Strategic Recommendations
Highlights China’s slowdown will deepen, and US bond yields will likely rise. This augurs well for the US dollar but will produce a toxic cocktail for EM. The recent weakness in the commodity complex will continue. EM markets are at risk in absolute terms and will continue to underperform their DM counterparts. From a global macro perspective, the US dollar’s appreciation will be a re-balancing act. In a world where China is exporting economic weakness/deflation and the US is experiencing genuine inflation, a strong US dollar is desirable. The latter will redistribute inflation away from the US to the rest of the world and will redirect disinflationary pressures from the rest of the world to the US. Feature Chart 1DXY Breakout, EM FX Breakdown
DXY Breakout, EM FX Breakdown
DXY Breakout, EM FX Breakdown
The US dollar is breaking out and EM currencies are breaking down (Chart 1). This will set in motion a number of responses in global financial markets. These include but are not limited to selloffs in EM equities, domestic bonds and EM credit markets and a setback in the commodity complex. Hence, we reiterate our negative stance on EM stocks and fixed-income markets. We continue to recommend shorting a basket of EM currencies versus the US dollar. Please refer to the end of this report for detailed investment recommendations. Why The Greenback Is Set To Strengthen Since early in the year, our investment strategy has been based on two macro themes: China’s slowdown and rising US inflation. We concluded early on that these dynamics are positive for the US dollar. Both macro themes have played out fairly well, yet until recently the broad trade-weighted US dollar’s advance has been hesitant. Odds are that the rally in the greenback is about to accelerate. Chart 2China's Slowdown = US Dollar Rally
China's Slowdown = US Dollar Rally
China's Slowdown = US Dollar Rally
The fundamental case for the US dollar rally remains as follows: China’s slowdown will weigh more on emerging Asia, Japan, Europe, and/or commodity producing, developing and developed economies than it will on the US. The basis is that US exports to China make up only 0.7% of its GDP. The same ratio is much higher for the rest of the world. Hence, the US economy will outperform many advanced and emerging economies. Chart 2 illustrates that, historically, whenever China has slowed down, the US dollar has rallied. The mainland’s property construction is shrinking, and traditional infrastructure investment is also extremely weak (Chart 3). Beijing is easing its regulatory and macro policies but only by degrees. For now, policy support will be insufficient to reverse the business cycle downturn. In the meantime, the US economy is overheating. Specifically, all core type inflation measures have surged to well above 2% (Chart 4). Critically, nominal wages are rising at the fastest rate seen in the past 35 years (Chart 5). Chart 3China: Infrastructure Investment Is Very Weak
China: Infrastructure Investment Is Very Weak
China: Infrastructure Investment Is Very Weak
Chart 4US Core Inflation Is Broad-Based And High
US Core Inflation Is Broad-Based And High
US Core Inflation Is Broad-Based And High
Given that the employee quit rate is very high, employers will have to grant notable wage increases to both new and current employees. Thus, wage growth will accelerate further. Recent wage gains have not been offset by productivity growth. As a result, unit labor costs are rising (Chart 6). This will push businesses to raise their selling prices. So long as household income and consumption remain robust, businesses will likely succeed in raising their prices. In short, US inflation is acute and genuine, and, hence, it will persist unless the economy slows considerably. Chart 5US Nominal Wage Growth Is At Its Fastest In 35 Years
US Nominal Wage Growth Is At Its Fastest In 35 Years
US Nominal Wage Growth Is At Its Fastest In 35 Years
Chart 6US Unit Labor Costs Are Rising Fast
US Unit Labor Costs Are Rising Fast
US Unit Labor Costs Are Rising Fast
The rise in US inflation will initially be bullish for the US dollar. The reason is that fixed-income markets will move to price in higher Fed funds rates and the Fed will also acknowledge the need to hike rates given that core inflation is well above its target range. At some point in future, however, high inflation will start hurting the US dollar. This will happen when the Fed eschews rate hikes and falls behind the inflation curve. We believe we are still in a window where US bond yields could rise further. Rising US interest rates will support the dollar. Finally, the US economy, but not necessarily its equity and credit markets, is better positioned to handle central bank tightening than are other DM and EM economies. American consumers have substantially deleveraged and there are shortages in US housing and cars. Even as US borrowing costs rise, interest rate sensitive sectors like housing and autos will still do well because of pent-up demand. In particular, the US housing market is sensitive to long-term (30-year) mortgage rates and not the front end of curve. On the contrary, many EM and other DM economies and their housing sectors are sensitive to domestic short-term rates. In percentage terms, the rise in US mortgage rates will likely be smaller than those in DM and EM economies. In short, the US economy will not slow sharply in the response to rates while EM and other DM economies will. This augurs well for the dollar. The key US vulnerability from higher interest rates stems from its equity and credit markets, not the real economy. US equities and credit markets are very richly priced, so the rising cost of capital could trigger a major selloff. In turn, wealth effects and tightening financial conditions will pose a risk to the real economy. However, even in this case, the US dollar will initially appreciate because it always rallies during risk-off phases. The greenback’s depreciation will resume when the Fed turns dovish again. From a big picture macro perspective, the US dollar’s appreciation will be a re-balancing act. In a world where China is exporting economic weakness/deflation and the US is experiencing genuine inflation, a strong US dollar is desirable. The latter will redistribute inflation away from the US to the rest of the world and will redirect disinflationary pressures from the rest of the world to the US. In this period of US dollar strength, EM financial markets will be hurt because foreign investors always flee EM when their currencies depreciate. Bottom Line: China’s slowdown will deepen, and US bond yields will likely rise. This will produce a toxic cocktail for EM. Watch Out Commodity Prices Chart 7Reduced Financing For Property Developers = Less Construction
Reduced Financing For Property Developers = Less Construction
Reduced Financing For Property Developers = Less Construction
The downturns in China’s property construction and traditional infrastructure spending are bad for raw material prices. The following points offer an explanation as to why commodity prices will relapse in spite of the fact that they have thus far resisted China’s slowdown. Although Chinese property sales and starts have been shrinking, floor area completed (construction work) has been very strong. However, the liquidity crunch that many real estate developers are experiencing will lead them to halt or cut back on their construction work (Chart 7, top panel). The latter will weigh on raw material prices (Chart 7, bottom panel). Taiwan’s new export orders PMI for the basic materials sector has dropped below 50, indicating plunging regional demand for raw materials (Chart 8). Ongoing weakness in Chinese demand is the culprit behind this drop. Due to electricity shortages, mainland production of industrial metals has plunged (Chart 9, top panel). Yet, the prices of these metals have recently corrected (Chart 9, bottom panel). Falling prices amid shrinking supply are a sign of major demand relapse. Chart 8Greater China: Orders For Basic Materials Are Already Shrinking
Greater China: Orders For Basic Materials Are Already Shrinking
Greater China: Orders For Basic Materials Are Already Shrinking
Chart 9Base Metal Price Falling Despite Production Shutdowns In China
Base Metal Price Falling Despite Production Shutdowns In China
Base Metal Price Falling Despite Production Shutdowns In China
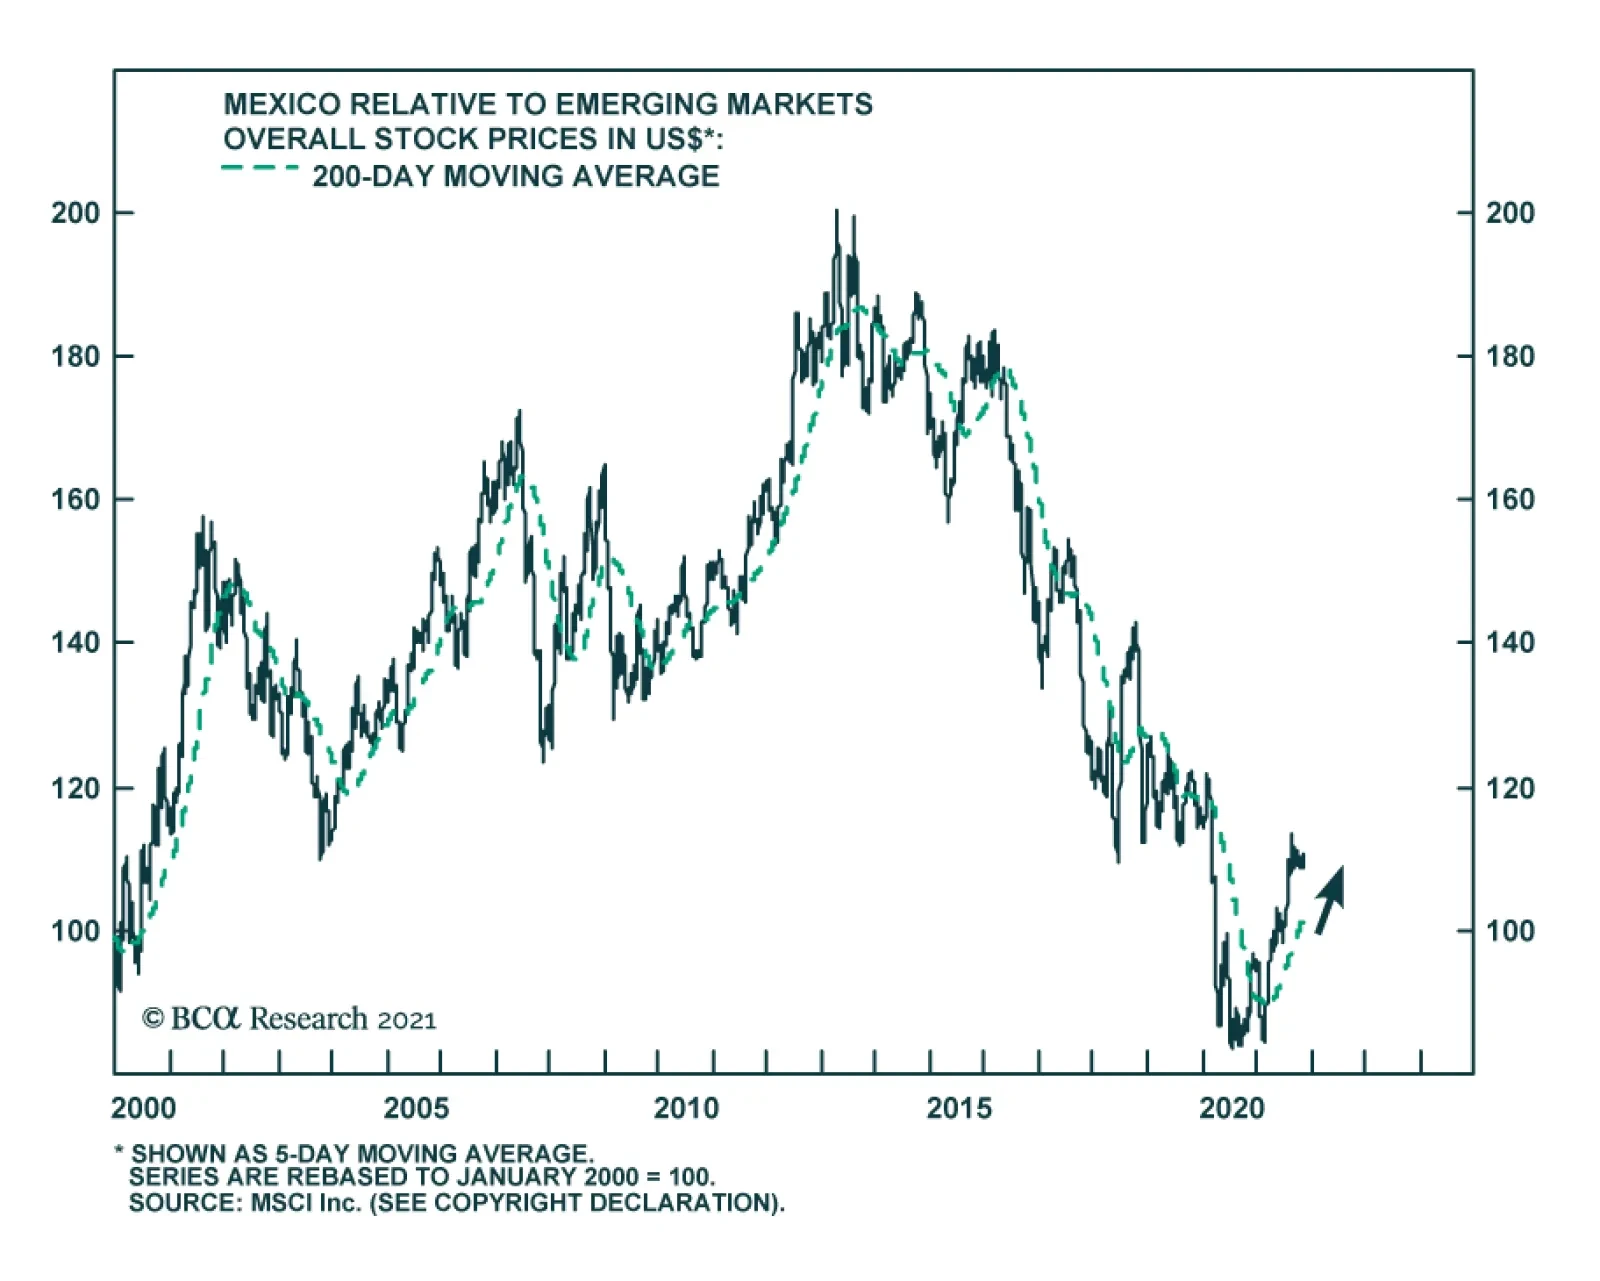
The Baltic Dry index – the price of shipping bulk commodities – has rolled over decisively. It has reasonable correlation with industrial metal prices. Oil is much less exposed than base metals to China’s property and infrastructure contraction. In the case of crude, the key risks are the US and China releasing their strategic reserves and the US dollar strength. Bottom Line: The recent weakness in the commodity complex will continue. Other Considerations Chart 10China's Onshore Stock-to_Bond Ratio Is Breaking Down
China's Onshore Stock-to_Bond Ratio Is Breaking Down
China's Onshore Stock-to_Bond Ratio Is Breaking Down
There are a number of other considerations and indicators that lead us to maintain a negative stance on EM financial markets: China’s onshore stock-to-bond ratio has broken below its 200-day moving average (Chart 10). This signifies a deepening growth slump in China. EM equity underperformance has been broad-based. Both the market cap-weighted and equal-weighted EM equity indexes have been underperforming their respective DM indexes. Further, not only have TMT (technology, media and telecom) stocks been underperforming their DM peers, but non-TMT stocks have also lagged their counterparts substantially (Chart 11). Last but not least, EM TMT stocks remain at risk. First, share prices of Chinese internet companies will continue derating due to structurally lower profitability going forward as the government exercises more control over them. We have discussed this in previous reports. In addition, consumer spending online has slowed sharply while smartphone sales are plunging (Chart 12). Chart 11EM Equity Underperformance Is Broad-Based
EM Equity Underperformance Is Broad-Based
EM Equity Underperformance Is Broad-Based
Chart 12China: Online Spending Is Very Weak
China: Online Spending Is Very Weak
China: Online Spending Is Very Weak
Second, DRAM (memory chip) prices are deflating and the value of DRAM sales is shrinking (Chart 13). This is weighing on Korean semiconductor share prices like Samsung and SK Hynix. These stocks have a large market cap in the KOSPI index. Finally, demand for semiconductors produced by Taiwanese companies has been booming but it is presently showing signs of moderation (Chart 14). Chart 13Falling DRAM Prices Are Weighing On Korean Semi Stocks
Falling DRAM Prices Are Weighing On Korean Semi Stocks
Falling DRAM Prices Are Weighing On Korean Semi Stocks
Chart 14Taiwanese Semiconductor Industry: Moderating Orders
Taiwanese Semiconductor Industry: Moderating Orders
Taiwanese Semiconductor Industry: Moderating Orders
Importantly, geopolitical risks around Taiwan in general and TSMC in particularly are enormous. The latter is literally at the center of the US-China confrontation. The timing of a diplomatic or even military crisis is uncertain but our Geopolitical Strategy team expects geopolitical risks over Taiwan to escalate substantially. The recent summit between Presidents Joe Biden and Xi Jinping does not change this assessment. Investment Recommendations Chart 15EM Credit Markets: Prepare For A Broad Selloff
EM Credit Markets: Prepare For A Broad Selloff
EM Credit Markets: Prepare For A Broad Selloff
Continue underweighting EM equities in a global equity portfolio. Within the EM space, our overweights are Korea, Singapore, China (favoring A shares over investable stocks), Vietnam, Russia, central Europe and Mexico. Concerning EM equity sectors, we reiterate the short EM banks / long DM banks and short EM banks / long EM consumer staples positions. In line with our US dollar breakout thesis, we continue to recommend a short position in a basket of the following EM currencies versus the US dollar: BRL, CLP, COP, PEN, ZAR, TRY, THB, PHP and KRW. EM exchange rate depreciation is bad for EM domestic bonds. Currency weakness could lead central banks in Latin America to hike rates further. In brief, the risk-reward of EM local currency bonds is still unattractive. In this space, we recommend the following positions: bet on yield curve flattening in Mexico and Russia (pay 1-year/receive 10-year swap rates); pay Czech 10-year swap rates; receive Chinese and Malaysian 10-year swap rates. We reiterate our underweight in EM credit (both sovereign and corporate) markets versus US corporate credit, quality adjusted. As EM exchange rates depreciate, EM credit spreads will widen (Chart 15). Chinese high-yield corporate US dollar bonds are not yet a buy because the mainland property market’s travails are far from over, as was discussed in our recent Special Report. For a complete list of our recommendations across all asset classes and country strategy within each asset class, please see below or visit our web site. Arthur Budaghyan Chief Emerging Markets Strategist arthurb@bcaresearch.com Footnotes Equities Recommendations Currencies, Credit And Fixed-Income Recommendations
Dear Client, The next two BCA Research Global Fixed Income Strategy reports will be jointly published with other BCA services, which will impact the publishing dates. Our next report will be a joint Special Report on Australia, published with our colleagues at Foreign Exchange Strategy, which you will receive this Friday, November 19. The following report will be a joint Special Report published with European Investment Strategy, which you will receive on November 29. -Rob Robis Highlights High realized inflation rates are pushing up longer-term inflation expectations toward all-time highs, while also weighing on consumer confidence, in the US and the UK. The inflation overshoot has not been as severe in the euro area, but consumer confidence appears to be rolling over there too. Over the next year, central banks will have to manage around the communications challenges posed by a rise in inflation that is perceived to be more supply-driven than demand-driven and, hence, beyond the full control of monetary policy. Public opinion surveys are showing eroding satisfaction with the Fed and Bank of England, while similar surveys in the euro area show public trust in the ECB remains strong despite higher euro area inflation. We continue to favor overweights in euro area government bonds (both core and periphery) versus US Treasuries and UK Gilts, given the far greater likelihood of multiple rate hikes in the UK and US in 2022/23, compared to the euro area, in order to restore central bank credibility. Feature Rapidly accelerating inflation has become front-page news around the world. It is also increasingly becoming a political issue and not just an economic one. After the release of the October US consumer price index (CPI) report, where headline inflation came in at a 30-year high of 6.2%, US President Joe Biden had to issue a formal White House statement acknowledging that inflation “hurts Americans’ pocketbooks, and reversing this trend is a top priority for me.” Biden also pulled off the neat trick of both committing to, and subtly challenging, the Fed’s independence when he noted that “I want to reemphasize my commitment to the independence of the Federal Reserve to monitor inflation, and take necessary steps to combat it.” The Great Inflation Of 2021 (and 2022?) has raised a new risk for both politicians and investors. As long as the high inflation persists, and for as long as central banks seem unwilling or unable to respond to try and bring down inflation with tighter monetary policy, consumer confidence will be negatively impacted – even if job growth remains reasonably healthy. Confidence & Inflation: A Matter Of Trust Chart of the WeekHigh Inflation Weighing On Consumer Confidence
High Inflation Weighing On Consumer Confidence
High Inflation Weighing On Consumer Confidence
The preliminary read on US consumer confidence for November from the University of Michigan survey showed sentiment hitting a ten-year low, largely on worries about the impact of rising inflation on household spending power. This effect of high inflation eroding consumer confidence is not just a US phenomenon (Chart of the Week). UK consumer sentiment is also falling due to what has been described as “a potential cost of living crisis” by consumer research firm GfK. In the euro area, however, consumer sentiment is still relatively elevated, but is starting to roll over as headline inflation reaches a 13-year high of 4.1% in October. From the point of view of financial markets, surging inflation is still expected to be a short-lived phenomenon, although conviction on that view is starting to wane. Market-based inflation expectations curves for the US, UK and euro area are all currently inverted, with shorter-maturity expectations above longer-maturity ones (Chart 2). Yet the upward momentum of those measures across all maturity points is showing little sign of ebbing, especially in the US. The 2-year TIPS breakeven rate now sits at a 16-year high of 3.51%, the 5-year breakeven is at an all-time high of 3.22%, while the 10-year breakeven of 2.77% is now just a single basis point below its all-time high reached in 2005. The story is similar in the UK, where RPI swap rates for the 2-year, 5-year and 10-year maturities are 5.3%, 4.8% and 4.3%, respectively – all hovering near all-time highs (as are breakevens on index-linked Gilts). Euro area inflation expectations are not so historically elevated, and the inflation curve is not as inverted, but the 2-year euro CPI swap rate is still at a 15-year high of 2.4% compared to a 9-year high of 2.0% - right at the ECB’s inflation target - for the 10-year CPI swap rate. In the US, the survey-based measures of inflation expectations are telling a similar story. The New York Fed’s Consumer Survey shows that median 3-year expectations are now at 4.2% with 1-year expectations even higher at 5.7% (Chart 3). Meanwhile, the early November read on inflation expectations from the University of Michigan survey showed that 1-year-ahead expectations climbed to a 13-year high of 4.9%, while the longer-term 5-10 year inflation expectations were unchanged from the October reading of 2.9%. Chart 2Rising Inflation Expectations, Both Short- & Long-Term
Rising Inflation Expectations, Both Short- & Long-Term
Rising Inflation Expectations, Both Short- & Long-Term
Chart 3A Broad-Based Surge In US Inflation
A Broad-Based Surge In US Inflation
A Broad-Based Surge In US Inflation
The latter figure may provide some comfort to the Fed, with surging shorter-term expectations not fully leaking through into longer-term expectations. However, the longer the inflation upturn persists, the more likely it will be that US consumers begin to factor in a higher rate of longer-term inflation, just as TIPS traders are doing. After all, the Michigan 5-10 year measure has still climbed by 0.7 percentage points from the pre-COVID low. Even more worrying from the Fed’s perspective is that inflation expectations are rising for essentially all Americans. The New York Fed Consumer Survey shows that 3-year-ahead inflation expectations are rising across all levels of education (Chart 4) and income cohorts (Chart 5). Chart 4US Inflation Expectations Are Rising For All Education Levels...
US Inflation Expectations Are Rising For All Education Levels...
US Inflation Expectations Are Rising For All Education Levels...
Chart 5...And Income Levels
...And Income Levels
...And Income Levels
The New York Fed also compiles a measure of consumer inflation uncertainty (bottom panels of both charts on page 5). Survey participants are asked to provide probabilities of inflation falling within certain ranges, with the gap between the top and bottom quartiles of those expected inflation outcomes representing the “uncertainty” over future US inflation. Perhaps unsurprisingly, the dispersion of inflation forecasts is typically much wider for those earning lower incomes and with less education. Yet even highly educated, high earning Americans are reporting wider gaps in possible inflation outcomes, in sharp contrast to the pre-COVID years where their expectations were low and stable. Americans Are Having Second Thoughts About The Fed Any way you cut it – TIPS breakevens or survey-based measures - US inflation uncertainty and volatility have increased. This appears to be starting to erode public confidence with the Fed. Along with its consumer confidence surveys, the University of Michigan also publishes a periodic survey of Confidence In Financial Institutions like commercial banks, asset managers and, most importantly, the Fed. The last survey was just conducted for the September/October 2021 period and showed that 43% of respondents reported a loss of confidence in the Fed compared to five years ago (Chart 6). That is up from 36% reporting a loss of confidence in the last such survey conducted in 2019, and is approaching the +50% levels seen in 2008 (the Financial Crisis) and in 2011 (the Taper Tantrum) – episodes where the Fed had difficulty maintaining economic and financial stability.
Chart 6
The University of Michigan also noted that reported consumer confidence was much lower for those claiming to have less confidence in the Fed, and vice versa (Chart 7).
Chart 7
Taken at face value, this survey shows that the Great Inflation of 2021 has shaken the public’s faith in the Fed’s ability to maintain economic stability. Combined with the message from the New York Fed Consumer Survey on the growing instability of American inflation expectations, this shows that the Fed may be facing an uphill climb to restore some of the credibility it has lost this year. Much like all aspects of American life these days, political partisanship must be factored in the analysis of US confidence data. The regular monthly University of Michigan sentiment survey for November noted that various measures of US confidence were consistently higher for respondents who reported to be Democrats compared to Republicans since President Biden took office (Chart 8). This is a mirror image of the years under President Trump (pre-pandemic), where Republicans consistently reported greater optimism than Democrats.
Chart 8
Chart 9Americans Can Agree On One Thing - High Inflation Is Bad
Americans Can Agree On One Thing - High Inflation Is Bad
Americans Can Agree On One Thing - High Inflation Is Bad
The University of Michigan Confidence in Financial Institutions survey also noted that less trust in the Fed was reported more frequently by Republicans (67%) than Democrats (27%) in 2021, the first year under Biden. This compares to 2017, the first year of the Trump Administration, where more Democrats (41%) reported less trust with the Fed compared to Republicans (30%). The Michigan survey described this “partisan identification” as being a “significant correlate of consumer assessments of the Federal Reserve, treating the Fed as part of the administration rather than an independent body.” Consumer confidence among reported Democrats has been falling since April of this year, although there is still room to catch up to the complete collapse of sentiment seen among Republican consumers (Chart 9, top panel). High US inflation is hitting everyone hard. The surge in inflation expectations is overwhelming income expectations for the next year, according to the New York Fed Consumer Survey (middle panel). High realized inflation has also eroded real spending power, with real average hourly earnings having contracted in year-over-year terms since April of this year (bottom panel). Even with that fall in real income growth perceptions, the plunge in the University of Michigan US consumer confidence has not been matched by other measures like the Conference Board US consumer confidence index, which remains well above pandemic era lows. Even more importantly, US consumer spending has held up well, with nominal retail sales expanding by +1.7% in October following a +0.8% gain in September. Some of those increases were due to rising prices, but were still significantly above inflation in both months, suggesting a solid pace of real consumer spending (the headline US CPI index rose +0.9% and +0.4% in October and September, respectively). For the Fed, the case is building to begin preparing Americans for higher interest rates in 2022. This is true both from an economic perspective – the US economy is likely to continue growing above trend next year, further tightening the US labor market – and in response to the high inflation that has caused some damage to the Fed’s credibility. What About The UK And Euro Area? Looking across the Atlantic, survey-based measures of inflation expectations have also climbed steadily higher (Chart 10). The YouGov/Citigroup survey of UK consumer inflation expectations is now at 4.4% for the 1-year-ahead measure and 3.7% for the longer-run 5-10 year ahead measure, both well above the BoE’s 2% inflation target. The European Commission surveys show a rapidly rising share of European Union businesses and consumers expect higher prices in the coming months. Yet while inflation expectations are rising in both the UK and Europe, only the UK shows the sort of deterioration in central bank confidence that is evident in the US. 48% of Europeans expressed confidence in the ECB, according to the Eurobarometer public opinion surveys – the highest share since 2007 and well above the 36% level seen after the Global Financial Crisis and European Debt Crisis (Chart 11). Some of that improvement in perceptions of the ECB mirrors better sentiment over the euro currency itself, as evidenced by that fact that both Germans and Italians now express similar levels of ECB confidence. Chart 10High Inflation Is Also A Problem Outside The US
High Inflation Is Also A Problem Outside The US
High Inflation Is Also A Problem Outside The US
Chart 11Europeans Have Not Lost Confidence In The ECB
Europeans Have Not Lost Confidence In The ECB
Europeans Have Not Lost Confidence In The ECB
High levels of public trust in the ECB play an important role in anchoring European inflation expectations. The ECB introduced its own Consumer Expectations Survey as a pilot project last year, and the latest reading from October 2021 shows that 1-year-ahead inflation expectations are now at 3% and 3-year-ahead expectations are at 2%. Both measures were at 2% a year earlier, and have generally stayed close to ECB’s 2% inflation target since the survey began. Chart 12High Inflation Is Worsening Public Satisfaction With The BoE
High Inflation Is Worsening Public Satisfaction With The BoE
High Inflation Is Worsening Public Satisfaction With The BoE
A recent research report from the Bank of Finland concluded that European consumers who have high trust in the ECB adjust their medium-term inflation expectations more slowly than those with low trust. The high public confidence in the ECB seen in the Eurobarometer surveys, combined with the stability of medium-term inflation expectations (both survey-based and market-based) around the ECB’s 2% target – even with realized euro area inflation now at 3.4% - fits with the conclusions of that report. We read this as a sign that the ECB is not under the same growing pressure to tighten policy in the face of rising inflation as the Fed, which is facing an erosion of public confidence that is showing up in steadily rising inflation expectations. In the UK, the Bank of England (BoE) is facing a situation more akin to that of the Fed. The BoE’s Inflation Attitudes Survey has been showing a steady erosion of UK consumers reporting satisfaction with how the BoE has been setting policy to fight inflation (Chart 12). The “net satisfied” index fell to +18% in the last survey published in September – similarly low levels of BoE satisfaction coincided with major spikes in longer-term UK inflation expectations in 2008 and 2011 (bottom panel). Our conclusion from the UK consumer surveys, along with measures of inflation expectations that are well above the BoE medium-term target, is similar to that in the US. The UK public is losing faith in the BoE’s ability, or willingness, to tackle the high inflation “problem” – even if much of the inflation is caused by high energy prices and global supply chain disruptions that are beyond the immediate control of monetary policy. The BoE will likely need to follow through on the rate hikes markets expect in 2022 to help restore public trust and credibility, even if realized inflation slows from current elevated levels. This is especially true after the debacle of the November 4 BoE meeting where a widely-signaled rate hike did not occur. If the BoE continues to delay the start of tightening while inflation expectations are accelerating, this will only put more pressure on the central bank to tighten faster, and by more than expected, in a bid to stabilize inflation expectations. Investment Conclusions Chart 13Favor European Government Bonds Over US & UK Equivalents
Favor European Government Bonds Over US & UK Equivalents
Favor European Government Bonds Over US & UK Equivalents
Our read of the various surveys shows that public trust in central banks has deteriorated in the US and UK, but not in Europe, because of surging inflation in 2021. This compounds the existing trends of tightening labor markets and accelerating wage growth in the US and UK that are more traditional reasons to tighten monetary policy. We continue to favor strategic overweights in euro area government bonds (both core and periphery) versus US Treasuries and UK Gilts, given the far greater likelihood of multiple rate hikes in the UK and US in 2022/23 in order to restore public trust in the Fed and BoE (Chart 13). The ECB can continue to be patient on responding to higher euro area inflation, given more stable euro area inflation expectations and with limited evidence that higher realized inflation is boosting European wage growth. Robert Robis, CFA Chief Fixed Income Strategist rrobis@bcaresearch.com Recommendations Duration Regional Allocation Spread Product Tactical Trades GFIS Model Bond Portfolio Recommended Positioning Active Duration Contribution: GFIS Recommended Portfolio Vs. Custom Performance Benchmark
Image
The GFIS Recommended Portfolio Vs. The Custom Benchmark Index
Dear Client, This week, the US Bond Strategy service is hosting its Quarterly Webcast (November 16 at 10:00 AM EST, 15:00 PM GMT, 16:00 PM CET and November 17 at 9:00 HKT, 11:00 AEST). In addition, we are sending this Quarterly Chartpack that provides a recap of our key recommendations and some charts related to those recommendations and other areas of interest for US bond investors. Please tune in to the Webcast and browse the Chartpack at your leisure, and do let us know if you have any questions or other feedback. To view the Quarterly Chartpack PDF please click here. Best regards, Ryan Swift, US Bond Strategist
The Bank of Mexico raised rates by 25 bps on Thursday, marking the fourth consecutive rate increase this year and bringing the benchmark rate to 5%. These hikes come as the central bank attempts to temper rising inflation. At 6.24% y/y, CPI headline inflation…
Highlights US growth will slow next year, not because demand will falter, but because supply-side constraints will prevent the economy from producing as much output as households and businesses want to buy. If aggregate demand exceeds aggregate supply, the price level will rise. We argue that the US aggregate demand curve is currently quite steep. This implies that the price level may need to rise a lot to restore balance to the economy. In fact, if the aggregate demand curve is not just steep but upward-sloping, which is quite possible, there may be no price level that brings aggregate demand in line with supply; the US economy could go supernova. When supply is the binding constraint to growth, investors need to throw the old playbook for dealing with growth slowdowns out the window. Rather than positioning for lower bond yields, investors should position for higher yields. Rather than expecting a stronger dollar, investors should expect a weaker one. Rather than favoring growth stocks, large caps, and defensives, investors should favor value stocks, small caps, and cyclicals. The Binding Constraint To Growth Is Now Supply After a post-Delta wave rebound in Q4, the US economy is expected to slow over the course of 2022. The Bloomberg consensus is for US growth to decelerate from 4.9% in 2021Q4 to 4.1% in 2022Q1, 3.9% in 2022Q2, 3.0% in 2022Q3, and 2.5% in 2022Q4. Growth in the first quarter of 2023 is expected to dip further to 2.3%. We agree that US growth will slow next year but think the market narrative around this slowdown is misguided. Chart 1Plenty Of Pent-Up Demand
Plenty Of Pent-Up Demand
Plenty Of Pent-Up Demand
The standard market playbook for dealing with an economic slowdown is to position for lower bond yields, a stronger US dollar, and a decline in commodity prices. On the equity side, the playbook calls for shifting equity exposure from cyclicals to defensives, favoring large caps over small caps, and growth stocks over value stocks. There are two major problems with this narrative. First, growth is peaking at much higher levels than before and is unlikely to return to trend at least until the second half of 2023. Second, and more importantly, US growth will slow due to supply-side constraints rather than inadequate demand. US final demand will remain robust for the foreseeable future. Households are sitting on $2.3 trillion in excess savings, equivalent to 15% of annual consumption (Chart 1). The household deleveraging cycle is over. After initially plunging during the pandemic, credit card balances are rising (Chart 2). Banks are falling over themselves to make consumer loans (Chart 3). Chart 2Revolving Credit On The Rise Again
Revolving Credit On The Rise Again
Revolving Credit On The Rise Again
Chart 3Banks Are Easing Credit Standards For Consumers
Banks Are Easing Credit Standards For Consumers
Banks Are Easing Credit Standards For Consumers
Chart 4A Record Rise In Household Net Worth
A Record Rise In Household Net Worth
A Record Rise In Household Net Worth
Household net worth has risen by over 100% of GDP since the start of the pandemic (Chart 4). As we discussed two weeks ago, the wealth effect alone could boost annual consumer spending by up to 4% of GDP. Investment demand should remain strong. Business inventories are near record low levels (Chart 5). Core capital goods orders, a leading indicator for corporate capex, have soared (Chart 6). Chart 5Business Inventories Are Near Record Low Levels
Business Inventories Are Near Record Low Levels
Business Inventories Are Near Record Low Levels
Chart 6Rise In Durable Goods Orders Bodes Well For Capex
Rise In Durable Goods Orders Bodes Well For Capex
Rise In Durable Goods Orders Bodes Well For Capex
Chart 7The Homeowner Vacancy Rate Is Signaling The Need For More Homebuilding
The Homeowner Vacancy Rate Is Signaling The Need For More Homebuilding
The Homeowner Vacancy Rate Is Signaling The Need For More Homebuilding
The Dodge Momentum Index, which tracks planned nonresidential construction, rose to a 13-year high in October. The homeowner vacancy rate is at multi-decade lows, signifying the need for more homebuilding (Chart 7). While increased investment will augment the nation’s capital stock down the road, the short-to-medium term effect will be to inflate demand. Policy Won’t Tighten Enough To Cool The Economy What is the mechanism that will push down aggregate demand growth towards potential GDP growth? It is unlikely to be policy. While budget deficits will narrow over the next few years, the IMF still expects the US cyclically-adjusted primary budget deficit to be nearly 3% of GDP larger between 2022 and 2026 than it was between 2014 and 2019 (Chart 8).
Chart 8
Chart 9The Fed And Investors Still Believe In Secular Stagnation
The Fed And Investors Still Believe In Secular Stagnation
The Fed And Investors Still Believe In Secular Stagnation
As Matt Gertken, BCA’s Chief Geopolitical Strategist, writes in this week’s US Political Strategy report, the passage of the $550 billion infrastructure bill has increased, not decreased, the odds of President Biden and the Democrats passing their social spending bill via the partisan budget reconciliation process. On the monetary side, the Federal Reserve will finish tapering asset purchases next June and begin raising rates shortly thereafter. However, the Fed has no intention of raising rates aggressively. Most FOMC members see the Fed funds rate rising to only 2.5% this cycle (Chart 9). The “dots” call for only one rate hike in 2022 and three rate hikes in both 2023 and 2024. Investors expect rates to rise even less by end-2024 than the Fed foresees (Chart 10).
Chart 10
The Inflation Outlook Hinges On The Slope Of The Aggregate Demand Curve If policy tightening will not suffice in cooling demand, the economy will overheat and inflation will rise. But by how much will inflation increase? The answer is of great importance to investors. It also hinges on a seemingly technical question: What is the slope of the aggregate demand curve? As Chart 11 illustrates, prices will rise more if the aggregate demand curve is steep than if it is flat.
Chart 11
Chart 12Wages Rose Faster Than Prices During The Inflationary Late-60s and 70s
Wages Rose Faster Than Prices During The Inflationary Late-60s and 70s
Wages Rose Faster Than Prices During The Inflationary Late-60s and 70s
It is tempting to think of the aggregate demand curve in the same way one might think of the demand curve for, say, apples. When the price of apples rises, there is both a substitution and an income effect. An increase in the price of apples will cause shoppers to substitute away from apples towards oranges. In addition, if apples are so-called “normal goods,” shoppers will buy fewer apples in response to lower real incomes. This chain of reasoning breaks down at the aggregate level. When economists say the price level has risen, they are referring to all prices; hence, there is no substitution effect. Moreover, since one person’s spending is another’s income, rising prices do not necessarily translate into lower overall real incomes. Granted, if nominal wages are sticky, as they usually are in the short run, an unanticipated increase in prices will reduce real wage income. However, this will be offset by higher business income. Over time, wages tend to catch up with prices. In fact, wage growth usually outstrips price growth during inflationary periods. For example, real wages rose during the late-1960s and 70s but fell during the disinflationary 1980s (Chart 12). Textbook Reasons For A Downward-Sloping Aggregate Demand Curve According to standard economic theory, there are three main reasons why aggregate demand curves are downward-sloping: The Pigou Effect: Higher prices erode the purchasing power of money, resulting in a negative wealth effect. The Keynes Effect: Higher prices reduce the real money supply. This pushes up real interest rates, leading to lower investment spending. The Mundell-Fleming Effect: Higher real rates push up the value of the currency, causing net exports to decline. None of these three factors are particularly important for the US these days. Chart 13Base Money Has Swollen Since The Subprime Crisis
Base Money Has Swollen Since The Subprime Crisis
Base Money Has Swollen Since The Subprime Crisis
Strictly speaking, the Pigou wealth effect applies only to “base money,” also known as “outside money.” Outside money includes cash notes, coins, and bank reserves. Inside money such as bank deposits are not included in the Pigou effect because while an increase in consumer prices decreases the real value of bank deposits, it also decreases the real value of commercial bank liabilities.1 In the US, the monetary base has swollen from 6% of GDP in 2008 to 28% of GDP as a result of the Fed’s QE programs (Chart 13). Nevertheless, even if one were to generously assume a wealth effect of 10% from changes in monetary holdings, this would still imply that a 1% increase in consumer prices would reduce spending by only 0.03% of GDP. Simply put, the Pigou effect is just not all that big.
Chart 14
In contrast to the Pigou effect, the Keynes effect has historically had a significant impact on the business cycle. However, the importance of the Keynes effect faded following the Global Financial Crisis as the Fed found itself up against the zero lower bound on interest rates. When interest rates are very low, there is little to distinguish money from bonds. Rather than holding money as a medium of exchange (i.e., for financing transactions), households and businesses end up holding money mainly as a store of wealth. In the presence of the zero bound, the demand for money becomes perfectly elastic with respect to the interest rate (Chart 14). As a result, changes in the real money supply have no effect on interest rates, and by extension, interest-rate sensitive spending. And if a decline in the real money supply does not push up interest rates, this undermines the Mundell-Fleming effect as well. Could The Aggregate Demand Curve Be Upward-Sloping? The discussion above, though rather theoretical in nature, highlights an important practical point: The aggregate demand curve may be quite steep. This means that the price level might need to rise a lot to equalize aggregate demand with aggregate supply. Chart 15US Real Bond Yields Hitting Record Lows
US Real Bond Yields Hitting Record Lows
US Real Bond Yields Hitting Record Lows
In fact, one can easily envision a scenario where a rising price level boosts spending; that is, where the demand curve is not just steep but upward-sloping. One normally assumes that higher inflation will prompt central banks to raise rates by more than inflation has risen, leading to higher real rates. However, if the Fed drags its feet in hiking rates, as it is wont to do given its concerns about the zero bound, rising inflation will translate into a decline in real rates. Lower rates will boost demand, leading to higher inflation, and even lower real rates. In addition, lower real rates will benefit debtors, who tend to have a higher marginal propensity to spend than creditors. This, too, will also boost aggregate demand. It is striking in this regard that real bond yields hit a record low this week, with the 10-year TIPS yield falling to -1.17% and the 30-year yield drooping to -0.57% (Chart 15). Black Holes Vs. Supernovas
Chart 16
In the case where the aggregate demand curve is upward-sloping, there is no stable equilibrium (Chart 16). If demand falls short of supply, demand will continue to shrink as the price level declines, leading to ever-rising unemployment. Unless policymakers intervene with stimulus, the economy will sink into a deflationary black hole. In contrast, if demand exceeds supply, demand will continue to rise as the price level increases exponentially. The economy will go supernova. Tick Tock Young stars fuse hydrogen into helium, releasing excess energy in the process. After the star has run out of hydrogen, if it is big enough, it will start fusing helium into heavier elements such as carbon and oxygen. The process of nucleosynthesis continues until it reaches iron. That is the end of the line. Fusing elements heavier than iron requires a net input of energy. Unable to generate enough external pressure through fusion, the star loses its battle to gravity. The core collapses, spewing material deep into interstellar space (a good thing since your body is mainly made from this stardust). Observing the star from afar, one would be hard-pressed to see anything abnormal until it explodes. The path to becoming a supernova is highly non-linear. The same is true for inflation. Just like a star with an ample supply of hydrogen, the Fed can burn through its credibility for a while longer. During the 1960s, it took four years for inflation to take off after the economy had reached full employment (Chart 17). By that time, the unemployment rate was two percentage points below NAIRU. Most of today’s inflation is confined to durable goods. This is not a sustainable source of inflation. The durable goods sector is the only part of the CPI where prices usually fall over time (Chart 18). Chart 17Inflation Spiked In The 1960s Only Once The Unemployment Rate Had Fallen Far Below Equilibrium
Inflation Spiked In The 1960s Only Once The Unemployment Rate Had Fallen Far Below Equilibrium
Inflation Spiked In The 1960s Only Once The Unemployment Rate Had Fallen Far Below Equilibrium
Chart 18Inflation Has Been Concentrated In Durable Goods, A Sector Where Prices Usually Fall Over Time
Inflation Has Been Concentrated In Durable Goods, A Sector Where Prices Usually Fall Over Time
Inflation Has Been Concentrated In Durable Goods, A Sector Where Prices Usually Fall Over Time
To get inflation to go up and stay up in modern service-based economies, wages need to rise briskly. While US wage growth has picked up, the bulk of the increase has been among low-wage workers, particularly in the services and hospitality sector (Chart 19). Chart 19Wage Growth Has Picked Up, But Mainly At The Bottom Of The Income Distribution
Wage Growth Has Picked Up, But Mainly At The Bottom Of The Income Distribution
Wage Growth Has Picked Up, But Mainly At The Bottom Of The Income Distribution
The most likely scenario for next year is that firms will simply ration output, fearful that raising prices too quickly will hurt brand loyalty and trigger accusations of price gouging. Shortages will persist, but this time they will be increasingly concentrated in the service sector. Such a state of affairs will not last, however. Competition for workers will cause wages to rise much more than they have so far. Keen to protect profit margins, firms will start jacking up prices. A wage-price spiral will develop. The US economy could go supernova. Investment Conclusions Chart 20Long-Term Inflation Expectations Are Near The Bottom End Of The Fed's Comfort Zone
Long-Term Inflation Expectations Are Near The Bottom End Of The Fed's Comfort Zone
Long-Term Inflation Expectations Are Near The Bottom End Of The Fed's Comfort Zone
US growth will slow next year, not because demand will falter, but because supply-side constraints will prevent the economy from producing as much output as households and businesses want to buy. This means that the old playbook for dealing with growth slowdowns needs to be thrown out the window. Rather than positioning for lower bond yields, investors should position for higher yields. Rather than expecting a stronger dollar, investors should expect a weaker one. Rather than favoring growth stocks, large caps, and defensives, investors should favor value stocks, small caps, and cyclicals. While inflation expectations have recovered from their pandemic lows, the 5-year/5-year forward TIPS breakeven inflation rate is still near the bottom end of the Fed’s comfort zone (Chart 20). Rising inflation expectations will lift long-term bond yields, justifying a short duration stance in fixed-income portfolios. Higher bond yields will benefit value stocks. Chart 21 shows that there has been a strong correlation between the relative performance of growth and value stocks and the 30-year bond yield this year. Rising input prices will make the US export sector less competitive, leading to a weaker dollar. Historically, non-US stocks have done well when the dollar has been weakening (Chart 22). Chart 21The Relative Performance of Value Stocks Has Closely Tracked Bond Yields This Year
The Relative Performance of Value Stocks Has Closely Tracked Bond Yields This Year
The Relative Performance of Value Stocks Has Closely Tracked Bond Yields This Year
Chart 22Non-US Stocks Tend To Do Best When The US Dollar Is Weakening
Non-US Stocks Tend To Do Best When The US Dollar Is Weakening
Non-US Stocks Tend To Do Best When The US Dollar Is Weakening
As for the overall stock market, with the Fed still in the dovish camp, it is too early to turn negative on equities. An equity bear market is coming, but not until rising inflation forces the Fed to step up the pace of rate hikes. That will probably not happen until mid-2023. Short Gilt Trade Activated We noted last week that we would go short the 10-year UK Gilt if the yield broke below 0.85%. Our limit order was activated on November 5th and we are now short this security. Peter Berezin Chief Global Strategist pberezin@bcaresearch.com Footnotes 1 To distinguish between inside and outside money, one should ask where the liability resides. If the liability resides within the private sector, it is inside money. By convention, central bank reserves are classified as outside money. However, one could argue that since taxpayers ultimately own the central bank, an increase in the price level will benefit taxpayers by eroding the real value of the central bank’s liability. If one were to take this view, the Pigou effect would be even weaker. Global Investment Strategy View Matrix
Image
Special Trade Recommendations
Image
Current MacroQuant Model Scores
Image
Highlights Geopolitical conflicts point to energy price spikes and could add to inflation surprises in the near term. However, US fiscal drag and China’s economic slowdown are both disinflationary risks to be aware of. Specifically, energy-producers like Russia and Iran gain greater leverage amid energy shortages. Europe’s natural gas prices could spike again. Conflict in the Middle East could disrupt oil flows. President Biden’s $1.75 trillion social spending bill is a litmus test for fiscal fatigue in developed markets. It could fail, and even assuming it passes it will not prevent overall fiscal drag in 2022-23. However, it is inflationary over the long run. China’s slowdown poses the chief disinflationary risk. But we still think policy will ease to avoid an economic crash ahead of the fall 2022 national party congress. We are closing this year’s long value / short growth trade for a loss of 3.75%. Cyclical sectors ended up being a better way to play the reopening trade. Feature Equity markets rallied in recent weeks despite sharp upward moves in core inflation across the world (Chart 1). Inflation is fast becoming a popular concern and we see geopolitical risks that could drive headline inflation still higher in the short run. We also see underrated disinflationary factors, namely China’s property sector distress and economic slowdown. Several major developments have occurred in recent weeks that we will cover in this report. Our conclusions: Biden’s domestic agenda will pass but risks are high and macro impact is limited. Congress passed Biden’s infrastructure deal and will probably still pass his signature social spending bill, although inflation is creating pushback. Together these bills have little impact on the budget deficit outlook but they will add to inflationary pressures. Energy shortages embolden Russia and Iran. Winter weather is unpredictable, the energy crisis may not be over. But investors are underrating Russia’s aggressive posture toward the West. Any conflict with Iran could also cause oil disruptions in the near future. US-China relations may improve but not for long. A bilateral summit between Presidents Joe Biden and Xi Jinping will not reduce tensions for very long, if at all. Climate change cooperation is an insufficient basis to reverse the cold war-style confrontation over the long run. Chart 1Inflation Rattles Policymakers
Inflation Rattles Policymakers
Inflation Rattles Policymakers
The investment takeaway is that geopolitical tensions could push energy prices still higher in the short term. Iran and Russia need to be monitored. However, China’s economic slowdown will weigh on growth. China poses an underrated disinflationary risk to our views. US Congress: Bellwether For Fiscal Fatigue While inflation is starting to trouble households and voters, investors should bear in mind that the current set of politicians have long aimed to generate an inflation overshoot. They spent the previous decade in fear of deflation, since it generated anti-establishment or populist parties that threatened to disrupt the political system. They quietly built up an institutional consensus around more robust fiscal policy and monetary-fiscal coordination. Now they are seeing that agenda succeed but are facing the first major hurdle in the form of higher prices. They will not simply cut and run. Inflation is accompanied by rising wages, which today’s leaders want to see – almost all of them have promised households a greater share of the fruits of their labor, in keeping with the new, pro-worker, populist zeitgeist. Real wages are growing at 1.1% in the US and 0.9% across the G7 (Chart 2). Even more than central bankers, political leaders are focused on jobs and employment, i.e. voters. Yet the labor market still has considerable slack (Chart 3). Almost all of the major western governments have been politically recapitalized since the pandemic, either through elections or new coalitions. Almost all of them were elected on promises of robust public investment programs to “build back better,” i.e. create jobs, build infrastructure, revitalize industry, and decarbonize the energy economy. Thus while they are concerned about inflation, they will leave that to central banks, as they will be loathe to abandon their grand investment plans. Chart 2Higher Wages: Real Or Nominal?
Higher Wages: Real Or Nominal?
Higher Wages: Real Or Nominal?
Still, there will be a breaking point at which inflation forces governments to put their spending plans on hold. The US Congress is the immediate test of whether today’s inflation will trigger fiscal fatigue and force a course correction. Chart 3Policymakers Fear Populism, Focus On Employment
Policymakers Fear Populism, Focus On Employment
Policymakers Fear Populism, Focus On Employment
President Biden’s $550 billion infrastructure bill passed Congress last week and will be signed into law around November 15. Now he is worried that his signature $1.75 trillion social spending bill will falter due to inflation fears. He cannot spare a single vote in the Senate (and only three votes in the House of Representatives). Odds that the bill fails are about 35%. Democratic Party leaders will not abandon the cause due to recent inflation prints. They see a once-in-a-generation opportunity to expand the role of government, the social safety net, and the interests of their constituents. If they miss this chance due to inflation that ends up being transitory then they will lose the enthusiastic left wing of the party and suffer a devastating loss in next year’s midterm elections, in which they are already at a disadvantage. Biden’s social bill is also likely to pass because the budget reconciliation process necessary to pass the bill is the same process needed to raise the national debt limit by December 3. A linkage of the two by party leaders would ensure that both pass … and otherwise Democrats risk self-inflicting a national debt default. The reconciliation bill is more about long-term than short-term inflation risk. The bill does not look to have a substantial impact on the budget outlook: the new spending is partially offset by new taxes and spread out over ten years. The various legislative scenarios look virtually the same in our back-of-the-envelope budget projections (Chart 4).
Chart 4
However, given that the output gap is virtually closed, this bill combined with the infrastructure bill will add to inflationary pressures. The fiscal drag will diminish by 2024, not coincidentally the presidential election year 2024, not coincidentally the presidential election year. The deficit is not expected to increase or decrease substantially between 2023 and 2024. From then onward the budget deficit will expand. The increased government demand for goods and services and the increased disposable income for low-earning families will add to inflationary pressures. Other developed markets face a similar situation: inflation is picking up, but big spending has been promised and normalizing budgets will marginally weigh on growth in the next few years (Chart 5). True, growth should hold up since the private economy is rebounding in the wake of the pandemic. But politicians will not be inclined to renege on campaign promises of liberal spending in the face of fiscal drag. The current crop of leaders is primed to make major public investments. This is true of Germany, Japan, Canada, and Italy as well as the United States. It is partly true in France, where fiscal retrenchment has been put on hold given the presidential election in the spring. The effect will be inflationary, especially for the US where populist spending is more extravagant than elsewhere.
Chart 5
The long run will depend on structural factors and how much the new investments improve productivity. Bottom Line: A single vote in the US Senate could derail the president’s social spending bill, so the US is now the bellwether for fiscal fatigue in the developed world. Biden is likely to pass the bill, as global fiscal drag is disinflationary over the next 12 months. Yet inflation could stay elevated for other reasons. And this fiscal drag will dissipate later in the business cycle. Russia And Iran Gain Leverage Amid Energy Crunch The global energy price spike arose from a combination of structural factors – namely the pandemic and stimulus. It has abated in recent weeks but will remain a latent problem through the winter season, especially if La Niña makes temperatures unusually cold as expected. Rising energy prices feed into general producer prices, which are being passed onto consumers (Chart 6). They look to be moderating but the weather is unpredictable. There is another reason that near-term energy prices could spike or stay elevated: geopolitics. Tight global energy supply-demand balances mean that there is little margin of safety if unexpected supply disruptions occur. This gives greater leverage to energy producers, two of which are especially relevant at the moment: Russia and Iran. Russia’s long-running conflict with the West is heating up on several fronts, as expected. Russia may not have caused the European energy crisis but it is exacerbating shortages by restricting flows of natural gas for political reasons, as it is wont to do (Chart 7). Moscow always maintains plausible deniability but it is currently flexing its energy muscles in several areas: Chart 6Energy Price Depends On Winter ... And Russia/Iran!
Energy Price Depends On Winter ... And Russia/Iran!
Energy Price Depends On Winter ... And Russia/Iran!
Ukraine: Russia has avoided filling up and fully utilizing pipelines and storage facilities in Ukraine, where the US is now warning that Russia could stage a large military action in retaliation for Ukrainian drone strikes in the still-simmering Russia-Ukraine war. Belarus: Russia says it will not increase the gas flow through the major Yamal-Europe natural gas pipeline in 2022 even as Belarus threatens to halt the pipeline’s operation entirely. Belarus, backed by Russia, is locked in a conflict with Poland and the EU over Belarus’s funneling of migrants into their territory (Chart 8). The conflict could lead not only to energy supply disruptions but also to a broader closure of trade and a military standoff.1 Russia has flown two Tu-160 nuclear-armed bombers over Belarus and the border area in a sign of support. Moldova: Russia is withholding natural gas to pressure the new, pro-EU Moldovan government.
Chart 7
Chart 8
Russia’s main motive is obvious: it wants Germany and the EU to approve and certify the new Nord Stream II pipeline. Nord Stream II enables Germany and Russia to bypass Ukraine, where pipeline politics raise the risk of shortages and wars. Lame duck German Chancellor Angela Merkel worked with Russia to complete this pipeline before the end of her term, convincing the Biden administration to issue a waiver on congressional sanctions that could have halted its construction. However, two of the parties in the incoming German government, the Greens and the Free Democrats, oppose the pipeline. While these parties may not have been able to stop the pipeline from operating, Russia does not want to take any chances and is trying to force Germany’s and the EU’s hand. The energy crisis makes it more likely that the pipeline will be approved, since the European Commission will have to make its decision during a period when cold weather and shortages will make it politically acceptable to certify the pipeline.2 The decision will further drive a wedge between Germany and eastern EU members, which is what Russia wants. EU natural gas prices will likely subside sometime next year and will probably not derail the economic recovery, according to both our commodity and Europe strategists. A bigger and longer-lasting Russian energy squeeze would emerge if the Nord Stream II pipeline is not certified. This is a low risk at this point but the next six months could bring surprises. More broadly, the West’s conflict with Russia can easily escalate from here. First, President Vladimir Putin faces economic challenges and weak political support. He frequently diverts popular attention by staging aggressive moves abroad. There is no reason to believe his post-2004 strategy of restoring Russia’s sphere of influence in the former Soviet space has changed. High energy prices give him greater leverage even aside from pipeline coercion – so it is not surprising that Russia is moving troops to the Ukraine border again. Growing military support for Belarus, or an expanded conflict in Ukraine, are likely to create a crisis now or later. Second, the US-Germany agreement to allow Nord Stream II explicitly states that Russia must not weaponize natural gas supply. This statement has had zero effect so far. But when the energy shortage subsides, the EU could pursue retaliatory measures along with the United States. Of course, Russia has been able to weather sanctions. But tensions are already escalating significantly. After Russia, Iran also gains leverage during times of tight energy supplies. With global oil inventories drawing down, Iran is in the position to inflict “maximum pressure” on the US and its allies, a role reversal from the 2017-20 period in which large inventories enabled the US to impose crippling sanctions on Iran after pulling out of the 2015 nuclear deal (Chart 9). Iran is rapidly advancing on its nuclear program and a new round of diplomatic negotiations may only serve to buy time before it crosses the “breakout” threshold of uranium enrichment capability as early as this month or next. In a recent special report we argued that there is a 40% chance of a crisis over Iran in the Middle East. Such a crisis could ultimately lead to an oil shock in the Persian Gulf or Strait of Hormuz. Chart 9Now Iran Can Use 'Maximum Pressure'
Now Iran Can Use 'Maximum Pressure'
Now Iran Can Use 'Maximum Pressure'
Bottom Line: Russia’s natural gas coercion of Europe could keep European energy prices high through March or May. More broadly Russia’s renewed tensions with the West confirm our view that oil producers gain geopolitical leverage amid the current supply shortages. Iran also gains leverage and its conflict with the US could lead to global oil supply disruptions anytime over the next 12 months. Until Nord Stream II is certified and a new Iranian nuclear agreement is signed, there are two clear sources of potential energy shocks. Moreover in today’s inflationary context there is limited margin of safety for unexpected supply disruptions regardless of source. Xi’s Historical Rewrite China continues to be a major source of risk for the global economy and financial markets in the lead-up to the twentieth national party congress in fall 2022. While Chinese assets have sold off this year, global risk assets are still vulnerable to negative surprises from China. The five-year political reshuffle in 2022 is more important than usual since President Xi Jinping was originally supposed to step down but will instead stick around as leader for life, like China’s previous strongmen Mao Zedong and Deng Xiaoping.3 Xi’s rejection of term limits became clear in 2017 and is not really news. But Xi will fortify himself and his faction in 2022 against any opposition whatsoever. He is extremely vigilant about any threats that could disrupt this process, whether at home or abroad. The Communist Party’s sixth plenary session this week highlights both Xi’s success within the Communist Party and the sensitivity of the period. Xi produced a new “historical resolution,” or interpretation of the party’s history, which is only the third such resolution. A few remarks on this historical resolution are pertinent: Mao’s resolution: Chairman Mao wrote the first such resolution in 1945 to lay down his version of the party’s history and solidify his personal control. It is naturally a revolutionary leftist document. Deng’s revision of Mao: General Deng Xiaoping then produced a major revision in 1981, shortly after initiating China’s economic opening and reform. Deng’s interpretation aimed to hold Mao accountable for “gross mistakes” during the Cultural Revolution and yet to recognize the Communist Party’s positive achievements in founding the People’s Republic. His version gave credit to the party and collective leadership rather than Mao’s personal rule. Two 30-year periods: The implication was that the party’s history should be divided into two thirty-year periods: the period of foundations and conflict with Mao as the party’s core and the period of improvement and prosperity with Deng as the core. Jiang’s support of Deng: Deng’s telling came under scrutiny from new leftists in the wake of Tiananmen Square incident in 1989. But General Secretary Jiang Zemin largely held to Deng’s version of the story that the days of reform and opening were a far better example of the party’s leadership because they were so much more stable and prosperous.4 Xi’s reaction to Jiang and Deng: Since coming to power in 2012, Xi Jinping has shown an interest in revising the party’s official interpretation of its own history. The central claim of the revisionists is that China could never have achieved its economic success if not for Mao’s strongman rule. Mao’s rule and the Communist Party’s central control thus regain their centrality to modern China’s story. China’s prosperity owes its existence to these primary political conditions. The two periods cannot be separated. Xi’s synthesis of Deng and Mao: Now Xi has written himself into that history above all other figures – indeed the communique from the Sixth Plenum mentions Xi more often than Marx, Mao, or Deng (Chart 10). The implication is that Xi is the synthesis of Mao and Deng, as we argued back in 2017 at the end of the nineteenth national party congress. The synthesis consists of a strongman who nevertheless maintains a vibrant economy for strategic ends.
Chart 10
What are the practical policy implications of this history lesson? Higher Country Risk: China’s revival of personal rule, as opposed to consensus rule, marks a permanent increase in “country risk” and political risk for investors. Autocratic governments lack institutional guardrails (checks and balances) that prevent drastic policy mistakes. When Xi tries to step down there will probably be a succession crisis. Higher Macroeconomic Risk: China is more likely to get stuck in the “middle-income trap.” Liberal or pro-market economic reform is de-emphasized both in the new historical resolution and in the Xi administration’s broader program. Centralization is already suppressing animal spirits, entrepreneurship, and the private sector. Higher Geopolitical Risk: The return to autocracy and the withdrawal from economic liberalism also entail a conflict with the United States, which is still the world’s largest economy and most powerful military. The US is not what it once was but it will put pressure on China’s economy and build alliances aimed at strategic containment. Bottom Line: China is trying to escape the middle-income trap, like Taiwan, Japan, and South Korea, but it is trying to do so by means of autocracy, import substitution, and conflict with the United States. These other Asian economies improved productivity by democratizing, embracing globalization, and maintaining a special relationship with the United States. China’s odds of succeeding are low. China will focus on power consolidation through fall 2022 and this will lead to negative surprises for financial markets. China Slowdown: The Disinflationary Risk While it is very unlikely that Xi will face serious challenges to his rule, strange things can happen at critical junctures. Therefore the regime will be extremely alert for any threats, foreign or domestic, and will ultimately prioritize politics above all other things, which means investors will suffer negative surprises. The lingering pandemic still poses an inflationary risk for the rest of the world while the other main risk is disinflationary: Inflationary Risk – Zero COVID: The “Covid Zero” policy of attempting to stamp out any trace of the virus will still be relevant at least over the next 12 months (Chart 11). Clampdowns serve a dual purpose since the Xi administration wants to minimize foreign interference and domestic dissent before the party congress. Hence the global economy can suffer more negative supply shocks if ports or factories are closed. Inflationary Risk – Energy Closures: The government is rationing electricity amid energy shortages to prioritize household heating and essential services. This could hurt factory output over the winter if the weather is bad. Disinflationary Risk – Property Bust: The country is still flirting with overtightening monetary, fiscal, and regulatory policies. Throughout the year we have argued that authorities would avoid overtightening. But China is still very much in a danger zone in which policy mistakes could be made. Recent rumors suggest the government is trying to “correct the overcorrection” of regulatory policy. The government is reportedly mulling measures to relax the curbs on the property sector. We are inclined to agree but there is no sign yet that markets are responding, judging by corporate defaults and the crunch in financial conditions (Chart 12).
Chart 11
Chart 12China Has Not Contained Property Turmoil
China Has Not Contained Property Turmoil
China Has Not Contained Property Turmoil
Evergrande, the world’s most indebted property developer, is still hobbling along, but its troubles are not over. There are signs of contagion among other developers, including state-owned enterprises, that cannot meet the government’s “three red lines.” 5 Credit growth has now broken beneath the government’s target range of 12%, though money growth has bounced off the lower 8% limit set for this year (Chart 13). China is dangerously close to overtightening. China’s economic slowdown has not yet been fully felt in the global economy based on China’s import volumes, which are tightly linked to the combined credit-and-fiscal-spending impulse (Chart 14). The implication is that recent pullbacks in industrial metal prices and commodity indexes will continue. Chart 13China Tries To Avoid Over-Tightening
China Tries To Avoid Over-Tightening
China Tries To Avoid Over-Tightening
Chart 14China Slowdown Not Yet Fully Felt
China Slowdown Not Yet Fully Felt
China Slowdown Not Yet Fully Felt
Until China eases policy more substantially, it poses a disinflationary risk and a strong point in favor of the transitory view of global inflation. It is difficult for China to ease policy – let alone stimulate – when producer prices are so high (see Chart 6 above). The result is a dangerous quandary in which the government’s regulatory crackdowns are triggering a property bust yet the government is prevented from providing the usual policy support as the going gets tough. Asset prices and broader risk sentiment could go into free fall. However, the party has a powerful incentive to prevent a generalized crisis ahead of the party congress. So we are inclined to accept signs that property curbs and other policies will be eased. Bottom Line: The full disinflationary impact of China’s financial turmoil and economic slowdown has yet to be felt globally. Biden-Xi Summit Not A Game Changer As long as inflation prevents robust monetary and fiscal easing, Beijing is incentivized to improve sentiment in other ways. One way is to back away from the regulatory crackdown in other sectors, such as Big Tech. The other is to improve relations with the United States. A stabilization of US ties would be useful before the party congress since President Xi would prefer not to have the US interfering in China’s internal affairs during such a critical hour. No surprise that China is showing signs of trying to stabilize the relationship. The US is apparently reciprocating. Presidents Biden and Xi also agreed to hold a virtual bilateral summit next week, which could lead to a new series of talks. The US Trade Representative also plans to restart trade negotiations. The plan is to enforce the Phase One trade deal, issue waivers for tariffs that hurt US companies, and pursue new talks over outstanding structural disputes. The Phase One trade deal has fallen far short of its goals in general but on the energy front it is doing well. China will continue importing US commodities amid global shortages (Chart 15).
Chart 15
Chart 15
The summit alone will have a limited impact. Biden had a summit with Putin earlier this year but relations could deteriorate tomorrow over cyber-attacks, Ukraine, or Belarus. However, there is some basis for the US and China to cooperate next year: Iran. Xi is consolidating power at home in 2022 and probably wants to use negotiations to keep the Americans at bay. Biden is pivoting to foreign policy in 2022, since Congress will not get anything done, and will primarily focus on halting Iran’s nuclear program. If China assists the US with Iran, then there is a basis for a reduction in tensions. The problem is not only Iran itself but also that China will not jump to enforce sanctions on Iran amid energy shortages. And China is not about to make sweeping structural economic concessions to the US as the Xi administration doubles down on state-guided industrial policy. Meanwhile the US is pursuing a long-term policy of strategic containment and Biden will not want to be seen as appeasing China ahead of midterm elections, especially given Xi’s reversion to autocracy. What about cooperation on climate change? The US and China also delivered a surprise joint statement at the United Nations climate change conference in Scotland (COP26), confirming the widely held expectation that climate policy is an area of engagement. These powers and Europe have a strategic interest in reducing dependency on Middle Eastern oil (Chart 16). Climate talks will begin in the first half of next year. However, climate cooperation is not significant enough alone to outweigh the deeper conflicts between the US and China. Moreover climate policy itself is somewhat antagonistic, as the EU and US are looking at applying “carbon adjustment fees” to carbon-intensive imports, e.g. iron and steel exports from China and other high-polluting producers (Chart 17). While the EU and US are not on the same page yet, and these carbon tariffs are far from implementation, the emergence of green protectionism does not bode well for US-China relations even aside from their fundamental political and military disputes.
Chart 16
Bottom Line: Some short-term stabilization of US-China relations is possible but not guaranteed. Markets will cheer if it happens but the effect will be fleeting. Chinese assets are still extremely vulnerable to political and geopolitical risks.
Chart 17
Investment Takeaways Gold can still go higher. Financial markets are pricing higher inflation and weak real rates. Gold has been our chief trade to prepare both for higher inflation and geopolitical risk. We are closing our long value / growth equity trade for a loss of 3.75%. We are maintaining our long DM Europe / short EM Europe trade. This trade has performed poorly due to the rally in energy prices and hence Russian equities. But while energy prices may overshoot in the near term, investors will flee Russian equities as geopolitical risks materialize. We are maintaining our long Korea / short Taiwan trade despite its being deeply in the red. This trade is valid over a strategic or long-term time horizon, in which a major geopolitical crisis and/or war is likely. Our expectation that China will ease policy to stabilize the economy ahead of fall 2022 should support Korean equities. Matt Gertken Vice President Geopolitical Strategy mattg@bcaresearch.com Footnotes 1 Over the past year President Alexander Lukashenko’s repression of domestic unrest prompted the EU to impose sanctions. Lukashenko responded by organizing an immigration scheme in which Middle Eastern migrants are flown into Belarus and funneled into the EU via Poland. The EU is threatening to expand sanctions while Belarus is threatening to cut off the Yamal-Europe pipeline amid Europe’s energy crisis. See Pavel Felgenhauer, “Belarus as Latest Front in Acute East-West Standoff,” Jamestown Foundation, November 11, 2021, Jamestown.org. 2 Both Germany and the EU must approve of Nord Stream II for it to enter into operation. The German Federal Network Agency has until January 8, 2022 to certify the project. The Economy Ministry has already given the green light. Then the European Commission has two-to-four months to respond. The EU is supposed to consider whether the pipeline meets the EU’s requirement that gas transport be “unbundled” or separated from gas production and sales. This is a higher hurdle but Germany’s clout will be felt. Hence final approval could come by March 8 or May 8, 2022. The energy crisis will put pressure for an early certification but the EU Commission may take the full time to pretend that it is not being blackmailed. See Joseph Nasr and Christoph Steitz, “Certifying Nord Stream 2 poses no threat to gas supply to EU – Germany,” Reuters, October 26, 2021, reuters.com. 3 Xi is not serving for an “unprecedented third term,” as the mainstream media keeps reporting. China’s top office is not constant nor were term limits ever firmly established. Each leader’s reign should be measured by their effective control rather than technical terms in office. Mao reigned for 27 years (1949-76), Deng for 14 years or more (1978-92), Jiang Zemin for 10 years (1992-2002), and Hu Jintao for 10 years (2002-2012). 4 See Joseph Fewsmith, “Mao’s Shadow” Hoover Institution, China Leadership Monitor 43 (2014), and “The 19th Party Congress: Ringing In Xi Jinping’s New Age,” Hoover Institution, China Leadership Monitor 55 (2018), hoover.org. 5 Liability-to-asset ratios less than 70%, debt-to-equity less than 100%, and cash-to-short-term-debt ratios of more than 1.0x. Strategic View Open Tactical Positions (0-6 Months) Open Cyclical Recommendations (6-18 Months) Open Trades & Positions
Image
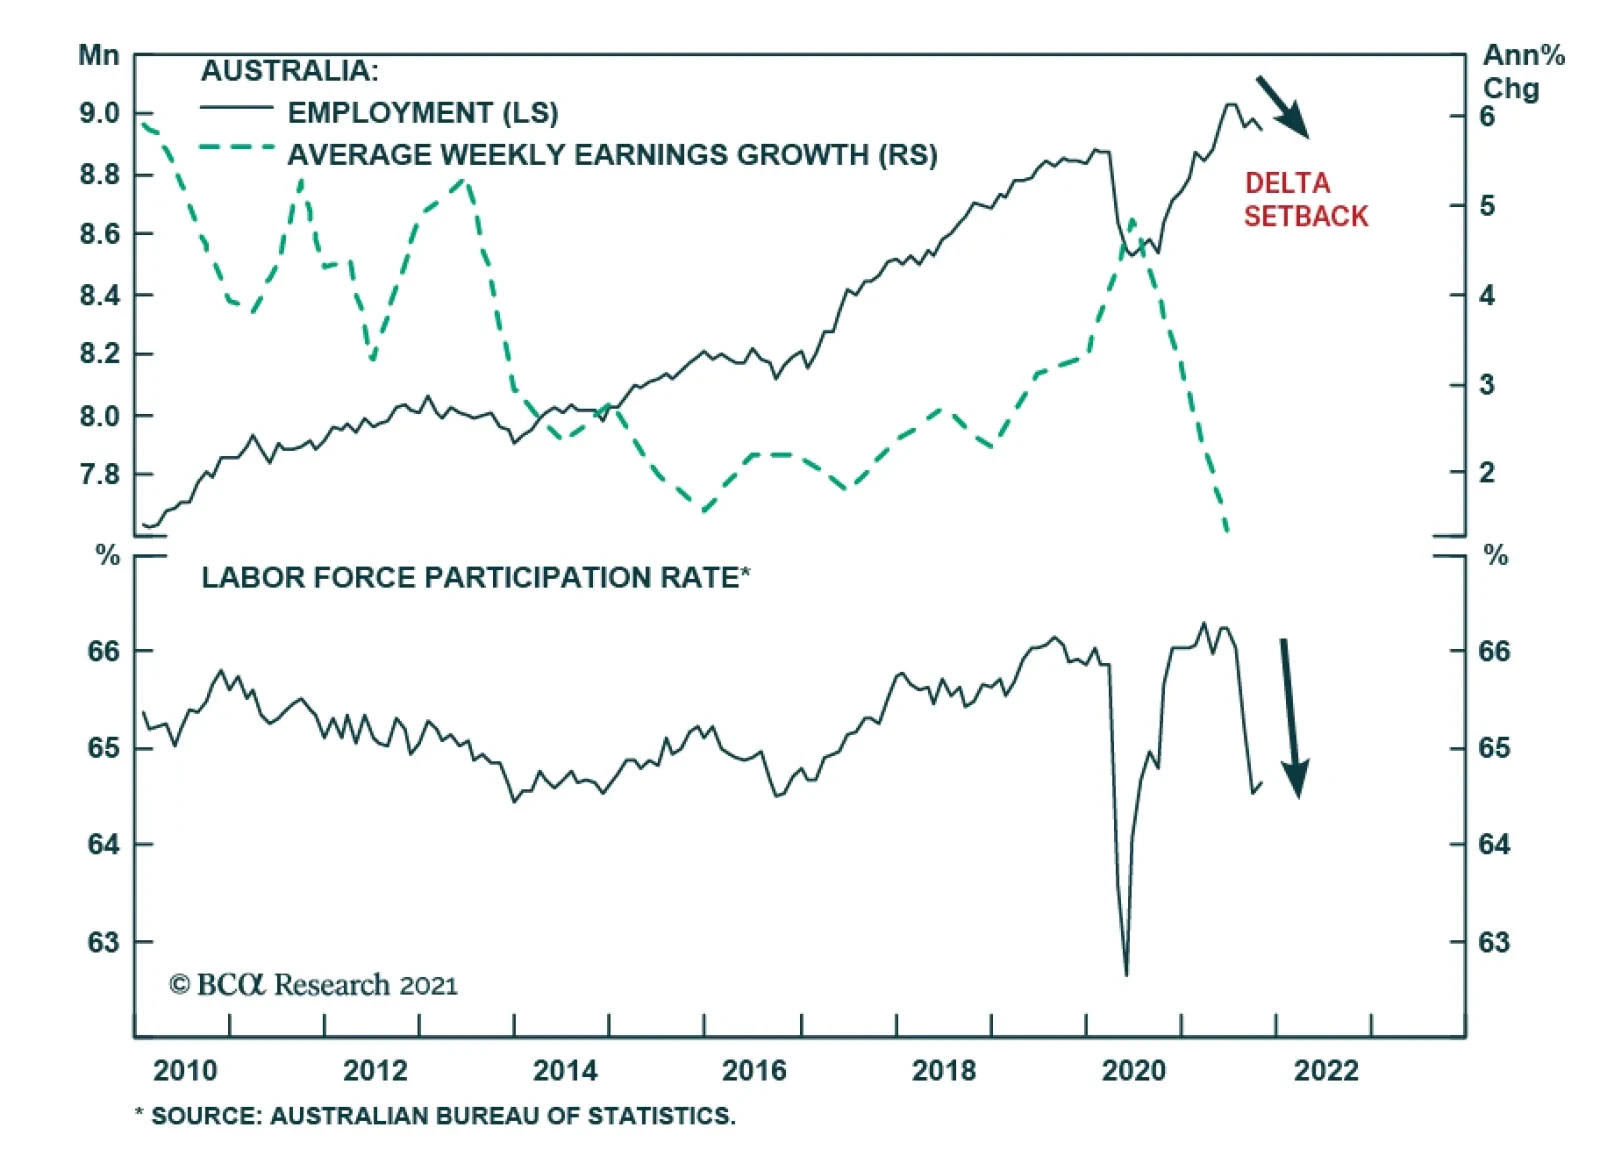
Rising inflationary pressures are seeping into Aussie inflation expectations which according to the Melbourne Institute reached 4.6% in November. Nevertheless, the RBA pushed back against market rate hike expectations at last week’s meeting. Instead, it…
Highlights So far, both the demand and supply side of the Philippine economy have been rather weak; yet there are signs that growth is set to revive. Fiscal expenditures have bottomed. Bank lending is also reviving. Acceleration in broad money supply is usually a good omen for stronger economic activity (Chart 1). Being a defensive market within EM, Philippine stocks will benefit in an impending period of weak EM stock prices. Upgrade this bourse from underweight to neutral in an EM equity portfolio. Philippine sovereign credit is also defensive in nature relative to its EM peers. Stay overweight in an EM portfolio. A deteriorating external accounts outlook makes the peso vulnerable. The central bank will also likely tolerate a weaker currency. Stay short the peso versus the US dollar. A vulnerable peso renders Philippine domestic bonds unappealing. Stay neutral in an EM domestic bonds portfolio. Feature The steep underperformance of Philippine stocks over the past several years is due for a pause. While this bourse may not see a sustainable rally in absolute terms, a period of flattish relative performance vis-à-vis the EM benchmark is likely. We recommend upgrading this market from underweight to neutral within an EM equity portfolio (Chart 2). Chart 1Accelerating Fiscal Spending And Credit Is A Good Omen For Economic Growth
Accelerating Fiscal Spending And Credit Is A Good Omen For Economic Growth
Accelerating Fiscal Spending And Credit Is A Good Omen For Economic Growth
Chart 2Philippine Stocks' Underperformance Is Set For A Breather But It's A Risk In Absolute Terms
Philippine Stocks' Underperformance Is Set For A Breather But It's A Risk In Absolute Terms
Philippine Stocks' Underperformance Is Set For A Breather But It's A Risk In Absolute Terms
One reason why Philippine stocks are unlikely to rally in absolute US dollar terms is a vulnerable peso. Philippine external accounts will likely deteriorate further, and therefore the peso is set to continue to trade on the weaker side. Currency investors should stick with our recommended short the peso versus US dollar trade for now. Philippine domestic bonds also remain unattractive to foreign investors. Local bond yields are not high enough relative to those of safe-haven bonds (US treasuries). As a result, the country is witnessing net debt portfolio outflows. The nation’s sovereign USD bonds, however, will likely outperform the EM benchmark going forward and merit an overweight stance in an EM sovereign bond portfolio. A Feeble Economy … The Philippine economy, so far, continues to be soft. Demand has been sluggish: manufacturing sales remain well below pre-pandemic levels – both in value and volume terms. So are car sales (Chart 3). On the supply side, production volume gives a similar message: they are still below pre-pandemic levels. Manufacturing PMI is barely in the expansion territory (Chart 4). In other words, there is palpable weakness in both the demand and supply side of the domestic economy. Chart 3The Demand Side Of The Economy Has Been Weak...
The Demand Side Of The Economy Has Been Weak...
The Demand Side Of The Economy Has Been Weak...
Chart 4...So Has Been The Supply Side
...So Has Been The Supply Side
...So Has Been The Supply Side
The soft domestic demand is also evident from the import cargo throughput in the country’s ports. While exports cargo has risen well above pre-pandemic levels, import cargo has not (Chart 5). Part of the reason behind the lingering frailty is muted fiscal spending. Over the past 12 months, the latter has decelerated measurably. To be sure, Philippine fiscal outlays during the entire pandemic period have not been extraordinary; and yet this has slowed further (Chart 6, top panel). Chart 5Weak Domestic Demand Is Also Evident In Still Subdued Imports
Weak Domestic Demand Is Also Evident In Still Subdued Imports
Weak Domestic Demand Is Also Evident In Still Subdued Imports
Chart 6Govt Spending Had Decelerated, Even As QE Proceeds Remained Unspent
Govt Spending Had Decelerated, Even As QE Proceeds Remained Unspent
Govt Spending Had Decelerated, Even As QE Proceeds Remained Unspent
The sharp widening seen in the country’s fiscal deficits had more to do with dwindling fiscal revenues, rather than strong spending. In fact, central bank data shows that most of its government bond purchase proceeds (‘QE’ proceeds) are unspent – still sitting in the government’s accounts with the central bank, i.e., they have not been channeled into the economy (Chart 6, bottom panel). … But Plenty Of Dry Powder Going forward, however, that picture is likely to change. The country is heading into general elections in May 2022. Lawmakers therefore have an incentive to spend the amount currently lying in the central bank. The amelioration in the number of new Covid-19 cases has enabled a re-opening of the economy, which will make stimulus spending easier. In addition, the federal budget for 2022 passed last month1 includes an 11.5% hike in government outlays. With core CPI at 3%, this translates into a robust 8.5% government expenditure growth rate in real terms. Chart 7Credit Is Finally Reviving
Credit Is Finally Reviving
Credit Is Finally Reviving
Beyond fiscal spending, the country’s bank credit might also gain some traction: During the pandemic, banks shunned loan disbursements. Lately, however, there are signs that credit is reviving (Chart 7). Real borrowing costs (prime lending rates deflated by core CPI) from banks are low, close to only 1%. Such low cost of credit should encourage new borrowing at a time when economic activity is resuming. On their part, banks have made sizeable provisions against the rising NPLs during the pandemic, and therefore have already taken a substantial hit on their books (Chart 8, top panel). Relatively cleaner balance sheets should encourage banks to lend. Banks have also been able to materially raise their operating efficiency in the past couple of years (by way of rising net interest income). As a result, operating margins have improved measurably. This has helped absorb part of the NPL-related losses and has somewhat cushioned the blow to banks’ bottom line (Chart 8, bottom panel). Relatively better margins (than otherwise would have been the case) should prompt banks to take relatively higher risks, i.e., expand their loan books going forward. Should fiscal authorities ramp up their spending, and should banks also begin to lend again, the activity that has resumed following a lessening of Covid-19 cases will get a fillip. Higher fiscal spending and bank credit will lift money supply in the economy, usually a good omen for stronger economic activity (see Chart 1 on page 1). Incidentally, inflation in the Philippines is under control. The relatively high headline inflation print is not indicative of any genuine inflationary pressures, and is due mostly to food prices, which account for 38% of the CPI basket. Core and trimmed mean CPI are much lower at around 3% (Chart 9, top panel). Chart 8Banks Have Cleaner Books Now As They Made Sizable NPL Provisions
Banks Have Cleaner Books Now As They Made Sizable NPL Provisions
Banks Have Cleaner Books Now As They Made Sizable NPL Provisions
Chart 9There Are No Genuine Inflationary Pressures In The Philippines
There Are No Genuine Inflationary Pressures In The Philippines
There Are No Genuine Inflationary Pressures In The Philippines
The central bank expects the headline inflation rate to decelerate to within its target band of 2% to 4% by the end of this year and settle close to the midpoint in 2022 and 2023. At the same time, Philippine nominal wages are barely growing (Chart 9, bottom panel). This implies that businesses have little margin pressures to raise their selling prices. Genuine inflationary pressures, therefore, are unlikely to become acute in the foreseeable future. That, in turn, will help keep fiscal and monetary policies accommodative. Domestic Bond Yields Will Stay Flattish With the resumption of economic activity, will come higher fiscal revenues. That should help the Philippine fiscal deficit to narrow. Narrower fiscal deficit in the Philippines is usually bond bullish (i.e., bond yields go down). Yet, lower bond yields will have negative implications for Philippine capital inflows. Foreign investors are the marginal buyers of Philippine bonds. And their appetite for the latter depends on how much extra yield the Philippines offers over safe-haven bonds (US treasuries). Chart 10 shows that whenever the yield differential narrows too much (to around 200 basis points), net debt portfolio inflows into the Philippines typically stop, and often turn into outflows. This is what is happening now. On the other end, when the differential widens enough (about 400 - 500 basis points), those outflows turn into inflows again. Chart 10The Philippines Need To Offer Relatively Higher Yields To Attract Capital Inflows
The Philippines Need To Offer Relatively Higher Yields To Attract Capital Inflows
The Philippines Need To Offer Relatively Higher Yields To Attract Capital Inflows
Given that we expect US long-term bond yields to rise, if Philippine bond yields do not rise at an even faster pace, its yield differential would stay low. Thus, the country will be hard-pressed to see any debt portfolio inflows in the near future. The absence of foreign buyers, in turn, would put a floor under bond yields. This will counterbalance any yield-suppressing forces coming from improving fiscal deficits. Thus, overall, the country will likely see flattish yields over the next six to nine months. And The Peso, Shaky Chart 11Debt Dominates The Philippines' Capital Inflows
Debt Dominates The Philippines' Capital Inflows
Debt Dominates The Philippines' Capital Inflows
Low bond yields and short-term interest rates will have negative ramifications for the currency: It’s the foreign debt flows, rather than equity investments, that dominate Philippine capital inflows. This is true for all categories of inflows: FDI, portfolio and other investments (Chart 11). The fact that debt investors are the dominant group among foreign investors has some implications. Debt investors do not like lower interest rates while equity investors do. As such, debt inflows into the Philippines diminish when the interest rates (bond yields) are relatively low. Muted foreign capital inflows, in turn, are bearish for the peso. The country’s current account outlook is also not rosy. The trade deficit has widened significantly, and the robust current account surplus has given way to deficits – in line with our forecast in our previous report. With domestic demand reviving (government spending, household consumption and business investment), imports will now likely grow faster than exports, and therefore, will weigh down on both trade and current account deficits further in the months ahead. Notably, the country’s overseas workers’ remittances have also rolled over in recent months. All these will be a headwind for the peso (Chart 12). As noted, the central bank does not expect inflation to overshoot their target in the next two years. They have also been a net buyer of US dollars year-to-date, i.e., they have been leaning against their currency. This implies that they would not mind a weaker currency – especially when the economy is still not strong, and inflation is not a threat. Incidentally, the peso is also about 7% expensive vis-à-vis the US dollar in purchasing power terms (Chart 13). Chart 12Current Account Balance Will Deteriorate As Rising Domestic Demand Fuels Imports
Current Account Balance Will Deteriorate As Rising Domestic Demand Fuels Imports
Current Account Balance Will Deteriorate As Rising Domestic Demand Fuels Imports
Chart 13The Peso Is Somewhat Expensive In PPP Terms And Is Vulnerable To A Downside
The Peso Is Somewhat Expensive In PPP terms And Is Vulnerable To A Downside
The Peso Is Somewhat Expensive In PPP terms And Is Vulnerable To A Downside
Equity Underperformance Is Late An improving fiscal balance is usually bullish news for Philippine stock multiples. The connection is via bond yields/interest rates. An improving fiscal balance leads to lower bond yields, which, in turn, boost this market which is dominated by interest rate sensitive sectors (real estate, financials/banks and utilities make up 50% of market cap). Chart 14Weak EM Stock Prices Herald Outperformance by The Defensive Philippine Markets
Weak EM Stock Prices Herald Outperformance by The Defensive Philippine Markets
Weak EM Stock Prices Herald Outperformance by The Defensive Philippine Markets
Yet, in this cycle, an improving fiscal balance may not herald a material fall in the country’s bond yields due to net debt portfolio outflows (as explained above). Thus, Philippine stocks would miss the tailwind from rising multiples. A dim outlook for the peso also calls for caution on the part of absolute-return foreign investors. That said, the resumption of economic activity will lead to rising earnings, and that should provide some tailwinds for this market. Moreover, as a defensive market within EM, Philippine stocks usually outperform the overall EM benchmark during periods of weak EM stock prices. Incidentally, we have a negative outlook on EM stock prices over the coming several months (Chart 14). Weighing all the pros and cons, we infer that Philippine stocks’ relative performance will likely be rangebound over the next six to nine months. Sovereign Credit Will Outperform Chart 15The Philippines' Sovereign Credit Outperforms During EM Risk-Off Periods, Stay Overweight
The Philippines' Sovereign Credit Outperforms During EM Risk-Off Periods, Stay Overweight
The Philippines' Sovereign Credit Outperforms During EM Risk-Off Periods, Stay Overweight
A negative outlook on overall EM sovereign credit warrants overweighting Philippine sovereign credit relative to its EM brethren. The reason is the defensive nature of the Philippine sovereign bond market – just like its equity market. During periods of stress, Philippine sovereign spreads widen much less than its EM peers. Chart 15 shows that in each of the last three risk-off periods (2008-09, 2015, 2020), Philippine sovereign credit massively outperformed the EM benchmark. The basis for the defensive features of Philippine sovereign credit is that the nation’s external public debt is quite low at 18% of GDP, down from 25% ten years back. Of this, foreign bonds outstanding are 10% of GDP, down from 12% ten years back (the rest being loans and contingent liabilities). Such low debt means the defensive nature of this market is unlikely to change soon. Hence, it makes sense to overweight Philippine sovereign bonds in view of impending sovereign credit spreads widening in the broader EM universe. Investment Conclusions Stocks: The Philippine economy will likely see some traction in the months ahead as fiscal spending rises and bank credit revives. This bourse’s relative performance will also benefit in an impending risk-off period in emerging markets. Asset allocators should upgrade this market from underweight to neutral in an EM equity portfolio. Our underweight call on this market vis-à-vis an EM equity portfolio has yielded a gain of 16% since we recommended it in October 2018. The Peso: The peso remains vulnerable in the face of deteriorating external accounts. Currency investors should stay with our recommended long USD/ short PHP trade for now. This call has yielded 2.1% so far since our recommendation on March 18, 2021. Chart 16Philippine Domestic Bonds Warrants A Neutral Allocation In An EM Portfolio
Philippine Domestic Bonds Warrants A Neutral Allocation In An EM Portfolio
Philippine Domestic Bonds Warrants A Neutral Allocation In An EM Portfolio
Domestic Bonds: Local currency bond yields in the Philippines are likely to stay flattish despite the slated improvements in the country’s fiscal balance. The peso is also set to stay weak. These call for a cautious stance on Philippine domestic bonds. Yet, they tend to do well relative to their EM counterparts during periods of EM stress – as they did in 2015 and in 2020 (Chart 16). Since another such period is around the corner, we recommend that investors maintain a neutral allocation of Philippine local currency bonds in an EM portfolio. Sovereign Bonds: Philippine sovereign bonds are set to outperform their EM counterparts. Asset allocators should stay overweight the Philippines in a dedicated EM sovereign bonds portfolio. Rajeeb Pramanik Senior EM Strategist rajeeb.pramanik@bcaresearch.com Footnotes 1 Passed in the third and final reading in the lower house and sent to the Senate, the upper house.
Highlights Fed/BoE: Both the Fed and the Bank of England found ways to talk down 2022 rate hike expectations discounted in US and UK bond markets. This is only a temporary reprieve, however, as the near-term uncertainties over the persistence of cost-push inflation will eventually be overwhelmed by medium-term certainties of demand-pull inflation confirmed by tightening labor markets. Stay underweight US Treasuries and UK Gilts in global bond portfolios. US Treasury Curve: Longer-term US Treasury yields are priced too low relative to the likely peak in the fed funds rate in the next cycle. Position for a steeper US Treasury curve until Fed rate hikes are imminent, which will likely not be until Q4/2022. Feature Chart of the WeekShifting Rate Expectations Driving Bond Yields As QE Fades
Shifting Rate Expectations Driving Bond Yields As QE Fades
Shifting Rate Expectations Driving Bond Yields As QE Fades
Bond market uncertainty about future monetary policy moves is on the rise. Bond volatility has picked up, most notably at the front end of yield curves that are most sensitive to rate hike expectations which have been intensifying. Yet last week, the Federal Reserve and Bank of England (BoE) were able to talk bond investors off the ledge – at least, temporarily - by pushing back against expectations of multiple rate hikes in the US and UK in 2022. Central bankers in those countries are stuck in a difficult spot. Inflation is high enough to warrant some tightening of monetary policy. Yet there are lingering concerns over how long the current upturn in global inflation will last. Meanwhile, there are just enough questions on the underlying pace of economic momentum to require policymakers to see more data, especially in labor markets, before feeling comfortable enough to pull the trigger on actual rate hikes. We now see that happening first in the UK early next year, and in the US in late 2022. One thing that is certain is that the ups and downs of interest rate expectations – and the central bank forward guidance that influences them – will increasingly become the more dominant driver of bond yields and yield curve shape as global pandemic bond-buying programs get wound down (Chart of the Week). On that front, we see more potential for bond-bearish steepening in the UK and US over the next several months. The BoE: Another Bad Date With The Unreliable Boyfriend The UK financial press infamously dubbed the BoE “the unreliable boyfriend”, under the leadership of former Governor Mark Carney, for hinting at interest rate increases that never materialized. At last week’s Monetary Policy Committee (MPC) meeting, rates were kept unchanged in a 7-2 vote despite some intense signaling in recent weeks that a rate hike was imminent. Under current BoE Governor Andrew Bailey, this edition of the MPC is more like an indecisive spouse than unreliable boyfriend. On the one hand, there is a clear overshoot of UK inflation (and inflation expectations) that would justify a rate hike as soon as possible (Chart 2). The BoE’s new economic forecasts presented in the November Monetary Policy Report (MPR) called for headline CPI inflation to reach a peak of 5% in April 2022 – significantly higher than the 4% late-2021 forecast from the August MPR. On the other hand, high current inflation is already having a dampening effect on economic sentiment. The GfK index of UK consumer confidence is down -10% from the peak seen in July, despite diminishing concerns over COVID seen in public opinion polls (Chart 3, middle panel). A similar divergence is evident in the BoE’s Decision Maker Panel survey of UK Chief Financial Officers, which showed that uncertainty over future sales was somewhat elevated compared to diminished concerns about COVID and Brexit (bottom panel). Chart 2Fed/BoE Cannot Stay Dovish For Much Longer
Fed/BoE Cannot Stay Dovish For Much Longer
Fed/BoE Cannot Stay Dovish For Much Longer
Chart 3High UK Inflation Raises Growth Uncertainty
High UK Inflation Raises Growth Uncertainty
High UK Inflation Raises Growth Uncertainty
The BoE highlighted these divergences in economic sentiment series in the November MPR as examples of how high inflation, fueled by global supply chain disruptions and soaring energy prices, introduced uncertainty into the central bank’s forecasts. Even more uncertainty exists in the BoE’s ability to assess the amount of spare capacity, and underlying inflationary pressure, in the UK economy. The BoE dedicated a 9-page section of the November MPR to a discussion about estimating the growth of the supply-side of the UK economy, evidence of how difficult that process has become during the COVID era. The BoE concluded that the pandemic would end up reducing the level of UK potential supply by -2% from pre-COVID levels, even though the growth rate would return to a pre-pandemic pace of around 1.5% by 2023-24. This is a combination that makes setting monetary policy tricky. Reduced supply indicates that the UK economy has a smaller output gap with more inflationary pressure that would require higher interest rates. Yet sluggish growth in potential supply implies that the UK equilibrium interest rate is likely still very low, thus the BoE would not have to raise rates much to get policy back to neutral. This uncertainty over the size of the output gap in the UK economy will force to BoE to focus more on the labor market as the best “real-time” measure of spare capacity. On that front, the evidence is also difficult to interpret. The UK unemployment rate fell to 4.5% over the three months to August, the last available data before the UK government’s COVID furlough schemes, which protected worker incomes hit by COVID job losses, ended on September 30. The UK Office of National Statistics estimates that there were between 900,000 and 1.4 million UK workers furloughed in late September, representing a significant source of labor supply to be absorbed when the government income assistance ends. Thus, the BoE would need to see at least a month or two of post-furlough employment reports – not just job growth, but labor force participation - to assess how quickly those workers were being reabsorbed into the UK labor market. By the BoE’s own estimates, the impact of the furlough schemes, combined with the compositional issues arising from pandemic job losses being borne more by lower-wage workers, boosted UK wage growth by 2.2% (Chart 4, bottom panel). “Underlying” wage growth, net of those effects, is 0.6%, above the pre-COVID peak, suggesting a tightening labor market before the return of furloughed workers to the labor force. In the end, we see the BoE’s November non-hike as nothing more than a delay of the inevitable. While a December hike is possible, this would represent a “double tightening” of monetary policy with the current BoE quantitative easing program set to expire at year-end. The more likely date for a rate hike is now February. This would give the MPC a few months of post-furlough labor data to assess the amount of spare capacity in UK labor markets. We expect the data to show enough underlying health in labor demand relative to supply for the BoE to conclude that accelerating wage growth represents a more sustainable form of UK inflation in 2022 than energy prices or supply-chain disruptions were in 2021, justifying a move to begin hiking rates. We continue to recommend positioning for a steeper UK Gilt curve, focused on longer-maturities where yields were too low relative to even a moderate future BoE rate hike cycle (Chart 5). We entered a new tactical butterfly spread trade last week, going long the 10-year Gilt bullet versus a duration-neutral 7-year/30-year barbell – we continue to like that trade as a way to play for eventual BoE rate hikes in the first half of 2022. Chart 4BoE Needs More Employment Data To Confirm Wage Uptrend
BoE Needs More Employment Data To Confirm Wage Uptrend
BoE Needs More Employment Data To Confirm Wage Uptrend
Chart 5Stay In UK Long-End Gilt Curve Steepeners
Stay In UK Long-End Gilt Curve Steepeners
Stay In UK Long-End Gilt Curve Steepeners
Bottom Line: The Bank of England is still on a path to begin rate hikes, either in December or, more likely, February of next year. Stay underweight UK Gilts. Position For A Steeper US Treasury Curve The Fed announced last week that tapering would begin right away in November, in a move that has been hinted at since the summer. The monthly pace of purchases of Treasuries and Agency MBS will decline by $10 billion and $5 billion, respectively in November and also December. The Fed declined to commit to any specific tapering amounts beyond that, although it seems likely that the same monthly pace of reduction will continue in 2022. This would take the buying of Treasuries and MBS, net of maturing debt, to zero by June of next year, clearing the first necessary hurdle before the FOMC could contemplate a hike in the funds rate. A completion of the taper by June has been hinted at in the speeches of several Fed officials in recent weeks. This is a bit faster than the expected pace of tapering seen in the most recent New York Fed Primary Dealer and Market Participant Surveys from September (Chart 6), but should not be categorized as a hawkish surprise. There were also few bond-bearish signals on future policy moves hinted at by Fed Chair Jay Powell in post post-FOMC meeting press conference.
Chart 6
Chart 7Upside Risk To UST Yields From A Tightening Labor Market
Upside Risk To UST Yields From A Tightening Labor Market
Upside Risk To UST Yields From A Tightening Labor Market
Powell did note that it was still not clear how long the current supply chain/commodity price driven surge in inflation would persist into next year. The expectation, however, was that these forces would eventually subside and allow US inflation to return back to levels much closer to the Fed’s 2% target. Given the uncertainties in the timing of that peak and decline in US inflation, the Fed has limited ability to calibrate any post-taper rate hikes by focusing solely on inflation - especially with longer-term inflation expectations still at levels consistent with the Fed’s target. The Fed will continue to look at US labor market developments to determine the timing and pace of future rate hikes. The last set of FOMC economic projections compiled for the September meeting have the US unemployment rate falling to 3.8% next year, below the median FOMC estimate of full employment at 4%, with one 25bp rate hike penciled in for 2022. We can use that as a baseline assumption on what the Fed considers to be the level of “maximum employment” that would need to be reached before rate hikes could begin. The US unemployment rate fell to 4.6% in October, thus there is still some more to go before hitting that 3.8% rate hike threshold. Yet among the FOMC members, the estimates of full employment range from 3.5%-4.5%, so the October print did knock on the door of that range (Chart 7, middle panel). With US wage growth already showing signs of breaking out – the Atlanta Fed Wage Tracker hit a 14-year high of 14% in September (bottom panel), while the Employment Cost Index rose by a record quarterly pace of 1.3% in Q3 – the Fed will likely be under a lot of pressure to begin hiking rates soon after the taper is expected to end next June. Chart 8UST Curve Forwards Too Flat Vs. Likely Fed Rate Hikes
UST Curve Forwards Too Flat Vs. Likely Fed Rate Hikes
UST Curve Forwards Too Flat Vs. Likely Fed Rate Hikes
We still see December 2022 as the most likely liftoff date, although a faster decline in unemployment could move that timetable forward. The bigger issue for the US Treasury market, however, is not the timing of liftoff but how fast the pace of hikes will be afterward. On that note, future rate expectations are still far too low. For example, according to the New York Fed’s Primary Dealer Survey, the fed funds rate is expected to average only 1.7% over the next ten years (top panel), a level that has proved to be a ceiling for the 10-year Treasury yield so far in 2021. Our colleagues at BCA Research US Bond Strategy recently made the case for expecting the US Treasury curve to bearishly steepen in the coming months. In their view, longer-maturity Treasury yield forward rates were too low compared to a fair value determined by the likely path for the funds rate that assumes rate hikes start in December of next year and rise by 100bps per year to a terminal rate of 2.08% (Chart 8). Interestingly, 2-year Treasury forward rates were in line with the projections of our US Bond Strategy team’s fair value framework. We fully agree with our US Bond colleagues on the likelihood of future Treasury curve steepening. This fits with our views on many developed market countries, not just the US, where longer-maturity bond yields were pricing in too few future rate hikes relative to what was likely to occur over the next few years. Even when taking a much longer perspective, the US Treasury curve looks too flat right now. Going back to the mid-1980s, the current 2-year/10-year US Treasury curve slope of just over 100bps has never been reached (in a flattening move) in the absence of actual Fed rate hikes (Chart 9). Chart 9UST Curve Has Never Been This Flat Without Some Actual Fed Rate Hikes
UST Curve Has Never Been This Flat Without Some Actual Fed Rate Hikes
UST Curve Has Never Been This Flat Without Some Actual Fed Rate Hikes
This week, we are adding a new trade to our Tactical Overlay table to benefit from this expected move in the US yield curve, a US Treasury 2-year/10-year curve steepener (combined with a position in cash, or US 3-month treasury bills, to make the entire trade duration-neutral). We are also taking profits on our previous Tactical US curve flattening trade, which has returned 0.84% since initiation back in June. The exact securities and weightings for our new trade can be found in the Tactical Overlay Trades table below. Bottom Line: Longer-term US Treasury yields are priced too low relative to the likely peak in the fed funds rate in the next cycle. Position for a steeper US Treasury curve until Fed rate hikes are imminent, which will likely not be until Q4/2022. Robert Robis, CFA Chief Fixed Income Strategist rrobis@bcaresearch.com Recommendations Duration Regional Allocation Spread Product Tactical Overlay Trades GFIS Model Bond Portfolio Recommended Positioning Active Duration Contribution: GFIS Recommended Portfolio Vs. Custom Performance Benchmark
Image
The GFIS Recommended Portfolio Vs. The Custom Benchmark Index