Inflation/Deflation

Highlights Monetary Policy: It’s all but certain that tapering will begin next month and conclude by the middle of next year, but the FOMC is currently split right down the middle on whether it will be appropriate to lift rates in H2 2022. We present five factors to track to decide when the Fed will hike rates. Yield Curve: A bear-flattening of the nominal yield curve remains the most likely scenario for the next 6-12 months. Maintain a position short the 5-year bullet versus a duration-matched 2/10 barbell. TIPS: Investors should enter 2/10 steepeners on the inflation compensation curve and/or 2/10 flatteners on the real (TIPS) curve. The 2-year real yield, in particular, has a lot of upside during the next 6-12 months. EM Bonds: US bond investors should shift some allocation out of expensive US investment grade corporate bonds and into USD-denominated investment grade EM Sovereigns and Corporates where valuation is more compelling. Feature This past week was quite eventful for US bond investors. First, the Fed presented its September update on Wednesday, offering some hints about the timing and pace of asset purchase tapering alongside its updated economic and interest rate forecasts. Then, bonds sold off sharply on Thursday, Friday and Monday with the 10-year Treasury yield rising all the way to 1.49%. The first section of this week’s report looks at what we learned from last week’s FOMC meeting and opines on some monetary policy questions that remain unanswered. The second section updates our views on portfolio duration, the yield curve and TIPS in light of last week’s large market moves. Finally, we conclude with an update on the outlook for USD-denominated Emerging Market bonds. Powell Answers Some Small Questions, Avoids The Big One The Small Questions The start date for asset purchase tapering is the first small question that the Fed answered last week. A new sentence was added to the post-meeting statement saying that “a moderation in the pace of asset purchases may soon be warranted” and, in his press conference, Chair Powell clarified that the purpose of the new language is “to put notice out there that [tapering] could come as soon as the next meeting”. After this statement from the Fed, we expect asset purchase tapering to be announced at the next FOMC meeting on November 3rd. A delay until December is possible if September’s employment report is a massive disappointment, but the bar for delaying tapering beyond November appears high. Chair Powell also shed some light on a second small question related to the Fed’s balance sheet. Specifically, the pace of asset purchase tapering. In his press conference the Chair said that “participants generally view that, so long as the recovery remains on track, a gradual tapering process that concludes around the middle of next year is likely to be appropriate.” The information about the pace of tapering is slightly more interesting than the start date, if only because Fed policymakers have expressed a desire for net purchases to reach zero before the first interest rate increase. The fact that the Fed is planning to reach net zero purchases by the middle of next year suggests that it wants to leave the door open for a possible rate hike in the second half of 2022. This message was confirmed by the Fed’s updated interest rate projections (Chart 1). The projections revealed an even split (9 vs. 9) on the Committee between those that expect at least one 25 basis point rate increase before the end of 2022 and those that do not expect to lift rates next year. It’s also notable that, out of the 9 participants that don’t expect a rate hike in 2022, 8 anticipate lifting rates in 2023. Chart 1Rate Expectations
Rate Expectations
Rate Expectations
Of course, as Chair Powell often points out, the Fed’s interest rate projections are contingent on the future state of the economy and will almost certainly be revised as the outlook evolves. What’s more important from a forecasting perspective is knowing how the Fed will react to different economic conditions. The Big Question With that in mind, we know that the Fed has promised not to lift rates until the labor market reaches “maximum employment”. However, as we noted in a recent report, the Fed hasn’t provided much detail on what “maximum employment” actually means.1 Powell’s comments last week didn’t add much clarity, but we can hunt for clues in the Summary of Economic Projections (SEP). In the SEP, we first notice that 13 FOMC participants expect the unemployment rate to be 3.8% - 3.9% or lower by the end of 2022 (Chart 2A). It is logical to assume that this group includes the 9 participants who expect to lift rates in 2022 and 4 additional ones. We also observe that 17 out of 18 participants anticipate an unemployment rate of 3.8% - 3.9% or lower by the end of 2023 (Chart 2B), exactly matching the number of participants who expect to lift rates by then. We can therefore infer that the Fed views an unemployment rate of roughly 3.8% as consistent with “maximum employment”. That is, FOMC participants tend to have rate hikes penciled into their forecasts once the unemployment rate is below 3.8%. Chart 2AFOMC 2022 Unemployment Rate Projection Distribution
Damage Assessment
Damage Assessment
Chart 2BFOMC 2023 Unemployment Rate Projection Distribution
Damage Assessment
Damage Assessment
The SEP’s inflation forecasts are less illuminating than the unemployment ones. All but 4 participants expect core PCE inflation to be above the Fed’s 2% target at the end of 2022 (Chart 3A) and no FOMC participant is forecasting below-2% core PCE at the end of 2023 (Chart 3B).2 The most we can take away from these forecasts is that 14 FOMC participants expect inflation to be above target in 2022, but five of those participants don’t see the labor market as being tight enough to lift rates by then. Chart 3AFOMC 2022 Core PCE Inflation Rate Projection Distribution
Damage Assessment
Damage Assessment
Chart 3BFOMC 2023 Core PCE Inflation Rate Projection Distribution
Damage Assessment
Damage Assessment
The revelation that FOMC participants view a 3.8% unemployment rate as consistent with “maximum employment” is illuminating, but it doesn’t tell the entire story. We don’t know, for example, what assumptions about labor force participation the different Fed officials are using. Our sense is that the following five criteria will ultimately determine when the Fed starts to lift interest rates: An unemployment rate in the neighborhood of 3.8%. Prime-age (25-54) labor force participation close to its pre-pandemic level (Chart 4, top panel). Accelerating wage growth (Chart 4, bottom 2 panels). Long-dated inflation expectations at or above target levels (Chart 5, top 2 panels). Non-transitory inflation at or above target levels (Chart 5, bottom panel). Bottom Line: The FOMC is currently split right down the middle on whether it will be appropriate to lift rates in 2022, but these forecasts aren’t set in stone and next year’s economic data – particularly the five factors listed above – will determine which group is correct. Chart 4Part Rate & Wage Growth
Part Rate & Wage Growth
Part Rate & Wage Growth
Chart 5Inflation & Inflation Expectations
Inflation & Inflation Expectations
Inflation & Inflation Expectations
Our own view is that the labor market will be sufficiently tight for the Fed to deliver its first rate hike in December 2022, and that rate hikes will proceed more quickly than what is currently priced in the yield curve. US bond investors should maintain below-benchmark portfolio duration. The Fallout In Bond Markets Bonds sold off sharply last Thursday and again yesterday morning. At the time of publication, the 30-year Treasury yield had risen from 1.81% on Wednesday to 2.02% (Chart 6). The 10-year Treasury yield had risen from 1.30% to 1.49% (Chart 6, panel 2). The 5-year yield is up to 0.98% from 0.85% on Wednesday (Chart 6, panel 3), and the 2-year yield is up to 0.28% from 0.24% (Chart 6, panel 4). The yield curve has also steepened since Wednesday, though the 2/10 slope remains well below its March peak (Chart 7). The trend during the past few months has been one of curve steepening out to the 5-year maturity point (Chart 7, panel 2) and flattening beyond that point (Chart 7, bottom 2 panels). Recent market action has led to some steepening beyond the 5-year maturity, but so far that steepening is minor compared to the flattening move we’ve witnessed since the spring. Chart 6Treasury Yield Trends
Treasury Yield Trends
Treasury Yield Trends
Chart 7Treasury Curve Trends
Treasury Curve Trends
Treasury Curve Trends
Nominal Curve We have been recommending a position short the 5-year bullet and long a duration-matched barbell consisting of the 2-year and 10-year notes, and we think this trade will continue to outperform. First, the 5-year/5-year forward Treasury yield is back above 2%, consistent with median estimates of the long-run neutral fed funds rate from the New York Fed’s Surveys of Market Participants (2%) and Primary Dealers (2.25%) (Chart 6, bottom panel). We think it will be difficult for the 5-year/5-year forward yield to rise much above these levels, which makes curve flattening more likely than steepening going forward.3 Second, we updated our work on yield curve scenarios to incorporate recent market action and some new information gleaned from last week’s SEP. In this analysis we estimate fair value levels for different parts of the yield curve as of the end of 2022 based on a scenario for the path of the fed funds rate. For example, if we assume that Fed liftoff occurs in December 2022 and rate hikes proceed at a pace of 75 bps per year (the median pace in the SEP) until the fed funds rate levels-off at 2.08% (consistent with a 2%-2.25% range for the long-run neutral fed funds rate), we calculate that the 2-year yield has 74 bps of upside between now and the end of 2022. This is slightly more than the 65 bps of upside in the 5-year yield and much more than the 37 bps of upside in the 10-year yield (Table 1). Comparing this expected change to what is already discounted in the forward curve, we see that both the 2-year and 10-year yields are expected to exceed their forwards by 6 bps. The 5-year yield is expected to exceed its forward by 16 bps. Table 1Treasury Curve Scenario Analysis
Damage Assessment
Damage Assessment
To us, the message is clear. We want to remain short the 5-year note versus a duration-matched 2/10 barbell. Real & Inflation Curves Chart 8Real & Inflation Curves
Real & Inflation Curves
Real & Inflation Curves
The increase in the 10-year nominal yield since last Wednesday was roughly evenly split between the real and inflation compensation components. Interestingly, inflation drove a greater proportion of the increase at the front-end of the curve, and the 2-year real yield actually fell. We maintain a neutral recommendation on TIPS versus nominal Treasuries, but this week we recommend taking advantage of recent market action by implementing some curve trades across the real and inflation curves. Specifically, we note that the cost of short-maturity inflation compensation remains well above the cost of long-maturity inflation compensation (Chart 8). Going forward, the cost of front-end inflation compensation will fall as inflation moderates from its current extremely high level. Meanwhile, the cost of long-maturity inflation compensation will remain sticky near the Fed’s target levels. This will lead to a steepening of the inflation curve (Chart 8, panel 2). The combination of a steeper inflation curve and a flatter nominal curve will lead to a much flatter real yield curve (Chart 8, bottom 2 panels). The 2-year real yield, in particular, has a lot of upside if inflation moderates, as we expect, and the 2-year nominal yield rises in line with the projections shown in Table 1. Bottom Line: Investors should remain short the 5-year bullet versus a duration-matched 2/10 barbell on the nominal Treasury curve. Investors should also enter 2/10 steepeners on the inflation compensation curve and/or 2/10 flatteners on the real (TIPS) curve. A Quick Update On Emerging Market Bonds The collapse of Chinese real estate behemoth Evergrande dominated headlines for most of the past week, though so far there has been little contagion into USD-denominated credit markets. Unsurprisingly, the spread on Chinese corporate and quasi-sovereign bonds has widened, and there has been some passthrough into both the High-Yield EM USD Corporate & Quasi-Sovereign Index and the High-Yield EM USD Sovereign Index (Chart 9). However, investment grade EM credit spreads have been relatively unaffected by the turmoil, as have US corporate bond spreads (both IG and HY) (Chart 9, bottom 2 panels). While the Evergrande drama – and weakening Chinese economic growth in general – could weigh on USD-denominated EM bond performance in the near-term, we see an excellent buying opportunity in investment grade EM bonds on a 6-12 month horizon. Investment grade EM Sovereigns outperformed credit rating and duration-matched US corporate bonds in the early months of the recovery but have lagged during the past few months (Chart 10). The same is true for the investment grade EM Corporate and Quasi-Sovereign index (Chart 10, panel 3). This is not to say that EM bond performance has been poor – the EM Sovereign index is still up 97 bps versus duration-matched Treasuries on the year – it has simply failed to keep pace with the stellar performance of US corporate bonds. Chart 9No Contagion
No Contagion
No Contagion
Chart 10EM Bonds Versus US Corporates
EM Bonds Versus US Corporates
EM Bonds Versus US Corporates
But that recent stellar performance of US investment grade corporate bonds has left spreads in the sector near historically tight levels. In last week’s report we ran some scenarios for US investment grade corporate bond returns during the next 12 months and concluded that excess returns versus Treasuries are probably capped at 85 bps.4 This makes the current spread advantage in EM Sovereigns (Chart 10, panel 2) and EM Corporates & Quasi-Sovereigns (Chart 10, bottom panel) very compelling. This will be especially true if Emerging Market growth accelerates in 2022 on the back of increased Chinese stimulus and a COVID vaccination campaign that is already picking up steam.5 Bottom Line: US bond investors should shift some allocation out of expensive US investment grade corporate bonds and into USD-denominated investment grade EM Sovereigns and Corporates where valuation is more compelling. Ryan Swift US Bond Strategist rswift@bcaresearch.com Footnotes 1 Please see US Bond Strategy Weekly Report, “2022 Will Be All About Inflation”, dated September 14, 2021. 2 Chart 3B shows that 4 participants expect core PCE inflation of 1.9%-2.0% in 2023, but the SEP also reveals that the minimum forecast for core PCE in 2023 is 2.0%. In other words, all 4 participants in that range are forecasting 2.0%, not 1.9%. 3 For more details on the relationship between our 5-year/5-year forward yield target and the yield curve please see US Bond Strategy Weekly Report, “A Bump On The Road To Recovery”, dated July 27, 2021. 4 Please see US Bond Strategy Weekly Report, “Expected Returns In Corporate Bonds”, dated September 21, 2021. 5 For a recent debate about the outlook for Emerging Market assets please see last Friday’s Webcast: https://www.bcaresearch.com/webcasts/detail/458 Recommended Portfolio Specification Other Recommendations Treasury Index Returns Spread Product Returns
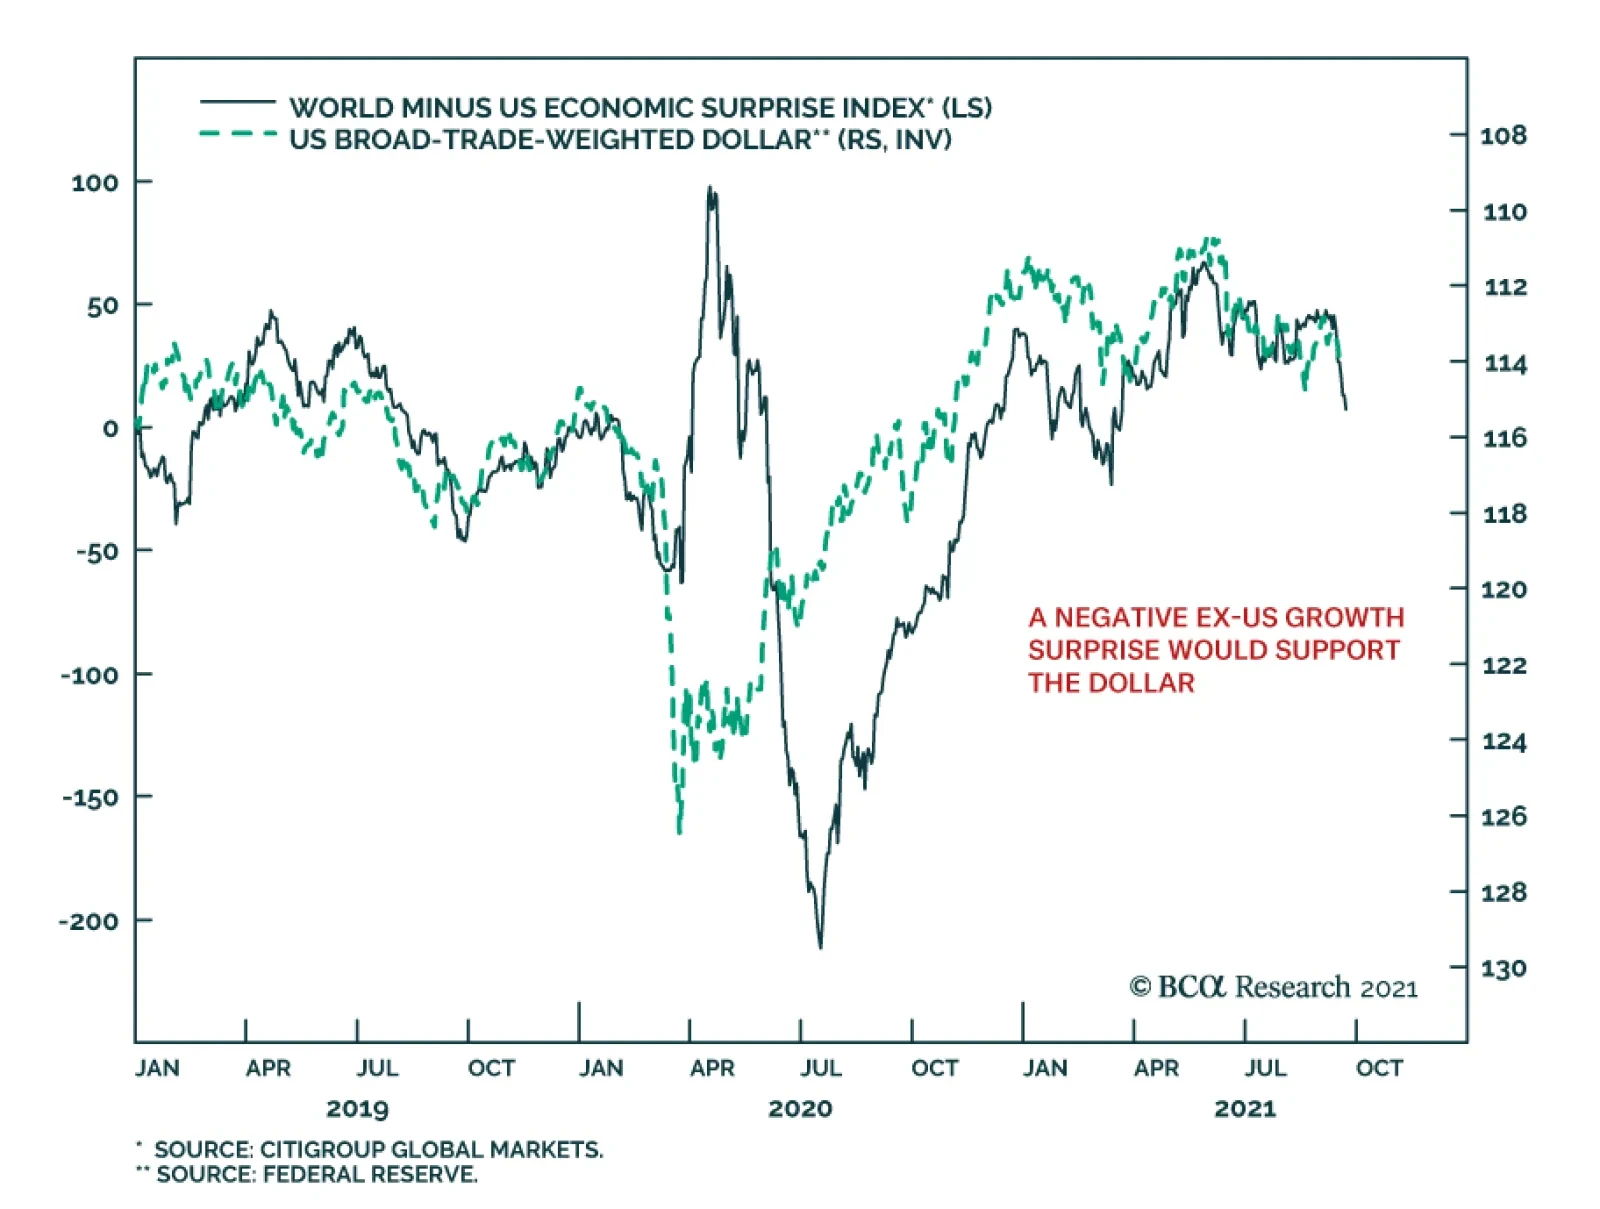
Although the US dollar has appreciated this year, our foreign exchange strategists highlight that from a big picture perspective, dynamics remain tilted against the dollar. True, the DXY is off its May low of 89.6. However, it has failed to break above 94,…
Highlights Economy – We find the leading arguments for why households’ excess savings won’t be spent to be wanting: US households do not commonly demonstrate the detached foresight that Ricardian equivalence takes as given and the trauma-will-change-behavior thesis fails to account for the absence of widespread financial trauma. Markets – Public equities account for a record portion of household wealth, but their share gains are not a sign of a budding mania: Our analysis of the Fed’s Flow of Funds data argues that much of equities’ relative share gains have been driven by structural rather than cyclical factors. Strategy – It would be premature to shift to defensive asset allocation settings if monetary policy is going to remain accommodative for another three years: The rate hike progression envisioned by FOMC participants’ dot-plot projections suggests policy won’t become tight until late 2024 at the earliest. Feature The US Investment Strategy team has been at the more bullish end of the continuum within BCA, and among the broader strategist community, since the spring of 2020. Our view was premised on the idea that the fiscal and monetary policy responses to the pandemic were (and would continue to be) so large that they would overwhelm its adverse effects on the economy and markets. That view came to pass as Congress augmented the CARES Act’s fiscal largesse with two subsequent rounds of direct payments to households earning up to $100,000 per adult and a renewed federal supplement to unemployment insurance (UI) benefits. With the expiration of the UI benefit program at the beginning of the month and the Fed poised to end asset purchases by the middle of next year, clients have begun to ask if our underlying bullish premise still applies. We believe that it does, on the grounds that policy remains on an emergency footing even though the emergency has passed. The fiscal transfers may have ended, but their full effect has yet to be felt. They will support the economy on an ongoing basis as households direct their excess pandemic savings toward consumption. No one knows for sure how much of the excess savings will be spent or when, but the arguments citing Ricardian equivalence or consumer trauma as impediments to consumption are flawed. What If Today’s Income Is Taxed Tomorrow? British classical economist David Ricardo is best known to introductory economics students for comparative advantage, but he also posited that deficit spending may fail to boost aggregate demand because taxpayers, anticipating that they will be tapped in the future to repay state loans, may increase savings to cover future taxes. Despite its theoretical appeal, empirical data in support of Ricardian equivalence is elusive. Two centuries and an ocean removed from Ricardo’s England, we submit that Americans are not known for parsimony, studied caution or a tendency to see the glass as half-empty. Although American households began to rebuild savings after the global financial crisis, an additional dollar has tended to burn a hole in their pockets ever since the baby boomers began reaching adulthood (Chart 1). Chart 1The Searing Trauma Of The Depression Weighed On Consumption Decisions
The Searing Trauma Of The Depression Weighed On Consumption Decisions
The Searing Trauma Of The Depression Weighed On Consumption Decisions
Even if Americans were wont to consider future tax burdens, it may be rational for the households who received the fiscal transfers to assume they will largely escape them unless their relative income surges. Per the most recent adjusted gross income (AGI) distribution data (for tax year 2018), 70% of taxpayers earn $75,000 or less (Chart 2). Single taxpayers meeting that threshold (and married taxpayers earning $150,000 or less) received the full amount of the economic impact payments authorized by the CARES Act and subsequent legislation. That bottom 70% paid just 5.1% of AGI in federal taxes (Chart 3), and the current political climate points in the direction of an increasingly progressive tax system, so they may not have to worry about being called upon to cover the expanding deficit down the road. Chart 2The Income Distribution Is Top Heavy ...
Post-Traumatic Bliss
Post-Traumatic Bliss
Chart 3…But So Is The Tax Burden
Post-Traumatic Bliss
Post-Traumatic Bliss
The (Not So Traumatic) Economic Trauma Of COVID-19 While we are confident that Ricardian equivalence will not act as an impediment to consumption, the ultimate disposition of households’ excess pandemic savings is unknown. Our working assumption has been that half of the savings will be spent across 2021 and 2022. Though we do not have any close antecedents for what households might do with a savings windfall equivalent to 10% of a year’s GDP amassed over a thirteen-month span, we reject the notion that those who experienced COVID-19 will behave like the many shell-shocked survivors of the Great Depression who became lifelong precautionary savers. However terrible the human cost of COVID, it did not ravage American households’ financial position; as the Fed’s latest Flow of Funds report showed, their balance sheets flourished, allowing the vast majority of them to escape any sense of financial trauma. Per the Flow of Funds, American household wealth grew by nearly $6 trillion in the second quarter, extending the last five quarters’ gains to $31 trillion since financial markets cratered when the pandemic burst forth in the first quarter of 2020. The 22% annualized five-quarter gain is nearly four standard deviations above the mean and blows away 4Q03 through 4Q04’s 14% second-place mark by two full standard deviations (Chart 4, top panel). The current run sets a record even when it’s stretched to six quarters to include 1Q20, the worst quarter in series history, and the five- and six-quarter gains are also pacesetters after adjusting for inflation (Chart 4, bottom panel). Chart 4Recessions Aren't So Bad When Congress And The Fed Throw Everything They Have At Them
Recessions Aren't So Bad When Congress And The Fed Throw Everything They Have At Them
Recessions Aren't So Bad When Congress And The Fed Throw Everything They Have At Them
Changes in household net worth lead consumption growth with a two-quarter lag (Chart 5), though the four quarters before the most recent one (the red dots with negative consumption growth) were notable outliers. 2Q21 consumption was just a little more than a percentage point below the best-fit line, however, so it is closing in on its modeled value and we expect it will overshoot it in coming quarters upon the release of pent-up demand. We do not believe that the pandemic will dampen household spending simply because the broad mass of consumers did not experience financial trauma on a scale that would alter future behavior. As household wealth and income data have shown, this recession has been a boon for most Americans. Chart 5Consumption Overshoots Are On The Way
Post-Traumatic Bliss
Post-Traumatic Bliss
Chart 6Fiscal Shock And Awe
Post-Traumatic Bliss
Post-Traumatic Bliss
We additionally reject the notion that households have learned a lesson that will make them want to hold more savings. The financial lesson of the pandemic seems to be that policymakers will do their utmost to shelter them from calamity. Between the economic impact payments (Chart 6, top panel) and the UI benefit supplement (Chart 6, middle panel), Congress directly sent nearly $1.5 trillion to US households to offset $300 billion of lost wages (Chart 6, bottom panel). COVID-19 inflicted terrible distress on those who lost loved ones and witnessed or experienced near fatal suffering, but it boosted the lower three quartiles of households who received transfers and the top decile of households who reveled in the financial markets’ advance. Those who experienced it will not hoard their pennies and shun debt like many of the Depression’s survivors; they are more likely to have experienced post-traumatic bliss than stress when it comes to their financial outlook. Too Much Of A Good Thing? We periodically check in on the Flow of Funds for insight into the evolution of households’ asset allocations and the share of net worth accounted for by homes. Directly owned equities and mutual funds have taken share from the other major categories throughout the pandemic run (Chart 7) and now account for a record share of household financial assets after having surpassed their 2000 highs (Chart 8, top panel). It is sensible to approach any equity milestone that invokes the dot-com bubble with some trepidation, but structural factors go a long way toward explaining the new allocation peak. The financialization of the economy has steadily advanced since the Flow of Funds data began to be compiled in 1951, promoting public equity ownership, and consolidation has supported the transfer of commercial ownership from mom-and-pop operations to corporate interests, many of which are publicly traded. Overall equity in businesses as a share of household net worth is merely in line with its ‘50s levels (Chart 8, bottom panel). Chart 7The Running Of The Bulls
The Running Of The Bulls
The Running Of The Bulls
Chart 8From Mom And Pop To Broad And Wall
From Mom And Pop To Broad And Wall
From Mom And Pop To Broad And Wall
Home price appreciation has picked up, but it is not out of the ordinary (Chart 9). Home equity gains have outstripped home price gains, relative to each series’ history, testifying to prudent behavior on the part of borrowers and lenders. The low aggregate mortgage loan-to-value ratio (Chart 10) suggests that slowing home price appreciation, or even an outright decline, would not be a source of economic instability. Chart 9Home Price Gains Are Not Out Of The Ordinary ...
Home Price Gains Are Not Out Of The Ordinary ...
Home Price Gains Are Not Out Of The Ordinary ...
Chart 10... And Leverage Levels Are Not A Concern
... And Leverage Levels Are Not A Concern
... And Leverage Levels Are Not A Concern
The Fed Signals That Tapering Is Near Though the FOMC did not adjust the pace of its asset purchases last week, it indicated that tapering will most likely begin after its November meeting. Chair Powell noted that the economy has made substantial further progress toward reaching the committee’s inflation goal and expressed that “many” members feel that it has made substantial progress toward achieving its full employment objective as well, going so far as to volunteer his personal view that the employment test has been “all but met.” Per the committee’s discussions, the purchases will likely end around the middle of next year if the economy progresses in line with its expectations. The committee would not be talking about reducing the accommodation it’s providing the economy if it weren’t secure in the sense that it is on solid footing. Powell expressed satisfaction with the evolution of inflation expectations (Chart 11) and although the real GDP forecast for this year was lowered in the summary of economic projections (the “dots”), next year’s forecast was raised and slightly higher inflation expectations imply that nominal GDP growth will remain quite robust. A shift in two members’ fed funds rate projections brought the median member’s liftoff date to 2022 from 2023, in line with our view. Chart 11The Fed Has Succeeded In Firming Up Inflation Expectations
The Fed Has Succeeded In Firming Up Inflation Expectations
The Fed Has Succeeded In Firming Up Inflation Expectations
The chair reiterated that tapering – slowing the pace of accommodation – and hiking the fed funds rate – slowing the economy – are distinct actions subject to separate criteria. We see liftoff as a more significant action than tapering, but much will depend on the pace at which the committee lifts the fed funds rate. It is too soon to speculate on the pace, but we stress that the big move for financial markets will occur once the policy rate exceeds the neutral rate. If the latter is somewhere around 2%, the rate hike pace embedded in the dots suggests that it may take until the end of 2024 or early 2025 before monetary policy becomes restrictive. Investment Implications If monetary policy is not going to become tight for another three years, it is premature to shift a portfolio to more defensive settings, especially for anyone sharing our three-to-twelve-month cyclical timeframe. Growth will be robust in the near term, supported by the income boost that the lower three quartiles of taxpayers received from fiscal transfers and the way wealthier households cleaned up as financial asset prices soared. We expect that a hearty portion of the newly minted wealth will be spent, as Ricardian equivalence requires a longer attention span than Americans typically exhibit, and the pandemic was largely trauma-free for most households from a financial perspective. The clearest policy lesson that a citizen should have taken from COVID is that Congress and the Fed have his/her back in a big way. We are staying the course with our risk-friendly asset allocation recommendations. Doug Peta, CFA Chief US Investment Strategist dougp@bcaresearch.com
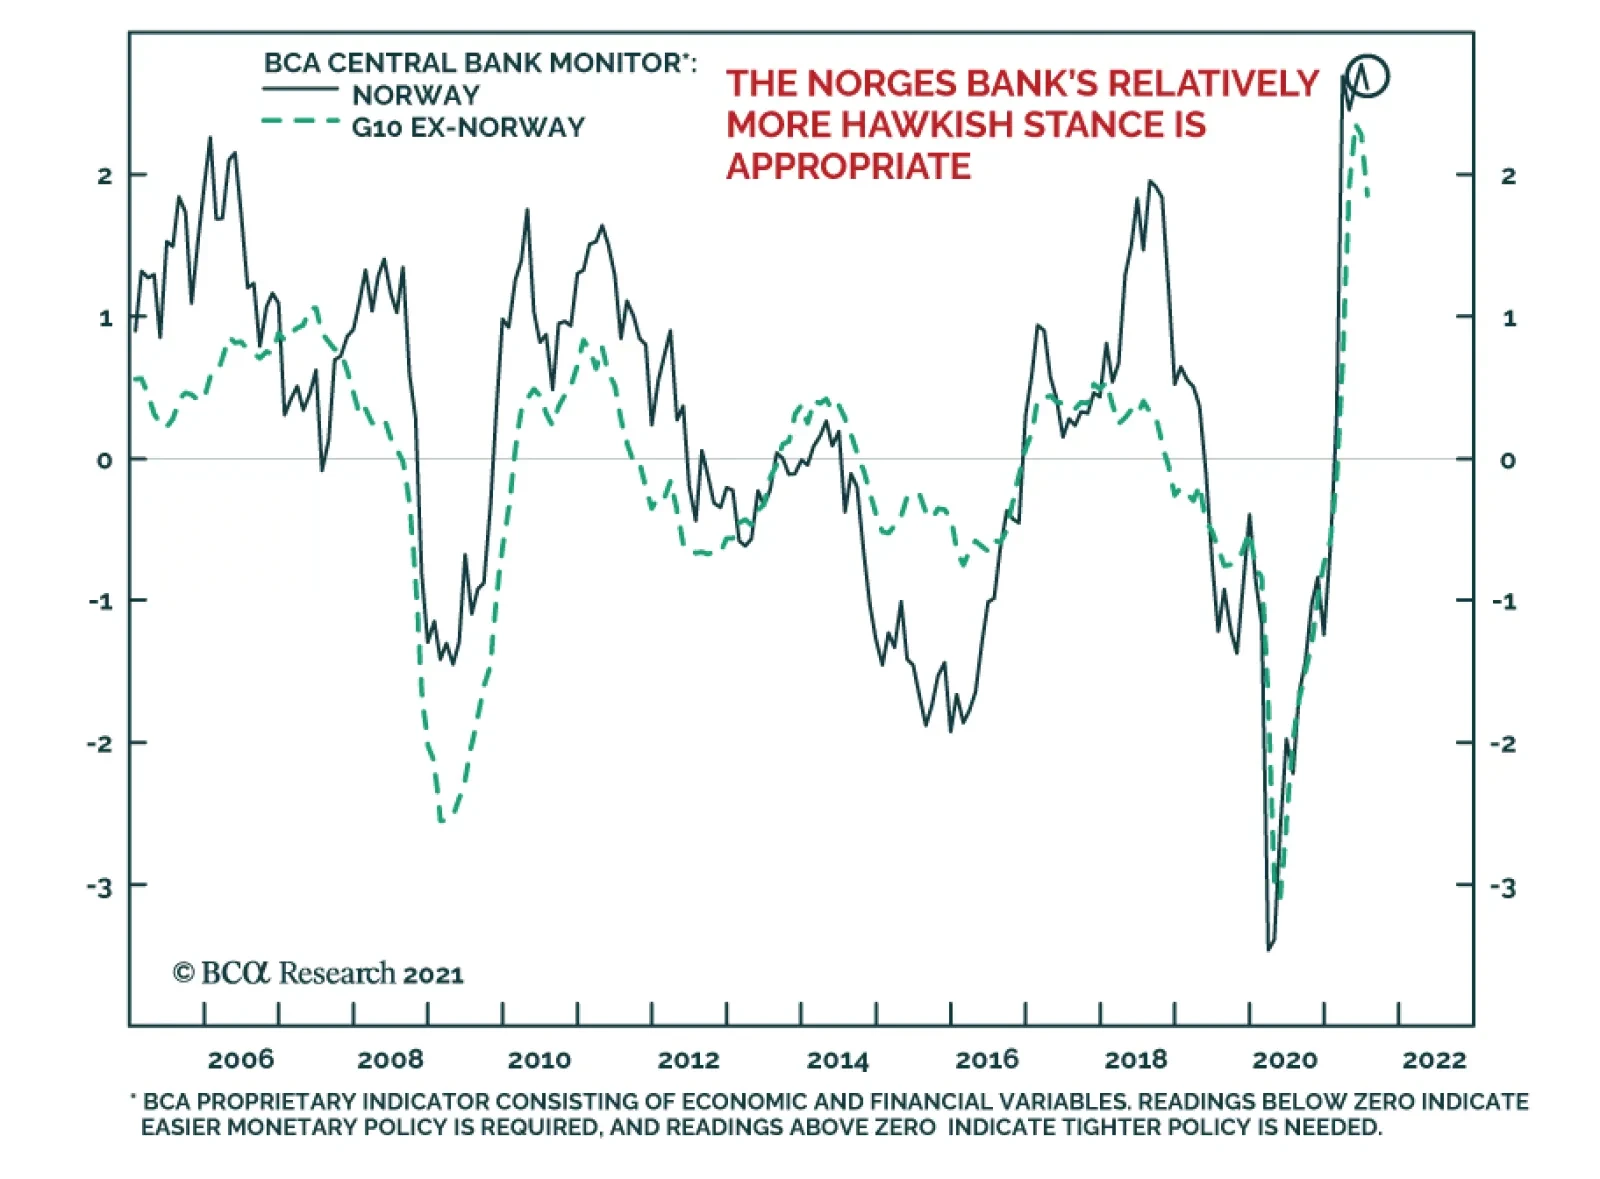
As expected, the Norges Bank delivered its first rate hike on Thursday, bringing its benchmark policy rate to 0.25%. It is the first developed market central bank to raise rates in the post-COVID-19 crisis period. The central bank statement revealed that…
Highlights Global Inflation: Most central banks, led by the Fed, have stuck to the narrative that surging inflation is a temporary phenomenon that will not require an aggressive monetary policy response. However, global supply chain disruptions are lasting for much longer than originally expected, while faster realized global inflation is feeding through into higher longer-term consumer inflation expectations, most notably in the US. This raises the risk that the 2021 inflation pickup will prove to be longer lasting, leading to higher global bond yields. Real Bond Yields: Global bond markets have made a collective bet on the “transitory” inflation narrative by driving yields on government bonds, and even the riskier parts of the corporate credit universe like US and European high-yield, below actual inflation. Markets will have to reprice those negative real bond yields higher if inflation proves to be more persistent than expected - particularly with central banks likely to respond with faster tapering and, in some cases, eventual rate hikes. Feature The month of September has often not been kind to financial markets and September 2021 is already providing many reasons for investors to be nervous. Slowing global growth momentum, uncertainty over the Delta variant, yet another US Debt Ceiling debate in D.C. and worries about excessive Chinese corporate leverage and contagion risks from the looming Evergrande default are all valid reasons for market participants to become more risk averse. On top of that, the monetary policy backdrop is threatening to become less overwhelmingly supportive for markets with the Fed set to begin tapering its asset purchases. Chart of the WeekInflation Expected To Slow But Remain Above Bond Yields
Inflation Expected To Slow But Remain Above Bond Yields
Inflation Expected To Slow But Remain Above Bond Yields
One other source of angst that markets seem less concerned about is inflation. Markets have generally come around to the view of most major central banks, led by the Fed, that the surge in inflation seen this year has been all pandemic related - base effect comparisons to 2020 and temporary supply chain squeezes – and will not last into 2022. Yet we have seen very strong realized global inflation readings in the August data, beyond the point of maximum base effect comparisons versus a year ago, while supply squeezes and soaring shipping costs are showing no signs of slowing as we approach the fourth quarter. Global bond markets have made a collective bet that current high rates of inflation will prove to be temporary. Developed market bond yields are all trading well below actual inflation, as are riskier fixed income asset classes like US and European high-yield (Chart of the Week). While consensus expectations are calling for some rise in government bond yields in 2022, yields are expected to remain below inflation. Those persistent negative real yield expectations remain the biggest source of vulnerability for global bond markets. If inflation turns out to be “less transitory” than expected, nominal bond yields will need to move higher to reprice both real yields and the risk of more hawkish central bank responses to sustained high inflation. A Persistent Inflation Threat From Supply Chain Disruptions Chart 2A Broad-Based Surge In Global Inflation
A Broad-Based Surge In Global Inflation
A Broad-Based Surge In Global Inflation
Our base-case view remains that global inflation will slow in 2022, but not by enough to prevent the major developed market central banks from tapering asset purchases. We expect the Fed to begin buying fewer bonds in January. Central banks that have already begun to slow the pace of quantitative easing (QE) like the Bank of Canada and Bank of England will likely continue to taper as fast, if not even faster, than the Fed. Even the ECB will likely not roll the full amount of the expiring Pandemic Emergency Purchase Program (PEPP) into the existing pre-COVID asset purchase programs, resulting in a mild form of tapering next year. Our view on global inflation has been predicated on an expected shift away from more externally-driven inflation towards more sustainable domestic price pressures stemming from tightening labor markets and the closing of pandemic output gaps (Chart 2). So the mix of inflation in most developed market countries will be more “core” and less “non-core” inflation driven by higher commodity prices and global supply chain disruptions. Yet there is little sign that those non-core inflation pressures are slowing, particular in price gauges most exposed to supply chains like producer price indices (PPI). US PPI inflation climbed to 15-year high of 8.3% on a year-over-year basis in August, while annual growth in the euro area PPI hit 12.1% in July – the fastest pace in the 30-year history of that data series (Chart 3). Surging PPI inflation reflects global price pressures, with import prices expanding at double-digit rates in both the US and Europe. Some of that more externally driven price pressure stems from commodity markets. While the prices for some notable commodities like lumber and iron ore have seen significant retracements from pandemic-era highs over the past several months, more economically sensitive commodities like aluminum and natural gas have all seen very strong price increases (Chart 4). Copper and oil prices are also holding firm, although both are off 2021 highs. Chart 3No Sign Of Slowing Global Inflation At The Producer Level
No Sign Of Slowing Global Inflation At The Producer Level
No Sign Of Slowing Global Inflation At The Producer Level
The price momentum of overall commodity price indices like the CRB Raw Industrials has clearly rolled over, but has held up much better than would be expected given signs of slowing global growth. Chart 4Commodity Markets Still More Inflationary Than Disinflationary
Commodity Markets Still More Inflationary Than Disinflationary
Commodity Markets Still More Inflationary Than Disinflationary
The current depressed level of the China credit impulse, and the flat year-over-year change of the global PMI, would typically be associated with flat commodity prices rather than the current 34% annual growth rate (Chart 5). A lack of sustained upward pressure on the US dollar is likely helping keep commodity prices, which are priced in dollars, more elevated than expected. Even more important, however, are the low inventories for many commodities relative to firm demand (which largely explains the current surge in aluminum and natural gas prices). This mirrors a broader global economic trend towards companies running lower inventories relative to sales, which has been exacerbated by the economic uncertainties of the COVID-19 pandemic. The US overall business inventory-to-sales ratio is now at the lowest level in the history of the series (Chart 6). Chart 5Commodity Price Inflation Peaking, But Not Slowing Much
Commodity Price Inflation Peaking, But Not Slowing Much
Commodity Price Inflation Peaking, But Not Slowing Much
Chart 6Supply Squeezes Are Likely To Persist
Supply Squeezes Are Likely To Persist
Supply Squeezes Are Likely To Persist
Before the pandemic, firms have gotten away with running very lean inventories because of globalized supply chains that allow firms to maintain the minimum amount of inventory to meet demand. Yet “just-in-time” inventory management only works when suppliers can deliver raw materials or finished goods in a timely fashion at low cost. The pandemic has blown up that model, making it much harder to deliver products and materials from critical countries like China. Global shipping costs have exploded higher and are showing no signs of slowing (bottom panel), while supplier delivery times remain well above historical averages according to measures like the US ISM index. Those higher costs are feeding through into overall inflation measures, particularly for the components most exposed to supply chain disruption. In Chart 7, we show a breakdown of the overall CPI inflation data for the US, euro area, UK and Canada. The groupings shown in the chart are based on an analysis done by the Bank of Canada back in August to measure pandemic impacts on Canadian inflation.1 The top panel of the chart shows the contribution to overall inflation for elements most exposed to supply constraints (like autos and durable goods). The second panel of the chart shows the contribution from sectors more exposed to increased demand as economies reopen from pandemic restrictions, like dining at restaurants and travel. The remaining panels of the chart show the contributions from energy prices and all other components not covered in the top three panels. Chart 7Fed's Transitory Narrative At Risk From Lingering Supply Chain Disruption
Fed's Transitory Narrative At Risk From Lingering Supply Chain Disruption
Fed's Transitory Narrative At Risk From Lingering Supply Chain Disruption
Chart 8High US Inflation May Not Prove To Be So Transitory
High US Inflation May Not Prove To Be So Transitory
High US Inflation May Not Prove To Be So Transitory
The conclusion from our chart is that supply disruptions have added more to US and Canadian inflation so far in 2021, while reopening demand has been more meaningful for UK and US inflation. The pickup in euro area inflation has been mostly an energy price story, although reopening demand has started to contribute to the rising trend of overall inflation. The implication from this analysis is that persistent supply chain disruptions could become a bigger issue for future inflation – and monetary policy decisions – in the US and Canada. The acceleration of US realized inflation in 2021 has already begun to broaden out from the most volatile components, according to measures like the Dallas Fed Trimmed Mean PCE (Chart 8). Faster inflation is also feeding through into higher US consumer inflation expectations according to surveys from the New York Fed and the University of Michigan. Those increases are not deemed to be temporary, with longer-term inflation expectations now moving higher. The New York Fed’s survey shows that inflation is expected to be 4% over the next three years, two full percentage points above the Fed’s target, which must be ringing some alarm bells on the FOMC. Chart 9European Consumers Are Waking Up To Higher Inflation
European Consumers Are Waking Up To Higher Inflation
European Consumers Are Waking Up To Higher Inflation
Consumer inflation expectations are also starting to perk up outside the US. The YouGov/Citigroup survey shows an expectation of UK inflation over the next 5-10 years of 3.5%, while the Bank of England/Kantar survey is at 3% over the next five years (Chart 9, top panel). Both are above the Bank of England’s 2% inflation target. The European Commission confidence surveys have shown a sharp increase in the net share of respondents expecting higher inflation in the coming months (bottom panel), while the Bundesbank’s August consumer survey shows that Germans now expect 3.5% inflation over the next 12 months, up from 2% back in March. Bottom Line: Supply chain disruptions are lasting for much longer than originally expected, while faster realized global inflation is feeding through into higher longer-term consumer inflation expectations, most notably in the US. This raises the risk that the 2021 inflation pickup will last much longer than expected and force a bond-bearish repricing of future interest rate expectations. Negative Real Yields – The Achilles Heel For Bond Markets It is clear that supply chain disruptions are having a more lasting effect on global inflation than investors, and policymakers, expected earlier this year. Yet while both market-based and survey-based measures of inflation expectations are moving higher, interest rate markets are still pricing in a very dovish future path for policy rates of the major developed market central banks. For example, our 24-month discounters, which measure the change in interest rates over the next two years discounted in overnight index swap (OIS) curves, show that only 71bps, 61bps and 13bps of rate hikes are expected in the US, UK and euro area, respectively, by September 2023 (Chart 10). This continues a trend that we have highlighted in recent reports – the persistence of negative real interest rate expectations in the developed markets that is also keeping real bond yields in sub-0% territory. In the US, the OIS forward curve shows that the first Fed rate hike is expected in early 2023 with a very slow pace of rate increases over the following 2-3 years (Chart 11). The funds rate is expected to level off at 1.75% and stay there through 2030. At the same time, the CPI swap forward curve has inflation falling steadily over the next couple of years, but leveling off around 2.35% for the rest of the upcoming decade. Combining those two forward projections comes up with an implied path for the real fed funds rate that is persistently negative for the next ten years, “settling” at -0.6% by the end of the decade. Chart 10Bond Markets Exposed To More Hawkish Central Banks
Bond Markets Exposed To More Hawkish Central Banks
Bond Markets Exposed To More Hawkish Central Banks
Chart 11US Real Yields Priced For Extended Fed Dovishness
US Real Yields Priced For Extended Fed Dovishness
US Real Yields Priced For Extended Fed Dovishness
An even more deeply negative real rate path is discounted in the euro area forward curves. The ECB is expected to begin lifting rates in 2023, eventually moving out of negative (nominal) territory in 2026 before climbing to +0.5% by 2030 (Chart 12). Euro area CPI swaps are priced for a fall in inflation back below 2% over the next two years, eventually stabilizing at 1.75% over the latter half of the next decade. The real ECB policy rate is therefore expected to settle at -1.25% by 2030. In the UK, markets are discounting much of what has been seen in the years since the 2008 financial crisis – a Bank of England that does very little with interest rates. The central bank is expected to begin lifting rates in 2023, but only a handful of rate hikes are expected in the following years with Bank Rate only climbing to 1% and settling there for most of the upcoming decade. The UK CPI swap curve is discounting relatively high inflation over the next decade, settling at 3.6% in 2030. Thus, the market is discounting a long-run real Bank of England policy rate of -2.6%. This pricing of negative real policy rates so far into the future goes a long way to explain why longer-term real government bond yields have also been consistently negative in the US, Germany, UK and elsewhere in the developed markets. That can be seen in Charts 11, 12 and 13, where we have added the 10-year inflation-linked (real) bond yield for US TIPS, French OATis and UK index-linked Gilts. In all three cases, the 10-year real yield has “gravitated” towards the realized path of the real policy rate – the nominal rate minus headline CPI inflation – over the past two decades. Chart 12Negative Real Rates Forever In Europe?
Negative Real Rates Forever In Europe?
Negative Real Rates Forever In Europe?
Chart 13BoE Not Expected To Do Much Over The Next Decade
BoE Not Expected To Do Much Over The Next Decade
BoE Not Expected To Do Much Over The Next Decade
Chart 14Nominal Yields Will Move Higher If Negative Real Yields Persist
Nominal Yields Will Move Higher If Negative Real Yields Persist
Nominal Yields Will Move Higher If Negative Real Yields Persist
Persistent low government bond yields, both in nominal and inflation-adjusted terms, have resulted in lower yields across the global fixed income markets as investors have been forced to take on more risk to find acceptable yields. This has resulted in a situation where nominal yields on riskier assets like US high-yield corporate bonds and Italian government debt are trading below prevailing headline inflation rates in the US and Europe (Chart 14). Bond investors would likely only be comfortable accepting such negative real yields on the riskier parts of the fixed income universe if a) inflation was expected to decline, and/or b) real yields on risk-free government bonds were expected to stay negative for longer as central banks stay dovish. In either case, the “bet” made by investors is that the inflation surge seen this year will indeed prove to be transitory, as central banks are forecasting. If that benign outlook proves to be incorrect and inflation stays resilient for longer – potentially because of the risk of lingering supply chain disruptions described earlier in this report - nominal bond yields will have to reprice higher to account for faster realized inflation (and, most likely, rising inflation expectations). This process will start in government bond markets, as global central banks will be forced to respond to stubbornly high inflation by turning more hawkish, first with faster tapering of QE bond buying and, later, with interest rate hikes. We continue to see persistent negative real yields as the biggest source of risk in developed economy bond markets over the next couple of years. Those yields discount a benign path for both inflation and future monetary policy that is looking increasingly less likely – especially with tightening labor markets and rising consumer inflation expectations already forcing central banks, led by the Fed, to move incrementally towards less accommodative policy settings. Bottom Line: Global bond markets have made a collective bet on the “transitory” inflation narrative by driving yields on government bonds, and even the riskier parts of the corporate credit universe like US and European high-yield, below actual inflation. Markets will have to reprice those negative real bond yields higher if inflation proves to be more persistent than expected - particularly with central banks likely to respond with faster tapering and, in some cases, eventual rate hikes. Stay below-benchmark on overall global duration exposure in fixed income portfolios. Robert Robis, CFA Chief Fixed Income Strategist rrobis@bcaresearch.com Footnotes 1 We have attempted to match the groupings shown in the Bank of Canada analysis as much as possible for the other countries, although there are some minor differences based on how each country’s consumer price index sub-indices are defined. Recommendations The GFIS Recommended Portfolio Vs. The Custom Benchmark Index
What If Higher Inflation Is Not Transitory?
What If Higher Inflation Is Not Transitory?
Duration Regional Allocation Spread Product Tactical Trades Yields & Returns Global Bond Yields Historical Returns
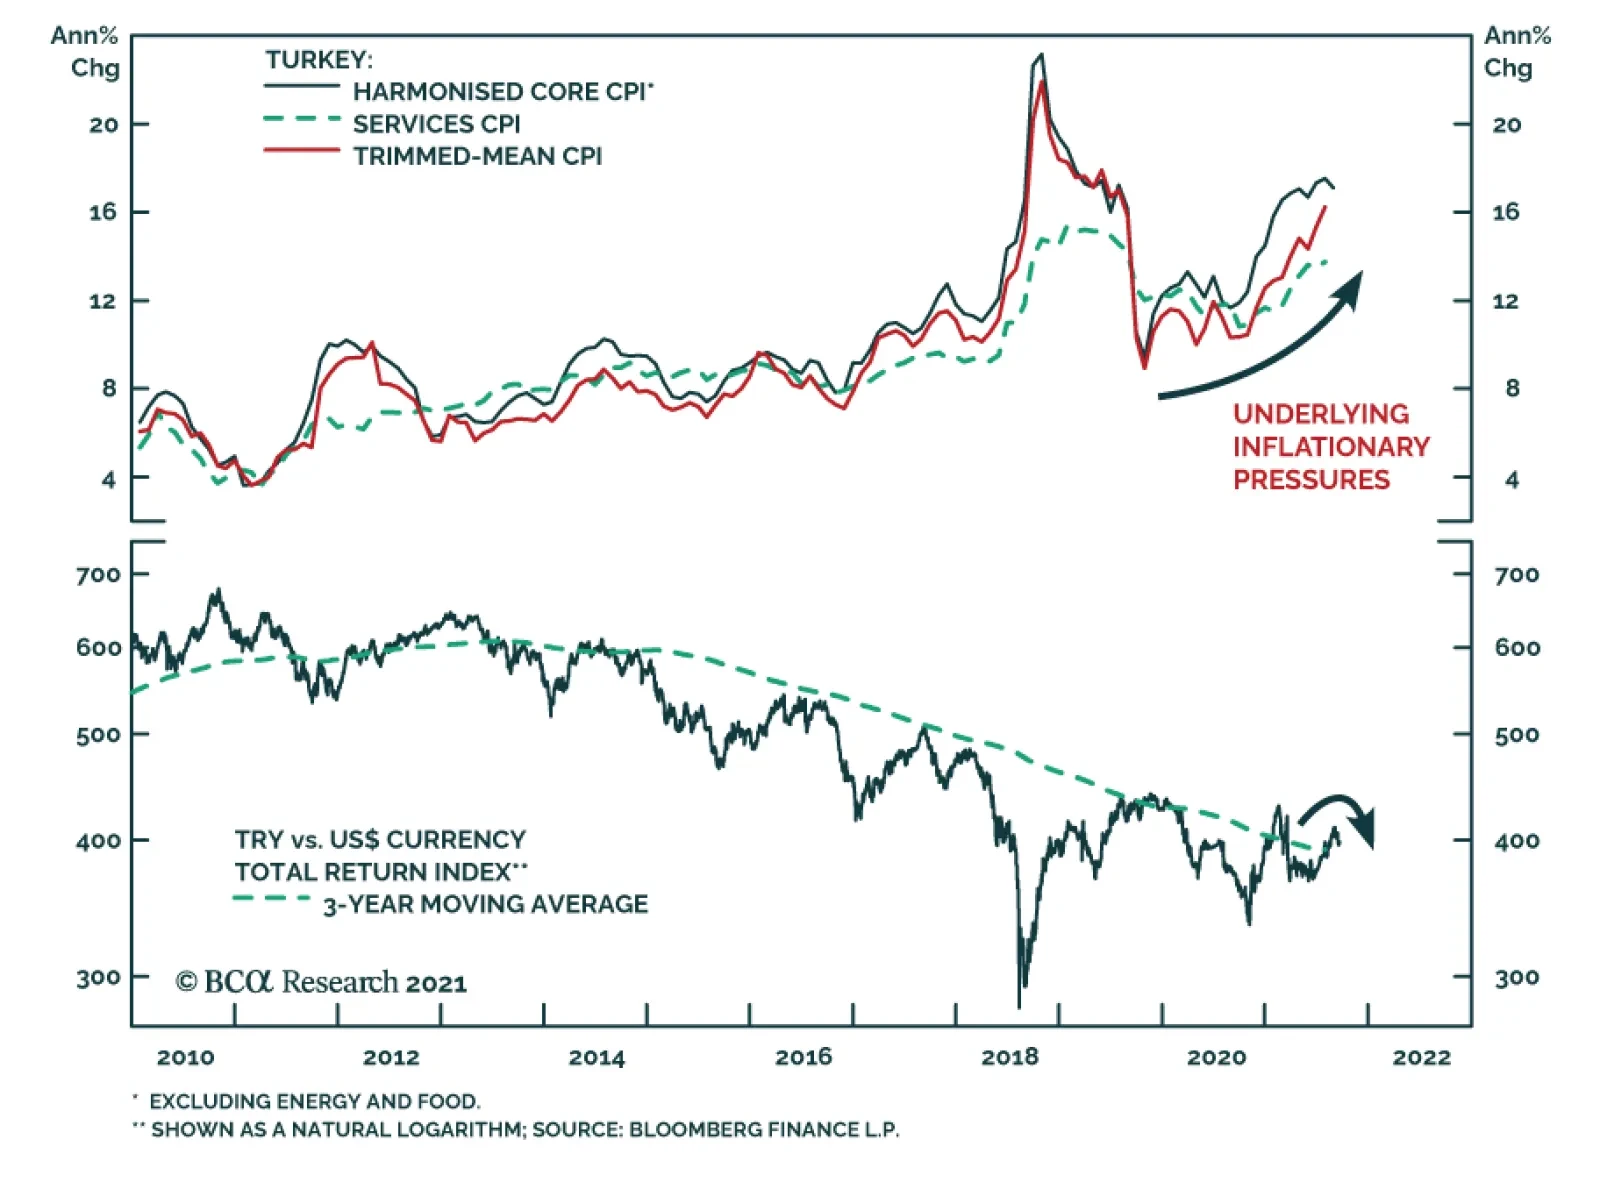
The Turkish central bank surprised investors with a 100-basis point rate cut on Thursday, bringing the one-week repo rate down to 18%. The decision comes despite rising inflation. Headline CPI has been steadily climbing since late-2019 and reached 19.25% in…
Highlights Asian and European natural gas prices will remain well bid as the Northern Hemisphere winter approaches. An upgraded probability of a second La Niña event this winter will keep gas buyers scouring markets for supplies (Chart of the Week). The IEA is pressing Russia to make more gas available to European consumers going into winter. While Russia is meeting contractual commitments, it is also trying to rebuild its inventories. Gas from the now-complete Nord Stream 2 pipeline might not flow at all this year. High natgas prices will incentivize electric generators to switch to coal and oil. This will push the level and costs of CO2 emissions permits higher, including coal and oil prices. Supply pressures in fossil-fuel energy markets are spilling into other commodity markets, raising the cost of producing and shipping commodities and manufactures. Consumers – i.e., voters – experiencing these effects might be disinclined to support and fund the energy transition to a low-carbon economy. We were stopped out of our long Henry Hub natural gas call spread in 1Q22 – long $5.00/MMBtu calls vs short $5.50/MMBtu calls in Jan-Feb-Mar 2022 – and our long PICK ETF positions with returns of 4.58% and -10.61%. We will be getting long these positions again at tonight's close. Feature European natural gas inventories remain below their five-year average, which, in the event of another colder-than-normal winter in the Northern Hemisphere, will leave these markets ill-equipped to handle a back-to-back season of high prices and limited supply (Chart 2).1 The probability of a second La Niña event this winter was increased to 70-80% by the US Climate Prediction Center earlier this week.2 This raises the odds of another colder-than-average winter. As a result, markets will remain focused on inventories and flowing natgas supplies from the US, in the form of Liquified Natural Gas (LNG) cargoes, and Russian pipeline shipments to Europe as winter approaches. Chart of the WeekSurging Natural Gas Prices Intensify Competition For Supplies
Natgas Markets Continue To Tighten
Natgas Markets Continue To Tighten
Chart 2Natgas Storage Remains Tight
Natgas Markets Continue To Tighten
Natgas Markets Continue To Tighten
US LNG supplies are being contested by Asian buyers, where gas storage facilities are sparse, and European buyers looking for gas to inject into storage as they prepare for winter. US LNG suppliers also are finding ready bids in Brazil, where droughts are reducing hydropower availability. In the first six months of this year, US natgas exports averaged 9.5 bcf/d, a y/y increase of more than 40%. Although Russia's Nord Stream 2 pipeline has been completed, it still must be certified to carry natgas into Germany. This process could take months to finish, unless there is an exemption granted by EU officials. Like the US and Europe, Russia is in the process of rebuilding its natgas inventories, following a colder-than-normal La Niña winter last year.3 Earlier this week, the IEA called on Russia to increase natgas exports to Europe as winter approaches. The risk remains no gas will flow through Nord Stream 2 this year.4 Expect Higher Coal, Oil Consumption As other sources of energy become constrained – particularly UK wind power in the North Sea, where supplies went from 25% of UK power in 2020 to 7% in 2021 – natgas and coal-fired generation have to make up for the shortfall.5 Electricity producers are turning more towards coal as they face rising natural gas prices.6 Increasing coal-fired electric generation produces more CO2 and raises the cost of emission permits, particularly in the EU's Emissions Trading System (ETS), which is the largest such market in the world (Chart 3). Prices of December 2021 ETS permits, which represent the cost of CO2 emissions in the EU, hit an all-time high of €62.75/MT earlier this month and were trading just above €60.00/MT as we went to press. Chart 3Higher CO2 Emissions Follow Lower Renewables Output
Higher CO2 Emissions Follow Lower Renewables Output
Higher CO2 Emissions Follow Lower Renewables Output
Going into winter, the likelihood of higher ETS permit prices increases if renewables output remains constrained and natgas inventories are pulled lower to meet space-heating needs in the EU. This will increase the price of power in the EU, where consumers are being particularly hard hit by higher prices (Chart 4). The European think tank Bruegel notes that even though natgas provides about 20% of Europe's electricity supply, it now is setting power prices on the margin.7 Chart 4EU Power Price Surge Is Inflationary
Natgas Markets Continue To Tighten
Natgas Markets Continue To Tighten
Elevated natgas prices are inflationary, according to Bruegel: "On an annual basis, a doubling of wholesale electricity prices from about €50/megawatt hour to €100/MWh would imply that EU consumers pay up to €150 billion (€50/MWh*3bn MWh) more for their electricity. … Drastic increases in energy spending will shrink the disposable income of the poorest households with their high propensity to consume." This is true in other regions and states, as well. Is the Natgas Price Surge Transitory? The odds of higher natgas and CO2 permit prices increase as the likelihood of a colder-than-normal winter increases. Even a normal winter likely would tax Europe's gas supplies, given the level of inventories, and the need for Russia to replenish its stocks. However, at present, even with the odds of a second La Niña event this winter increasing, this is a probable event, not a certainty. The global natgas market is evolving along lines similar to the crude oil market. Fungible cargoes can be traded and moved to the market with the highest netback realization, after accounting for transportation. High prices now will incentivize higher production and a stronger inventory-injection season next year. That said, prices could stay elevated relative to historical levels as this is occurring. Europe is embarked on a planned phase-out of coal- and nuclear-powered electricity generation over the next couple of years, which highlights the risks associated with the energy transition to a low-carbon future. China also is attempting to phase out coal-fired generation in favor of natgas turbines, and also is pursuing a buildout of renewables and nuclear power. Given the extreme weather dependence on prices for power generated from whatever source, renewables will remain risky bets for modern economies as primary energy sources in the early stages of the energy transition. When the loss of wind, for example, must be made up with natgas generation and that market is tight owing to its own fundamental supply-demand imbalance, volatile price excursions to high levels could be required to destroy enough demand to provide heat in a cold winter. This would reduce support for renewables if it became too-frequent an event. This past summer and coming winter illustrate the risk of too-rapid a phase out of fossil-fueled power generation and space-heating fuels (i.e., gas and coal). Frequent volatile energy-price excursions, which put firms and households at risk of price spikes over an extended period of time, are, for many households, material events. We have little doubt the commodity-market effects will be dealt with in the most efficient manner. As the old commodity-market saw goes, "High prices are the best cure for high prices, and vice versa." All the same, the political effects of another very cold winter and high energy prices are not solely the result of economic forces. Inflation concerns aside, consumers – i.e., voters – may be disinclined to support a renewable-energy buildout if the hits to their wallets and lifestyles become higher than they have been led to expect. Investment Implications The price spike in natgas is highly likely to be a transitory event. Another surge in natgas prices likely would be inflationary while supplies are rebuilding – so, transitory. Practically, this could stoke dissatisfaction among consumers, and add a political element to the transition to a low-carbon energy future. This would complicate capex decision-making for incumbent energy suppliers – i.e., the fossil-fuels industries – and for the metals suppliers, which will be relied upon to provide the literal building blocks for the renewables buildout. Robert P. Ryan Chief Commodity & Energy Strategist rryan@bcaresearch.com Ashwin Shyam Research Associate Commodity & Energy Strategy ashwin.shyam@bcaresearch.com Commodities Round-Up Energy: Bullish US crude oil inventories fell 3.5mm barrels in the week ended 17 September 2021, according to the US EIA. Product inventories built slightly, led by a 3.5mm-build in gasoline stocks, which was offset by a 2.6mm barrel draw in distillates (e.g., diesel fuel). Cumulative average daily crude oil production in the US was down 7% y/y, and stood at 10.9mm b/d. Cumulative average daily refined-product demand – what the EIA terms "Product Supplied" – was estimated at 19.92mm b/d, up almost 10% y/y. Brent prices recovered from an earlier sell-off this week and were supported by the latest inventory data (Chart 5). Base Metals: Bullish Iron ore prices have fallen -55.68% since hitting an all-time high of $230.58/MT in May 12, 2021 (Chart 6). This is due to sharply reduced steel output in China, as authorities push output lower to meet policy-mandated production goals and to conserve power. Even with the cuts in steel production, overall steel output in the first seven months of the year was up 8% on a y/y basis, or 48mm MT, according to S&P Global Platts. Supply constraints likely will be exacerbated as the upcoming Olympic Games hosted by China in early February approach. Authorities will want blue skies to showcase these events. Iron ore prices will remain closer to our earlier forecast of $90-$110/MT than not over this period.8 Precious Metals: Bullish The Federal Open Market Committee is set to publish the results of its meeting on Wednesday. In its last meeting in June, more hawkish than expected forecasts for interest rate hikes caused gold prices to drop and the yellow metal has been trading significantly lower since then. Our US Bond Strategy colleagues expect an announcement on asset purchase tapering in end-2021, and interest rate increases to begin by end-2022.9 Rate hikes are contingent on the Fed’s maximum employment criterion being reached, as expected and actual inflation are above the Fed criteria. Tapering asset purchases and increases in interest rates will be bearish for gold prices. Chart 5
BRENT PRICES BEING VOLATILE
BRENT PRICES BEING VOLATILE
Chart 6
BENCHMARK IRON ORE 62% FE, CFR CHINA (TSI)RECOVERING
BENCHMARK IRON ORE 62% FE, CFR CHINA (TSI)RECOVERING
Footnotes 1 Equinor, the Norwegian state-owned energy-supplier, estimates European natgas inventories will be 70-75% of their five-year average this winter. Please see IR Gas Market Update, September 16, 2021. 2 Please see "ENSO: Recent Evolution, Current Status and Predictions," published by the US Climate Prediction Center 20 September 2021. Earlier this month, the Center gave 70% odds to a second La Niña event in the Northern Hemisphere this winter. Please see our report from September 9, 2021 entitled NatGas: Winter Is Coming for additional background. 3 Please see IEA calls on Russia to send more gas to Europe before winter published by theguardian.com, and Big Bounce: Russian gas amid market tightness. Both were published on September 21, 2021. 4 Please see Nord Stream Two Construction Completed, but Gas Flows Unlikely in 2021 published 14 September 2021 by Jamestown.org. 5 Please see The U.K. went all in on wind power. Here’s what happens when it stops blowing, published by fortune.com on 16 September 2021. Argus Media this week reported wind-power output fell 56% y/y in September 2021 to just over 2.5 TWh. 6 Please see UK power firms stop taking new customers amid escalating crisis, published by Aljazeera; Please see UK fires up coal power plant as gas prices soar, published by BBC. 7 Please see Is Europe’s gas and electricity price surge a one-off?, published by Bruegel 13 September 2021. 8 Please see China's Recovery Paces Iron Ore, Steel, which we published on November 5, 2020. 9 Please see 2022 Will Be All About Inflation and Talking About Tapering, published on September 22, 2021 and on August 10, 2021 respectively. Investment Views and Themes Recommendations Strategic Recommendations Commodity Prices and Plays Reference Table Trades Closed in 2021 Summary of Closed Trades
Highlights Investment Grade: Investment grade corporate bond total returns will be close to zero or negative during the next 12 months. The bonds are also likely to outperform duration-matched Treasuries during that period, but excess returns are probably capped at 85 bps. High-Yield: High-yield total returns will fall between -0.29% and +1.80% during the next 12 months, but with a much higher likelihood of being positive than investment grade corporates. Junk will outperform duration-matched Treasuries by between 0.94% and 1.84%, besting the excess returns earned in investment grade. Inflation & The Fed: The Fed will announce asset purchase tapering before the end of this year, and tapering will proceed at a pace that opens the door to a potential rate hike before the end of 2022. Ultimately, whether the Fed lifts rates in 2022 will depend on trends in core CPI excluding COVID-impacted services and autos, along with wage growth and inflation expectations. Feature Chart 1Valuations Are Stretched
Valuations Are Stretched
Valuations Are Stretched
There are two broad factors that must be considered when deciding whether to favor corporate bonds over Treasuries in a US bond portfolio: (i) The cyclical macroeconomic environment and (ii) valuation. The problem is that, as it stands today, these two factors are sending contrasting signals. The cyclical macroeconomic environment is consistent with strong positive excess returns for spread product versus Treasuries. However, corporate bond spreads and yields are extremely low relative to history (Chart 1). We view the slope of the yield curve as the single best indicator of the cyclical macro environment and have shown in prior research that corporate bonds tend to deliver positive excess returns versus Treasuries when the 3-year/10-year Treasury slope is above 50 bps, even when corporate spreads are tight.1 At present, the 3-year/10-year slope sits at 90 bps and our bias will be toward an overweight allocation to corporates until the slope breaks below 50 bps. A flatter yield curve is negative for corporate bond performance because it suggests that monetary conditions are less accommodative. It also makes it more likely that an unforeseen shock will lead to yield curve inversion, a highly reliable recession indicator. While the macro environment is consistent with continued corporate bond outperformance versus Treasuries, valuation suggests that we should anticipate lower returns than usual from corporate bonds. Table 1 shows annualized corporate bond excess returns during each of the past six cycles. Additionally, it splits each cycle into three phases based on the slope of the 3-year/10-year Treasury curve. Phase 1 of the cycle lasts from the end of the prior recession until the slope breaks below 50 bps. Phase 2 encompasses the period when the slope is between 0 bps and 50 bps. Phase 3 lasts from when the yield curve inverts until the start of the next recession. Table 1Corporate Bond Excess Returns In Different Phases Of The Cycle
Expected Returns In Corporate Bonds
Expected Returns In Corporate Bonds
The first conclusion to draw from Table 1 is that excess returns tend to be lower in Phase 2 than in Phase 1 and lower in Phase 3 than in Phase 2. Second, we see that investment grade corporates have returned an annualized 7.55% in excess of duration-matched Treasuries so far this cycle and high-yield corporates have delivered 15.15% of outperformance. These figures are well above even those seen in prior Phase 1 periods. Based on this, an expectation for lower – but still positive – excess corporate bond returns seems like a reasonable base case for the next 6-12 months. Table 2 is identical to Table 1 except that it shows total returns instead of excess returns. We observe that, so far this cycle, junk bond total returns have outpaced prior Phase 1 periods. Investment grade total returns have been slightly lower given the greater exposure to interest rate risk of those securities. Table 2Corporate Bond Total Returns In Different Phases Of The Cycle
Expected Returns In Corporate Bonds
Expected Returns In Corporate Bonds
As noted above, our expectation is that corporate bonds will outperform Treasuries during the next 6-12 months, but that both excess returns and total returns will take a step down. The next section of this report presents a scenario analysis that puts some more specific numbers on the sorts of excess and total corporate bond returns investors might expect to earn during the next year. Corporate Bond Returns: Scenario Analysis Methodology To run our scenario analysis for investment grade corporate bond returns we use the following equations: Excess Return = OAS0 – D0 (dOAS) Total Return = OAS0+ TSY0 – D0 (dOAS+dTSY) Where: Excess Return = The expected corporate index excess return versus duration-matched Treasuries during the next 12 months Total Return = The expected corporate index total return during the next 12 months OAS0 = Today’s average index option-adjusted spread D0 = Today’s average index duration TSY0 = Today’s Treasury yield that matches the duration of the corporate index dOAS = The expected change in the index option-adjusted spread during the next 12 months dTSY = The expected change in the duration-matched Treasury yield during the next 12 months These equations are obviously simplifications. For example, the impact of convexity is ignored. However, Chart 2 shows that our proxies track actual index returns very closely over time, assuming the estimated yield and spread changes are accurate. Chart 2Estimating IG Returns
Estimating IG Returns
Estimating IG Returns
We use similar equations for assessing high-yield corporate returns, with the additional complication that we must include an assumption for default losses. Excess Return= OAS0 – (DR × (1 - RR)) –D0(dOAS) Total Return= OAS0 + TSY0 – (DR × (1 – RR)) –D0 (dOAS + dTSY) In these equations: DR = The expected issuer-weighted default rate for the next 12 months RR = The expected average recovery rate on defaulted debt for the next 12 months Once again, though these equations are relatively simple, they do a good job of capturing actual returns over time (Chart 3). Chart 3Estimating HY Returns
Estimating HY Returns
Estimating HY Returns
Scenarios With the above equations in hand, we can easily make some educated guesses about future yields, spreads and default losses and translate those assumptions into expected return forecasts. Specifically, we test three different scenarios (bullish, neutral and bearish) for corporate spreads, Treasury yields and default losses. For corporate index spreads, both investment grade and high-yield, our bullish scenario assumes that spreads reach the all-time tight levels seen in the mid-1990s. For investment grade bonds this spread level is 58 bps, 27 bps below the current level. For high-yield bonds this spread level is 233 bps, 41 bps below the current level. Our neutral scenario assumes that index spreads remain at their current levels (85 bps for investment grade and 274 bps for junk). Finally, our bearish scenario assumes that spreads widen back to the average levels seen during the 2017-2019 period (112 bps for investment grade and 369 bps for junk), this implies 27 bps of widening for investment grade and 95 bps of widening for junk. Given our view that bond yields will rise as we approach the next Fed tightening cycle, none of our scenarios assume that Treasury yields will fall during the next 12 months. Our bullish Treasury yield scenario assumes that yields stay flat at current levels. Our neutral Treasury yield scenario assumes that yields follow the path implied by current forward rates, and our bearish Treasury yield scenario assumes that yields rise to levels consistent with fair value estimates assuming the market prices-in a December 2022 Fed liftoff followed by 100 bps of rate hikes per year until the fed funds rate levels-off at 2.08%.2 We use the 7-year and 6-year Treasury yields as our inputs for the investment grade and high-yield scenarios, respectively, as those yields most closely match the interest rate component embedded in the corporate indexes. For default losses, our bullish scenario assumes a 1.8% default rate – consistent with the rate at which defaults are tracking so far this year – and a recovery rate of 50%. Our neutral scenario assumes a 3% default rate and a 40% recovery rate. Our bearish scenario assumes a 4% default rate and 30% recovery rate. Investment Grade Results Table 3 shows the results of our scenario analysis for investment grade corporate bond returns. Table 3Investment Grade Corporate Bond Expected Return Scenarios
Expected Returns In Corporate Bonds
Expected Returns In Corporate Bonds
Starting with excess returns, we think it is most likely that spreads remain near current levels, or perhaps widen a bit, during the next 12 months. We think it’s extremely unlikely that spreads will tighten to the levels seen in the mid-1990s because the average duration of the index is much higher today than it was back then. All else equal, it’s generally true that securities with higher duration also have higher OAS. This means we expect investment grade corporate bond excess returns to be between -153 bps and +85 bps during the next 12 months, probably closer to +85 bps. Obviously, this represents a significant step down from the +550 bps earned during the past year. In fact, even the most bullish scenario where spreads tighten back to all-time lows only implies an excess return of +323 bps, well below the recent rate of outperformance. As for total returns, we estimate that a neutral scenario where the index spread holds steady and Treasury yields follow the forward curve will lead to total returns being close to zero during the next 12 months. In fact, our results suggest that it’s highly likely that investment grade corporate bonds will deliver negative total returns during the next 12 months. Yes, the index is expected to deliver a total return of 1.98% if both the index spread and duration-matched Treasury yield remain at their current levels, but an environment where growth is slow enough to keep Treasury yields flat is much more likely to coincide with spread widening than with steady corporate spreads. For some additional historical perspective, the columns labeled “Historical Percentile Rank” show how the returns in each scenario would rank relative to actual returns earned during the past 31 calendar years. For example, even the most bullish total return scenario of 4.36% ranks at the 27th percentile relative to history. This means that it would only be better than 27% of historical 12-month return observations for that index. High-Yield Results Tables 4A, 4B and 4C summarize the results of our high-yield scenario analysis. Table 4A assumes the bullish scenario for default losses, Table 4B assumes the neutral scenario for default losses and Table 4C assumes the bearish scenario for default losses. Table 4AHigh-Yield Corporate Bond Expected Return Scenarios: Bullish Default Loss Scenario*
Expected Returns In Corporate Bonds
Expected Returns In Corporate Bonds
Table 4BHigh-Yield Corporate Bond Expected Return Scenarios: Neutral Default Loss Scenario*
Expected Returns In Corporate Bonds
Expected Returns In Corporate Bonds
Table 4CHigh-Yield Corporate Bond Expected Return Scenarios: Bearish Default Loss Scenario*
Expected Returns In Corporate Bonds
Expected Returns In Corporate Bonds
Looking at excess returns, the first result that jumps out is that even the most bullish scenario leads to an expected 12-month excess return of +3.43%, this would be equivalent to the median return earned during the past 31 calendar years. In our view, it’s more likely that excess returns will be in the +0.94% to +1.84% range during the next 12 months. This is consistent with flat spreads and a range for default losses between our neutral and bullish scenarios. Our sense is that junk bonds are less likely to deliver negative total returns than investment grade bonds. Though even the most bullish scenario puts expected junk total returns at +4.54%, consistent with the 39th percentile relative to history. Investment Implications To summarize, our expectation is that investment grade corporate bond total returns will be close to zero or negative during the next 12 months. The bonds are also likely to outperform duration-matched Treasuries during that period, but excess returns are probably capped at 85 bps. Our best guess places high-yield total returns at between -0.29% and +1.80%, but with a much higher likelihood of earning positive total returns than a position in investment grade. We estimate that excess junk returns will fall between +0.94% and +1.84%, above returns earned in investment grade. In general, the message is that investors should remain overweight corporate bonds versus Treasuries, but should retain a preference for high-yield over investment grade and should expect to earn far lower returns than were earned during the past year. Given low expected returns, investors should also seek out creative ways of adding additional spread to a bond portfolio. We offered some suggestions in a recent report.3 CPI Update And FOMC Preview This week’s FOMC meeting could be significant for bond markets. First off, there is a possibility that the Fed will announce a timeline for tapering its asset purchases. Our sense is that last month’s weak employment report probably delays this announcement, but we still expect it to come before the end of the year. We expect that the actual tapering of purchases will start in January 2022 and that net Fed purchases will reach zero by Q3 of next year. More broadly, we continue to think that the market is already priced for a tapering announcement in 2021. In other words, any information about asset purchases probably won’t move bond yields that much. What will move bond yields is any hint about when the Fed thinks it may want to start lifting rates. Such news could come in the form of revisions to the Fed’s interest rate forecasts, or in any information that the Fed provides about the pace of asset purchase tapering. Because the Fed has indicated a strong preference for having net purchases at zero prior to liftoff, any pace of tapering that gets net purchases to zero by the middle of next year opens the door to a possible rate hike before the end of 2022. Of course, the economic data between now and the end of 2022 will have a lot to say about whether the Fed actually starts to hike. In particular, last week’s report made the case that next year’s inflation data will determine when rate hikes begin.4 With that in mind, last week’s CPI release showed a significant deceleration in core inflation, driven by the COVID-impacted service and auto sectors that had previously caused inflation to spike (Chart 4). Interestingly, core inflation excluding COVID-impacted services and autos jumped on the month (Chart 4, bottom panel). From the Fed’s perspective, it ignored the transitory rise of COVID-impacted service and auto inflation on the way up, it will also be inclined to ignore its descent. What will ultimately matter for monetary policy is whether underlying inflationary pressures start to build throughout 2022. It is therefore much more important for us to focus on trends in core inflation excluding the COVID-impacted services and autos, along with wage growth and inflation expectations. Our view is that underlying inflationary pressures will be strong enough for the Fed to lift rates before the end of 2022. This will, in large part, be due to an acceleration of shelter inflation (Chart 5). Owner’s Equivalent Rent and Rent of Primary Residence inflation have already jumped, and leading indicators of shelter inflation like the unemployment rate (Chart 5, panel 3) and the Apartment Market Tightness Index (Chart 5, bottom panel) are consistent with further acceleration. Chart 4Looking For Underlying Inflation
Looking For Underlying Inflation
Looking For Underlying Inflation
Chart 5Shelter Inflation Will Keep Rising
Shelter Inflation Will Keep Rising
Shelter Inflation Will Keep Rising
Bottom Line: The Fed will announce asset purchase tapering before the end of this year, and tapering will proceed at a pace that opens the door to a potential rate hike before the end of 2022. Ultimately, whether the Fed lifts rates in 2022 will depend on trends in core CPI excluding COVID-impacted services and autos, along with wage growth and inflation expectations. Ryan Swift US Bond Strategist rswift@bcaresearch.com Footnotes 1 Please see US Bond Strategy Weekly Report, “The Post-FOMC Credit Environment”, dated June 29, 2021. 2 Last week’s report provides more detail on this fair value analysis. Please see US Bond Strategy Weekly Report, “2022 Will Be All About Inflation”, dated September 14, 2021. 3 Please see US Bond Strategy Weekly Report, “The Collapsing Credit Risk Premium”, dated July 20, 2021. 4 Please see US Bond Strategy Weekly Report, “2022 Will Be All About Inflation”, dated September 14, 2021. Recommended Portfolio Specification Other Recommendations Treasury Index Returns Spread Product Returns
Highlights Economy – The inflation question is unresolved, and it will remain that way for the rest of the year: August’s CPI report had something for everyone and ensured the debate will continue. Doves could celebrate the month-over-month decline while hawks could argue that upward inflation pressures are no longer a transitory phenomenon. Markets – Elevated valuations make equities vulnerable, but a little turmoil in China is not likely to trigger a de-rating wave: The demise of large Chinese property developer Evergrande may cause some upheaval in China but it is not likely to ruffle the S&P 500, corporate bonds or other US spread product. Strategy – Policymakers continue to hold the key. As long as the Fed is still easing, and households direct some of their excess savings to consumption, risk assets should outperform: We still think Goldilocks is far more likely that a too-cold or a too-hot outcome. Feature We continue to view the prospects for financial markets and the economy through a Goldilocks-and-the-two-tails lens, with the idea that equities and credit will thrive against a backdrop of supercharged growth and ongoing policy support (Figure 1). The Fed’s unusually pro-cyclical stance will prolong the macro sweet spot for risk assets and ensure positive excess returns provided growth doesn’t flop (the too-cold left tail), or the inflation genie doesn’t get out of the bottle (the too-hot right tail). Though both flanks pose a risk to our base-case Goldilocks scenario, we deem overheating to be the bigger concern. Unless a vaccine-resistant variant reestablishes COVID-19 as a mortal threat to the broad population, we think it is unlikely that growth will tumble below trend this year or next. Figure 1Goldilocks And The Two Tails
Watching Both Flanks
Watching Both Flanks
One does not need to be a sworn devotee of rugged individualism to harbor some misgivings about the magnitude and scope of the direct transfers to American households or the broader fiscal effort to combat the economic effects of the pandemic. Egged on by support amounting to 25% of a year’s output, it remains entirely possible that aggregate demand might overwhelm productive capacity. The emergence of rolling bottlenecks in the spaces that were most crimped by COVID has focused attention on the threat of overheating, but the more lasting risk emanates from spaces that cannot be dismissed as unduly influenced by the pandemic. We have been closely monitoring the path of consumer prices and will continue to do so, but the ultimate outcome remains unclear. Though a Goldilocks macro backdrop remains our base-case expectation, it is far from assured. In this week’s report, we consider three potential disruptions: too much inflation, a change in the Fed’s policy course and a credit shock from China. We do not think that any of the potential disruptions is likely to change the picture in a material way and we therefore reiterate our view that investors with a twelve-month timeframe ought to maintain at least an equal weight exposure to equities and credit in a multi-asset portfolio. Fitting The August CPI Tile Into The Inflation Mosaic The pace of consumer price increases cooled in August, according to the headline and core CPIs. Both measures came in below market expectations, and the leading month-over-month series (Chart 1, dashed line) decelerated more than their year-over-year counterparts (Chart 1, solid line). Although the data were encouraging on their face, the ongoing inflation debate is nowhere near resolved. COVID continues to play havoc with the spaces it impacted most heavily, defying simple interpretations of aggregate CPI data. Base effects have warped year-over-year data once the peak pandemic months of last spring and summer entered the equation. As category-by-category analyses of the April CPI release showed, the lion’s share of the aggregate core CPI increase was powered by new and used cars and a handful of badly disrupted services like air travel, car rental, lodging and in-person entertainment. Chart 1Inflation Seems To Have Peaked
Inflation Seems To Have Peaked
Inflation Seems To Have Peaked
Chart 2A Stunning Reversal On Used-Car Lots
A Stunning Reversal On Used-Car Lots
A Stunning Reversal On Used-Car Lots
The semiconductor-driven production squeeze pushed up new car prices and took used car prices along for the ride as consumers turned to them as a ready substitute. Used car prices then rose even more as rental car companies frantically reversed 2020’s culling of their fleets to meet revived 2021 demand (Chart 2). By July, however, several of those categories had come off the boil and began to make more modest contributions to month-over-month core CPI growth. In August, they turned into headwinds, limiting core CPI’s sequential gain to just 0.1%. While the core index grew at its slowest rate since February, the segments that weren’t as heavily affected by the pandemic – the gray portion of the stacked bars in Chart 3 – experienced their largest price increases of the year. Those core categories less sensitive to transitory pandemic factors have eased a bit on a year-over-year basis (Chart 4, bottom panel) but the leading month-on-month measure suggests they will turn higher going forward. Chart 3Passing The Baton
Watching Both Flanks
Watching Both Flanks
Shelter costs account for 41% of the core CPI basket and though spiking hotel rates (Chart 5, second panel) have made an outsized contribution to their bounce off the bottom (Chart 5, top panel), the much weightier owners’ equivalent rent and primary residence cost measures have begun to hook up (Chart 5, third panel). Series that impact the supply and demand balance for residences, like the prime-age employment-to-population ratio (Chart 5, fourth panel) and the National Multifamily Housing Council’s measures of apartment market activity (Chart 5, fifth panel), suggest that the key rent series will continue moving higher. Chart 4Transitory Factors Are Abating ...
Transitory Factors Are Abating ...
Transitory Factors Are Abating ...
Chart 5... But Rents Are Rising
... But Rents Are Rising
... But Rents Are Rising
The bottom line is that the August CPI report, like much of the economic data in this particularly uncertain time, offered evidence to support opposing interpretations. We will simply have to wait and see how the data evolve over the rest of the year to gain a good read on its future trajectory. We expect that inflation will continue to come down from its summer peak while remaining comfortably above the Fed’s effective 2.3-2.5% core CPI target. Such a move will underscore that its inflation criteria have been met and focus investor attention squarely on the labor market’s progress toward regaining full employment. Much Ado About Nothing The bond market has cottoned on to the fact that the labor market, not consumer price inflation, is the swing factor for monetary policy settings, and the 10-year Treasury note has essentially ignored the core CPI breakout (Chart 6). Equities have evinced little concern, reflecting the causal relationship we noted last week. High inflation by itself is not kryptonite for stocks; the restrictive monetary policy measures the Fed eventually imposes in response to high inflation are. Inflation’s market importance thus turns on the tipping point at which it heralds restrictive monetary policy. Chart 6Treasuries Are On Board With The Transitory View
Treasuries Are On Board With The Transitory View
Treasuries Are On Board With The Transitory View
A Fed that believes elevated inflation readings are transitory is a Fed that will wait to restrain the economy to contain them. A Fed that is determined to let the economy run hot so as to nurture broad-based strength in the labor market is a Fed with a less sensitive inflation reaction function than has prevailed since Paul Volcker’s tenure. The same goes for a Fed that has made no secret of its desire to reset inflation expectations higher. Putting it all together, the Fed appears determined to wait until it sees the whites of inflation’s eyes before it takes action that will undermine economic growth. Our view that the Fed’s inflation reaction function has become less sensitive is independent of the identity of the chair. The revised statement on longer-run goals and monetary policy strategy was issued by the entire FOMC, and investors should not be distracted by the quadrennial reappointment parlor game, which has settled on a contest between chair Powell and board member Brainard. Although Brainard has won progressives’ admiration for her advocacy of tighter bank supervision, policy would not be materially different under her stewardship than it would be under Jay Powell’s. Monetary policy will be accommodative for a long time regardless of who is chairing the FOMC on February 1st and the Biden administration’s nomination decision will not have lasting market implications. Could A Messy Evergrande Unwind Trip Up The US Bull? The financial press last week was filled with stories about the dire condition of Evergrande Property Group (Chart 7), one of China’s largest property developers. As noted in several of last week’s reports, Evergrande is the world’s most indebted developer and its leverage burden is not news to dollar bond investors, who have increasingly required outsized yields to lend to the company.1 All three major credit rating agencies have downgraded it to the equivalent of CC, reflecting their view that default is imminent. Though a technical default may be certain, per reports that Evergrande will fail to make scheduled interest and principal payments due this week, the ultimate ripple effects are unknown. As our Emerging Markets Strategy team has noted, a broad range of outcomes are possible. At the most benign end of the continuum, the event could mark a crescendo of concerns that have been weighing on sentiment and activity, and trigger policy stimulus that produces economic and market inflections. At the other end, Evergrande could intensify the existing credit crunch, sparking a wave of self-reinforcing defaults and bankruptcies, culminating in a systemic event on the order of Lehman Brothers’ bankruptcy. Absent government intervention, the defaults will be messy. Most of the company’s assets are in the form of unfinished properties that will require additional capital and know-how before they can be monetized. Even its portfolios of completed properties may not be easy to sell in a residential market that was already slowing (Chart 8). The pall its troubles have cast over the property market will make things worse by prodding other liquidity-constrained developers to slash prices to move their own inventories. Chart 7Boom And Bust
Boom And Bust
Boom And Bust
Chart 8Not Exactly A Seller's Market
Not Exactly A Seller's Market
Not Exactly A Seller's Market
Our China strategists believe that the government wants to make an example out of Evergrande to impose some discipline on investors and developers. Despite repeated warnings, it has remained on the wrong side of the three red lines policy makers recently established to rein in property market excesses. Some onshore investors may be bailed out, but party officials will have no qualms about leaving offshore investors holding the bag. As China goes, so too do small neighboring economies reliant on its appetite for imports. Resource economies like Brazil, Chile and Australia that export iron ore, copper and other base metals to feed the China construction and infrastructure juggernaut could slow. Suppliers of machinery and specialized manufactured components like Japan and Europe could also feel a bit of a chill. While the US is not immune to disruptions in the rest of the world, it is a comparatively closed economy that is generally less susceptible to external troubles and has minimal financial links with the Middle Kingdom. A review of the 2020 10-Ks for the SIFI banks and Goldman Sachs and Morgan Stanley confirmed that the American banking system has minimal direct exposures to China and Hong Kong. Only Citigroup, which operates a meaningful commercial banking franchise in Hong Kong, has direct cross-border exposures that amount to as much as 1% of assets (Table 1). Table 1SIFI Exposures To China And Hong Kong
Watching Both Flanks
Watching Both Flanks
The bottom line is that we do not view Evergrande as China’s Lehman. Policymakers may want to make an example of it but not to the point that they will stand by in the face of a broad contagion. Even if it did produce a credit event that rippled across Asian EM markets and tempered investors’ enthusiasm for risk assets more generally, US markets would benefit in a relative sense befitting the dollar’s status as a defensive currency, Treasuries’ status as the predominant risk-free asset and the S&P 500’s low-beta nature. The fall of an overextended Chinese property developer is unlikely to push the US out of Goldilocks and into too-cold territory. Investment Implications Inflation will trigger a policy change once it stays high enough for long enough to trigger the Fed’s recalibrated reaction function. Markets will sniff out a policy change ahead of time and could even catalyze a policy change if the bond vigilantes awaken from their long hibernation. When we reiterate our constructive view on markets and the economy over a three-to-twelve-month timeframe, we are reiterating our assessment that markets will not begin to prepare for the policy change within the next twelve months and that growth will appear as if it will remain on an above-trend trajectory for some time beyond. We are confident that the next twelve months will remain “safe” from a policy and a growth perspective. We have much less conviction about the next six to twelve months following next September and are acutely aware that the outlook for the second half of 2022 and the first half of 2023 will exert a meaningful influence next summer. We will adjust our views based on the incoming data, but we do think the first three to six months of our cyclical timeframe will be conducive to risk asset outperformance and therefore reiterate our recommendation to overweight equities and credit while sharply underweighting Treasuries. Doug Peta, CFA Chief US Investment Strategist dougp@bcaresearch.com Footnotes 1 Per Evergrande’s annual reports, its average annual interest rate on outstanding debt on 12/31/20 was 9.49%, up from 8.99% on 12/31/19, 8.13% on 12/31/18 and 8.09% on 12/31/17.
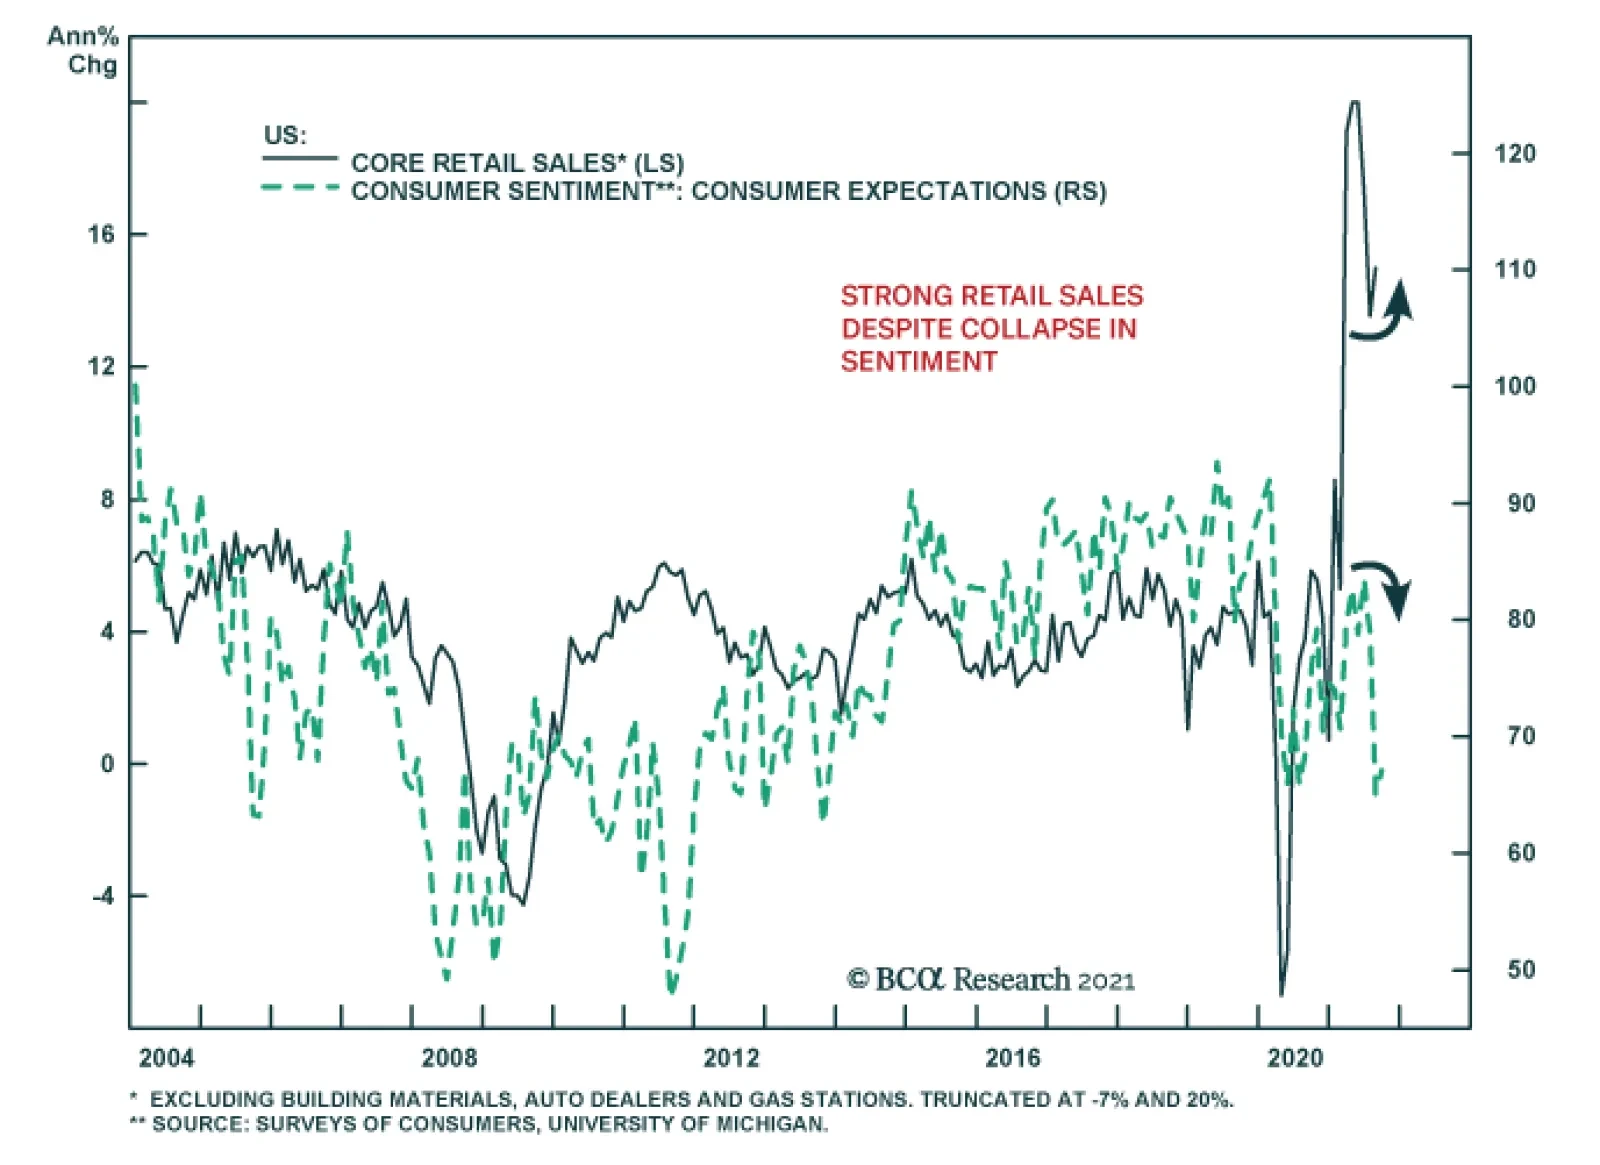
Friday’s preliminary University of Michigan Consumer Sentiment survey revealed that American households experienced a minor improvement in confidence in August. The headline index ticked up 0.7 points to 72. The minor increase reflects a two-point improvement…