Inflation/Deflation

Dear Client, I will be holding a webcast next Friday, September 24th at 10:00 AM EDT (3:00 PM BST, 4:00 PM CEST, 11:00 PM HKT) with BCA Research’s Chief Emerging Markets Strategist Arthur Budaghyan where we will debate the outlook for EM stocks. As this week’s report conveys, I am bullish, while Arthur is in the bearish camp. Please join us for what is sure to be a fiery debate. Also, instead of our regular report next week, we will be sending you a Special Report written by Matt Gertken, BCA Research’s Chief Geopolitical Strategist, discussing the stability of the American political system. I hope you will find it insightful. We will be back the following week with the GIS Quarterly Strategy Outlook, where we will explore the major trends that are set to drive financial markets in the rest of 2021 and beyond. As always, I will hold a webcast discussing the outlook the week after, on Thursday, October 7th. Best regards, Peter Berezin Chief Global Strategist Highlights After lagging the global indices, EM stocks are set to outperform during the remainder of this year and into 2022. Go long the EM FTSE index versus the global benchmark (ETF proxy: VWO versus VT). Five factors will support EM assets over the coming months: 1) The vaccination campaign in emerging markets is in full swing; 2) Domestic EM inflation will crest; 3) China will stimulate its economy; 4) The US dollar will weaken; and 5) EM valuations have discounted a lot of bad news. Contrary to popular perception, the Chinese government has not launched an indiscriminate attack on tech companies. If anything, heightened geopolitical tensions have made it more important than ever for China to buttress its tech sector. Investors wanting to gain exposure to Chinese tech while still limiting risk should consider writing cash-covered puts. For example, a strategy of selling puts on Alibaba could generate a 9% annualized yield while giving investors access to the stock at a forward PE ratio of only 12.5. Go long an equally-weighted basket consisting of the Russian ruble and Brazilian real against the US dollar. Both currencies enjoy favorable interest rate differentials and will benefit from continued strength in commodity markets. Debating The EM Outlook BCA Research has some of the brightest, most creative strategists in the world. While we often agree on many issues, we sometimes disagree. The near-term outlook for emerging markets is a case in point. My colleague, Chief EM Strategist Arthur Budaghyan, is bearish on emerging markets over a 3-to-6 month horizon. In contrast, I am bullish. In this note, I explain why. I see five reasons why EM assets will do very well during the remainder of the year and into 2022: 1) The vaccination campaign in emerging markets is in full swing; 2) Domestic EM inflation will crest; 3) China will stimulate its economy; 4) The US dollar will weaken; and 5) EM valuations have discounted a lot of bad news. Let’s examine all five reasons in turn. Vaccine Access In Emerging Markets Is Improving The proportion of EM populations which have been vaccinated is rising rapidly (Chart 1). India is now vaccinating 10 million people per day, a number that would have seemed unimaginable just a few months ago. Chart 1EM Vaccination Rates Have Been Ramping Up Rapidly
The Best Trade For The Rest Of 2021: Long EM Equities And Currencies
The Best Trade For The Rest Of 2021: Long EM Equities And Currencies
Globally, about 10 billion doses of vaccine will be produced this year (Chart 2). This does not include potential new mRNA vaccines that China is developing. China-based Walvax Biotechnology is conducting late-stage trials in Nepal, with mass production of the vaccine expected to start in October. Sinopharm is also working on its own mRNA vaccine. Meanwhile, the number of new Covid cases in most EM economies has peaked, permitting a relaxation of lockdown measures (Chart 3). Goldman’s Effective Lockdown Index for China has eased significantly since mid-August, although this week’s outbreak in Fujian province could partially reverse that trend. Chart 2At Least 10 Billion Doses Of Vaccine Will Be Produced This Year
The Best Trade For The Rest Of 2021: Long EM Equities And Currencies
The Best Trade For The Rest Of 2021: Long EM Equities And Currencies
Chart 3EM Lockdown Measures Have Eased As The Number Of New Cases Has Peaked
The Best Trade For The Rest Of 2021: Long EM Equities And Currencies
The Best Trade For The Rest Of 2021: Long EM Equities And Currencies
It is true, as Arthur has pointed out, that vaccine hesitancy is a problem in some emerging markets. However, this may not be as significant an issue as previously believed. The huge spike in cases in highly vaccinated countries such as Israel and the UK shows that herd immunity is a pipe dream. Given this reality, as long as everyone who wants a vaccine is able to receive it, the political pressure to maintain lockdowns will dissipate. Pandemic-Induced Spike In Inflation Is Fading As in most developed economies, many emerging markets have experienced a post-pandemic rise in inflation (Chart 4). Whereas DM central banks generally looked through the inflation spike, many EMs did not have that luxury. Chart 4Inflation Across The EM Universe
The Best Trade For The Rest Of 2021: Long EM Equities And Currencies
The Best Trade For The Rest Of 2021: Long EM Equities And Currencies
Worried about an unmooring of inflation expectations and currency depreciation, central banks in such countries as Brazil, Mexico, Chile, Colombia, Peru, Russia, and Turkey have all raised rates this year. Higher rates have weighed on EM growth and financial markets. The good news is that inflationary pressures are starting to abate. This week’s US CPI report for August showed an absolute decline in prices in pandemic-related categories such as airfares, hotels, admissions, and vehicles (Chart 5). Things are even improving on the semiconductor front. Chart 6 shows that memory chip prices are in a clear downtrend. Chart 5Pandemic-Driven Inflation Is Cresting
The Best Trade For The Rest Of 2021: Long EM Equities And Currencies
The Best Trade For The Rest Of 2021: Long EM Equities And Currencies
Chart 6Chip Prices Are Off Their Highs
Chip Prices Are Off Their Highs
Chip Prices Are Off Their Highs
Chart 7Agricultural Prices Have Stabilized, Which Will Help Cool EM Inflation
Agricultural Prices Have Stabilized, Which Will Help Cool EM Inflation
Agricultural Prices Have Stabilized, Which Will Help Cool EM Inflation
Critically for emerging markets, agricultural prices have stabilized (Chart 7). Historically, food inflation has been a major driver of EM inflation. Chinese Stimulus On The Way Growth in China was quite weak in the first half of the year, averaging only 3.5% on a sequential annualized basis (Chart 8). The Bloomberg consensus estimate is for Q3 growth to hit 4.3%, reflecting the negative impact of lockdown measures and the lagged effect from policy tightening. Growth in the fourth quarter is expected to rebound to only 5.7%. This seems too low to us. Barring a major spike in Covid cases, Chinese industry will be saddled with fewer social distancing restrictions in the fourth quarter. Policy is also turning more stimulative. The PBOC cut bank reserve requirements in July. In the past, cuts in reserve requirements have been a reliable predictor of faster credit growth (Chart 9). Chart 8Chinese Growth Should Accelerate After A Disappointing First Half Of 2021
Chinese Growth Should Accelerate After A Disappointing First Half Of 2021
Chinese Growth Should Accelerate After A Disappointing First Half Of 2021
Chart 9Chinese Stimulus Is On The Way
Chinese Stimulus Is On The Way
Chinese Stimulus Is On The Way
With credit growth back to its 2018 lows, there is little need for further actions to reduce lending. On the contrary, the PBOC’s meeting with financial institutions on August 23rd revealed a desire to increase credit availability. Partly reflecting this development, new bank loans rose to RMB 1.22 trillion in August, up from RMB 1.08 trillion in the prior month. Chart 10EM Stocks Have Done Well When Global Industrial Stocks Have Outperformed
EM Stocks Have Done Well When Global Industrial Stocks Have Outperformed
EM Stocks Have Done Well When Global Industrial Stocks Have Outperformed
On the fiscal side, the Ministry of Finance stated on August 27th its intention to ramp up fiscal spending by increasing local government bond issuance. As of the end of August, local governments had used up only 50% of their annual debt issuance quota, compared to 77% at the same time last year and 93% in 2019. To reinforce the need for more stimulus, the authorities announced an additional RMB 300 billion in credit support for SMEs during the latest State Council meeting held on September 1st. Local Chinese government spending has typically flowed into infrastructure. Increased infrastructure spending should buttress metals prices while providing a tailwind for global industrial stocks. I agree with Arthur’s assessment that industrials will be a winning equity sector over the coming years. EM stocks have usually beaten the global benchmark during periods when global industrial stocks were outperforming (Chart 10). A Weaker US Dollar Will Benefit Emerging Markets EM stocks tend to perform best when the US dollar is on the back foot (Chart 11). We expect the greenback to weaken over the next 12 months. As a countercyclical currency, the dollar is likely to struggle in an environment of above-trend global growth (Chart 12). Chart 11EM Stocks Tend To Outperform The Global Benchmark When The Dollar Is Weakening
EM Stocks Tend To Outperform The Global Benchmark When The Dollar Is Weakening
EM Stocks Tend To Outperform The Global Benchmark When The Dollar Is Weakening
Chart 12The Dollar Is A Countercyclical Currency
The Dollar Is A Countercyclical Currency
The Dollar Is A Countercyclical Currency
Interest rate differentials have moved sharply against the dollar (Chart 13). The US trade deficit has surged over the past 16 months. The way the US has been financing its trade deficit – relying heavily on fickle equity inflows – also leaves the dollar in a vulnerable position (Chart 14). Chart 13Interest Rate Differentials Have Moved Against The Dollar
Interest Rate Differentials Have Moved Against The Dollar
Interest Rate Differentials Have Moved Against The Dollar
Chart 14Volatile Equity Inflows Have Been Financing The US Trade Deficit, Putting The Dollar In A Vulnerable Position
Volatile Equity Inflows Have Been Financing The US Trade Deficit, Putting The Dollar In A Vulnerable Position
Volatile Equity Inflows Have Been Financing The US Trade Deficit, Putting The Dollar In A Vulnerable Position
Go Long BRL And RUB Against a backdrop of broad-based dollar weakness, EM currencies will strengthen. Currently, the 12-month interest rate differential between Brazil and the US stands at 8.7%, up from a low of 2.1% last year. Russian rates have also risen rapidly relative to US rates (Chart 15). The Russian ruble will benefit from the cyclical recovery in oil prices. Bob Ryan and BCA’s commodity team project that the price of Brent will rise 5% to $80/bbl in 2023, whereas market expectations are for a 12% decline (Chart 16). Likewise, Brazil will gain from both higher oil prices and rising Chinese demand for metals. Chart 15Interest Rate Differentials Favor The RUB And BRL Versus The USD
Interest Rate Differentials Favor The RUB And BRL Versus The USD
Interest Rate Differentials Favor The RUB And BRL Versus The USD
Chart 16Oil Prices Have More Upside
Oil Prices Have More Upside
Oil Prices Have More Upside
Accordingly, we are initiating a new trade going long an equally-weighted basket consisting of BRL/USD and RUB/USD. Are EMs A Value Trap? Emerging market stocks currently trade at a Shiller PE ratio of 14.7, compared to 36.8 for the US, 22.2 for Europe, and 24.1 for Japan. The EM discount to the global index is as large now as it was during the late 1990s. Other valuation measures tell a similar story (Chart 17). Chart 17AEM Equities Are Trading At A Large Discount (I)
The Best Trade For The Rest Of 2021: Long EM Equities And Currencies
The Best Trade For The Rest Of 2021: Long EM Equities And Currencies
Chart 17BEM Equities Are Trading At A Large Discount (II)
The Best Trade For The Rest Of 2021: Long EM Equities And Currencies
The Best Trade For The Rest Of 2021: Long EM Equities And Currencies
A low PE ratio for EM stocks could be justified based on weak expected earnings growth. However, it is far from clear that such an expectation is warranted. While EM earnings growth has lagged the US since 2011, this follows a decade when EM earnings grew much faster than in the US (Chart 18). Chart 18AEM Earnings Have Moved Sideways Since 2011 After Blazing Higher Over The Preceding Decade (I)
EM Earnings Have Moved Sideways Since 2011 After Blazing Higher Over The Preceding Decade (I)
EM Earnings Have Moved Sideways Since 2011 After Blazing Higher Over The Preceding Decade (I)
Chart 18BEM Earnings Have Moved Sideways Since 2011 After Blazing Higher Over The Preceding Decade (II)
EM Earnings Have Moved Sideways Since 2011 After Blazing Higher Over The Preceding Decade (II)
EM Earnings Have Moved Sideways Since 2011 After Blazing Higher Over The Preceding Decade (II)
Chart 19EM Stocks Underperformed Their US Peers By More Than What Is Suggested By Earnings
EM Stocks Underperformed Their US Peers By More Than What Is Suggested By Earnings
EM Stocks Underperformed Their US Peers By More Than What Is Suggested By Earnings
On that note, it is worth mentioning that US earnings have risen by only 6 percentage points more than EM earnings since mid 2019 (20% versus 14%), even as EM stocks have underperformed their US peers by 29% over this period (52% versus 23%) (Chart 19). China’s Regulatory Crackdown The regulatory crackdown on Chinese tech companies has weighed on the sector. Chinese tech stocks have underperformed their global tech peers by 48% since February (Chart 20). Chart 20Chinese Tech Stocks Have Been Underperforming Their Global Tech Peers
Chinese Tech Stocks Have Been Underperforming Their Global Tech Peers
Chinese Tech Stocks Have Been Underperforming Their Global Tech Peers
Chinese tech is 44% of the China investable index and 15% of the MSCI EM index. Thus, the outlook for Chinese stocks is relevant not just for China-focused investors, but for EM investors more broadly (especially those who invest in index products). The current crackdown bears some resemblance to the one in 2018, which saw Tencent lose $20 billion in market capitalization in a single day. Like other Chinese tech names, Tencent shares quickly recovered from that incident. Contrary to popular perception, the Chinese government has not launched an indiscriminate attack on tech companies. If anything, heightened geopolitical tensions have made it more important than ever for China to buttress its tech sector. Rather, what the government has done is restrain companies that it either perceives as working against the national interest (i.e., addictive video game makers and expensive after-school tutoring companies) or that have too much sway over the public. Private tech companies in sectors such as semiconductors or clean energy continue to receive government support. A plausible outcome is that China’s leading consumer-oriented internet companies will go out of their way to pledge allegiance to the Communist Party just as US companies have pledged allegiance to woke ideology. If that were to happen, the Chinese government may allow them to operate normally, cognizant of the fact that it is easier to monitor a few large internet companies than many small ones. While such an outcome is far from assured, current valuations offer enough cushion to prospective investors. As we go to press, Alibaba is trading at 16.4-times earnings, Baidu is trading at 17.9-times earnings, and Tencent is trading at 26.7-times current year earnings. In comparison, the NASDAQ 100 trades at nearly 30-times earnings. Investment Conclusions Sentiment towards EM stocks is very bearish (Chart 21). Investor angst towards China is especially elevated, with the media replete with stories about the tech crackdown and problems at Evergrande, the country’s largest property developer. Chart 21Sentiment Towards EM Stocks Is Highly Bearish
Sentiment Towards EM Stocks Is Highly Bearish
Sentiment Towards EM Stocks Is Highly Bearish
All these downside risks to EM assets are well known. What are less well known are the upside risks stemming from higher vaccination rates, an easing of domestic inflationary pressures, Chinese stimulus, a weaker US dollar, and favorable valuations. With that in mind, we are upgrading our rating on EM equities and currencies to strong overweight in the view matrix at the back of this report. We are also reinstating a long EM/Global equity trade (ETF proxy: VWO versus VT). The risk-reward of buying Chinese internet stocks is reasonably appealing. Investors who want to mitigate risk should consider writing cash-covered puts. For example, a BABA put with a strike price of $130 expiring on December 16th 2022 trades for about $16. If the price of BABA does not fall below $130, you will pocket the premium, realizing an annualized yield of 9%. If the price does fall to $130, you get the stock at an attractive PE ratio of 12.5 based on current forward earnings estimates. Peter Berezin Chief Global Strategist pberezin@bcaresearch.com Global Investment Strategy View Matrix
The Best Trade For The Rest Of 2021: Long EM Equities And Currencies
The Best Trade For The Rest Of 2021: Long EM Equities And Currencies
Special Trade Recommendations
The Best Trade For The Rest Of 2021: Long EM Equities And Currencies
The Best Trade For The Rest Of 2021: Long EM Equities And Currencies
Current MacroQuant Model Scores
The Best Trade For The Rest Of 2021: Long EM Equities And Currencies
The Best Trade For The Rest Of 2021: Long EM Equities And Currencies
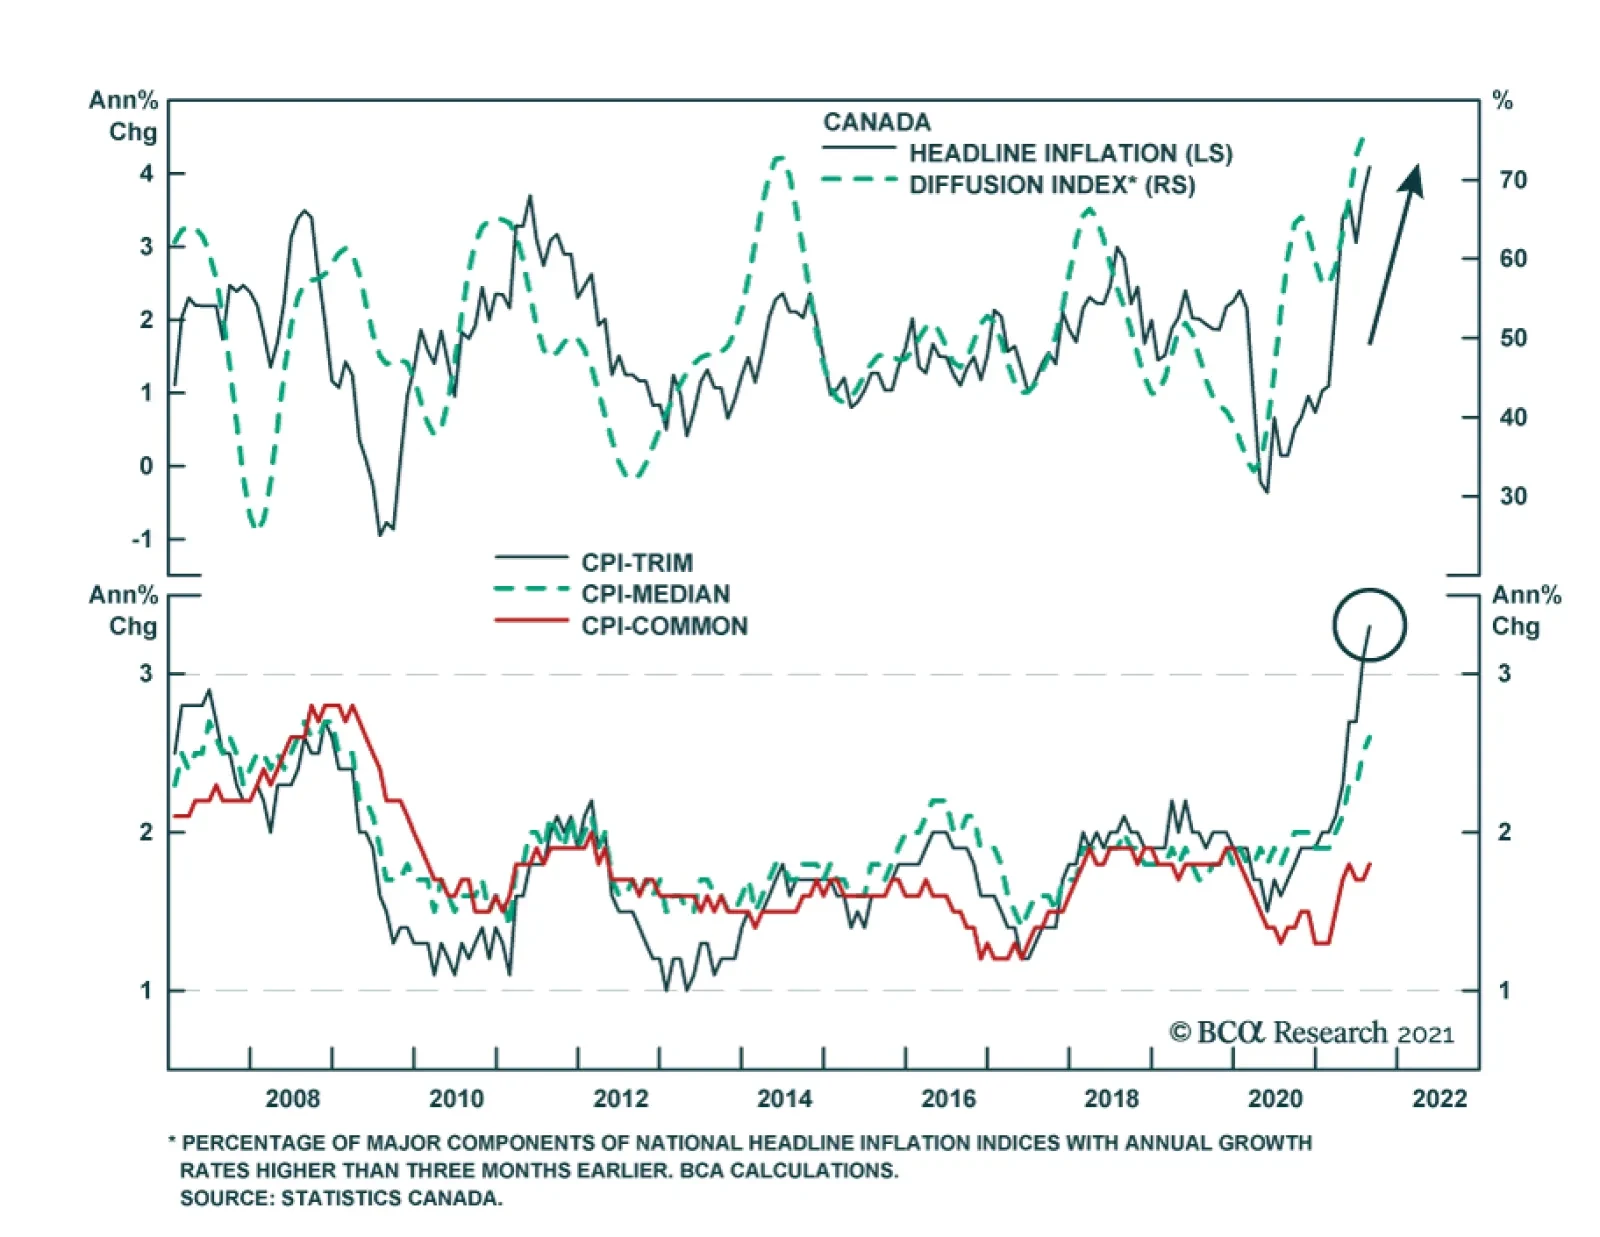
Inflationary pressures are likely to keep the Bank of Canada at least as hawkish - if not more hawkish - than the Fed. Headline CPI accelerated to a 18-year high of 4.1% y/y in August. The diffusion index's extremely elevated reading is in line with…
Dear Client, Next week, in lieu of our regular weekly report, I will be hosting two webcasts where I will discuss our view on China’s economy and financial markets. I will also address the topics that our clients are most concerned about, including China’s regulatory developments, inflation, and policy direction. The webcasts will be held on Wednesday, September 22 at 10:00 am EDT (English), and Thursday, September 23 at 9:00 am HKT (Mandarin). I look forward to discussing with you during the webcast. We will return to our regular publishing schedule on Wednesday, September 29. Best regards, Jing Sima, China Strategist Highlights China is facing cyclical inflationary pressures more than disinflationary ones. Prices of mining, raw materials and manufacturing goods have been rising at record rates. Chinese manufacturers are operating at close to full production, which suggests that there is little slack in demand. Despite soft headline readings in consumer prices, the costs of goods and services have rebounded to pre-pandemic levels. Prices for home durable goods, fuel and utilities have surged to multiyear highs. Measures to boost domestic demand will be limited as long as inflationary pressures continue and manufacturers produce at close to full capacity. Near-term policy support will likely focus on reducing costs for manufacturers and improving wage growth for lower-income households. We are initiating a trade: long industrial stocks/short A-shares. Feature China’s Producer Price index (PPI) registered a 13-year high in August, at the time when the domestic economy continued to slow. On the other hand, consumer prices (CPI) - both headline and core CPI - have been lackluster. The acceleration in producer inflation and the demand dynamics raise the question whether China is in a stagflation, a situation in which prices climb but wages and demand do not follow. Consequentially, economy policy faces a dilemma between boosting demand and containing inflation. Inflationary pressures have been driven by pandemic-related factors and the supply-side constraints will likely continue into Q1 next year. These inflationary pressures, and more importantly, undercurrents in the inflation prints, will constrain Chinese policymakers’ efforts to reflate the economy. The recent rebound in Chinese infrastructure stocks is overdone. Material stocks are also vulnerable to price setbacks. Global commodity prices will soften, although from very elevated levels. Meanwhile, we are initiating a trade: long Chinese industrial stocks relative to the A-share market. Despite falling profit growth in recent months, China’s leadership is increasing its support, both cyclically and structurally, to the manufacturing sector. Inflation Or Deflation? The details in both the PPI and CPI readings indicate that China is facing more inflationary pressures than disinflationary ones. Producers are raising prices across the board. Although consumer prices will likely remain well below the PBoC's 3% inflation target for the year mainly due to low food prices, prices in some of the key consumer goods segments are rising at an alarming pace. The inflationary pressures will continue for producers, at least through the first quarter of 2022. The strength in August’s PPI was concentrated in mining and raw materials (Chart 1, top panel). Robust global demand and tight supply conditions supported high oil and base metals prices, while pushing up coal prices. Chart 1Chinese Mining And Manufacturing Goods Prices Accelerated To Record Highs
Chinese Mining And Manufacturing Goods Prices Accelerated To Record Highs
Chinese Mining And Manufacturing Goods Prices Accelerated To Record Highs
Chart 2Commodity Prices Held Up Despite A Slowing China
Commodity Prices Held Up Despite A Slowing China
Commodity Prices Held Up Despite A Slowing China
We do not expect China’s infrastructure investment growth to pick up and support industrial metal prices. However, this year’s unsynchronized recovery in global demand and severe supply shortages have delayed the global commodity market’s price reaction to slowing Chinese demand (Chart 2). Moreover, as China’s environmental policy remains stringent during the upcoming winter, supply-side constraints from production cuts will partially offset the slowdown in China’s demand for mining and raw materials (Chart 3A and 3B). Chart 3ASupply-Side Constraints And Chinese Production Cuts Likely To Continue Into Early 2022
Supply-Side Constraints And Chinese Production Cuts Likely To Continue Into Early 2022
Supply-Side Constraints And Chinese Production Cuts Likely To Continue Into Early 2022
Chart 3BSupply-Side Constraints And Chinese Production Cuts Likely To Continue Into Early 2022
Supply-Side Constraints And Chinese Production Cuts Likely To Continue Into Early 2022
Supply-Side Constraints And Chinese Production Cuts Likely To Continue Into Early 2022
Manufacturing goods inflation registered its topmost annual growth since data collection started in 1996 (Chart 1, bottom panel). Moreover, capacity utilization rates in the industrial and manufacturing sectors are at the highest levels since 2007, well above their means (Chart 4). Changes in manufacturing capacity are highly correlated with China’s export growth and tightly linked to PPI (Chart 5). Therefore, manufacturing goods prices will remain lofty as long as external demand stays robust and China’s manufacturers continue to produce near maximum output. Chart 4Chinese Manufacturers Are Producing Near Their Max Capacity
Chinese Manufacturers Are Producing Near Their Max Capacity
Chinese Manufacturers Are Producing Near Their Max Capacity
Chart 5Robust Exports Have Been Supporting Strong Chinese Manufacturing Output
Robust Exports Have Been Supporting Strong Chinese Manufacturing Output
Robust Exports Have Been Supporting Strong Chinese Manufacturing Output
The PPI’s weakest component has been consumer goods, which inched up by a mere 0.3% from a year ago (Chart 6). However, consumer goods only account for 25% of PPI, whereas industrial and manufacturing producer goods are 75%. In addition, the underlying data shows that among the four sub-components in the PPI’s consumer goods, only food prices have remained below their pre-pandemic levels (Chart 7, top panel). Prices in durable goods have rebounded strongly since March last year and clothing and daily sundry articles have recovered to their end-2019 rate of growth (Chart 7, mid and bottom panels). Chart 6Producer Prices For Consumer Goods Remain Soft...
Producer Prices For Consumer Goods Remain Soft...
Producer Prices For Consumer Goods Remain Soft...
Chart 7...But Food Prices Have Been The Main Drag
...But Food Prices Have Been The Main Drag
...But Food Prices Have Been The Main Drag
The PPI’s price forces are consistent with the CPI, in which food has been the main drag. Core CPI, along with prices for consumer goods and services, have returned to pre-pandemic growth rates (Chart 8). Durable goods prices, such as home appliances, increased to a multiyear high in August. Fuel and utilities costs have also risen. This suggests that despite the soft CPI readings, inflation has flowed from producers to Chinese consumers through manufacturing goods. The passthrough will likely intensify into Q4 when domestic COVID-cases have been largely brought under control and the September – October holiday season will boost consumption for both goods and services. Chart 8Prices For Other Consumer Goods Categories Have Recovered
Prices For Other Consumer Goods Categories Have Recovered
Prices For Other Consumer Goods Categories Have Recovered
Table 1A Look At China’s CPI Basket – Food Dominates
Inflation, Deflation, Or Stagflation?
Inflation, Deflation, Or Stagflation?
We still expect that headline CPI will remain below the PBoC’s 3% inflation target for the year. Consumer durable goods prices are lightly weighted in China’s CPI, therefore, an acceleration in inflation passthroughs in this component is unlikely to significantly push up the CPI aggregates (Table 1). Chart 9Prices For Healthcare And Education Services On A Structural Downshift
Prices For Healthcare And Education Services On A Structural Downshift
Prices For Healthcare And Education Services On A Structural Downshift
In addition, there are some structural headwinds that will affect prices in the education and healthcare and medical services components, which together account for about 15% of the CPI. Healthcare prices have been on a policy-driven structural downshift since late 2017 and recent regulatory changes in the education industry will depress pricing power in that sector (Chart 9). Despite sluggish aggregate consumer prices, climbing prices in consumer durable goods, services and particularly, fuel and utilities, will likely force China’s leadership to take action on policy. Bottom Line: Price pressures for Chinese producers remain intense and consumers will feel the heat of escalating prices in durable goods, fuel and utilities. Inflation is threatening domestic demand, which is already slowing from its peak earlier this year. Implications On Policy Response Inflation readings –even though they are lagging economic indicators –bear significant forward-looking market implications because changes in inflation dynamics herald various policy responses. Despite slower economic growth, higher inflation coupled with accommodative monetary and fiscal policies may indicate that the economy is in a “goldilocks” stage and corporate profits can still benefit (Chart 10). Chinese onshore stocks reached record high recently (Chart 11). Chart 10Are Chinese Corporates In A 'Sweet Spot'?
Are Chinese Corporates In A 'Sweet Spot'?
Are Chinese Corporates In A 'Sweet Spot'?
Chart 11Accommodative Monetary Conditions Propelled Chinese Stock Prices To Highest Since 2015
Accommodative Monetary Conditions Propelled Chinese Stock Prices To Highest Since 2015
Accommodative Monetary Conditions Propelled Chinese Stock Prices To Highest Since 2015
However, underlying trends in China’s producer and consumer inflation prints raise the risks that policymakers may not deliver the ingredients needed for a “just right” scenario. Even though China has kept a loose monetary policy that we expect to extend into next year, inflationary pressures may force policymakers to either delay or reduce the magnitude of stimulus. Recent policy moves show that the authorities are focused on reducing input cost burdens and bumping up support for small- and medium-sized enterprises (SMEs), which are highly concentrated in mid- to downstream manufacturing and services sectors. In our view, the recent rhetoric from policymakers further reduces the odds of any broadly based stimulus to boost demand. Our view is based on the following observations: The elevated global input costs and limited price passthroughs to consumers are depressing Chinese manufacturers’ profit margins and incentives to expand production capacity. Despite strong exports and production, manufacturing investment has lagged that in infrastructure and real estate this year (Chart 12). Consumers, particularly lower-income households, are bearing most of the burdens; rising costs and slow wage growth are weakening their propensity to spend (Chart 13). Chart 12Slower Manufacturing Investment Recovery Than Infrastructure And Real Estate So Far This Year
Slower Manufacturing Investment Recovery Than Infrastructure And Real Estate So Far This Year
Slower Manufacturing Investment Recovery Than Infrastructure And Real Estate So Far This Year
Chart 13Slow Wage Growth Limits The Pace Of Consumption Recovery
Slow Wage Growth Limits The Pace Of Consumption Recovery
Slow Wage Growth Limits The Pace Of Consumption Recovery
The inflation prints came at the time when China’s top leadership shifted its structural policy goals to reduce income inequality and stabilize manufacturing share in the aggregate economy. The structural goals will likely be reflected in policy responses to the cyclical challenge. Moreover, this year’s manufacturing production volume was growing twice as fast as producer prices, a reversal from 2017 when price increases outpaced production (Chart 14). Price changes are much more important to corporate profits than volume changes. A strong RMB and sharply escalating shipping costs have also reduced exporters’ pricing power and profits (Chart 15). In contrast, mounting prices across various commodities have allowed the upstream industrial sectors, which are dominated by SOEs, to deliver much stronger profits than the downstream and private sector (Chart 16). Chart 14Growth In Manufacturing Output And Prices Starting To Converge
Growth In Manufacturing Output And Prices Starting To Converge
Growth In Manufacturing Output And Prices Starting To Converge
Chart 15Strong RMB And Rising Shipping Costs Have Reduced Chinese Exporters' Profitability
Strong RMB And Rising Shipping Costs Have Reduced Chinese Exporters' Profitability
Strong RMB And Rising Shipping Costs Have Reduced Chinese Exporters' Profitability
It is unsurprising that authorities are increasing support to the private sector in order to maintain manufacturing share in the economy and keep the export sector competitive (Chart 17). A boost in infrastructure investment, on the other hand, would exacerbate upward pressure on commodity prices and mostly benefit upstream SOEs. Chart 16Upstream Industries Disproportionally Benefited From Surging Commodity Prices
Upstream Industries Disproportionally Benefited From Surging Commodity Prices
Upstream Industries Disproportionally Benefited From Surging Commodity Prices
Chart 17Private Sector: Lower Profit Margin, Higher Costs
Private Sector: Lower Profit Margin, Higher Costs
Private Sector: Lower Profit Margin, Higher Costs
Furthermore, stimulating the traditional sectors would not revive household consumption. The subdued recovery in consumption and prices for consumer staple goods is due to slow growth in lower-income household wages and a disrupted recovery in the services sector. Ramping up infrastructure investment can support headline GDP growth, but will do little to provide jobs and wages since China’s private sector provides 80% of all jobs and 90% of annual job creations. Lower-income households have a higher marginal propensity to consume. We expect the government to accelerate fiscal support measures to fortify wages among lower-income households. Bottom Line: Ongoing inflationary pressures and the underlying forces will likely thwart policymakers from stepping up their efforts to stimulate the old economy sectors. Investment Conclusions Chart 18Rebound In Infrastructure Stocks Should Be Short-Lived
Rebound In Infrastructure Stocks Should Be Short-Lived
Rebound In Infrastructure Stocks Should Be Short-Lived
Chinese onshore stocks in the infrastructure, materials, and industrial sectors recently advanced strongly in the expectation that policymakers will ramp up their fiscal support in the old economy sectors, particularly infrastructure. Although we agree that infrastructure investment will improve, we maintain our view that a sizable rebound is highly unlikely this year. Hence, we do not expect that the rally in infrastructure stocks will be long-lasting (Chart 18). We are probably too late in the cycle to re-initiate our long material/broad market trade in the onshore and offshore equity markets (Chart 19). We closed the trade in December last year when Chinese policymakers started pulling back stimulus, and in expectations that raw material prices would tumble. However, we underestimated the intensity of China’s de-carbonization efforts and protracted global supply-side constraints. Although global commodity prices will remain elevated into 2022, the price rallies from this year are not sustainable on a cyclical (6- to 12-month) basis. Therefore, we do not recommend material stocks as a cyclical play. Chart 19Price Rally In Materials Stocks Unlikely To Sustain
Price Rally In Materials Stocks Unlikely To Sustain
Price Rally In Materials Stocks Unlikely To Sustain
Chart 20Industrial Stocks May Be On A Structural Upcycle
Industrial Stocks May Be On A Structural Upcycle
Industrial Stocks May Be On A Structural Upcycle
Instead, we recommend a long industrial/broad A-share market trade (Chart 20). Even though China is in a late business cycle and the upcoming stimulus will be mediocre at best, we think that the industrial sector will benefit from policy support for investment in the manufacturing sector and a faster pace in the sector’s capacity expansion. Jing Sima China Strategist jings@bcaresearch.com Footnotes Market/Sector Recommendations Cyclical Investment Stance
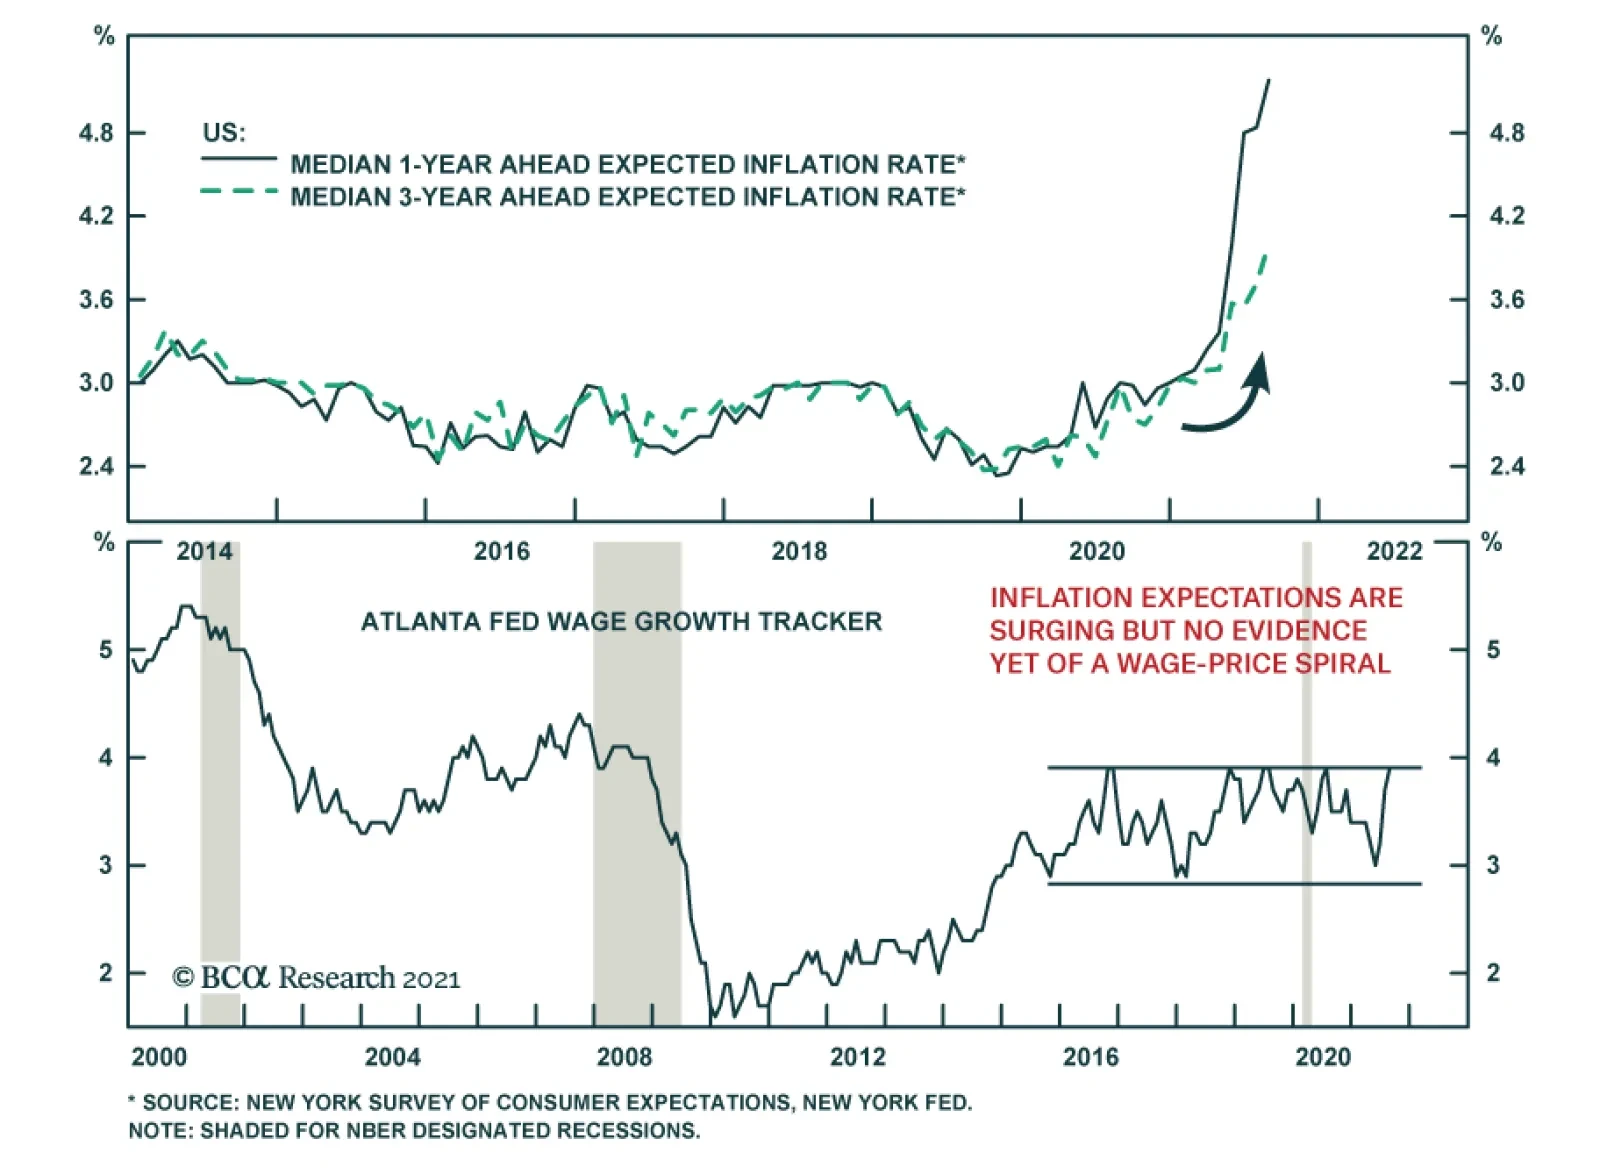
According to the New York Fed’s Survey of Consumer Expectations, the median 1-year ahead and 3-year ahead expected inflation rates rose to fresh series highs in August. Survey respondents expect the inflation rate to be 5.2% in a year’s time and ease to a…
BCA Research’s US Bond Strategy service expects employment data to take a back seat to the inflation data in the minds of bond investors in 2022. The Fed has successfully convinced markets that it will not lift rates until “maximum employment” is achieved,…
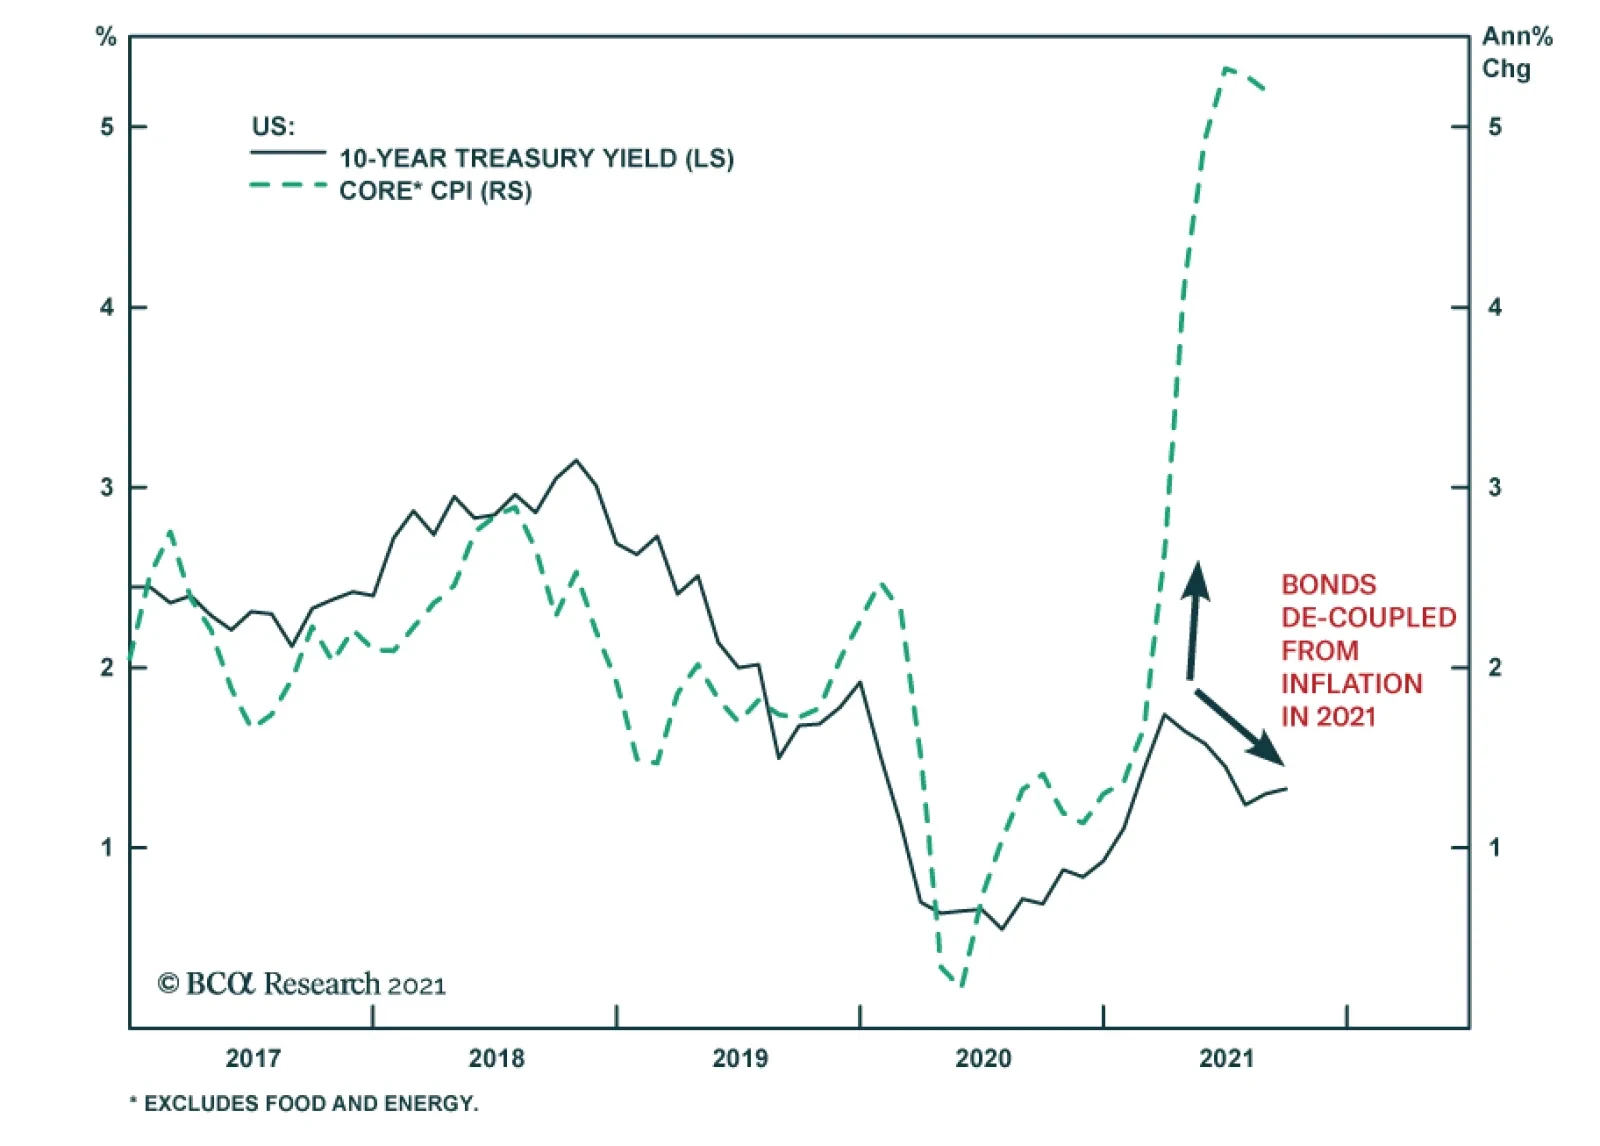
Highlights Fed: The Fed will be forced to clarify its definition of “maximum employment” in 2022, and the path of inflation will ultimately dictate how far the Fed tries to push the labor market. We expect Fed rate hikes to start in December 2022 and that the pace of hikes will proceed more quickly than is currently priced in the yield curve. Duration: Investors should maintain below-benchmark portfolio duration in anticipation of a rate hike cycle starting in December 2022. Yield Curve: Investors should position in Treasury curve flatteners. Specifically, we recommend shorting the 5-year Treasury note versus a duration-matched barbell consisting of the 2-year and 10-year notes. Feature Chart 1Bonds De-Coupled From Inflation In 2021
Bonds De-Coupled From Inflation In 2021
Bonds De-Coupled From Inflation In 2021
One of our themes this year is that US bond investors should pay more attention to the employment data than the inflation data.1 This is because the Fed has successfully convinced markets that it will not lift rates until “maximum employment” is achieved, even if inflation is strong.2 This story has played out during the past few months as bond yields have remained low despite surging prices (Chart 1). Our view is that the muted reaction in bonds is due to the widespread belief that the labor market remains far from “maximum employment” and that rate hikes are therefore a long way off. In this environment, only surprisingly strong employment prints can upset the market’s narrative and send bond yields higher. This playbook for the bond market will continue to function for the next few months. Strong employment data will pull bond yields higher and disappointing employment data will push them down. Inflation prints will be largely irrelevant for the market. But this will change next year. In fact, we see the employment data taking a back seat to the inflation data in the minds of bond investors in 2022. A More Explicit Definition of “Maximum Employment” Must Emerge In 2022 Almost everyone agrees that the US labor market is far from “maximum employment” today, but that will no longer be the case in 2022. The Appendix to this report shows the average monthly nonfarm payroll growth that is required to reach different possible definitions of “maximum employment” by a few specific future dates. For example, we calculate that average monthly nonfarm payroll growth of 414 thousand would cause the unemployment rate to reach 3.8% and the labor force participation rate to reach 63% by the end of 2022. Our sense is that the US economy will be able to add more than 414 thousand jobs per month between now and December 2022. This means that if Fed officials believe that an unemployment rate of 3.8% and a participation rate of 63% meet the definition of “maximum employment”, then they will start to lift interest rates by then. This example sets the scene for what will become next year’s most important monetary policy debate. What constitutes “maximum employment”? Does our example of a 3.8% unemployment rate and a 63% participation rate meet the definition? Or does the Fed have different targets in mind? The Fed will be forced to clarify its position on the topic as the labor market gets closer to reasonable definitions of “maximum employment”. Our sense is that, as of now, there are a range of views on the committee with some FOMC participants taking a more hawkish view of how much slack is left in the labor market and some adopting a more dovish posture. We outline the differences between the hawkish and dovish positions below, but ultimately the path of inflation in 2022 will determine which camp wins out. If inflation remains high next year, then the Fed will be quicker to declare that the labor market is at “maximum employment”, and vice-versa. The Fed’s reliance on the inflation data to settle the argument of what constitutes “maximum employment” will make inflation the most important economic indicator for bond yields in 2022. Labor Market Slack: The Hawkish Case Chart 2The Unemployment Rate Is Falling Fast
The Unemployment Rate Is Falling Fast
The Unemployment Rate Is Falling Fast
The hawkish case for the US labor market reaching “maximum employment” sooner rather than later was outlined nicely last month by our own Bank Credit Analyst.3 First, the Bank Credit Analyst points out that the US labor market was likely beyond “maximum employment” before COVID-19 struck. The implication being that the Fed may move to lift interest rates before the unemployment and participation rates fully recover their pre-pandemic levels. Notice that the unemployment rate (adjusted for the post-COVID surge in people employed but absent from work) was 3.5% in February 2020, well below the Congressional Budget Office’s 4.5% estimate of the natural rate of unemployment (Chart 2).4 Today, the adjusted unemployment rate is 5.5%, not that far above the 3.5%-4.5% range of FOMC participant estimates of the natural rate. If this year’s rate of decline continues, the unemployment rate will hit 4.5% by January 2022 and 3.5% by May 2022. Of course, we know that the Fed takes a broader view of labor market utilization than just the unemployment rate. In particular, we observed sharp declines in labor force participation rates across a wide range of demographic groups when the pandemic struck last year (Chart 3). While the Fed will want to see some improvement in labor force participation, it might be unrealistic to expect the overall labor force participation rate to return to its pre-pandemic level. This is because the aging of the US population imparts a structural downtrend to the participation rate. The dashed line in Chart 4 shows where the participation rate would be if the rate of labor force participation of every individual age cohort remained constant at its February 2020 level. Even in this case, the greater flow of people into the older age groups causes the part rate to fall over time. The message from Chart 4 is that even if the participation rates of every age cohort tracked by the Bureau of Labor Statistics rebound to their February 2020 levels, we would still only expect an overall participation rate of 62.8% by the end of 2022, significantly below the 63.3% seen in February 2020. Chart 3Labor Force Participation By Age Cohort
Labor Force Participation By Age Cohort
Labor Force Participation By Age Cohort
Chart 4The Demographic Downtrend In Participation
The Demographic Downtrend In Participation
The Demographic Downtrend In Participation
On top of the demographic argument, we also notice that the pandemic led to a surge in the number of retired people last year, a number that continues to rise quickly (Chart 5). While we should probably expect some increase in the flow of people coming out of retirement to re-join the labor force as the economy recovers, it’s also logical to assume that there will be at least some hysteresis among the retired population. That is, the longer someone is retired, the less likely they are to re-enter the labor force at all. To the extent that the increase in retired people is sticky, it may be ambitious to expect a full convergence of the 55-year+ part rate back to February 2020 levels (Chart 3, bottom panel). All else equal, this will cause the labor market to reach “maximum employment” more quickly than even our demographic trendline for participation suggests. Chart 5A Surge In Retirees
A Surge In Retirees
A Surge In Retirees
The question of how many FOMC participants agree with the above arguments remains open, but our sense is that there are some who will be eager to declare that “maximum employment” has been achieved before we see a full rebound in the unemployment and participation rates back to pre-COVID levels. For example, Fed Vice-Chair Richard Clarida mentioned the “demographic trend” in labor force participation in his most recent speech.5 Also, Dallas Fed President Robert Kaplan said the following in a recent interview: We’ve had 3 million retirements since February 2020. […] Some of these workers will come back into the workforce, but some of these workers are 55 and older and they’re in reasonably good financial shape and COVID has caused them to re-think whether they really want to re-enter the workforce.6 Labor Market Slack: The Dovish Case There are also good arguments on the side of those who think that an appropriate definition of “maximum employment” involves an unemployment rate closer to 3.5% than 4.5% and a participation rate that does return to pre-COVID levels, and maybe even moves higher. First, a study from the Federal Reserve Bank of Kansas City noted that the bulk of the recent increase in the number of retired people is explained, not by an increase in the number of retirements, but by a reduction in the flow of people from retirement back into the workforce (Chart 6).7 This suggests that pandemic-related health risks are the likely culprit behind the increase in the number of retired people, casting doubt on the idea that the increase in retired people will be sticky. Chart 6Increased Retirees: A Closer Look
2022 Will Be All About Inflation
2022 Will Be All About Inflation
Second, there is a strong case to be made that even the February 2020 labor force participation rate is not high enough to meet the definition of “maximum employment”. If we look at the participation rates for 25-54 year old men and women, we see that both were in strong uptrends prior to the pandemic (Chart 7), and there is every reason to believe that they would have continued to move higher if COVID hadn’t cut the recovery short. Chart 7Part Rates Were Rising Pre-Pandemic
Part Rates Were Rising Pre-Pandemic
Part Rates Were Rising Pre-Pandemic
Consider what some FOMC participants were saying prior to the pandemic: The strong labor market is also encouraging more people in their prime working years – ages 25 to 54 – to rejoin or remain in the labor force, […] So far, we have made up more than half the loss in the Great Recession, which translates to almost 2 million more people in the labor force. But prime age participation could still be higher. - Jerome Powell, November 20198 Whether participation will continue to increase in a tight labor market remains to be seen. But I note that male prime-age participation still remains below levels seen in previous business cycle expansions. - Richard Clarida, November 20199 In a more recent interview, Minneapolis Fed President Neel Kashkari expressed skepticism about the idea that labor force participation is destined to remain in a long-run structural downtrend and said that he’s “not convinced we were actually at maximum employment before the COVID shock hit us.” He also said: Getting [labor force participation] and employment-to-population at least back to where they were before [the pandemic], but not necessarily even declaring victory when we do that. I think that’s a reasonable thing for us to try to achieve.10 Inflation: The Ultimate Argument Settler What the above arguments make clear is that there are good reasons to think that the US labor market will reach some policymakers’ definitions of “maximum employment” perhaps by as early as the middle of next year. However, there are also some policymakers who will adopt a more dovish view of what constitutes “maximum employment”. Ultimately, the path of inflation will determine which camp wins out. This is because the entire concept of “maximum employment” is only meaningful when viewed alongside inflation. If employment is pushed beyond its “maximum”, it definitionally means that labor market tightness is leading to unwanted inflationary pressures. With that in mind, the Fed will increasingly refer to the inflation data next year as it tries to make its definition of “maximum employment” more precise. Crucially, what will matter for the Fed (and for the bond market) is where inflation is next year, not where it is right now. Right now, core inflation is well above the Fed’s price stability target, but it is well known that the recent increase in inflation is concentrated in a few sectors – COVID-impacted services and autos – where prices will decelerate as post-pandemic bottlenecks ease (Chart 8). Just as the Fed ignored surging prices in those sectors this year, it will ignore plunging prices in those sectors next year. What will matter for monetary policy is whether core inflation excluding COVID-impacted services and autos remains contained or rises above levels consistent with the Fed’s target (Chart 8, bottom panel). The Fed will also be inclined to declare that “maximum employment” has been achieved if wage growth is accelerating. Currently, there is some evidence of rising wages but also some major supply bottlenecks in the labor market, as evidenced by the all-time high in job openings (Chart 9). Labor supply constraints should ease next year, but the Fed will be watching closely to see if wage growth moderates in kind or continues to increase. Chart 8Watch CPI (ex. COVID-Impacted Services And Autos) In 2022
Watch CPI (ex. COVID-Impacted Services And Autos) In 2022
Watch CPI (ex. COVID-Impacted Services And Autos) In 2022
Chart 9Watch Wages In 2022
Watch Wages In 2022
Watch Wages In 2022
Finally, the Fed will keep a close eye on inflation expectations next year. In particular, it will monitor the Common Inflation Expectations Index and the 5-year/5-year forward TIPS breakeven inflation rate (Chart 10). If either of these indicators break above levels consistent with the Fed’s 2% inflation target, then policymakers will be more inclined to think that “maximum employment” has been attained. Chart 10Watch Inflation Expectations In 2022
Watch Inflation Expectations In 2022
Watch Inflation Expectations In 2022
Bottom Line: The Fed will be forced to clarify its definition of “maximum employment” in 2022, and the path of inflation will ultimately dictate how far the Fed tries to push the labor market. The key indicators to monitor to decide when the Fed will declare that “maximum employment” has been attained are: core inflation excluding COVID-impacted services and autos, wage growth, inflation expectations and the prime-age (25-54) labor force participation rate (Chart 3, panel 2). Investment Implications For bond markets, the question of when the Fed decides that the labor market has reached “maximum employment” is crucial because it will determine the start of the next rate hike cycle. At present, the overnight index swap curve is priced for Fed liftoff in January 2023 and for a total of 78 bps of rate hikes by the end of 2023 (Chart 11). Chart 11Rate Hike Expectations
Rate Hike Expectations
Rate Hike Expectations
Our expectation is that the Fed will start lifting rates in December 2022 and that rate hikes will proceed more quickly than what is currently priced in the market. The unemployment rate will be close to 3.5% by December 2022 and inflation will be sufficiently above the Fed’s target that policymakers will be inclined to view the labor market as at “maximum employment”. Investors should run below-benchmark duration in US bond portfolios to profit from this outcome. We also recommend that investors position for a flatter yield curve by the end of 2022. Specifically, we recommend shorting the 5-year Treasury note versus a duration-matched barbell consisting of the 2-year and 10-year notes. Table 1A shows fair value estimates for the 2-year, 5-year and 10-year yields as of the end of 2022 assuming the market moves to price-in the following path for the fed funds rate: The first 25 bps rate hike occurs in December 2022 Rate hikes proceed at a pace of 100 bps per year The fed funds rate levels-off at a terminal rate of 2.08%11 Table 1ATreasury Curve Fair Value Estimates: December 2022 Liftoff Scenario
2022 Will Be All About Inflation
2022 Will Be All About Inflation
In that example, the 2-year and 5-year yields both rise by much more than the 10-year yield and both exceed the change that is priced into the forward curve by more than the 10-year yield. Table 1B shows the results from a similar scenario, the only difference is that the liftoff date is pushed back to March 2023. Both the 2-year and 5-year yields also rise by more than the 10-year yield in this scenario, though the delayed liftoff dampens the relative upside in the 2-year yield. Table 1BTreasury Curve Fair Value Estimates: March 2023 Liftoff Scenario
2022 Will Be All About Inflation
2022 Will Be All About Inflation
Bottom Line: Investors should maintain below-benchmark portfolio duration and position in Treasury curve flatteners in anticipation of a rate hike cycle that will start in December 2022. Appendix: How Far From “Maximum Employment” And Fed Liftoff? Chart A1Defining “Maximum Employment”
Defining "Maximum Employment"
Defining "Maximum Employment"
The Federal Reserve has promised that the funds rate will stay pinned at zero until the labor market returns to “maximum employment”. The Fed has not provided explicit guidance on the definition of “maximum employment”, but we deduce that “maximum employment” means that the Fed wants to see the U3 unemployment rate within a range consistent with its estimates of the natural rate of unemployment, currently 3.5% to 4.5%, and that it wants to see a more or less complete recovery of the labor force participation rate back to February 2020 levels (Chart A1). Alternatively, we can infer definitions of “maximum employment” from the New York Fed’s Surveys of Primary Dealers and Market Participants. These surveys ask respondents what they think the unemployment and labor force participation rates will be at the time of Fed liftoff. Currently, the median respondent from the Survey of Market Participants expects an unemployment rate of 3.5% and a participation rate of 63%. The median respondent from the Survey of Primary Dealers expects an unemployment rate of 3.8% and a participation rate of 62.8%. Tables A1-A4 present the average monthly nonfarm payroll growth required to reach different combinations of unemployment rate and participation rate by specific future dates. For example, if we use the definition of “maximum employment” from the Survey of Market Participants, then we need to see average monthly nonfarm payroll growth of +414k in order to hit “maximum employment” by the end of 2022. Table A1Average Monthly Nonfarm Payroll Growth Required For The Unemployment To Reach 4.5% By The Given Date
2022 Will Be All About Inflation
2022 Will Be All About Inflation
Table A2Average Monthly Nonfarm Payroll Growth Required For The Unemployment To Reach 4% By The Given Date
2022 Will Be All About Inflation
2022 Will Be All About Inflation
Table A3Average Monthly Nonfarm Payroll Growth Required For The Unemployment To Reach 3.5% By The Given Date
2022 Will Be All About Inflation
2022 Will Be All About Inflation
Table A4Average Monthly Nonfarm Payroll Growth Required To Reach “Maximum Employment” As Defined By Survey Respondents
2022 Will Be All About Inflation
2022 Will Be All About Inflation
Chart A2 presents recent monthly nonfarm payroll growth along with target levels based on the Survey of Market Participants’ definition of “maximum employment”. This chart is to help us track progress toward specific liftoff dates. For example, if monthly nonfarm payroll growth continues to print at the same level as last month, then we could anticipate a Fed rate hike by June 2022. Chart A2Tracking Toward Fed Liftoff
Tracking Toward Fed Liftoff
Tracking Toward Fed Liftoff
We will continue to track these charts and tables in the coming months, and will publish updates after the release of each monthly employment report. Ryan Swift US Bond Strategist rswift@bcaresearch.com Footnotes 1 Please see US Bond Strategy Weekly Report, “Watch Employment, Not Inflation”, dated June 15, 2021. 2 Specifically, the Fed’s forward guidance states that it will not lift interest rates until (i) inflation is above 2%, (ii) inflation is expected to remain above 2% for some time and (iii) the labor market has reached “maximum employment”. 3 Please see Bank Credit Analyst Special Report, “The Return To Maximum Employment: It May Be Faster Than You Think”, dated August 26, 2021. 4 For details on the adjustment we make to the unemployment rate please see US Bond Strategy Weekly Report, “Overreaction”, dated July 13, 2021. 5 https://www.federalreserve.gov/newsevents/speech/clarida20210804a.htm 6 https://www.bloomberg.com/news/articles/2021-08-09/dallas-fed-president-rob-kaplan-on-the-economy-and-monetary-policy-right-now?sref=Ij5V3tFi 7 https://www.kansascityfed.org/research/economic-bulletin/what-has-driven-the-recent-increase-in-retirements/ 8 https://www.federalreserve.gov/newsevents/speech/powell20191125a.htm 9 https://www.federalreserve.gov/newsevents/speech/clarida20191114a.htm 10 https://www.bloomberg.com/news/articles/2021-08-16/neel-kashkari-on-the-fed-s-quest-to-get-to-full-employment?srnd=oddlots-podcast&sref=Ij5V3tFi 11 We assume a target range of 2% to 2.25% for the terminal fed funds rate. We also assume that the effective fed funds rate trades 8 bps above the lower-end of its target band, as is presently the case. Recommended Portfolio Specification Other Recommendations Treasury Index Returns Spread Product Returns
9 September 2021 at 10:00 EDT Emerging Markets Strategy/Webcast EM/China: See The Forest For The Trees 9 September 2021 at 21:00 EDT Emerging Markets Strategy/Webcast Emerging Asia: See The Forest For The Trees Highlights Structural inflation in India has abated noticeably since the mid-2010s. The cyclical inflation outlook is also benign (Chart 1). As such, the specter of inflation does not pose a material threat to this stock market. Indian stocks’ high valuation is a risk; yet this bourse’s structurally high premium relative to EM will likely continue as India’s earnings growth will stay strong and its volatility low. Investors should stay overweight Indian stocks in an EM equity portfolio, and local currency bonds in an EM domestic bond portfolio. Feature Chart 1India's Cyclical Inflation Outlook Is Benign
Can Inflation Upset The Indian Applecart?
Can Inflation Upset The Indian Applecart?
In a recent Emerging Markets Strategy report we showed that India stands out as the only country in Asia with rather high inflation. Indeed, core CPI in India, at about 6%, is higher than all other major EM and DM countries, save Turkey and Russia. The question is, with the economy re-opening, will Indian inflation rise further and thus derail the rally in Indian equities? Our research indicates that both the structural and cyclical inflation outlook for India remains benign. Our models for headline and core CPI both point to lower inflation in the coming months (Chart 1). As such, inflation is unlikely to pose any major threat to Indian assets in the foreseeable future. Investors should remain overweight Indian stocks in an EM equity portfolio. Fixed-income investors should also continue to overweight Indian local bonds in an EM domestic bond portfolio. Currency traders should favor the rupee versus its EM peers. Inflation Outlook: Structural … The first of the two principal drivers of India’s structural inflation trend is the country’s productivity. The stronger the productivity gains, the more contained has been its structural inflation. The second major driver is broad money supply. The higher the money growth, the steeper have been inflationary pressures – especially during those periods when productivity gains were timid. Top panel of Chart 2 shows that up until the early-2000s, India’s average productivity gains used to be rather low: of the order of 3% annually. That period was also marked by very strong broad money growth: at times, the latter would rise to 20% annually (Chart 2, bottom panel). This growth was due to chronically high fiscal deficits that were monetized, coupled with intermittent surges in bank credit. Chart 2Slower Money Supply Amid Decent Productivity Led To A Structural Decline In Inflation
Can Inflation Upset The Indian Applecart?
Can Inflation Upset The Indian Applecart?
The consequence of persistently low productivity gains amid strong money supply was structurally high inflation, with occasional flare-ups well into double digits (Chart 2). Chart 3Steady Fall In Budget Deficits In Post-GFC Era
Can Inflation Upset The Indian Applecart?
Can Inflation Upset The Indian Applecart?
From the early 2000s, however, that dynamic began to change. A surge in capital spending in infrastructure and other productive capacity propelled India’s productivity trend up by several notches. In the past 15 years, the productivity growth rate has averaged around 6% a year; even though more recently that rate has slowed. In the post-GFC period, both major sources of money creation were stymied. First, successive Indian governments, regardless of political affiliation, adopted a rather tight fiscal policy. They reined in fiscal outlays substantially. Non-interest expenditures of the central government fell from 14% of GDP in 2010 down to 9% by 2019, just before the pandemic (Chart 3, top panel). As a result, during that period, fiscal and primary deficits narrowed significantly: from almost 7% of GDP to 3%, and from almost 4% of GDP to nearly zero, respectively (Chart 3, bottom panel). In addition, a myriad of reasons1 caused commercial bank credit to decelerate materially – from as high as 30% before the GFC to a mere 6% by 2019. The upshot of all this was a secular decline in broad money growth. That eventually led India’s inflationary pressures to decline structurally since the mid-2010s (Chart 2, bottom panel, above). Going forward, those major drivers (both productivity and money growth) will warrant a benign inflation outlook. The country has been continuing its high capital spending for over a decade now (around 30% to 35% of GDP, a rate second only to China). This year, India’s capital spending has already revived. Other corroborating indicators such as imports of capital goods have also recovered robustly. This indicates a new capex cycle is unfolding. Therefore, odds are that the productivity growth rate will stay decent. Prudent fiscal policy, on the other hand, will keep the money growth in check. Chart 4Low Wages Will Help Keep Inflation Subdued
Can Inflation Upset The Indian Applecart?
Can Inflation Upset The Indian Applecart?
Finally, wage pressures in India will also stay muted. In rural areas, both farm and non-farm nominal wages have been growing at a very slow pace; and are now flirting with outright contraction (Chart 4, top panel). Industrial wage expectations have also been tepid over the past several years (Chart 4, bottom panel). The broader picture is unlikely to change in the future as tens of millions of young people continue to join the work force every year. Taken together, these factors point to subdued structural inflation ahead. … And Cyclical The chance that inflation in India will flare up over a cyclical horizon (12 months) is also low: First, one of the major cyclical drivers of inflation in India, the government’s food procurement prices (called Minimum Support Price or MSP) have stayed low for the past several years. The announced MSPs for some of the crops for the 2021-22 agriculture season (July-June) have also shown no marked increase. This will surely help keep the wholesale prices for food in check, which, in turn, will keep a lid on consumer inflation expectations and ultimately on both headline and core consumer inflation (Chart 5). Second, the country’s money growth is also unlikely to witness an immediate, major boom. While the budget deficit has swelled over the past year or so, odds are that the government will revert to the tighter fiscal stance that prevailed over the past decade – as soon as the pandemic is brought under control. Chart 6 shows that government non-interest spending leads core CPI. Reduced expenditure growth will cap inflation. Chart 5Low Food Prices Will Keep A Lid On Inflation Expectations
Can Inflation Upset The Indian Applecart?
Can Inflation Upset The Indian Applecart?
Chart 6Slowing Fiscal Spending Will Cap Core Inflation
Can Inflation Upset The Indian Applecart?
Can Inflation Upset The Indian Applecart?
Chart 7Fuel Price Inflation Is Set To Decelerate
Can Inflation Upset The Indian Applecart?
Can Inflation Upset The Indian Applecart?
The other contributor to money growth, bank credit, is expected to accelerate; but its expansion will not be rapid as banks are still suffering from elevated NPLs. Third, fuel price inflation has likely peaked in India. Last year authorities imposed substantial new taxes on local gasoline and diesel prices, which artificially raised consumer inflation (Chart 7). Since there is little chance of new fuel levies this year and given that crude prices are unlikely to rise much from the current levels (which is EMS’s view), fuel inflation will subside materially next year. And as fuel costs often eventually spill into core inflation, this deceleration will help check the latter as well. Finally, given the massive negative output gap that opened up in the economy during the pandemic-related lockdowns, it will take a while before the economy overheats again. Odds are therefore low that India’s inflation will accelerate much in the coming months. Notably, our cyclical inflation models for both headline and core CPI – built using the drivers discussed above – also vouch for a modest decline in inflation (Chart 1, on page 1). Does Inflation Hurt Stocks? Currently, the Indian economy is not plagued by any major excesses and therefore has no major macro vulnerability. The only potential vulnerability that the economy and stock markets face stem from any possible rise in inflation. Notably, the primary driver of Indian stocks is economic growth and corporate profits. Historically, inflation (CPI) in low- and mid-single digits did not hurt Indian stocks. However, once inflation approached a high-single digit mark (usually 8%), a sell-off in stocks typically occurred. Chart 8 shows that, during India’s high-inflation era (from 1994 to 2013), every time CPI breached the 8% mark (the dotted line in the chart), stocks fell in absolute USD terms, or at the minimum, were weak. Chart 8Indian Stocks Faced Major Headwinds When Headline CPI Approached 8%
Can Inflation Upset The Indian Applecart?
Can Inflation Upset The Indian Applecart?
Chart 9In Recent Years Inflation Has Ceased To Be A Headwind For Indian Stocks
Can Inflation Upset The Indian Applecart?
Can Inflation Upset The Indian Applecart?
Interestingly, the above correlations have changed dramatically since 2014. The top panel of Chart 9 shows that core CPI does not have any steady correlation with stock prices anymore. And core PPI, in fact, has developed a strong positive correlation with stocks (Chart 9, bottom panel) – in complete reversal of the dynamics that prevailed in the previous two decades. The adverse impact of inflation on stock prices is via multiple compression, as rising interest rates lead to equity de-rating. What’s notable is that the multiple compressions do not begin as soon as a rate hike cycle commences. Rather, it takes a meaningful rise in interest rates before it starts to hurt multiples (Chart 10). Given the above, one can expect a material multiple compression only if inflation rises a few notches above the central bank’s target (Chart 11). The odds of that happening now are low. Therefore, policy rates will remain lower for longer, and stock valuations will remain at a higher level than usual. Chart 10Interest Rates Usually Needed To Rise Several Points Before Stock Multiple Compression Began
Can Inflation Upset The Indian Applecart?
Can Inflation Upset The Indian Applecart?
Chart 11India's Inflation Remains Within RBI Target Bands
Can Inflation Upset The Indian Applecart?
Can Inflation Upset The Indian Applecart?
Incidentally, thanks to material rate cuts, real interest rates paid by Indian firms – deflated by both core producer and core consumer prices – have plummeted. Lower real rates benefit the borrowers (i.e., non-financial listed companies) (Chart 12). The bottom line is that, with India’s inflation now being both structurally low (by Indian history) and cyclically tame, it is unlikely to be a cause of any major equity sell-off. Are Indian Equity Valuations Justified? With a trailing P/E of 31, and P/Book of 3.9, there is no doubt that Indian stocks are expensive. Yet, part of the multiple expansion in India, like most other DM countries, has been a direct outcome of a sharply lower policy rate, as discussed above. Incidentally, if one were to look at the cyclically adjusted valuation measures (CAPE), Indian markets appear to be only moderately expensive (Chart 13, top panel). Chart 12Lower Real Rates Boost Firms' Profits And Warrant Higher Stock Prices
Can Inflation Upset The Indian Applecart?
Can Inflation Upset The Indian Applecart?
Chart 13Cyclically-Adjuted P/E Ratio
Can Inflation Upset The Indian Applecart?
Can Inflation Upset The Indian Applecart?
Chart 14Relative Equity Multiples: India vs. EM
Can Inflation Upset The Indian Applecart?
Can Inflation Upset The Indian Applecart?
In terms of relative valuation vis-à-vis the rest of the EM, Indian stocks continue to command a high premium: around 90% in the case of P/E and P/Book multiples. (Chart 14). In terms of cyclically adjusted valuation (CAPE) relative to the EM, India also appears to be quite pricey (Chart 13, bottom panel). The bottom line is that Indian stocks are expensive; and that is a risk to this bourse. A pertinent question here is whether India still merits the structurally high premium that it has enjoyed over the years relative to its peers. Our answer is in the affirmative. One reason this bourse has continued to enjoy a high premium, especially since the mid-2000s, is because the growth of Indian corporate earnings has been superior to those of most other EM countries. But more importantly, the volatility of those earnings has been much lower than its peers. These strong, yet less volatile earnings are what investors have been willing to pay a premium for. Going forward, we see both traits remaining intact. Long-term growth in India will likely stay as one of the highest in the EM world. Earnings volatility is also unlikely to change anytime soon. The reason is, first, lower inflation going forward will entail relatively lower interest rate volatility, and therefore, lower business cycle / earnings volatility. Second, India’s currency volatility will also likely stay lower. Part of the reason is the near absence of foreign investors on government bonds in India. This has precluded India from suffering a major currency sell-off during global risk-off episodes – as few bond investors head for the exit. We discussed this and several other issues related to Indian bond markets and the rupee in much greater detail in our last report on India. Taken together, lower volatility in both local currency earnings and the exchange rate entails lower overall volatility for US dollar-denominated earnings. That will help Indian stocks’ premium to stay elevated beyond any short-term fluctuations. Inflation And The Rupee Chart 15The Rupee Strengthens When Relative Inflation In India Versus US Decelerates
Can Inflation Upset The Indian Applecart?
Can Inflation Upset The Indian Applecart?
The impact of inflation on the rupee is nuanced. It’s not the absolute level of India’s CPI or PPI that affects the rupee-dollar exchange rate; it’s the relative inflation between these two economies that does so. Chart 15 shows that the rupee usually strengthens versus the dollar when inflation in India falls relative to that of US (shown in inverted scale in the chart). These relative inflation dynamics could also provide insight into the exchange rate outlook. Chart 16 shows that the rupee is currently 10% cheaper when measured against what would be its “fair value” (Chart 16, bottom panel). The fair value has been derived from a regression analysis of the exchange rate on the manufacturers’ relative producer prices of the two countries. Investment Recommendations Indian stocks have decisively broken out both in absolute terms and relative to their EM counterparts (Chart 17). Notably, the outperformance is not just due to a sell-off in Chinese TMT stocks. It is even more impressive relative to the ‘mainstream EM’ bourses (i.e., EM excluding China, Taiwan and Korea). Given India’s relatively superior structural and cyclical backdrops, this outperformance should continue for a while (Chart 17, bottom two panels). Investors should stay overweight this bourse in an EM equity portfolio. Chart 16The Indian Rupee Is Now About 10% Below Its Fair Value Versus The US Dollar
Can Inflation Upset The Indian Applecart?
Can Inflation Upset The Indian Applecart?
Chart 17Indian Stocks' Breakout Is Decisive And The Relative Outperformance Is Broad-based
Can Inflation Upset The Indian Applecart?
Can Inflation Upset The Indian Applecart?
Chart 18Higher Carry And A Better Currency Outlook Will Lead To Indian Domestic Bonds' Outperformance
Can Inflation Upset The Indian Applecart?
Can Inflation Upset The Indian Applecart?
The medium-term outlook for the rupee is also positive. The currency is cheap and competitive –an added incentive for both foreign direct investors and portfolio investors. Finally, Indian domestic bonds offer value – both relative to their EM peers and the US treasuries. 10-year government bonds yields, at 6.2%, offer an enticing 480 basis points over similar duration US Treasuries. Given the sanguine rupee and inflation outlooks, Indian bonds will likely continue to outperform EM local bonds (Chart 18). Investors should stay on with our recommendation of overweighting India in an EM local currency bond portfolio. Rajeeb Pramanik Senior EM Strategist rajeeb.pramanik@bcaresearch.com Footnotes 1 The reasons include a surge in bank NPLs, lack of bankable projects, a kind of policy paralysis resulting in delay in various regulatory clearances for capital projects etc.
Highlights Economy – Goldilocks remains our base-case macro backdrop for the next twelve months: The transitory inflation narrative is still intact, despite persistently high consumer price increases, suggesting that the economy will not overheat. The Delta wave has roiled many communities, but COVID is unlikely to spark a growth outage unless a vaccine-resistant variant emerges. Markets – Above-trend growth and extraordinarily accommodative monetary policy is a sweet spot for risk assets: As long as the Fed’s novel policy of adding monetary stimulus to an economy growing way above trend doesn’t give rise to unnervingly high inflation, the combination will be conducive to continued equity and credit outperformance. Strategy – Continue to overweight risk assets within multi-asset portfolios: There’s more to investment returns than the state of the business, credit and monetary policy cycles but they make a powerful case against turning defensive in the near term. Feature We had several virtual meetings with clients in August and inflation, the Fed and the growth outlook were frequently recurring themes. In this week’s report, we share some of the most common questions, along with our take on them, so that all clients can see what we’ve been discussing with their peers. In the interest of space, we confine the discussion to our base-case scenarios, but future outcomes appear to be even more uncertain than they normally are against a backdrop of unprecedented policy settings. We advise investors to remain vigilant and be prepared to hold positions for shorter-than-usual durations in the event circumstances change. Inflation prints remain high, pressuring the Fed’s transitory narrative. What will happen to markets if investors reject it? Chart 1Losing Steam?
Losing Steam?
Losing Steam?
Inflation prints do remain high, with headline CPI rising 0.5% month-over-month and 5.3% year-over-year in July and core CPI rising 0.3% and 4.2%. Both series modestly exceeded expectations, though they recorded their smallest sequential gains since February and their year-over-year increases came in just below the peaks recorded in June (Chart 1). It is possible that consumer price increases have begun to decelerate though it will take more data to confirm the existence of a new trend. Reports of continued bottlenecks driven by component shortages, transport challenges and the Delta infection wave suggest that even if the factors that have pushed inflation higher are beginning to abate, they may linger in some form for longer than initially expected. The transitory narrative remains intact, however. Drilling into the components of the elevated core CPI reveals that a handful of categories that have been particularly impacted by the pandemic are exerting outsized influence over the index. When we published the initial version of Table 1 in late May, nine categories powered April’s reported core inflation. This time there are eight, as the five shaded components have come off the boil and the four components shown in an indented font have newly begun to run hot. Table 1Temporary Irritants
Discussing Inflation, Growth And Market Implications
Discussing Inflation, Growth And Market Implications
Excepting historically volatile recreational services and water, sewer and trash services, which have been increasing in price far faster than other goods and services for a while, the hot categories’ moves have been extreme relative to their own history. Unless their spaces have undergone lasting structural changes, we expect their two-plus standard deviation moves will not be sustained. The biggest outliers, lodging and new vehicles, can be explained entirely by the pandemic and once hotels are able to return to full capacity and an end to the semiconductor shortage allows automakers to resume normal production levels, they will come back to earth. The turnover among the outliers supports the transitory narrative, as price spikes in categories that have long lagged the overall basket, like airfares and used cars, or have experienced long deflationary skids, like furniture and bedding, appear to have been fleeting. Chart 2Back To The Early Nineties
Back To The Early Nineties
Back To The Early Nineties
Markets would experience considerable disruption if investors became convinced that elevated inflation readings were not transitory. Bond yields would rise sharply; the dollar would weaken, stoking further price increases; and the technology sector would come under pressure, threatening the S&P 500. Worst of all, the Fed would be forced to begin hiking the fed funds rate sooner than expected, on its way to setting it at a higher terminal level than expected, sending rates higher across all maturities and weighing on equities generally. The sizable potential market impacts have us monitoring inflation closely, even if the inflation debate won’t likely be resolved until we have several more monthly data points. So you’re watching inflation closely, but you’re not all that worried about it? That’s the gist of it, yes. We’re watchful but not worried. Part of the reason that respective year-over-year core and headline CPI prints over 4% and 5% give everyone such a start is that inflation hasn’t been so high since the beginning of the nineties (Chart 2). But the structural factors that have helped keep inflation in check for decades didn’t suddenly disappear when the pandemic arrived. While BCA’s house view holds that investors are complacent about inflation’s longer-run trajectory, we expect that it will take a few years for prices to move sustainably higher. Table 2Inflation Checklist
Discussing Inflation, Growth And Market Implications
Discussing Inflation, Growth And Market Implications
We developed our inflation checklist to keep tabs on when inflation is poised to rise enough to impact monetary policy and provoke a market inflection. We check the same three boxes that we have in our previous reviews: Labor demand is still red-hot, year-over-year changes in marquee inflation indexes are still well above the Fed’s target and BCA’s pipeline inflation indicator remains very elevated (Table 2). Wages have not yet broken out in response to the worker shortage, however (Chart 3), and it is as if idle workers are abstaining from working rather than using their leverage to command higher wages. The more refined trimmed-mean measures of the CPI and the PCE Index remain relatively well behaved (Chart 4). Chart 3Wages Have Risen, But They Haven't Broken Out Yet
Wages Have Risen, But They Haven't Broken Out Yet
Wages Have Risen, But They Haven't Broken Out Yet
Chart 4More Refined Inflation Measures Continue To Lag Their Marquee Peers
More Refined Inflation Measures Continue To Lag Their Marquee Peers
More Refined Inflation Measures Continue To Lag Their Marquee Peers
Even if our pipeline inflation indicator has crested, it remains at an extremely high level consistent with above-target consumer price gains (Chart 5). As measured by the DXY Index, the dollar has twice bounced convincingly off support at 90 this year, helping to keep imports from adding fuel to the fire. Core consumer prices in the Eurozone and China are only rising a little more than 1% annually in any event, so the two largest economies outside the US are not yet exporting inflation stateside (Chart 6). Chart 5Inflation Pressures May Finally Be Easing
Inflation Pressures May Finally Be Easing
Inflation Pressures May Finally Be Easing
Chart 6Eurozone Prices Are Rising, But They're Not Yet Elevated
Eurozone Prices Are Rising, But They're Not Yet Elevated
Eurozone Prices Are Rising, But They're Not Yet Elevated
If we had to pick just one indicator to determine whether inflation will become problematic, it would be the shape of the inflation expectations curve. High inflation becomes self-sustaining when economic actors – workers, businesses, consumers and lenders – begin to expect it will persist into the future and change their behavior to align with their expectations. When inflation is expected to be high over the long term, individual workers or their unions insist on higher wages to maintain purchasing power, businesses at all points of the supply chain demand higher prices to protect their margins, consumers accelerate their big-ticket purchase decisions to get the most bang for their buck and lenders require higher nominal pro forma returns. The resulting feedback loops help inflation become entrenched in the same way that expectations of falling prices have paved the way for a deflationary mindset to grip Japan. As long as investors (Table 3) and households (Chart 7) expect inflation to decelerate from the short term to the intermediate term, and again from the intermediate term to the long term, the inflation genie has not gotten out of the bottle. Table 3Investors' Inflation Expectations Curve Is Inverted, ...
Discussing Inflation, Growth And Market Implications
Discussing Inflation, Growth And Market Implications
Chart 7... And So Is Consumers'
... And So Is Consumers'
... And So Is Consumers'
Where do you get the idea that upward S&P 500 earnings revisions are in store? Analysts are already penciling in double-digit year-over-year gains over the next four quarters and growth is plainly decelerating. In our view, the dislocations imposed by COVID-19 across all of 2020 distorts year-over-year earnings comparisons so much that they are of little use. To sidestep that distortion, we have been calculating expected growth by comparing forward four-quarter earnings projections to the annualized run rate of the last reported quarter. As an example, at the beginning of the second quarter earnings season in July, we multiplied the first quarter’s $49.13 EPS by four to get $196.52 and then compared it to the $193.25 sum of expectations for 2Q21 through 1Q22, discovering that analysts were calling for a nearly 2% decline in S&P earnings based on 1Q21's run rate. We also observed that the 2Q21 projection of $45.21 indicated that analysts expected an 8% quarter-over-quarter decline (Table 4). Table 4Expectations At The Start Of The 2Q Earnings Season Were Too Low
Discussing Inflation, Growth And Market Implications
Discussing Inflation, Growth And Market Implications
Looking through modest seasonal effects, S&P 500 EPS tend to grow from quarter to quarter during expansions. An 8% quarter-on-quarter contraction would have been very surprising when nominal GDP, a sound proxy for S&P 500 revenue growth, was projected to grow by at least 2.25% (7% real annual growth plus 2% inflation). Assuming S&P 500 earnings could match GDP growth, we figured that 2Q index EPS would be at least $50, 2% above 1Q and 10% above analyst estimates. With nearly all constituents having reported at press time, it looks like they will settle at $52.74. Chart 8Predicted Declines In Forward Four-Quarter S&P 500 Earnings Are Rare
Predicted Declines In Forward Four-Quarter S&P 500 Earnings Are Rare
Predicted Declines In Forward Four-Quarter S&P 500 Earnings Are Rare
Table 5S&P 500 Earnings
Discussing Inflation, Growth And Market Implications
Discussing Inflation, Growth And Market Implications
BCA does not make point estimates, but a sequential perspective yielded a useful insight that pandemic-distorted year-over-year analysis missed: consensus 2Q earnings estimates were glaringly low when compared to actual 1Q results and the next three quarters’ estimates looked like they had room to rise as well. As Chart 8 shows, forward four-quarter earnings are rarely projected to fall below the most recent quarter’s annualized run rate. With quarterly earnings not projected to exceed 2Q21 until 2Q22 (Table 5), the expectations bar appears to be set low for the next four quarters, especially given 2H21 real annualized GDP growth expectations of around 6% (9% nominal, if inflation declines to no less than 3%) and 1H22 real GDP growth expectations of 3 to 3.5% (5.5 to 6% nominal, if inflation declines to no less than 2.5%). The bottom line is that earnings estimates are quite modest from a sequential perspective when viewed against S&P 500 earnings’ tendency to rise during expansions. While we expect that earnings growth will decelerate, we do not foresee that it will spite history and contract, especially given the extraordinarily accommodative monetary and fiscal policy backdrop. Investment Implications As the foregoing discussion suggests, we remain comfortable with our base-case scenario that the Goldilocks strong-growth/accommodative policy backdrop will remain in place and support risk assets over the next twelve months. Neither the too-hot right-hand tail, in which monetary policy is projected to turn restrictive soon enough to weigh on twelve-month returns, or the too-cold left-hand tail, in which growth disappoints despite copious accommodation, looks particularly likely. But as we keep highlighting in discussions with clients, we are mindful that our conviction levels are necessarily lower than usual given the unprecedented backdrop. We are bullish, but vigilantly so, and we urge investors not to let their guard down. We take heart from what we view as a powerful bias for the Fed to err on the side of providing too much accommodation. It was nothing new when Chair Powell explicitly drew a distinction between tapering asset purchases and hiking the fed funds rate in his Jackson Hole speech a week and a half ago, but it was nonetheless comforting for an investor in risk assets to have the Fed reiterate its dovish default position. A zero fed funds rate is conducive to corporate earnings growth and risk asset outperformance and it will help hold off the start date of the next recession. So too will the lagged effects of massive fiscal transfers that bolster households’ ability to consume. The path of least resistance is for risk assets to continue generating excess returns. Doug Peta, CFA Chief US Investment Strategist dougp@bcaresearch.com
Highlights Regulatory changes affecting Chinese platform companies are structural – rather than transitory – in nature. These companies might become quasi-SOEs and could be used by the government to achieve its national and geopolitical objectives. China’s regulatory clampdown will produce structurally lower corporate profitability and, thereby, reduce equity valuations for Chinese TMT companies. Chinese policymakers have begun easing monetary and fiscal policies. Money and credit growth will likely bottom in December or so. However, as in H2 2018 and H1 2019, policy will be eased only gradually. During this period EM ex-TMT stocks and industrial metal prices performed poorly. Mainstream EM (countries outside North Asia) will continue suffering from weak growth and rising political volatility, warranting a higher risk premium. The risk-reward tradeoff for EM financial markets is poor. Feature Over the past several days, I have held calls and roundtables with clients located in the EMEA region. In this report, we will share our answers to the most common client questions. Many clients were asking if the selloff in Chinese platform companies is nearing its end or whether much more weakness is to be expected. It is not surprising that with the Hang Seng Tech index down 35% from its February highs, there is great temptation to engage in bottom fishing. So, we start with questions relating to this topic. Chart 1Is This Time Different For Chinese TMT Stocks?
Is This Time Different For Chinese TMT Stocks?
Is This Time Different For Chinese TMT Stocks?
Question: In 2018, the regulatory clampdown on Tencent and other video game companies lasted several months and created a major pullback in their share prices (Chart 1). However, authorities ultimately removed restrictions and these stocks rallied to new highs. Do you expect the same dynamics to emerge this time around? And if not, why? We are witnessing a structural regime shift in the Chinese government’s approach toward platform companies. These changes are much more profound and long lasting than those in 2018. They herald structurally lower corporate profitability and equity multiples for Chinese TMT companies. For these stocks, a bounce from oversold levels is possible over the near term and it could be sharp. However, the rebound will be short-lived, i.e., a cyclical or secular rally is unlikely. Investors – who have not sold – should use this rebound to pare back exposure to Chinese TMT stocks. Chart 2Chinese SOEs: Lackluster Share Price Performance
Chinese SOEs: Lackluster Share Price Performance
Chinese SOEs: Lackluster Share Price Performance
Going forward, these platform companies will be managed in a similar fashion to Chinese state-owned enterprises (SOEs): with the interest of the entire nation in mind, and shareholder interests will take a back seat. China’s SOEs trade at very low multiples and their share prices have been treading water since 2009 (Chart 2). The secular bull market in Chinese TMT share prices is over and more de-rating is likely for the following reasons: Chinese platform/new economy companies possess unique big data that are important to the country’s development. Protecting big data becomes a priority in an era of US-China geopolitical confrontation and amid the elevated risk of cyber attacks. As a result, it is essential for the Chinese government to control companies that possesses big data. Limiting foreign shareholders’ access and decision making in regard to big data is also imperative. We do not believe that Chinese authorities will ever allow these new economy companies to operate as freely as they have in the past. Given platform company importance to both the domestic economy and geopolitical confrontation with the US, we will not be surprised if the government eventually establishes effective control over these platform companies – probably via its affiliated entities. Many of these platform companies are natural monopolies or oligopolies and their profitability should be regulated by authorities according to free market economic textbooks. We discussed this point in the recent report titled Chinese TMT Stocks: A Bad Dream Or A New Reality? Please click on the link to open the report. Going forward, return on equity will be lower than in the past for these stocks, heralding lower valuation multiples. Stocks of many Chinese platform companies trade in the US and are largely owned by US/international (non-Chinese) investors. Neither US nor Chinese authorities want to see shares of Chinese TMT companies trade in the US, albeit for completely different reasons. Chinese authorities want these companies to release little information to their foreign shareholders, especially regarding big data. In turn, the US securities regulator is keen for US investors not to be exposed to the risks of owning Chinese stocks for two main reasons: (1) these companies do not disclose full information and (2) China’s government meddles with the management of these enterprises. Given that authorities from both countries do not support the trading of Chinese stocks in the US, odds are high that the trading of Chinese TMT companies will move from the US to Hong Kong. Moreover, US authorities may recommend US funds avoid owing Chinese stocks. In short, increased government control over Chinese TMT companies and rising geopolitical tensions between the US and the Middle Kingdom may prompt many foreign investors to reduce their exposure to these stocks. This will have negative ramifications on their share prices. Chart 3Little Volatility Spillover From Offshore Into China's Onshore Markets
Little Volatility Spillover From Offshore Into China's Onshore Markets
Little Volatility Spillover From Offshore Into China's Onshore Markets
Question: Don’t you think Chinese authorities may reverse their regulatory clampdown given that Chinese share prices have already dropped a great deal and further weakness could hurt investor and business sentiment? Chinese authorities will not reverse regulatory tightening on platform companies. If investor and business confidence on the mainland is hurt materially, regulators will reduce the intensity of their reforms but will not reverse them. Importantly, the carnage has so far been limited to Chinese offshore financial markets (Chart 3). Neither the onshore equity indexes, nor onshore corporate bonds have sold off much (Chart 3). The majority of platform companies are listed offshore and plunging share prices hurt foreign shareholders more than domestic retail and institutional investors. There is little reason for Chinese policymakers to worry about losses among foreign investors so long as the carnage does not spread to onshore markets. Question: Why would Chinese authorities damage their largest and most successful companies in the new economy sectors? Are they not critical amidst the US-China confrontation? Chinese policymakers understand the importance of platform companies to the country’s domestic growth outlook as well as its geopolitical ambitions. This explains why Chinese authorities seek to establish effective control over decision making in these companies. We elaborated on the strategic importance of big data above. Also, the largest platform companies, such as Alibaba, Tencent and Meituan, have in recent years been acquiring stakes in numerous businesses in Southeast Asia. Beijing might be thinking of using these platform companies to raise its geopolitical influence over other Asian nations and beyond. Many Asian nations will play a prominent role in the US-China confrontation. Whether they side with China or the US will affect the balance of geopolitical power in the region. In this context, having control over soft infrastructure (payment and data systems, among others) in these Asian economies will give Beijing a chance to influence their geopolitical choices, thereby giving China an advantage over the US. Therefore, the Chinese central government might be aiming to establish an effective control over these companies’ strategic decisions. In such a case, shareholder interests will take a back seat in these companies. Question: What about common prosperity initiatives and policies that the Chinese leadership has unveiled in recent weeks? Why now? President Xi will be elected for his third term in the fall of 2022. This constitutes a major political precedent in the Middle Kingdom’s modern history. President Xi wants to secure his support from the bulk of the population. Common prosperity policies entail income and wealth distribution from high-income to middle- and low-income households. Chart 4 and Chart 5 illustrate that there has so far been no equalization of income and wealth distribution. Chart 4China: Income Disparity Has Not Been Narrowing
What Clients Are Asking
What Clients Are Asking
Chart 5Wealth Concentration Remains High In China
Wealth Concentration Remains High In China
Wealth Concentration Remains High In China
It is imperative for President Xi to achieve a meaningful change in income and wealth distribution in the next 12 months before his third term. President Xi’s power stems not from the top 10% of the population but from the remaining (and less wealthy) 90%. Hence, there will be little easing in the push toward common prosperity. If anything, the pace of these initiatives could escalate going forward. As a part of the common prosperity initiatives, companies with excess profitability will be compelled to perform a national duty in the form of financing social programs or providing donations. Large platform companies have already begun making large donations. This trend will intensify in the months ahead. In brief, profits will be distributed away from shareholders of these companies in favor of the general well-being of society. The positive is that low- and middle-income consumer spending in China will be supported by income transfer from companies and wealthy individuals. As a result, investors should favor the companies that sell to low- and middle-income households. Chart 6Chinese Growth Stocks Are Not Yet Cheap
Chinese Growth Stocks Are Not Yet Cheap
Chinese Growth Stocks Are Not Yet Cheap
Going forward, the model of SOEs in China or Russia will be applicable to Chinese platform companies. SOEs in China, Russia and other EM countries often perform national duties at the expense of shareholders. Not surprisingly, their stocks have been trading at much lower multiples than private companies. Presently, Chinese TMT/growth stocks trade at a trailing P/E ratio of 33.5 (Chart 6). We do not expect platform companies’ P/E ratio to drop to the level of SOEs. However, a trailing P/E ratio of 33.5 for China’s TMT companies is still high given: the uncertainty around future business models; a lack of clarity around (still evolving) new regulation; government involvement in their management; the prioritization of national and geopolitical objectives over shareholder interest. Chart 7Mind These Gaps
Mind These Gaps
Mind These Gaps
Question: Isn’t the slowdown in China’s business cycle already well known and priced in related financial markets? Yes, it is well known but we do not think it has been priced in China-exposed plays. There are several market relationships and indicators that lead us to believe so. Both panels in Chart 7 illustrate that industrial metals prices have diverged from the Chinese manufacturing PMI and onshore government bond yields. The latter two variables project the Chinese business cycle. Such a decoupling is unsustainable given that China accounts for 55% of global industrial metal consumption. We continue to expect meaningful downside in industrial metals prices which would hurt EM countries exporting commodities. China’s credit and fiscal spending impulse leads its business cycle by nine months and suggests that economic data will be weakening until Q2 2022 (Chart 8). Finally, net EPS revisions for EM-listed companies remain elevated (Chart 9). Chart 8China's Business Cycle Will Continue Decelerating Well Into Q1 2022
China's Business Cycle Will Continue Decelerating Well Into Q1 2022
China's Business Cycle Will Continue Decelerating Well Into Q1 2022
Chart 9EM EPS Growth Expectations Have Not Yet Been Downgraded
EM EPS Growth Expectations Have Not Yet Been Downgraded
EM EPS Growth Expectations Have Not Yet Been Downgraded
That said, one sentiment indicator that has dropped significantly and is now near its level during previous EM equity lows is the Sentix European investor sentiment index on EM equities (Chart 10). Chart 10European Investor Sentiment On EM Stocks Is Back To Its Previous Lows
European Investor Sentiment On EM Stocks Is Back To Its Previous Lows
European Investor Sentiment On EM Stocks Is Back To Its Previous Lows
Net-net, the risk-reward tradeoff for EM equities and credit markets is not yet attractive. Chinese TMT stocks are vulnerable for reasons discussed above while EM financial markets exposed to China’s old economy are at risk due to decelerating Chinese economic growth. Question: When will authorities in China ease policy? What does it imply for Chinese and EM financial markets? Shouldn’t investors buy China/EM assets now in anticipation of macro policy easing in China? Yes, China has already started easing credit and fiscal policy and will ease more in the coming months. Chart 11 reveals that banks’ excess reserves at the PBOC have turned up and they lead the credit impulse by six months. In turn, the Chinese credit impulse in turn leads EM share price cycles by nine months (Chart 12). Chart 11China's Credit Impulse Will Bottom In Late 2021
China's Credit Impulse Will Bottom In Late 2021
China's Credit Impulse Will Bottom In Late 2021
Chart 12EM Equities Are Not Yet Out Of The Woods
EM Equities Are Not Yet Out Of The Woods
EM Equities Are Not Yet Out Of The Woods
All in all, even though Chinese policymakers have begun easing credit and fiscal policy, financial markets leveraged to the mainland’s old economy could still suffer as growth continues to disappoint in the months to come. Chart 13Chinese Easing In H2 2018 And H1 2019 Did Not Help Much EM Stocks And Metal Prices
Chinese Easing In H2 2018 and H1 2019 Did Not Help Much EM Stocks And Metal Prices
Chinese Easing In H2 2018 and H1 2019 Did Not Help Much EM Stocks And Metal Prices
Importantly, policy easing will be implemented gradually, as in H2 2018 and H1 2019. During this period EM ex-TMT stocks and industrial metal prices performed poorly despite policy easing in China (Chart 13). Question: Given improvements in vaccine availability worldwide, will EM countries close their vaccination gap with developed countries in the coming months? If yes, wouldn’t it allow their economies to catch up, and their financial markets to outperform their DM peers? EM vaccination rates will rise as vaccines become available to developing countries. However, mainstream EM vaccination rates will still remain below those of advanced economies. This gap is due to higher levels of mistrust toward governments in developing countries than in advanced ones. Therefore, the pandemic will continue capping economic activity in mainstream EM. Importantly, the lack of fiscal stimulus, monetary policy tightening and weak banking systems in mainstream EM (i.e., excluding China, Korea and Taiwan) herald weak income and domestic demand growth in these economies. Years of poor income growth and lasting pandemic damage have caused political volatility to flare-up in some countries such as Colombia, Peru, Brazil, South Africa and Malaysia. This trend will likely continue foreshowing a higher risk premium in EM financial markets. Question: What is your inflation outlook for mainstream EM (excluding North Asia)? Will inflation continue to surprise to the upside and will their central banks hike rates enough so that their currencies do not depreciate? We discussed the inflation dynamics and the outlook for local rates for EM in the August 12 report. While commodity price inflation will subside, renewed currency deprecation is the key risk to the inflation outlook in mainstream EM. EM currencies will depreciate because China’s continued slowdown is bearish for EM currencies but bullish for the greenback. The basis is that the US sells little to China while EM are exposed to the Chinese business cycle. Also, domestic demand in mainstream EM will disappoint. That, along with rising political volatility, is negative for their currencies. Finally, high local rates in mainstream EM have often coincided with currency depreciation rather than appreciation. Question: What is the biggest risk in your view? The biggest risk to our view has been and remains TINA (There Is No Alternative). We have strong conviction on fundamentals but very little conviction on fund flows. Given that DM equity and credit markets are expensive and their government bond yields are very depressed, portfolio capital can go into EM financial markets that offer lower valuation than their DM counterparts even though they are not cheap in absolute terms. Our methodology is that fundamentals drive flows in the medium- to-long term. However, with the global financial system flush with liquidity, the importance of fundamentals has declined in recent years. Therefore, we are cognizant that EM markets might not sell off a lot and could bottom at a higher level than warranted by fundamentals. Still, we expect more downside in the coming months because fundamentals are much worse than most investors realize. Chart 14EM Credit Will Continue Underperforming Their US Peers
EM Credit Will Continue Underperforming Their US Peers
EM Credit Will Continue Underperforming Their US Peers
Question: What is your recommended strategy across EM equities, currencies, and fixed-income markets? Global equity portfolios should continue underweighting EM, a recommendation from March 25, 2021. Within the EM equity universe, our overweights are Korea, India, China (preferring onshore to offshore equities), Mexico and Chile. Our underweights are Brazil, Colombia, Peru, South Africa, Turkey, the Philippines and Indonesia. The risk-reward tradeoff for EM currencies remains poor. We continue shorting a basket of BRL, CLP, COP, PEN, ZAR, TRY, PHP, THB and KRW versus the US dollar. Within local markets we overweight Mexico, Russia, Korea, Malaysia, India, China and Chile. Regarding sovereign and corporate credit, we have downgraded EM credit versus US credit on March 25 and this strategy remains intact (Chart 14). The lists of our overweights, underweights and the ones warranting neutral allocation in EM equity, domestic bonds and credit portfolios are presented below and can always be found on the EMS website. Arthur Budaghyan Chief Emerging Markets Strategist arthurb@bcaresearch.com Equities Recommendations Currencies, Credit And Fixed-Income Recommendations
Highlights Commodity markets will face growing supply challenges over the next decade as the US and China prepare for war, if only to deter war. Chinese President Xi Jinping's push for greater self-reliance at home and supply chain security abroad is reinforced by the West’s focus on the same interests. The erosion of a single rules-based global trade system increases the odds of economic and even military conflict. The competition for security is precipitating a reforging of global supply chains and a persistent willingness to use punitive measures, which can escalate into boycotts, embargoes, and even blockades (i.e. not only Huawei). The risk of military engagements will rise, particularly along global chokepoints and sea lanes needed to transport vital commodities. Import dependency and supply chain risk are powerful drivers of decarbonization efforts, especially in China. On net, geopolitical trends will keep the balance of commodity-price risks tilted to the upside. Commodity and Energy Strategy remains long commodity index exposure on a strategic basis via the S&P GSCI and the COMT ETF. Note: Even in the short term, a higher geopolitical risk premium is warranted in oil prices due to US-Iran conflict. Feature The Chinese Communist Party (CCP) under President Xi Jinping has embarked on a drive toward autarky, or economic self-sufficiency, that has enormous implications, especially for global commodities. Beijing believes it can maintain central control, harness technology, enhance its manufacturing prowess, and grow at a reasonable rate, all while bulking up its national security. The challenge is to maintain social stability and supply security through the transition. China lives in desperate fear of the chaos that reigned throughout most of the twentieth and twenty-first centuries, which also enabled foreign domination (Chart 1). The problem for the rest of the world is that Chinese nationalism and assertive foreign policy are integral aspects of the new national strategy. They are needed to divert the public from social ills and deter foreign powers that might threaten China’s economy and supply security. Chart 1China Fears Any Risk Of Another ‘Century Of Humiliation’
US-China: War Preparation Pushes Commodity Demand
US-China: War Preparation Pushes Commodity Demand
The chief obstacle for China is the United States, which remains the world leader even though its share of global power and wealth is declining over time. The US is formally adopting a policy of confrontation rather than engagement with China. For example, the Biden administration is co-opting much of the Trump administration's agenda. Infrastructure, industrial policy, trade protectionism, and the “pivot to Asia” are now signature policies of Biden as well as Trump (Table 1).1 Table 1US Strategic Competition Act Highlights Return Of Industrial Policy, Confrontation With China
US-China: War Preparation Pushes Commodity Demand
US-China: War Preparation Pushes Commodity Demand
Many of these policies are explicitly related to the strategic aim of countering China’s rise, which is seen as vitiating the American economy and global leadership. Biden’s Trump-esque policies are a powerful indication of where the US median voter stands and hence of long-term significance (Chart 2). Thus competition between the US and China for global economic, military, and political leadership is entering a new phase. China’s drive for self-reliance threatens the US-led global trade system, while the US’s still-preeminent geopolitical power threatens China’s vital lines of supply. Chart 2US Public’s Fears Are China-Centric
US-China: War Preparation Pushes Commodity Demand
US-China: War Preparation Pushes Commodity Demand
Re-Ordering Global Trade The US’s and China’s demonstrable willingness to use tariffs, non-tariff trade barriers, export controls, and sanctions cannot be expected to abate given that they are locked in great power competition (Chart 3). More than likely, the US and China will independently pursue trade relations with their respective allies and partners, which will replace the mostly ineffective World Trade Organization (WTO) framework. The WTO is the successor to the rules-based and market-oriented system known as the General Agreement on Tariffs and Trade (GATT), which was formed following World War II. The GATT’s founders shared a strong desire to avoid a repeat of the global economic instability brought on by World War I, the Great Crash of 1929, and the retreat into autarky and isolationism that led to WWII. Chart 3US and China Imposing Trade Restrictions
US and China Imposing Trade Restrictions
US and China Imposing Trade Restrictions
This inter-war period saw domestically focused monetary policies and punishing tariffs that spawned ruinous bouts of inflation and deflation. Minimizing tariffs, leveling the playing field in trading markets, and reducing subsidization of state corporate champions were among the GATT's early successes. The WTO, like the GATT before it, has no authority to command a state to change its economy or the way it chooses to organize itself. At its inception the GATT's modus vivendi was directed at establishing a rules-based system free of excessive government intrusion and regulation. If governments agreed to reduce their domestic favoritism, they could all improve their economic efficiency while avoiding a relapse into autarky and the military tensions that go with it.2 The prime mover in the GATT's founding and early evolution – the USA – firmly believed that exclusive trading blocs had created the groundwork for economic collapse and war. These trading blocs had been created by European powers with their respective colonies. During the inter-war years the revival of protectionism killed global trade and exacerbated the Great Depression. After WWII, Washington was willing to use its power as the global hegemon to prevent a similar outcome. Policymakers believed that European and global economic integration would encourage inter-dependency and discourage protectionism and war. The fall of the Soviet Union reinforced this neoliberal Washington Consensus. Countries like India and China adopted market-oriented policies. The WTO was formed along with a range of global trade deals. Ultimately the US and the West cleared the way for China to join the trading bloc, hoping that the transition from communism to capitalism would eventually be coupled with social and even political liberalization. The world took a very different turn as the United States descended into a morass of domestic political divisions and foreign military adventures. China seized the advantage to expand its economy free of interference from the US or West. The West failed to insist that liberal economic reforms keep pace.3 Moreover, when China joined the WTO in 2001, the organization was in a state of "regulatory stalemate," which made it incapable of dealing with the direct challenges presented by China.4 Today President Xi has consolidated control over the Communist Party and directs its key economic, political, and military policymaking bodies. He has deepened party control down to the management level of SOEs – hiring and firing management. SOEs have benefited from Xi’s rule (Chart 4). But now the West is also reasserting the role of the state in the economy and trade, which means that punitive measures can be brought to bear on China’s SOEs. Chart 4State-Owned Enterprises Benefit From Xi Administration
State-Owned Enterprises Benefit From Xi Administration
State-Owned Enterprises Benefit From Xi Administration
What Comes After The WTO? The CCP has shown no interest in coming around to the WTO's founding beliefs of government non-interference in the private sector. For example, it is doubling down on subsidization and party control of SOEs, which compete against firms in other WTO member states. Nor has the party shown any inclination to accept a trade system based on the GATT/WTO founding members' Western understanding of the rule of law. These states represent market-based economies with long histories of case law for settling disputes. Specifically, China’s fourteenth five-year plan and recent policies re-emphasize the need to upgrade the manufacturing sector rather than rebalancing the economy toward household consumption. The latter would reduce imbalances with trade deficit countries like the US but China is wary of the negative social consequences of too rapidly de-industrializing its economy. It wants to retain its strategic and economic advantage in global manufacturing and it fears the social and political consequences of fully adopting consumer culture (Chart 5). Chart 5China’s Economic Plans Re-Emphasize Manufacturing, Not Consumption
US-China: War Preparation Pushes Commodity Demand
US-China: War Preparation Pushes Commodity Demand
The US, EU, and Japan have proposed reform measures for the WTO aimed at addressing “severe excess capacity in key sectors exacerbated by government financed and supported capacity expansion, unfair competitive conditions caused by large market-distorting subsidies and state owned enterprises, forced technology transfer, and local content requirements and preferences.”5 But these measures are unlikely to succeed. China disagrees with the West’s characterization. In 2018-19, during the trade war with the US, Beijing contended that WTO members must “respect members’ development models.” China formally opposes “special and discriminatory disciplines against state-owned enterprises in the name of WTO reform.”6 In bilateral negotiations with the US this year, China’s first demand is that the US not to oppose its development model of “socialism with Chinese characteristics” (Table 2). Table 2China’s Three Diplomatic Demands Of The United States (2021)
US-China: War Preparation Pushes Commodity Demand
US-China: War Preparation Pushes Commodity Demand
Yet it is hard for the US not to oppose this model because it involves Beijing using the state’s control of the economy to strengthen national security strategy, namely by the fusion of civil and military technology. Going forward, the Biden administration will violate the number one demand that Chinese diplomats have made: it will attempt to galvanize the democracies to put pressure on China’s development model. China’s demand itself reflects its violation of the US primary demand that China stop using the state to enhance its economy at the expense of competitors. If a breakdown in global trading rules is replaced by the US and China forming separate trading blocs with their allies and partners, the odds of repeating the mistakes of the inter-bellum years of 1918-39 will significantly increase. Tariff wars, subsidizing national champions, heavy taxation of foreign interests, non-tariff barriers to trade, domestic-focused monetary policies, and currency wars would become more likely. China’s Strategic Vulnerability The CCP has delivered remarkable prosperity and wealth to the average Chinese citizen in the 43 years since it undertook market reforms, and especially since its accession to the WTO in 2001 (Chart 6). China has transformed from an economic backwater into a $15.4 trillion (2020) economy and near-peer competitor to the US militarily and economically.7 This growth has propelled China to the top of commodity-importing and -consuming states globally for base metals and oil. We follow these markets closely, because they are critical to sustaining economic growth, regardless of how states are organized. Production of and access to these commodities, along with natural gas, will be critical over the next decade, as the world decarbonizes its energy sources, and as the US and China address their own growth and social agendas while vying for global hegemony. Decarbonization is part of the strategic race since all major powers now want to increase economic self-sufficiency and technological prowess. Chart 6CCPs Remarkable Success In Growing Chinas Economy
CCPs Remarkable Success In Growing Chinas Economy
CCPs Remarkable Success In Growing Chinas Economy
Over recent decades China has become the largest importer of base metals ores (Chart 7) and the world's top refiner of many of these metals. In addition, it is the top consumer of refined metal (Chart 8). Chart 7China Is World’s Top Ore Importer
US-China: War Preparation Pushes Commodity Demand
US-China: War Preparation Pushes Commodity Demand
Chart 8China Is Worlds Top Refined Metal Consumer
China Is Worlds Top Refined Metal Consumer
China Is Worlds Top Refined Metal Consumer
By contrast, the US is not listed among ore importers or metals consumers in the Observatory of Economic Complexity (OEC) databases we used to map these commodities. This reflects not only domestic supplies but also the lack of investment and upgrades to the US's critical infrastructure over 2000-19.8 Going forward, the US is trying to invest in “nation building” at home. An enormous change has taken shape in strategic liabilities. In the oil market, the US went from being the world's largest importer of oil in 2000, accounting for more than 24% of imports globally, to being the largest oil and gas producer by 2019, even though it still accounted for more than 12% of the world's imports (Chart 9). In 2000, China accounted for ~ 3.5% of the world's oil imports and by 2019 it was responsible for nearly 21%. China is far behind per capita US energy consumption, given its large population, but it is gradually closing the gap (Chart 10). Overall energy consumption in China is much higher than in the US (Chart 11). Chart 9US Oil Imports Collapse As Shale Production Grows
US-China: War Preparation Pushes Commodity Demand
US-China: War Preparation Pushes Commodity Demand
Chart 10Energy Use Per Capita In China Far From US Levels...
Energy Use Per Capita In China Far From US Levels...
Energy Use Per Capita In China Far From US Levels...
Chart 11China Is World’s Largest Primary Energy Consumer
US-China: War Preparation Pushes Commodity Demand
US-China: War Preparation Pushes Commodity Demand
China's impressive GDP growth in the twenty-first century is primarily responsible for China's stunning growth in imports and consumption of oil (Chart 12) and copper (Chart 13), which we track closely as a proxy for the entire base-metals complex. Chart 12Global Oil Demand Forecast Remains Steady Chinas GDP Drives Oil Consumption, Imports
Global Oil Demand Forecast Remains Steady Chinas GDP Drives Oil Consumption, Imports
Global Oil Demand Forecast Remains Steady Chinas GDP Drives Oil Consumption, Imports
Chart 13Global Oil Demand Forecast Remains Steady Chinas GDP Drives Refined Copper Consumption And Ore Imports
Global Oil Demand Forecast Remains Steady Chinas GDP Drives Refined Copper Consumption And Ore Imports
Global Oil Demand Forecast Remains Steady Chinas GDP Drives Refined Copper Consumption And Ore Imports
China’s importance in these markets points to an underlying strategic weakness, which is its dependency on imports. This in turn points to the greatest danger of the breakdown in US-China relations and the global trade system. The Road To War? China is extremely anxious about maintaining supply security in light of these heavy import needs. Its pursuit of economic self-sufficiency, including decarbonization, is driven by its fear of the US’s ability to cut off its key supply lines. China’s first goal in modernizing its military in recent years was to develop a naval force capable of defending the country from foreign attack, particularly in its immediate maritime surroundings. Historically China suffered from invaders across the sea who took advantage of its weak naval power to force open its economy and exploit it. Today China is thought to have achieved this security objective. It is believed to have a high level of capability within the “first island chain” that surrounds the coast, from the Korean peninsula to the Spratly Islands, including southwest Japan and Taiwan (Map 1).9 China’s militarization of the South China Sea, suppression of Hong Kong, and intimidation of Taiwan shows its intention to dominate Greater China, which would put it in a better strategic position relative to other countries. Map 1China’s Navy Likely Achieved Superiority Within The First Island Chain
US-China: War Preparation Pushes Commodity Demand
US-China: War Preparation Pushes Commodity Demand
China’s capability can be illustrated by comparing its naval strength to that of the United States, the most powerful navy in the world. While the US is superior, China would be able to combine all three of its fleets within the first island China, while the US navy would be dispersed across the world and divided among a range of interests to defend (Table 3). China would also be able to bring its land-based air force and missile firepower to bear within the first island chain, as opposed to further abroad.10 Table 3China’s Naval Growth Enables Primacy Within First Island Chain
US-China: War Preparation Pushes Commodity Demand
US-China: War Preparation Pushes Commodity Demand
In this sense China is militarily capable of conquering Taiwan or other nearby islands. President Xi Jinping had in fact ordered China’s armed forces be capable of doing so by 2020.11 Taiwan continues to be the most significant source of insecurity for the regime. True, a military victory would likely be a pyrrhic victory, as Taiwan’s wealth and tech industry would be destroyed, but China probably has the raw military capability to defeat Taiwan and its allies within this defined space. However, this military capability needs to be weighed against economic capability. If China seized military control of Taiwan, or Okinawa or other neighboring territories, the US, Japan, and their allies would respond by cutting off China’s access to critical supplies. Most obviously oil and natural gas. China’s decarbonization has been impressive but the reliance on foreign oil is still a fatal strategic vulnerability over the next few years (Chart 14). China is rapidly pursuing a Eurasian strategy to diversify away from the Middle East in particular. But it still imports about half its oil from this volatile region (Chart 15). The US navy is capable of interdicting China’s critical oil flows, a major inhibition on China’s military ambitions within the first island chain. Chart 14Chinas Energy Diversification Still Leaves Vulnerabilities
Chinas Energy Diversification Still Leaves Vulnerabilities
Chinas Energy Diversification Still Leaves Vulnerabilities
Of course, if the US and its allies ever blockaded China, or if China feared they would, Beijing could be driven to mount a desperate attack to prevent them from doing so, since its economic, military, and political survival would be on the line. Chart 15China Still Dependent On Middle East Energy Supplies
China Still Dependent On Middle East Energy Supplies
China Still Dependent On Middle East Energy Supplies
The obvious historical analogy is the US-Japan conflict in WWII. Invasions that lead to blockades will lead to larger invasions, as the US and Japan learned.12 However, the lesson from WWII for China is that it should not engage the US navy until its own naval power has progressed much further. In the event of a conflict, the US would be imposing a blockade at a distance from China’s naval and missile forces. When it comes to the far seas, China’s naval capabilities are extremely limited. Military analysts highlight that China lacks a substantial naval presence in the Indian Ocean. China relies on commercial ports, where it has partial equity ownership, for ship supply and maintenance (Table 4). This is no substitute for naval basing, because dedicated military facilities are lacking and host countries may not wish to be drawn into a conflict. Table 4China’s Network Of Part-Owned Ports Across The World: Useful But Not A Substitute For Military Bases
US-China: War Preparation Pushes Commodity Demand
US-China: War Preparation Pushes Commodity Demand
Further, Beijing lacks the sea-based air power necessary to defend its fleets should they stray too far. And it lacks the anti-submarine warfare capabilities necessary to defend its ships.13 These capabilities are constantly improving but at the moment they are insufficient to overthrow US naval control of the critical chokepoints like the Strait of Hormuz or Strait of Malacca. While China’s naval power is comparable to the US’s Asia Pacific fleet (the seventh fleet headquartered in Japan), it is much smaller than the US’s global fleet and at a much greater disadvantage when operating far from home. China’s navy is based at home and focused on its near seas, whereas US fleet is designed to operate in the far seas, especially the Persian Gulf, which is precisely the strategic area in question (Chart 16).14 China is gradually expanding its navy and operations around the world, so over time it may gain the ability to prevent the US from cutting off its critical supplies in the Persian Gulf. But not immediately. The implication is that China will have to avoid direct military conflict with the United States until its military and naval buildup has progressed a lot further. Chart 16China’s Navy At Huge Disadvantage In Distant Seas
US-China: War Preparation Pushes Commodity Demand
US-China: War Preparation Pushes Commodity Demand
Meanwhile Beijing will continue diversifying its energy sources, decarbonizing, and forging supply chains across Eurasia via the Belt and Road Initiative. What could go wrong? We would highlight a few risks that could cause China to risk war even despite its vulnerability to blockade: Chart 17China’s Surplus Of Males Undergirds Rise In Nationalism
US-China: War Preparation Pushes Commodity Demand
US-China: War Preparation Pushes Commodity Demand
Domestic demographic pressure. China is slated to experience a dramatic bulge in the male-to-female ratio over the coming decade (Chart 17).15 A surfeit of young men could lead to an overshoot of nationalism and revanchism. This trend is much more important than the symbolic political anniversaries of 2027, 2035, and 2049, which analysts use to predict when China’s military might launch a major campaign. Domestic economic pressure. China’s turn to nationalism reflects slowing income growth and associated social instability. An economic crisis in China would be worrisome for regional stability for many reasons, but such pressures can lead nations into foreign military adventures. Domestic political pressure. China has shifted from “consensus rule” to “personal rule” under Xi Jinping. This could lead to faulty decision-making or party divisions that affect national policy. A leadership that carefully weighs each strategic risk could decay into a leadership that lacks good information and perspective. The result could be hubris and belligerence abroad. Foreign aggression. Attempts by the US or other powers to arm China’s neighbors or sabotage China’s economy could lead to aggressive reaction. The US’s attempt to build a technological blockade shows that future embargoes and blockades are not impossible. These could prompt a war rather than deter it, as noted above. Foreign weakness. China’s capabilities are improving over time while the US and its allies lack coordination and resolution. An opportunity could arise that China’s strategists believe they cannot afford to miss. Afghanistan is not one of these opportunities, but a US-Iran war or another major conflict with Russia could be. The breakdown in global trade is concerning because without an economic buffer, states may resort to arms to resolve disputes. History shows that military threats intended to discourage aggressive behavior can create dilemmas that incentivize aggression. The behavior of the US and China suggests that they are preparing for war, even if we are generous and assume that they are doing so only to deter war. Both countries are nuclear powers so they face mutually assured destruction in a total war scenario. But they will seek to improve their security within that context, which can lead to naval skirmishes, proxy wars, and even limited wars with associated risks of going nuclear. Investment Takeaways The pursuit of the national interest today involves using fiscal means to create more self-sufficient domestic economies and reduce international supply risks. Both China and the West are engaged in major projects to this end, including high-tech industrialization, domestic manufacturing, and decarbonization. These trends are generally bullish for commodities, even though they include trends like military modernization and naval expansion that could well be a prelude to war. War itself leads to commodity shortages and commodity price inflation, but of course it is disastrous for the people and economies involved. Fortunately, strategic deterrence continues to operate for the time being. The underlying geopolitical trend will put commodity markets under continual pressure. A final urgent update on oil and the Middle East: The US attempt to conduct a strategic “pivot” to Asia Pacific faces a critical juncture. Not because of Afghanistan but because of Iran. The Biden administration will have trouble unilaterally lowering sanctions on Iran after the humiliating Afghanistan pullout. The new administrations in both Iran and Israel are likely to establish red lines and credible threats. A higher geopolitical risk premium is thus warranted immediately in global oil markets. Beyond short-term shows of force, everything depends on whether the US and Iran can find a temporary deal to avoid the path to a larger war. But for now short-term geopolitical risks are commodity-bullish as well as long-term risks. Robert P. Ryan Chief Commodity & Energy Strategist rryan@bcaresearch.com Matt Gertken Vice President Geopolitical Strategy mattg@bcaresearch.com Footnotes 1 There are also significant differences between Biden and Trump in other areas such as redistribution, immigration, and social policy. 2 See Ravenhill, John (2020), Regional Trade Agreements, Chapter 6 in Global Political Economy, which he edited for Oxford University Press, particularly pp. 156-9. 3 “As time went by, the United States realized that Communism not only did not retreat, but also further advanced in China, with the state-owned economy growing stronger and the rule of the Party further entrenched in the process." See Henry Gao, “WTO Reform and China Defining or Defiling the Multilateral Trading System?” Harvard International Law Journal 62 (2021), p. 28, harvardilj.org. 4 See Mavroidis, Petros C. and Andre Sapir (2021), China and the WTO, Why Multilateralism Still Matters (Princeton University Press) for discussion. See also Confronting the Challenge of Chinese State Capitalism published by the Center for Strategic & International Studies 22 January 2021. 5 Gao (2021), p. 19. 6 Gao (2021), p. 24. 7 Please see China's GDP tops 100 trln yuan in 2020 published by Xinhuanet 18 January 2021. 8 We excluded 2020 because of the COVID-19 pandemic's effects on supply and demand for these ores, metals and crude oil. 9 See Captain James Fanell, “China’s Global Navy Strategy and Expanding Force Structure: Pathway To Hegemony,” Testimony to the US House of Representatives, May 17, 2018, docs.house.gov. 10 Fanell (2018), p. 13. 11 He has obliquely implied that his vision for national rejuvenation by 2035 would include reunification with Taiwan. Others suggest that the country’s second centenary of 2049 is the likely deadline, or the 100th anniversary of the People’s Liberation Army. 12 The US was a major supplier of oil to Japan, and in 1941 it froze Japan's assets in the US and shut down all oil exports, in response to Japan's military incursion into China in the Second Sino-Japanese War of 1937-45. Please see Anderson, Irvine H. Jr. (1975), "The 1941 De Facto Embargo on Oil to Japan: A Bureaucratic Reflex," Pacific Historical Review, 44:2, pp. 201-231. 13 See Jeffrey Becker, “Securing China’s Lifelines Across the Indian Ocean,” China Maritime Report No. 11 (Dec 2020), China Maritime Studies Institute, digital-commons.usnwc.edu. 14 See Rear Admiral Michael McDevitt, “Becoming a Great ‘Maritime Power’: A Chinese Dream,” Center for Naval Analyses (June 2016), cna.org. 15 For discussion see Major Tiffany Werner, “China’s Demographic Disaster: Risk And Opportunity,” 2020, Defense Technical Information Center, discover.dtic.mil.