Inflation/Deflation

This week I have been holding client calls and roundtables with clients located in the EMEA region. In next week’s report we will share our answers to the most common client questions. In the meantime, this week we are sending you a report about Peru that discusses the political situation and the outlook for the nation’s financial markets. Best regards, Arthur Budaghyan Highlights Do not bottom fish in Peruvian financial markets. Political volatility has not yet reached its apex. Clashes between the government and congress are inevitable. Either president Pedro Castillo will be impeached and massive protest will follow, or his party’s radical leftist agenda will be at least partially legislated. Neither scenario bodes well for Peru’s financial markets. Capital outflows and lower metal prices pose a threat to the exchange rate. Go short the sol versus the US dollar. Dedicated EM equity and fixed-income managers should continue underweighting Peru in their respective portfolios. Feature Chart 1Peru: Absolute And Relative Equity Performance
Peru: Approaching A Boiling Point
Peru: Approaching A Boiling Point
Peru’s financial assets have plummeted due to the election of left-wing president Pedro Castillo. Some investors may be tempted to bottom fish in these markets due to their lower valuations and oversold conditions (Chart 1, top panel). Some may attempt to draw parallels with Brazil’s 2002 election of Lula da Silva which initially triggered a selloff in Brazilian financial markets followed by a substantial rally during the president’s two terms in office. Will that be the case with Peruvian markets? We do not think so. Unlike twenty years ago in Brazil, Peru is currently facing a much worse political and economic outlook. Overall, the political volatility as well as deteriorating macro fundamentals warrant a higher risk premium on Peruvian assets. Thus, we recommend investors underweight Peru within EM equity, local, and sovereign fixed-income portfolios (Chart 1, bottom panel). A Political Showdown Is Looming One could argue that Peruvian financial markets have hit a floor and that much of the bad news has already been priced. Another argument is that Castillo will not be able to pass sweeping socio-economic reforms because of strong opposition from congress. In our opinion, Peru has yet to reach peak political tensions, which may very well end with a bang. Given this heightened political uncertainty, investors should brace themselves for a rocky ride. We identify two main risks plaguing Peruvian politics. First, the unsustainable ideological divide within Castillo’s proposed cabinet between far-left militants and the pragmatic center-left. Second, the looming clash between a government that wants to upend the country’s socioeconomic system and a notoriously harsh congress keen on making the president’s job unbearable. Intra-Government Dichotomy The ideological divide in Castillo’s government is extreme. On one side is the Marxist-Leninist wing, headed by Free Peru’s party leader, Vladimir Cerrón, and prime minister candidate, Guido Bellido. On the other side is the left-to-center members, headed by Pedro Francke, the minister of finance candidate. The more extremist Marxist-Leninist camp constitutes the majority, while moderates are a minority. Critically, the Marxist-Leninist radicals will make few concessions to the moderate ministers, as the former believe they have a mandate from the people to upend the country’s socio-economic system. Nevertheless, the policies supported by the general public are more nuanced than that. According to a national Ipsos survey from August, 85% of respondents believe president Castillo should govern with technocrats in his governments’ key positions. Only 11% support him making the ideology of his party the centerpiece of his policies and promoting (radical) members of his party. This shows how Castillo’s victory was more of a national referendum against Fujimori and the corrupt political elites than support for a radical socialist government. We elaborated on this topic in our previous report on Peru. The wide ideological divide between the party and a few moderate members of the cabinet in key positions will make governing extremely difficult. Cracks are already beginning to form. Bellido and Francke hold different views on the role of the state in the economy. Bellido, on the one hand, has stated he supports state-owned companies in commodity-extracting sectors (particularly natural gas and hydroelectricity) and the drafting of a new constitution to give the state greater ownership of mining contracts. Francke, on the other hand, wants to reinstate fiscal spending caps and is less harsh with multinational companies, favoring an increase only in mining taxes. Furthermore, there is significant uncertainty around the government’s official fiscal plan, as Francke has avoided giving clear figures on fiscal expenditures and social programs. To make matters worse, there is growing concern that it is party leader Cerrón who is de facto in charge, and that he has an enormous influence on Castillo. Cerrón is unpopular among voters as a result of his criminal allegations, close ties to the Cuban regime, and often apologetic stance toward the Maoist terrorist group, Shining Path. Although he intended to run as the presidential candidate for Free Peru, he was banned from the election because of ongoing criminal accusations, which is why he handpicked Castillo as his replacement. Without a doubt, he intends to be heavily involved in government decision-making. According to the same Ipsos poll we cited earlier, 61% of Peruvians believe Cerrón is either de facto in charge of the government or holds considerable sway over Castillo. The biggest risk to financial markets will be the eventual dismissal or resignation of finance minister Francke. This may happen as he eventually realizes that the radicals will concede very little. This would also lead to a resignation of orthodox central bank governor Julio Velarde, who Francke has been able to convince to remain in his post. These two resignations would result in another riot in Peruvian markets, as the investment and business communities fully lose confidence in Castillo’s government. An Inevitable Clash Between The Government And Congress Being president in Peru is a notoriously difficult job due to the large sway that congress has on legislation and governing. The outcome of this constant confrontation between the president and congress has been five different presidents in the past five years alone. Critically, this tension has never been higher. The government and congress hold diametrically opposed views on the broad vision and strategy for the nation and how the economy should be managed. On the one hand, congress is mainly composed of traditional centrist parties and the opposition holds a majority—Castillo’s coalition has only about 39% of the seats. On the other hand, the government has just been elected on a far-left reformist platform. In essence, both the government and congress have incentives and the determination to be as obstructive as possible for each other. As tensions ramp up and confrontation becomes inevitable, the risks of unrest and clashes between supporters of Castillo and congress will rise. Table 1Peru: Voters Support More Moderate Politicians
Peru: Approaching A Boiling Point
Peru: Approaching A Boiling Point
In congress’s point of view, they have a mandate to serve as an opposing force to Castillo’s radicalism: There is some validity to this claim. The opposition holds a majority, and congress president Maricarmen Alva is by far more popular than the leaders of the Free Peru party like Cerrón and Bellido (Table 1). Given that Castillo’s ideology is a threat to the nation’s current socio-economic model and, thereby, to the political establishment, the majority in congress would prefer to block all radical legislation, including the appointments of controversial cabinet members. In addition, they will use all manner of accusations and alleged linkages between cabinet members and Shining Path to impeach Castillo. Congress needs only 87 votes, which means they need to convince only eight members from the governing alliance to impeach Castillo. In turn, the government argues it was elected to upend the country’s status quo and confront the unpopular political elites: Critically, the president has the ability to dissolve congress after two votes of no confidence, thereby putting pressure on congress to abide by the government’s radical proposals. This latter point and the fact that congress has little popular support provide leverage for the government over congress. Given the fact that current congressional members cannot be reelected, they might be more careful about how they maneuver, so that they do not provoke Castillo to dissolve congress. There are, therefore, two extreme possible outcomes. On one hand, congress may impeach the president, triggering a social revolt from Castillo’s hardline supporters against congress. On the other hand, congressional members may allow the passing of a leftist legislative agenda in order to maintain their seats, which would gravely reduce corporate profitability and productivity in Peru. Both scenarios would result in a collapse of investor and business confidence, leading to more capital flight and a riot in Peruvian financial markets. Bottom Line: Political volatility in Peru has not yet reached its apex. Clashes between the government and congress are inevitable, as well as among key cabinet members. Such elevated political volatility warrants a higher risk premium on Peruvian assets. Return Of Macro Instability Peru enjoyed a period of relative macro stability from the early 2000s until recently. Its currency, local interest rates, and sovereign spreads have fluctuated less than those in other Latin American countries. However, the nation’s economy and financial markets have entered a period of heightened volatility. Both domestic and external macro factors have turned into headwinds for the Peruvian economy and financial markets. Chart 2Peru: Business Confidence Will Continue Plummeting
Peru: Approaching A Boiling Point
Peru: Approaching A Boiling Point
Domestically, the economic recovery has been uninspiring, and multiple indicators point to growth disappointments ahead: Business confidence took another serious hit with the election of Castillo and ensuing uncertainty (Chart 2). Imminent political volatility will further depress business confidence, and, consequently, capital expenditures and hiring in the coming months. This will curb household income growth and consumer spending. Peru remains one of the world’s deadliest COVID-19 hotspots (Chart 3, top panel). In addition, vaccination rates are the lowest among major Latin American economies (Chart 3, bottom panel). As the more infectious Delta variant becomes dominant, there will not be enough immunity to hold back new cases. Consequently, either the government will introduce lockdowns or people will voluntarily limit their activities, thereby inhibiting the nascent economic recovery. The unemployment rate remains far above its pre-pandemic level (Chart 4). Thus, household income remains very depressed. The latter does not bode well for debtors’ ability to service debt. Chart 3Peru: The Government Has Grossly Mismanaged The Pandemic
Peru: Approaching A Boiling Point
Peru: Approaching A Boiling Point
Chart 4Peru: Labor Market Has Not Fully Recovered
Peru: Approaching A Boiling Point
Peru: Approaching A Boiling Point
As a result, loan delinquencies will rise anew, weighing on banks’ appetite to lend. Notably, local currency loans to the private sector will contract (Chart 5). Chart 5Peru: Prepare For A Credit Slump
Peru: Approaching A Boiling Point
Peru: Approaching A Boiling Point
Commercial banking profitability is also vulnerable, as president Castillo aims to strengthen the state bank (Banco de la Nación) by expanding its operations and undercutting private banking fees. Given financials of the bourse’s market cap, poor banking profitability is a major risk to this stock market. Unrelenting currency depreciation—see below for a more detailed analysis of the exchange rate—will prompt the central bank to hike rates further. This will not only weigh on new credit demand, but also augment loan delinquencies in the banking system. As a result, banks will become very risk averse and shrink their balance sheets. A credit crunch will ensue. Even though fiscal spending will be increased, it is unlikely to propel economic growth. The basis is that fiscal primary spending accounted for less than 15% of GDP before the pandemic and is now 17% due to the pandemic distortion (Chart 6). In the meantime, consumer spending constitutes 63% of GDP, capital spending 21%, and exports 25%. Externally, deteriorating balance of payments dynamics will weigh down on the currency: Peruvian assets tend to move with the country’s trade balance and global metal prices. The fact that Peruvian stock prices have plummeted in the face of rising industrial and precious metal prices supports a bearish thesis on this bourse (Chart 7). Chart 6Peru: Fiscal Expenditures Have Risen Due To The Pandemic
Peru: Approaching A Boiling Point
Peru: Approaching A Boiling Point
Chart 7Rising Metal Prices Have Failed To Boost Peruvian Stocks
Peru: Approaching A Boiling Point
Peru: Approaching A Boiling Point
Chart 8China's Slowdown Portends A Fall In Commodities
Peru: Approaching A Boiling Point
Peru: Approaching A Boiling Point
Export revenue will contract as a result of a decline in commodity prices brought on by China’s slowing “old economy” (Chart 8). Precious and industrial metals together account for 66% of Peru’s merchandise exports. A meaningful decline in metal prices will erode the trade surplus and weigh on the exchange rate. Furthermore, Peru is already experiencing capital flight. Potential anti-market policies from this government could trigger more capital exodus. The capital account deficit will widen as both FDI and portfolio inflows fall due to the negative commodity outlook as well as political uncertainty (Chart 9). Foreigners still hold 45% of local currency bonds, and they will reduce their holdings (Chart 10). Chart 9Peru: FDI Inflows Will Decline
Peru: Approaching A Boiling Point
Peru: Approaching A Boiling Point
Chart 10Peruvian Domestic Bonds: Will Banks Make Up For Foreign Investor Retrenchment?
Peru: Approaching A Boiling Point
Peru: Approaching A Boiling Point
Chart 11Peru: The Dollarization Rate Has Room To Rise
Peru: Approaching A Boiling Point
Peru: Approaching A Boiling Point
Currency depreciation will also be reinforced by locals converting their sol deposits into foreign currency. The dollarization rate—the ratio of foreign currency banking deposits to total deposits—will rise (Chart 11). A weakening currency will also lead to higher inflation expectations, to which the central bank will respond by raising rates. The monetary authorities already hiked the policy rate by 25 basis points this month due to higher-than-expected inflation and a rapidly depreciating currency. As Peru’s exchange rate continues to weaken, the central bank might also sell foreign currency reserves to prevent large fluctuations in the value of the currency. This foreign exchange intervention will, in turn, shrink banking system local currency liquidity and lift interbank rates (Chart 12). Chart 12FX Reserve Sales Will Shrink Banking Liquidity And Lift Interbank Rates
Peru: Approaching A Boiling Point
Peru: Approaching A Boiling Point
In short, the central bank has enough international reserves to stabilize the exchange rate, but this will come at the cost of tighter liquidity and higher interest rates. The latter will only reinforce sluggish growth in domestic demand. Bottom Line: Heightened political volatility and lower metal prices are working against the Peruvian economy and its financial markets. Peru is experiencing large capital flight, which will exacerbate currency depreciation. Investment Recommendations Keep an underweight allocation to the Peruvian bourse within an EM equity portfolio. We recommend currency traders go short the Peruvian sol versus the US dollar. While the sol has already depreciated considerably, the domestic and external headwinds entail more downside. For fixed-income investors, we maintain an underweight allocation to Peruvian sovereign credit in an EM credit portfolio. The basis for this position is that the nation’s fiscal policy may undergo a major shift, entailing larger fiscal spending and wider budget deficits. We are downgrading local bonds from neutral to underweight in an EM domestic bond portfolio. Critically, the share of foreign ownership of Peruvian local fixed income remains one of the highest in the EM universe—it has only fallen from around 55% to 45% of domestic fixed-income instruments in the past six months (Chart 10 on page 9). Thus, there is a major risk that foreign investors will sell domestic bonds as the currency depreciates further, which will weigh down on local bonds. Juan Egaña Research Analyst juane@bcaresearch.com Footnotes
Highlights The post-pandemic investment phase is just a continuation of the post-credit boom investment phase. This is because the pandemic has just accelerated the pre-existing shifts to a more remote way of working, shopping and interacting as well as the de-carbonisation of the economy. Combined with no new credit boom, these ongoing trends will structurally weigh on the profits of old economy sectors, consumer prices, and bond yields. At the same time, these trends are a continuing structural tailwind for the profits in those sectors that facilitate the shift to a more digital and cleaner world. Our high-conviction recommendation is to stay structurally overweight growth sectors versus old economy sectors… …and to stay structurally overweight the US stock market versus the non-US stock market. Fractal analysis: PLN/USD, Hungary versus Emerging Markets, and sugar versus soybeans. Feature Chart of the WeekUS And Non-US Profits Go Their Starkly Separate Ways
US And Non-US Profits Go Their Starkly Separate Ways
US And Non-US Profits Go Their Starkly Separate Ways
Many people use the US stock market as a proxy for the world stock market. Intuitively, this makes sense, because the US stock market is the largest in the world, and the S&P 500 and Dow Jones Industrials are well-known indexes that we can monitor in real time. In contrast, world equity indexes such as the MSCI All Country World are less familiar and do not move in real time. Yet to use the US stock market as a proxy for the world stock market is a mistake. Although the US comprises makes up half of the world stock market capitalisation, the other half is so different – the non-US yan to the US yin – that the US cannot represent the world. As we will now illustrate. US Profits Have Doubled While Non-US Profits Have Shrunk Over the past ten years, US and non-US stock market profits have gone their starkly separate ways. While US profits have nearly doubled, non-US profits languish 10 percent below where they were in 2011! (Chart of the Week) While US profits have nearly doubled, non-US profits languish 10 percent below where they were in 2011. Of course, in any comparison of this sort, a key issue is the starting point. In this first part of our analysis, we are defining the starting point as the point at which profits had recouped all their global financial crisis losses. For both US and non-US profits this point was in March 2011 (Chart I-2 and Chart I-3). Chart I-2Comparing Profit Growth Since The Full Recovery From The Financial Crisis
Comparing Profit Growth Since The Full Recovery From The Financial Crisis
Comparing Profit Growth Since The Full Recovery From The Financial Crisis
Chart I-3Comparing Valuation Expansion Since The Full Recovery From The Financial Crisis
Comparing Valuation Expansion Since The Full Recovery From The Financial Crisis
Comparing Valuation Expansion Since The Full Recovery From The Financial Crisis
Because the issue of the starting point of the analysis is contentious, we will look at a much earlier starting point later in the report. But first, here are the decompositions of the US and non-US stock market moves from March 2011. US stock market profits are up 93 percent, while the multiple paid for those profits (valuation) is up 75 percent. Compounding to a total price gain of 235 percent (Chart I-4). Chart I-4US Profits Up 93 Percent, Valuation Up 75 Percent
US Profits Up 93 Percent, Valuation Up 75 Percent
US Profits Up 93 Percent, Valuation Up 75 Percent
Non-US stock market profits are down -9 percent, while the multiple paid for those profits is up 38 percent. Compounding to a total price gain of a measly 25 percent (Chart I-5). Chart I-5Non-US Profits Down -9 Percent, Valuation Up 38 Percent
Non-US Profits Down -9 Percent, Valuation Up 38 Percent
Non-US Profits Down -9 Percent, Valuation Up 38 Percent
The aggregate world stock market profits are up 24 percent, while the multiple paid for those profits is up 57 percent. Compounding to a total price gain of 94 percent (Chart I-6). Chart I-6World Profits Up 24 Percent, Valuation Up 57 Percent
World Profits Up 24 Percent, Valuation Up 57 Percent
World Profits Up 24 Percent, Valuation Up 57 Percent
The Post-Credit Boom Phase Favours The US Over The Non-US Stock Market In the post-credit boom phase, several important features of stock market performance are worth highlighting. In absolute terms, valuation expansion has lifted US stocks by twice as much as non-US stocks, 75 percent versus 38 percent. Yet even the 75 percent expansion in the US stock market valuation has played second fiddle to the 93 percent expansion in US stock market profits. Absent valuation expansion, non-US stocks would stand lower today than in 2011. But for non-US stocks, whose structural profit growth has been non-existent, valuation expansion has been the only instrument for structural gains. Indeed, absent valuation expansion, non-US stocks would stand lower today than in 2011. And absent valuation expansion at a world level, the world stock market would lose three quarters of its ten-year gain. What can explain the startling performance differential between US and non-US stocks on both profit and valuation expansions? As we have argued before, most of the difference does not come from the underlying (US versus non-US) economies, but instead comes from the company and sector compositions of the stock markets. The US stock market is heavily over-weighted to global growth companies and sectors – such as technology and healthcare (Chart I-7) – which, by definition, have experienced structural growth in their profits. In contrast, the non-US stock market is heavily over-weighted to global old economy companies and sectors – such as financials, energy, and resources (Chart I-8) – whose profits have stagnated, or entered structural downtrends (Chart I-9). Chart I-7The US Stock Market Is Heavily Over-Weighted To Growth Sectors
The US Stock Market Is Heavily Over-Weighted To Growth Sectors
The US Stock Market Is Heavily Over-Weighted To Growth Sectors
Chart I-8The Non-US Stock Market Is Heavily Over-Weighted To Old Economy Sectors
The Non-US Stock Market Is Heavily Over-Weighted To Old Economy Sectors
The Non-US Stock Market Is Heavily Over-Weighted To Old Economy Sectors
Chart I-9Old Economy Sector Profits Have Gone Nowhere
Old Economy Sector Profits Have Gone Nowhere
Old Economy Sector Profits Have Gone Nowhere
At the same time, when bond yields decline, companies whose profits are growing (and time-weighted into the distant future) see a greater increase in their net present values. Hence, companies in the global growth sectors have experienced a larger valuation expansion than those in the old economy sectors. In this way, the US stock market has outperformed the non-US stock market on both profit growth and valuation expansion. The key question is, will these post-credit boom trends continue? The answer depends on whether the post-pandemic world marks a new phase for investment, or whether it is just a continuation of the post-credit boom phase. The Post-Pandemic Phase Is A Continuation Of The Post-Credit Boom Phase Let’s now address the issue of the starting point of our analysis by panning out to 1990. This bigger picture from 1990 shows three distinct phases for investors (Chart I-10 and Chart I-11). Chart I-10Since 1990, There Have Been Three Distinct Investment Phases
Since 1990, There Have Been Three Distinct Investment Phases
Since 1990, There Have Been Three Distinct Investment Phases
Chart I-11The Post-Pandemic Investment Phase Is A Continuation Of The Post-Credit Boom Phase
The Post-Pandemic Investment Phase Is A Continuation Of The Post-Credit Boom Phase
The Post-Pandemic Investment Phase Is A Continuation Of The Post-Credit Boom Phase
The first phase was the 1990s build-up to the dot com boom. This phase clearly favoured growth sectors, and thereby the US stock market versus the non-US stock market. The second phase was the early 2000s credit boom. This phase clearly favoured sectors that facilitated the credit boom or benefited from its spending – notably, the old economy sectors of financials, energy, and resources. Thereby it favoured the non-US stock market versus the US stock market. The third and most recent phase is the post-credit boom phase. This phase has flipped the leadership back to growth sectors as the absence of structural credit growth has stifled financials as well as the capital-intensive old economy sectors that had previously benefited from the credit boom. Additionally, the structural disinflation that has comes from weak credit growth has dragged down bond yields and – as already discussed – given a much bigger boost to growth sector valuations. Since 1990, there have been three distinct phases for investors: the dot com boom; the credit boom; and the post-credit boom. Now we come to the key question. Did 2020 mark the end of the post-credit boom phase and the start of a new ‘post-pandemic’ phase? On the evidence so far, the answer is an emphatic no. Crucially, there is no new credit boom. A still highly indebted private sector is neither willing nor able to borrow. And although public sector debt surged during the pandemic, governments are now keen to temper or rein in deficits. In any case, Japan teaches us that government borrowing – which is bond rather than bank financed – does nothing for the banks or the broader financial sector. An equally important question is, has the pandemic reversed the societal and economic trends of the post-credit boom phase? The answer is no. Quite the contrary, the pandemic has accelerated the pre-existing shifts to a more remote way of working, shopping and interacting as well as the de-carbonisation of the economy. Combined with no new credit boom, these ongoing trends are structurally disinflationary for the profits of old economy sectors as well as for consumer prices. Thereby, they will continue to weigh on bond yields. At the same time, the trends are a continuing structural tailwind for the profits in those sectors that facilitate and enable the shift to a more digital and cleaner world. While we are open to the evolving evidence, the post-pandemic investment phase seems an extension of the post-credit boom phase. This means that structurally, there is no reason to flip out of growth sectors back to old economy sectors. It also means that structurally, there is no reason to switch from US to non-US stocks. Fractal Analysis Update This week’s fractal analysis highlights three potential countertrend moves based on fragile fractal structures. First, the recent rally in the US dollar could meet near-term resistance given its weakening 65-day fractal structure. A good way of playing this would be long PLN/USD (Chart I-12). Chart I-12PLN/USD Could Rebound
PLN/USD Could Rebound
PLN/USD Could Rebound
Second, the strong outperformance of Hungary versus Emerging Markets – largely driven by one stock, OTP Bank – has become a crowded trade based on its 130-day fractal structure. This would suggest underweighting Hungary versus the Emerging Markets index (Chart I-13). Chart I-13Underweight Hungary Versus EM
Underweight Hungary Versus EM
Underweight Hungary Versus EM
Finally, the sugar price has skyrocketed as extreme weather has disrupted output in the world’s top producer, Brazil. Given that supply bottlenecks ultimately ease, a recommended trade would be to short sugar versus soybeans, using ICE versus CBOT futures contracts (Chart I-14). Set the profit target and symmetrical stop-loss at 8 percent. Chart I-14Short Sugar Versus Soybeans
Short Sugar Versus Soybeans
Short Sugar Versus Soybeans
Dhaval Joshi Chief Strategist dhaval@bcaresearch.com Fractal Trading System Fractal Trades 6-Month Recommendations Structural Recommendations Closed Fractal Trades Closed Trades Asset Performance Equity Market Performance Indicators To Watch - Bond Yields Indicators To Watch - Bond Yields ##br##- Euro Area
Indicators To Watch - Bond Yields - Euro Area
Indicators To Watch - Bond Yields - Euro Area
Indicators To Watch - Bond Yields ##br##- Europe Ex Euro Area
Indicators To Watch - Bond Yields - Europe Ex Euro Area
Indicators To Watch - Bond Yields - Europe Ex Euro Area
Indicators To Watch - Bond Yields ##br##- Asia
Indicators To Watch - Bond Yields - Asia
Indicators To Watch - Bond Yields - Asia
Indicators To Watch - Bond Yields ##br##- Other Developed
Indicators To Watch - Bond Yields - Other Developed
Indicators To Watch - Bond Yields - Other Developed
Indicators To Watch - Interest Rate Expectations Indicators To Watch - Interest Rate Expectations
Indicators To Watch - Interest Rate Expectations
Indicators To Watch - Interest Rate Expectations
Indicators To Watch - Interest Rate Expectations
Indicators To Watch - Interest Rate Expectations
Indicators To Watch - Interest Rate Expectations
Indicators To Watch - Interest Rate Expectations
Indicators To Watch - Interest Rate Expectations
Indicators To Watch - Interest Rate Expectations
Indicators To Watch - Interest Rate Expectations
Indicators To Watch - Interest Rate Expectations
Indicators To Watch - Interest Rate Expectations
Highlights The baht will depreciate further, given the state of the economy and external accounts. Domestic demand was already relapsing, even before the latest surge in COVID-19 cases. Now, the recovery will be delayed more. The authorities have little to offer by way of fiscal or monetary support. Credit to the job-intensive SME sector has collapsed. The balance of payment dynamics remains negative for the currency. Investors should stay short the baht. Dedicated EM asset allocators should continue to be neutral on Thailand within respective equity and domestic bond portfolios. Feature Chart 1Thai Stocks Are Facing Several Headwinds
Thailand: Stay Short The Baht
Thailand: Stay Short The Baht
Our negative view on the baht has played out as expected.1 The Thai currency is down 10% versus the dollar since its peak in February of this year. It has also been the worst performer in Asia. The country’s stock market is struggling and going down in both absolute terms and relative to their EM counterparts (Chart 1). Going forward, odds are that the baht will remain weak. A weak currency will continue to stifle both Thai stocks’ and local currency bonds’ relative performance. Investors should stay short the baht and remain neutral Thai equity and local currency bonds within their respective EM portfolios. Relapsing Growth Chart 2Surging New COVID-19 Cases...
Thailand: Stay Short The Baht
Thailand: Stay Short The Baht
The latest spike in new COVID-19 cases has dashed hopes for any early recovery of the Thai economy (Chart 2). Earlier this month, the central bank revised down their GDP forecast for 2021 from 1.8% to 0.7%. We concur with this bearish outlook: Private consumption in real terms was languishing as of June this year at 10% below 2019 levels. Car sales, both personal and commercial, are even more downbeat (Chart 3). After the latest surge in new COVID-19 cases, those numbers must have weakened further. Incidentally, the country’s vaccination rate, at 26% of total population (7.5% fully vaccinated), remains low. It could be, therefore, several months before any meaningful recovery in consumer demand takes place. Faced with low demand, the country’s manufacturing and shipment volumes are also weak. They are both breaking down anew from well below the 2019 levels (Chart 4, top panel). Chart 3...Will Further Delay Domestic Demand Recovery
Thailand: Stay Short The Baht
Thailand: Stay Short The Baht
Chart 4Manufacturers Are Saddled With High Inventory Amid Weak Orders...
Thailand: Stay Short The Baht
Thailand: Stay Short The Baht
Weak demand also means that businesses are stuck with high inventories. Indeed, there is a widening disparity between inventory levels and shipments (Chart 4, middle panel). Furthermore, order books have slipped back to levels not seen since the height of the COVID-19 scare early last year. The combination of high inventories and tumbling orders does not portend a manufacturing recovery anytime soon (Chart 4, bottom panel). Notably, jobs and wages are also weak. Employment in the manufacturing sector is well below pre-pandemic levels (Chart 5). This trend, in turn, is hurting household income and consumer demand, completing a vicious cycle of depressed demand, weak production, falling employment and household income, and further reduced demand. The softness of the economy is accentuating the disinflationary pressure that was already entrenched. Headline and core CPI in Thailand have stayed mostly below 1% over the past five years — the lower band of the central bank’s inflation target. Now, they are flirting with outright deflation. In fact, if the impact of food and oil prices is excluded, the prices are actually deflating (Chart 6). Chart 5...Which Is Hurting Jobs And Wage Growth
Thailand: Stay Short The Baht
Thailand: Stay Short The Baht
Chart 6Thailand Is Flirting With Outright Deflation...
Thailand: Stay Short The Baht
Thailand: Stay Short The Baht
Outright deflation makes it harder for borrowers to service their debts, which then discourages both borrowing and spending — making the recovery much harder. Notably, the banks’ prime lending rates remain high at 5.4%, which means real prime lending rates are quite steep at 5% (deflated by core CPI). This is at a time of very low household income and business revenue growth expectations. This trend is a strong disincentive for borrowing and consuming /capital spending. Little Policy Support What is more concerning for the economy is that policymakers can offer little to boost the economy. Fiscal stimulus has waned: government expenditure, after a surge last year, is now contracting (Chart 7). The budget proposal for the next fiscal year (October 2021 - September 2022) that was passed by the parliament in June 2021 (first reading)2 stipulates a 5.7% cut in nominal spending. Part of the reason is that fiscal deficits have already ballooned to a staggering 8% of GDP — from an average of 2.5% in the past ten years. The IMF estimates that the fiscal thrust will be zero this year, and a negative 2.4% of GDP in 2022 (Chart 7, bottom panel). The monetary policy transmission is also paralyzed. Despite easing by the Bank of Thailand — the policy rate is at an all-time low of 0.5% since May last year — credit growth is dismal. Lenders are wary of rising NPLs and are holding back new credit: The share of impaired loans (NPLs plus Special Mention Loans) of total bank loans has dramatically increased to 10%. In the case of small and medium enterprises (SMEs), that ratio is 20%. By comparison, loss provisions are much lower, at just 5.2% as of June of this year (Chart 8, top panel). Chart 7...Yet, The Government Is Planning To Cut Fiscal Spending
Thailand: Stay Short The Baht
Thailand: Stay Short The Baht
Chart 8Sharp Rise In Banks' Stressed Loans Amid Tanking Profits...
Thailand: Stay Short The Baht
Thailand: Stay Short The Baht
Notably, both operating and net profits of banks had already halved (as a % of assets) by June 2021 — as both interest and non-interest incomes dropped. Profits are slated to contract further, since banks will have to make greater provisions in the future as the recent surge in new cases will produce more loan delinquencies (Chart 8, bottom panel). The specter of rising NPLs has prompted banks to retrench loans. In particular, bank credit to SMEs has plunged by a massive 34% from 2019 levels (Chart 9). Before the pandemic, banks’ SME loans made up a significant 30% of GDP. Now, they are down to 21%. Credit retrenchment of this order to the job-intensive SME sector is going to have a significant negative ripple effect. Employment will shrink further as small businesses go bust. Shrinking jobs will dent household income, and, in turn, consumer demand. Incidentally, loans to other business segments are also not rising much. Bank loans to all non-financial corporates are growing rather minimally, at 1.5% year-over-year. Going into the pandemic, the Thai household sector was already highly leveraged. Over the past two decades, banks and other financial institutions have been lending ever more to households, shunning non-financial corporates. Households’ borrowing from banks have now risen to 40% of GDP; and those from other institutions another 50%. These loans had helped boost consumer demand all those years, but now, at a time when incomes are uncertain, households have very limited appetite to borrow more to spend. This means a consumer debt-fueled demand recovery is not in the cards (Chart 10). Chart 9...Induced Banks To Massively Reduce Credit To The Job-Intensive SME Sector
Thailand: Stay Short The Baht
Thailand: Stay Short The Baht
Chart 10Thai Households Are Too Indebted To Borrow More And Spend
Thailand: Stay Short The Baht
Thailand: Stay Short The Baht
In brief, Thai businesses are in the middle of a toxic combination of contracting sales, absent fiscal support, slashed credit facilities, and rather high borrowing costs in real terms. Chart 11 shows that corporate profit margins of non-financial firms are struggling at a low level. It is no wonder that businesses are reluctant to invest, expand, and hire. The message is similar when we examined all companies included in the MSCI Thailand stock index. On the one hand, their EPS has fallen to 10-year lows. Thai stock prices, on the other hand, have not yet fallen as much as the shrinking EPS would imply (Chart 12, top panel). The consequence is that the valuations are remarkably stretched—near a 20-year high (Chart 12, bottom panel). Chart 11Low Margins Are Discouraging Thai Firms To Borrow, Invest, Or Hire
Thailand: Stay Short The Baht
Thailand: Stay Short The Baht
Chart 12Thai Profits, At A Decade-Low, Are Also A Headwind For Stock Prices
Thailand: Stay Short The Baht
Thailand: Stay Short The Baht
All in all, for Thai share prices to stage a sustainable rally, an economic recovery is essential. The first indications of that usually come from an improving order book. The latter currently shows little glimmer of hope. But investors should keep an eye on this indicator, as Thai stocks’ performance is geared to the ebbs and flows of the business order book (Chart 13). Thailand Needs A Weaker Currency The state of the Thai economy not only warrants exchange rate depreciation, but also needs a much weaker currency to help an economic recovery. The country’s balance of payment is in deficit — for the first time since 2014. A crucial reason is that the baht is still expensive, which continues to weigh on exports. Of all the export-oriented Asian economies, Thai exports recovery has been the weakest (Chart 14). Chart 13Keep An Eye On The Order Book For A Sign In Stock Recovery
Thailand: Stay Short The Baht
Thailand: Stay Short The Baht
Chart 14An Expensive Baht Held Back Thai Exports Recovery
Thailand: Stay Short The Baht
Thailand: Stay Short The Baht
The fact that a quarter of Thai exports go to other ASEAN countries — where demand has been and remains weak due to the lingering pandemic — doesn’t help either. As a result, the Thai trade surplus has narrowed significantly, and the current account has slipped into deficit (Chart 15, top and middle panels). The other main external revenue source of Thailand, tourism, continues to be near absent at 0.6% of GDP — a far cry from a high of 12% before the pandemic (Chart 15, bottom panel). What’s more, there is little hope of any recovery in the near future. The government now expects the number of foreign tourists this year to be as low as 0.3 million versus 40 million in 2019. On the capital account front, Thailand continues to hemorrhage both FDI and portfolio capital — just as it did the past several years. Despite that, the baht had remained strong until early this year, as a result of a substantial repatriation of bank deposits by Thai residents and, to a lesser extent, foreign borrowings. Those inflows prevented the Thai baht from depreciating. But such panic-stricken, one-off savings/deposit repatriations by Thai residents will certainly slow materially going forward (Chart 16). Chart 15The Thai Current Account Balance Will Struggle To Stay In Surplus...
Thailand: Stay Short The Baht
Thailand: Stay Short The Baht
Chart 16...While The Capital Account Balance Will Slip Deeper Into Deficit...
Thailand: Stay Short The Baht
Thailand: Stay Short The Baht
There’s also little hope that FDI and portfolio inflows will pick up the slack. The reason is that the Thai economy is very weak and the return on capital is low. The latter discourages capital inflows. The fact that the baht continues to be an expensive currency in real terms, and therefore not as competitive as some of its neighbors’, doesn’t help either. The multi-nationals who are planning to re-locate out of China might find some other countries — where the currency is more competitive (such as in India, Malaysia, or the Philippines) — more attractive. Overall, the Thai capital account balance will likely slide deeper into deficit, at a time when the current account will also struggle to stay in surplus. The result will be a further deterioration in the country’s balance of payment, hurting the baht (Chart 17). Considered from another angle, if the return on capital on Thai assets is any guide, the baht could drop much more from its current levels (Chart 18). Chart 17...Putting Downward Pressure On The Baht
Thailand: Stay Short The Baht
Thailand: Stay Short The Baht
Chart 18Thai Firms' Low Rates Of Return Point To More Baht Depreciation
Thailand: Stay Short The Baht
Thailand: Stay Short The Baht
The reality is that, given Thailand’s current macro backdrop, a cheaper currency is what the nation needs. That will help boost growth significantly by aiding exports and promoting import substitution. Since foreign trade makes up an impressive 90% of GDP, a boost therein could kickstart the entire economy. Another result of a weaker currency will be higher inflation, something the economy seriously needs. Higher inflation will contribute to lower real interest rates which, in turn, will encourage borrowing and spending. Higher spending and inflation will help achieve higher nominal sales, boost firms’ profits, employment, and eventually, household incomes. All in all, it could allow a productive cycle to unfold. Given all these possible benefits and given that policymakers have few other tools at their disposal at this juncture, chances are the central bank will let the baht depreciate more, albeit in an orderly fashion, in the months to come. What About Bonds? Chart 19Mantain A Neutral Allocation To Thai Domestic Bonds In An EM Basket
Thailand: Stay Short The Baht
Thailand: Stay Short The Baht
Thai local currency bonds’ absolute return in US dollar terms, as expected, is highly dependent on the exchange rate (Chart 19, top panel). Given the weak currency outlook, foreign investors should refrain from holding Thai domestic bonds outright. For foreign asset allocators, however, the matter is more nuanced. Thai domestic bonds’ relative return versus that of overall EM did not depend on the baht movement alone. This is because Thailand has been a defensive market owing to the following: a traditionally strong current account, a manageable public debt (now 47% of GDP), and a relatively low holding of bonds by foreign investors (now 12% of total). A robust current account surplus for years meant that during periods of negative growth shocks, the baht often fell less than many other EM currencies — that is, in periods of distress, the baht helped boost the relative performance of Thai bonds vis-à-vis overall EM bonds in US dollar terms. Those periods of distress also saw Thai bond yields fall as the central bank was able to cut rates due to low inflation. In addition, during those periods, local investors moved from equities to government bonds. Since the holdings of local bond investors far outweighed those of foreign investors, Thai bond yields managed to go down, even when some foreign investors dumped EM and Thai domestic bonds. As a result of these factors, Thai bonds outperformed their EM counterparts during the commodity/EM slowdown in 2014-15, and again at the height of the COVID-19-scare in early 2020 — even though the baht fell versus the US dollar during those periods (Chart 19, middle panel). All that said, the reality in the ground has changed somewhat since early last year. The Thai current account is no longer in surplus, and, given the dismal tourism outlook and slowing trade surplus, it will probably stay that way for the foreseeable future. That will keep the baht relatively weak weighing on Thai bonds’ relative performance versus their EM peers. On the other hand, the grim outlook of the Thai economy and looming deflation risk means that Thai bond yields could fall going forward relative to their EM counterparts. That will be a tailwind for Thai domestic bonds’ relative outperformance versus their EM counterparts. There is, therefore, a good chance that the headwind from a relatively weaker baht could be somewhat compensated for by a drop in Thai local yields versus their EM peers. Indeed, the periods of the baht’s weakness usually coincided with Thai bonds’ relative yield compression (Chart 19, bottom panel). This calls for a neutral outlook for relative bond performance going forward. Investment Conclusions Currency: The baht outlook remains precarious. Investors would do well to remain short the baht versus the US dollar. Domestic Bonds: Thai bond yields will go down. The Bank of Thailand will have no choice but to cut rates further. Local investors should stay long bonds. For international dedicated EM fixed-income portfolios, we downgraded Thai bonds in February of this year, from overweight to neutral in an EM bond portfolio, in view of the impending baht weakness. That turned out to be a good decision. Going forward, investors should continue to have a neutral allocation on Thai bonds, as the headwind from the baht will be mitigated by the tailwind from relative bond yield compression. Foreign absolute-return investors, however, should avoid Thai bonds in view of expected currency depreciation. Chart 20A Vulnerable Baht Will Keep Foreign Equity Investors Away
Thailand: Stay Short The Baht
Thailand: Stay Short The Baht
Stocks: A struggling economy offers little hope for corporate margins or profits recovery soon. A vulnerable currency makes Thai stocks even less appealing to foreign investors. Without their participation, it will be hard for this market to rise sustainably in absolute terms or outperform their EM counterparts (Chart 20). Thai equities are not cheap either: the P/Book ratio is at par with EM. That said, given the Thai market’s already very steep underperformance versus the EM equity benchmark, from a portfolio strategy point of view, we recommend investors stay neutral this market within an EM equity portfolio. Rajeeb Pramanik Senior EM Strategist rajeeb.pramanik@bcaresearch.com Footnotes 1 Please refer to the EMS report “Thailand: Beset By A Vulnerable Baht,” dated February 24, 2021. 2 The budget bill has to pass the second and third readings expected in August before it goes for senate and royal approval.
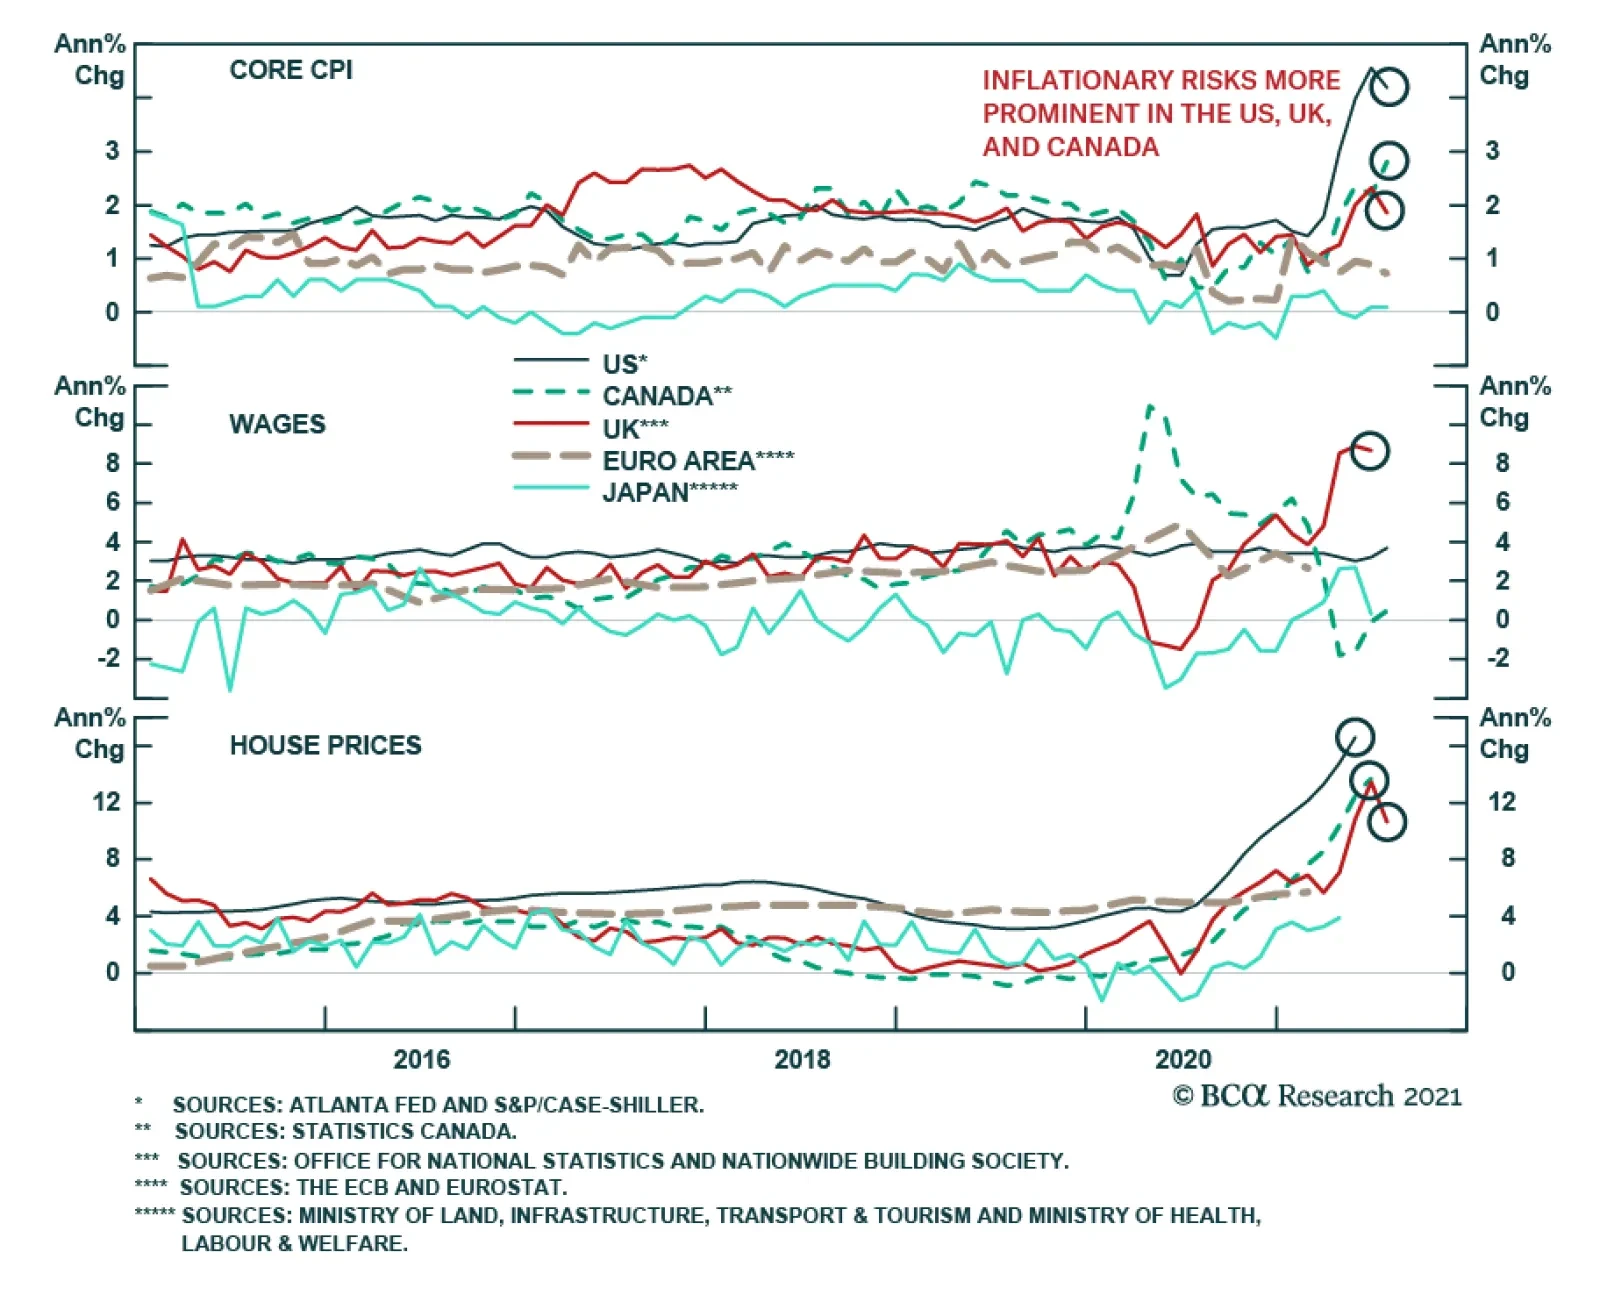
Canadian, UK, and Euro Area CPI prints for July were released on Tuesday. The UK’s core CPI grew 1.8% y/y and Canada’s three core measures average 2.5% y/y. Meanwhile, the Euro Area faces relatively mute core inflation at 0.7% y/y. This reflects the broader…
Dear Client, This week, the US Bond Strategy service is hosting its Quarterly Webcast (August 17 at 10:00 AM EDT, 15:00 PM BST, 16:00 PM CEST and August 18 at 9:00 HKT, 11:00 AEST). In addition, we are sending this Quarterly Chartpack that provides a recap of our key recommendations and some charts related to those recommendations and other areas of interest for US bond investors. Please tune in to the Webcast and browse the Chartpack at your leisure, and do let us know if you have any questions or other feedback. To view the Quarterly Chartpack PDF please click here. Scheduling Note: There will be no US Bond Strategy report next week. The following week (August 31), clients will receive a report written by our Global Fixed Income Strategist Rob Robis. The regular US Bond Strategy publication schedule will resume on September 8 with the publication of September’s Portfolio Allocation Summary. Best regards, Ryan Swift, US Bond Strategist
Highlights Going into the new crop year, we expect the course of the broad trade-weighted USD to dictate the path taken by grain and bean prices (Chart of the Week). Higher corn stocks in the coming crop year, flat wheat stocks and lower rice stocks will leave grain markets mostly balanced vs the current crop year. Soybean stocks and carryover estimates from the USDA and International Grains Council (IGC) are essentially unchanged year-on-year (y/y). In the IGC's estimates, changes in production, trade, and consumption for the major grains and beans largely offset each other, leaving carryovers unchanged. Supply-demand fundamentals leave our outlook for grains and beans neutral. This does not weaken our conviction that continued global weather volatility will tip the balance of price risk in grains and beans over the coming year to the upside. Our strategically bearish USD view also tips the balance of price risk in grains – and commodities generally – to the upside. We believe positioning for higher-volatility weather events and a lower US dollar is best done with index products like the S&P GSCI and the COMT ETF, which tracks a version of the GSCI optimized for backwardation. Feature Chart of the WeekUSD Will Drive Global Grain Markets
USD Will Drive Global Grain Markets
USD Will Drive Global Grain Markets
Chart 2Opening, Closing Grain Stocks Will Be Largely Unchanged
Global Grain, Bean Markets Balanced; USD Expected To Drive '21/22 Prices
Global Grain, Bean Markets Balanced; USD Expected To Drive '21/22 Prices
Going into the new crop year, opening and closing stocks are expected to remain flat overall vs the current crop years, with changes in production and consumption largely offsetting each other in grain and bean markets (Chart 2).1 This will leave overall prices a function of weather – which no one can predict – and the path taken by the USD over the coming year. The IGC's forecast calls for mostly unchanged production and consumption for grains and beans globally, with trade volumes mostly flat y/y. This leaves global end-of-crop-year carryover stocks essentially unchanged at 594mm tons. The USDA expects wheat ending stocks at the end of the '21/22 crop year up a slight 0.5%; rice down ~ 4.5%, and corn up ~ 4%. Below we go through each of the grain and bean fundamentals, and assess the impact of COVID-19 on global trade in these commodities. We then summarize our overall view for the grain and bean complex, and our positioning recommendations. Rice The IGC forecasts higher global rice production and consumption, and, since they expect both to change roughly by the same amount, ending stocks are projected to remain unchanged in the '21/22 crop year relative to the current year (Chart 3). The USDA, on the other hand, is expecting global production to increase by ~ 1mm MT in the new crop year, with consumption increasing by ~ 8mm MT. This leaves ending inventories for the new crop year just under 8mm MT below '20/21 ending stocks, or 4.5%. Chart 3Global Rice Balances Roughly Unchanged
Global Rice Balances Roughly Unchanged
Global Rice Balances Roughly Unchanged
Corn The IGC forecasts global corn production will rise 6.5% to a record high in the '21/22 crop year, while global consumption is expected to increase 3.6%. Trade volumes are expected to fall ~ 4.2%, leaving global carryover stocks roughly unchanged (Chart 4). In the USDA's modelling, global production is expected to rise 6.6% in the '21/22 crop year to 1,195mm MT, while consumption is projected to rise ~ 2.4% to 1,172mm MT. The Department expects ending balances to increase ~ 11mm MT, ending next year at 291.2mm MT, or just over 4% higher. Chart 4Corn Balances Y/Y Remain Flat
Corn Balances Y/Y Remain Flat
Corn Balances Y/Y Remain Flat
Wheat The IGC forecasts global wheat production in the current crop year will increase by ~ 16mm MT y/y, which will be a record if realized. Consumption is expected to rise 17mm MT, with trade roughly unchanged. This leaves expected carryover largely unchanged at ~ 280mm MT globally (Chart 5). The USDA's forecast largely agrees with the IGC's in its ending-stocks assessment for the new crop year. Global wheat production is expected to increase 16.6mm MT y/y in '21/22, and consumption will rise ~ 13mm MT, or 1.7% y/y. Ending stocks for the new crop year are expected to come in at just under 292mm MT, or 0.5% higher. Chart 5Ending Wheat Stocks Mostly Unchanged
Ending Wheat Stocks Mostly Unchanged
Ending Wheat Stocks Mostly Unchanged
Soybeans Both the IGC and USDA expect increases in soybean ending stocks for the '21/22 crop year. However, the USDA’s estimates for ending stocks are nearly double the IGC projections.2 We use the IGC's estimates in Chart 6 to depicts balances. USDA - 2021/22 global soybean ending stocks are set to increase by ~3 mm MT to 94.5 mm MT, as higher stocks from Brazil and Argentina are partly offset by lower Chinese inventories. US production is expected to make up more than 30% of total production, rising 6% year-on-year. Chart 6Higher Bean Production Meets Higher Consumption
Higher Bean Production Meets Higher Consumption
Higher Bean Production Meets Higher Consumption
Impact Of COVID-19 On Ags Trade Global agricultural trade was mostly stable throughout the COVID-19 pandemic. China was the main driver for this resilience, accounting for most of the increase in agricultural imports from 2019 to 2020. Ex-China, global agricultural trade growth was nearly zero. During this period, China was rebuilding its hog stocks after an outbreak of the African Swine Flu, which prompted the government to grant waivers on tariffs in key import sectors, which increased trade under the US-China Phase One agreement. As a result, apart from COVID-19, other factors were influencing trade. Arita et. al. (2021) attempted to isolate the impact of COVID on global agricultural trade.3 Their report found that COVID-19 – through infections and deaths – had a small impact on global agricultural trade. Government policy restrictions and reduced mobility in response to the pandemic were more detrimental to agricultural trade flows than the virus itself in terms of reducing aggregate demand. Policy restrictions and lower mobility reduced trade by ~ 10% and ~ 6% on average over the course of the year. Monthly USDA data shows that the pandemic was not as detrimental to agricultural trade as past events. Rates of decline in global merchandise trade were sharper during the Great Recession of 2007 – 2009 (Chart 7). Many agricultural commodities are necessities, which are income inelastic. Furthermore, shipping channels for these types of commodities did not require substantial human interactions, which reduced the chances of this trade being a transmission vector for the virus, when governments declared many industries using and producing agricultural commodities as necessities. This could explain why agricultural trade was spared by the pandemic. Amongst agricultural commodities, the impact of the pandemic was heterogenous. For necessities such as grains or oilseeds, there was a relatively small effect, and in few instances, trade actually grew. For example, trade in rice increased by ~4%. The value of trade in higher-end items, such as hides, Chart 7COVID-19 Spares Ag Trade
Global Grain, Bean Markets Balanced; USD Expected To Drive '21/22 Prices
Global Grain, Bean Markets Balanced; USD Expected To Drive '21/22 Prices
Chart 8Grains Rallied During Pandemic
Global Grain, Bean Markets Balanced; USD Expected To Drive '21/22 Prices
Global Grain, Bean Markets Balanced; USD Expected To Drive '21/22 Prices
tobacco, wine, and beer fell during the pandemic. This was further proof of the income inelasticity of many agricultural products which kept global trade in this sector resilient. Indeed, the UNCTAD estimates global trade for agriculture foods increased 18% in 1Q21 relative to 1Q19. Over this period, Bloomberg's spot grains index was up 47.08% (Chart 8). Investment Implications We remain neutral grains and beans based on our assessment of the new crop-year fundamentals. That said, we have a strong-conviction view global weather volatility will tip the balance of price risk in grains over the coming year to the upside. Our strategically bearish USD view also tips the balance of price risk in grains – and commodities generally – to the upside. Weather-induced grain and bean prices volatility is supportive for our recommendations in the S&P GSCI and the COMT ETF, which tracks a version of the GSCI optimized for backwardation. These positions are up 5.8% and 7.9% since inception, and are strategic holdings for us. Robert P. Ryan Chief Commodity & Energy Strategist rryan@bcaresearch.com Ashwin Shyam Research Associate Commodity & Energy Strategy ashwin.shyam@bcaresearch.com Commodities Round-Up Energy: Bullish US natural gas prices remain well supported by increased power-generation demand due to heat waves rolling through East and West coasts, lower domestic production and rising exports. The US EIA estimates natgas demand for July rose 3.9 bcf/d vs June, taking demand for the month to 75.8 bcf/d. Exports – pipeline and LNG – rose 0.4 bcf/d to 18.2 bcf/d, while US domestic production fell to 92.7 bcf/d, down 0.2 bcf/d from June's levels. As US and European distribution companies and industrials continue to scramble for gas to fill inventories, we expect natgas to remain well bid as the storage-injection season winds down. We remain long 1Q22 call spreads, which are up ~214% since the position was recommended April 8, 2021 (Chart 9). Base Metals: Bullish Labor and management at BHP's Escondida copper mine – the largest in the world – have a tentative agreement to avoid a strike that would have crippled an already-tight market. The proposed contract likely will be voted on by workers over the next two days, according to reuters.com. Separately, the head of a trade group representing Chile's copper miners said prices likely will remain high over the next 2-3 years as demand from renewables and electric vehicles continues to grow. Diego Hernández, president of the National Society of Mining (SONAMI), urged caution against expecting a more extended period of higher prices, however, mining.com reported (Chart 10). We remain bullish base metals generally, copper in particular, which we expect to remain well-bid over the next five years. Precious Metals: Bullish US CPI for July rose 0.5% month-over-month, suggesting the inflation spike in June was transitory. While lower inflation may reduce demand for gold, it will allow the Fed to continue its expansionary monetary policy. The strong jobs report released on Friday prompted markets and some Fed officials to consider tapering asset purchases sooner than previously expected. The jobs report also boosted an increasing US dollar. A strong USD and an increase in employment were negative for gold prices on Monday. There also were media reports of a brief “flash crash” caused by an attempt to sell a large quantity of gold early in the Asian trading day, which swamped available liquidity at the time. This also was believed to trigger stops and algorithmic trading programs, which exacerbated the move. The potential economic impact of the COVID-19 Delta variant is the only unequivocally supportive development for gold prices. Not only will this increase safe-have demand for gold, but it will also prevent the Fed from being too hasty in tapering its asset purchases and subsequently raising interest rates. Chart 9
Natgas Prices Recovering
Natgas Prices Recovering
Chart 10
Copper Prices Going Down
Copper Prices Going Down
Footnotes 1 The wheat crop year in the US begins in June; the rice crop year begins this month; and the corn and bean crop years begin in September. 2 Historical data indicate this difference is persistent, suggesting different methods of calculating ending stocks. The USDA estimates ending stocks for the '21/22 crop year will be 94.5mm tons, while the IGC is projecting a level of 53.8mm. 3 Please refer to ‘Has Global Agricultural Trade Been Resilient Under Coronavirus (COVID-19)? Findings from an Econometric Assessment. This is a working paper published by Shawn Arita, Jason Grant, Sharon Sydow, and Jayson Beckman in May 2021. Investment Views and Themes Strategic Recommendations Tactical Trades Commodity Prices and Plays Reference Table Trades Closed in 2021 Summary of Closed Trades
Image
Highlights US Treasuries: US Treasury yields are rising once again, in response to typical drivers – less dovish Fed commentary and upside growth surprises. The spread of the Delta variant in the US represents a potential near-term roadblock to additional yield increases, but the recent slowing of new cases in the UK and Europe is a positive sign that the US can see a similar result and avoid a major economic hit. Stay below-benchmark on US duration exposure. UK: The Bank of England is starting to prepare the markets for less accommodative monetary policy, with the UK economy holding up well as its Delta variant surge is losing momentum. UK Gilt yields are vulnerable to a hawkish repricing with only 48bps of rate hikes discounted by the end of 2024. Stay below-benchmark on UK duration exposure, and downgrade Gilts to underweight in global bond portfolios. A New Turning Point For Global Bond Yields? After seeing steady declines since the peak in late March that took the yield down to an intraday 2021 low of 1.13% last week, the 10-year US Treasury experienced a rebound back to 1.30% in a span of just three days. Yields in typically “high-beta” countries like Canada and Australia also saw significant increases. There were two main triggers for the pickup in US yields. Firstly, a speech from Fed Vice-Chair Richard Clarida was interpreted hawkishly, as he stated that he expects the conditions necessary for the Fed to begin lifting rates would be met by the end of 2022. Secondly, a better-than-expected July employment report confirmed the strength of the US labor market already evident in booming demand indicators like job openings. A third potential cause of the trough in yields can be found outside the US in the increasingly positive news on the spread of the Delta variant coming out of the UK. We would argue that the more relevant turning point for global bond yields in 2021 was not the late March peak in the US, but the mid-May peak in non-US developed market yields. The 10-year UK Gilt yield reached its 2021 apex on May 13, just as the spread of the Delta variant was starting to push UK COVID-19 case numbers sharply higher – despite the high vaccination rate in that country (Chart of the Week). This raised the fears that the “reopening boom” could stall, not only in the UK but other major economies, at a time when global growth momentum was already starting to cool off from the overheated pace in the first half of the year. Chart of the WeekThe "Delta Rally" In Bond Markets Is Fading
The 'Delta Rally' In Bond Markets Is Fading
The 'Delta Rally' In Bond Markets Is Fading
The Delta variant wave continues to wash over the US, although primarily in regions with lower vaccination rates. There was little sign of any impact from the variant in the July US jobs data with just over one million new jobs added (including revisions to prior months) and the unemployment rate falling one-half of a percentage point to 5.4%, the lowest level since March 2020 (Chart 2). However, we will need to see more economic data from July and August to confirm that this latest wave is not having a material impact on the broad US economy beyond the regions with lower vaccination rates. New COVID-19 cases in the UK peaked in mid-July, and are rolling over in continental Europe, with relatively low hospitalization rates – a hopeful sign that the US Delta spread could also soon begin to lose momentum. We continue to believe that steady improvements in the US labor market will be the driver of higher US bond yields over at least the next 6-12 months, as falling unemployment will embolden the Fed to begin tapering asset purchases and, eventually, begin rate hikes towards the end of 2022. The technical backdrop for Treasuries has become less of a headwind to higher yields, with the 10-year yield falling back to its 200-day moving average and speculators closing a lot of short positioning in Treasury futures (Chart 3). If the US can follow the more positive news from across the Atlantic with regards to the spread of the Delta variant, this would remove another impediment to higher US bond yields. Chart 2Steady Progress Towards The Fed's Employment Goals
Steady Progress Towards The Fed's Employment Goals
Steady Progress Towards The Fed's Employment Goals
Bottom Line: US Treasury yields are rising once again, in response to typical drivers – less dovish Fed commentary and upside growth surprises. Chart 3Technical Backdrop Less Of A Headwind To Higher US Yields
Technical Backdrop Less Of A Headwind To Higher US Yields
Technical Backdrop Less Of A Headwind To Higher US Yields
The surge in Delta variant cases represents a potential near-term roadblock to additional yield increases, but the recent slowing of new cases in the UK and Europe may be a positive sign that the US will avoid a major economic hit. Stay below-benchmark on US duration exposure. A Gilt-Bearish Shift In Tone From The Bank Of England Chart 4Pressures Building On The BoE To Dial Back Stimulus
Pressures Building On The BoE To Dial Back Stimulus
Pressures Building On The BoE To Dial Back Stimulus
BCA Research’s Global Fixed Income Strategy has had the UK on “downgrade watch” over the past few months. Improving growth momentum and recovering inflation have raised the risks of a more hawkish turn by the Bank of England (BoE), as evidenced by the elevated reading from our UK Central Bank Monitor (Chart 4). At the same time, the spread of the Delta variant injected a note of caution into an otherwise positive UK economic story. We now think it is time to move from “downgrade watch” to a full downgrade of our current neutral stance on UK Gilts. The BoE left its policy settings unchanged at last week’s policy meeting, but did provide strong indications that some removal of monetary accommodation would soon be necessary. The central bank noted that the UK economy was recovering from the pandemic shock at a faster-than-expected pace. In the August Monetary Policy Report (MPR) also released last week, the BoE maintained its 2021 real GDP growth forecast at 7.25% while slightly raising its 2022 growth estimate to 6%. UK GDP is now projected to fully recover to the pre-COVID level by the end of 2021. More importantly, the projections for the unemployment rate were lowered substantially. The central bank no longer expects much of an impact on unemployment when the UK government’s job-protecting furlough scheme expires in September. The BoE now expects unemployment to peak at 5.1% in Q3/2021 (Chart 5), a big change from the 6% projection in the May MPR, with the central bank noting that job vacancies are already back to pre-pandemic levels. The unemployment rate is projected to reach 4.25% in both 2022 and 2023. Chart 5Major Changes To The BoE's Forecasts
Major Changes To The BoE's Forecasts
Major Changes To The BoE's Forecasts
The BoE baseline forecast now calls for UK headline CPI inflation to see a temporary surge to 4% in Q4/2021 – a significant change from the 2.5% peak in inflation projected in the May MPR - before returning back to close to 2% over the next two years. Yet the minutes of last week’s policy meeting noted that the medium-term risks surrounding inflation were “two-way”, a message that sounds a bit more concerning compared to the benign 2022/23 inflation projections. The BoE is now running the risk of underestimating how long the UK inflation uptrend can persist and force increases in interest rates – perhaps beginning as soon as mid-2022 – given the multiple factors that are pushing up inflation. A modest growth hit from the Delta variant The daily number of new cases has fallen by nearly one-half since the peak on July 20th, according to the Oxford University data (Chart 6). Hospitalizations are also rolling over at a peak that would be one-quarter the size of the January peak. If these trends continue, this latest wave of COVID will not have a lasting negative impact on the economy that would dampen inflation pressures. The modest dip in the UK manufacturing and services PMIs in June and July, when cases were rising, supports this conclusion. Accelerating wage growth UK job vacancies are now higher than the pre-pandemic peak, while the BoE’s Agents’ Survey of companies reports an increasing number of firms reporting recruitment difficulties across a broader range of industries (Chart 7). The job market frictions are similar to the dynamics currently at play in the US, where labor demand is booming but firms have struggled to fill openings because government pandemic support programs have dampened labor market participation. Chart 6The Biggest Threat To The Dovish BoE Stance
The Biggest Threat To The Dovish BoE Stance
The Biggest Threat To The Dovish BoE Stance
Chart 7Good Help Is Hard To Find In The UK
Good Help Is Hard To Find In The UK
Good Help Is Hard To Find In The UK
The BoE noted in the August MPR that its forecasts include the impact of labor market frictions that have temporarily raised the medium-term equilibrium rate of unemployment during the pandemic, resulting in a surge in wage growth. However, this effect is expected to fade as the economy normalizes and government support programs expire. For example, the BoE estimates that the UK government’s job retention “furlough” scheme, which pays a reduced wage to workers who cannot work because of COVID economic restrictions and which expires in September, has acted to dampen measured wage growth over the past year. At the same time, compositional effects, with pandemic job losses being skewed towards lower-paying roles, have had a far greater impact in lifting wage growth. The BoE estimates that the “underlying” pace of wage growth, excluding pandemic effects, is only 3.3% compared to the reported 7.2%, but is expected to rise towards 4.5% in Q3 as the labor market recovers. Yet if the employment frictions do not fade as rapidly as the BoE expects, perhaps due to persistent skills mismatches for existing job openings, then the inflationary pressures emanating from the UK jobs market may cause UK inflation to stay elevated for longer than the BoE is projecting. Continued recovery from the initial COVID shock Chart 8Recovering From The COVID Recession
Recovering From The COVID Recession
Recovering From The COVID Recession
The BoE now expects UK real GDP to return to its pre-pandemic level in Q4 of this year (Chart 8). Much of the recovery in activity seen so far has been in services as pandemic restrictions have been lifted. Looking forward, consumer spending will be boosted by improving growth momentum in employment and incomes, further underpinned by a high levels of household savings accumulated during the pandemic. Business investment is also expected recover, given the robust reading from the BoE Agents’ Survey of investment intentions (bottom panel). The twin engines of consumption and investment will be enough to keep the UK economy growing at an above-trend pace in 2022, even with a modest expected drag from fiscal policy, which should help maintain some of the current cyclical inflationary pressures. Rising house prices UK house prices are experiencing another sharp uptick, with the Nationwide index up 10.3% year-over-year in Q2 (Chart 9). Demand for homes has been boosted by the UK government’s holiday on stamp duty, or housing transaction taxes, which began last year as a form of pandemic economic support. Housing transactions spiked in June as demand surged ahead of the expiry of the stamp duty holiday last month, and some payback is likely in the near-term. Yet UK housing demand has also been supported by the same factors boosting house prices in most developed economies - low interest rates, high household savings available for down payments and the increased need for space for those choosing to work from home. UK house price inflation thus could remain higher for longer than the BoE expects. Chart 9Is This House Price Surge 'Transitory' Or Policy Driven?
Is This House Price Surge 'Transitory' Or Policy Driven?
Is This House Price Surge 'Transitory' Or Policy Driven?
Supply Chain Bottlenecks The BoE noted in the August MPR that overall UK import prices have risen faster than expected, especially with the British pound higher on a year-over-year basis. UK firms have faced rising input costs because of disruption to global supply chains from the pandemic. For example, the annual growth rate of import prices for manufactured components rose by 12.1% in May, a sharp contrast to the -5.4% deflation of consumer goods prices (Chart 10). The BoE projects UK overall import price inflation to turn negative in 2022 and 2023, a big part of its slowing inflation forecast. Some decrease is inevitable as price momentum in oil and other commodities cools from overheated levels seen in 2021. However, supply chain disruptions are a global phenomenon already persisting for longer than expected in other countries and could linger into 2022 if global growth stays above trend - potentially causing UK import price inflation to once again exceed the BoE’s expectations. Summing it all up, the pressure is clearly building on the BoE to dial back the massive monetary easing put in place last year in response to the pandemic. Not only is the economy now recovering far more rapidly than the BoE had been projecting, with inflation set to peak at a higher level, but there are other indications that monetary conditions may now be too loose like accelerating house prices. There are numerous upside risks to the BoE’s benign post-2021 inflation forecasts, especially with the central bank also projecting the UK to have a positive output gap in 2022 and 2023 (Chart 11). Chart 10BoE Betting On Waning Global Supply Bottlenecks
BoE Betting On Waning Global Supply Bottlenecks
BoE Betting On Waning Global Supply Bottlenecks
Markets are not expecting much from the BoE in terms of interest rate increases. While the UK overnight index swap (OIS) curve is now discounting an initial 25bp rate hike in August 2022, only one other 25bp increase is expected by the end of 2024 (Table 1). Chart 11Domestic Price Pressures On The Rise
Domestic Price Pressures On The Rise
Domestic Price Pressures On The Rise
The BoE has not been a very active central bank since the 2008 financial crisis, never raising the Bank Rate above 0.75% over that time, thus the markets now seem conditioned to think that the BoE will continue to do very little in the future. Table 1Markets Expect The BoE To Hike Before The Fed
The UK Leads The Way
The UK Leads The Way
Chart 12Markets Expect Persistent Negative UK Real Rates
The UK Leads The Way
The UK Leads The Way
That is evident when you look at longer-dated OIS rates compared to forward inflation rates from the UK CPI swap curve. The combined message from those markets is that the BoE is expected to maintain deeply negative real interest rates for at least the next decade, a major reason why the UK has persistently negative real bond yields (Chart 12). A lower equilibrium real interest rate (i.e. “r-star”) is consistent with the declining trend in the OECD’s estimate of UK potential real GDP growth over the past 20 years (Chart 13). Yet it is a stretch to think that the neutral UK real interest rate is now negative, especially given how rapidly UK growth and inflation have snapped back from the 2020 COVID recession. UK interest rate markets are highly vulnerable to any hawkish shift by the BoE – and outcome that the current growth and inflation dynamics suggest is increasingly likely over the next 6-12 months. The BoE has already started to process of dialing back monetary accommodation by slowing the pace of asset purchases in its quantitative easing (QE) program (Chart 14). While no decision on additional tapering was made last week, the BoE did dedicate three pages of the August MPR to a detailed discussion on how the future size of the BoE’s balance sheet would likely be reduced if the BoE were to begin raising interest rates. There has also been some political pressure on the UK to dial back QE, with the Chair of the Economic Affairs Committee in the UK House of Lords saying that the BoE was “addicted” to QE last month. BoE Governor Andrew Bailey has previously stated that he viewed QE as a regular part of a central banker’s toolkit, to be used opportunistically during periods of deep economic or financial market stress. That made sense in 2020 during the height of the pandemic, but is no longer the case now. Chart 13UK R-Star Is Still Positive
UK R-Star Is Still Positive
UK R-Star Is Still Positive
We anticipate that the BoE will end the current QE program sometime in the next six months, with an initial 25bp rate hike occurring sometime in mid-2022. Chart 14UK QE: Expect More Tapering
UK QE: Expect More Tapering
UK QE: Expect More Tapering
This would be a faster pace of tapering, with a quicker liftoff, than the Fed, although we expect the Fed to eventually raise rates by more than the BoE in the next interest rate cycle. Investment Conclusions Given our expectation that the BoE is starting to prepare the markets for an unwind of its pandemic policy settings, we come to the following fixed income and currency investment conclusions (Chart 15): Chart 15Summarizing Our UK Fixed Income Recommendations
Summarizing Our UK Fixed Income Recommendations
Summarizing Our UK Fixed Income Recommendations
Chart 16A More Hawkish BoE Would Benefit The Pound
A More Hawkish BoE Would Benefit The Pound
A More Hawkish BoE Would Benefit The Pound
Duration: Maintain a below-benchmark duration stance within dedicated UK bond portfolios, with too few rate hikes discounted Country Allocation: Downgrade UK Gilts to underweight in global bond portfolios Yield Curve: On a tactical (0-6 months) basis, the UK Gilt curve may re-steepen as UK and global growth stays resilient, but a more hawkish BoE will eventually result in a flatter Gilt curve Inflation-Linked: Inflation breakevens on UK index-linked Gilts are already quite elevated and are overvalued on our fair value models, while real yields are at deeply negative levels that are conditioned on a continually dovish BoE – a combination that suggests an underweight stance on UK linkers is appropriate. Corporate Credit: Stay neutral on a tactical basis, as solid UK growth will offset the impact of a shift to a less dovish BoE. Currency: Our currency strategists are positive on the British pound - which is undervalued on their models (Chart 16) - over the medium-term, with the BoE seemingly on a path to begin tightening monetary policy sooner than the ECB and perhaps even the Fed. Robert Robis, CFA Chief Fixed Income Strategist rrobis@bcaresearch.com Recommendations The GFIS Recommended Portfolio Vs. The Custom Benchmark Index
The UK Leads The Way
The UK Leads The Way
Duration Regional Allocation Spread Product Tactical Trades Yields & Returns Global Bond Yields Historical Returns
Dear Client, I will be on vacation next week. In lieu of our regular report, we will be sending you a Special Report written by my colleague Arthur Budaghyan, BCA Research’s Chief Emerging Markets Strategist. Arthur’s report will discuss the long-term outlook for industrial companies. He argues that the US is entering an industrial boom prompted by infrastructure stimulus and onshoring. This will benefit US industrial equities, or ones selling into the US on a multi-year horizon. I trust you will find it insightful. Best regards, Peter Berezin, Chief Global Strategist Highlights Investors keep asking whether the recent increase in US inflation is transitory. However, this is the wrong question to ask. Annualized core CPI inflation reached 10.6% in the second quarter. There is little doubt that inflation will fall from such elevated levels. The key question that investors should be asking is whether inflation will decline more or less than what the market is discounting. The widely watched 5-year/5-year forward TIPS inflation breakeven rate has sunk to 2.11%, below the Fed’s “comfort zone” of 2.3%-to-2.5%. Thus, the market already expects a substantial decline in inflation. Our sense is that US inflation will come down fast enough to allow the Fed to maintain a highly dovish policy stance, but not as fast as market expectations currently imply. As inflation surprises on the upside, long-term bond yields will rise. This should revive bank shares and other reflationary plays. The combination of a weaker US dollar, faster sequential Chinese growth, increased vaccine supplies, and favorable valuations should all help EM stocks later this year. Go long the Vanguard FTSE Emerging Markets ETF (VWO) versus the Vanguard S&P 500 ETF (VOO). The Right Question About Inflation Chart 1After A Spike In Q2, US Inflation Will Decelerate
After A Spike In Q2, US Inflation Will Decelerate
After A Spike In Q2, US Inflation Will Decelerate
Investors remain focused on whether the recent bout of US inflation is transitory. However, this is not the correct question to be asking at the present juncture. The US core CPI rose by 10.6% at an annualized pace in Q2 relative to the first quarter (Chart 1). It is almost inevitable that inflation will come down from such high levels. The key question investors should be asking is whether inflation will decline more or less than what is already baked into market expectations. As Chart 2 shows, investors expect US inflation to come down rapidly over the next two years. The 5-year/5-year forward TIPS breakeven inflation rate – a good proxy for where investors expect inflation to be over the long haul – has sunk to 2.11% (Chart 3). This is below the Fed’s comfort zone of 2.3%-to-2.5%.1 Globally, long-term inflation expectations remain subdued (Chart 4). Chart 2Inflation Is Expected To Moderate Over The Coming Years
Investors Are Asking The Wrong Question About Inflation
Investors Are Asking The Wrong Question About Inflation
Chart 3Inflation Expectations Have Fallen Back Below The Fed's Target Zone
Inflation Expectations Have Fallen Back Below The Fed's Target Zone
Inflation Expectations Have Fallen Back Below The Fed's Target Zone
Chart 4Long-Term Inflation Expectations Remain Subdued
Investors Are Asking The Wrong Question About Inflation
Investors Are Asking The Wrong Question About Inflation
Inflation Will Fall, But… Our sense is that US inflation will come down fast enough to allow the Fed to maintain a highly dovish policy stance, but not as fast as market expectations currently imply. Broad-based inflationary pressures would make the Fed nervous. However, that is not what we are seeing. Wages have accelerated markedly in only a few relatively low-skilled sectors such as retail trade and leisure and hospitality (Chart 5). For the economy as a whole, wage growth is broadly stable (Chart 6). The expiration of extended unemployment benefits, the reopening of schools, and increased immigration should also boost labor supply in the fall. Chart 5Faster Wage Growth Has Been Confined To A Few Low-Wage Sectors
Investors Are Asking The Wrong Question About Inflation
Investors Are Asking The Wrong Question About Inflation
Chart 6No Sign Of A Wage-Price Spiral... For Now
No Sign Of A Wage-Price Spiral... For Now
No Sign Of A Wage-Price Spiral... For Now
On the price front, more than two-thirds of the increase in the core CPI in June stemmed from pandemic-afflicted sectors (Chart 7). The price of the median item within the CPI index rose by just 2.2% year-over-year in June, somewhat below the pre-pandemic pace of inflation (Chart 8). Chart 7Most Of The Recent Increase In Inflation Is Pandemic-Related
Investors Are Asking The Wrong Question About Inflation
Investors Are Asking The Wrong Question About Inflation
Chart 8The Median Price In The CPI Basket Is Up Only 2.2%
The Median Price In The CPI Basket Is Up Only 2.2%
The Median Price In The CPI Basket Is Up Only 2.2%
… Not As Fast As The Market Expects While inflation will fall as pandemic effects recede, investors are overestimating how fast this will happen. US growth has undoubtedly peaked, but at a very high level. Economists surveyed by Bloomberg estimate that US GDP rose by 9.0% in Q2. Growth is expected to slow to 7.1% in Q3 and 5.1% in Q4, while averaging 4.2% in 2022 (Table 1). By any standard, these are very strong, above-trend growth rates. Table 1Growth Is Peaking, But At A Very High Level
Investors Are Asking The Wrong Question About Inflation
Investors Are Asking The Wrong Question About Inflation
Chart 9Nearly 90% Of US Seniors Have Had At Least One Shot
Investors Are Asking The Wrong Question About Inflation
Investors Are Asking The Wrong Question About Inflation
The current Delta-variant wave is unlikely to slow US growth by very much. Although vaccination rates among younger people are at middling levels, they are quite high for the elderly who are most at risk of serious illness. Close to 89% of Americans above the age of 65 have received at least one shot, and nearly 80% are fully vaccinated (Chart 9). The 65+ age group accounts for four-fifths of all Covid deaths in the United States. Widespread vaccination coverage for older Americans will take pressure off the hospital system, allowing the economy to remain open. Fiscal Support In The US And Abroad As we noted last week, Senate Democrats are likely to use the reconciliation process to both raise the debt ceiling and pass President Biden’s $3.5 trillion American Jobs and Families Plan. They are also likely to move forward on Biden’s proposed $600 billion in infrastructure spending, with or without Republican support. Meanwhile, much of the fiscal stimulus that has already been undertaken has yet to make its way through to the economy. US households are sitting on about $2.5 trillion in excess savings, about half of which stems from increased government transfers (Chart 10). Chart 10A Lot Of Excess Savings
Investors Are Asking The Wrong Question About Inflation
Investors Are Asking The Wrong Question About Inflation
Chart 11Inventories Are At Low Levels
Inventories Are At Low Levels
Inventories Are At Low Levels
Satiating that demand has not been easy for many companies. Retail sector inventories are at record lows (Chart 11). The number of homes that have been authorized for construction but where building has yet to begin has increased by 62% since the start of the pandemic (Chart 12). By limiting production, supply-chain bottlenecks will push some spending towards the future. This will keep growth from decelerating more than it otherwise would. Outside the US, fiscal policy will remain supportive. All 27 EU countries ratified the €750 billion Next Generation fund on May 28th. The allocations from the fund for southern European countries are relatively large (Chart 13). Most of the money will be spent on public investment projects with high fiscal multipliers. Chart 12Growing Backlog Of New Home Construction Projects
Growing Backlog Of New Home Construction Projects
Growing Backlog Of New Home Construction Projects
Chart 13EU Fiscal Policy: Allocations To Southern European Countries Are Relatively Large
EU Fiscal Policy: Allocations To Southern European Countries Are Relatively Large
EU Fiscal Policy: Allocations To Southern European Countries Are Relatively Large
Chart 14Economic Growth In China Was Slow In H1
Economic Growth In China Was Slow In H1
Economic Growth In China Was Slow In H1
The Japanese government is contemplating sending stimulus checks to low-income citizens in advance of the general election due by October 22nd. It is an understandable move. Covid cases are rising again. As a result, the authorities have declared a state of emergency in Tokyo and barred spectators from attending the Olympic games in and around the city. Fortunately, the Japanese vaccination campaign has accelerated after a slow start. A third of the population has now received at least one shot. The government intends to vaccinate all eligible people by November. Looking at quarter-over-quarter growth rates, Chinese growth averaged just 3.8% on an annualized basis in the first half of 2021 (Chart 14). Growth should pick up in the second half of the year thanks in part to increased fiscal spending. As of June, local governments had used only 28% of their annual bond issuance quotas, compared with 61% over the same period last year and 65% in 2019. Most of the proceeds from local government bond sales will likely flow into infrastructure projects. Resumption Of The Dollar Bear Market Will Keep Inflation From Falling Too Far As a countercyclical currency, the US dollar usually weakens when global growth is strong (Chart 15). Short-term real interest rate differentials have moved sharply against the dollar, a trend that is unlikely to change anytime soon given the Fed’s dovish bias (Chart 16). While inflation in the US is not as sensitive to currency fluctuations as in most other countries, a weaker dollar will still lift tradeable goods prices (Chart 17). Chart 15The Dollar Is A Countercyclical Currency
The Dollar Is A Countercyclical Currency
The Dollar Is A Countercyclical Currency
Chart 16Rate Differentials Are A Headwind For The Dollar
Rate Differentials Are A Headwind For The Dollar
Rate Differentials Are A Headwind For The Dollar
Chart 17The Dollar And Inflation
Investors Are Asking The Wrong Question About Inflation
Investors Are Asking The Wrong Question About Inflation
Structural Forces Turning More Inflationary Not only are cyclical forces likely to turn out to be less disinflationary than investors believe, but many of the structural factors that have suppressed inflation over the past 40 years are reversing direction: Chart 18Globalization Plateaued More Than A Decade Ago
Globalization Plateaued More Than A Decade Ago
Globalization Plateaued More Than A Decade Ago
Globalization is in retreat: The ratio of global trade-to-manufacturing output has been flat for over a decade (Chart 18). Looking out, the ratio could even decline as more companies shift production back home in order to gain greater control over supply chains of essential goods. Baby boomers are leaving the labor force en masse. As a group, baby boomers hold more than half of US household wealth (Chart 19). They will continue to run down their wealth once they retire. However, since they will no longer be working, they will no longer contribute to national output. Continued spending against a backdrop of diminished production could be inflationary. Despite a pandemic-induced bounce, underlying productivity growth remains anemic (Chart 20). Slow productivity growth could cause aggregate supply to fall short of aggregate demand. Social stability is in peril, as exemplified by the recent dramatic increase in the US homicide rate. In the past, social instability and higher inflation have gone hand in hand (Chart 21). Perhaps most importantly, policymakers are deliberately aiming to run the economy hot. A tight labor market will eventually lift wage growth to a greater degree than what we have seen so far (Chart 22). Not only could higher wage growth push up inflation through the usual “cost-push” channel, but by boosting labor’s share of income, a tight labor market could spur aggregate demand. Chart 19Baby Boomers Have Accumulated A Lot Of Wealth
Investors Are Asking The Wrong Question About Inflation
Investors Are Asking The Wrong Question About Inflation
Chart 20Trend Productivity Growth Has Been Disappointing
Trend Productivity Growth Has Been Disappointing
Trend Productivity Growth Has Been Disappointing
Chart 21Historically, Social Unrest And Higher Inflation Move In Lock-Step
Historically, Social Unrest And Higher Inflation Move In Lock-Step
Historically, Social Unrest And Higher Inflation Move In Lock-Step
Chart 22A Tight Labor Market Eventually Bolsters Wages
A Tight Labor Market Eventually Bolsters Wages
A Tight Labor Market Eventually Bolsters Wages
Investment Implications Chart 23Positive Earnings Revisions Are At High Levels
Investors Are Asking The Wrong Question About Inflation
Investors Are Asking The Wrong Question About Inflation
The path to higher rates is lined with lower rates. The longer central banks keep interest rates below their neutral level, the more economies will overheat, and the more rates will eventually need to rise to bring inflation back down. For now, we are still in the warm-up phase to higher inflation. With long-term inflation expectations below target, central banks will be able to maintain accommodative monetary policies. This is good news for stocks, at least in the short-to-medium term. The recent wobble in equity markets has occurred despite a strong second quarter earnings season. According to the latest available data from I/B/E/S, 90% of S&P 500 companies have reported earnings above analyst expectations. Earnings have surprised on the upside by an average of 19.2%, compared to a historical average of 3.9%. Positive earnings revisions are at record high levels (Chart 23). Full year 2021 S&P 500 EPS estimates have risen 16% since the start of the year. Analysts have also raised their estimates for 2022 and 2023 (Chart 24). We continue to recommend that asset allocators favor stocks over bonds over a 12-month horizon. Chart 24Analysts Have Been Revising Up Earnings Estimates This Year
Analysts Have Been Revising Up Earnings Estimates This Year
Analysts Have Been Revising Up Earnings Estimates This Year
Chart 25The Gains Of Recent Winners Have Not Been Fully Mirrored In Relative Earnings Growth
The Gains Of Recent Winners Have Not Been Fully Mirrored In Relative Earnings Growth
The Gains Of Recent Winners Have Not Been Fully Mirrored In Relative Earnings Growth
Chart 26Bank Shares Thrive In A Rising Yield Environment
Bank Shares Thrive In A Rising Yield Environment
Bank Shares Thrive In A Rising Yield Environment
Tech stocks have outperformed the broader market over the past seven weeks. However, unlike during the pandemic, 12-month forward EPS estimates for tech have not risen in relation to other sectors (Chart 25). As long-term bond yields move back up, tech shares will underperform. In contrast, banks will benefit from higher yields (Chart 26). Along the same lines, US stocks have outpaced other stock markets by more than one would have expected based on relative EPS trends. Notably, EM earnings have moved sideways versus the US since mid-2019. Yet, US stocks have outperformed EM by 17% over this period. Today, the forward P/E ratio for EM stands at 13.8, compared to 22.1 for the US (Chart 27). The combination of a weaker US dollar, faster sequential Chinese growth, increased vaccine supplies, and favorable valuations should all help EM stocks later this year. Go long the Vanguard FTSE Emerging Markets ETF (VWO) versus the Vanguard S&P 500 ETF (VOO). Peter Berezin Chief Global Strategist pberezin@bcaresearch.com Chart 27Wide Valuation Gap Between US And Non-US Markets
Wide Valuation Gap Between US And Non-US Markets
Wide Valuation Gap Between US And Non-US Markets
Footnotes 1 The Federal Reserve targets an average inflation rate of 2% for the personal consumption expenditures (PCE) index. The TIPS breakeven is based on the CPI index. Due to compositional differences between the two indices, CPI inflation has historically averaged 30-to-50 basis points higher than PCE inflation. This is why the Fed effectively targets a CPI inflation rate of about 2.3%-to-2.5%. Global Investment Strategy View Matrix
Investors Are Asking The Wrong Question About Inflation
Investors Are Asking The Wrong Question About Inflation
Special Trade Recommendations
Investors Are Asking The Wrong Question About Inflation
Investors Are Asking The Wrong Question About Inflation
Current MacroQuant Model Scores
Investors Are Asking The Wrong Question About Inflation
Investors Are Asking The Wrong Question About Inflation
Feature June’s economic data and second-quarter GDP indicate that China’s economic recovery may have peaked. Slight improvements in some sectors, including manufacturing investment, exports and consumption, were offset by slowing in China’s old economy, such as infrastructure and real estate. A softening economy will weigh on Chinese corporate profits in 2H21. Inflation in Producer Price Index (PPI) has likely peaked, but it remains far above its historic average. Downstream industries may benefit from low interest rates and slightly less inflationary pressures on input prices, however, their profit growth has rolled over given weakening domestic demand and base effect. Industrial profits will shift downward in 2H21, meanwhile China’s macro policy will probably disappoint investors. Last week’s GDP’s numbers show that small-to-medium enterprises (SMEs) and private-sector businesses bore the brunt of rising global commodity prices and a slow recovery in domestic household consumption and services. The data, coupled with recent policy moves, support our view that China’s leadership is focused on helping vulnerable segments of the economy rather than boosting domestic demand by broadly easing policies (Chart 1). Nonetheless, the authorities may resort to easing policy later in 2021 if export growth weakens significantly in the second half of the year. A series of Reserve Requirement Ratio (RRR) and/or interest rate cuts, increased infrastructure project approvals, and/or looser real estate regulations, will signal that China’s ongoing policy tightening cycle has ended. In recent weeks both Chinese onshore and offshore stocks slipped further in absolute terms and relative to global benchmarks (Chart 2). We continue to recommend that investors remain cautious on Chinese stocks, at least through Q3. Chart 1No Broad Easing Yet
No Broad Easing Yet
No Broad Easing Yet
Chart 2Investors Still Cautious On China's Economy And Policy
Investors Still Cautious On China's Economy And Policy
Investors Still Cautious On China's Economy And Policy
Qingyun Xu, CFA Associate Editor qingyunx@bcaresearch.com Jing Sima China Strategist jings@bcaresearch.com Q2 GDP: Recovering At A Slower Pace China’s official GDP growth, on a year-over-year basis, slowed to 7.9% in Q2 from 18.3% in Q1 (Chart 3, top panel). While Q2’s weaker reading reflects the base effect in the data, it was slightly below the market’s expectation of 8.0-8.5%. Moreover, on a sequential basis (quarter-over-quarter), Q2’s seasonally adjusted GDP growth was one of the slowest in the past decade (Chart 3, bottom panel). These figures and the underlying data highlight that China’s economic growth momentum, which historically lags the credit impulse by six to nine months, has peaked (Chart 4). However, in 1H21, China aggregate output still grew by a 5.5% average annual rate during the same period over the past two years, well within Chinese policymakers’ target of above 5% growth needed to maintain a stable economy. Meanwhile, the bifurcation in China’s economic recovery continues. While robust external demand for Chinese goods helped to underpin manufacturing output, the sector’s profit growth has lagged upstream industries. Moreover, state-owned enterprises (SOEs) are experiencing soaring profit growth whereas SMEs have struggled with rising global commodity prices and sluggish domestic consumption as discussed below. We expect that the pace in credit growth deceleration will moderate in 2H21 and interest rates will stay at historically low levels. However, the authorities are unlikely to loosen macro policies until more signs of economic weaknesses emerge. Chart 3Q2 GDP: Slowing From An Elevated Level
Q2 GDP: Slowing From An Elevated Level
Q2 GDP: Slowing From An Elevated Level
Chart 4Chinese Economic Growth Should Soften Further In 2H21
Chinese Economic Growth Should Soften Further In 2H21
Chinese Economic Growth Should Soften Further In 2H21
Robust Exports, Sluggish Manufacturing Investment Chart 5Subdued Manufacturing Investment Recovery Despite Robust Exports
Subdued Manufacturing Investment Recovery Despite Robust Exports
Subdued Manufacturing Investment Recovery Despite Robust Exports
China’s export growth in June beat market expectations, despite shipping disruptions at major ports in Guangdong province due to a resurgence in COVID-19 cases. However, the recovery in manufacturing investment was muted through most of 1H21 even though export growth was resilient (Chart 5). There are several reasons for the sluggish recovery: the RMB’s rapid appreciation in the first five months of 2021, rising inflation and the limited pricing power that Chinese exporters gained in the first half of the year likely impeded their profits and curbed their propensity to invest (Chart 6). Total export values in USD significantly outpaced those in RMB terms, suggesting that the profit gains by Chinese exporters were offset by the strengthening local currency (Chart 7). Chart 6Rapid RMB Appreciation Will Weigh On Industrial Profits
Rapid RMB Appreciation Will Weigh On Industrial Profits
Rapid RMB Appreciation Will Weigh On Industrial Profits
Chart 7Divergence Between Exports In USD versus RMB
Divergence Between Exports In USD versus RMB
Divergence Between Exports In USD versus RMB
Furthermore, manufacturers in mid-to-downstream industries have been unable to fully pass on rising input costs to domestic consumers, which is evidenced in the faster growth of manufacturing output volume compared with price increases. It contrasts with the previous inflationary cycles, where surging prices for manufactured goods surpassed output volume (Chart 8A & 8B). Chart 8AChina's Manufacturing Recovery: Stronger Volume Than Prices
China's Manufacturing Recovery: Stronger Volume Than Prices
China's Manufacturing Recovery: Stronger Volume Than Prices
Chart 8BMuted Profit Margin Recovery In Manufacturing Compared With Mining
Muted Profit Margin Recovery In Manufacturing Compared With Mining
Muted Profit Margin Recovery In Manufacturing Compared With Mining
June’s improvement in manufacturing investment may not advance into 2H21 without added policy support. The nearly 2% depreciation in the RMB against the dollar in recent weeks will alleviate some pressure on exporters’ profit margins. However, export prices in USD also started to weaken (Chart 9). In addition, June’s manufacturing PMI and a Chinese business school survey,1 reported a deterioration in business conditions among smaller businesses. The weaker sentiment will depress manufacturing investments since China’s manufacturing sector is dominated by private and smaller businesses (Chart 10). Chart 9Chinese Export Prices In USD Are Rolling Over
Chinese Export Prices In USD Are Rolling Over
Chinese Export Prices In USD Are Rolling Over
Chart 10Deteriorating Business Sentiment Will Depress Manufacturing Investments
Deteriorating Business Sentiment Will Depress Manufacturing Investments
Deteriorating Business Sentiment Will Depress Manufacturing Investments
Recent policy measures to keep a low interest-rate environment will help the export and manufacturing sectors by reducing operating costs. The measures are also in keeping with China’s shift from boosting its service sector to maintaining a steady share of manufacturing output in its domestic economy (Chart 11). Chart 11Maintaining A Steady Share Of Manufacturing Output In China's Economy
Maintaining A Steady Share Of Manufacturing Output In China's Economy
Maintaining A Steady Share Of Manufacturing Output In China's Economy
Policy Tightening In The Old Economy Continues Chart 12Investments In Real Estate Have Lost Steam
Investments In Real Estate Have Lost Steam
Investments In Real Estate Have Lost Steam
Infrastructure investment growth slowed further in June. Investments in real estate, which drove China’s economic recovery in the second half of 2020, are also losing momentum (Chart 12). The slowdown, engineered by policymakers, will likely endure for the rest of the year. Bank loans to real estate developers tumbled to a cyclical low (Chart 13). In addition, deposit and advance payments, the main source of funds for real estate projects, nose-dived along with home sales (Chart 14). Chart 13No Signs Of Looser Financing Regulations In Property Sector
No Signs Of Looser Financing Regulations In Property Sector
No Signs Of Looser Financing Regulations In Property Sector
Chart 14Falling Home Sales Will Further Depress Real Estate Investments
Falling Home Sales Will Further Depress Real Estate Investments
Falling Home Sales Will Further Depress Real Estate Investments
Chart 15Sharp Pullback In New Infrastructure Project Approvals This Year
Sharp Pullback In New Infrastructure Project Approvals This Year
Sharp Pullback In New Infrastructure Project Approvals This Year
Infrastructure project approvals by the Ministry of Finance remain on a downward trend (Chart 15). Last week, China’s Banking and Insurance Regulatory Commission (CBIRC) announced a new rule to stop financial institutions from lending to local government financing vehicles (LGFV) that hold off-balance sheet government debt. LGFVs are largely used by provincial governments to borrow from banks to help fund infrastructure projects. Regulations targeting the real estate sector will further dampen real estate investments in the second half of this year. Land purchases and housing starts, both leading indicators for real estate investment, have declined since February. Excavator sales and investment in construction equipment also deteriorated sharply (Chart 16). Given that housing prices remain elevated, we do not expect real estate regulations to shift to an easier tone. The deceleration in China’s old economy is reflected in imports. While the value of imports remains strong, the volume has slowed, which suggests that the surge was due to soaring commodity prices (Chart 17, top panel). In particular, the growth in China’s imports of copper and steel, on a year-over-year basis and in volume terms, contracted in June (Chart 17, bottom panel). Chart 16Construction Activities Set To Slow Further
Construction Activities Set To Slow Further
Construction Activities Set To Slow Further
Chart 17Falling Import Volume
Falling Import Volume
Falling Import Volume
The Key To A Consumption Recovery Retail sales picked up slightly in June following two consecutive months of decline. However, retail sales remain below their pre-pandemic level (Chart 18). Labor market dynamics and household income growth, which stayed sluggish through 1H21, hold the key to the speed and magnitude of a recovery in consumption this year (Chart 19). Chart 18Sluggish Recovery In Household Consumption
Sluggish Recovery In Household Consumption
Sluggish Recovery In Household Consumption
Chart 19A Lackluster Consumption Recovery Due To Slow Recovery in Household Income
A Lackluster Consumption Recovery Due To Slow Recovery in Household Income
A Lackluster Consumption Recovery Due To Slow Recovery in Household Income
Household precautionary savings, which remain elevated compared with their historical norms, have depressed the propensity to spend (Chart 20). While the overall unemployment rate in China’s urban centers has steadily declined this year, the rate of jobless young graduates (ages 16-24) picked up and is nearly three percentage points higher than its historical mean (Chart 21). However, the high unemployment among graduates will not encourage policymakers to stimulate the economy. The number of new graduates in both 2020 and 2021 is larger than the historical average, while the growth in new job creation has nearly recovered to that of the pre-pandemic years (Chart 22). Chart 20Households' Propensity For Precautionary Savings Remains Elevated
Households' Propensity For Precautionary Savings Remains Elevated
Households' Propensity For Precautionary Savings Remains Elevated
Chart 21Rising Unemployment Rate Among Younger Workers
Rising Unemployment Rate Among Younger Workers
Rising Unemployment Rate Among Younger Workers
Moreover, labor market slack among young graduates seems to be concentrated in the services sector, and this sector’s improvement is dependent on China’s domestic pandemic situation and inoculation rates rather than on stimulus (Chart 23). Chart 22Urban Job Creation Growth Still On The Mend
Urban Job Creation Growth Still On The Mend
Urban Job Creation Growth Still On The Mend
Chart 23Interruptions In Service Sector Recovery Due To Lingering COVID Cases
Interruptions In Service Sector Recovery Due To Lingering COVID Cases
Interruptions In Service Sector Recovery Due To Lingering COVID Cases
Elevated Inflation, Downshifting Industrial Profits Chart 24China's PPI May Have Reached A Cyclical Peak...
China's PPI May Have Reached A Cyclical Peak...
China's PPI May Have Reached A Cyclical Peak...
China’s domestic inflationary pressures eased slightly in June with a small decline in both consumer and producer prices. The input price component of the manufacturing PMI, which normally leads the PPI by about three months, dropped sharply last month, which indicates that the PPI may have reached its cyclical peak (Chart 24). However, producer price inflation will likely remain elevated in the second half of the year. Although global industrial metal prices have rolled over since May, they remain at their highest level since 2011 (Chart 25). A rapid deceleration in Chinese credit growth and weakening demand in 2H21 will remove some pressure in the sizzling hot commodity market, but global supply-side constraints will limit the downside in raw material prices, at least through the next six months. Therefore, diminishing inflationary pressures on the PPI will only slightly reduce input costs for China’s mid-to- downstream manufacturers, which have been unable to pass on rising commodity prices to domestic consumers (Chart 26). As discussed earlier, Chinese export prices in both USD and RMB terms have also rolled over. Chart 25...But Global Commodity Prices Are Still Elevated
...But Global Commodity Prices Are Still Elevated
...But Global Commodity Prices Are Still Elevated
Chart 26Absence Of Inflation Pass-Through
Absence Of Inflation Pass-Through
Absence Of Inflation Pass-Through
Given that price changes are more important to corporate profits than volume changes, Chinese mid-to-downstream industries will continue to face downward pressure on their profit margins. Profit growth in mid-to-downstream industries consistently lagged their upstream counterparts in the past 12 months (Chart 27). Moreover, state-holding enterprises, which dominate upstream industries, have seen a 150% jump in profit growth from a year ago, while the rate of profit gains among privately owned industrial companies tumbled this year (Chart 28). Chart 27A Faster Mean Reversal In Profit Growth Among Private Companies
Taking The Pulse Of China’s Slowing Economy
Taking The Pulse Of China’s Slowing Economy
Chart 28A Faster Mean Reversal In Profit Growth Among Private Companies
A Faster Mean Reversal In Profit Growth Among Private Companies
A Faster Mean Reversal In Profit Growth Among Private Companies
Chinese policymakers will probably focus on addressing imbalances in China’s industrial sector and economy by supporting SMEs and the private sector. Meanwhile, industrial profit growth will decline in 2H21 from its V-shaped recovery last year, given weakening domestic demand and the waning base effect. Table 1China Macro Data Summary
Taking The Pulse Of China’s Slowing Economy
Taking The Pulse Of China’s Slowing Economy
Table 2China Financial Market Performance Summary
Taking The Pulse Of China’s Slowing Economy
Taking The Pulse Of China’s Slowing Economy
Footnotes 1The CKGSB (Cheung Kong Graduate School Of Business) Business Conditions Index (BCI) comprises four sub-indices: corporate sales, corporate profits, corporate financing environment and inventory levels. Equity Sector Recommendations Cyclical Investment Stance
Highlights Yield curves have flattened considerably in the major economies since April. Slowing global growth, the perception that the Fed is turning more hawkish, and technical factors have contributed to flatter yield curves. Looking out, we expect the forces pushing down bond yields to abate, with the US 10-year Treasury yield ultimately rising to 1.8%-to-1.9% by the end of the year. Shrinking output gaps, rebounding inflation expectations, and stepped-up Treasury issuance should all push yields higher. Higher yields will benefit bank shares at the expense of tech stocks. Investors should favor value over growth and non-US equities over their US peers. We are closing our long global energy stocks/short copper miners trade. In its place, we are opening a trade to go long the December 2022 Brent futures contract at a price of $66.50/bbl. Flatter Yield Curves Yield curves have flattened considerably in the major economies since April. The US 10-year yield has fallen to 1.31% (and was down to as low as 1.25% intraday last Thursday) from a recent peak of 1.74% on March 31st. The US 2-year yield has risen 7 bps over this period, which has translated into 50 bps of flattening in the 2/10 yield curve. The German bund curve has flattened by 20 bps, the UK curve by 28 bps, the Canadian curve by 52 bps, and the Australian curve by 57 bps. Even the Japanese yield curve has managed to flatten by 13 bps (Chart 1). Chart 1AYield Curves In The Major Economies Have Flattened Since April (I)
Yield Curves In The Major Economies Have Flattened Since April (I)
Yield Curves In The Major Economies Have Flattened Since April (I)
Chart 1BYield Curves In The Major Economies Have Flattened Since April (II)
Yield Curves In The Major Economies Have Flattened Since April (II)
Yield Curves In The Major Economies Have Flattened Since April (II)
Chart 2US Economic Surprise Index Is Near A Post-Pandemic Low
US Economic Surprise Index Is Near A Post-Pandemic Low
US Economic Surprise Index Is Near A Post-Pandemic Low
Three major factors account for the recent bout of yield-curve flattening: Slowing growth: Decelerating growth is usually accompanied by a flatter yield curve. Chinese growth peaked late last year. US growth peaked around March, with the Citi Economic Surprise Index falling to a post-pandemic low last week (Chart 2). European growth will peak over the course of this summer (Table 1). The emergence of the Delta variant has amplified growth concerns. Table 1Growth Is Peaking, But At A Very High Level
The Message From The Yield Curve
The Message From The Yield Curve
Fears that the Fed is turning more hawkish: About one-third of the flattening in the US yield curve occurred in the two days following the June FOMC meeting. The shift in the median Fed forecast towards a 2023 rate hike was interpreted by many market participants as a signal that the Fed was unwilling to tolerate a prolonged inflation overshoot (Chart 3). As a result, short-term rate expectations moved up while long-term rate expectations declined (Chart 4). Chart 3The Fed Dots Have Shifted Towards An Earlier Rate Hike
The Message From The Yield Curve
The Message From The Yield Curve
Chart 4Markets Saw The June FOMC Meeting As A Turning Point
Markets Saw The June FOMC Meeting As A Turning Point
Markets Saw The June FOMC Meeting As A Turning Point
Chart 5Treasury Cash Balances Are Declining
Treasury Cash Balances Are Declining
Treasury Cash Balances Are Declining
Technical factors: Investors were positioned very bearishly on bonds earlier this year, helping to set the stage for a short-covering rally. Meanwhile, with yet another debt ceiling showdown looming in Congress, the Treasury department began to slash T-bill issuance, drawing on its cash balances at the Fed instead (Chart 5). Treasurys, which were already in short supply due to the Fed’s QE program, became even scarcer. All this happened at a time when seasonal factors normally turn bond bullish (Chart 6). Chart 6Seasonality In Markets
The Message From The Yield Curve
The Message From The Yield Curve
How these three factors evolve over the coming months will dictate the path of bond yields, with important implications for stocks and currencies. Let’s examine each in turn. Global Growth Will Slow, But Remain Firmly Above Trend Chart 7High Vacancies Suggest Strong Demand For Labor
High Vacancies Suggest Strong Demand For Labor
High Vacancies Suggest Strong Demand For Labor
While global growth will continue to decelerate, it will remain well above trend. This is important because ultimately, it is the size of the output gap that determines the timing and magnitude of rate hikes. In the US, the high level of job vacancies suggests that there is no shortage of labor demand (Chart 7). What is missing are willing workers. As we noted in our Third Quarter Strategy Outlook, labor shortages should ease in the fall as expanded unemployment benefits expire, schools reopen, and immigration picks up. The recent rapid decline in initial unemployment claims is consistent with an acceleration in job gains over the coming months (Chart 8). The share of small businesses planning to increase hiring also jumped in June to the highest level in the 48-year history of the NFIB survey (Chart 9). Chart 8Declining Unemployment Claims Point To Further Strong Employment Growth
Declining Unemployment Claims Point To Further Strong Employment Growth
Declining Unemployment Claims Point To Further Strong Employment Growth
Chart 9Small US Businesses Are Keen To Hire
Small US Businesses Are Keen To Hire
Small US Businesses Are Keen To Hire
Delta Risk In the US, 32,000 new Covid cases were reported on Wednesday. This pushed the 7-day average to 25,000, double the level it was the first week of July. According to the CDC, more than 90% of US counties with high case counts had vaccination rates below 40% (Map 1). As is in other countries, the highly contagious Delta variant accounts for the majority of new US infections. Map 1AUS Covid Vaccination Coverage
The Message From The Yield Curve
The Message From The Yield Curve
Map 1BUS Covid Infection Trends
The Message From The Yield Curve
The Message From The Yield Curve
Chart 10Vaccine Makers Are On Track To Produce Over 10 Billion Doses In 2021
The Message From The Yield Curve
The Message From The Yield Curve
The latest Covid wave will slow US economic activity, but probably not by much. The CDC estimates that over 99% of recent US Covid deaths have been among the non-vaccinated population. Vaccinated people have little to fear from the Delta strain and hence, will likely continue to go on with their daily lives. Non-vaccinated people, in most cases, are presumably not very concerned about contracting the virus, so they too will go on with their daily lives. Thus, it is difficult to see how the Delta strain will lead to major behavioral changes. And politically, it will be difficult for governments to legislate lockdowns when everyone who wants a vaccine has been able to receive one. Outside the US, the Delta strain will cause more havoc. Nevertheless, there is a light at the end of the tunnel. Globally, vaccine makers are set to produce over 10 billion doses this year (Chart 10). Many of these vaccines will make their way to emerging economies, which have struggled to obtain adequate supplies. That should help boost EM growth. China Policy Support Chinese retail sales, industrial production, and fixed asset investment all rose faster than expected in June. Yesterday’s solid activity data followed strong trade numbers released earlier this week. Chart 11Chinese Credit Growth Should Stabilize In The Second Half Of The Year
Chinese Credit Growth Should Stabilize In The Second Half Of The Year
Chinese Credit Growth Should Stabilize In The Second Half Of The Year
Chinese policy is turning more stimulative, which should continue to support growth. Effective this Thursday, the PBOC cut its reserve requirement ratio by 0.5 percentage points, releasing about RMB 1 trillion of liquidity into the banking system. It was the first such cut since April 2020. Total social financing, a broad measure of Chinese credit, rose by RMB 3.7 trillion in June, well above consensus estimates of RMB 2.9 trillion. Credit growth has fallen sharply since last October and is currently running near its 2018 lows (Chart 11). Looking out, Chinese credit growth should pick up modestly as local governments issue more debt. As of June, local governments had used only 28% of their annual bond issuance quota, compared with 61% over the same period last year and 65% in 2019. The proceeds from local government bond sales will likely flow into infrastructure spending, which has been tepid in recent years (Chart 12). Increased infrastructure spending will boost metals prices. With that in mind, we are closing our long global energy stocks/short copper miners trade for a gain of 8.5%. In its place, we are opening a trade to go long the December 2022 Brent futures contract at a price of $66.50/bbl. As Chart 13 shows, BCA’s Commodity and Energy service expects oil prices to keep rising in contrast to market expectations of a price decline. Chart 12China: Weak Infrastructure Spending Should Pick Up
China: Weak Infrastructure Spending Should Pick Up
China: Weak Infrastructure Spending Should Pick Up
Chart 13Oil Prices Have Further Upside
Oil Prices Have Further Upside
Oil Prices Have Further Upside
The Fed Will Stay Dovish Chart 14Excluding Pandemic-Affected Sectors, Core CPI Has Not Surged As Much As Headline Measures
Excluding Pandemic-Affected Sectors, Core CPI Has Not Surged As Much As Headline Measures
Excluding Pandemic-Affected Sectors, Core CPI Has Not Surged As Much As Headline Measures
Market participants overreacted to the shift in the Fed’s dot plot. The regional Fed presidents tend to be more hawkish than the Board of Governors. Jay Powell himself probably penciled in one hike for 2023. Lael Brainard, who may end up replacing Powell next year, likely projects no hikes for 2023. Granted, inflation has surged. The CPI rose 5.4% year-over-year in June, above expectations of 4.9%. Core CPI inflation clocked in at 4.5%, surpassing expectations of 4.0%. However, most of the increase in the CPI continues to be driven by a few pandemic-affected sectors. Excluding airfares, hotels, and vehicle prices, the core CPI rose by a modest 2.5% in June. The level of the CPI outside these pandemic-affected sectors is still below trend, suggesting little imminent need for monetary tightening (Chart 14). Many input prices have already rolled over (Chart 15). The price of lumber, which at one point was up 93% from the start of 2021, is now down for the year. Steel prices are well off their highs. So too are memory chip prices. Even used car auction prices are starting to decline (Chart 16). Chart 15Input Prices Have Rolled Over
Input Prices Have Rolled Over
Input Prices Have Rolled Over
Chart 16Used Car Prices Have Probably Peaked
Used Car Prices Have Probably Peaked
Used Car Prices Have Probably Peaked
Chart 17Both The Fed And Market Participants Have Revised Down Their Estimate Of The Neutral Rate Of Interest
Both The Fed And Market Participants Have Revised Down Their Estimate Of The Neutral Rate Of Interest
Both The Fed And Market Participants Have Revised Down Their Estimate Of The Neutral Rate Of Interest
Chart 18Inflation Expectations Have Fallen Back Below The Fed's Target Zone
Inflation Expectations Have Fallen Back Below The Fed's Target Zone
Inflation Expectations Have Fallen Back Below The Fed's Target Zone
Despite the widespread perception that US monetary policy is ultra-accommodative, current policy rates are only two percentage points below both the Fed’s and the market’s estimates of the terminal rate (Chart 17). Given the zero lower bound constraint on nominal policy rates, tightening monetary policy prematurely could be a grave mistake.Market-based inflation expectations are signaling the need for easier, not tighter, monetary policy. After rising earlier this year, the 5-year/5-year forward TIPS breakeven inflation rate has fallen back below the Fed’s comfort zone (Chart 18). It is highly unlikely that the Fed will commence tapering if long-term inflation expectations remain below target. More likely, the Fed will ramp up its dovish rhetoric over the coming months, allowing inflation expectations to recover. This should put some upward pressure on long-term bond yields. Technical Factors Are Turning Less Bond Friendly Chart 19Investors Were Heavily Short Bonds Earlier This Year
Investors Were Heavily Short Bonds Earlier This Year
Investors Were Heavily Short Bonds Earlier This Year
While seasonal factors should remain bond bullish over the remainder of the year, other technical factors are turning less supportive. Investors surveyed by J.P. Morgan increased duration exposure over the past four weeks, after having cut it to the lowest level since 2017 (Chart 19). Traders also cut short positioning on the 30-year bond by two-thirds from record levels. Treasury issuance should normalize by the fall. While the obligatory brinkmanship over the debt ceiling is likely to extend beyond the August 1st deadline, BCA’s chief political strategist Matt Gertken believes that Democrats will ultimately be able to raise the ceiling. Senate Democrats may end up using the reconciliation process to both raise the debt ceiling and pass President Joe Biden’s $3.5 trillion American Jobs and Families Plan with 51 votes along. They are also likely to move forward on passing Biden’s proposed $600 billion in traditional infrastructure, with or without Republican support. The combination of increased Treasury supply and more fiscal spending should translate into higher bond yields. Higher Bond Yields Favor Value Stocks We expect the US 10-year Treasury yield to move back up to 1.8%-to-1.9% by the end of the year. Bond yields in other markets will also rise, but less so than in the US, given the relatively “high beta” status of US Treasurys (Chart 20). In contrast to tech stocks, banks usually outperform when bond yields are rising (Chart 21). The recent pickup in US consumer lending should also help bank shares (Chart 22). Chart 20US Treasuries Have A Higher Beta Than Most Other Government Bond Markets
US Treasuries Have A Higher Beta Than Most Other Government Bond Markets
US Treasuries Have A Higher Beta Than Most Other Government Bond Markets
Chart 21Bank Shares Thrive In A Rising Yield Environment
Bank Shares Thrive In A Rising Yield Environment
Bank Shares Thrive In A Rising Yield Environment
Chart 22Recent Pickup In US Consumer Lending Will Help Bank Shares
Recent Pickup In US Consumer Lending Will Help Bank Shares
Recent Pickup In US Consumer Lending Will Help Bank Shares
Chart 23Outperformance Of Tech Stocks Not Backed By Trend In Earnings Estimates
Outperformance Of Tech Stocks Not Backed By Trend In Earnings Estimates
Outperformance Of Tech Stocks Not Backed By Trend In Earnings Estimates
Chart 24Non-US Stocks And Value Stocks Typically Perform Best When The Dollar Is Falling
Non-US Stocks And Value Stocks Typically Perform Best When The Dollar Is Falling
Non-US Stocks And Value Stocks Typically Perform Best When The Dollar Is Falling
It is worth noting that the outperformance of tech stocks over the past six weeks has not been mirrored in relative upward revisions to earnings estimates (Chart 23). Without the tailwind from relatively fast earnings growth, tech names will lag the market over the remainder of 2021. The US dollar usually weakens when growth momentum rotates from the US to the rest of the world, which is likely to occur in the second half of this year. A dovish Fed will put further downward pressure on the greenback. Non-US stocks and value stocks typically perform best when the dollar is falling (Chart 24). Peter Berezin Chief Global Strategist peterb@bcaresearch.com Global Investment Strategy View Matrix
The Message From The Yield Curve
The Message From The Yield Curve
Special Trade Recommendations
The Message From The Yield Curve
The Message From The Yield Curve
Current MacroQuant Model Scores
The Message From The Yield Curve
The Message From The Yield Curve