Labor Market

Highlights Indian stocks need more time to digest and consolidate the significant gains from earlier this year. However, the country’s medium and long-term growth outlook remains positive. Indian firms’ profit margins will likely settle at a higher level than usual. That will also put a floor on its equity multiples. With an imminent topline recovery, the main driver of Indian stocks next year will be profits, in contrast with multiple expansions during the last year and a half. India is beginning a cyclical expansion with a cheap rupee. Stay neutral Indian stocks in an EM equity basket for now. Investors should overweight India in an EM domestic bond portfolio. Feature Chart 1Indian Stocks Are Overbought
Indian Stocks Are Overbought
Indian Stocks Are Overbought
We tactically downgraded Indian stocks from overweight to neutral in EM and emerging Asian equity portfolios in early October this year. This call has worked out well so far as India’s absolute and relative share prices seem to have peaked. The primary reason for our tactical “neutral” call on Indian equities was this market’s vertical rise earlier this year, both in absolute and relative terms. Similar spikes – in terms of magnitude and duration back in 2007 and in 2014 – were followed by a period of underperformance (Chart 1). Yet, we recommended downgrading to only a neutral allocation. The reason is that the country’s cyclical outlook remains constructive, and the profit expansion cycle has further to run. That forbade us from turning too bearish on this bourse. A neutral stance on India also makes sense for the next several months as this bourse digests and consolidates its previous gains. In this report, we detail the various nuances of our analysis. Meanwhile, the Indian currency is cheap versus the greenback and will likely be one of the best performing currencies in the EM world over the next year. A positive currency outlook also makes Indian government bonds attractive for foreign investors, as Indian bonds also offer a high yield amid a benign domestic inflation backdrop. Dedicated EM domestic bond portfolios should stay overweight India. Equity Multiple Compression Ahead? Chart 2India's Profit Margin Expansion Has Led To Its Equity Re-Rating
India's Profit Margin Expansion Has Led To Its Equity Re-Rating
India's Profit Margin Expansion Has Led To Its Equity Re-Rating
An upshot to the steep equity rally earlier this year has been India’s stretched valuations. That made many investors question the sustainability of the outperformance. A pertinent question, therefore, is how overvalued have Indian stocks become? And how much multiple compression can investors expect in this bourse? Before we answer this question, it’s useful to understand what drove the cyclical re-rating of Indian markets in the first place. The solid black line in Chart 2 shows the gross profit margins of all Indian listed non-financial firms. They have risen substantially since spring 2020 to reach decade-high levels. Margin expansions of this magnitude are indicative of material efficiency gains; and are usually rewarded with an equity re-rating. This is indeed what happened since spring 2020: stock multiples rose following the expanding margins. The same can be said if we only consider the major non-financial corporations’ EBITDA margins (Chart 2, bottom panel). If one looks at the cyclically adjusted P/E ratio (CAPE) instead, we see a very similar thing: the CAPE ratio has also risen in line with rising profit margins (Chart 3). Chart 3Profit Margins Have A Bearing On Equity Valuations
Profit Margins Have A Bearing On Equity Valuations
Profit Margins Have A Bearing On Equity Valuations
Charts 2 and 3 show that the positive correlations between profit margins and stock multiples held steady over past several cycles. Hence, it will be reasonable to expect that should Indian firms hold on to wide margins, they will not suffer a significant de-rating going forward. Can Margins Stay Wide? Chart 4Indian Firms' Borrowing Costs Will Likely Stay Low
Indian Firms' Borrowing Costs Will Likely Stay Low
Indian Firms' Borrowing Costs Will Likely Stay Low
Before we delve into the question of whether margins can stay wide, we need to understand what caused such a margin expansion in the first place. That cause is cost cutting: wage bills have gone down as businesses slashed employees. Data from Oxford economics show that there had been 9% fewer workers in India as of September 2021 compared to March 2020, just before the pandemic. Interest expense has also gone down – both relative to sales and profits (Chart 4) – as interest rates were cut aggressively. In our view, the latest rollover in profit margins will likely be temporary and limited. It is probably due to hiring back of some employees. Beyond a near-term limited drop in margins, the more relevant question to ask is, can Indian corporations maintain high margins? Our bias is that, to a large extent, they can. The main reason is that firms’ costs are slated to stay under control: Chart 5Indian Companies Do Not Face Any Wage Pressures
Indian Companies Do Not Face Any Wage Pressures Firms' Costs Will Likely Stay Low As Wage Pressures Are Muted...
Indian Companies Do Not Face Any Wage Pressures Firms' Costs Will Likely Stay Low As Wage Pressures Are Muted...
Wage expectations are low. Going forward, as millions of new job seekers and workers temporarily discouraged by the pandemic enter the job market, wages have little chance of much of an increase. The top panel of Chart 5 shows salary expectations from an industrial survey by RBI. Both the assessment for the current quarter and expectations for the next quarter have been a net negative for a while. Rural wages are also similarly timid (Chart 5, bottom panel). Notably, companies’ hiring back of employees is slow. It seems they prefer to substitute labor by capital by investing in new machines and equipment. This will boost productivity and cap wages. Overall, high productivity growth will keep companies’ profit margins wide and excess labor will suppress wages. Higher margins and low inflation are bullish for the stock market. Critically, headline inflation is within the central bank target bands, and our model shows that it will likely remain as such (Chart 6, top panel). Core inflation is also likely to stay flattish (Chart 6, bottom panel). This means the odds are that the central bank will not raise rates anytime soon. Flattish inflation and policy rates mean firms’ borrowing costs, in both nominal and real terms, are slated to stay approximately as low as they are now. Low real borrowing costs are usually a tailwind for stocks (Chart 7).
Chart 6
Chart 7Low Borrowing Costs Are Bullish For Stocks
Low Borrowing Costs Are Bullish For Stocks
Low Borrowing Costs Are Bullish For Stocks
All put together, Indian companies will likely see their costs largely under control. That, in turn, should keep profit margins wider than usual. Wide profit margins should limit multiple compression. Can The Topline Rise Further? Wider margins will boost total profits if and once the topline (revenues) recovers. So, the next question is, how much topline recovery is in the cards? Chart 8Indian Economy Is In A Rapid Expansion Mode
Indian Economy Is In A Rapid Expansion Mode
Indian Economy Is In A Rapid Expansion Mode
There are already signs that sales will likely accelerate in the months to come: PMI indexes for both the manufacturing and services sectors have recovered strongly since the Delta variant-induced lockdowns in spring. They are now hovering around a very high level of close to 60. This indicates that the economy is in a rapid expansion mode (Chart 8). The Industrial Outlook survey (conducted by the RBI) shows that the order books for the September quarter was already at a decade-high level. The expectation for the next few quarters is even more elevated – indicating strong momentum (Chart 9, top panel). In other surveys, such as the PMI and Business Expectation survey (from Dun & Bradstreet), we see similar strong order books (Chart 9, bottom panel). While orders are strong, inventory of finished goods is low. Not surprisingly, businesses are expecting very high-capacity utilization in the next few quarters (Chart 10, top two panels). Chart 9Firms' Order Books Are Quite Robust
Firms' Order Books Are Quite Robust
Firms' Order Books Are Quite Robust
Chart 10Low Inventories Mean Stronger Economic Activity Ahead
Low Inventories Mean Stronger Economic Activity Ahead
Low Inventories Mean Stronger Economic Activity Ahead
They are expecting to hire more people. Companies also believe consumer demand will revive which will enable wider profit margins. In sum, firms are optimistic about accelerating economic activity (Chart 10, bottom two panels). Chart 11A Positive Bank Credit Impulse Is Bullish For Industrial Activity
A Positive Bank Credit Impulse Is Bullish For Industrial Activity
A Positive Bank Credit Impulse Is Bullish For Industrial Activity
This, in turn, is encouraging them to make capital investments. Finally, the commercial banks’ credit impulse has also turned positive. Rising bank credit impulses usually signal stronger industrial production (Chart 11). To summarize, chances are that firms’ top lines are set to rise materially. Coupled with high margins, this will translate into strong profit acceleration in the next several quarters. Put differently, over the past year and a half, Indian firms witnessed rising margins. Going forward, they will likely see rising profits. Higher profits, in turn, will propel Indian share prices cyclically beyond any short-term consolidation. A Sustainable Expansion? In a notable departure from most developed countries, India’s recovery from the pandemic-induced recession has been more capex-led, rather than consumption-led (Chart 12). One reason for that is the Indian government did not supplement the lost household incomes during the lockdowns nearly as much as developed countries did. That, in turn, kept household demand low. And it also contributed to keeping inflation in check – even though India’s supply side was also paralyzed due to strict lockdown measures. On the other hand, firms’ profits soared owing to rigorous cost-cutting. Higher profits in turn have encouraged firms to expand their production capacity. Companies are ramping up capital spending as they expect sales to accelerate in the future (Chart 13). Chart 12A Capex-Led Recovery Will Prolong The Economic Expansion
A Capex-Led Recovery Will Prolong The Economic Expansion
A Capex-Led Recovery Will Prolong The Economic Expansion
Chart 13Strong Profits Are Encouraging Firms To Ramp Up Capital Spending
Strong Profits Are Encouraging Firms To Ramp Up Capital Spending
Strong Profits Are Encouraging Firms To Ramp Up Capital Spending
Notably, the combination of curtailed household demand and robust capital expenditure has set India’s inflation dynamics apart from many other countries in Latin America and EMEA. While India’s inflation remains largely contained, countries in those regions are witnessing accelerating inflation. Also, over a cyclical horizon, a capex-led expansion is very crucial for India as this will determine the duration and magnitude of the cycle. Strong investment expenditures do not only boost firms’ competitiveness and profitability, but they also help keep inflationary pressures at bay. Lower inflation for a longer period means the central bank need not raise rates as soon and/or as much as otherwise would be the case. That in turn allows the economic and profit expansion to continue for longer. An extended period of expansion is also positive for multiples as investors extrapolate profit growth over many years ahead. India’s current dynamics are a case in point. Given the country is facing no imminent interest rate hikes, stock multiples can stay higher for longer. This is because multiple de-rating commences only after meaningful rate hikes have already been accorded (Chart 14). Since that is quite far off, valuations are not facing any immediate and considerable headwinds. Finally, India is beginning the new cycle with a rather inexpensive currency. Chart 15 shows that the rupee is currently cheaper by about 10% than what would be its “fair value” vis-à-vis the US dollar. The fair value has been derived from a regression analysis of the exchange rate on the relative manufacturing producer prices of India and the US. Chart 14It Takes Several Rate Hikes Before It Hurts Stock Multiples
It Takes Several Rate Hikes Before It Hurts Stock Multiples
It Takes Several Rate Hikes Before It Hurts Stock Multiples
Chart 15India's Cyclical Expansion Has A Tailwind From Cheap Currency
India's Cyclical Expansion Has A Tailwind From Cheap Currency
India's Cyclical Expansion Has A Tailwind From Cheap Currency
Investment Conclusions Equities: Given the vertical rise earlier this year, Indian stocks would likely need a few more months to digest previous gains and consolidate. Hence, even though the country’s cyclical outlook remains constructive, we recommend that dedicated EM and Asian equity portfolios stay neutral on this market for now. Absolute return investors should stay on the sidelines and wait for a better entry point. Currency and Bonds: The rupee is cheap and could be one of the best performers within the EM world over a cyclical horizon. Indian government bonds also offer a good value with a rather high yield (6.4% for 10-year securities) amid a benign inflation outlook. A positive rupee outlook also makes Indian bonds more appealing for foreign investors. Investors should stay overweight India in an EM local currency bond portfolio. Rajeeb Pramanik Senior EM Strategist rajeeb.pramanik@bcaresearch.com Footnotes
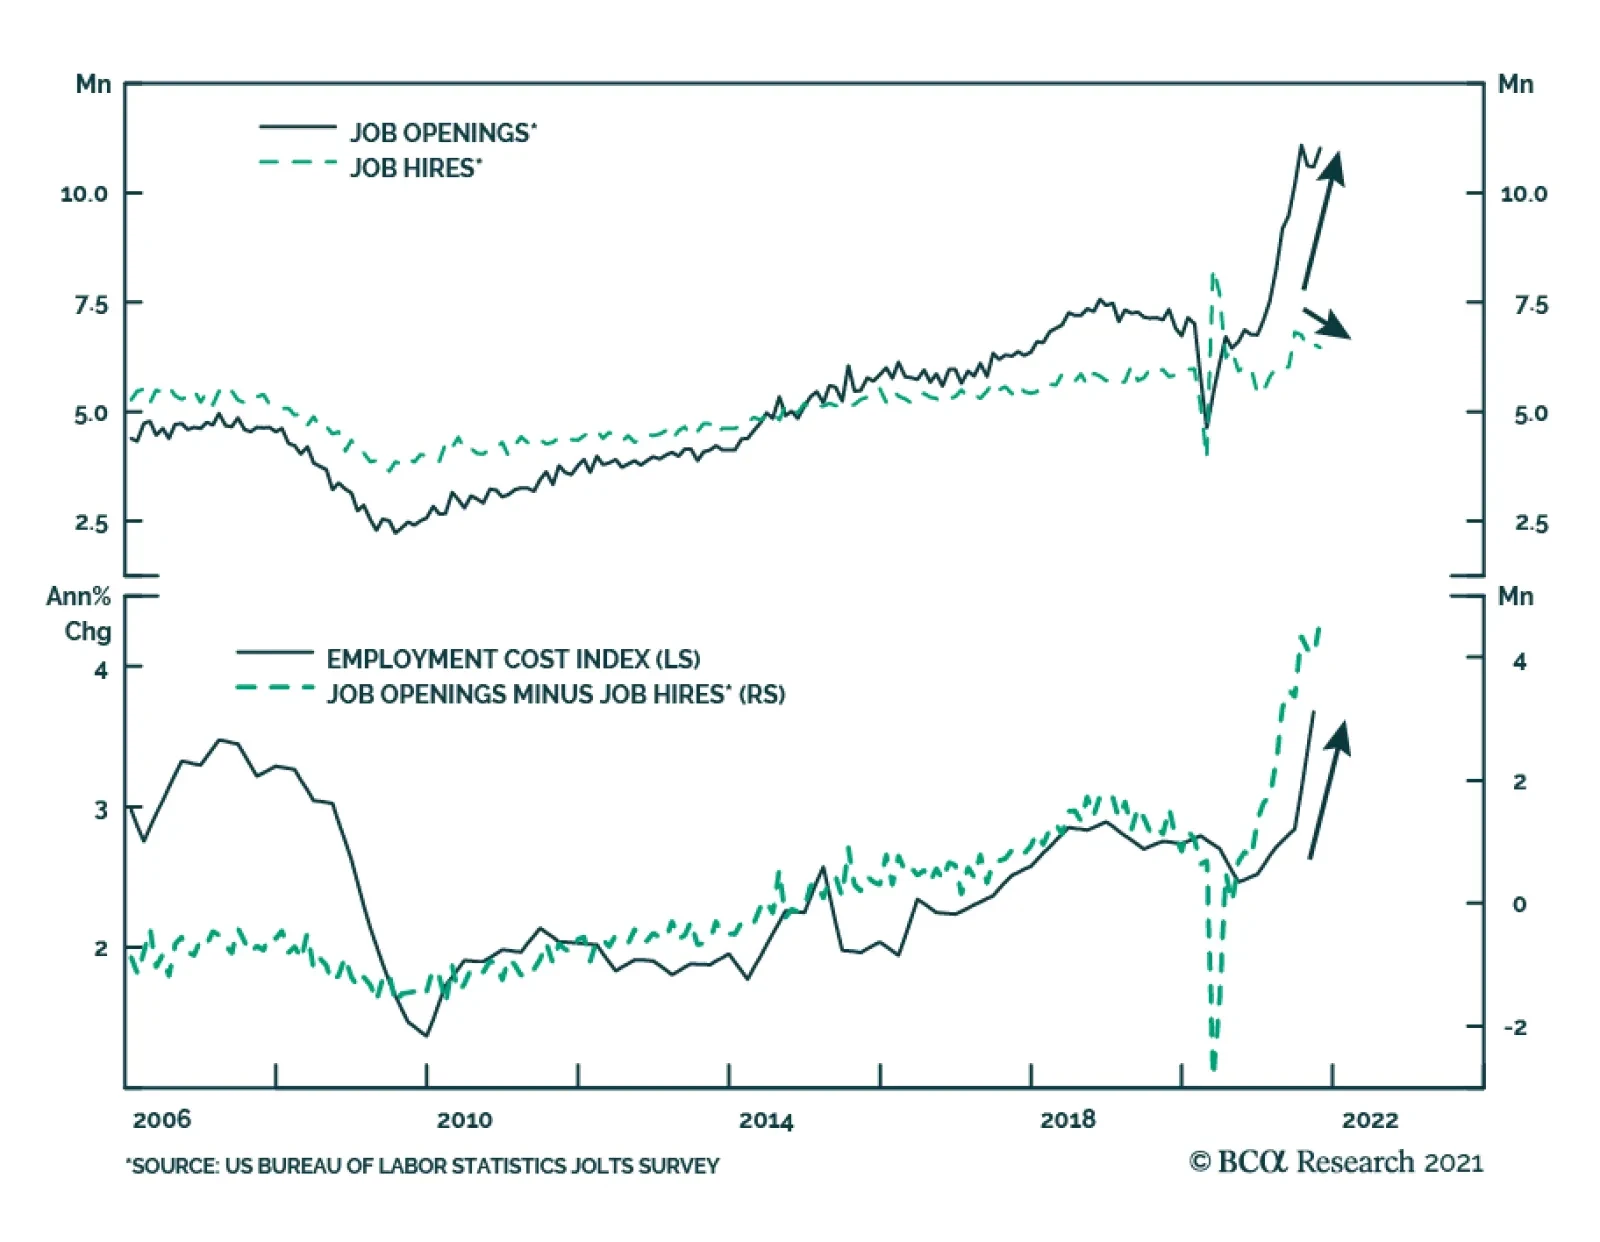
US job openings from the October JOLTS survey were stronger than expected: they increased to 11 million versus an anticipated 10.5 million. Moreover, the September figure was revised upwards from 10.4 million to 10.6 million. Meanwhile, the number of hires…
Dear Clients, Next week, in addition to sending you the China Macro And Market Review, we will be presenting our 2022 outlook on China at our last webcasts of the year “China 2021 Key Views: A Challenging Balancing Act”. The webcasts will be held Wednesday, December 15 at 10:00 am EDT (English) and Thursday, December 16 at 9:00 am HKT (Mandarin). Best regards, Jing Sima China Strategist Highlights China’s policymakers are balancing between staying the course with structural reforms and stabilizing the economy. This carefully calibrated approach means that Beijing will only initiate piecemeal policy easing in the near term. China will ramp up investment in the new economy, which is too small to fully offset the drag on the aggregate economy from weakening old economy sectors. In the next three to six months, the economy will deteriorate further, but Beijing will only press the stimulus accelerator harder if their pressure points are breached. A zero-tolerance policy towards COVID will be maintained for the foreseeable future. Uncertainties surrounding the Omicron variant will reinforce this approach. The common prosperity policy initiative will likely accelerate ahead of the 20th National Congress of the Chinese Communist Party (NCCCP) in the fall of 2022. While the plan will ultimately benefit income and consumption for the majority of Chinese households, the uncertainties surrounding impending tax reforms will curb demand for housing and luxury goods in the short term. We remain underweight Chinese stocks. Prices for onshore stocks will likely fall in the next three to six months when the market starts to price in lower-than-expected economic growth and disappointing stimulus. Selloffs in the first half of 2022 may present an opportunity to turn positive on onshore stocks in absolute terms. We will turn bullish on Chinese stocks relative to global equities only when credit expansion overshoots weakness in the economy, which has a low likelihood. We continue to favor onshore stocks versus offshore within a Chinese equity portfolio. Tensions between the US and China may intensify leading up to the political events next year. Chinese offshore stocks, highly concentrated in internet companies, still face the risks of being caught in both geopolitical crossfires and domestic regulatory pressures. Feature China’s economy slowed significantly in 2H21, with the extent of policy tightening and magnitude of the decline in growth much larger than global investors expected. As we forecasted in our last year’s Key Views report, 2021 marked the beginning of a new era in which policymakers would switch gears from building a "moderately prosperous society" to becoming a "great modern socialist nation”.The pivot means that officials would tolerate slower economic growth, implement tougher financial and industry regulations, and accelerate structural reforms. On the cusp of 2022, we are cautious about the willingness of China’s top leadership to initiate large-scale policy easing. Even though policy tone has shifted to a more pro-growth bias, authorities are still trying to replace old economic drivers with the new economy sectors. Furthermore, they are struggling to maintain a delicate balance between boosting short-term growth and maintaining long-term reforms goals. As a result, their policies are sending mixed signals. As seen in 2018 and 2019, the policymakers’ reluctance to activate a full-scale stimulus does not bode well for global commodity prices. Chinese onshore stocks underperformed their global counterparts during the 2018-19 period. Chinese stocks will face nontrivial headwinds in the coming months and warrant a cautious stance until more stimulus is introduced and the macro picture begins to meaningfully improve. The main themes in our outlook for 2022 are discussed below. Key View #1: Balancing Between The Old And New Economies Despite a recent pro-growth bias in the policy tone, the speed of easing has been incremental and the magnitude piecemeal. Moreover, authorities are telegraphing policy support in new economy sectors (such as high tech and clean energy), while only somewhat loosening restrictions in old economy sectors (mainly property and infrastructure). Chart 1Current Easing Path Is Looking A Lot Like In 2018/19
Current Easing Path Is Looking A Lot Like In 2018/19
Current Easing Path Is Looking A Lot Like In 2018/19
China’s policy framework has shifted since late 2017 as we noted in previous reports. The top leadership is more determined to stay the course with reforms and tolerate slower growth in the old economy. Our BCA Li Keqiang Leading Indicator highlights policymakers’ carefully calibrated policy actions to avoid a dramatic overshoot of credit growth; these actions are consistent with 2018/19 and starkly contrast with policy frameworks in 2012 and 2015. Monetary conditions have meaningfully eased, but the rebound in money supply and credit growth has lagged and is muted due to heightened regulatory oversight (Chart 1). Investors should keep low expectations about the policymakers’ willingness to boost growth in old economy sectors. The easing of restrictions in property sector – from prompting banks to resume lending to qualified homebuyers and developers, to allowing funding for developers to acquire distressed real estate assets – are steps to alleviate an escalating risk of widespread bankruptcies among real estate developers. However, regulators have not changed the direction of their structural policies. Funding constraints placed on both developers and banks since last August remain intact. Banks still need to meet the “two red lines” that set the upper limit on the portion of their lending to the property sector, while developers must bring their leverage ratios below the “three red lines” by end-2023. Maintaining these binding constraints on developers and banks will continue to weigh on the housing market in the coming years. The recent easing may reduce the intensity of funding constraints, but the banks will be extremely cautious to extend lending to a broad range of developers. Aggressive crackdowns on property market speculation in the past 12 months has fundamentally shifted both developers’ and consumers’ expectations for future home prices. Growth in home sales and new projects dropped to their 2015 lows, while current real estate inventories are comparable to 2015 highs (Chart 2). Therefore, unless regulators are willing to initiate more aggressive policy boosts, such as cutting mortgage rates and/or providing government funds to monetize inventory excesses in the housing market, the current easing measures probably will not revive sentiment in the property market. Thus, odds are that the property market downtrend will extend through 2022 (Chart 3). Chart 2Downward Momentum In Property Market Comparable To 2015
Downward Momentum In Property Market Comparable To 2015
Downward Momentum In Property Market Comparable To 2015
Chart 3Policymakers Will Have To Allow Significant Re-leveraging To Revive The Market
Policymakers Will Have To Allow Significant Re-leveraging To Revive The Market
Policymakers Will Have To Allow Significant Re-leveraging To Revive The Market
Chart 4Key Indicators Show Weak Signs Of Revival In Infrastructure Spending
Key Indicators Show Weak Signs Of Revival In Infrastructure Spending
Key Indicators Show Weak Signs Of Revival In Infrastructure Spending
We expect some modest increase in infrastructure spending next year from the meager 0.7% growth in 2021, but we are skeptical that policymakers will allow any substantial rebound. Shadow banking activity and infrastructure project approval, two key indicators we monitor for signs of a meaningful easing in infrastructure spending, show little improvement (Chart 4). Our outlook for infrastructure investment is based on the following: Since 2017 policymakers have assumed a much more hawkish approach toward reducing investment in the capital-intensive and unproductive old economic sectors. Next year’s 20th NCCCP will not fundamentally change this policy setting. The 19th NCCCP in late 2017 deviated from the past; infrastructure investment growth downshifted following the event, whereas significant spending boosts had followed previous NCCCPs (Chart 5). Beijing adhered to its structural downshift in infrastructure spending even during the 2018/19 US-China trade war and after last year’s pandemic-induced economic contraction. Chart 5Infrastructure Investment Shifted To A Lower Gear Following The 19th NCCCP
Infrastructure Investment Shifted To A Lower Gear Following The 19th NCCCP
Infrastructure Investment Shifted To A Lower Gear Following The 19th NCCCP
Chart 6
Secondly, government spending since 2017 has tilted towards social welfare over building “bridges to nowhere”, a meaningful change from the past and in keeping with President Xi Jinping’s political priorities (Chart 6). The trend will likely continue next year because local governments need to maintain large social welfare budgets to counter the economic impact of the prolonged domestic battle against COVID. Local government revenues, on the other hand, will be reduced due to slumping land sales. Thirdly, there has been strong policy guidance by the central government to shift investment to the new economy sectors and away from traditional infrastructure projects. The PBoC in early November launched the carbon emission reduction facility (CERF) to offer low interest loans to financial institutions that help firms cut carbon emissions.
Chart 7
China’s new economy sectors have experienced rapid growth in recent years, but in the short-term, infrastructure spending in those sectors will not fully offset a reduction in traditional infrastructure (Chart 7). The combined spending in tech infrastructure (including information transmission such as 5G technology and services) and green energy stood at RMB1.6 trillion last year, compared with the RMB19 trillion investment in traditional infrastructure and RMB14 trillion in the real estate sector. Bottom Line: Beijing will continue to push for investment in new economy sectors since the leadership is determined to reduce dependency on unproductive segments of the economy. Even as the economy slows, they will be reluctant to ramp up leverage and channel capital to the old economy sectors. Unfortunately, the small size of the new economy’s sectors versus the old economy will inhibit their ability to stabilize and accelerate economic growth via these policies. Key View #2: The Pressure Points We do not think Beijing will allow the economy to freefall past the “point of no return”. The economy still needs to grow by 4.5-5.0% per annum between 2021 and 2035 to achieve the target of doubling GDP by 2035 (Chart 8A and 8B). Chart 8AThe Structural Downshift In Chinese Growth Will Continue…
The Structural Downshift In Chinese Growth Will Continue…
The Structural Downshift In Chinese Growth Will Continue…
Chart 8B...But A 5%+/- Rate Of Growth Will Keep China Well On Track Of Doubling Its GDP By 2035
...But A 5%+/- Rate Of Growth Will Keep China Well On Track Of Doubling Its GDP By 2035
...But A 5%+/- Rate Of Growth Will Keep China Well On Track Of Doubling Its GDP By 2035
Investors should watch the following pressure points to assess whether China’s leaders will feel the urgency to turn policy to outright reflationary: A collapse in onshore financial market prices. China’s economic fundamentals will weaken further in the next three to six months and the risks to Chinese equity prices are on the downside. However, the odds are still low that the onshore equity, bond and currency markets will plunge as in 2015. Onshore stocks are cheaper than during the height of their 2015 boom-bust cycle, margin trading remains well below its 2015 level and economic fundamentals are stronger (Chart 9). Selloffs by global investors in China’s offshore equity and high-yield bond markets have not triggered much panic in the onshore markets and, therefore, will not drive Beijing to change its macro policy (Chart 10). Chart 9Valuations In Chinese Stocks Are Not As Extreme As In 2015
Valuations In Chinese Stocks Are Not As Extreme As In 2015
Valuations In Chinese Stocks Are Not As Extreme As In 2015
Chart 10Onshore Markets Have Been Relatively Calm
Onshore Markets Have Been Relatively Calm
Onshore Markets Have Been Relatively Calm
Chart 11China/US Growth Rates In 2022 Will Be Uncomfortably Close, Based On IMF Forecasts
China/US Growth Rates In 2022 Will Be Uncomfortably Close, Based On IMF Forecasts
China/US Growth Rates In 2022 Will Be Uncomfortably Close, Based On IMF Forecasts
Narrowing growth differentials between China and the US. In the IMF’s October World Economic Outlook, economic growth in 2022 for China and the US is projected at 5.6% and 5.2%, respectively. The forecast suggests that next year the growth differential between the two largest economies will be narrowed to less than one percentage point, rarely seen in China’s post-reform history (Chart 11). Notably, the most recent Bloomberg consensus estimate for the 2022 US real GDP growth is much lower at 3.9%, whereas China is expected to grow by 5.3% and in line with the IMF forecast. We do not suggest that Beijing will make its policy decisions based on these growth projections. Rather, we expect that if China’s growth in 1H22 falls behind that in the US, Chinese policymakers will feel an urgency to stimulate the economy and show a better economic scorecard ahead of the all-important 20th NCCCP next fall. Rising unemployment. Current data shows a mixed picture. Unemployment rates have been falling in all age groups (Chart 12). Demand for labor in urban areas, on the other hand, has been shrinking (Chart 13). The employment subindex in China’s service PMIs has also been dropping. Our view is that the resilient export/manufacturing sector has provided strong support to employment this year, while the labor supply in urban areas has been sluggish due to tighter travel restrictions and frequent regional lockdowns. The combination of strong manufacturing demand for labor and a lack of supply has reduced excesses in the labor market and the urgency to stimulate the economy (Chart 13, bottom panels). However, the picture could change if China’s exports start to slow into next year. Chart 12China's Unemployment Rate Is Falling...
China's Unemployment Rate Is Falling...
China's Unemployment Rate Is Falling...
Chart 13...But Demand For Labor Is Also Falling
...But Demand For Labor Is Also Falling
...But Demand For Labor Is Also Falling
Bottom Line: In the coming year, investors should watch for three pressure points that may trigger more forceful growth-supporting actions from policymakers: the onshore financial markets, economic growth differentials between the US and China, and labor market dynamics. Key View #3: The Exit Strategy Chart 14Service Sector Activities Have Been Restricted By Domestic Covid Cases And Frequent Lockdowns
Service Sector Activities Have Been Restricted By Domestic Covid Cases And Frequent Lockdowns
Service Sector Activities Have Been Restricted By Domestic Covid Cases And Frequent Lockdowns
China will not completely lift its zero-tolerance policy toward COVID in the coming year. We will likely see tightened domestic preventive measures leading to the Beijing Olympics in February and the NCCCP in October. The zero-tolerance policy cannot be sustained in the long run; China’s stringent counter-COVID measures have created a stop-and-go pattern in China’s service sector, which has taken a toll on household consumption (Chart 14). As such, Chinese policymakers will face a trade-off between hefty economic costs from its current counter-COVID measures, and the potential social costs and risks if there is a dramatic increase in domestic COVID cases. China is estimated to have fully vaccinated more than 80% of its citizens and is close to launching its own mRNA vaccine next year to be used as a booster shot. However, the inoculation rate will likely matter less to Beijing’s decision to relax its draconian approach towards COVID given the emergence of the virulent Omicron variant. Recent statement by China's top respiratory experts suggests that China will return to normalcy if fatality rate of COVID-19 drops to around 0.1%, and when R0 (the virus reproduction ratio) sits between 1 and 1.5. A more important factor that could influence Beijing’s decision is the development and effectiveness of anti-viral drug treatments. Pfizer recently announced that its anti-viral oral drug Paxlovid can reduce the hospitalization and death rates by 89% if taken within three days of the onset of symptoms. The drug-maker has announced its intention to produce enough of the medication to treat 50 million people in 2022. China’s Tsinghua University has also developed an antibody combination drug that may reduce hospitalization and mortality by 78% and is expected to be approved by Chinese regulators within this year. Beijing’s decision to abandon its zero-tolerance policy, therefore, will be based on the combined effectiveness of both vaccines and treatments. If clinical trials prove that the new antiviral drugs are effective in treating COVID patients, combined with China’s aggressive rollout of booster shots, then Beijing may incrementally relax its COVID containment measures by late 2022 or early 2023. Bottom Line: China will not loosen its zero-tolerance policy until a combination of vaccines and treatments proves to be effective against COVID. Key View #4: Common Prosperity Will Gather Steam We expect the notion of common prosperity espoused by President Xi Jinping to gain momentum ahead of the 20th NCCCP. Beijing will likely roll out measures to support consumption, particularly for low-income households. At the same time, there is a high possibility that policymakers will introduce taxes on luxury goods and accelerate the legislative process on real estate taxes. Chart 15The Slump In Property Market Will Likely Be An Extended One
The Slump In Property Market Will Likely Be An Extended One
The Slump In Property Market Will Likely Be An Extended One
The property market will remain in a limbo in 2022. In the near term, potential homebuyers will likely maintain their wait-and-see attitude before details of real estate taxes are disclosed. Home sales will remain in contraction despite improved mortgage lending conditions (Chart 15). Consumption taxes are expected to increase, targeting consumer discretionary and/or luxury goods. Chinese consumption of luxury goods benefited from government pro-growth measures last year, flush liquidity in the market and global travel restrictions. Meanwhile, growth in aggregate household income and consumption has been lackluster. President Xi Jinping’s common prosperity policy initiative is intended to narrow the income and wealth gap between the rich and poor. Moreover, empirical studies show that the marginal propensity to consume among lower- and middle-income groups, which account for more than 80% of China’s total population, is significantly higher than that of high-income groups. We expect more support for lower income groups as Beijing looks to stabilize the economy and narrow the wealth gap. Bottom Line: There is a high probability that policymakers will introduce taxes on the consumption of luxury goods and initiate the legislative process on real estate taxes in the next 12 months. Investment Conclusions Chinese stocks in both the onshore and offshore markets have cheapened relative to global equities. However, in absolute terms onshore stocks are not unduly cheap and offshore stocks are cheap for a reason (Chart 16). We remain defensive in our investment strategy for Chinese stocks in the next two quarters, given the headwinds facing the onshore and offshore markets. We do not rule out the possibility that China’s authorities will stimulate more forcefully in the next 12 months. However, for Chinese policymakers to ramp up leverage again, the near-term dynamics in the country’s economic cycle will have to significantly worsen. Chinese stocks will sell off in this scenario, but the selloff will provide investors with a good buying opportunity in the expectation of a more decisive stimulus (Chart 17). Chart 16Chinese Onshore Stocks Are Not Particularly Cheap, While Offshore Stocks Are Cheap For A Reason
Chinese Onshore Stocks Are Not Particularly Cheap, While Offshore Stocks Are Cheap For A Reason
Chinese Onshore Stocks Are Not Particularly Cheap, While Offshore Stocks Are Cheap For A Reason
Chart 17Selloff Risks Are High Before The Economy Stabilizes
Selloff Risks Are High Before The Economy Stabilizes
Selloff Risks Are High Before The Economy Stabilizes
Chart 18A Deja Vu Of 2018-2019?
A Deja Vu Of 2018-2019?
A Deja Vu Of 2018-2019?
If the economy slows in an orderly and gradual manner, then there is a slim chance that policymakers will allow an overshoot in stimulus. The Politburo meeting on Monday sent a stronger pro-growth message, the PBoC cut the reserve requirement ratio (RRR) rate by 50bps, and regulators will likely allow a front-loading of local government special-purpose bonds in Q1 next year. However, based on the lessons learned in 2019, regulators can be quick to scale back policy support if they see there is a risk of overshooting in credit expansion (Chart 18). The measured stimulus during the 2018-2019 period did not bode well for Chinese stocks or global commodity prices (Chart 19A and 19B). Meanwhile, we do not think the recent selloff in offshore stocks provided good buying opportunities. In the next 6 to 12 months, any tactical rebound in Chinese investable stocks will present a good selling point. Chart 19AChina's Measured Stimulus In 2018-2019 Did Not Bode Well For Global Commodity Prices
China's Measured Stimulus In 2018-2019 Did Not Bode Well For Global Commodity Prices
China's Measured Stimulus In 2018-2019 Did Not Bode Well For Global Commodity Prices
Chart 19BChinese Stocks Underperformed In 2018-2019
Chinese Stocks Underperformed In 2018-2019
Chinese Stocks Underperformed In 2018-2019
Investable stocks, highly concentrated in China’s internet companies, are caught in domestic regulatory clampdowns and geopolitical crossfires. We expect tensions between China and the US to intensify in 2022 in light of next fall’s 20th NCCCP in China and mid-term elections in the US. Furthermore, Didi Global’s decision to delist from the New York Stock Exchange last week highlights that both China and the US are unanimous in their efforts (although for different reasons) to remove Chinese firms from US bourses. Risks associated with future delisting of Chinese firms will continue to depress the valuations of Chinese technology stocks. Jing Sima China Strategist jings@bcaresearch.com Market/Sector Recommendations Cyclical Investment Stance
Highlights Omicron vs. The Fed: The new COVID variant has thrown a growth scare into markets, but the bigger concern is the Fed belated playing catch up to high inflation and low unemployment. Fade the Omicron bond rally, and position for higher US Treasury yields over the next year with the Fed threatening to taper faster, and potentially hike sooner, than markets expect. New Zealand: Underlying growth and inflation fundamentals, soaring house prices, and the central bank’s historical reaction function indicate that the Reserve Bank of New Zealand will lift the cash rate to 2% by the end of 2022. However, markets are already priced for this, leaving little room for New Zealand debt to continue underperforming on a relative basis. We are upgrading New Zealand sovereigns to neutral and initiating a long NZ/short US 10-year spread trade. A Year-End Bout Of Uncertainty Chart of the WeekMarkets Have Been Worried About The Fed Since September
Markets Have Been Worried About The Fed Since September
Markets Have Been Worried About The Fed Since September
Over the past two weeks, we have published Special Reports and thus have not had an opportunity to comment on market moves and news. Needless to say, it has been an eventful period! The emergence of the new Omicron variant, and the hawkish shift in the Fed’s guidance on future policy moves, have injected fresh uncertainty and volatility into global financial markets. Since the existence of Omicron was revealed to the world on Nov 26, 30-year US Treasury yields have fallen by as much as -23bps and the S&P 500 index has been down by as much as -4.4%. Yet the evolving Fed stance, with Fed Chair Jerome Powell hinting last week that the end of tapering and start of rate hikes could begin sooner than expected next year, is having a more lasting influence on risk asset performance. Dating back to the September 23 FOMC meeting, when the Fed first signaled an imminent tapering of bond purchases and pulled forward the timing of liftoff into 2022, the 2-year US Treasury yield has gone up from 0.22% to 0.63%. Importantly, there has been little pullback on the pricing at the front-end of the US Treasury curve due to the Omicron shock. That pre-September-FOMC low in the 2-year Treasury yield also marked the peak in riskier fixed income market performance for 2021, with the Bloomberg Global High-Yield and Emerging Market USD-Denominated Sovereign total return indices down -2.0% and -1.8%, respectively, since Sept 23 (Chart of the Week). Other risk assets also appear to be responding more to news about the Fed than Omicron. Equity markets stopped climbing since the Fed announced the first taper of bond purchases at the November 3 FOMC meeting – three weeks before the world knew of Omicron - which also coincided with troughs in the VIX index and corporate credit spreads, not only in the US but in Europe and emerging markets as well (Chart 2). Of course, it is difficult to disentangle which is having a greater impact, the variant or the Fed, when details on both are evolving at the same time. Omicron Investors are understandably right to be nervous about a new COVID variant that can reportedly evade existing vaccines and even infect those who have had COVID previously. The whole idea of “putting COVID in the rearview mirror’ that has helped fuel booming equity and credit markets was predicated on vaccines being both effective and widely available. However, when investors see COVID case numbers start to pick up in the US and Europe, with vaccination rates twice that of South Africa where Omicron was first detected (Chart 3), this raises concern about a return to pre-vaccine economic restrictions and uncertainty. Chart 2A Typical Risk-Off Response To The Emergence Of Omicron
A Typical Risk-Off Response To The Emergence Of Omicron
A Typical Risk-Off Response To The Emergence Of Omicron
Chart 3Omicron Putting A Dent In Vaccine Optimism
Omicron Putting A Dent In Vaccine Optimism
Omicron Putting A Dent In Vaccine Optimism
The “Omicron effect” on fixed income markets has been most evident in the repricing of interest rate expectations. Since the presence of Omicron was revealed on November 26, there has been a reduction in the cumulative amount of tightening discounted to the end of 2024 in the overnight index swap (OIS) curves of the major developed economies (Table 1). The moves were most evident in the US (32bps of hikes priced out), Canada (37bps) and Australia (37bps). Table 1Pricing Out Some Rate Hikes Because Of Omicron
Blame The Fed, Not Omicron, For More Volatile Markets
Blame The Fed, Not Omicron, For More Volatile Markets
Much is still unknown about the dangers of the Omicron variant. The admittedly very early data out of South Africa, however, indicates that there has not been a major surge in hospitalizations related to Omicron cases. A new COVID strain that proves to be more virulent, but that does not strain health care systems, should help allay investor concerns over a major economic hit from Omicron. This presents an opportunity to put on positions that will profit from a rebound in global bond yields led by higher US Treasury yields. The Fed The Omicron threat to date has not been enough to move the Fed off its plans to rein in the monetary accommodation put in place in 2020 to fight the pandemic. If Omicron is to have any impact on the US economy, it will do so at a time when the economy continues to grow well above trend. The November reading on the ISM Manufacturing survey showed strength in the overall index, with a stabilization of the New Orders/Inventory ratio that leads overall growth, and only a very modest reduction in the still-elevated Prices Paid and Supplier Deliveries indices (Chart 4). The Atlanta Fed’s GDPNow model is suggesting that US real GDP growth could come in at a whopping 9.7% in Q4. As further evidence that the US economy is growing at a pace well above trend, just look to labor market data. New US jobless claims are at the lowest level since 1969. The November US Payrolls report showed that the headline unemployment rate fell 0.4 percentage points on the month to 4.2% - within the range of full employment estimates of the FOMC - even with actual job growth falling short of consensus forecasts (Chart 5, top panel). Chart 4Nothing Bond-Bullish In US Manufacturing
Nothing Bond-Bullish In US Manufacturing
Nothing Bond-Bullish In US Manufacturing
The improving health of the labor market is being felt more broadly, with big declines seen in unemployment rates for minorities and less-educated Americans (second panel). That point is of critical importance to the Powell Fed that has emphasized reducing racial and educational gaps in US unemployment as part of reaching its goal of “maximum employment”. Chart 5Nothing Bond-Bullish In US Labor Markets
Nothing Bond-Bullish In US Labor Markets
Nothing Bond-Bullish In US Labor Markets
Tightening labor markets are also evident in accelerating wage momentum. Excluding the 2020 spike driven by labor force compositional effects related to COVID lockdowns, the year-over-year growth in average hourly earnings reached a 39-year high of 5.9% in November (third panel). The Fed now seems willing to finally confront high US inflation and strong economic growth with some tightening of monetary policy. Chart 6A Near-Term Break From Supply-Fueled Inflation?
A Near-Term Break From Supply-Fueled Inflation?
A Near-Term Break From Supply-Fueled Inflation?
Powell caused some investor agita last week when he indicated that the taper could end before mid-2022, the previous FOMC guidance, which would open the door for rate hikes. We see Powell’s comments as less about signaling an intensifying hawkishness and more about giving the Fed optionality on when to start lifting rates next year in the event the US economy continues to overheat. The Fed strongly believes that tapering must end before rate hikes can begin, so a more accelerated taper allows for an earlier liftoff date, if necessary. To that end, the supply fueled surge in inflation this year, which has lingered for far longer than the Fed anticipated, may be showing some signs of easing. Several indices of global shipping container prices are off the highs, while there is a reduced backlog of container ships off key US ports like Los Angeles. Overall commodity price momentum has peaked, in line with slower, but still strong, global industrial activity (Chart 6). An easing of supply-driven price pressures would be welcome by the FOMC. It would allow time to evaluate both the Omicron threat and evolving US labor market dynamics, instead of being forced to fight a rearguard action against accelerating inflation. However, a shift away from goods/commodity inflation to more domestically driven inflation would not lessen the need for the Fed to begin lifting rates next year – in fact, it could even strengthen the case for the Fed to hike rates faster, and by more, than currently discounted in markets. Importantly, forward looking indicators are still pointing to solid US growth next year (Chart 7): The Conference Board’s leading economic indicator continues to grow at a pace signaling above-trend growth US financial conditions remain highly accommodative even with the recent market turbulence The New York Fed’s yield curve based recession probability model is indicating that the spread between the 10-year US Treasury yield and the 3-month US Treasury bill rate, currently 138bps, is consistent with only a 9% chance of a US recession over the next year (bottom panel) We continue to recommend a below-benchmark duration stance within US fixed income portfolios, with a yield target on the 10-year benchmark US Treasury yield of 2-2.25% to be reached by the end of 2022. We also continue to recommend positioning in Treasury curve steepening trades. This is admittedly a counter-intuitive suggestion given that the Fed is moving towards a rate hiking cycle, but we see too much flattening priced into the Treasury forward curve over the next year (Chart 8). Chart 7A Positive Message From US Leading Growth Indicators
A Positive Message From US Leading Growth Indicators
A Positive Message From US Leading Growth Indicators
Chart 8Our Favorite Bearish US Rates Trades
Our Favorite Bearish US Rates Trades
Our Favorite Bearish US Rates Trades
For global bond investors, our favorite trade that will benefit from higher US bond yields next year is to position for a wider 10-year US Treasury-German Bund spread (bottom panel). We expect the ECB to avoid any rate increases until at least mid-2023, well after the Fed has begun to tighten. Forward curves in the US and Germany currently discount a relatively stable Treasury-Bund spread in 2022, thus there is no negative carry incurred by positioning for a wider spread. Bottom Line: Omicron has thrown a growth scare into markets, but the bigger concern is that the Fed is belated starting to play catch up to high inflation and low unemployment. Fade the Omicron bond rally, and position for higher US Treasury yields over the next year. New Zealand: How Much Further Can The Bond Selloff Go? Chart 9NZ Sovereign Underperformance Has Been Driven By RBNZ Hawkishness
NZ Sovereign Underperformance Has Been Driven By RBNZ Hawkishness
NZ Sovereign Underperformance Has Been Driven By RBNZ Hawkishness
Over the past year, New Zealand bonds have sold off much faster than developed market peers (Chart 9). Markets correctly recognized the Reserve Bank Of New Zealand (RBNZ) as a central bank that would move more aggressively to tamp down on inflation and manage the financial stability and political risks arising from soaring house prices. The RBNZ has already delivered back-to-back hikes at its October and November meetings, after its plans to hike at the August meeting were thrown off by the Delta variant. Markets are now pricing in a further 172bps of tightening over the coming year, having largely faded any downside growth risk from the Omicron variant. Expectations of continued tightening have been buoyed by the response of New Zealand policymakers, who are largely looking past the Omicron variant. Restrictions have already begun to ease, with the country having entered its “Traffic Light” COVID-19 Protection Framework. The new variant is also unlikely to affect the RBNZ’s tightening path, with Chief Economist Yuong Ha stating that, given the lifting of restrictions, the RBNZ would have raised rates even if Omicron had become known before its November 24 meeting. Given the bond-bearish backdrop, New Zealand government bonds have underperformed substantially this year. On a relative hedged and duration-matched basis, New Zealand sovereigns have underperformed by -6.6% year-to-date with -4.0 percentage points of that underperformance coming after July 21 when we formally moved to an underweight stance on New Zealand debt within global government bond portfolios (Chart 9, bottom panel). However, with monetary policy entering a new phase, led by an increasingly hawkish Fed, we believe it is appropriate to re-assess our New Zealand call and judge whether this underperformance can continue into 2022. The growth picture is broadly supportive of the RBNZ’s stated policy path. Real GDP as of Q2 was above its pre-Covid trend and 2.6% over the RBNZ’s own estimate of potential GDP, supported by an easing of travel restrictions and strong consumer spending (Chart 10). On a forward-looking basis, however, the risk is now that the economy is running too hot, jeopardizing future growth. Consumer and business sentiment has been worsening as inflation expectations soar, with consumers fearing a hit to purchasing power and businesses concerned about the impact of rising input costs on profit margins. Household and business inflation fears also have a strong basis in the realized inflation data, which has soared to a 10-year high of 4.9% (Chart 11). More troublingly, underlying inflation measures such as the trimmed mean and core (excluding food and energy) are now at series highs of 4.8% and 4%, respectively, indicating that higher inflation could prove to be sticky. The RBNZ now sees headline inflation peaking at 5.7% in Q1/2022 before settling to 2% by the end of its forecast horizon in 2024. Chart 10The NZ Economy Is Overheating
The NZ Economy Is Overheating
The NZ Economy Is Overheating
Chart 11The RBNZ Will Welcome A Slight Growth Slowdown
The RBNZ Will Welcome A Slight Growth Slowdown
The RBNZ Will Welcome A Slight Growth Slowdown
The RBNZ clearly attributes higher inflation to an economy running above longer-term capacity rather than short-term supply factors. The Bank’s measure of the output gap is now at the most positive level since 2007, and survey measures of capacity utilization remain elevated. In contrast to the Fed, which is still nominally focused on maximum employment, the RBNZ actually believes that employment is above its maximum sustainable level, and sees a rising unemployment rate as necessary to ease capacity constraints. Given that the RBNZ is clearly comfortable with, and will likely welcome, a gradual rise in unemployment, it will take much more than a slight growth shock to deter the RBNZ from its tightening path. Chart 12Higher Rates Necessary To Stabilize The NZ Housing Market
Higher Rates Necessary To Stabilize The NZ Housing Market
Higher Rates Necessary To Stabilize The NZ Housing Market
The newest, and most politically potent, part of the RBNZ’s remit—house prices – has further supported a bias to tighten monetary policy. However, while still dramatically elevated, house price growth looks to have peaked (Chart 12). The central bank’s hawkish shift earlier in the year has made a clear impact, with house price growth peaking shortly after mortgage rates started picking up in April of this year. Overall household mortgage credit has also begun to decelerate, indicating that the passthrough from monetary policy to credit demand and housing via the mortgage rate is working as intended. However, there is likely further to go. The last time house price growth was somewhat stable around 6.6% in the 2012-2019 period, benchmark 5-year mortgage rates averaged 6.1%. Assuming the spread between the 5-year mortgage and policy rates remains around 4%, history indicates that we would need to see the policy rate rise to at least 2% to cool down the housing market. That 2% level is also the RBNZ’s mean estimate of a “neutral” cash rate—a level at which policy would be neither accommodative nor restrictive (Chart 13). Current market pricing is quite consistent with the RBNZ’s own projected path of rates as of the November meeting—both of which are set to exceed the neutral rate by the end of 2022. Historical experience from the pre-crisis period indicates that this is not uncommon, and that a bout of restrictive policy might be needed to cool down an overheating economy.
Chart 13
Indeed, if the RBNZ’s historical reaction to inflation is any guide, it seems likely that policymakers will want to push rates above inflation. The top two panels of Chart 14 show how anomalous deeply negative real policy rates are in New Zealand. Even if we make the case that developed market real rates are in a structural downtrend, as realized real rates have peaked out at successively lower levels with each tightening cycle, the current gap between the cash rate and core inflation seems obviously unsustainable and requires a tightening of policy. Chart 14NZ Real Rates Are Too Low
NZ Real Rates Are Too Low
NZ Real Rates Are Too Low
Chart 15Go Long The 10-Year NZ Government Bond/US Treasury Spread
Go Long The 10-Year NZ Government Bond/US Treasury Spread
Go Long The 10-Year NZ Government Bond/US Treasury Spread
Another way to think about where policy rates are in relation to a “neutral” level is to look at the yield curve (Chart 14, bottom panel). Typically, the yield curve inverts when markets judge that monetary policy is too restrictive and that short rates are too high relative to a long-run average. However, the New Zealand government bond curve has historically remained inverted for extended periods of time, troughing at around -100bps. This again indicates that the RBNZ is comfortable raising rates above neutral and keeping policy restrictive when needed. Putting together the four factors we have looked at—growth, inflation, asset prices, and the RBNZ’s reaction function—it looks likely that the RBNZ will continue along the tightening path it has set out and chances of any dovish surprise seem slim. At the same time, markets are priced to perfection in terms of the pace and amount of tightening discounted. For New Zealand sovereigns to continue underperforming, however, we will need to see markets price in, on the margin, even more tightening from the RBNZ relative to its peers. With the Fed and other central banks having become more focused on responding to US inflation dynamics, bond-bearish upside shocks to market rate expectations will increasingly come from outside New Zealand. At the same time, in the event of a negative global growth shock, perhaps relating to COVID-19, there is relatively more room for hikes to be priced out in New Zealand. Given our view that bond and rates markets have appropriately priced in the extent of the RBNZ’s likely tightening cycle, we are upgrading New Zealand sovereign debt to neutral, taking profits on our current underweight stance. While we do not include New Zealand debt in our model bond portfolio, we are expressing our view via a new tactical cross-country spread trade: long New Zealand 10-Year government bonds vs. US 10-Year Treasuries (Chart 15). Forwards are currently pricing in a flat spread between the two countries, meaning that any future spread tightening will put our trade in the black. Given that there is more space for markets to price in increased hawkishness from the Fed, we believe that spread compression is likely. We are implementing this trade by going long New Zealand cash bonds and shorting 10-year US Treasury futures. Details can be found on Page 18. Bottom Line: Underlying growth and inflation fundamentals, soaring house prices, and the central bank’s historical reaction function indicate that the Reserve Bank of New Zealand will lift the cash rate to 2% by the end of 2022. However, markets are already priced for this, leaving little room for New Zealand debt to continue underperforming on a relative basis. We are upgrading New Zealand sovereigns to neutral and initiating a long NZ/short US 10-year spread trade. Robert Robis, CFA Chief Fixed Income Strategist rrobis@bcaresearch.com Shakti Sharma Senior Analyst ShaktiS@bcaresearch.com GFIS Model Bond Portfolio Recommended Positioning Active Duration Contribution: GFIS Recommended Portfolio Vs. Custom Performance Benchmark
Image
The GFIS Recommended Portfolio Vs. The Custom Benchmark Index Global Fixed Income - Strategic Recommendations* Duration Regional Allocation Spread Product Tactical Overlay Trades
Dear Client, We are sending you our Strategy Outlook today where we outline our thoughts on the global economy and the direction of financial markets for 2022 and beyond. Next week, please join me for a webcast on Friday, December 10th at 10:00 AM EST (3:00 PM GMT, 4:00 PM CET, 11:00 PM HKT) to discuss the outlook. Also, we published a report this week transcribing our annual conversation with Mr. X, a long-standing BCA client. Please join my fellow BCA strategists and me on Tuesday, December 7th for a follow-up discussion hosted by my colleague, Jonathan LaBerge. Finally, you will receive a Special Report prepared by our Global Asset Allocation service on Monday, December 13th. Similarly to previous years, Garry Evans and his team have prepared a list of books and articles to read over the holiday period. This year they recommend reading materials on key themes of the moment, such as climate change, cryptocurrencies, supply-chain disruption, and gene technology. Included in this report are my team’s recommendations on what to read to understand the underlying causes of inflation. Best regards, Peter Berezin, Chief Global Strategist Highlights Macroeconomic Outlook: Despite the risks posed by the Omicron variant, global growth should remain above trend in 2022. Inflation will temporarily dip next year as goods prices come off the boil. However, the structural trend for inflation is to the upside, especially in the US. Equities: Remain overweight stocks in 2022, favoring cyclicals, small caps, value stocks, and non-US equities. Look to turn more defensive in mid-2023 in advance of a stagflationary recession in 2024 or 2025. Fixed income: Maintain below-average interest rate duration exposure. The US 10-year Treasury yield will rise to 2%-to-2.25% by the end of 2022. Underweight the US, UK, Canada, and New Zealand in a global bond portfolio. Credit: Corporate debt will outperform high-quality government bonds next year. Favor HY over IG. Spreads will widen again in 2023. Currencies: As a momentum currency, the US dollar could strengthen some more over the next month or two. Over a 12-month horizon, however, the trade-weighted dollar will weaken. The Canadian dollar will be the best performing G10 currency next year. Commodities: Oil prices will rise, with Brent crude averaging $80/bbl in 2022. Metals prices will remain resilient thanks to tight supply and Chinese stimulus. We prefer gold over cryptos. I. Macroeconomic Outlook Running out of Greek Letters Just as the world was looking forward to “life as normal”, a new variant of the virus has surfaced. While little is known about the Omicron variant, preliminary indications suggest that it is more transmissible than Delta. The emergence of the Omicron variant is coming in the midst of yet another Covid wave. The number of new cases has skyrocketed across parts of northern and central Europe, prompting governments to re-introduce stricter social distancing measures (Chart 1). New cases have also been trending higher in many parts of the US and Canada since the start of November.
Chart 1
Despite the risks posed by Omicron, there are reasons for hope. BioNTech has said that its vaccine, jointly developed with Pfizer, will provide at least partial immunity against the new strain. At present, 55% of the world’s population has had at least one vaccine shot; 44% is fully vaccinated (Chart 2). China is close to launching its own mRNA vaccine next year, which it intends to administer as a booster shot.
Chart 2
In a worst-case scenario, BioNTech has said that it could produce a new version of its vaccine within six weeks, with initial shipments beginning in about three months. New antiviral medications are also set to hit the market. Pfizer claims its newly developed pill cuts the risk of hospitalization by nearly 90% if taken within three days from the onset of symptoms. The drug-maker has announced its intention to produce enough of the medication to treat 50 million people in 2022. In addition, it is allowing generic versions to be manufactured in developing countries. The company has indicated that its antiviral pills will be effective in treating the new strain. Global Growth: Slowing but from a High Level Assuming the vaccines and antiviral drugs are able to keep the new strain at bay, global growth should remain solidly above trend in 2022. Table 1 shows consensus GDP growth projections for the major economies. G7 growth is expected to tick up from 3.6% in 2021Q3 to 4.5% in 2021Q4. Growth is set to cool to 4.1% in 2022Q1, 3.6% in 2022Q2, 2.9% in 2022Q3, 2.3% in 2022Q4, and 2.1% in 2023Q1. Table 1Growth Is Slowing, But From Very High Levels
Strategy Outlook - 2022 Key Views: The Beginning Of The End
Strategy Outlook - 2022 Key Views: The Beginning Of The End
Chart 3
According to the OECD, potential real GDP growth in the G7 is about 1.4% (Chart 3). Thus, while growth in developed economies will slow next year, it is unlikely to return to trend until the second half of 2023. Emerging markets face a more daunting outlook. The Chinese property market is weakening, and the recent collapse of the Turkish lira highlights the structural problems that some EMs face. Nevertheless, the combination of elevated commodity prices, forthcoming Chinese stimulus, and the resumption of the US dollar bear market starting next year should support EM growth. Relative to consensus, we think the risks to growth in both developed and emerging markets are tilted to the upside in 2022. Growth will likely start surprising to the downside in late 2023, however. The United States: No Shortage of Demand US growth slowed to only 2.1% in the third quarter, reflecting the impact of the Delta variant wave and supply-chain bottlenecks. The semiconductor shortage hit the auto sector especially hard. The decline in vehicle spending alone shaved 2.2 percentage points off Q3 GDP growth. Chart 4Durable Goods Spending Is Still Above Pre-Pandemic Trend, While Services Spending Is Catching Up
Durable Goods Spending Is Still Above Pre-Pandemic Trend, While Services Spending Is Catching Up
Durable Goods Spending Is Still Above Pre-Pandemic Trend, While Services Spending Is Catching Up
The fourth quarter is shaping up to be much stronger. The Bloomberg consensus estimate is for real GDP to expand by 4.9%. The Atlanta Fed’s GDPNow model is even more optimistic. It sees growth hitting 9.7%. The demand for goods will moderate in 2022. As of October, real goods spending was still 10% above its pre-pandemic trendline (Chart 4). In contrast, the demand for services will continue to rebound. While restaurant sales have recovered all their lost ground, spending on movie theaters, amusement parks, and live entertainment in October was still down 46% on a seasonally-adjusted basis compared to January 2020. Hotel spending was down 23%. Spending on public transport was down 25%. Spending on dental services was down 16% (Chart 5).
Chart 5
US households have accumulated $2.3 trillion in excess savings over the course of the pandemic. Some of this money will be spent over the course of 2022 (Chart 6). Increased borrowing should also help. After initially plunging during the pandemic, credit card balances are rising again (Chart 7). Banks are eager to make consumer loans (Chart 8). Chart 6Plenty Of Pent-Up Demand
Plenty Of Pent-Up Demand
Plenty Of Pent-Up Demand
Chart 7Credit Card Spending Is Recovering Following The Pandemic Slump
Credit Card Spending Is Recovering Following The Pandemic Slump
Credit Card Spending Is Recovering Following The Pandemic Slump
Household net worth has risen by over 100% of GDP since the start of the pandemic (Chart 9). In an earlier report, we estimated that the wealth effect alone could boost annual consumer spending by up to 4% of GDP. Chart 8Banks Are Easing Credit Standards For Consumer Loans
Banks Are Easing Credit Standards For Consumer Loans
Banks Are Easing Credit Standards For Consumer Loans
Chart 9A Record Rise In Household Net Worth
A Record Rise In Household Net Worth
A Record Rise In Household Net Worth
Business investment will rebound in 2022, as firms seek to build out capacity, rebuild inventories, and automate more production in the face of growing labor shortages. After moving sideways for the better part of two decades, core capital goods orders have broken out to the upside. Surveys of capex intentions have improved sharply (Chart 10). Nonresidential investment was 6% below trend in Q3 – an even bigger gap than for consumer services spending – so there is plenty of scope for capex to increase. Residential investment should also remain strong in 2022 (Chart 11). The homeowner vacancy rate has dropped to a record low, as have inventories of new and existing homes for sale. Homebuilder sentiment rose to a 6-month high in November. Building permits are 7% above pre-pandemic levels. Chart 10Business Investment Should Be Strong In 2022
Business Investment Should Be Strong In 2022
Business Investment Should Be Strong In 2022
Chart 11Residential Construction Will Be Well Supported
Residential Construction Will Be Well Supported
Residential Construction Will Be Well Supported
US Monetary and Fiscal Policy: Baby Steps Towards Tightening Policy is unlikely to curb US aggregate demand by very much next year. While the Federal Reserve will expedite the tapering of asset purchases and begin raising rates next summer, the Fed is unlikely to raise rates significantly until inflation gets out of hand. As we discuss in the Feature section later in this report, the next leg in inflation will be to the downside, even if the long-term trend for inflation is to the upside. The respite from inflation next year will give the Fed some breathing space. A major tightening campaign is unlikely until mid-2023. Reflecting the Fed’s dovish posture, long-term real bond yields hit record low levels in November (Chart 12). Despite giving up some of its gains in recent days, Goldman’s US Financial Conditions Index stands near its easiest level in history (Chart 13). Chart 12US Real Bond Yields Hitting Record Lows
US Real Bond Yields Hitting Record Lows
US Real Bond Yields Hitting Record Lows
Chart 13Easy Financial Conditions In The US
Easy Financial Conditions In The US
Easy Financial Conditions In The US
US fiscal policy will get tighter next year, but not by very much. In November, President Biden signed a $1.2 trillion infrastructure bill into law, containing $550 billion in new spending. BCA’s geopolitical strategists expect Congress to pass a $1.5-to-$2 trillion social spending bill using the reconciliation process. The emergence of the Omicron strain will facilitate passage of the bill because it will allow the Democrats to add some “indispensable” pandemic relief to the package. All in all, the IMF foresees the US cyclically-adjusted primary budget deficit averaging 4.9% of GDP between 2022 and 2026, compared to 2.0% of GDP between 2014 and 2019 (Chart 14).
Chart 14
It should also be noted that government spending on goods and services has been quite weak over the past two years (Chart 15). The budget deficit surged because transfer payments exploded. Unlike direct government spending, which is set to accelerate over the next few years, households saved a large share of transfer payments. Thus, the fiscal multiplier will increase next year, even as the budget deficit shrinks. Chart 15While Overall Consumption Has Recovered, Business Spending and Direct Government Expenditures Remain Below Trend
While Overall Consumption Has Recovered, Business Spending and Direct Government Expenditures Remain Below Trend
While Overall Consumption Has Recovered, Business Spending and Direct Government Expenditures Remain Below Trend
Chart 16European Banks Have Cleaned Up Their Act
European Banks Have Cleaned Up Their Act
European Banks Have Cleaned Up Their Act
Europe: Room to Grow The European economy faces near-term growth pressures. In addition to Covid-related lockdowns, high energy costs will take a bite out of growth. After having dipped in October, natural gas prices have jumped again due to delays in the opening of the Nord Stream 2 pipeline, strong Chinese gas demand, and rising risks of a colder winter due to La Niña. The majority of Germans are in favor of opening the pipeline, suggesting that it will ultimately be approved. This should help reduce gas prices. Meanwhile, the winter will pass and Chinese demand for gas should abate as domestic coal production increases. The combination of increased energy supplies, easing supply-chain bottlenecks, and hopefully some relief on the pandemic front, should all pave the way for better-than-expected growth across the euro area next year. After a decade of housecleaning, European banks are in much better shape (Chart 16). Capex intentions have risen (Chart 17). Consumer confidence is even stronger in the euro area than in the US (Chart 18).
Chart 17
Chart 18Consumer Confidence Is At Pre-Pandemic Levels In The Euro Area, Unlike In The US
Consumer Confidence Is At Pre-Pandemic Levels In The Euro Area, Unlike In The US
Consumer Confidence Is At Pre-Pandemic Levels In The Euro Area, Unlike In The US
Euro area fiscal policy should remain supportive. Infrastructure spending is set to increase as the Next Generation EU fund begins operations. Germany’s “Traffic Light” coalition will pursue a more expansionary fiscal stance. The IMF expects the euro area to run a cyclically-adjusted primary deficit of 1.2% of GDP between 2022 and 2026, compared to a surplus of 1.2% of GDP between 2014 and 2019. For its part, the ECB will maintain a highly accommodative monetary policy. While net asset purchases under the PEPP will end next March, the ECB is unlikely to raise rates until 2023 at the earliest. In contrast to the US, trimmed-mean inflation has barely risen in the euro area (Chart 19). Moreover, unlike their US counterparts, European firms are reporting few difficulties in finding qualified workers (Chart 20). In fact, euro area wage growth slowed to an all-time low of 1.35% in Q3 (Chart 21). Chart 19Trimmed-Mean Inflation: Higher In The US Than In The Euro Area And Japan
Trimmed-Mean Inflation: Higher In The US Than In The Euro Area And Japan
Trimmed-Mean Inflation: Higher In The US Than In The Euro Area And Japan
Chart 20
Chart 21Wage Growth Remains Contained Across The Euro Area
Wage Growth Remains Contained Across The Euro Area
Wage Growth Remains Contained Across The Euro Area
The UK finds itself somewhere between the US and the euro area. Trimmed-mean inflation is running above euro area levels, but below that of the US. UK labor market data remains very strong, as evidenced by robust employment gains, firm wage growth, and a record number of job vacancies. The PMIs stand at elevated levels, with the new orders component of November’s manufacturing PMI rising to the highest level since June. While worries about the impact of the Omicron variant will likely cause the Bank of England to postpone December’s rate hike, we expect the BoE to begin raising rates in February. Japan: Short-Term Stimulus Boost A major Covid wave during the summer curbed Japanese growth. Consumer spending rebounded after the government removed the state of emergency on October 1 but could falter again if the Omicron variant spreads. The government has already told airlines to halt reservations for all incoming international flights for at least one month. On the positive side, the economy will benefit from new fiscal measures. Following the election on October 31, the new government led by Prime Minister Fumio Kishida announced a stimulus package worth 5.6% of GDP. As with most Japanese stimulus packages, the true magnitude of fiscal support will be much lower than the headline figure. Nevertheless, the combination of increased cash payments to households, support for small businesses, and subsidies for domestic travel should spur consumption in 2022. The capex recovery in Japan has lagged other major economies. This is partly due to the outsized role of the auto sector in Japan’s industrial base. Motor vehicle shipments fell 37% year-over-year in October, dragging down export growth with it. As automotive chip supplies increase, Japan’s manufacturing sector should gain some momentum. Despite the prospect of stronger growth next year, the Bank of Japan will stand pat. Core inflation remains close to zero, while long-term inflation expectations remain far below the BOJ’s 2% target. We do not expect the BOJ to raise rates until 2024 at the earliest. China: Crosswinds The Chinese economy faces crosswinds going into 2022. On the one hand, the energy crisis should abate, helping to boost growth. China has reopened 170 coal mines and will probably begin re-importing Australian coal. Chinese coal prices have fallen drastically over the past 6 weeks (Chart 22). Coal accounts for about two-thirds of Chinese electricity generation. Chart 22Coal Prices Are Renormalizing In China
Coal Prices Are Renormalizing In China
Coal Prices Are Renormalizing In China
Chart 23China's Property Market Has Weakened
China's Property Market Has Weakened
China's Property Market Has Weakened
The US may also trim tariffs on Chinese goods, as Treasury Secretary Yellen hinted this week. This will help Chinese manufacturers. On the other hand, the property market remains under stress. Housing starts, sales, and land purchases were down 34%, 21%, and 24%, respectively, in October relative to the same period last year. The proportion of households planning to buy a home has plummeted. Loan growth to real estate developers has decelerated to the lowest level on record (Chart 23). Nearly half of their offshore bonds are trading at less than 70 cents on the dollar. The authorities have taken steps to stabilize the property market. They have relaxed restrictions on mortgage lending and land sales, cut mortgage rates in some cities, and have allowed some developers to issue asset backed securities to repay outstanding debt. Most Chinese property is bought “off-plan”. The government does not want angry buyers to be deprived of their property. Thus, the existing stock of planned projects will be built. Chart 24 shows that this is a large number; in past years, developers have started more than twice as many projects as they have completed. The longer-term problem is that China builds too many homes. Like Japan in the early 1990s, China’s working-age population has peaked (Chart 25). According to the UN, it will decline by over 400 million by the end of the century. China simply does not need to construct as many new homes as it once did. Chart 24Chinese Construction: Halfway Done
Chinese Construction: Halfway Done
Chinese Construction: Halfway Done
Chart 25Demographic Parallels Between China And Japan
Demographic Parallels Between China And Japan
Demographic Parallels Between China And Japan
Chart 26
Japan was unable to fill the gap that a shrinking property sector left in aggregate demand in the early 1990s. As a result, the economy fell into a deflationary trap. China is likely to have more success. Unlike Japan, which waited too long to pursue large-scale fiscal stimulus, China will be more aggressive. The authorities will raise infrastructure spending next year with a focus on clean energy. They will also boost social spending. A frayed social safety net has forced Chinese households to save more than they would otherwise for precautionary reasons. This has weighed on consumption. The fact that China is a middle-income country helps. In 1990, Japan’s output-per-worker was nearly 70% of US levels; China’s output-per-worker is still 20% of US levels (Chart 26). If Chinese incomes continue to grow at a reasonably brisk pace, this will make it easier to improve home affordability. It will also allow China to stabilize its debt-to-GDP ratio without a painful deleveraging campaign. II. Feature: The Long-Term Inflation Outlook Two Steps Up, One Step Down We expect inflation in the US, and to a lesser degree abroad, to follow a “two steps up, one step down” trajectory of higher highs and higher lows. The US is currently near the top of those two steps. Inflation should dip over the next 6-to-9 months as the demand for goods moderates and supply-chain disruptions abate. Chart 27 shows that container shipping costs have started to come down. The number of ships anchored off the ports of Los Angeles and Long Beach is falling. US semiconductor firms are working overtime (Chart 28). Chip production in Japan and Korea is rising swiftly. DRAM chip prices have already started to decline. Chart 27Signs Of Easing Supply Issues On The Rough Seas
Signs Of Easing Supply Issues On The Rough Seas
Signs Of Easing Supply Issues On The Rough Seas
Chart 28Semiconductor Manufacturers Are Stepping Up Their Game
Semiconductor Manufacturers Are Stepping Up Their Game
Semiconductor Manufacturers Are Stepping Up Their Game
Reflecting the easing of supply-chain bottlenecks, both the “prices paid” and “supplier delivery” components of the manufacturing ISM declined in November. The respite from inflation will not last long, however. The US labor market is heating up. So far, most of the wage growth has been at the bottom end of the income distribution (Chart 29). Wage growth will broaden out over the course of 2022, pushing up service price inflation in the process. Chart 29Wage Growth Has Picked Up, But Mainly At The Bottom Of The Income Distribution
Wage Growth Has Picked Up, But Mainly At The Bottom Of The Income Distribution (I)
Wage Growth Has Picked Up, But Mainly At The Bottom Of The Income Distribution (I)
Chart 30Rent Inflation Has Increased
Rent Inflation Has Increased
Rent Inflation Has Increased
Rent inflation will also rise, as the unemployment rate falls further. The Zillow rent index has spiked 14% (Chart 30). Rents account for 8% of the US CPI basket and 4% of the PCE basket. Biased About Neutral? Investors are assuming that the Fed will step in to extinguish any inflationary fires before they get out of hand. The widely-followed 5-year/5-year forward TIPS breakeven inflation rate has fallen back below the Fed’s comfort zone (Chart 31). Chart 31Long-Term Inflation Expectations Are Not A Source Of Worry For The Fed
Long-Term Inflation Expectations Are Not A Source Of Worry For The Fed (II)
Long-Term Inflation Expectations Are Not A Source Of Worry For The Fed (II)
Chart 32Both The Fed And Investors Have Lowered Their Estimate Of The Neutral Rate
Both The Fed And Investors Have Lowered Their Estimate Of The Neutral Rate
Both The Fed And Investors Have Lowered Their Estimate Of The Neutral Rate
This may be wishful thinking. Back in 2012, when the Fed began publishing its “dots”, it thought the neutral rate of interest was 4.25%. Today, it considers it to be around 2.5% (Chart 32). Market participants broadly agree. Both investors and policymakers have bought into the secular stagnation thesis hook, line, and sinker. If the neutral rate turns out to be higher than widely believed, the Fed could find itself woefully behind the curve. Given the “long and variable” lags between changes in monetary policy and the resulting impact on the economy, inflation is liable to greatly overshoot the Fed’s target. Structural Forces Turning More Inflationary Meanwhile, the forces that have underpinned low inflation over the past few decades are starting to fray: Globalization is in retreat: The ratio of global trade-to-manufacturing output has been flat for over a decade (Chart 33). Looking out, the ratio could decline as geopolitical tensions between China and the rest of the world continue to simmer, and more companies shift production back home in order to gain greater control over the supply chains of essential goods. Baby boomers are leaving the labor force en masse: As a group, baby boomers hold more than half of US household wealth (Chart 34). They will continue to run down their wealth once they retire. However, since they will no longer be working, they will no longer contribute to national output. Spending that is not matched by output tends to drive up inflation. Chart 33Globalization Plateaued Over a Decade Ago
Globalization Plateaued Over a Decade Ago
Globalization Plateaued Over a Decade Ago
Chart 34
Social stability is in peril: The US homicide rate increased by 27% in 2020, the biggest one-year jump on record. All indications suggest that crime has continued to rise in 2021, coinciding with the ongoing decline in the incarceration rate (Chart 35). Amazingly, the murder rate and inflation are highly correlated (Chart 36). If the government cannot credibly commit to keeping people safe, how can it credibly commit to keeping inflation low? Without trust in government, inflation expectations could quickly become unmoored. Chart 35The Homicide Rate Has Tended To Rise When The Institutionalization Rate Has Declined
The Homicide Rate Has Tended To Rise When The Institutionalization Rate Has Declined
The Homicide Rate Has Tended To Rise When The Institutionalization Rate Has Declined
Chart 36Bouts Of Inflation Tend To Coincide With Rising Crime
Bouts Of Inflation Tend To Coincide With Rising Crime
Bouts Of Inflation Tend To Coincide With Rising Crime
The temptation to monetize debt will rise: Public-sector debt levels have soared to levels last seen during World War II. If bond yields rise as the Congressional Budget Office expects, debt-servicing costs will triple by the end of the decade (Chart 37). Faced with the prospect of having to divert funds from social programs to pay off bondholders, the government may apply political pressure on the Fed to keep rates low.
Chart 37
A Post-Pandemic Productivity Boom?
Chart 38
Might faster productivity growth bail out the economy just like it did following the Second World War? Don’t bet on it. US labor productivity did increase sharply during the initial stages of the pandemic. However, that appears to have been largely driven by composition effects that saw many low-skilled, poorly-paid service workers lose their jobs. As these low-skilled workers have returned to the labor force, productivity growth has dropped. The absolute level of productivity declined by 5.0% at an annualized rate in the third quarter, leading to an 8.3% increase in labor costs. Productivity growth has been extremely weak outside the US (Chart 38). This gives weight to the view that the pandemic-induced changes in business practices have not contributed to higher productivity, at least so far. It is worth noting that a recent study of 10,000 skilled professionals at a major IT company revealed that work-from-home policies decreased productivity by 8%-to-19%, mainly because people ended up working longer. Increased investment spending should eventually boost productivity. However, the near-term impact of higher capex will be to boost aggregate demand, stoking inflation in the process. III. Financial Markets A. Portfolio Strategy Above-Trend Global Growth Will Support Equities Our golden rule of investing is about as simple as they come: Don’t bet against stocks unless you think that there is a recession around the corner. As Chart 39 shows, recessions and equity bear markets almost always overlap.
Chart 39
Chart 40Sentiment Towards Equities Is Already Bearish
Sentiment Towards Equities Is Already Bearish
Sentiment Towards Equities Is Already Bearish
Equity corrections can occur outside of recessionary periods. In fact, we are experiencing such a correction right now. Yet, with the percentage of bearish investors reaching the highest level in over 12 months in this week’s AAII survey, chances are that the correction will not last much longer (Chart 40). A sustained decline in stock prices requires a sustained decline in corporate earnings; the latter normally only happens during economic downturns. Admittedly, it is impossible to know for sure if a recession is lurking around the corner. If the Omicron variant is able to completely evade the vaccines, growth will slow considerably over the coming months. Yet, even in that case, the global economy is unlikely to experience a sudden-stop of the sort that occurred last March. As noted at the outset of this report, pharma companies have the tools to tweak the vaccines, and most experts believe that the soon-to-be-released antivirals will be effective against the new strain. If economic growth remains above trend, earnings will rise (Chart 41). S&P 500 companies generated $53.82 per share in profits in Q3. The bottom-up consensus is for these companies to generate an average of $54.01 in quarterly profits between 2021Q4 and 2022Q3, implying almost no growth from 2021Q3 levels. This is a very low bar to clear. We expect global equities to produce high single-digit returns next year. Chart 41Analysts Increased Earnings Estimates This Year
Analysts Increased Earnings Estimates This Year
Analysts Increased Earnings Estimates This Year
The Beginning of the End Our guess is that 2022 will be the last year of the secular equity bull market that began in 2009. In mid-2023 or so, the Fed will come around to the view that the neutral rate is higher than it once thought. Unfortunately, by then, it will be too late; a wage-price spiral will have already emerged. A nasty bear flattening of the yield curve will ensue: Long-term bond yields will rise but short-term rate expectations will increase even more. A recession will follow in 2024 or 2025. The most important real-time indicator we are focusing on to gauge when to turn more bearish on stocks is the 5y/5y forward TIPS breakeven rate. As noted earlier, it is still at the bottom end of the Fed’s comfort zone. If it were to rise above 3%, all hell could break loose, especially if this happened without a corresponding increase in crude oil prices. The Fed takes great pride in the success it has had in anchoring long-term expectations. Any evidence that expectations are becoming unmoored would cause the FOMC to panic. B. Equity Sectors, Regions, And Styles Favor Value, Small Caps, and Non-US Markets in 2022 Until the Fed takes away the punch bowl, a modestly procyclical stance towards equity sectors, styles, and regional equity allocation is warranted. Chart 42The Relative Performance Of Value Stocks Has Closely Tracked Bond Yields This Year
The Relative Performance Of Value Stocks Has Closely Tracked Bond Yields This Year
The Relative Performance Of Value Stocks Has Closely Tracked Bond Yields This Year
The relative performance of value versus growth stocks has broadly followed the trajectory of the 30-year Treasury yield this year (Chart 42). Rising yields should buoy value stocks, with banks being the biggest beneficiaries (Chart 43). In contrast, rising yields will weigh on tech stocks. Chart 43Rising Bond Yields Will Help Bank Shares But Hurt Tech Stocks
Rising Bond Yields Will Help Bank Shares But Hurt Tech Stocks
Rising Bond Yields Will Help Bank Shares But Hurt Tech Stocks
Chart 44The Winners And Losers Of Covid Waves
The Winners And Losers Of Covid Waves
The Winners And Losers Of Covid Waves
If we receive some good news on the pandemic front, this should disproportionately help value. As Chart 44 illustrates, the relative performance of value versus growth stocks has tracked the number of new Covid cases globally. The correlation between new cases and the relative performance of IT and energy has been particularly strong. Rising capex spending will buoy industrial stocks. Industrials are overrepresented in value indices both in the US and abroad (Table 2). Along with financials, industrials are also overrepresented in small cap indices (Table 3). US small caps trade at 15-times forward earnings compared to 21-times for the S&P 500. Table 2Breaking Down Growth And Value By Sector
Strategy Outlook - 2022 Key Views: The Beginning Of The End
Strategy Outlook - 2022 Key Views: The Beginning Of The End
Table 3Financials And Industrials Have A Larger Weight In US Small Caps
Strategy Outlook - 2022 Key Views: The Beginning Of The End
Strategy Outlook - 2022 Key Views: The Beginning Of The End
Time to Look Abroad? Given our preference for cyclicals and value in 2022, it stands to reason that we should also favor non-US markets. Table 4 shows that non-US stock markets have more exposure to cyclical and value sectors. Table 4Cyclicals Are Overrepresented Outside The US
Strategy Outlook - 2022 Key Views: The Beginning Of The End
Strategy Outlook - 2022 Key Views: The Beginning Of The End
Admittedly, favoring non-US stock markets has been a losing proposition for the past 12 years. US earnings have grown much faster than earnings abroad over this period (Chart 45). US stock returns have also benefited from rising relative valuations. Chart 45The US Has Been The Earnings Leader In Recent Years
The US Has Been The Earnings Leader In Recent Years
The US Has Been The Earnings Leader In Recent Years
At this point, however, US stocks are trading at a significant premium to their overseas peers, whether measured by the P/E ratio, price-to-book, or price-to-sales (Chart 46). US profit margins are also more stretched than elsewhere (Chart 47).
Chart 46
Chart 47US Profit Margins Look Stretched
US Profit Margins Look Stretched
US Profit Margins Look Stretched
Chart 48Non-US Stocks Tend To Do Best When The US Dollar Is Weakening
Non-US Stocks Tend To Do Best When The US Dollar Is Weakening
Non-US Stocks Tend To Do Best When The US Dollar Is Weakening
The US dollar may be the ultimate arbiter of whether the US or international stock markets outperform in the 2022. Historically, there has been a close correlation between the trade-weighted dollar and the relative performance of US versus non-US equities (Chart 48). In general, non-US stocks do best when the dollar is weakening. The usual relationship between the dollar and the relative performance of US and non-US stocks broke down in 2020 when the dollar weakened but the tech-heavy US stock market nonetheless outperformed. However, if “reopening plays” gain the upper hand over “pandemic plays” in 2022, the historic relationship between the dollar and US/non-US returns will reassert itself. As we discuss later on, while near-term momentum favors the dollar, the greenback is likely to weaken over a 12-month horizon. This suggests that investors should look to increase exposure to non-US stocks in a month or two. Around that time, the energy shortage gripping Europe will begin to abate, China will be undertaking more stimulus, and investors will start to focus more on the prospect of higher US corporate taxes. C. Fixed Income Maintain Below-Benchmark Duration The yield on a government bond equals the expected path of policy rates over the duration of the bond plus a term premium that compensates investors for locking in their savings at a fixed rate rather than rolling them over at the prevailing short-term rate. While expected policy rates have moved up in the US over the past 2 months, the market’s expectations of where policy rates will be in the second half of the decade have not changed much (Chart 49). Investors remain convinced of the secular stagnation thesis which postulates that the neutral rate of interest is very low.
Chart 49
As for the term premium, it remains stuck in negative territory, much where it has been for the past 10 years (Chart 50). Chart 50Negative Term Premium Across The Board
Negative Term Premium Across The Board
Negative Term Premium Across The Board
The Term Premium Will Increase The notion of a negative term premium may seem odd, as it implies that investors are willing to pay to take on duration risk. However, there is a good reason for why the term premium has been negative: The correlation between bond yields and stock prices has been positive (Chart 51). Chart 51Stocks And Bond Yields Have Not Always Been Positively Correlated
Stocks And Bond Yields Have Not Always Been Positively Correlated
Stocks And Bond Yields Have Not Always Been Positively Correlated
When bond yields are positively correlated with stock prices, bonds are a hedge against bad economic news. If the economy falls into recession, equity prices will drop; the value of your home will go down; you may not get a bonus, or even worse, you may lose your job. But at least the value of your bond portfolio will go up! There is a catch, however: Bonds are a hedge against bad economic news only if that news is deflationary in nature. The 2001 and 2008-09 recessions all saw bond yields drop as the economy headed south. Both recessions were due to deflationary shocks: first the dotcom bust, and later, the bursting of the housing bubble. In contrast, bond yields rose in the lead up to the recession in the 1970s and early 80s. Bonds were not a good hedge against falling stock prices back then because it was surging inflation and rising bond yields that caused stocks to fall in the first place. This raises a worrying possibility that investors have largely overlooked: The term premium may increase as it becomes increasingly clear that the next recession will be caused not by inadequate demand but by Fed tightening in response to an overheated economy. A rising term premium would exacerbate the upward pressure on bond yields stemming from higher-than-expected inflation as well as upward revisions to estimates of the real neutral rate of interest. Again, we do not think that a “term premium explosion” is a significant risk for 2022. However, it is a major risk for 2023 and beyond. Investors should maintain a modestly below-benchmark duration stance for now but look to go maximally underweight duration towards the end of next year. Global Bond Allocation BCA’s global fixed-income strategists recommend underweighting the US, Canada, the UK, and New Zealand in 2022. They suggest overweighting Japan, the euro area, and Australia. US Treasuries trade with a higher beta than most other government bond markets (Chart 52). Our bond strategists expect the US 10-year Treasury yield to hit 2%-to-2.25% by the end of next year. Chart 52High-And Low-Beta Bond Yields
High-And Low-Beta Bond Yields
High-And Low-Beta Bond Yields
As discussed earlier, neither the ECB nor the BoJ are in a hurry to raise rates. Both euro area and Japanese bonds have outperformed the global benchmark when Treasury yields have risen (Chart 53).
Chart 53
Chart 54UK Inflation Expectations Are Higher Than In Other Major Developed Economies
UK Inflation Expectations Are Higher Than In Other Major Developed Economies
UK Inflation Expectations Are Higher Than In Other Major Developed Economies
While rate expectations in Australia have come down on the Omicron news, the markets are still pricing in four hikes next year. With wage growth still below the RBA’s target, our fixed-income strategists think the central bank will pursue a fairly dovish path next year. In contrast, they think New Zealand will continue its hiking cycle. Like Canada, the Reserve Bank of New Zealand has become increasingly concerned about soaring home prices and household indebtedness. Inflation expectations are higher in the UK than elsewhere (Chart 54). With the BoE set to raise rates early next year, gilts will underperform the global benchmark. Overweight High-Yield Corporate Bonds… For Now Chart 55High-Yield Spreads Are Pricing In A Default Rate Of Close To 4%
High-Yield Spreads Are Pricing In A Default Rate Of Close To 4%
High-Yield Spreads Are Pricing In A Default Rate Of Close To 4%
The combination of above-trend economic growth and accommodative monetary policy will provide support for corporate bonds in 2022. For now, we prefer high yield over investment grade. According to our bond strategists, while high-yield spreads are quite tight, they are still pricing in a default rate of 3.8% (Chart 55). This is more than their fair value default estimate of 2.3%-to-2.8%. It is also above the year-to-date realized default rate of 1.7%. As with equities, the bull market in corporate credit will end in 2023 as the Fed is forced to accelerate the pace of rate hikes in the face of an overheated economy and rising long-term inflation expectations. D. Currencies and Commodities Dollar Strength Will Reverse in Early 2022 Since bottoming in May, the US dollar has been trending higher. The US dollar is a high momentum currency: When the greenback starts rising, it usually keeps rising (Chart 56). A simple trading rule that buys the dollar when it is trading above its various moving averages has delivered positive returns (Chart 57). This suggests that the greenback could very well strengthen further over the next month or two.
Chart 56
Chart 57
Over a 12-month horizon, however, we think the trade-weighted dollar will weaken. Both speculators and asset managers are net long the dollar (Chart 58). Current positioning suggests we are nearing a dollar peak. Rising US rate expectations have helped the dollar this year. Chart 59 shows that both USD/EUR and USD/JPY have tracked the spread between the yield on the December 2022 Eurodollar and Euribor/Euroyen contracts, respectively. While the Fed will expedite the pace of tapering, the overall approach will still be one of “baby-steps” towards tightening next year. BCA’s bond strategists do not expect US rate expectations for end-2022 to rise from current levels. Chart 58Long Dollar Positions Are Getting Crowded
Long Dollar Positions Are Getting Crowded
Long Dollar Positions Are Getting Crowded
Chart 59Interest Rates Have Played A Major Role On The Dollar's Performance This Year
Interest Rates Have Played A Major Role On The Dollar's Performance This Year
Interest Rates Have Played A Major Role On The Dollar's Performance This Year
The present level of real interest rate differentials is consistent with a much weaker dollar (Chart 60). Using CPI swaps as a proxy for expected inflation, 2-year real rates in the US are 42 basis points below other developed economies. This is similar to where real spreads were in 2013/14, when the trade-weighted dollar was 16% weaker than it is today. Chart 60AThe Dollar And Interest Rate Differentials (I)
The Dollar And Interest Rate Differentials (I)
The Dollar And Interest Rate Differentials (I)
Chart 60BThe Dollar And Interest Rate Differentials (II)
The Dollar And Interest Rate Differentials (II)
The Dollar And Interest Rate Differentials (II)
Meanwhile, growth outside the US will pick up next year as Europe’s energy crisis abates and China ramps up stimulus. If history is any guide, firmer growth abroad will put downward pressure on the dollar (Chart 61). Chart 61The Dollar Will Weaken As Global Growth Rotates From The US To The Rest Of The World
The Dollar Will Weaken As Global Growth Rotates From The US To The Rest Of The World
The Dollar Will Weaken As Global Growth Rotates From The US To The Rest Of The World
Chart 62Dollar Headwinds
Dollar Headwinds
Dollar Headwinds
Pricey Greenback The dollar’s lofty valuation has left it overvalued by nearly 20% on a Purchasing Power Parity (PPP) basis. The PPP exchange rate equalizes the price of a representative basket of goods and services between the US and other economies. Reflecting the dollar’s overvaluation, the US trade deficit has widened sharply. Excluding energy exports, the US trade deficit as a share of GDP is now the largest on record. Equity inflows have helped finance America’s burgeoning current account deficit (Chart 62). However, these inflows are starting to abate, and could drop further if global investors abandon their infatuation with US tech stocks. Favor Commodity Currencies We favor commodity currencies for 2022, especially the Canadian dollar, which we expect to be the best performing G10 currency. Canadian real GDP growth will average nearly 5% in Q4 and the first half of next year. The Bank of Canada will start hiking rates next April. Oil prices should remain reasonably firm next year, helping the loonie and other petrocurrencies. Bob Ryan, BCA’s chief Commodity Strategist, expects the price of Brent crude to average $80/bbl in 2022 and 81$/bbl in 2023, which is well above the forwards (Chart 63). Years of underinvestment in crude oil production have led to tight supply conditions (Chart 64). Proven global oil reserves increased by only 6% between 2010 and 2020, having risen by 26% over the preceding decade.
Chart 63
Chart 64
As with oil, there has been little investment in mining capacity in recent years. While a weaker property market in China will weigh on metals prices, this will be partly offset by Chinese fiscal stimulus. Looking further ahead, the outlook for metals remains bright. Whereas the proliferation of electric vehicles is bad news for oil demand over the long haul, it is good news for many metals. The typical electric vehicle requires about four times as much copper as a typical gasoline-powered vehicle. Huge amounts of copper will also be necessary to expand electrical grids. The RMB Will Be Stable in 2022 It is striking that despite the appreciation in the trade-weighted dollar since June and escalating concerns about the health of the Chinese economy, the RMB has managed to strengthen by 0.3% against the US dollar. Chinese export growth will moderate in 2022 as global consumption shifts from goods to services. Rising global bond yields may also narrow the yield differential between China and the rest of the world. Nevertheless, we doubt the RMB will weaken very much. China wants the RMB to be a global reserve currency. A weak RMB would run counter to that goal. Rather than weakening the yuan, the Chinese authorities will use fiscal stimulus to support growth. Gold Versus Cryptos? Gold prices tend to move closely with real bond yields (Chart 65). Since August 2020, however, the price of gold has slumped from a high of $2,067/oz to $1,768/oz, even though real yields remain near record lows. The divergence between real yields and gold prices may partly reflect growing demand for cryptocurrencies. Investors increasingly see cryptos as not just a disruptive economic force, but as the premier “anti-fiat” hedge. Whether that view pans out remains to be seen. So far, the vast majority of the demand for cryptocurrencies has stemmed from people hoping to get rich by buying cryptos. To the extent that people are using cryptos for online purchases, it is usually for illegal goods (Chart 66). Chart 65Gold Prices Tend To Correlate Closely With Real Interest Rates
Gold Prices Tend To Correlate Closely With Real Interest Rates
Gold Prices Tend To Correlate Closely With Real Interest Rates
Chart 66
Crypto proponents like to say that the supply of cryptos is finite. While this may be true for individual cryptocurrencies, it is not true for the sector as a whole. Over the past 8 years, the number of cryptocurrencies has swollen from 26 in 2013 to 7,877 (Chart 67). At least with gold, they are not adding any new elements to the periodic table.
Chart 67
At any rate, the easy money in the crypto space has already been made. Bitcoin has doubled in price seven times since the start of 2016. If it were to double just one more time to $120,000, it would be worth $2.2 trillion, equal to the entire stock of US dollars in circulation. Investors looking to hedge long-term inflation risk should shift back into gold. Peter Berezin Chief Global Strategist pberezin@bcaresearch.com Global Investment Strategy View Matrix
Image
Special Trade Recommendations
Image
Current MacroQuant Model Scores
Image
Highlights Expectations for monetary policy in Australia have turned aggressively hawkish over the past month, with markets now discounting multiple rate hikes next year. This pricing defies guidance from the Reserve Bank of Australia (RBA), which calls for no rate hikes until 2024. An update of our RBA Checklist shows that while there is a growing case for the RBA to tighten, there are still enough lingering uncertainties about the trajectory for growth (specifically, Chinese import demand) and inflation (specifically, wage growth) for the RBA to credibly remain on the sidelines next year. Fade the aggressive 2022 rate hike profile discounted in Australian interest rate markets by staying overweight Australian government bonds in global bond portfolios. Also position for a steeper yield curve (that should also benefit Australian bank stocks) and wider breakevens on Australian inflation-linked bonds. The Australian dollar offers compelling medium-term value, but play that through positions on the crosses (long AUD/NZD & AUD/CHF) with the RBA/Fed policy gap keeping a lid on AUD/USD in the near term. Feature With inflation surging across the world, investors have become hyper-sensitive to any potentially hawkish turn by central banks that have used ultra-accommodative monetary policy to fight the economic shock of the COVID-19 pandemic. Rapidly shifting interest rate expectations have triggered bouts of bond and currency volatility in countries like the UK, Canada and New Zealand over the past several months – with perhaps the biggest shock seen in Australia. Australian government bonds had enjoyed an impressive period of outperformance versus developed market peers between March and September of 2021. All that changed in late October (Chart 1), when the RBA effectively abandoned its yield curve control policy that anchored shorter-maturity bond yields with asset purchases, triggering a spike in Australian yields (the yield on the April 2024 government bond that was targeted by the RBA jumped +80bps in a single week). Interest rate expectations have rapidly been repriced higher to the point where there are now nearly four rate hikes in 2022 discounted in the Australian overnight index swap (OIS) curve – even with the RBA still formally saying that it does not expect to lift rates until 2024 (Chart 2). Chart 1The RBA Will Likely Disappoint Market Expectations
The RBA Will Likely Disappoint Market Expectations
The RBA Will Likely Disappoint Market Expectations
Chart 2A Very Aggressive Term Structure For Aussie Interest Rates
A Very Aggressive Term Structure For Aussie Interest Rates
A Very Aggressive Term Structure For Aussie Interest Rates
In this Special Report, we revisit our RBA Checklist, originally introduced in January of this year, to determine if the time is indeed right to expect tighter monetary policy in Australia next year, which has implications for not only the Australian bond market but also the Australian dollar. While much of the checklist is flashing a need for the RBA to begin lifting rates, there are still enough lingering uncertainties on the outlook for inflation, the labor market and export demand to keep the central bank on hold in 2022. Checking In On Our RBA Checklist Chart 3Tentative Signs Of A Rebound In Aussie Economic Activity
Tentative Signs Of A Rebound In Aussie Economic Activity
Tentative Signs Of A Rebound In Aussie Economic Activity
Before the recent Australian bond market turbulence, the potent policy mix from the RBA since the start of the pandemic – cutting the Cash Rate to 0.1%, with aggressive quantitative easing (QE) and yield curve control, all reinforced with very dovish forward guidance – helped cap market pricing for interest rate hikes. A sharp outbreak of the Delta Variant earlier this year, leading to severe economic restrictions in Australia’s major cities, also helped anchor bond yields Down Under on a relative basis compared with other countries. As RBA Governor Philip Lowe noted in his speech following the November 2 RBA policy meeting, “At the outset of the pandemic, economic policy, including monetary policy, set out to build a bridge to the other side. That other side is now clearly in sight. As [pandemic] restrictions are eased, spending is expected to pick up relatively quickly as people seek a return to a more normal way of life.” At the same time, Lowe stated that “the latest data and forecasts do not warrant an increase in the Cash Rate in 2022.” Thus, any attempt to begin unwinding RBA policy accommodation would require clear evidence that the impacts of the pandemic on economic growth, and also on inflation and financial stability, were evolving such that emergency policy settings were no longer required. On the growth front, there are already signs of recovery looking at reliable cyclical indicators like the manufacturing and services PMIs, which have rebounded by 6.2 points and 8.9 points, respectively, from the August lows (Chart 3). Yet while inflation expectations have remained fairly stable – the 5-year/5-year Australia CPI swap rate has stayed in a 2.2-2.5% range throughout 2021, despite the Delta outbreak – our RBA Monitor has rolled over, led by the economic growth components. This suggests there may be some diminished pressure for tighter monetary policy in Australia. To get a clearer picture on the outlook for Australian monetary policy over the next year, it is a good time to revisit our RBA Checklist - the most important things to monitor to determine when the RBA could be expected to turn more hawkish. We compiled the Checklist back in January, and the elements are still relevant today. 1. The COVID-19 vaccination process goes quickly and smoothly (✓) We are placing a checkmark next to this part of our RBA Checklist. After a very slow start earlier in 2021, Australia has executed a successful vaccination campaign with 71% of the population now fully vaccinated (Chart 4). More importantly, the number of daily new infections is rolling over rapidly, and hospitalization rates remain low. This is allowing economic restrictions to be lifted quickly. Chart 4The Beginning Of The End Of Australia's 2021 COVID Crisis
The Beginning Of The End Of Australia's 2021 COVID Crisis
The Beginning Of The End Of Australia's 2021 COVID Crisis
2. Private sector demand accelerates as the impulse from COVID fiscal stimulus fades (✓?) We are tentatively giving a checkmark for this component of the Checklist, but with a question mark given some of the cross-currents visible on the consumer spending side. Real consumer spending rebounded sharply in the first half of 2021 (Chart 5). However, the Delta lockdowns weighed on consumer confidence and demand in Q3, with retail sales contracting on a year-over-year basis (both in nominal and inflation-adjusted terms). Furthermore, much of the spending boom was fueled by Australian households running down the high savings accumulated during the 2020 COVID lockdowns. The household savings rate fell from a peak of 22% in Q2 2020 to 10% in Q2 2021, the last data point available, while real disposable income growth actually fell by -2.6% on a year-over-year basis in Q2. We expect the next few consumer confidence prints to improve sharply as economic restrictions are lifted, with consumer spending following suit. This would lead us to remove the question mark next to this item of the RBA Checklist. Already, business confidence is rebounding with the NAB survey bouncing 6 points in October (Chart 6), which should translate into increased capital spending and hiring activity by Australian companies that have maintained profitability during the pandemic (top panel). Chart 5Australia's Economy Holding Up Well Despite COVID Wave
Australia's Economy Holding Up Well Despite COVID Wave
Australia's Economy Holding Up Well Despite COVID Wave
Chart 6Resilient Business Confidence Will Support Employment
Resilient Business Confidence Will Support Employment
Resilient Business Confidence Will Support Employment
3. Inflation, both realized and expected, returns to the RBA’s 2-3% target (✓?)
Chart 7
We are giving another tentative checkmark with a question mark for this entry in the RBA Checklist, given that wage growth remains modest despite high realized inflation. Australian headline CPI inflation, on a year-over-year basis, was 3.8% in Q2/2021 and 3.0% in Q3/2021, above the top of the 2-3% RBA target. Much of that inflation has come from the Transport sector, which includes the prices of both car fuel and new car prices, which contributed 1.1% to inflation in Q3 (Chart 7). The former is impacted by high oil prices and the latter is influenced by the global supply chain disruption and shortage of semiconductors used in cars. Beyond those sectors, there was a modest pickup in inflation across much of the consumption basket. Underlying inflation was more subdued but did pick up over the same Q2/Q3 period. Annual growth in the trimmed mean CPI accelerated from 1.6% in Q2 to 2.1% in Q3 - returning to the bottom half of the RBA’s target range for the first time since Q4/2015 (Chart 8). The latest RBA projections call for underlying inflation to stay in the lower half of the inflation target range in 2022 (2.25%) and 2023 (2.5%), although this is conditional on a steady tightening of the Australian labor market. The RBA is forecasting the unemployment rate, which was at 5.2% in October, to fall to 4.25% by the end of 2022 and 4% by the end of 2023. The RBA expects a tighter labor market to eventually boost wage growth to a pace consistent with underlying inflation staying within the RBA target band – which would then augur for tighter monetary policy. The central bank has repeatedly stated that annual growth in the Wage Cost Index, its most preferred measure of Australian wages, has historically been in the 3-4% range when underlying inflation was consistently between 2-3%. The Wage Cost Index grew by only 2.2% on a year-over-year basis in Q3, so still well below the pace that would convince the RBA that underlying inflation would stay within the target. This argues for a wait-and-see approach. Chart 8Wage Uncertainty Preventing A Hawkish RBA Turn
Wage Uncertainty Preventing A Hawkish RBA Turn
Wage Uncertainty Preventing A Hawkish RBA Turn
Chart 9A Rising Participation Rate Will Cushion Tightening In The Labor Market
A Rising Participation Rate Will Cushion Tightening In The Labor Market
A Rising Participation Rate Will Cushion Tightening In The Labor Market
RBA Governor Lowe has noted that there is still ample spare capacity in labor markets that opened up because of COVID lockdowns, which will prevent a more rapid decline in the unemployment rate even with labor demand still quite strong. On that note – the Australian labor force participation rate fell from a 2021 high of 66.3% in March of this year to 64.7% in October, a 1.6 percentage point decline that provides a buffer to absorb the strong labor demand in Australia (Chart 9). Given that Australian inflation and wages are reported less frequently (quarterly) than employment data (monthly), it is a challenge for the RBA to quickly assess to true state of inflationary pressure in the Australian economy. We see the inflation data as being far more important than labor market developments in assessing the RBA’s next move. The RBA will likely want to a few more Wage Cost Index and CPI prints before signaling any move to hike rates sooner than currently projected. The RBA will not have a complete reading on wages for the first half of 2022 until August, when the Q2/2022 Wage Cost Index is released. Thus, it would not be until well into the latter half of 2022 before any shift in hawkish messaging could plausibly occur, at the earliest, even if CPI inflation were to surprise to the upside over the same period. The RBA will need to see price inflation confirmed by wage inflation before changing its stance. In a nutshell, robust inflation prints out of Australia will need to be reinforced by strong wage data, for the RBA to move the dial closer to market expectations for interest rate hikes. 4. House price inflation is accelerating (✓) We are placing a checkmark next to this piece of our Checklist. Given Australia’s past history with periods of surging home values, signs that housing markets are overheating could prompt the RBA to consider tightening monetary policy sooner than expected. On that front, there is plenty of evidence to give the RBA anxiety. Median house prices grew at a 16.8% year-over-year rate in Q2, the fastest pace since 2003, and now appear very expensive relative to median incomes (Chart 10). Chart 10House Price Appreciation Could Moderate
House Price Appreciation Could Moderate
House Price Appreciation Could Moderate
High prices may eventually begin to turn away buyers, as the “good time to buy a home” component of the Melbourne/Westpac consumer confidence survey has fallen sharply (bottom panel). Some of that decline may also be due to the Delta wave, as the growth rate of new building approvals has also slowed alongside rising COVID cases (top panel). The RBA will likely want to see a few post-Delta prints on Australian house prices and housing demand to determine the true underlying trends. But given the extreme readings on overall house prices, the housing market is a legitimate reason for the RBA to turn more hawkish. 5. Export demand, particularly from China, is strong (x) We are NOT placing a checkmark next to this item of our RBA Checklist. A booming external environment could lead the RBA to feel more comfortable signaling rate hikes. So far, that has been the case via a rising terms of trade, which has positive implications for the valuation of the Australian dollar, as we discuss below. But on the volume front - which is critical for the growth outlook, and RBA policy decisions, given the importance of the export sector to the Australian economy - there is reason for caution. First, the Chinese economy continues to slow down. The Chinese credit impulse, one of the key gauges of momentum in domestic activity peaked in October last year and has been rolling over since. Historically, this has been a bad omen for Aussie exports in general, as well as the performance of the AUD (Chart 11). Almost 40% of Australian exports go to China. This suggests that exports of both coal and iron ore are particularly susceptible to a further slowdown in Chinese construction activity. That said, the slowdown in China has probably passed the “maximum deceleration” phase and the odds are that, going forward, both monetary and fiscal policy will be marginally eased. This will help cushion the Australian dollar and bond yields from undershooting below current levels. Chinese bond yields have already declined, reflecting an easing in domestic financial conditions. With the Chinese bond market becoming more and more liberalized, it has become a good proxy for monetary conditions. As such, the trend in Chinese bond yields has tended to lead Chinese imports. As Chinese going concerns finance working capital requirements at lower rates, this could help stabilize import volumes (Chart 12). Chart 11A Slowdown In China Is A Risk For The AUD
A Slowdown In China Is A Risk For The AUD
A Slowdown In China Is A Risk For The AUD
Chart 12Easing Financial Conditions In China
Easing Financial Conditions In China
Easing Financial Conditions In China
Political tensions between Australia and China remain a key point of contention for higher Aussie terms of trade and an improving basic balance. However, many Australian exports are fungible and have been redirected to other countries. For example, despite China’s ban on Australian coal imports, Aussie export volumes and terms of trade remain robust, leading to a sharp improvement in Australia’s external accounts (Chart 13). This is because Australian exports to Japan, India, and South Korea have picked up as China has redirected imports of coal from Australia to other countries. Commodity prices remain resilient, but could face downside in the coming months. This is especially the case for Australian export prices, which have outperformed that of other commodity-producing nations, leading to the sharp improvement in the terms of trade (Chart 14). Part of the story has been a supply-side shock. But Australia is also relatively competitive in supplying the types of raw materials that China needs and wants such as higher-grade iron ore, which is more expensive, pollutes less, and is in high demand. Similarly, Australia is one of the largest exporters of liquefied natural gas, of which prices have been soaring in recent months amidst a global push to clean the planet. Chart 13An Improving Basic Balance Supports The AUD
An Improving Basic Balance Supports The AUD
An Improving Basic Balance Supports The AUD
Chart 14Australian Terms Of Trade Are Robust
Australian Terms Of Trade Are Robust
Australian Terms Of Trade Are Robust
Historically, the terms of trade has been one of the best explanatory variables for the AUD. That said, our model suggests that even a 15%-20% decline in forward prices will still keep the AUD undervalued relative to levels implied by terms of trade (Chart 15). While Australian export prices have overtaken their 2011 highs, the AUD remains around 35% below 2011 levels. On a longer-term basis, Australia’s terms-of-trade improvement is likely to continue. First, a boom in global infrastructure spending is likely to keep the prices of the commodities Australia exports well bid. This includes both copper and iron ore. Second, China’s clean energy policy shift away from coal and towards natural gas will buffet LNG export volumes (Chart 16). Given that reducing - if not outright eliminating - pollution is a long-term strategic goal in China, this will provide a multi-year tailwind for both cleaner ore and LNG import volumes. Chart 15A Drop In Commodities Is Well Discounted By The AUD
A Drop In Commodities Is Well Discounted By The AUD
A Drop In Commodities Is Well Discounted By The AUD
Chart 16
In a nutshell, Australia sports the best improvement in both trade and current account balances in the G10 over the last few years (Chart 17). Significant investment in resource projects over the last decade are now bearing fruit, easing the external funding requirement. This has ended the 35-year-long deficit in the current account. A rising current account naturally increases the demand for the Australian dollar, even in the absence of RBA rate hikes. This argues for short-term caution, but a longer-term bullish view on the Aussie. Chart 17External Funding Will Face Competition From Domestic Savings
External Funding Will Face Competition From Domestic Savings
External Funding Will Face Competition From Domestic Savings
Investment Implications A check of our RBA Checklist shows that the argument in favor of tighter monetary policy is becoming more compelling. However, the uncertainties over Australian wages and Chinese growth – both critical for the RBA’s next move - will not be resolved until the second half of 2022, so RBA tightening is not likely until the first half of 2023 at the earliest. There are a number of ways that investors can position for continued RBA dovishness in 2022. Fixed Income Bond investors should overweight Australian government bonds in global portfolios, as the RBA will not match the policy tightening expected in the US, Canada or the UK. Those overweights should be concentrated versus the US, given the lower yield beta of Australian government bonds versus US Treasuries (Chart 18). For dedicated Australian bond investors, maintain a below-benchmark duration stance as longer-maturity yields have more room to rise as the economy continues to recover from the Delta wave. In addition, favor inflation-linked debt over nominal bonds, as both survey-based inflation expectations and the fair value from our 10-year breakeven spread model are rising. Wider breakevens pushing up longer-term yields, and a dovish RBA capping shorter-maturity bond yields, both point to a bearish steepening of the government bond yield curve over the next 6-12 months (Chart 19). Chart 18Remain Overweight Aussie Bonds...
Remain Overweight Aussie Bonds...
Remain Overweight Aussie Bonds...
Chart 19...And Position For A Steeper Yield Curve
...And Position For A Steeper Yield Curve
...And Position For A Steeper Yield Curve
Currency A lot of pessimism is already embedded in the Aussie dollar, making it a potent candidate for a powerful mean-reversion rally. One catalyst will be a continued reversal in COVID-19 infection rates. The second is valuation. The Aussie is at fair value on a PPP basis, but remains very cheap on a terms-of-trade basis. Historically, terms of trade have had much better explanatory power for the direction of the Aussie, compared to relative real interest rates or fluctuations from purchasing power parity. Even accounting for falling commodity prices, the valuation margin of safety makes the AUD a good bet over a cyclical horizon, though in the very near-term, it is fraught with risks. We have a limit-buy on AUD/USD at 70 cents, which could be a capitulation level. On the upside, if the Aussie closes its undervaluation gap vis-à-vis terms of trade as it has done historically, this will lift AUD/USD towards 85 cents and beyond. Finally, sentiment on the Aussie is very depressed. Extreme short positioning suggests a dearth of buyers and the potential for a short covering rally (Chart 20). On the crosses, we are already long AUD/NZD, but AUD/CHF and AUD/CAD should also be winners in any Aussie short squeeze. Chart 20Lots Of Shorts In The Aussie
Lots Of Shorts In The Aussie
Lots Of Shorts In The Aussie
Equities 37% of the MSCI Australia index is financials, while 16% is materials. Therefore, a call on the Australian equity market is a call on banks and resources. On the resource front, Australian producers will benefit from a pickup in natural gas exports and a shift away from coal. Therefore, the strategy will be to overweight Australian LNG producers in a resource portfolio. On banks, a relatively dovish RBA will keep the Australian yield curve steep. Meanwhile, banks have still underperformed the improvement in the interest rate term structure. A bottoming economy will also benefit banks, as investors start to price in the prospect for interest rate hikes beyond 2023 (Chart 21). Chart 21A Steeper Yield Curve Will Benefit Banks
A Steeper Yield Curve Will Benefit Banks
A Steeper Yield Curve Will Benefit Banks
Robert Robis, CFA Chief Fixed Income Strategist rrobis@bcaresearch.com Chester Ntonifor Foreign Exchange Strategist chestern@bcaresearch.com Recommendations Duration Regional Allocation Spread Product Tactical Trades GFIS Model Bond Portfolio Recommended Positioning Active Duration Contribution: GFIS Recommended Portfolio Vs. Custom Performance Benchmark
Image
The GFIS Recommended Portfolio Vs. The Custom Benchmark Index
Dear Client, There will be no report next week as we will be working on our Quarterly Strategy Outlook, which will be published the following week. In the meantime, please keep an eye out for BCA Research’s Annual Outlook, featuring long-time BCA client Mr. X, who visits towards the end of each year to discuss the economic and financial market outlook for the year ahead. Best regards, Peter Berezin Chief Global Strategist Highlights Inflation in the US, and to a lesser extent, in other major economies, will follow a “two steps up, one step down” trajectory of higher highs and higher lows. While inflation will fall in the first half of next year as goods prices stabilize, an overheated labor market will cause inflation to re-accelerate into 2023. The Fed will be slow to respond to high inflation, implying that monetary policy will remain accommodative next year. This should help propel stocks to new highs. Chinese stimulus will offset much of the drag from a weaker domestic property market. The dollar is a high momentum currency, so we wouldn’t bet against the greenback in the near term. Nevertheless, with “long dollar” now a consensus trade, we would position for a weaker dollar over a 12-month horizon. A depreciating dollar next year should help non-US equities, especially beleaguered emerging market stocks. The dollar will strengthen anew in 2023, as the Fed is forced to turn more hawkish, and global equities begin to buckle. From Ice To Fire In past reports, we have contended that inflation in the US, and to a lesser extent, in other major economies, would follow a “two steps up, one step down” trajectory of higher highs and higher lows. We are currently near the top of those two steps. The pandemic ushered in a major re-allocation of spending from services to goods (Chart 1). US inflation should dip over the next 6-to-9 months as the demand for goods decelerates and supply-chain disruptions abate. Chart 1The Pandemic Caused A Major Shift In Spending From Services To Goods
The Pandemic Caused A Major Shift In Spending From Services To Goods
The Pandemic Caused A Major Shift In Spending From Services To Goods
CHart 2Those With Low Paid Jobs Are Enjoying Stronger Wage Gains
Those With Low Paid Jobs Are Enjoying Stronger Wage Gains
Those With Low Paid Jobs Are Enjoying Stronger Wage Gains
The respite from inflation will not last long, however. The labor market is heating up. So far, most of the wage growth has been at the bottom end of the income distribution (Chart 2). Wage growth will broaden over the course of 2022, setting the scene for a price-wage spiral in 2023. We doubt that either fiscal or monetary policy will tighten fast enough to prevent such a spiral from emerging. As a result, US inflation will surprise meaningfully on the upside. Our view has no shortage of detractors. In this week’s report, we address the main counterarguments in a Q&A format: Q: What makes you think that service spending will rebound fast enough to offset the drag from weaker goods consumption? Chart 3Inventory Restocking Could Be A Source Of Growth Next Year
Inventory Restocking Could Be A Source Of Growth Next Year
Inventory Restocking Could Be A Source Of Growth Next Year
A: There is still a lot of pent-up demand for goods. Try calling any auto dealership. You will hear the same thing: “We have nothing in stock now, but if you put in an order today, you might get a vehicle in 3-to-6 months.” Thus, durable goods sales are unlikely to weaken quickly. And with inventories near record low levels, firms will need to produce more than they sell (Chart 3). Inventory restocking will support GDP growth. As for services, real spending in the US grew by 7.9% in the third quarter, an impressive feat considering that this coincided with the Delta-variant wave. Service growth will stay strong in the fourth quarter. The ISM non-manufacturing index jumped to a record high of 66.7 in October, up from 61.9 in September. The Atlanta Fed’s GDPNow model is tracking real PCE growth of 9.2% in Q4. Goldman’s Current Activity Indicator has hooked up (Chart 4).
Chart 4
Q: Aren’t you worried that spending on services might stall next year? A: Not really. Chart 5 shows the percentage change in real spending for various types of services from January 2020 to September 2021, the last month of available data.
Chart 5
Chart 6
The greatest decline in spending occurred in those sectors that were most directly affected by the pandemic. Notably, spending on movie theaters, amusement parks, and live entertainment in September was still down 46% on a seasonally-adjusted basis compared to last January. Hotel spending was down 22%. Spending on public transport was down 26%. Only spending on restaurants was back to normal. The number of Covid cases has once again started to trend higher in the US, so that path to normalization will take time (Chart 6). Nevertheless, with vaccination rates still edging up and new antiviral drugs set to hit the market, it is reasonable to assume that many of the hardest-hit service categories will recover next year. Q: What about medical services? Some have speculated that the shift to telemedicine will require much lower spending down the road. A: It is true that spending on outpatient services in September was $43 billon below pre-pandemic levels. However, over two-fifths of that shortfall was in dental services, which are not amenable to telemedicine. Spending on dental services was down 16% from its January 2020 levels, compared to 6% for physician services. A more plausible theory is that many people are still worried about venturing to the doctor’s or dentist’s office. In addition, a lot of elective procedures were canceled or postponed due to the pandemic. Clearing that backlog will lift medical spending next year. Chart 7The Flow Of Savings Has Fallen Back To Pre-Pandemic Levels But The Stock Of Accumulated Savings Remains High
The Flow Of Savings Has Fallen Back To Pre-Pandemic Levels But The Stock Of Accumulated Savings Remains High
The Flow Of Savings Has Fallen Back To Pre-Pandemic Levels But The Stock Of Accumulated Savings Remains High
In any case, the cost of a telemedicine appointment is typically no different from an in-person one. And, to the extent that telemedicine does become more widespread, this could encourage more people to seek medical assistance. Lastly, even if spending on certain services does not fully recover after the pandemic, this will probably simply result in a permanent increase in spending on goods. The only way that overall consumer spending will falter is if the savings rate rises, which seems unlikely to us. Q: Why do you say that? The savings rate has been very high throughout the pandemic. A: The savings rate did spike during the pandemic, but that was mainly because fewer services were available, and because households were getting transfer payments from the government. Now that these payments have ended, the savings rate has dropped to 7.5%, roughly where it was prior to the pandemic. There is good reason to think the savings rate will keep falling next year. Households are sitting on $2.3 trillion in excess savings, most of which reside in bank deposits (Chart 7). As they run down those savings, consumption will rise in relation to income. The household deleveraging cycle is over. After initially plunging during the pandemic, credit card balances are rising (Chart 8). Banks are eager to make consumer loans (Chart 9). Household net worth has risen by over 100% of GDP since the start of the pandemic (Chart 10). As we discussed three weeks ago, the wealth effect alone could boost annual consumer spending by up to 4% of GDP. Chart 8APost-GFC Deleveraging Has Ended And People Are Swiping Credit Cards Again Following The Pandemic Scare
Post-GFC Deleveraging Has Ended And People Are Swiping Credit Cards Again Following The Pandemic Scare
Post-GFC Deleveraging Has Ended And People Are Swiping Credit Cards Again Following The Pandemic Scare
Chart 8BPost-GFC Deleveraging Has Ended And People Are Swiping Credit Cards Again Following The Pandemic Scare
Post-GFC Deleveraging Has Ended And People Are Swiping Credit Cards Again Following The Pandemic Scare
Post-GFC Deleveraging Has Ended And People Are Swiping Credit Cards Again Following The Pandemic Scare
Chart 9Banks Are Easing Credit Standards For Consumer Loans
Banks Are Easing Credit Standards For Consumer Loans
Banks Are Easing Credit Standards For Consumer Loans
Chart 10A Record Rise In Household Net Worth
A Record Rise In Household Net Worth
A Record Rise In Household Net Worth
Q: Household wealth could fall as the Fed starts tapering and eventually raising rates. Wouldn’t that cool the economy? A: The taper is a fait accompli, and markets are already pricing in rate hikes starting in the second half of next year. If the Fed were to signal its intention to raise rates more quickly than what has been priced in, then home prices and stocks could certainly weaken. We do not think the Fed will pivot in a more hawkish direction before the end of next year, however. The Fed’s estimate of the neutral rate is only 2.5%, a big step down from its estimate of 4.25% in 2012. The market’s view is broadly in line with the Fed’s (Chart 11). Despite the upward move in realized inflation, long-term inflation expectations remain in check – expected inflation 5-to-10 years out in the University of Michigan survey has increased from 2.3% in late 2019 to 2.9%, bringing it back to where it was between 2010 and 2015. The 5-year/ 5-year forward TIPS breakeven inflation rate is near the bottom end of the Fed’s comfort zone (Chart 12). Chart 11The Fed And Investors Still Believe In Secular Stagnation
The Fed And Investors Still Believe In Secular Stagnation
The Fed And Investors Still Believe In Secular Stagnation
Chart 12Long-Term Inflation Expectations Are Not Yet A Concern For The Fed
Long-Term Inflation Expectations Are Not Yet A Concern For The Fed
Long-Term Inflation Expectations Are Not Yet A Concern For The Fed
Q: What about fiscal policy? Isn’t it set to tighten sharply next year? A: The US budget deficit will decline next year. However, this will happen against the backdrop of strong private demand growth. Moreover, budget deficits are likely to remain elevated in the post-pandemic period. This week, President Biden signed a $1.2 trillion infrastructure bill into law, containing $550 billion in new spending. BCA’s geopolitical strategists expect Congress to pass a $1.5-to-$2 trillion social spending bill using the reconciliation process. All in all, the IMF foresees the US cyclically-adjusted primary budget deficit averaging 4.9% of GDP between 2022 and 2026, compared to 2.0% of GDP between 2014 and 2019 (Chart 13).
Chart 13
Chart 14While Overall Consumption Has Recovered, Business Spending and Direct Government Expenditures Remain Below Trend
While Overall Consumption Has Recovered, Business Spending and Direct Government Expenditures Remain Below Trend
While Overall Consumption Has Recovered, Business Spending and Direct Government Expenditures Remain Below Trend
It should also be noted that government spending on goods and services has been quite weak over the past two years (Chart 14). The budget deficit surged because transfer payments exploded. Unlike direct government spending, which is set to accelerate over the next few years, households saved a large share of transfer payments. Thus, the fiscal multiplier will increase next year, even as the budget deficit shrinks. Q: We have focused a lot on demand, but what about supply? There are over 4 million fewer Americans employed today than before the pandemic and yet the job openings rate is near a record high. Chart 15Despite A Notable Decline, There Are Still A Lot Of People Avoiding Work Because Of Worries About Contracting Or Transmitting Covid
Despite A Notable Decline, There Are Still A Lot Of People Avoiding Work Because Of Worries About Contracting Or Transmitting Covid
Despite A Notable Decline, There Are Still A Lot Of People Avoiding Work Because Of Worries About Contracting Or Transmitting Covid
A: Some people who left the workforce will regain employment. According to the Census Bureau’s Household Pulse Survey, there are still 2.5 million people not working because they are afraid of catching or transmitting the virus (Chart 15). That said, some workers may remain sidelined for a while longer. The very same survey also revealed that about 8 million of the 100 million workers currently subject to vaccine mandates say that “they will definitely not get the vaccine.” In addition, about 3.6 million workers have retired since the start of the pandemic, about 1.2 million more than one would have expected based on pre-existing demographic trends. Most of these retirees will not work again. Lifestyle choices may keep others from seeking employment. Female labor participation has declined much more during the pandemic and than it did during the Great Recession (Chart 16). While many mothers will re-enter the labor force now that schools have reopened, some may simply choose to stay at home.
Chart 16
The bottom line is that the pandemic has reduced labor supply at a time when labor demand remains very strong. This is likely to exacerbate the labor shortage. Q: Any chance that higher productivity will offset some of the damage to the supply side of the economy from decreased labor participation? A: US labor productivity did increase sharply during the initial stages of the pandemic. However, that appears to have been largely driven by composition effects in which low-skilled, poorly-paid service workers lost their jobs. As these low-skilled workers have returned to the labor force, productivity growth has dropped. The absolute level of productivity declined by 5.0% at an annualized rate in the third quarter, leading to an 8.3% increase in labor costs. It is telling that productivity growth has been extremely weak outside the US (Chart 17). This gives weight to the view that the pandemic-induced changes in business practices have not contributed to higher productivity, at least so far. It is also noteworthy that a recent study of 10,000 skilled professionals at a major IT company revealed that work-from-home policies decreased productivity by 8%-to-19%, mainly because people ended up working longer. Increased investment spending should eventually boost productivity. Core capital goods orders, which lead corporate capex, are up 18% since the start of the pandemic (Chart 18). However, the near-term impact of increased investment spending will be to boost aggregate demand, stoking inflation in the process.
Chart 17
Chart 18US Capex Should Pick Up
US Capex Should Pick Up
US Capex Should Pick Up
Q: We have spoken a lot about the US, but the world’s second biggest economy, China, is facing a massive deflationary shock from the implosion of its real estate market. Could that deflationary impulse potentially cancel out the inflationary impulse from an overheated US economy? A: You are quite correct that inflation has risen the most in the US. While inflation has picked up in Europe, this mainly reflects base effects (Chart 19). Inflation in China has fallen since the start of the pandemic despite booming exports. There are striking demographic parallels between China today and Japan in the early 1990s. The bursting of Japan’s property bubble corresponded with a peak in the country’s working-age population (Chart 20). China’s working-age population has also peaked and is set to decline by more than 40% over the remainder of the century. Chart 19The US Stands Out As The Inflation Leader
The US Stands Out As The Inflation Leader
The US Stands Out As The Inflation Leader
Chart 20Demographic Parallels Between China And Japan
Demographic Parallels Between China And Japan
Demographic Parallels Between China And Japan
That said, there are important differences between the two nations. In 1990, Japan was a rich economy; output-per-hour was nearly 70% of US levels. China is still a middle-income economy; output-per-hour is only 20% of US levels (Chart 21). China has the ability to outgrow some of its problems in a way that Japan did not. In addition, Chinese policymakers have learned from some of Japan’s mistakes. They have been trying to curb the economy’s dependence on property development; real estate development investment has fallen from 12% of GDP in 2014 to less than 10% of GDP (Chart 22). China is still building too many new homes, but unlike Japan in the 1990s, the government is likely to pursue stimulus measures to compensate for a shrinking property sector. This should keep the economy from entering a deflationary slump.
Chart 21
Chart 22Real Estate Investment Has Peaked In China
Real Estate Investment Has Peaked In China
Real Estate Investment Has Peaked In China
Q: Let’s bring this back to markets. What is the main investment takeaway from your view? A: The main takeaway is that investors should remain bullish on stocks and other risk assets for the next 12 months but be prepared to turn more cautious in 2023. The neutral rate of interest in the US is higher than generally assumed. This means that monetary policy is currently more accommodative than widely believed, which is good for stocks. Unfortunately, it also means that a policy error is likely: The Fed will keep rates too low for too long, causing the economy to overheat. Chart 23Bank Stocks Tend To Outperform When Yields Rise
Bank Stocks Tend To Outperform When Yields Rise
Bank Stocks Tend To Outperform When Yields Rise
This overheating will not be evident over the next six months. As we noted at the outset of this report, the US economy is currently at the top of the proverbial two steps in our projected “two steps up, one step down” trajectory for inflation. The cresting in durable goods inflation will provide a temporary respite from inflationary worries, even as the underlying long-term driver of higher inflation – an increasingly tight labor market – gains traction. Strong consumer demand and persistent labor shortages will incentivize companies to invest in new capacity and automate production. This will benefit industrial stocks and select tech names. Rising bond yields will also boost bank shares (Chart 23). A country’s current account balance is simply the difference between what it saves and what it invests. With savings on the downswing and investment on the upswing, the US will find it increasingly difficult to finance its burgeoning trade deficit. The US dollar is a high momentum currency, so we wouldn’t necessarily bet against the greenback in the near term (Chart 24). Nevertheless, with “long dollar” now a consensus trade, we would position for a weaker dollar over a 12-month horizon (Chart 25).
Chart 24
Chart 25Long Dollar Is A Crowded Trade
Long Dollar Is A Crowded Trade
Long Dollar Is A Crowded Trade
Chart 26A Depreciating Dollar Next Year Should Help Non-US Equities
A Depreciating Dollar Next Year Should Help Non-US Equities
A Depreciating Dollar Next Year Should Help Non-US Equities
A depreciating dollar next year should help non-US equities, especially beleaguered emerging markets (Chart 26). The dollar will strengthen anew in 2023, as the Fed is forced to turn more hawkish, and global equities begin to buckle. Peter Berezin Chief Global Strategist pberezin@bcaresearch.com Global Investment Strategy View Matrix
Image
Special Trade Recommendations
Image
Current MacroQuant Model Scores
Image
Highlights China’s slowdown will deepen, and US bond yields will likely rise. This augurs well for the US dollar but will produce a toxic cocktail for EM. The recent weakness in the commodity complex will continue. EM markets are at risk in absolute terms and will continue to underperform their DM counterparts. From a global macro perspective, the US dollar’s appreciation will be a re-balancing act. In a world where China is exporting economic weakness/deflation and the US is experiencing genuine inflation, a strong US dollar is desirable. The latter will redistribute inflation away from the US to the rest of the world and will redirect disinflationary pressures from the rest of the world to the US. Feature Chart 1DXY Breakout, EM FX Breakdown
DXY Breakout, EM FX Breakdown
DXY Breakout, EM FX Breakdown
The US dollar is breaking out and EM currencies are breaking down (Chart 1). This will set in motion a number of responses in global financial markets. These include but are not limited to selloffs in EM equities, domestic bonds and EM credit markets and a setback in the commodity complex. Hence, we reiterate our negative stance on EM stocks and fixed-income markets. We continue to recommend shorting a basket of EM currencies versus the US dollar. Please refer to the end of this report for detailed investment recommendations. Why The Greenback Is Set To Strengthen Since early in the year, our investment strategy has been based on two macro themes: China’s slowdown and rising US inflation. We concluded early on that these dynamics are positive for the US dollar. Both macro themes have played out fairly well, yet until recently the broad trade-weighted US dollar’s advance has been hesitant. Odds are that the rally in the greenback is about to accelerate. Chart 2China's Slowdown = US Dollar Rally
China's Slowdown = US Dollar Rally
China's Slowdown = US Dollar Rally
The fundamental case for the US dollar rally remains as follows: China’s slowdown will weigh more on emerging Asia, Japan, Europe, and/or commodity producing, developing and developed economies than it will on the US. The basis is that US exports to China make up only 0.7% of its GDP. The same ratio is much higher for the rest of the world. Hence, the US economy will outperform many advanced and emerging economies. Chart 2 illustrates that, historically, whenever China has slowed down, the US dollar has rallied. The mainland’s property construction is shrinking, and traditional infrastructure investment is also extremely weak (Chart 3). Beijing is easing its regulatory and macro policies but only by degrees. For now, policy support will be insufficient to reverse the business cycle downturn. In the meantime, the US economy is overheating. Specifically, all core type inflation measures have surged to well above 2% (Chart 4). Critically, nominal wages are rising at the fastest rate seen in the past 35 years (Chart 5). Chart 3China: Infrastructure Investment Is Very Weak
China: Infrastructure Investment Is Very Weak
China: Infrastructure Investment Is Very Weak
Chart 4US Core Inflation Is Broad-Based And High
US Core Inflation Is Broad-Based And High
US Core Inflation Is Broad-Based And High
Given that the employee quit rate is very high, employers will have to grant notable wage increases to both new and current employees. Thus, wage growth will accelerate further. Recent wage gains have not been offset by productivity growth. As a result, unit labor costs are rising (Chart 6). This will push businesses to raise their selling prices. So long as household income and consumption remain robust, businesses will likely succeed in raising their prices. In short, US inflation is acute and genuine, and, hence, it will persist unless the economy slows considerably. Chart 5US Nominal Wage Growth Is At Its Fastest In 35 Years
US Nominal Wage Growth Is At Its Fastest In 35 Years
US Nominal Wage Growth Is At Its Fastest In 35 Years
Chart 6US Unit Labor Costs Are Rising Fast
US Unit Labor Costs Are Rising Fast
US Unit Labor Costs Are Rising Fast
The rise in US inflation will initially be bullish for the US dollar. The reason is that fixed-income markets will move to price in higher Fed funds rates and the Fed will also acknowledge the need to hike rates given that core inflation is well above its target range. At some point in future, however, high inflation will start hurting the US dollar. This will happen when the Fed eschews rate hikes and falls behind the inflation curve. We believe we are still in a window where US bond yields could rise further. Rising US interest rates will support the dollar. Finally, the US economy, but not necessarily its equity and credit markets, is better positioned to handle central bank tightening than are other DM and EM economies. American consumers have substantially deleveraged and there are shortages in US housing and cars. Even as US borrowing costs rise, interest rate sensitive sectors like housing and autos will still do well because of pent-up demand. In particular, the US housing market is sensitive to long-term (30-year) mortgage rates and not the front end of curve. On the contrary, many EM and other DM economies and their housing sectors are sensitive to domestic short-term rates. In percentage terms, the rise in US mortgage rates will likely be smaller than those in DM and EM economies. In short, the US economy will not slow sharply in the response to rates while EM and other DM economies will. This augurs well for the dollar. The key US vulnerability from higher interest rates stems from its equity and credit markets, not the real economy. US equities and credit markets are very richly priced, so the rising cost of capital could trigger a major selloff. In turn, wealth effects and tightening financial conditions will pose a risk to the real economy. However, even in this case, the US dollar will initially appreciate because it always rallies during risk-off phases. The greenback’s depreciation will resume when the Fed turns dovish again. From a big picture macro perspective, the US dollar’s appreciation will be a re-balancing act. In a world where China is exporting economic weakness/deflation and the US is experiencing genuine inflation, a strong US dollar is desirable. The latter will redistribute inflation away from the US to the rest of the world and will redirect disinflationary pressures from the rest of the world to the US. In this period of US dollar strength, EM financial markets will be hurt because foreign investors always flee EM when their currencies depreciate. Bottom Line: China’s slowdown will deepen, and US bond yields will likely rise. This will produce a toxic cocktail for EM. Watch Out Commodity Prices Chart 7Reduced Financing For Property Developers = Less Construction
Reduced Financing For Property Developers = Less Construction
Reduced Financing For Property Developers = Less Construction
The downturns in China’s property construction and traditional infrastructure spending are bad for raw material prices. The following points offer an explanation as to why commodity prices will relapse in spite of the fact that they have thus far resisted China’s slowdown. Although Chinese property sales and starts have been shrinking, floor area completed (construction work) has been very strong. However, the liquidity crunch that many real estate developers are experiencing will lead them to halt or cut back on their construction work (Chart 7, top panel). The latter will weigh on raw material prices (Chart 7, bottom panel). Taiwan’s new export orders PMI for the basic materials sector has dropped below 50, indicating plunging regional demand for raw materials (Chart 8). Ongoing weakness in Chinese demand is the culprit behind this drop. Due to electricity shortages, mainland production of industrial metals has plunged (Chart 9, top panel). Yet, the prices of these metals have recently corrected (Chart 9, bottom panel). Falling prices amid shrinking supply are a sign of major demand relapse. Chart 8Greater China: Orders For Basic Materials Are Already Shrinking
Greater China: Orders For Basic Materials Are Already Shrinking
Greater China: Orders For Basic Materials Are Already Shrinking
Chart 9Base Metal Price Falling Despite Production Shutdowns In China
Base Metal Price Falling Despite Production Shutdowns In China
Base Metal Price Falling Despite Production Shutdowns In China
The Baltic Dry index – the price of shipping bulk commodities – has rolled over decisively. It has reasonable correlation with industrial metal prices. Oil is much less exposed than base metals to China’s property and infrastructure contraction. In the case of crude, the key risks are the US and China releasing their strategic reserves and the US dollar strength. Bottom Line: The recent weakness in the commodity complex will continue. Other Considerations Chart 10China's Onshore Stock-to_Bond Ratio Is Breaking Down
China's Onshore Stock-to_Bond Ratio Is Breaking Down
China's Onshore Stock-to_Bond Ratio Is Breaking Down
There are a number of other considerations and indicators that lead us to maintain a negative stance on EM financial markets: China’s onshore stock-to-bond ratio has broken below its 200-day moving average (Chart 10). This signifies a deepening growth slump in China. EM equity underperformance has been broad-based. Both the market cap-weighted and equal-weighted EM equity indexes have been underperforming their respective DM indexes. Further, not only have TMT (technology, media and telecom) stocks been underperforming their DM peers, but non-TMT stocks have also lagged their counterparts substantially (Chart 11). Last but not least, EM TMT stocks remain at risk. First, share prices of Chinese internet companies will continue derating due to structurally lower profitability going forward as the government exercises more control over them. We have discussed this in previous reports. In addition, consumer spending online has slowed sharply while smartphone sales are plunging (Chart 12). Chart 11EM Equity Underperformance Is Broad-Based
EM Equity Underperformance Is Broad-Based
EM Equity Underperformance Is Broad-Based
Chart 12China: Online Spending Is Very Weak
China: Online Spending Is Very Weak
China: Online Spending Is Very Weak
Second, DRAM (memory chip) prices are deflating and the value of DRAM sales is shrinking (Chart 13). This is weighing on Korean semiconductor share prices like Samsung and SK Hynix. These stocks have a large market cap in the KOSPI index. Finally, demand for semiconductors produced by Taiwanese companies has been booming but it is presently showing signs of moderation (Chart 14). Chart 13Falling DRAM Prices Are Weighing On Korean Semi Stocks
Falling DRAM Prices Are Weighing On Korean Semi Stocks
Falling DRAM Prices Are Weighing On Korean Semi Stocks
Chart 14Taiwanese Semiconductor Industry: Moderating Orders
Taiwanese Semiconductor Industry: Moderating Orders
Taiwanese Semiconductor Industry: Moderating Orders
Importantly, geopolitical risks around Taiwan in general and TSMC in particularly are enormous. The latter is literally at the center of the US-China confrontation. The timing of a diplomatic or even military crisis is uncertain but our Geopolitical Strategy team expects geopolitical risks over Taiwan to escalate substantially. The recent summit between Presidents Joe Biden and Xi Jinping does not change this assessment. Investment Recommendations Chart 15EM Credit Markets: Prepare For A Broad Selloff
EM Credit Markets: Prepare For A Broad Selloff
EM Credit Markets: Prepare For A Broad Selloff
Continue underweighting EM equities in a global equity portfolio. Within the EM space, our overweights are Korea, Singapore, China (favoring A shares over investable stocks), Vietnam, Russia, central Europe and Mexico. Concerning EM equity sectors, we reiterate the short EM banks / long DM banks and short EM banks / long EM consumer staples positions. In line with our US dollar breakout thesis, we continue to recommend a short position in a basket of the following EM currencies versus the US dollar: BRL, CLP, COP, PEN, ZAR, TRY, THB, PHP and KRW. EM exchange rate depreciation is bad for EM domestic bonds. Currency weakness could lead central banks in Latin America to hike rates further. In brief, the risk-reward of EM local currency bonds is still unattractive. In this space, we recommend the following positions: bet on yield curve flattening in Mexico and Russia (pay 1-year/receive 10-year swap rates); pay Czech 10-year swap rates; receive Chinese and Malaysian 10-year swap rates. We reiterate our underweight in EM credit (both sovereign and corporate) markets versus US corporate credit, quality adjusted. As EM exchange rates depreciate, EM credit spreads will widen (Chart 15). Chinese high-yield corporate US dollar bonds are not yet a buy because the mainland property market’s travails are far from over, as was discussed in our recent Special Report. For a complete list of our recommendations across all asset classes and country strategy within each asset class, please see below or visit our web site. Arthur Budaghyan Chief Emerging Markets Strategist arthurb@bcaresearch.com Footnotes Equities Recommendations Currencies, Credit And Fixed-Income Recommendations
Dear Client, This week, the US Bond Strategy service is hosting its Quarterly Webcast (November 16 at 10:00 AM EST, 15:00 PM GMT, 16:00 PM CET and November 17 at 9:00 HKT, 11:00 AEST). In addition, we are sending this Quarterly Chartpack that provides a recap of our key recommendations and some charts related to those recommendations and other areas of interest for US bond investors. Please tune in to the Webcast and browse the Chartpack at your leisure, and do let us know if you have any questions or other feedback. To view the Quarterly Chartpack PDF please click here. Best regards, Ryan Swift, US Bond Strategist
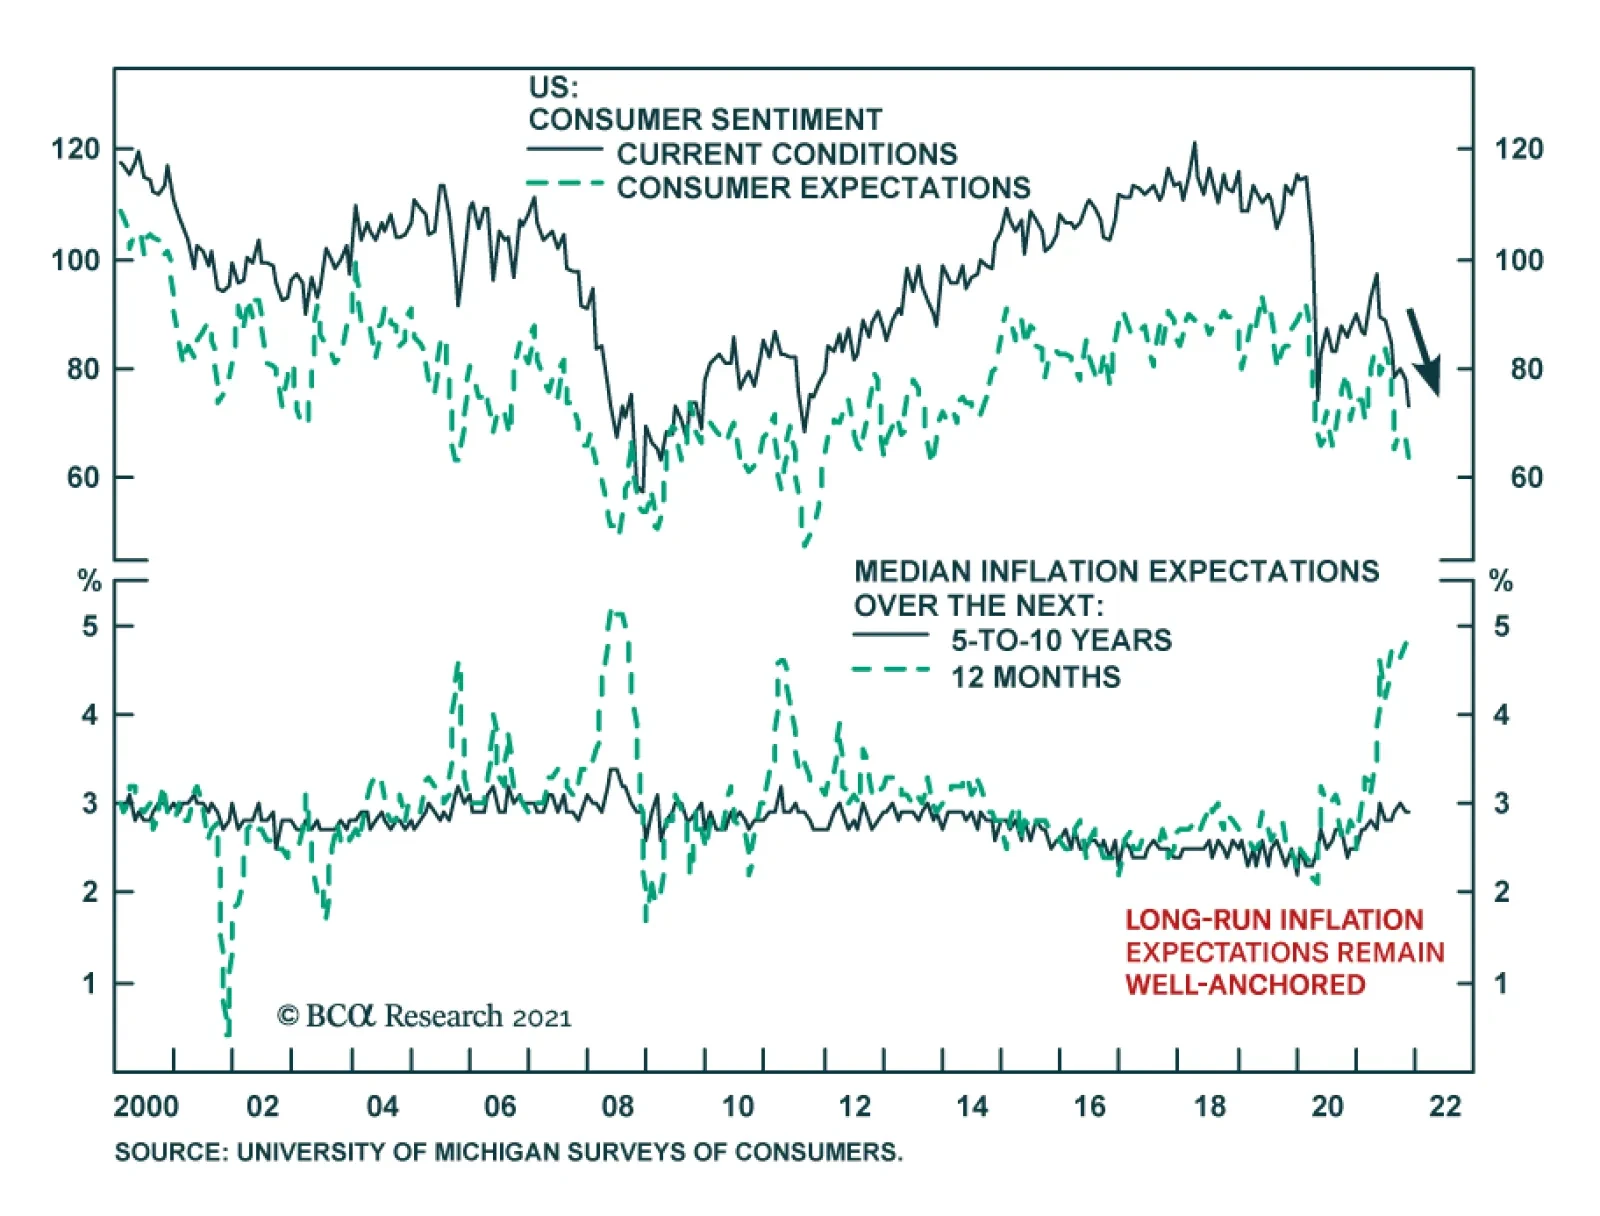
Concerns about inflation are continuing to dent US consumer confidence. The University of Michigan consumer sentiment survey’s headline index fell nearly 5 points in November to a decade low of 66.8, disappointing expectations of a minor improvement. The…