Labor Market

Highlights Recommended Allocation
Quarterly Portfolio Outlook: Stay Bullish But Verify
Quarterly Portfolio Outlook: Stay Bullish But Verify
The global economy will continue to grow at an above-trend rate over the next 12 months and central banks will remove accommodation only slowly.But the second year of a bull market is often tricky: Growth slows after its initial rebound, and monetary policy starts to be tightened, amid rising inflation.Equities are likely to outperform bonds over the next 12 months, driven by improving earnings, but at a slower pace than over the past year and with higher volatility.We continue to recommend only a cautiously optimistic stance on equities, with an overweight in US equities, and underweight in Europe. Our sector overweights are a mix of cyclicals (Industrials), plays on higher rates (Financials), and selective defensives (Health Care).China is likely to announce a stimulus to cushion the impact from Evergrande, which might push up oversold Chinese stocks. We close our underweight on Chinese equities, but raise them only to neutral as the real estate sector looks vulnerable. That could be bad news for commodities and the rest of Emerging Markets, which we cut to underweight.The Fed is likely to announce tapering this quarter, and raise rates in December 2022. This is likely to push up 10-year Treasury yields to 2-2.25% by then, and so we remain underweight duration.Investment-grade credit is expensive, but B-rated high-yield bonds still look attractive as defaults continue to decline. EM corporate debt is riskier post-Evergrande, but higher-rated sovereign dollar debt offers a good spread pickup.OverviewThe second year of a bull market is often tricky. Growth starts to slow after its initial rebound, and central banks move towards tightening policy. This does not signal the end of the bull market, but equity returns in Year 2 are typically lacklustre (Table 1).That is exactly the situation markets face now. Growth has been surprising on the downside, and inflation on the upside over the past few months (Chart 1). Table 1Year 2 Of Bull Markets Often Has Only Weak Returns
Quarterly Portfolio Outlook: Stay Bullish But Verify
Quarterly Portfolio Outlook: Stay Bullish But Verify
Chart 1Growth Surprising On The Downside, Inflation On The Upside
Growth Surprising On The Downside, Inflation On The Upside
Growth Surprising On The Downside, Inflation On The Upside
Our basic investment stance remains that the global economy will continue to grow at an above-trend rate over the next 12 months (as the consensus forecasts – Chart 2), and that central banks will remove accommodation only slowly. We can see no signs of a recession on the 18-to-24-month horizon and, as Chart 3 shows, equities almost always outperform bonds except during and in the run-up to recessions. Chart 2But Growth Will Continue To Be Above Trend
But Growth Will Continue To Be Above Trend
But Growth Will Continue To Be Above Trend
Chart 3Equities Outpeform Bonds Except Around Recessions
Equities Outpeform Bonds Except Around Recessions
Equities Outpeform Bonds Except Around Recessions
This justifies a moderately pro-risk stance, with overweights in equities and (selectively) credit, and a big underweight in government bonds. But the risks to this sanguine view are rising, and the next few months could be choppy. Stay bullish, but keep a close eye on what could go wrong.The slowdown in growth is largely because manufacturing boomed last year and now simply the pace of growth is decelerating. Manufacturing PMIs are (mostly) still above 50, but have fallen from their peaks (Chart 4). Supply-chain bottlenecks have also dented production. And consumers will spend less on durables and more on services, as lockdowns are eased.We have emphasized that the $2.5 trillion of excess savings in the US will boost spending over coming quarters. But enhanced unemployment benefits have now ended and most of the savings left are with richer households who have a lower propensity to spend (see page 9 for more on this). Covid also remains a risk: Cases are stickily high in some countries and consumers are still not 100% confident about going out to dine and for entertainment (Chart 5). Chart 4PMIs Falling But Mostly Still Above 50
PMIs Falling But Mostly Still Above 50
PMIs Falling But Mostly Still Above 50
Chart 5Consumers Still A Bit Wary About Going Out
Consumers Still A Bit Wary About Going Out
Consumers Still A Bit Wary About Going Out
China is an increasing risk to growth. Its economy has been slowing all year as a result of monetary tightening (Chart 6) and this may be exacerbated by the fallout from Evergrande. The Chinese authorities are likely to announce a stimulus package to offset the slowdown (which is why we are neutralizing our underweight on Chinese equities). But the stimulus will probably be only moderate and targeted, and they will not allow a renewed boom in real estate (as we explain on page 11), which has been a significant driver of Chinese growth in recent years (Chart 7). This could hurt the economies of Emerging Markets and other commodity producers, which depend on Chinese demand. Chart 6China Has Been Slowing All Year
China Has Been Slowing All Year
China Has Been Slowing All Year
Chart 7Real Estate Has Been A Big Driver Of Chinese Growth
Real Estate Has Been A Big Driver Of Chinese Growth
Real Estate Has Been A Big Driver Of Chinese Growth
At the same time that growth is slowing, inflation is proving a little stickier and broader-based than was expected. Measures of underlying inflation pressure, such as trimmed-mean CPIs, suggest that it is no longer only pandemic-related prices that are rising in the US and some other countries (Chart 8). Rising shipping charges (container rates are up 228% this year) are pushing up the cost of imported goods. And the first signs are emerging that labor shortages, especially in restaurants and shops, are causing wage rises (Chart 9). Chart 8Inflation Is Broadening Out In Some Countries
Inflation Is Broadening Out In Some Countries
Inflation Is Broadening Out In Some Countries
Chart 9The First Signs Of Wage Rises?
The First Signs Of Wage Rises?
The First Signs Of Wage Rises?
Unsurprisingly, then, central banks are starting to wind down their asset purchases and even raise rates. Norges Bank was the first developed central bank to hike this cycle in September. New Zealand may follow in Q4. And the Fed has pretty clearly signaled that it, too, will announce tapering before year-end. And this is not to mention Emerging Market central banks, many of which have had to raise rates sharply in the face of soaring inflation (Chart 10).A shrinking of excess liquidity is another common phenomenon of the second stage of expansions, as monetary policy starts to be tightened and liquidity is directed more towards the real economy and less towards speculation. This, too, often caps the upside for risk assets, though it doesn’t usually cause them to collapse (Chart 11). Chart 10EM Central Banks Raising Rates Sharply
EM Central Banks Raising Rates Sharply
EM Central Banks Raising Rates Sharply
Chart 11Excess Liquidity Is Drying Up
Excess Liquidity Is Drying Up
Excess Liquidity Is Drying Up
Table 2Who Will Raise Rates When?
Quarterly Portfolio Outlook: Stay Bullish But Verify
Quarterly Portfolio Outlook: Stay Bullish But Verify
While there are many factors that might cause market jitters over the coming months, the underlying picture is that robust growth is likely to continue and central banks will remain cautious about tightening too quickly. Excess savings will propel consumption, companies will need to increase capex to fulfill that demand, and the impact of fiscal stimulus is still coming through (Chart 12). The big central banks won’t raise rates for some time: The Fed perhaps in late-2022, but the ECB and the Bank of Japan not over the forecast horizon (Table 2). Decent growth and easy policy remains a positive backdrop for risk assets over the 12-month horizon. Chart 12Fiscal Stimulus Is Still Coming Through
Quarterly Portfolio Outlook: Stay Bullish But Verify
Quarterly Portfolio Outlook: Stay Bullish But Verify
Garry Evans, Senior Vice PresidentChief Global Asset Allocation Strategistgarry@bcaresearch.comWhat Our Clients Are AskingHow Worried Should We Be About Inflation?Since the beginning of the year, we have argued that the current period of high inflation will be transitory. The market has adopted this view, with 5-year/5-year forward inflation expectations remaining at 2.2%. Chart 13Growing Signs That Inflation Might Not Be Transitory
Growing Signs That Inflation Might Not Be Transitory
Growing Signs That Inflation Might Not Be Transitory
However, we have grown worried about the possibility that inflation might be stickier at a higher level than we initially expected. Specifically, while it is true that prices of supply-constrained items – such as used cars – have started to ease, there are signs that higher inflation has began to broaden. Core CPI excluding pandemic-related items and cars has started to pick up, with its 6-month rate of change reaching its highest level in more than a decade (Chart 13, panel 1). Meanwhile 42% of the PCE basket grew at an annual rate of more than 5% in July, compared to just 24% in March.Currently, we are watching the behavior of prices in the housing and labor markets to check if our worries are justified. We pay particular attention to these sectors because price pressures in housing and labor can be self-sustaining, giving rise to inflationary spirals if left unchecked.What is happening to inflation in these areas? So far, the signals are mixed. Even though wage growth remains within the historical norm for now, any further advance in wages will take us to a decade high (Chart 13, panel 2). Likewise, annual growth of shelter cost remains low, though its 6-month change suggests that it will soon begin to rise to its pre-pandemic levels (Chart 13, panel 3).Our base case continues to be that high inflation is transitory. That being said, we have positioned our portfolio to hedge for the risk that this view is wrong. We have given an overweight to real estate in our alternatives portfolio and within equities. Will Consumers Really Spend All Those Savings? Chart 14Low-Income Households Did Not Save Much
Quarterly Portfolio Outlook: Stay Bullish But Verify
Quarterly Portfolio Outlook: Stay Bullish But Verify
Generous unemployment benefits and the year-long lockdown have pushed up US excess savings over the past 18 months to an estimated $2.5 trillion, and the household savings ratio to 9.6% (Chart 14, panel 1). The consensus is that these savings will bolster consumer spending and support broad economic growth over the coming quarters. However, this expectation is based on the assumption that all consumers have accumulated savings, whereas the reality is a bit different.Survey results from the US Census Bureau show that households earning under $75,000, which have the highest propensity to consume, have almost entirely spent their first stimulus checks and three-quarters of their second and third checks on expenses and paying off debt. Even for those earning over $75,000, only 50% of those stimulus receipts have gone into savings (Chart 14, panel 2).With the labor market still not back to full employment (albeit mostly because of labor supply issues), enhanced unemployment benefits coming to an end, fears of further Covid variants and lockdowns, and higher inflation, could precautionary savings rise? The years following the Global Financial Crisis suggest that they might: The savings rate rose from 3% at the onset of the GFC to 8% five years after it (Chart 14, panel 3). A similar attitude among consumers this time could put a dent in US growth, given that consumption makes up about 70% of GDP.This raises the risk that consumption might slow over the coming quarters. In our latest Monthly Portfolio Outlook, we highlighted that consumption is shifting away from goods towards services. While value added from manufacturing is only 11% of GDP, the effect on markets might be bigger, since goods producers make up about 40% of US market cap. What Is The Risk Of A Big Upside Surprise In US Employment?The recovery of the labor market remains at the center of investors’ and Fed officials’ attention. The reluctance to return to the workforce mostly reflects overly generous unemployment benefits and fears of getting infected. With the fourth wave of the pandemic showing signs of cresting and benefits expiring, the consensus is that the unemployment gap will soon shrink. We would, however, question whether the labor market can surprise significantly to the upside and recover faster than the market currently implies. A swift recovery would push up bond yields and bring forward the Fed’s liftoff date, which could hurt the outlook for risk assets. Chart 15The Labor Market Could Surprise To The Upside
The Labor Market Could Surprise To The Upside
The Labor Market Could Surprise To The Upside
The number of men not in the labor force but who want a job has fallen back to the pre-pandemic level (Chart 15, panel 1). The sharp decline in this indicator in August coincided with the expiration of unemployment benefits in some Republican states. The overall Federal pandemic benefits program expired in early September. This should push even more people to return to the workforce (Chart 15, panel 2).However, there are still close to 3.5 million women (almost half a million above the pre-pandemic level) who are not in the labor force but would like a job: Some of these are keen to return to the workplace once they deem it safe for their children to get vaccinated and return to school. With governments eager to speed up vaccination rollouts and Pfizer’s recent announcement showing positive results of its Covid vaccine in trials on children under the age of 12, more women should return to the workforce.It is also worth noting that some of the most hard-hit sectors – such as leisure & hospitality – have already recovered over 80% of the jobs lost since February 2020. For sectors yet to reach such a high recovery rate, for example education & health services, returning workers have room to choose from jobs. For every job lost since the onset of the pandemic, there are now 2.1 job openings (Chart 15, panel 3). What Is The Risk Of Contagion From Evergrande?In September, Chinese property developer Evergrande failed to make an interest payment on an overseas bond issue. What would be the consequences for the Chinese and global economy if it went bankrupt? Chart 16Chinese Companies Are Highly Indebted
Chinese Companies Are Highly Indebted
Chinese Companies Are Highly Indebted
Evergrande is big. Its debts are $306 billion, 2% of Chinese GDP. It has yet to build 1 million units that have already been paid for. It employs 200,000 people. And the issue is bigger. For years, investors have worried about China’s corporate debt, which is 160% of GDP (Chart 16). Chinese companies have issued almost $1 trillion of bonds in foreign currencies. The property market plays an outsized role in the economy: It comprises 66% of household wealth (versus 24% in the US); real estate and related industries amount to some 30% of GDP.The government will likely rescue Evergrande. But it faces a dilemma: For years it has been trying to reduce bad debt and stabilize house prices. It cannot bail out Evergrande’s creditors without undermining those efforts.It will probably aid apartment buyers, who have paid upfront for Evergrande properties, and make arrangements for domestic banks to swap their debt for equity or land holdings. But it won’t bail out equity owners or foreign bond holders. It will also not ease real-estate market restrictions, such as the “three red line” rules on property companies’ leverage. Such a package could damage Chinese individuals’ confidence in property, and foreigners willingness to provide capital to the industry.China may also announce a stimulus package to bolster the economy. But local governments are dependent on land sales for around a third of their income (Chart 17). If the property market is weak, the transmission mechanism of stimulus may be damaged. Finally, Chinese housing sales are highly correlated to global commodities prices, which may fall as a result (Chart 18). Chart 17Local Governments Depend On Land Sales
Local Governments Depend On Land Sales
Local Governments Depend On Land Sales
Chart 18A Slowdown In Housing Would Hurt Commodities
A Slowdown In Housing Would Hurt Commodities
A Slowdown In Housing Would Hurt Commodities
BCA Research’s EM and China strategists do not see Evergrande as likely to trigger a systemic crisis or crash, but it will reinforce the chronic credit tightening that has been underway in China.1Is It Time To Overweight Japanese Equities?Japanese equities staged a strong rally in the third quarter, outperforming the MSCI global equity index by about 5% in US dollar total return terms. On an absolute basis, the MSCI Japan price index in USD is near its 1989 historical high, even though the local-currency index is still more than 30% below its 1989 all-time high.We have been underweight Japanese equities in our global equity portfolio since July 2019, mainly due to unfavorable structural forces such as the aging population and chronic deflationary pressures. Japanese equities have tended to stage counter-trend bounces, some of which were quite significant in magnitude (Chart 19, panel 1). We therefore recommend clients move to the sidelines to avoid the potentially short-lived but sharp upside risk, supported by the following two considerations:First, foreign investors play a significant role in the Japanese equity market. The fact that MSCI Japan in USD terms is near its all-time high could trigger more foreign buying, given the positive correlation between the price index and price momentum (Chart 19, panels 3 and 5).Second, Japanese equities are among the cheapest globally, trading at a large discount to the global index. Currently, the discount is larger than its 3-year moving average, making it risky to underweight Japan.So why not overweight Japanese equities?The Japanese equity index is dominated by Industrials. It should benefit from our favorable view on this sector. However, Japan’s machinery and machine tool industries have heavy reliance on Asia, especially China. Orders from China have already rolled over with the Chinese PMI now in contractionary territory. In the meantime, the rolling-over of the US and European PMIs also does not bode well for orders from the other two large regions (Chart 20). Chart 19Upgrade Japanese Equities To Neutral
Upgrade Japanese Equities To Neutral
Upgrade Japanese Equities To Neutral
Chart 20Japan's Heavy External Reliance
Japan's Heavy External Reliance
Japan's Heavy External Reliance
We expect that China will eventually inject stimulus into its economy in a measured fashion such that the negative spillover to Japan and Europe may be limited. That’s why we are also taking profit in our underweight position on China after the recent sharp selloff in the offshore Chinese equity index (see page 18).Global EconomyOverview: The developed world continues to see strong growth, albeit at a slower pace than nine months ago. This is causing a more persistent – and more broad-based – rise in inflation, especially in the US, than was previously expected. However, the Fed is unlikely to raise rates for at least another 12 months, and the ECB and BOJ not on the forecast horizon. The biggest risk to global economic growth is the slowdown in China and now the troubles at Evergrande. We assume that the Chinese government will launch a stimulus to cushion the slowdown, but it may be less effective than the market expects. Chart 21US Growth Has Slowed But Remains Above Trend
US Growth Has Slowed But Remains Above Trend
US Growth Has Slowed But Remains Above Trend
US: Growth has been slowing relative to expectations all year (Chart 21, panel 1). Nonetheless, it is still well above trend. The September Markit PMIs remained high at 60.5 for manufacturing and 54.4 for services. Although consumer confidence has fallen back a little because of the third Covid wave in some southern states, retail sales in August were still up 15% year-on-year and 1.8% (ex autos) month-on-month. Growth seems set to remain above trend, as consumers spend their $2.5 trillion of excess savings, companies increase capex to ease supply-chain bottlenecks, and the government rolls out more fiscal spending. The IMF forecasts 4.9% real GDP growth in 2022, after 7.0% this year. Euro Area growth also remains robust, with the manufacturing and services PMIs at 58.7 and 56.3 respectively in September. Vaccination levels have risen (more quickly than in the US) and, as a consequence, lockdowns and international travel restrictions have been largely eased. Inflation pressures remain more restrained than in the US, with core CPI at only 1.6% (mainly pushed up by pandemic-related shortages) and the trimmed-mean CPI barely above zero. The ECB persuaded the market that its tapering, announced in September, is very dovish, and it is certainly true that – with its new 2% symmetrical inflation target – the ECB is not set to raise rates any time soon. The IMF’s forecasts are for 4.6% real GDP growth this year, and 4.3% next.Japan has generally lagged the recovery in the rest of the world, due to its structural headwinds, but it is now seeing some more robust data. Industrial production is up 12% year-on-year and exports 26%, although the PMIs still remain somewhat depressed at 51.2 for manufacturing and 47.4 for services in September. Japan’s initial slow vaccine rollout has recently accelerated and the percent of double-vaccinated adults now exceeds the US. This suggests that sluggish consumption (with retail sales up only 2% year-on-year) might start to recover. Markets got excited about the prospects for fiscal stimulus ahead of the general election, which has to be held by the end of November. We do not see new LDP leader Fumio Kishida, who is likely to win that election, making any significant change in policy. Chart 22China Is The One Market Where Growth Is Slowing Sharply
China Is The One Market Where Growth Is Slowing Sharply
China Is The One Market Where Growth Is Slowing Sharply
Emerging Markets: China’s slowdown – and the government’s possible reaction to it with a large stimulus – dominate the outlook for Emerging Markets. Both China’s manufacturing and services PMIs are now below 50 (Chart 22, panel 3), and retail sales, industrial production and fixed-asset investment all surprised sharply on the downside last month. We expect an easing of policy, but only a moderate one. Elsewhere in Emerging Markets, central banks continue to struggle with the puzzle of whether they need to raise rates (as Russia, Brazil and Mexico have done) in the face of rising inflation and falling currencies, despite continuing underlying weakness in their economies. Interest Rates: US inflation looks stickier than believed three months ago, with a broadening of inflation away from just pandemic-affected items (see “How Worried Should We Be About Inflation?" on page 8). But inflation expectations are still well under control (Chart 22, panel 4) and so the Fed is likely to begin tapering only in December and not raise rates until end-2022. This will most likely cause a moderate rise in long-term rates with the 10-year US Treasury yield rising to 1.7% by year-end and 2-2.25% by the time of the first Fed rate hike. Inflation elsewhere in developed economies looks more subdued (except in the UK and Canada), and so long-term rates are likely to rise somewhat more slowly there.Global Equities Chart 23Watch Earning Revisions
Watch Earning Revisions
Watch Earning Revisions
Global equities ended the quarter more or less flat after a very strong performance in the first eight months of the year and a volatile September. Earnings growth continued its strong trend from the first half, powered by margin improvement in both the DM and EM universes. Consequently, the forward PE multiple contracted further (Chart 23).Going forward, despite worries about the potential spillover to the global economy and global financial markets from China’s Evergrande fiasco, the “earnings-driven” theme will likely continue. BCA’s global earnings model points to over 40% earnings growth for the next 12 months, and all sectors have positive forward earnings estimates. However, net revisions by analysts seem to be cresting as the global manufacturing PMI has rolled over from a very high level. Even though valuation is less stretched than at the beginning of the year, equities are still expensive by historical standards. In addition, central banks are preparing for an eventual withdrawal of their massive liquidity injections and there is still plenty of uncertainty concerning Covid variants. GAA has been cautiously optimistic so far this year with overweights on equities and cash relative to bonds, and overweight US equities relative to Japan, Europe and China. These positions have panned out well. After adjustments made in April and July, our sector portfolio has been well positioned by overweighting Industrials, Financials, Real Estate and Healthcare, underweighting Materials, Utilities and Consumer Staples, and being neutral on Tech, Consumer Discretionary and Communication Services. We have not made any changes to our sector recommendations this quarter.In accordance with our long-held belief of “taking risk where risk will likely be rewarded the most,” we make the following adjustments to our country allocations: close the underweights in China and Japan and the overweight in the UK; and initiate one new position: Underweight EM-ex-China. Overall, our country portfolio has a defensive tilt with an overweight in the US (defensive) and underweights in the euro area and EM-ex China (cyclical), while being neutral on the UK, Japan, Australia and Canada. Country Allocation: Upgrade MSCI China And Japan, Downgrade UK And EM-ex-China. We have been underweight MSCI China and overweight the UK since April 2021, and underweight Japan since July 2019.The China underweight generated outperformance of 23% and the UK overweight -2%, while the Japanese position produced an outperformance of 7%. Chart 24Favor China vs The Rest of The EM
Favor China vs The Rest of The EM
Favor China vs The Rest of The EM
While the fate of Evergrande Group, China’s second largest property developer, remains uncertain, our view is that the government will come up with a restructuring plan to minimize damaging ripple effects on the Chinese economy. This view is supported by the behavior of the domestic A-share market and also the CNY/USD, which has diverged from the offshore equity market (Chart 24, Panel 5).BCA Research’s house view is that China will now stimulate its economy, but only at a measured pace. This means that further underperformance of MSCI China is likely to be limited relative to the global benchmark, as shown in Chart 24, panel 1. The ongoing deleveraging in the Chinese real estate sector, however, means that activity in the sector will probably slow further, reducing demand for construction materials. This may put a dent on the strength of metal prices, therefore negatively impacting the ex-China EM equity index, as shown in panel 2.Moreover, the relative performance of China vs non-China EM is approaching a very oversold level while the relative valuation measure is at an extreme (Chart 24, panels 3 and 4). As such, we switch our positioning by upgrading Chinese equities to neutral from underweight and downgrade EM ex China to underweight from neutral. This implies an overall underweight to Emerging Markets.We also close the UK overweight to support an upgrade in Japan (see more details on page 13). The UK overweight was largely based on a positive view of the GBP, which has now risen to fair value.Government Bonds Chart 25Watch Inflation In 2022
Watch Inflation in 2022
Watch Inflation in 2022
Maintain Below-Benchmark Duration. Global bond yields ignored the sharp rise in core inflation in Q3. The US 10-year Treasury yield actually declined in the first two months of the quarter in response to the muted inflation readings in non-Covid related segments of the economy. Even with the fast run-up in yields in September, the US 10-year yield finished the quarter at 1.52%, only about 5 bps higher than the level on June 30th (Chart 25).We have advised clients to focus on the jobs market to determine when the Fed will lift the Fed Funds Rate off its zero bound because of the Fed’s emphasis on “maximum employment” as a pre-condition for this. However, the Fed has not clearly defined what “maximum employment” means. According to calculations by our US bond strategists, the US unemployment rate will fall to 3.8%, with a 63% participation rate, by the end of 2022 if job creation averages a reasonably achievable 414,000 per month until then. Our bond strategists think that the Fed will be forced to clarify its definition of “maximum unemployment” over the coming months and, as we get close to it next year, the key indicator to watch will shift back to inflation. If inflation remains high, then the Fed will be quicker to declare that the labor market is at “maximum employment”, and vice versa.Currently, the overnight index swap curve indicates the first rate hike will be in January 2023 with a total rate increase of 123 bps by the end of 2024. BCA Research’s house view is that the Fed will announce its first hike in December 2022 and will hike at a faster pace than what is priced in by the market. This is based on our view that unemployment will likely reach 3.5% by end-2022 with inflation above the Fed’s target. This would suggest that long-term rates will rise too, and so bond investors should remain below benchmark duration.Corporate BondsSince the beginning of the year, investment-grade credit has provided roughly 200 basis points of excess return over duration-matched Treasurys, while high-yield bonds have generated almost 600 basis points. Chart 26Continue to Favor High-Yield Credit
Continue to Favor High-Yield Credit
Continue to Favor High-Yield Credit
We continue to have a neutral allocation to investment-grade credits within the fixed-income category. While supportive monetary policy should generally favor spread product, we believe there is much better value to be found outside investment-grade bonds, since these bonds are currently trading at historically high valuation levels (Chart 26, panel 1).We think valuations look much more attractive in the high-yield space, and as a result remain overweight within the fixed-income category. Our US Bond Strategy service expects the share of defaults in the space to fall to between 2.3% and 2.8% – below the default rate currently priced in by the market (Chart 26, panel 2). Within high yield, we prefer B-rated bonds since they offer the most attractive spread pickup on a risk-adjusted basis.What about EM debt? Currently we are cautious on EM corporate debt. The default of Chinese real estate developer Evergrande is likely to have ripple effects throughout EM credit markets and currencies. There are already signs of considerable strains, with EM corporate spreads starting to rise (Chart 26, panel 3). We recommend that investors focus on EM sovereign issuers such as Mexico, Russia, and Malaysia, given that they provide a significant yield pickup over US bonds with comparable credit ratings, and are less likely to default than their corporate counterparts.CommoditiesEnergy (Overweight): Oil prices are likely to remain close to current levels for the remainder of this year. However, recovering demand – particularly from Emerging Markets – and production discipline by the OPEC 2.0 coalition should support prices over the next two years. Given this backdrop, our Commodity & Energy strategists expect the price of Brent crude to average $75 and $80 per barrel in 2022 and 2023 respectively, with WTI trading $2-$4/bbl lower. Chart 27Limited Upside For Oil And Metals In The Short-Term
Limited Upside For Oil And Metals In The Short-Term
Limited Upside For Oil And Metals In The Short-Term
Industrial Metals (Neutral): Industrial metals’ prices have bifurcated. Those relating to alternative energy, such as copper, nickel and cobalt, continue to rise and are up 30% on average since the beginning of the year. Iron ore on the other hand has taken a colossal hit, falling over 53% from its May high. The knock-on effects of accelerating Chinese production cuts and softening economic activity, as well as Evergrande’s debt woes, will continue to put downward pressure on prices. In the short-term, we do not expect a significant rebound. However, in the longer-term, demand will recover – particularly if China implements significant stimulus – and supply will remain tight, which will help metal prices to recover.Precious Metals (Neutral): Gold prices did not react positively to the decline in US real rates over the past quarter. In fact, gold prices are slightly down, by ~1.5% since the start of July (Chart 27, panel 4). We expect real rates to rise as economic growth and the labor market recover and the Fed turns slightly more hawkish, while inflation moderates as base and pandemic effects abate. Rising real rates are a negative factor for the gold price. Nevertheless, inflation is likely to be a bit stickier than the market is currently pricing in, and we therefore maintain a neutral exposure to gold, since it is a good inflation hedge.CurrenciesUS Dollar Chart 28Do Not Underweight The Dollar Yet
Do Not Underweight The Dollar Yet
Do Not Underweight The Dollar Yet
Since we went from underweight to neutral on the dollar in April, the DXY has risen by only 1%. Our position remains the same for this quarter. On the one hand, momentum – one of the most reliable indicators for cyclical movements in the dollar – has turned firmly positive. Moreover, pain in the Chinese real-estate sector should weight on commodities and emerging markets – a development which historically has been bullish for the USD (Chart 28, panel 1). However, not all is good news for the greenback. Relative growth and inflation trends are starting to rebound in the rest of the world vis-à-vis the US (Chart 28, panel 2). Additionally, speculators are now firmly overweight the USD, and it remains expensive by 11% relative to PPP fair value. We believe that these forces could eventually be strong enough for the dollar bear market to resume. As a result, we are putting the US dollar on downgrade watch. Canadian DollarWe believe that there is upside to the Canadian dollar. Canada’s employment market is recovering faster than in the US, which should prompt the BoC to normalize interest rates before the Fed. Additionally, while many commodities are likely to suffer as China’s real estate market slows, oil should hold up relatively well since its demand is not as dependent on the Chinese economy. As a result, we are upgrading the CAD from neutral to overweight. Australian DollarWe remain underweight the AUD. While it is true that the AUD is now cheap on a PPP basis, weakness in iron ore from a slowing Chinese real-estate market should continue to weigh on the Aussie dollar. Chinese YuanWe are negative on the yuan on a cyclical basis. Interest-rate differentials should start moving against this currency (Chart 28, panel 3). While the Fed is likely to tighten policy as the labor market enters full employment, Chinese authorities will ease monetary policy to avert a full-blown crisis in their real-estate market.Alternatives Chart 29Outlook Remains Favorable For Private Equity And Real Estate
Quarterly Portfolio Outlook: Stay Bullish But Verify
Quarterly Portfolio Outlook: Stay Bullish But Verify
Return Enhancers: With public markets expensive and unlikely to provide investors with more than single-digit returns, the focus has shifted to alternative assets, particularly private equity (PE). Performance continues to be impressive, with an annualized return of 59% in Q4 2020 (Chart 29, panel 1). This supports our previous research that funds raised during recessions and early in expansions tend to outperform those raised late-cycle. Distributions from existing positions should allow limited partners (LPs – the investors who provide capital to PE funds) to commit to newer funds. Data from Preqin shows that more than $610 billion has been raised so far during 2021 (Chart 29, panel 2). We continue to favor Private Equity over Hedge Funds.Inflation Hedges: Last year’s inflationary pressures should moderate over the coming months as base effects and supply chain bottlenecks abate. Given this backdrop, we maintain our positive view on real estate versus commodity futures. Commodity prices have already shot up over the past 18 months and have limited upside from current levels: Energy prices are up by 61% since the beginning of the year, industrial metals 24%, and agriculture 17%. Over the past 15 years, REITs outperformed commodity futures when inflation was between 0% and 3% (Chart 29, panel 3). There are opportunities within the real-estate sector, despite our concerns about weaknesses in some segments of commercial real estate such as prime office property in major cities.Volatility Dampeners: We continue to favor farmland and timberland over structured products, particularly mortgage-backed securities (MBS). Farmland offers attractive yields and should continue to provide the best portfolio protection in the event of any market distress. MBS spreads, on the other hand, while wider than the pre-pandemic level, remain tight compared to the pace of mortgage refinancing (Chart 29, panel 4).Risks To Our ViewOur main scenario is based on a Goldilocks-like view of the world: That growth will be robust, but not so strong as to push up inflation further and cause central banks to turn hawkish. The risks, therefore, are that the environment turns out to be either too hot or too cold. Chart 30A Resurgence Of Covid
A Resurgence Of Covid
A Resurgence Of Covid
What could cause growth to slow? Covid remains the biggest risk. Cases are still high in many countries, and could rise again as people socialize indoors during the colder months (Chart 30). A more virulent strain is not inconceivable. Governments will be reluctant to impose lockdowns again, but consumers might become wary about going out.We have written elsewhere (see page 11) about the risks coming from a China slowdown and the aftermath of the Evergrande affair. A policy mistake is not improbable: The Chinese authorities want to stimulate the economy, but at the same time keep a lid on property prices. That will be a hard balance to achieve. Slower Chinese growth would hurt commodity producers and many Emerging Markets. Other risks to growth include fiscal tightening as employment-support schemes end and countries look to repair their budget positions (Chart 31), consumers building up precautionary savings and not spending their excess cash (see page 9), and problems caused by rising energy prices.Our view remains that the currently high inflation is transitory. But it is proving quite sticky and could remain high for a while. Inflation expectations are well anchored for the moment (Chart 32) but could rise above central banks’ comfort-zones if recorded core inflation in the US, for example, currently 3.6%, stays above 3% for another 12 months. This could bring forward the date of the first Fed rate hike (currently priced in for January 2023), raise long-term rates and, in turn, push up the dollar. A combination of rising US rates and a stronger dollar would have very negative consequences for heavily indebted Emerging Market economies. Chart 31Fiscal Drag
Fiscal Drag
Fiscal Drag
Chart 32Deanchoring Of Inflation Expectations
Deanchoring Of Inflation Expectations
Deanchoring Of Inflation Expectations
Footnotes1 Please see China Investment Strategy Report "The Evergrande Saga Continues," dated September 29, 2021 and Emerging Markets Strategy Report "On Chinese Internet Stocks, Real Estate And Overall EM," dated September 16, 2021, available at https://www.bcaresearch.com/GAA Asset Allocation
Highlights The fourth quarter will be volatile as China still poses a risk of overtightening policy and undermining the global recovery. US political risks are also elevated. A debt default is likely to be averted in the end. Fiscal stimulus could be excessive. There is a 65% chance that taxes will rise in the New Year. A crisis over Iran’s nuclear program is imminent. Oil supply disruptions are likely. A return to diplomacy is still possible but red lines need to be underscored. European political risks are comparatively low, although they cannot go much lower, Russia still poses threats to its neighbors, and China’s economic wobbles will weigh on European assets. Our views still support Mexican equities and EU industrials over the long run but we are booking some gains in the face of higher volatility. Feature Our annual theme for 2021 was “No Return To Normalcy” and events have borne this out. The pandemic has continued to disrupt life while geopolitics has not reverted to pre-Trump norms. Going forward, the pandemic may subside but the geopolitical backdrop will be disruptive. This is primarily due to Chinese policy, unfinished business with Iran, and the struggle among various nations to remain stable in the aftermath of the pandemic. Chart 1Delta Recedes With Vaccinations
Delta Recedes With Vaccinations
Delta Recedes With Vaccinations
Chart 2Global Recovery Marches On
Global Recovery Marches On
Global Recovery Marches On
Chart 3Global Labor Markets On The Mend
Global Labor Markets On The Mend
Global Labor Markets On The Mend
The underlying driver of markets in the fourth quarter will be the fact that the COVID-19 pandemic is waning as vaccination campaigns make progress (Chart 1). New cases of the Delta variant have rolled over in numerous countries and in US states that are skeptical toward vaccines. Global growth will still face crosswinds. US growth rates are unlikely to be downgraded further while Europe’s growth has been upgraded. However, forecasters are likely to downgrade Chinese growth expectations in the face of the government’s regulatory onslaught against various sectors and property sector instability (Chart 2). Barring a Chinese policy mistake, the global composite PMI is likely to stabilize. Labor markets will continue healing (Chart 3). The tug of war between unemployment and inflation will continue to give way in favor of inflation, given that wage pressures will emerge, stimulus-fueled household demand will be strong, and supply shortages will persist. Central banks will try to normalize policy but will not move aggressively in the face of any new setbacks to the recovery. Will China Spoil The Recovery? Maybe. Chinese policy and structural imbalances pose the greatest threat to the global economic recovery both in the short and the long run. The immediate risk to the recovery is clear from our market-based Chinese growth indicator, which has not yet bottomed (Chart 4). The historic confluence of domestic political and geopolitical risks in China is our key view for the year. China is attempting to make the economic transition that other East Asian states have made – away from the “miracle” manufacturing phase of growth toward something more sustainable. But there are two important differences: China is making its political and economic system less open and free (the opposite of Taiwan and South Korea) and it is confronting rather than befriending the United States. The Xi administration is focused on consolidating power ahead of the twentieth national party congress in fall 2022. Xi is attempting to stay in power beyond the ten-year limit that was in place when he took office. On one hand he is presenting a slate of socioeconomic reforms – dubbed “common prosperity” – to curry popular favor. This agenda represents a tilt from capitalism toward socialism within the context of the Communist Party’s overarching idea of socialism with Chinese characteristics. On the other hand, Xi is cracking down on the private sector – Big Tech, property developers – which theoretically provides the base of power for any political opposition. The crackdowns have caused Chinese equities to collapse relative to global and have reaffirmed the long trend of underperformance of cyclical sectors relative to defensives within Chinese investable shares (Chart 5, top panel). Chart 4China Threatens To Spoil The Party
China Threatens To Spoil The Party
China Threatens To Spoil The Party
In terms of financial distress, so far only high-yield corporate bonds have seen spreads explode, not investment grade. But current policies force property developers to liquidate their holdings, pay off debts, and raise cash while forcing banks to cut bank on loans to property developers and homebuyers. (Not to mention curbs on carbon emissions and other policies squeezing industrial and other sectors.) Chart 5Beijing Could Easily Trigger Global Market Riot
Beijing Could Easily Trigger Global Market Riot
Beijing Could Easily Trigger Global Market Riot
If these policies are not relaxed then property developers will continue to struggle, property prices will fall, credit tightening will intensify, and local governments will be starved of revenue and forced to cut back on their own spending. Yet the government’s signals of policy easing are so far gradual and behind the curve. If policy is not relaxed, then onshore equities will sell off (as well as offshore) and credit spreads will widen more generally (Chart 5, bottom panel). Broad financial turmoil cannot be ruled out in the fourth quarter. Ultimately, however, China will be forced to do whatever it takes to try to secure the post-pandemic recovery. Otherwise it will instigate a socioeconomic crisis ahead of the all-important political reshuffle in fall 2022. That would be the opposite of what Xi Jinping needs as he tries to consolidate power. Chinese households have stored their wealth, built up over decades of economic success, in the housing sector (Chart 6). Economic instability could translate to political instability. Chart 6Beijing Will Provide Bailouts And Stimulus … Or Face Political Instability
Fourth Quarter Outlook: So Much For Normalcy!
Fourth Quarter Outlook: So Much For Normalcy!
Investors often ask how the government can ease policy if doing so will further inflate housing prices, which hurts the middle class and is the opposite of the common prosperity agenda. High housing prices are the biggest of the three “mountains” that are said to be crushing the common folks and weighing on Chinese birthrates and fertility (the other two are high education and medical costs). The answer is that while policymakers want to cap housing prices and encourage fertility, they must prevent a general collapse in prices and economic and financial crisis. There is no evidence that suppressing housing prices will increase fertility or birthrates – if anything, falling fertility is hard to reverse and goes hand in hand with falling prices. Rather, evidence from the US, Japan, South Korea, Thailand, and other countries shows that a bursting property bubble certainly does not increase fertility or birthrates (Charts 7A and 7B). Chart 7AEconomic Crash Not A Recipe For Higher Fertility
Economic Crash Not A Recipe For Higher Fertility
Economic Crash Not A Recipe For Higher Fertility
Chart 7BEconomic Crash Not A Recipe For Higher Fertility
Economic Crash Not A Recipe For Higher Fertility
Economic Crash Not A Recipe For Higher Fertility
Bringing it all together, investors should not play down negative news and financial instability emerging from China. There are no checks and balances on autocrats. Our China Investment Strategy has a high conviction view that policy stimulus is not forthcoming and regulatory curbs will not be eased. The implication is that China’s government could make major policy mistakes and trigger financial instability in the near term before changing its mind to try to preserve overall stability. At that point it could be too late. Will Countries Add More Stimulus? Yes. Chart 8Global Monetary Policy Challenges
Global Monetary Policy Challenges
Global Monetary Policy Challenges
With China’s stability in question, investors face a range of crosswinds. Central banks are struggling with a surge in inflation driven by stimulus-fueled demand and supply bottlenecks. The global output gap is still large but rapid economic normalization will push inflation up further if kinks are not removed (Chart 8). A moderating factor in this regard is that budget deficits are contracting in 2022 and coming years – fiscal policy will shift from thrust to drag (Chart 9). However, the fiscal drag is probably overstated as governments are also likely to increase deficit spending on the margin. The US is certainly likely to do so. But before considering US fiscal policy we must address the immediate question: whether the US will default on national debt. Treasury Secretary Janet Yellen has designated October 18 as the “X-date” at which the Treasury will run out of extraordinary measures to make debt payments if Congress does not raise the statutory debt ceiling. There is presumably a few weeks of leeway after this date but markets will grow very jittery and credit rating agencies will start to downgrade the United States, as Standard & Poor’s did in 2011. Chart 9Global Fiscal Drag Rears Its Head
Fourth Quarter Outlook: So Much For Normalcy!
Fourth Quarter Outlook: So Much For Normalcy!
Democrats have full control of Congress and can therefore suspend the debt ceiling through a party-line vote. They can do this through regular legislation, if Republicans avoid raising a filibuster, though that requires Democrats to make concessions in a back-room deal with Republicans. Or they can compromise the filibuster, though that requires convincing moderate Democrats who support the filibuster that they need to make an exception to preserve the faith and credit of the US. Or they can raise the debt ceiling via budget reconciliation, though this would run up against the time limit and so far Senate Leader Chuck Schumer claims to refuse this option. While the odds of a debt default are not zero, the Democrats have the power to avoid it and will also suffer the most in public opinion if it occurs. Therefore the debt limit will likely be suspended at the last minute in late October or early November. Investors should expect volatility but should view it as short-term noise and buy on dips – i.e. the opposite of any volatility that stems from Chinese financial turmoil. Congress is likely to pass Biden’s $550 billion bipartisan infrastructure bill (80% subjective odds). It is also likely to pass a partisan social welfare reconciliation bill over the coming months (65% subjective odds). The full impact on the deficit of both bills should range from $1.1-$1.6 trillion over ten years. This will not be enough to prevent the fiscal drag in 2022 but it will provide for a gradually expanding budget deficit over the course of the decade (Chart 10). Chart 10New Fiscal Stimulus Will Reduce Fiscal Drag On Margin
Fourth Quarter Outlook: So Much For Normalcy!
Fourth Quarter Outlook: So Much For Normalcy!
The reconciliation package will be watered down and late in coming. Investors will likely buy the rumor and sell the news. If reconciliation fails, markets may cheer, as it will also include tax hikes and pose the risk of pushing up inflation and hastening Fed rate hikes. Elsewhere governments are also providing “soft budgets.” The German election results confirmed our forecast that the government will change to left-wing leadership that will be able to boost domestic investment but not raise taxes. This is due to the inclusion of at least one right-leaning party, most likely the Free Democrats. Fiscal deficits will go up. Germany has a national policy consensus on most matters of importance and thus can pass some legislation. But the new coalition will be ideologically split and barely have a majority in the Bundestag, so controversial or sweeping legislation will be unlikely. This outcome is positive for German markets and the euro. Looking at popular opinion toward western leaders and their ruling coalitions since the outbreak of COVID-19, the takeaway is that the Europeans have the strongest political capital (Chart 11). Governments are either supported by leadership changes (Italy, Germany) or likely to be supported in upcoming elections (France). The UK does not face an election until 2024, unless an early election is called. This seems doubtful to us given the government’s strong majority. Chart 11DM Shifts In Popular Opinion Since COVID-19
Fourth Quarter Outlook: So Much For Normalcy!
Fourth Quarter Outlook: So Much For Normalcy!
Chart 12EM Shifts In Popular Opinion Since COVID-19
Fourth Quarter Outlook: So Much For Normalcy!
Fourth Quarter Outlook: So Much For Normalcy!
After all, Canada called an early election and it became a much riskier affair than the government intended and did not increase the prime minister’s political capital. Spain is far more likely to see tumult and an early election. Japan’s election in November will not bring any surprises: as we have written, Kishidanomics will be Abenomics by a different name. The implication is that after November, most developed markets will be politically recapitalized and fiscal policy will continue to be accommodative across the board. In emerging markets, popular opinion has been much more damning for leaders, calling attention to our expectation that the aftershocks of the global pandemic will come in the form of social and political instability (Chart 12). Russia has a record of pursuing more aggressive foreign policy to distract from its domestic ills. The next conflict could already be emerging, with allegations that it is deliberately pushing up natural gas prices in Europe to try to force the new German government to certify and operate the NordStream II pipeline. The Americans are already brandishing new sanctions. Chart 13Stary Neutral Dollar For Now
Stary Neutral Dollar For Now
Stary Neutral Dollar For Now
Brazil and Turkey both face extreme social instability in the lead-up to elections in 2022 and 2023. India has been the chief beneficiary of today’s climate but it also faces an increase in political and geopolitical risk due to looming state elections and its increasing alliance with the West against China. Putting it all together, the US is likely to stimulate further and pump up inflation expectations. Europe is politically stable but Russia disrupt it. Other emerging markets, including China, will struggle with economic, political, and social instability. This is an environment in which the US dollar will remain relatively firm and the renminbi will depreciate – with negative effects on EM currencies more broadly (Chart 13). Annual Views On Track Our three key views for 2021 are so far on track but face major tests in the fourth quarter: 1. China’s internal and external headwinds: If China overtightens policy and short-circuits the global economic recovery, then its domestic political risks will have exceeded even our own pessimistic expectations. We expect China to ease fiscal policy and do at least the minimum to secure the recovery. Investors should be neutral on risky assets until China provides clearer signals that it will not overtighten policy (Chart 14). 2. Iran is the crux of the US pivot to Asia: A crisis over Iran is imminent since Biden did not restore the 2015 nuclear deal promptly upon taking office. Any disruption of Middle Eastern energy flows will add to global supply bottlenecks and price pressures. Brent crude oil prices will see upside risks relative both to BCA forecasts and the forward curve (Chart 15). Chart 14Wait For China To Relax Policy
Wait For China To Relax Policy
Wait For China To Relax Policy
Chart 15Expect A Near-Term Crisis Over Iran
Expect A Near-Term Crisis Over Iran
Expect A Near-Term Crisis Over Iran
The reason is that Iran is expected to reach nuclear “breakout” capability by November or December (i.e. obtain enough highly enriched uranium to make a nuclear device). The Biden administration is focused on diplomacy and so far hesitant to impose a credible threat of war to halt Iranian advances. Israel’s new government has belatedly admitted that it would be a good thing for the US and Iran to rejoin the 2015 nuclear deal – if not, it supports a global coalition to impose sanctions, and finally a military option as a last resort. Biden will struggle to put together a global coalition as effective as Obama did, given worse relations with China and Russia. The US and Israel are highly likely to continue using sabotage and cyberattacks to slow Iran’s nuclear and missile progress. Chart 16Pivot To Asia Runs Through Iran
Pivot To Asia Runs Through Iran
Pivot To Asia Runs Through Iran
Chart 17Europe: A Post-Trump Winner? Depends On China
Europe: A Post-Trump Winner? Depends On China
Europe: A Post-Trump Winner? Depends On China
Thus the Iranians are likely to reach breakout capability at which point a crisis could erupt. The market is not priced for the next Middle East crisis (Chart 16). Incidentally, any additional foreign policy humiliation on top of Afghanistan could undermine the Biden administration more broadly, in both domestic and foreign policy. 3. Europe benefits most from a post-pandemic, post-Trump world: Europe is a cyclical economy and is also relatively politically stable in a world of structurally rising policy uncertainty and geopolitical risk. We thought it stood to benefit most from the global recovery and the passing of the Trump administration. However, China’s policy tightening has undermined European assets and will continue to do so. Therefore this view is largely contingent on the first view (Chart 17). Investment Takeaways Strategically we maintain a diversified portfolio of trades based on critical geopolitical themes: long gold, short China/Taiwan, long developed markets, long aerospace/defense, long rare earths, and long value over growth stocks. Taiwanese equities have continued to outperform despite bubbling geopolitical tensions. We maintain our view that Taiwan is overpriced and vulnerable to long-term semiconductor diversification as well as US-China conflict. Our rare earths basket, which focuses on miners outside China, has been volatile and stands to suffer if China’s growth decelerates. But global industrial, energy, and defense policy will continue to support rare earths and metals prices. Russian tensions with the West have been manageable over the course of the year and emerging European stocks have outperformed developed European peers, contrary to our recommendation. However, fundamental conflicts remain unresolved and the dispute over the recently completed Nord Stream II pipeline to Germany could still deal negative surprises. We will reassess this recommendation in a future report. We are booking gains on the following trades: long Mexico (8%), long aerospace and defense in absolute terms (4%), long EU industrials relative to global (4%), and long Italian BTPs relative to bunds (0.2%). Matt Gertken Vice President Geopolitical Strategy mattg@bcaresearch.com Appendix: GeoRisk Indicator China
China: GeoRisk Indicator
China: GeoRisk Indicator
Russia
Russia: GeoRisk Indicator
Russia: GeoRisk Indicator
United Kingdom
UK: GeoRisk Indicator
UK: GeoRisk Indicator
Germany
Germany: GeoRisk Indicator
Germany: GeoRisk Indicator
France
France: GeoRisk Indicator
France: GeoRisk Indicator
Italy
Italy: GeoRisk Indicator
Italy: GeoRisk Indicator
Canada
Canada: GeoRisk Indicator
Canada: GeoRisk Indicator
Spain
Spain: GeoRisk Indicator
Spain: GeoRisk Indicator
Taiwan
Taiwan: GeoRisk Indicator
Taiwan: GeoRisk Indicator
Korea
Korea: GeoRisk Indicator
Korea: GeoRisk Indicator
Turkey
Turkey: GeoRisk Indicator
Turkey: GeoRisk Indicator
Brazil
Brazil: GeoRisk Indicator
Brazil: GeoRisk Indicator
Australia
Australia: GeoRisk Indicator
Australia: GeoRisk Indicator
Appendix: Geopolitical Calendar
Highlights Monetary Policy: It’s all but certain that tapering will begin next month and conclude by the middle of next year, but the FOMC is currently split right down the middle on whether it will be appropriate to lift rates in H2 2022. We present five factors to track to decide when the Fed will hike rates. Yield Curve: A bear-flattening of the nominal yield curve remains the most likely scenario for the next 6-12 months. Maintain a position short the 5-year bullet versus a duration-matched 2/10 barbell. TIPS: Investors should enter 2/10 steepeners on the inflation compensation curve and/or 2/10 flatteners on the real (TIPS) curve. The 2-year real yield, in particular, has a lot of upside during the next 6-12 months. EM Bonds: US bond investors should shift some allocation out of expensive US investment grade corporate bonds and into USD-denominated investment grade EM Sovereigns and Corporates where valuation is more compelling. Feature This past week was quite eventful for US bond investors. First, the Fed presented its September update on Wednesday, offering some hints about the timing and pace of asset purchase tapering alongside its updated economic and interest rate forecasts. Then, bonds sold off sharply on Thursday, Friday and Monday with the 10-year Treasury yield rising all the way to 1.49%. The first section of this week’s report looks at what we learned from last week’s FOMC meeting and opines on some monetary policy questions that remain unanswered. The second section updates our views on portfolio duration, the yield curve and TIPS in light of last week’s large market moves. Finally, we conclude with an update on the outlook for USD-denominated Emerging Market bonds. Powell Answers Some Small Questions, Avoids The Big One The Small Questions The start date for asset purchase tapering is the first small question that the Fed answered last week. A new sentence was added to the post-meeting statement saying that “a moderation in the pace of asset purchases may soon be warranted” and, in his press conference, Chair Powell clarified that the purpose of the new language is “to put notice out there that [tapering] could come as soon as the next meeting”. After this statement from the Fed, we expect asset purchase tapering to be announced at the next FOMC meeting on November 3rd. A delay until December is possible if September’s employment report is a massive disappointment, but the bar for delaying tapering beyond November appears high. Chair Powell also shed some light on a second small question related to the Fed’s balance sheet. Specifically, the pace of asset purchase tapering. In his press conference the Chair said that “participants generally view that, so long as the recovery remains on track, a gradual tapering process that concludes around the middle of next year is likely to be appropriate.” The information about the pace of tapering is slightly more interesting than the start date, if only because Fed policymakers have expressed a desire for net purchases to reach zero before the first interest rate increase. The fact that the Fed is planning to reach net zero purchases by the middle of next year suggests that it wants to leave the door open for a possible rate hike in the second half of 2022. This message was confirmed by the Fed’s updated interest rate projections (Chart 1). The projections revealed an even split (9 vs. 9) on the Committee between those that expect at least one 25 basis point rate increase before the end of 2022 and those that do not expect to lift rates next year. It’s also notable that, out of the 9 participants that don’t expect a rate hike in 2022, 8 anticipate lifting rates in 2023. Chart 1Rate Expectations
Rate Expectations
Rate Expectations
Of course, as Chair Powell often points out, the Fed’s interest rate projections are contingent on the future state of the economy and will almost certainly be revised as the outlook evolves. What’s more important from a forecasting perspective is knowing how the Fed will react to different economic conditions. The Big Question With that in mind, we know that the Fed has promised not to lift rates until the labor market reaches “maximum employment”. However, as we noted in a recent report, the Fed hasn’t provided much detail on what “maximum employment” actually means.1 Powell’s comments last week didn’t add much clarity, but we can hunt for clues in the Summary of Economic Projections (SEP). In the SEP, we first notice that 13 FOMC participants expect the unemployment rate to be 3.8% - 3.9% or lower by the end of 2022 (Chart 2A). It is logical to assume that this group includes the 9 participants who expect to lift rates in 2022 and 4 additional ones. We also observe that 17 out of 18 participants anticipate an unemployment rate of 3.8% - 3.9% or lower by the end of 2023 (Chart 2B), exactly matching the number of participants who expect to lift rates by then. We can therefore infer that the Fed views an unemployment rate of roughly 3.8% as consistent with “maximum employment”. That is, FOMC participants tend to have rate hikes penciled into their forecasts once the unemployment rate is below 3.8%. Chart 2AFOMC 2022 Unemployment Rate Projection Distribution
Damage Assessment
Damage Assessment
Chart 2BFOMC 2023 Unemployment Rate Projection Distribution
Damage Assessment
Damage Assessment
The SEP’s inflation forecasts are less illuminating than the unemployment ones. All but 4 participants expect core PCE inflation to be above the Fed’s 2% target at the end of 2022 (Chart 3A) and no FOMC participant is forecasting below-2% core PCE at the end of 2023 (Chart 3B).2 The most we can take away from these forecasts is that 14 FOMC participants expect inflation to be above target in 2022, but five of those participants don’t see the labor market as being tight enough to lift rates by then. Chart 3AFOMC 2022 Core PCE Inflation Rate Projection Distribution
Damage Assessment
Damage Assessment
Chart 3BFOMC 2023 Core PCE Inflation Rate Projection Distribution
Damage Assessment
Damage Assessment
The revelation that FOMC participants view a 3.8% unemployment rate as consistent with “maximum employment” is illuminating, but it doesn’t tell the entire story. We don’t know, for example, what assumptions about labor force participation the different Fed officials are using. Our sense is that the following five criteria will ultimately determine when the Fed starts to lift interest rates: An unemployment rate in the neighborhood of 3.8%. Prime-age (25-54) labor force participation close to its pre-pandemic level (Chart 4, top panel). Accelerating wage growth (Chart 4, bottom 2 panels). Long-dated inflation expectations at or above target levels (Chart 5, top 2 panels). Non-transitory inflation at or above target levels (Chart 5, bottom panel). Bottom Line: The FOMC is currently split right down the middle on whether it will be appropriate to lift rates in 2022, but these forecasts aren’t set in stone and next year’s economic data – particularly the five factors listed above – will determine which group is correct. Chart 4Part Rate & Wage Growth
Part Rate & Wage Growth
Part Rate & Wage Growth
Chart 5Inflation & Inflation Expectations
Inflation & Inflation Expectations
Inflation & Inflation Expectations
Our own view is that the labor market will be sufficiently tight for the Fed to deliver its first rate hike in December 2022, and that rate hikes will proceed more quickly than what is currently priced in the yield curve. US bond investors should maintain below-benchmark portfolio duration. The Fallout In Bond Markets Bonds sold off sharply last Thursday and again yesterday morning. At the time of publication, the 30-year Treasury yield had risen from 1.81% on Wednesday to 2.02% (Chart 6). The 10-year Treasury yield had risen from 1.30% to 1.49% (Chart 6, panel 2). The 5-year yield is up to 0.98% from 0.85% on Wednesday (Chart 6, panel 3), and the 2-year yield is up to 0.28% from 0.24% (Chart 6, panel 4). The yield curve has also steepened since Wednesday, though the 2/10 slope remains well below its March peak (Chart 7). The trend during the past few months has been one of curve steepening out to the 5-year maturity point (Chart 7, panel 2) and flattening beyond that point (Chart 7, bottom 2 panels). Recent market action has led to some steepening beyond the 5-year maturity, but so far that steepening is minor compared to the flattening move we’ve witnessed since the spring. Chart 6Treasury Yield Trends
Treasury Yield Trends
Treasury Yield Trends
Chart 7Treasury Curve Trends
Treasury Curve Trends
Treasury Curve Trends
Nominal Curve We have been recommending a position short the 5-year bullet and long a duration-matched barbell consisting of the 2-year and 10-year notes, and we think this trade will continue to outperform. First, the 5-year/5-year forward Treasury yield is back above 2%, consistent with median estimates of the long-run neutral fed funds rate from the New York Fed’s Surveys of Market Participants (2%) and Primary Dealers (2.25%) (Chart 6, bottom panel). We think it will be difficult for the 5-year/5-year forward yield to rise much above these levels, which makes curve flattening more likely than steepening going forward.3 Second, we updated our work on yield curve scenarios to incorporate recent market action and some new information gleaned from last week’s SEP. In this analysis we estimate fair value levels for different parts of the yield curve as of the end of 2022 based on a scenario for the path of the fed funds rate. For example, if we assume that Fed liftoff occurs in December 2022 and rate hikes proceed at a pace of 75 bps per year (the median pace in the SEP) until the fed funds rate levels-off at 2.08% (consistent with a 2%-2.25% range for the long-run neutral fed funds rate), we calculate that the 2-year yield has 74 bps of upside between now and the end of 2022. This is slightly more than the 65 bps of upside in the 5-year yield and much more than the 37 bps of upside in the 10-year yield (Table 1). Comparing this expected change to what is already discounted in the forward curve, we see that both the 2-year and 10-year yields are expected to exceed their forwards by 6 bps. The 5-year yield is expected to exceed its forward by 16 bps. Table 1Treasury Curve Scenario Analysis
Damage Assessment
Damage Assessment
To us, the message is clear. We want to remain short the 5-year note versus a duration-matched 2/10 barbell. Real & Inflation Curves Chart 8Real & Inflation Curves
Real & Inflation Curves
Real & Inflation Curves
The increase in the 10-year nominal yield since last Wednesday was roughly evenly split between the real and inflation compensation components. Interestingly, inflation drove a greater proportion of the increase at the front-end of the curve, and the 2-year real yield actually fell. We maintain a neutral recommendation on TIPS versus nominal Treasuries, but this week we recommend taking advantage of recent market action by implementing some curve trades across the real and inflation curves. Specifically, we note that the cost of short-maturity inflation compensation remains well above the cost of long-maturity inflation compensation (Chart 8). Going forward, the cost of front-end inflation compensation will fall as inflation moderates from its current extremely high level. Meanwhile, the cost of long-maturity inflation compensation will remain sticky near the Fed’s target levels. This will lead to a steepening of the inflation curve (Chart 8, panel 2). The combination of a steeper inflation curve and a flatter nominal curve will lead to a much flatter real yield curve (Chart 8, bottom 2 panels). The 2-year real yield, in particular, has a lot of upside if inflation moderates, as we expect, and the 2-year nominal yield rises in line with the projections shown in Table 1. Bottom Line: Investors should remain short the 5-year bullet versus a duration-matched 2/10 barbell on the nominal Treasury curve. Investors should also enter 2/10 steepeners on the inflation compensation curve and/or 2/10 flatteners on the real (TIPS) curve. A Quick Update On Emerging Market Bonds The collapse of Chinese real estate behemoth Evergrande dominated headlines for most of the past week, though so far there has been little contagion into USD-denominated credit markets. Unsurprisingly, the spread on Chinese corporate and quasi-sovereign bonds has widened, and there has been some passthrough into both the High-Yield EM USD Corporate & Quasi-Sovereign Index and the High-Yield EM USD Sovereign Index (Chart 9). However, investment grade EM credit spreads have been relatively unaffected by the turmoil, as have US corporate bond spreads (both IG and HY) (Chart 9, bottom 2 panels). While the Evergrande drama – and weakening Chinese economic growth in general – could weigh on USD-denominated EM bond performance in the near-term, we see an excellent buying opportunity in investment grade EM bonds on a 6-12 month horizon. Investment grade EM Sovereigns outperformed credit rating and duration-matched US corporate bonds in the early months of the recovery but have lagged during the past few months (Chart 10). The same is true for the investment grade EM Corporate and Quasi-Sovereign index (Chart 10, panel 3). This is not to say that EM bond performance has been poor – the EM Sovereign index is still up 97 bps versus duration-matched Treasuries on the year – it has simply failed to keep pace with the stellar performance of US corporate bonds. Chart 9No Contagion
No Contagion
No Contagion
Chart 10EM Bonds Versus US Corporates
EM Bonds Versus US Corporates
EM Bonds Versus US Corporates
But that recent stellar performance of US investment grade corporate bonds has left spreads in the sector near historically tight levels. In last week’s report we ran some scenarios for US investment grade corporate bond returns during the next 12 months and concluded that excess returns versus Treasuries are probably capped at 85 bps.4 This makes the current spread advantage in EM Sovereigns (Chart 10, panel 2) and EM Corporates & Quasi-Sovereigns (Chart 10, bottom panel) very compelling. This will be especially true if Emerging Market growth accelerates in 2022 on the back of increased Chinese stimulus and a COVID vaccination campaign that is already picking up steam.5 Bottom Line: US bond investors should shift some allocation out of expensive US investment grade corporate bonds and into USD-denominated investment grade EM Sovereigns and Corporates where valuation is more compelling. Ryan Swift US Bond Strategist rswift@bcaresearch.com Footnotes 1 Please see US Bond Strategy Weekly Report, “2022 Will Be All About Inflation”, dated September 14, 2021. 2 Chart 3B shows that 4 participants expect core PCE inflation of 1.9%-2.0% in 2023, but the SEP also reveals that the minimum forecast for core PCE in 2023 is 2.0%. In other words, all 4 participants in that range are forecasting 2.0%, not 1.9%. 3 For more details on the relationship between our 5-year/5-year forward yield target and the yield curve please see US Bond Strategy Weekly Report, “A Bump On The Road To Recovery”, dated July 27, 2021. 4 Please see US Bond Strategy Weekly Report, “Expected Returns In Corporate Bonds”, dated September 21, 2021. 5 For a recent debate about the outlook for Emerging Market assets please see last Friday’s Webcast: https://www.bcaresearch.com/webcasts/detail/458 Recommended Portfolio Specification Other Recommendations Treasury Index Returns Spread Product Returns
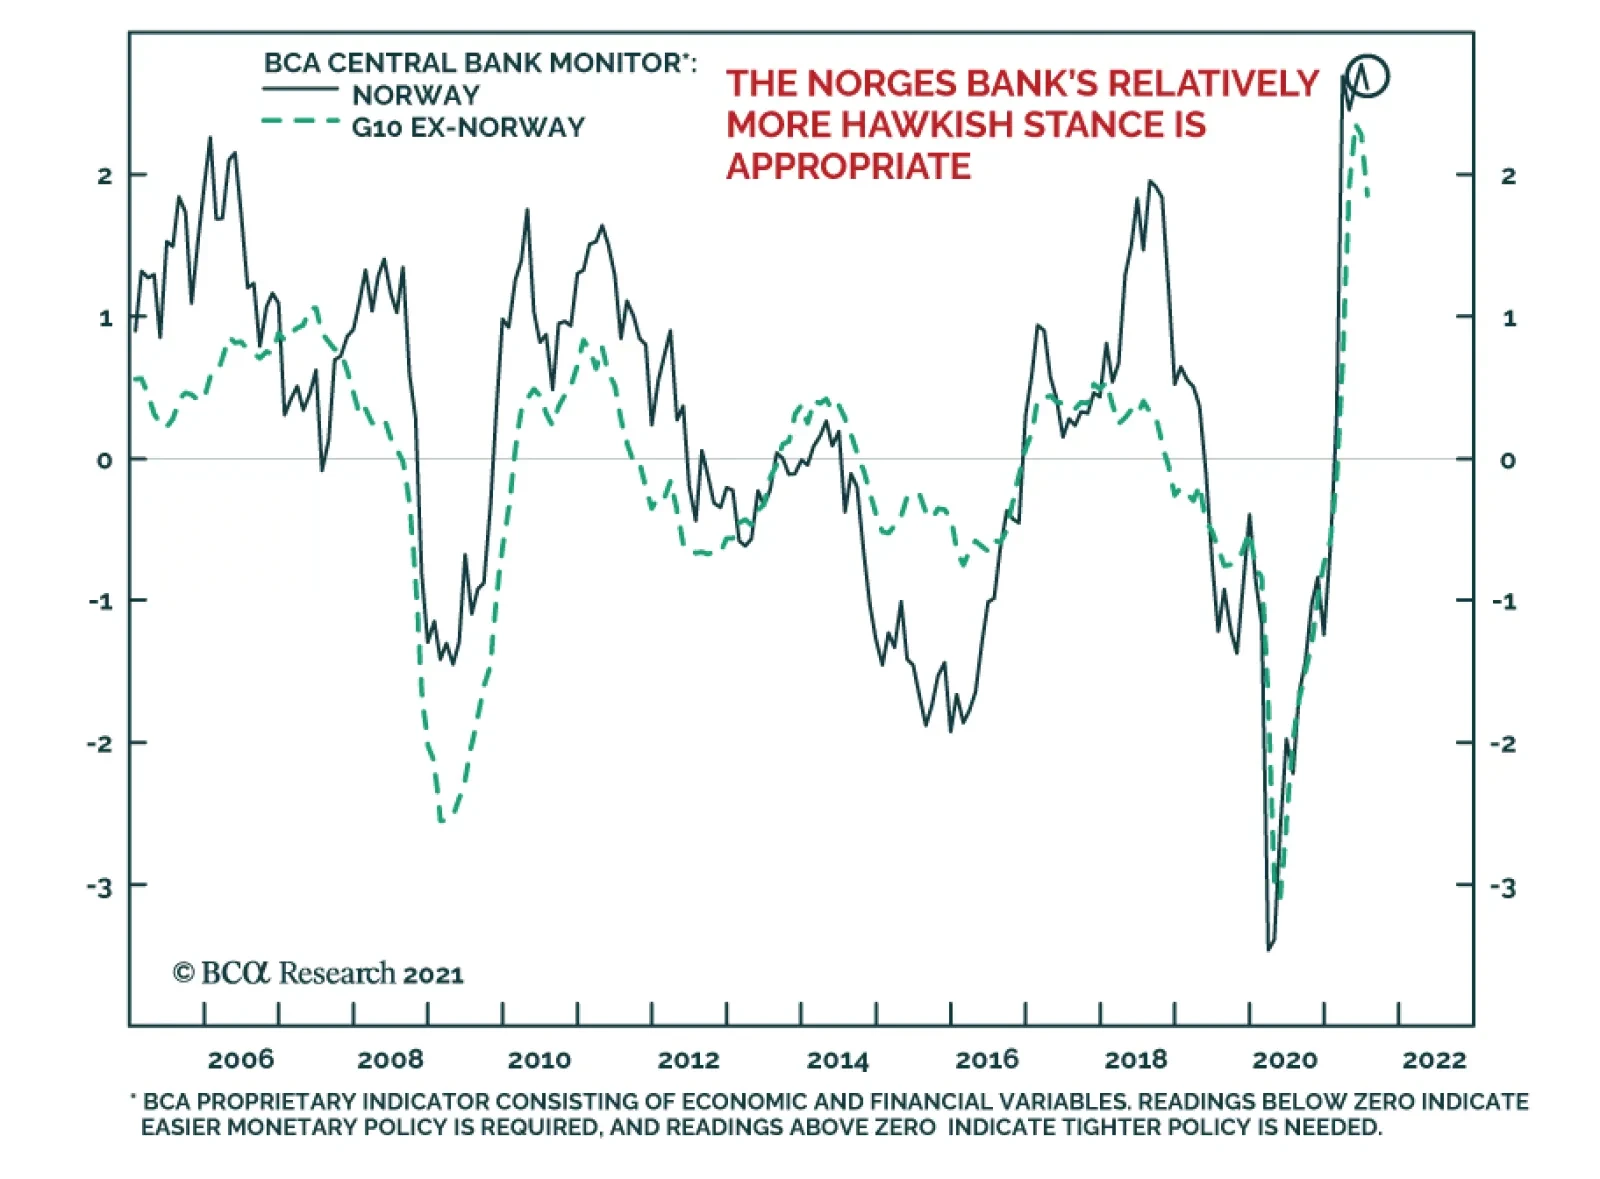
As expected, the Norges Bank delivered its first rate hike on Thursday, bringing its benchmark policy rate to 0.25%. It is the first developed market central bank to raise rates in the post-COVID-19 crisis period. The central bank statement revealed that…
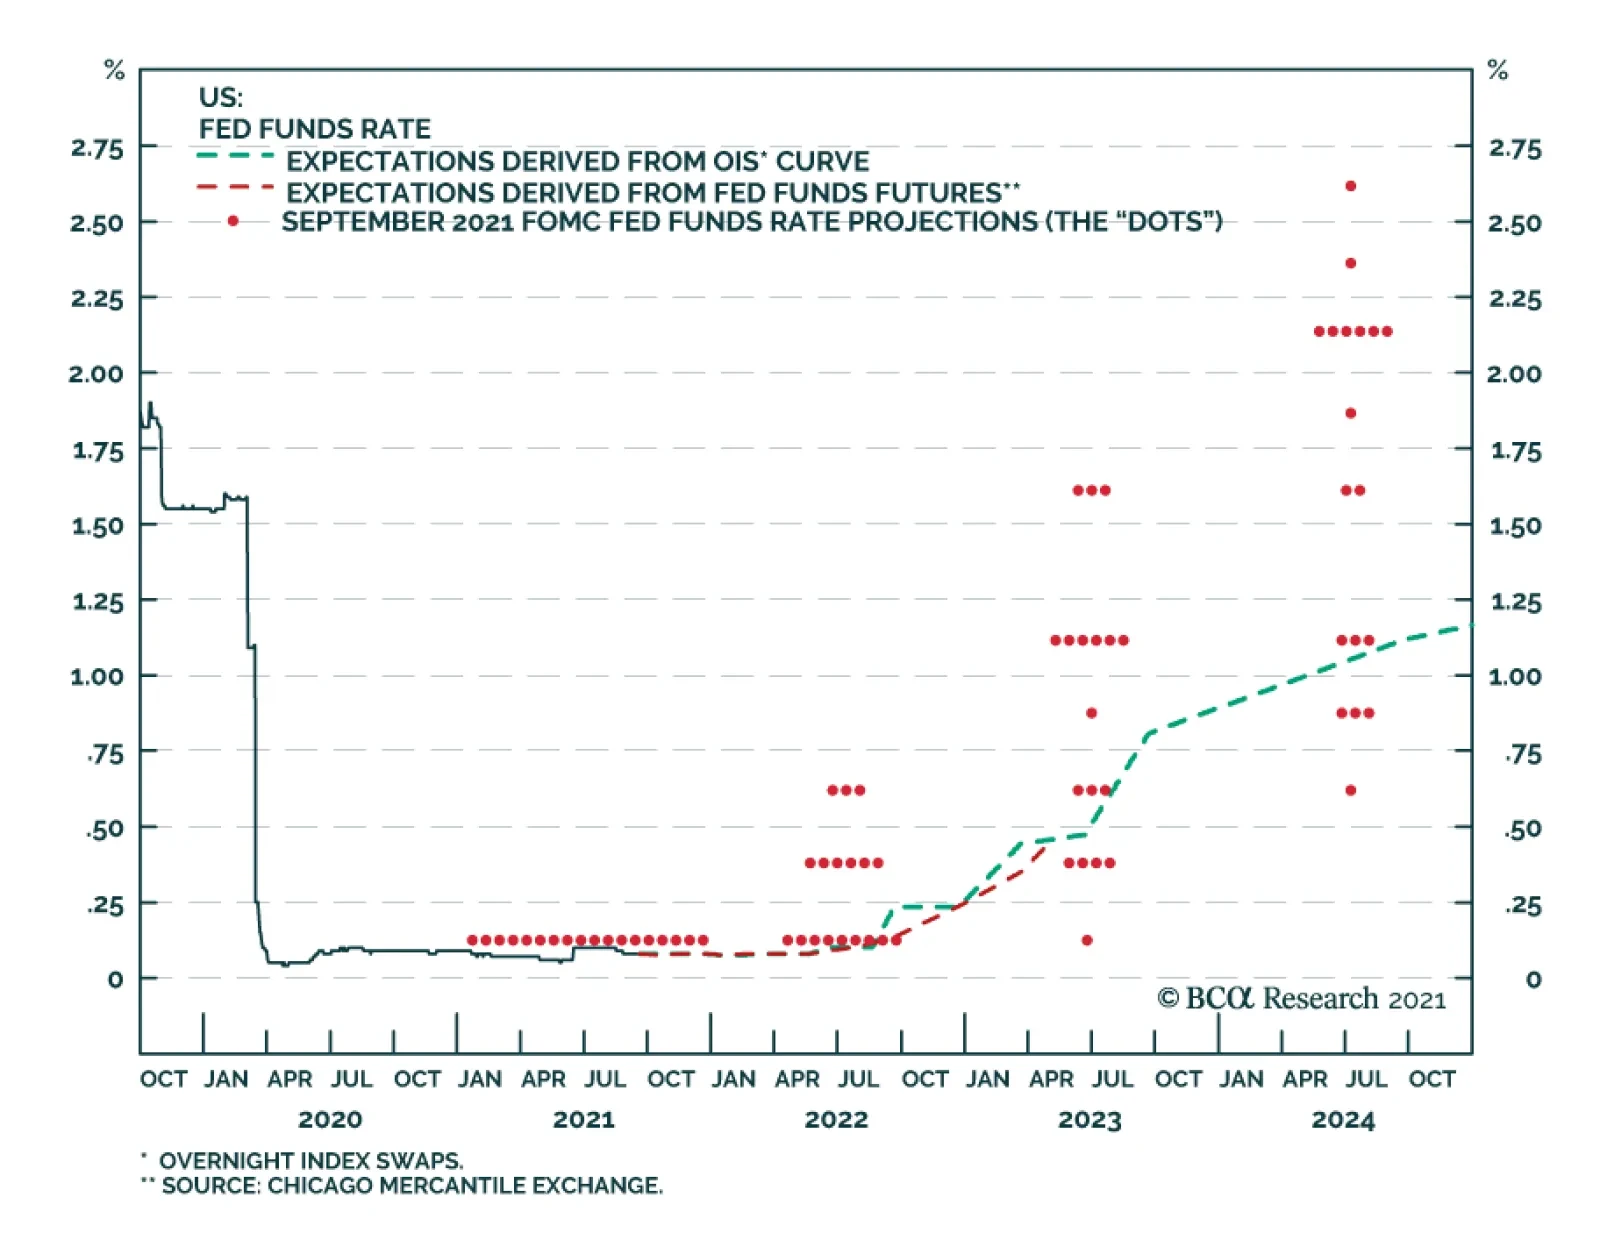
As expected, the FOMC did not make any changes to its policy rate or pace of asset purchases at its meeting on Wednesday. However, the Fed sent a strong signal that tapering is on the horizon. The statement indicated that “if progress continues broadly as…
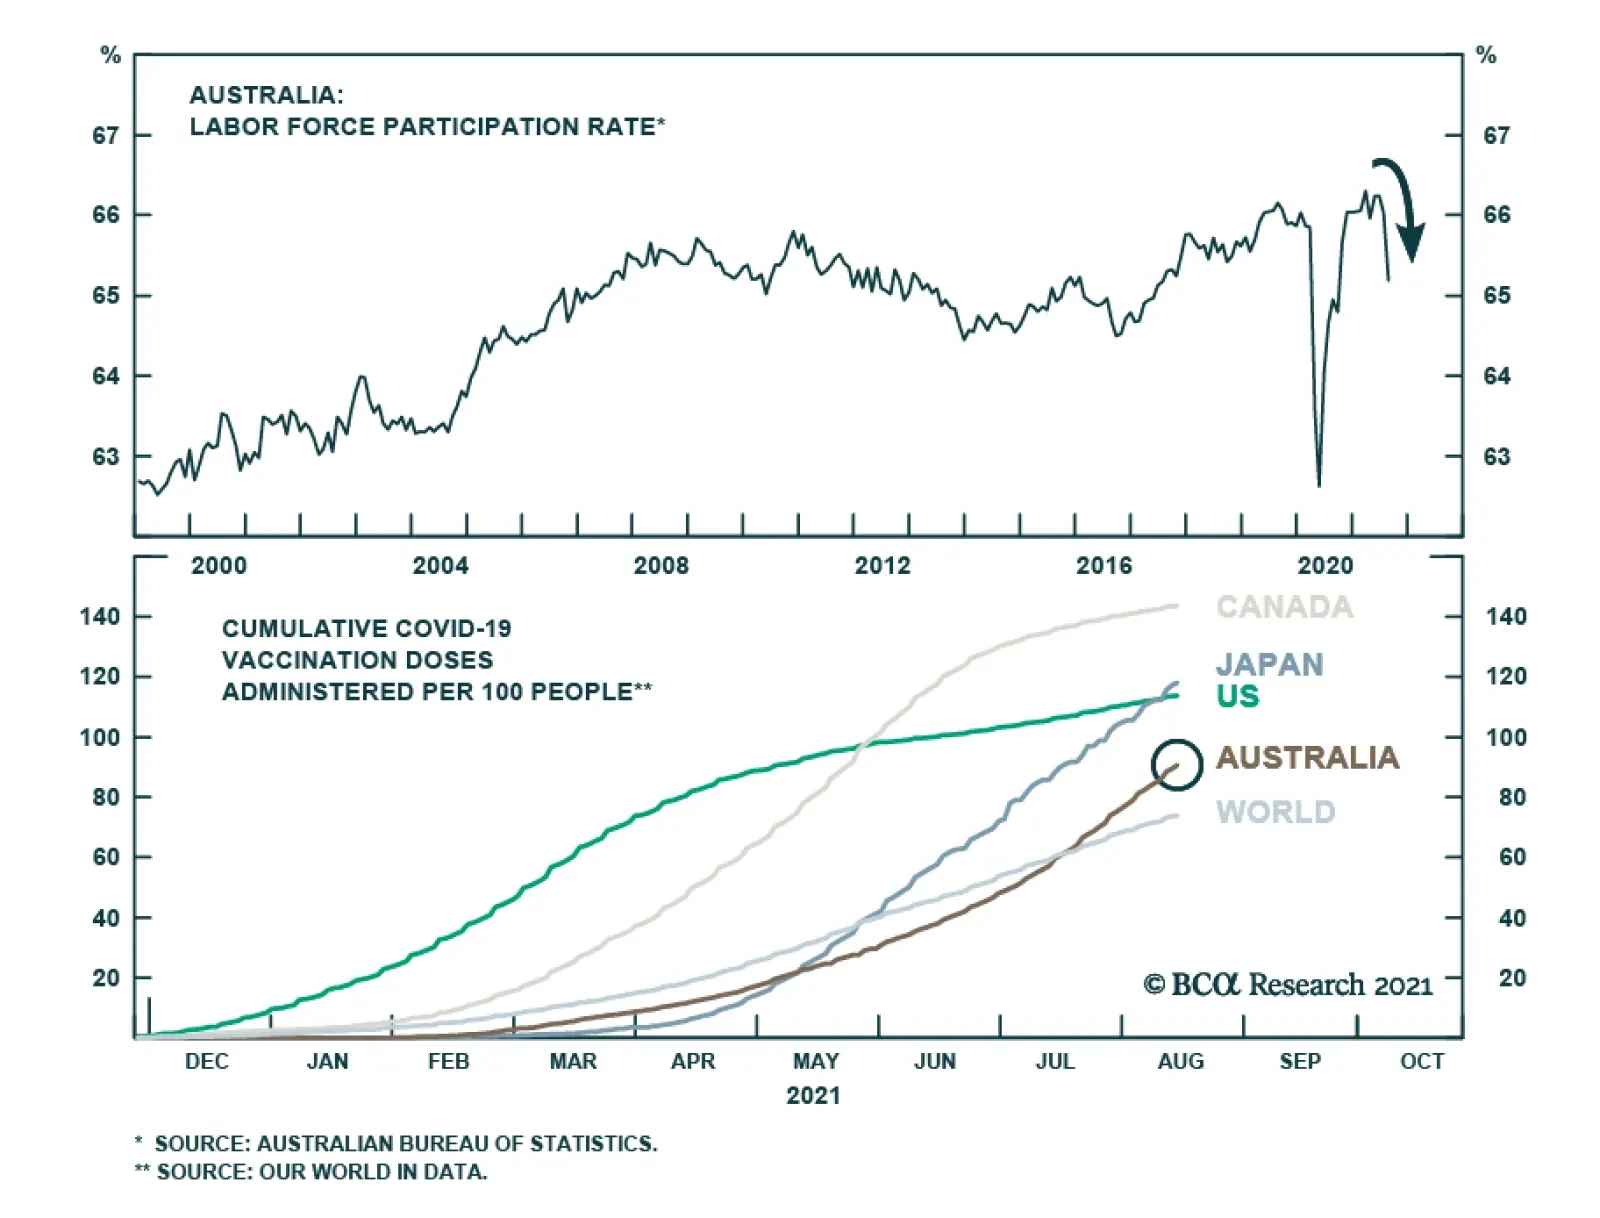
At first blush, Australia’s labor market recovery appears to have accelerated in August. The unemployment rate fell to a 13-year low of 4.5% versus expectations it would rise 0.4 percentage points to 5.0%. However, the lower unemployment rate reflects a…
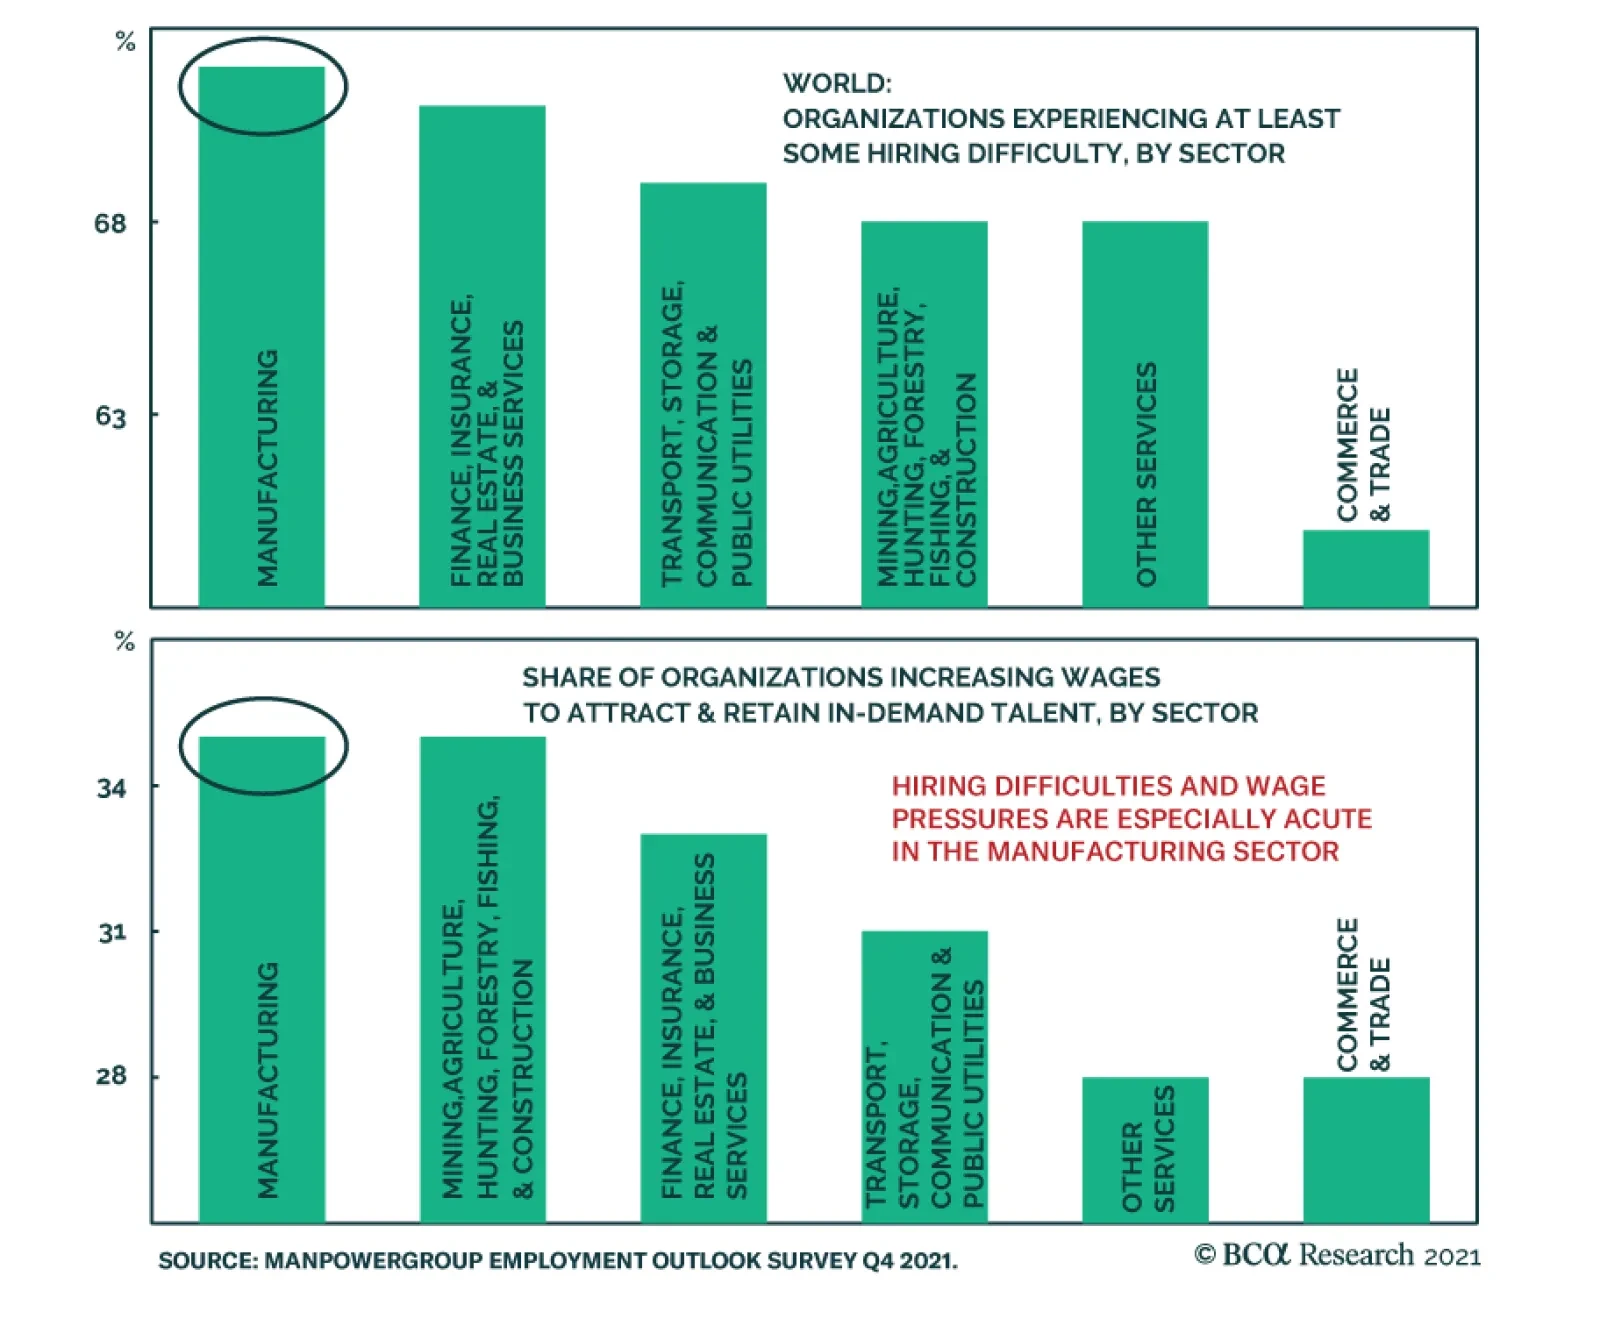
The results of ManpowerGroup's Q4 2021 global employment outlook survey - released earlier this week - provide further evidence that labor markets are tight globally. The share of global employers reporting difficulty filling roles rose to a 15-year high…
Highlights Fed: The Fed will be forced to clarify its definition of “maximum employment” in 2022, and the path of inflation will ultimately dictate how far the Fed tries to push the labor market. We expect Fed rate hikes to start in December 2022 and that the pace of hikes will proceed more quickly than is currently priced in the yield curve. Duration: Investors should maintain below-benchmark portfolio duration in anticipation of a rate hike cycle starting in December 2022. Yield Curve: Investors should position in Treasury curve flatteners. Specifically, we recommend shorting the 5-year Treasury note versus a duration-matched barbell consisting of the 2-year and 10-year notes. Feature Chart 1Bonds De-Coupled From Inflation In 2021
Bonds De-Coupled From Inflation In 2021
Bonds De-Coupled From Inflation In 2021
One of our themes this year is that US bond investors should pay more attention to the employment data than the inflation data.1 This is because the Fed has successfully convinced markets that it will not lift rates until “maximum employment” is achieved, even if inflation is strong.2 This story has played out during the past few months as bond yields have remained low despite surging prices (Chart 1). Our view is that the muted reaction in bonds is due to the widespread belief that the labor market remains far from “maximum employment” and that rate hikes are therefore a long way off. In this environment, only surprisingly strong employment prints can upset the market’s narrative and send bond yields higher. This playbook for the bond market will continue to function for the next few months. Strong employment data will pull bond yields higher and disappointing employment data will push them down. Inflation prints will be largely irrelevant for the market. But this will change next year. In fact, we see the employment data taking a back seat to the inflation data in the minds of bond investors in 2022. A More Explicit Definition of “Maximum Employment” Must Emerge In 2022 Almost everyone agrees that the US labor market is far from “maximum employment” today, but that will no longer be the case in 2022. The Appendix to this report shows the average monthly nonfarm payroll growth that is required to reach different possible definitions of “maximum employment” by a few specific future dates. For example, we calculate that average monthly nonfarm payroll growth of 414 thousand would cause the unemployment rate to reach 3.8% and the labor force participation rate to reach 63% by the end of 2022. Our sense is that the US economy will be able to add more than 414 thousand jobs per month between now and December 2022. This means that if Fed officials believe that an unemployment rate of 3.8% and a participation rate of 63% meet the definition of “maximum employment”, then they will start to lift interest rates by then. This example sets the scene for what will become next year’s most important monetary policy debate. What constitutes “maximum employment”? Does our example of a 3.8% unemployment rate and a 63% participation rate meet the definition? Or does the Fed have different targets in mind? The Fed will be forced to clarify its position on the topic as the labor market gets closer to reasonable definitions of “maximum employment”. Our sense is that, as of now, there are a range of views on the committee with some FOMC participants taking a more hawkish view of how much slack is left in the labor market and some adopting a more dovish posture. We outline the differences between the hawkish and dovish positions below, but ultimately the path of inflation in 2022 will determine which camp wins out. If inflation remains high next year, then the Fed will be quicker to declare that the labor market is at “maximum employment”, and vice-versa. The Fed’s reliance on the inflation data to settle the argument of what constitutes “maximum employment” will make inflation the most important economic indicator for bond yields in 2022. Labor Market Slack: The Hawkish Case Chart 2The Unemployment Rate Is Falling Fast
The Unemployment Rate Is Falling Fast
The Unemployment Rate Is Falling Fast
The hawkish case for the US labor market reaching “maximum employment” sooner rather than later was outlined nicely last month by our own Bank Credit Analyst.3 First, the Bank Credit Analyst points out that the US labor market was likely beyond “maximum employment” before COVID-19 struck. The implication being that the Fed may move to lift interest rates before the unemployment and participation rates fully recover their pre-pandemic levels. Notice that the unemployment rate (adjusted for the post-COVID surge in people employed but absent from work) was 3.5% in February 2020, well below the Congressional Budget Office’s 4.5% estimate of the natural rate of unemployment (Chart 2).4 Today, the adjusted unemployment rate is 5.5%, not that far above the 3.5%-4.5% range of FOMC participant estimates of the natural rate. If this year’s rate of decline continues, the unemployment rate will hit 4.5% by January 2022 and 3.5% by May 2022. Of course, we know that the Fed takes a broader view of labor market utilization than just the unemployment rate. In particular, we observed sharp declines in labor force participation rates across a wide range of demographic groups when the pandemic struck last year (Chart 3). While the Fed will want to see some improvement in labor force participation, it might be unrealistic to expect the overall labor force participation rate to return to its pre-pandemic level. This is because the aging of the US population imparts a structural downtrend to the participation rate. The dashed line in Chart 4 shows where the participation rate would be if the rate of labor force participation of every individual age cohort remained constant at its February 2020 level. Even in this case, the greater flow of people into the older age groups causes the part rate to fall over time. The message from Chart 4 is that even if the participation rates of every age cohort tracked by the Bureau of Labor Statistics rebound to their February 2020 levels, we would still only expect an overall participation rate of 62.8% by the end of 2022, significantly below the 63.3% seen in February 2020. Chart 3Labor Force Participation By Age Cohort
Labor Force Participation By Age Cohort
Labor Force Participation By Age Cohort
Chart 4The Demographic Downtrend In Participation
The Demographic Downtrend In Participation
The Demographic Downtrend In Participation
On top of the demographic argument, we also notice that the pandemic led to a surge in the number of retired people last year, a number that continues to rise quickly (Chart 5). While we should probably expect some increase in the flow of people coming out of retirement to re-join the labor force as the economy recovers, it’s also logical to assume that there will be at least some hysteresis among the retired population. That is, the longer someone is retired, the less likely they are to re-enter the labor force at all. To the extent that the increase in retired people is sticky, it may be ambitious to expect a full convergence of the 55-year+ part rate back to February 2020 levels (Chart 3, bottom panel). All else equal, this will cause the labor market to reach “maximum employment” more quickly than even our demographic trendline for participation suggests. Chart 5A Surge In Retirees
A Surge In Retirees
A Surge In Retirees
The question of how many FOMC participants agree with the above arguments remains open, but our sense is that there are some who will be eager to declare that “maximum employment” has been achieved before we see a full rebound in the unemployment and participation rates back to pre-COVID levels. For example, Fed Vice-Chair Richard Clarida mentioned the “demographic trend” in labor force participation in his most recent speech.5 Also, Dallas Fed President Robert Kaplan said the following in a recent interview: We’ve had 3 million retirements since February 2020. […] Some of these workers will come back into the workforce, but some of these workers are 55 and older and they’re in reasonably good financial shape and COVID has caused them to re-think whether they really want to re-enter the workforce.6 Labor Market Slack: The Dovish Case There are also good arguments on the side of those who think that an appropriate definition of “maximum employment” involves an unemployment rate closer to 3.5% than 4.5% and a participation rate that does return to pre-COVID levels, and maybe even moves higher. First, a study from the Federal Reserve Bank of Kansas City noted that the bulk of the recent increase in the number of retired people is explained, not by an increase in the number of retirements, but by a reduction in the flow of people from retirement back into the workforce (Chart 6).7 This suggests that pandemic-related health risks are the likely culprit behind the increase in the number of retired people, casting doubt on the idea that the increase in retired people will be sticky. Chart 6Increased Retirees: A Closer Look
2022 Will Be All About Inflation
2022 Will Be All About Inflation
Second, there is a strong case to be made that even the February 2020 labor force participation rate is not high enough to meet the definition of “maximum employment”. If we look at the participation rates for 25-54 year old men and women, we see that both were in strong uptrends prior to the pandemic (Chart 7), and there is every reason to believe that they would have continued to move higher if COVID hadn’t cut the recovery short. Chart 7Part Rates Were Rising Pre-Pandemic
Part Rates Were Rising Pre-Pandemic
Part Rates Were Rising Pre-Pandemic
Consider what some FOMC participants were saying prior to the pandemic: The strong labor market is also encouraging more people in their prime working years – ages 25 to 54 – to rejoin or remain in the labor force, […] So far, we have made up more than half the loss in the Great Recession, which translates to almost 2 million more people in the labor force. But prime age participation could still be higher. - Jerome Powell, November 20198 Whether participation will continue to increase in a tight labor market remains to be seen. But I note that male prime-age participation still remains below levels seen in previous business cycle expansions. - Richard Clarida, November 20199 In a more recent interview, Minneapolis Fed President Neel Kashkari expressed skepticism about the idea that labor force participation is destined to remain in a long-run structural downtrend and said that he’s “not convinced we were actually at maximum employment before the COVID shock hit us.” He also said: Getting [labor force participation] and employment-to-population at least back to where they were before [the pandemic], but not necessarily even declaring victory when we do that. I think that’s a reasonable thing for us to try to achieve.10 Inflation: The Ultimate Argument Settler What the above arguments make clear is that there are good reasons to think that the US labor market will reach some policymakers’ definitions of “maximum employment” perhaps by as early as the middle of next year. However, there are also some policymakers who will adopt a more dovish view of what constitutes “maximum employment”. Ultimately, the path of inflation will determine which camp wins out. This is because the entire concept of “maximum employment” is only meaningful when viewed alongside inflation. If employment is pushed beyond its “maximum”, it definitionally means that labor market tightness is leading to unwanted inflationary pressures. With that in mind, the Fed will increasingly refer to the inflation data next year as it tries to make its definition of “maximum employment” more precise. Crucially, what will matter for the Fed (and for the bond market) is where inflation is next year, not where it is right now. Right now, core inflation is well above the Fed’s price stability target, but it is well known that the recent increase in inflation is concentrated in a few sectors – COVID-impacted services and autos – where prices will decelerate as post-pandemic bottlenecks ease (Chart 8). Just as the Fed ignored surging prices in those sectors this year, it will ignore plunging prices in those sectors next year. What will matter for monetary policy is whether core inflation excluding COVID-impacted services and autos remains contained or rises above levels consistent with the Fed’s target (Chart 8, bottom panel). The Fed will also be inclined to declare that “maximum employment” has been achieved if wage growth is accelerating. Currently, there is some evidence of rising wages but also some major supply bottlenecks in the labor market, as evidenced by the all-time high in job openings (Chart 9). Labor supply constraints should ease next year, but the Fed will be watching closely to see if wage growth moderates in kind or continues to increase. Chart 8Watch CPI (ex. COVID-Impacted Services And Autos) In 2022
Watch CPI (ex. COVID-Impacted Services And Autos) In 2022
Watch CPI (ex. COVID-Impacted Services And Autos) In 2022
Chart 9Watch Wages In 2022
Watch Wages In 2022
Watch Wages In 2022
Finally, the Fed will keep a close eye on inflation expectations next year. In particular, it will monitor the Common Inflation Expectations Index and the 5-year/5-year forward TIPS breakeven inflation rate (Chart 10). If either of these indicators break above levels consistent with the Fed’s 2% inflation target, then policymakers will be more inclined to think that “maximum employment” has been attained. Chart 10Watch Inflation Expectations In 2022
Watch Inflation Expectations In 2022
Watch Inflation Expectations In 2022
Bottom Line: The Fed will be forced to clarify its definition of “maximum employment” in 2022, and the path of inflation will ultimately dictate how far the Fed tries to push the labor market. The key indicators to monitor to decide when the Fed will declare that “maximum employment” has been attained are: core inflation excluding COVID-impacted services and autos, wage growth, inflation expectations and the prime-age (25-54) labor force participation rate (Chart 3, panel 2). Investment Implications For bond markets, the question of when the Fed decides that the labor market has reached “maximum employment” is crucial because it will determine the start of the next rate hike cycle. At present, the overnight index swap curve is priced for Fed liftoff in January 2023 and for a total of 78 bps of rate hikes by the end of 2023 (Chart 11). Chart 11Rate Hike Expectations
Rate Hike Expectations
Rate Hike Expectations
Our expectation is that the Fed will start lifting rates in December 2022 and that rate hikes will proceed more quickly than what is currently priced in the market. The unemployment rate will be close to 3.5% by December 2022 and inflation will be sufficiently above the Fed’s target that policymakers will be inclined to view the labor market as at “maximum employment”. Investors should run below-benchmark duration in US bond portfolios to profit from this outcome. We also recommend that investors position for a flatter yield curve by the end of 2022. Specifically, we recommend shorting the 5-year Treasury note versus a duration-matched barbell consisting of the 2-year and 10-year notes. Table 1A shows fair value estimates for the 2-year, 5-year and 10-year yields as of the end of 2022 assuming the market moves to price-in the following path for the fed funds rate: The first 25 bps rate hike occurs in December 2022 Rate hikes proceed at a pace of 100 bps per year The fed funds rate levels-off at a terminal rate of 2.08%11 Table 1ATreasury Curve Fair Value Estimates: December 2022 Liftoff Scenario
2022 Will Be All About Inflation
2022 Will Be All About Inflation
In that example, the 2-year and 5-year yields both rise by much more than the 10-year yield and both exceed the change that is priced into the forward curve by more than the 10-year yield. Table 1B shows the results from a similar scenario, the only difference is that the liftoff date is pushed back to March 2023. Both the 2-year and 5-year yields also rise by more than the 10-year yield in this scenario, though the delayed liftoff dampens the relative upside in the 2-year yield. Table 1BTreasury Curve Fair Value Estimates: March 2023 Liftoff Scenario
2022 Will Be All About Inflation
2022 Will Be All About Inflation
Bottom Line: Investors should maintain below-benchmark portfolio duration and position in Treasury curve flatteners in anticipation of a rate hike cycle that will start in December 2022. Appendix: How Far From “Maximum Employment” And Fed Liftoff? Chart A1Defining “Maximum Employment”
Defining "Maximum Employment"
Defining "Maximum Employment"
The Federal Reserve has promised that the funds rate will stay pinned at zero until the labor market returns to “maximum employment”. The Fed has not provided explicit guidance on the definition of “maximum employment”, but we deduce that “maximum employment” means that the Fed wants to see the U3 unemployment rate within a range consistent with its estimates of the natural rate of unemployment, currently 3.5% to 4.5%, and that it wants to see a more or less complete recovery of the labor force participation rate back to February 2020 levels (Chart A1). Alternatively, we can infer definitions of “maximum employment” from the New York Fed’s Surveys of Primary Dealers and Market Participants. These surveys ask respondents what they think the unemployment and labor force participation rates will be at the time of Fed liftoff. Currently, the median respondent from the Survey of Market Participants expects an unemployment rate of 3.5% and a participation rate of 63%. The median respondent from the Survey of Primary Dealers expects an unemployment rate of 3.8% and a participation rate of 62.8%. Tables A1-A4 present the average monthly nonfarm payroll growth required to reach different combinations of unemployment rate and participation rate by specific future dates. For example, if we use the definition of “maximum employment” from the Survey of Market Participants, then we need to see average monthly nonfarm payroll growth of +414k in order to hit “maximum employment” by the end of 2022. Table A1Average Monthly Nonfarm Payroll Growth Required For The Unemployment To Reach 4.5% By The Given Date
2022 Will Be All About Inflation
2022 Will Be All About Inflation
Table A2Average Monthly Nonfarm Payroll Growth Required For The Unemployment To Reach 4% By The Given Date
2022 Will Be All About Inflation
2022 Will Be All About Inflation
Table A3Average Monthly Nonfarm Payroll Growth Required For The Unemployment To Reach 3.5% By The Given Date
2022 Will Be All About Inflation
2022 Will Be All About Inflation
Table A4Average Monthly Nonfarm Payroll Growth Required To Reach “Maximum Employment” As Defined By Survey Respondents
2022 Will Be All About Inflation
2022 Will Be All About Inflation
Chart A2 presents recent monthly nonfarm payroll growth along with target levels based on the Survey of Market Participants’ definition of “maximum employment”. This chart is to help us track progress toward specific liftoff dates. For example, if monthly nonfarm payroll growth continues to print at the same level as last month, then we could anticipate a Fed rate hike by June 2022. Chart A2Tracking Toward Fed Liftoff
Tracking Toward Fed Liftoff
Tracking Toward Fed Liftoff
We will continue to track these charts and tables in the coming months, and will publish updates after the release of each monthly employment report. Ryan Swift US Bond Strategist rswift@bcaresearch.com Footnotes 1 Please see US Bond Strategy Weekly Report, “Watch Employment, Not Inflation”, dated June 15, 2021. 2 Specifically, the Fed’s forward guidance states that it will not lift interest rates until (i) inflation is above 2%, (ii) inflation is expected to remain above 2% for some time and (iii) the labor market has reached “maximum employment”. 3 Please see Bank Credit Analyst Special Report, “The Return To Maximum Employment: It May Be Faster Than You Think”, dated August 26, 2021. 4 For details on the adjustment we make to the unemployment rate please see US Bond Strategy Weekly Report, “Overreaction”, dated July 13, 2021. 5 https://www.federalreserve.gov/newsevents/speech/clarida20210804a.htm 6 https://www.bloomberg.com/news/articles/2021-08-09/dallas-fed-president-rob-kaplan-on-the-economy-and-monetary-policy-right-now?sref=Ij5V3tFi 7 https://www.kansascityfed.org/research/economic-bulletin/what-has-driven-the-recent-increase-in-retirements/ 8 https://www.federalreserve.gov/newsevents/speech/powell20191125a.htm 9 https://www.federalreserve.gov/newsevents/speech/clarida20191114a.htm 10 https://www.bloomberg.com/news/articles/2021-08-16/neel-kashkari-on-the-fed-s-quest-to-get-to-full-employment?srnd=oddlots-podcast&sref=Ij5V3tFi 11 We assume a target range of 2% to 2.25% for the terminal fed funds rate. We also assume that the effective fed funds rate trades 8 bps above the lower-end of its target band, as is presently the case. Recommended Portfolio Specification Other Recommendations Treasury Index Returns Spread Product Returns
Highlights Stocks tend to perform worse when unemployment is low. Since 1950, the S&P 500 has risen at an annualized pace of 12% when the unemployment rate was above its historic average compared to 6% when the unemployment rate was below its average. Three reasons help explain this relationship: 1) The unemployment rate has historically been mean-reverting; 2) Low unemployment often leads to monetary tightening; and 3) Valuations are usually more stretched when unemployment is low. In the spring of 2020, stocks benefited from what turned out to be a very auspicious environment: A steady decline in the unemployment rate from very high levels, assisted by a massive dose of monetary and fiscal stimulus. Today, the situation is less clear-cut. The labor market has improved dramatically, while both monetary and fiscal policy are turning less accommodative. Nevertheless, the Fed is unlikely to hike rates for at least 12 months, and it will take much longer than that for monetary policy to turn restrictive. This suggests that we are still in the middle-to-late stages of a business cycle expansion that began following the Great Recession (and was only briefly interrupted by the pandemic). Historically, cyclical stocks have done well during this phase of the business cycle. To the extent that cyclicals are overrepresented in overseas indices, investors should favor non-US stock markets. Non-US stocks also trade at a substantial valuation discount to their US peers. A Surprising Relationship One of the best pieces of advice I received when I was starting my research career was to get to the punchline as soon as possible. As a strategist, you are not writing a detective novel where the answers are shrouded in mystery until the very end. You are providing conclusions to readers with supporting evidence. Chart 1Stocks Do Best When Unemployment Is High
Is Low Unemployment Good Or Bad For Stocks?
Is Low Unemployment Good Or Bad For Stocks?
With that in mind, let me answer the question posed in the title of this report: Is low unemployment good or bad for stocks? As Chart 1 shows, the answer is bad. The interesting issues are why it is bad and what this may mean for investors today. There are three key reasons why low unemployment has typically corresponded with paltry equity returns: The unemployment rate has historically been mean-reverting: Low unemployment is often followed by high unemployment. And, when the unemployment rate starts rising, it keeps rising. There has never been a case in the post-war era where the unemployment rate has risen by more than one-third of a percentage point without a recession occurring (Chart 2). Chart 2When Unemployment Starts Rising, It Usually Keeps Rising
When Unemployment Starts Rising, It Usually Keeps Rising
When Unemployment Starts Rising, It Usually Keeps Rising
Low unemployment often leads to monetary tightening: An economy can only grow at an above-trend pace if there is labor market slack. Once the slack runs out, growth is liable to weaken as supply-side constraints kick in. Worse yet, labor market overheating has historically prompted central banks to raise rates (Chart 3). Higher rates in the context of slowing growth is toxic for stocks. Valuations are usually more stretched when unemployment is low: During the post-war period, the S&P 500 has traded at an average Shiller P/E ratio of 22.5 when the unemployment rate was below its historic average compared to 16.3 when the unemployment rate was above its average. Implications For The Present Day Stocks fare best when unemployment is high but falling. In contrast, stocks fare the worst when unemployment is low and rising (Chart 4). My colleague Doug Peta, BCA’s Chief US Investment Strategist, reached a similar conclusion in his August report entitled Level Or Direction? Chart 3Low Unemployment Often Leads To Monetary Tightening
Low Unemployment Often Leads To Monetary Tightening
Low Unemployment Often Leads To Monetary Tightening
Chart 4Stocks Do Best When Unemployment Is Falling From High Levels
Is Low Unemployment Good Or Bad For Stocks?
Is Low Unemployment Good Or Bad For Stocks?
In the spring of 2020, stocks benefited from what turned out to be a very auspicious environment: A steady decline in the unemployment rate from very high levels, assisted by a massive dose of monetary and fiscal stimulus. Controversially at the time, this led us to argue that the pandemic could lead to much higher stock prices. Chart 5There Is Still Slack
There Is Still Slack
There Is Still Slack
Today, the situation is less clear-cut. On the one hand, the unemployment rate has fallen dramatically, while monetary and fiscal policy are turning less accommodative. This week, the ECB reduced the pace of net asset purchases under the PEPP. The Fed will start paring back asset purchases by the end of this year. Governments are also withdrawing fiscal policy support. In the US, emergency federal unemployment benefits expired, somewhat ironically, on Labor Day. On the other hand, the unemployment rate in most economies is still above pre-pandemic levels. In the US, the unemployment rate for prime-age workers is 1.7 percentage points higher than in February 2020, while the employment-to-population ratio is 2.4 points lower (Chart 5). The presence of labor market slack ensures that policy support will be withdrawn only gradually. Granted, core CPI inflation in the US is running above 4%. Standard Taylor Rule equations suggest that the Fed funds rate should be well above zero (Chart 6). That said, these equations use realized inflation, which may be misleading given that both market participants and Fed officials expect inflation to fall rapidly (Chart 7). Indeed, the widely followed 5-year/5-year forward TIPS breakeven rate is below the Fed’s comfort zone (Chart 8).1 With long-term inflation expectations still subdued, there is no urgency for the Fed to sound more hawkish. Chart 6What Rate Does The Taylor Rule Prescribe?
Is Low Unemployment Good Or Bad For Stocks?
Is Low Unemployment Good Or Bad For Stocks?
Chart 7Investors Expect Inflation To Fall Rapidly From Current Levels
Is Low Unemployment Good Or Bad For Stocks?
Is Low Unemployment Good Or Bad For Stocks?
Chart 8Long-Term Inflation Expectations Are Muted
Long-Term Inflation Expectations Are Muted
Long-Term Inflation Expectations Are Muted
Cyclical Stocks Usually Do Best In The Latter Innings Of The Business Cycle Expansion Monetary policy is unlikely to become restrictive in any major economy during the next 18 months, which should allow global growth to remain at an above-trend pace. Hence, it is too early to turn bearish on stocks. Nevertheless, given that the unemployment rate in most countries is closer to a trough than to a peak, it is reasonable to conclude that we are somewhere in the middle-to-late stages of a business cycle expansion that began following the Great Recession (and was only briefly interrupted by the pandemic). As Chart 9 shows, cyclical equity sectors, such as industrials, energy, and materials, typically do best in the latter innings of business cycle expansions. Such was the environment that prevailed in 2005-08, and such will be the environment that prevails over the coming quarters as the unemployment rate falls further, capital spending increases, and commodity prices rise further. Chart 9The Business Cycle And Equity Sectors
Is Low Unemployment Good Or Bad For Stocks?
Is Low Unemployment Good Or Bad For Stocks?
Increased government infrastructure spending should help cyclical sectors. The US Congress is set to pass a 10-year $500 billion package. The EU’s €750 billion Next Generation fund is finally up and running. Chinese local government infrastructure spending is poised to accelerate over the remainder of the year. Chart 10The Dollar Is A Countercyclical Currency
The Dollar Is A Countercyclical Currency
The Dollar Is A Countercyclical Currency
Chart 11Past Another Covid Wave
Is Low Unemployment Good Or Bad For Stocks?
Is Low Unemployment Good Or Bad For Stocks?
A weaker US dollar should also buoy cyclical stocks (Chart 10). As a countercyclical currency, the greenback usually weakens when global growth is strong. A cresting in the Delta variant wave should help jumpstart global growth over the coming months (Chart 11). Meanwhile, interest rate differentials have moved sharply against the US dollar, while the US trade deficit has widened noticeably (Charts 12A & B). Chart 12AInterest Rate Differentials Have Moved Against The Dollar
Interest Rate Differentials Have Moved Against The Dollar
Interest Rate Differentials Have Moved Against The Dollar
Chart 12BThe US Trade Deficit Has Widened Noticeably
The US Trade Deficit Has Widened Noticeably
The US Trade Deficit Has Widened Noticeably
Cyclical sectors are overrepresented outside the US (Table 1). Although not a classically cyclical sector, financials are also overrepresented in overseas indices. BCA’s global fixed-income strategists recommend a moderately underweight duration stance. As bond yields rise, bank shares should outperform (Chart 13). In contrast, tech stocks often lag in a rising yield environment. Table 1Cyclicals Are Overrepresented Outside The US
Is Low Unemployment Good Or Bad For Stocks?
Is Low Unemployment Good Or Bad For Stocks?
Chart 13Higher Rates: A Boon For Banks And A Bane For Tech
Higher Rates: A Boon For Banks And A Bane For Tech
Higher Rates: A Boon For Banks And A Bane For Tech
How Expensive Are Stocks? A high Shiller P/E predicts low future returns (Chart 14). Today, the Shiller P/E stands at 37 in the US. This is consistent with an expected 10-year total real return of close to zero for the S&P 500. Thus, the long-term outlook for US stocks is poor. We stress the words “long term.” As the bottom panel of Chart 14 shows, no matter what the starting point of valuations is, the average return over short-term horizons is very low relative to realized volatility. This is another way of saying that valuations provide a great deal of information about the long-term outlook for stocks, but little information about their near-term direction. Over horizons of about 12 months, the business cycle drives the stock market, as a simple comparison between purchasing manager indices and stock returns illustrates (Chart 15). Chart 14Valuation Is The Single Best Predictor Of Long-Term Equity Returns
Is Low Unemployment Good Or Bad For Stocks?
Is Low Unemployment Good Or Bad For Stocks?
Chart 15AThe Business Cycle Drives Cyclical Swings In Stocks
The Business Cycle Drives Cyclical Swings In Stocks
The Business Cycle Drives Cyclical Swings In Stocks
Chart 15BThe Business Cycle Drives Cyclical Swings In Stocks
The Business Cycle Drives Cyclical Swings In Stocks
The Business Cycle Drives Cyclical Swings In Stocks
Outside the US, the Shiller P/E stands at 20. In emerging markets, it is only 16 (Chart 16). This is significantly below US levels, implying that the long-term prospect for equities is much more attractive abroad. Thus, both medium-term cyclical factors and long-term valuation considerations favor non-US stocks. Peter Berezin Chief Global Strategist pberezin@bcaresearch.com Chart 16US Stocks Are Pricey
US Stocks Are Pricey
US Stocks Are Pricey
Footnotes 1 The Federal Reserve targets an average inflation rate of 2% for the personal consumption expenditures (PCE) index. The TIPS breakeven is based on the CPI index. Due to compositional differences between the two indices, CPI inflation has historically averaged 30-to-50 basis points higher than PCE inflation. This is why the Fed effectively targets a CPI inflation rate of about 2.3%-to-2.5%. Global Investment Strategy View Matrix
Is Low Unemployment Good Or Bad For Stocks?
Is Low Unemployment Good Or Bad For Stocks?
Special Trade Recommendations
Is Low Unemployment Good Or Bad For Stocks?
Is Low Unemployment Good Or Bad For Stocks?
Current MacroQuant Model Scores
Is Low Unemployment Good Or Bad For Stocks?
Is Low Unemployment Good Or Bad For Stocks?
Highlights Chart 1Employment Growth Will Rebound
Employment Growth Will Rebound
Employment Growth Will Rebound
August’s weak employment growth reflects the surge of Delta variant COVID cases in the United States. This is evidenced by the fact that Leisure & Hospitality sector payrolls held flat in August after having grown by 415k in July and 397k in June (Chart 1). While Delta could still be a drag on employment growth for another month or two, there is mounting evidence that the daily new case count is close to its peak. Leisure & Hospitality employment growth will regain its prior pace as new Delta cases trend down. This will lead to a resumption of strong monthly payroll reports (500k – 1000k) as we head into the new year. For monetary policy, we calculate that average monthly nonfarm payroll growth of 414k will be sufficient for the Fed to start rate hikes before the end of 2022 (bottom panel). We anticipate that this threshold will easily be met. The Treasury curve will bear-flatten as employment growth improves and the market prices-in an earlier start and quicker pace of Fed rate hikes. Investors should maintain below-benchmark portfolio duration and stay short the 5-year Treasury note versus a duration-matched 2/10 barbell. Feature Table 1Recommended Portfolio Specification
The Delta Drag
The Delta Drag
Table 2Fixed Income Sector Performance
The Delta Drag
The Delta Drag
Investment Grade: Neutral Chart 2Investment Grade Market Overview
Investment Grade Market Overview
Investment Grade Market Overview
Investment grade corporate bonds underperformed the duration-equivalent Treasury index by 5 basis points in August, dragging year-to-date excess returns down to +166 bps. The combination of above-trend economic growth and accommodative monetary policy supports continued positive excess returns for spread product versus Treasuries. At 91 bps, the 3-year/10-year Treasury slope remains steep. This is a strong signal that monetary conditions are accommodative. But despite the positive macro back-drop, investment grade valuations are extremely tight (Chart 2). A recent report looked at what different combinations of Treasury slope and corporate spreads have historically signaled for corporate bond excess returns.1 It shows that tight corporate spreads only correlate with negative excess returns once the 3-year/10-year Treasury slope is below 50 bps. Though we retain a positive view of spread product as a whole, better value can be found outside of the investment grade corporate sector. Specifically, we recommend that investors shift into high-yield corporates, municipal bonds and USD-denominated Emerging Market sovereigns and corporates. We also advise investors to favor long-maturity corporate bonds and those corporate sectors with elevated Duration-Times-Spread.2 Table 3ACorporate Sector Relative Valuation And Recommended Allocation*
The Delta Drag
The Delta Drag
Table 3BCorporate Sector Risk Vs. Reward*
The Delta Drag
The Delta Drag
High-Yield: Overweight Chart 3High-Yield Market Overview
High-Yield Market Overview
High-Yield Market Overview
High-Yield outperformed the duration-equivalent Treasury index by 66 basis points in August, bringing year-to-date excess returns up to +502 bps. A recent report looked at the default expectations that are currently priced into the junk index and considered whether they are likely to be met.3 If we demand an excess spread of 100 bps and assume a 40% recovery rate on defaulted debt, then the High-Yield index embeds an expected default rate of 3.0% (Chart 3). Using a model of the 12-month trailing speculative grade default rate that is based on gross corporate leverage (pre-tax profits over total debt) and C&I lending standards, we estimate that the 12-month default rate will fall to between 2.3% and 2.8%, below what the market currently discounts. Notably, the corporate default rate is tracking at an annualized rate of roughly 1.7% through the first seven months of the year, well below the estimate generated by our macro model. Another recent report looked at the incremental spread pick-up investors can earn by moving out of investment grade corporates and into junk.4 It concluded that the extra spread available in high-yield is worth grabbing and that B-rated bonds look particularly attractive in risk-adjusted terms. MBS: Underweight Chart 4MBS Market Overview
MBS Market Overview
MBS Market Overview
Mortgage-Backed Securities underperformed the duration-equivalent Treasury index by 3 basis points in August, dragging year-to-date excess returns down to -67 bps. The nominal spread between conventional 30-year MBS and equivalent-duration Treasuries tightened 4 bps in August. The spread is wide compared to recent history, but it remains tight compared to the pace of mortgage refinancings (Chart 4). The conventional 30-year MBS option-adjusted spread (OAS) widened 2 bps in August (panel 2), and it is now starting to look attractive compared to other similarly risky spread sectors. The conventional 30-year MBS OAS sits at 38 bps, below the 56 bps offered by Aa-rated corporate bonds but above the 20 bps offered by Aaa-rated consumer ABS and the 35 bps offered by Agency CMBS. In a recent report we looked at MBS performance and valuation across the coupon stack.5 We noted that the higher convexity of high-coupon MBS makes them likely to outperform lower-coupon MBS in a rising yield environment. Higher coupon MBS also have greater OAS than lower coupons. This makes the high-coupon MBS more likely to outperform in a flat bond yield environment as well. Given our view that bond yields will be higher in 6-12 months, we recommend favoring high coupons (4%, 4.5%) over low coupons (2%, 2.5%, 3%) within an overall underweight allocation to Agency MBS. Government-Related: Neutral Chart 5Government-Related Market Overview
Government-Related Market Overview
Government-Related Market Overview
The Government-Related index outperformed the duration-equivalent Treasury index by 27 basis points in August, bringing year-to-date excess returns up to +84 bps (Chart 5). Sovereign debt outperformed duration-equivalent Treasuries by 122 bps in August, bringing year-to-date excess returns up to +7 bps. Foreign Agencies outperformed the Treasury benchmark by 8 bps on the month, bringing year-to-date excess returns up to +44 bps. Local Authority bonds outperformed by 9 bps in August, bringing year-to-date excess returns up to +382 bps. Domestic Agency bonds outperformed by 3 bps, bringing year-to-date excess returns up to +30 bps. Supranationals outperformed by 5 bps, bringing year-to-date excess returns up to +31 bps. USD-denominated Emerging Market (EM) Sovereign bonds outperformed US corporates in August and relative valuation between the two sectors is starting to equalize (panel 4). That said, we retain a preference for EM sovereigns over US corporates, particularly the bonds of Russia, Mexico, Saudi Arabia, UAE and Qatar where value remains attractive. A recent report looked at valuation within the investment grade USD-denominated EM corporate space.6 It found that EM corporates are attractively priced relative to US corporate bonds across the entire investment grade credit spectrum. It also found that EM corporates are attractive relative to EM sovereigns within the A and Baa credit tiers. EM sovereigns have the edge in the Aa credit tier. Municipal Bonds: Overweight Chart 6Municipal Market Overview
Municipal Market Overview
Municipal Market Overview
Municipal bonds underperformed the duration-equivalent Treasury index by 9 basis points in August, dragging year-to-date excess returns down to +262 bps (before adjusting for the tax advantage). The economic and policy back-drop remains favorable for municipal bond performance. Trailing 4-quarter net state & local government savings were already positive through the end of Q1 2021 and they received another significant boost in Q2 as funds from the American Rescue Plan were doled out (Chart 6). With state & local government balance sheets in such good shape, we are comfortable moving down in quality within municipal bonds. A move down in quality is especially compelling because of tight Aaa muni valuations relative to Treasuries (top panel). Valuation is more compelling in the lower investment grade credit tiers, especially at the long-end of the curve.7 GO munis in the 12-17 year maturity bucket offer a 5% breakeven tax rate versus corporates with the same credit rating and duration. 12-17 year Revenue munis actually offer a before-tax yield pick-up (panel 2). Finally, high-yield muni spreads are reasonably attractive relative to high-yield corporates, offering a breakeven tax rate of 23% (panel 4). But despite the attractive spread, we recommend only a neutral allocation to high-yield munis versus high-yield corporates as the deep negative convexity of high-yield munis makes them susceptible to extension risk if bond yields rise. Treasury Curve: Buy 2/10 Barbell Versus 5-Year Bullet Chart 7Treasury Yield Curve Overview
Treasury Yield Curve Overview
Treasury Yield Curve Overview
Treasury yields moved higher in August, with the 5-year and 7-year maturities bearing the brunt of the sell-off. The 2-year/10-year Treasury slope steepened 5 bps to end the month at 110 bps. The 5-year/30-year slope flattened 5 bps to end the month at 115 bps. We expect bond yields to be higher in 6-12 months, but we also anticipate that the next significant move higher in bond yields will coincide with curve flattening, not steepening. At 1.93%, the 5-year/5-year forward Treasury yield is not that far below our target fair value range of 2% - 2.25%. In a recent report, we demonstrated that yield curve steepening only occurs when either the Fed is cutting rates or the 5-year/5-year forward yield rises.8 This means that the 2/10 Treasury curve is more likely to flatten than steepen during the next 6-12 months, even as bond yields move higher. Similarly, we observe that the overnight index swap (OIS) curve is priced for the fed funds rate to be 0.21% in one year’s time and 1.47% in five years (Chart 7). The latter rate has 146 bps of upside if it converges all the way back to its 2018 high, but this pales in comparison to the 265 bps of upside in the 12-month forward rate. The yield curve will flatten as the 12-month forward OIS rate converges with the 5-year forward rate (panel 3). Investors should position in yield curve flatteners on a 6-12 month horizon. Specifically, we recommend shorting the 5-year bullet versus a duration-matched 2/10 barbell. TIPS: Neutral Chart 8TIPS Market Overview
TIPS Market Overview
TIPS Market Overview
TIPS performed in line with the duration-equivalent nominal Treasury index in August, leaving year-to-date excess returns unchanged at +578 bps. The 10-year and 5-year/5-year forward TIPS breakeven inflation rates both fell by 7 bps in August. At 2.37%, the 10-year TIPS breakeven inflation rate is near the middle of the 2.3% to 2.5% range that is consistent with inflation expectations being well anchored around the Fed’s target (Chart 8). Meanwhile, at 2.21%, the 5-year/5-year forward TIPS breakeven inflation rate is only just below target (panel 3). With long-dated inflation expectations close to the Fed’s target levels, we see limited upside on a 6-12 month investment horizon. We also see the cost of short-maturity inflation protection falling during the next few months as realized inflation continues to moderate from its current extremely high level. This will lead to some modest steepening of the inflation curve (bottom panel). While the inflation curve has some room to steepen, we don’t see it returning to positive territory. An inverted inflation curve is simply more consistent with the Fed’s Average Inflation Target than a positively sloped one. This is because the Fed’s new framework calls for it to attack its inflation target from above rather than from below. ABS: Overweight Chart 9ABS Market Overview
ABS Market Overview
ABS Market Overview
Asset-Backed Securities outperformed the duration-equivalent Treasury index by 3 basis points in August, bringing year-to-date excess returns up to +40 bps. Aaa-rated ABS outperformed by 2 bps on the month, bringing year-to-date excess returns up to +30 bps. Non-Aaa ABS outperformed by 4 bps, bringing year-to-date excess returns up to +92 bps. The stimulus from last year’s CARES Act led to a significant increase in household savings when individual checks were mailed in April 2020. That excess savings has still not been spent and the most recent round of stimulus checks has only added to the stockpile (Chart 9). The extraordinarily large stock of household savings means that the collateral quality of consumer ABS is also extraordinarily high. Indeed, many households have been using their windfalls to pay down consumer debt (bottom panel). Investors should remain overweight consumer ABS and should also take advantage of the high quality of household balance sheets by moving down the quality spectrum. Non-Agency CMBS: Neutral Chart 10CMBS Market Overview
CMBS Market Overview
CMBS Market Overview
Non-Agency Commercial Mortgage-Backed Securities outperformed the duration-equivalent Treasury index by 6 basis points in August, bringing year-to-date excess returns up to +193 bps. Aaa Non-Agency CMBS outperformed Treasuries by 10 bps in August, bringing year-to-date excess returns up to +92 bps. Non-Aaa Non-Agency CMBS underperformed Treasuries by 9 bps on the month, dragging year-to-date excess returns down to +529 bps (Chart 10). Though returns have been strong and spreads remain attractive, particularly for lower-rated CMBS, we continue to recommend only a neutral allocation to the sector because of the structurally challenging environment for commercial real estate. Agency CMBS: Overweight Agency CMBS outperformed the duration-equivalent Treasury index by 4 basis points in August, bringing year-to-date excess returns up to +91 bps. The average index option-adjusted spread held flat on the month. It currently sits at 35 bps (bottom panel). Though Agency CMBS spreads have recovered to well below pre-COVID levels, they still look attractive compared to other similarly risky spread products. Stay overweight. Ryan Swift US Bond Strategist rswift@bcaresearch.com Appendix A: Butterfly Strategy Valuations The following tables present the current read-outs from our butterfly spread models. We use these models to identify opportunities to take duration-neutral positions across the Treasury curve. The following two Special Reports explain the models in more detail: US Bond Strategy Special Report, “Bullets, Barbells And Butterflies”, dated July 25, 2017, available at usbs.bcaresearch.com US Bond Strategy Special Report, “More Bullets, Barbells And Butterflies”, dated May 15, 2018, available at usbs.bcaresearch.com Table 4 shows the raw residuals from each model. A positive value indicates that the bullet is cheap relative to the duration-matched barbell. A negative value indicates that the barbell is cheap relative to the bullet. Table 4Butterfly Strategy Valuation: Raw Residuals In Basis Points (As Of August 31st, 2021)
The Delta Drag
The Delta Drag
Table 5 scales the raw residuals in Table 4 by their historical means and standard deviations. This facilitates comparison between the different butterfly spreads. Table 5Butterfly Strategy Valuation: Standardized Residuals (As Of August 31st, 2021)
The Delta Drag
The Delta Drag
Table 6 flips the models on their heads. It shows the change in the slope between the two barbell maturities that must be realized during the next six months to make returns between the bullet and barbell equal. For example, a reading of 12 bps in the 5 over 2/10 cell means that we would only expect the 5-year to outperform the 2/10 if the 2/10 slope steepens by more than 12 bps during the next six months. Otherwise, we would expect the 2/10 barbell to outperform the 5-year bullet. Table 6Discounted Slope Change During Next 6 Months (BPs)
The Delta Drag
The Delta Drag
Appendix B: Excess Return Bond Map The Excess Return Bond Map is used to assess the relative risk/reward trade-off between different sectors of the US bond market. It is a purely computational exercise and does not impose any macroeconomic view. The Map’s vertical axis shows 12-month expected excess returns. These are proxied by each sector’s option-adjusted spread. Sectors plotting further toward the top of the Map have higher expected returns and vice-versa. Our novel risk measure called the “Risk Of Losing 100 bps” is shown on the Map’s horizontal axis. To calculate it, we first compute the spread widening required on a 12-month horizon for each sector to lose 100 bps or more relative to a duration-matched position in Treasury securities. Then, we divide that amount of spread widening by each sector’s historical spread volatility. The end result is the number of standard deviations of 12-month spread widening required for each sector to lose 100 bps or more versus a position in Treasuries. Lower risk sectors plot further to the right of the Map, and higher risk sectors plot further to the left. Chart 11Excess Return Bond Map (As Of August 31st, 2021)
The Delta Drag
The Delta Drag
Footnotes 1 Please see US Bond Strategy Weekly Report, “The Post-FOMC Credit Environment”, dated June 29, 2021. 2 For ideas on how to increase the average spread of a US bond portfolio please see US Bond Strategy Weekly Report, “The Collapsing Credit Risk Premium”, dated July 20, 2021. 3 Please see US Bond Strategy Weekly Report, “The Post-FOMC Credit Environment”, dated June 29, 2021. 4 Please see US Bond Strategy Weekly Report, “The Collapsing Credit Risk Premium”, dated July 20, 2021. 5 Please see US Bond Strategy Weekly Report, “A New Conundrum”, dated April 20, 2021. 6 Please see US Bond Strategy Weekly Report, “The Post-FOMC Credit Environment”, dated June 29, 2021. 7 Please see US Bond Strategy Weekly Report, “The Collapsing Credit Risk Premium”, dated July 20, 2021. 8 Please see US Bond Strategy / Global Fixed Income Strategy Weekly Report, “A Bump On The Road To Recovery”, dated July 27, 2021.