Recession-Hard/Soft Landing
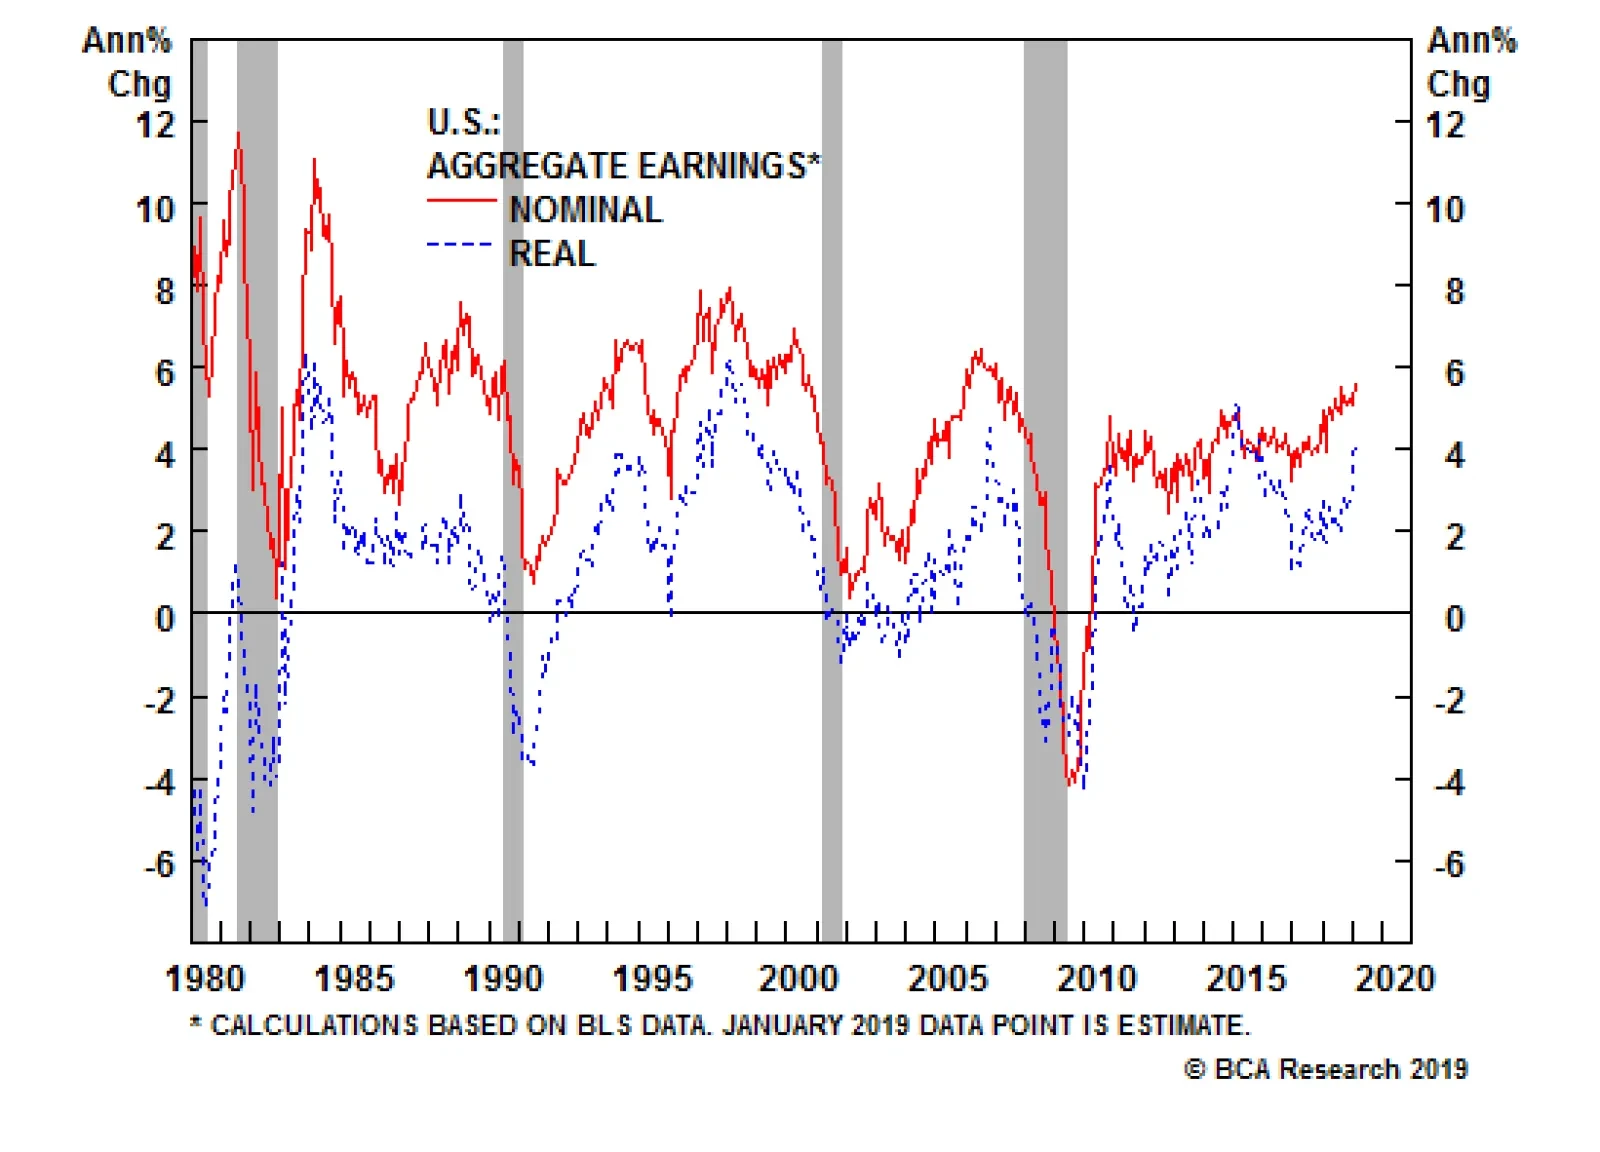
The recent U.S. data has certainly been consistent with that thesis. The ISM manufacturing index rose 2.3 percentage points to 56.6 in January. New orders jumped by 6.9 percentage points to 58.2. Payroll growth has also accelerated. Real aggregate earnings…
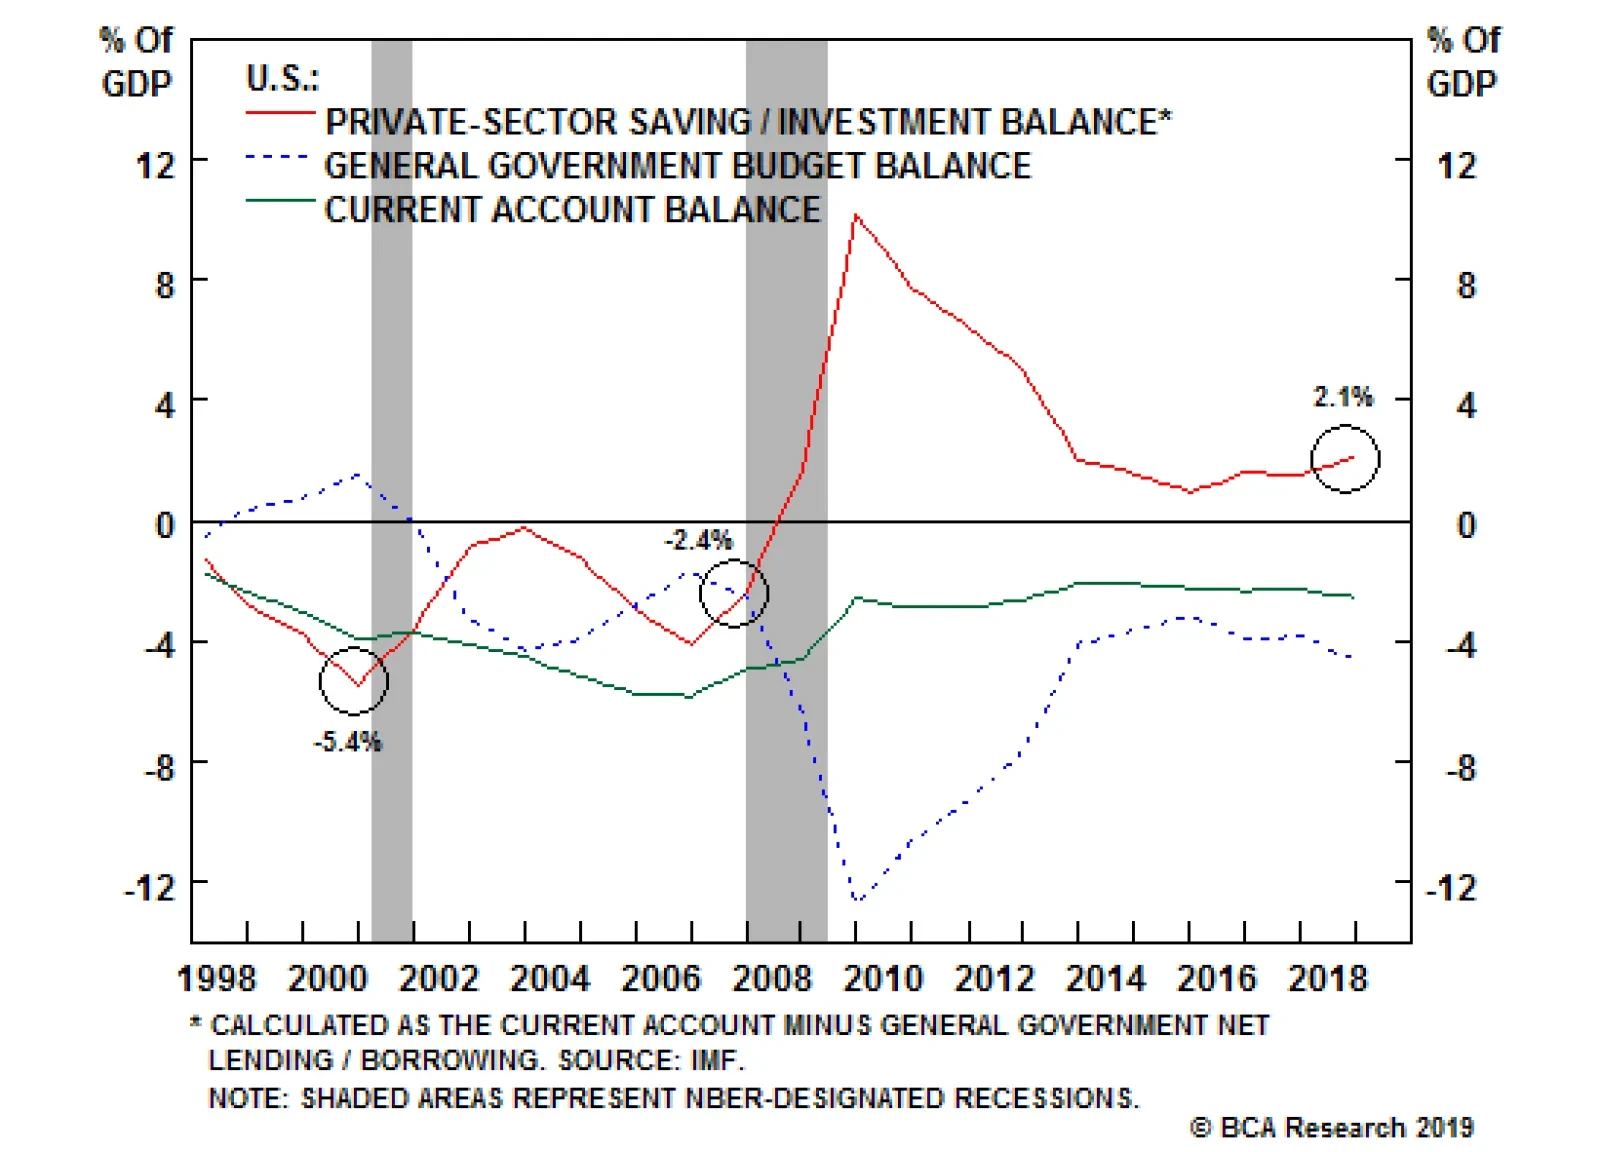
Today, the U.S. private-sector financial balance – the difference between what the private sector earns and spends – stands at a healthy surplus of 2.1% of GDP. Both of the last two recessions began when the private-sector balance was in deficit. The past…

Highlights Hyman Minsky famously said that “stability begets instability.” The converse is also true: Instability begets stability. None of the preconditions for a U.S. recession are in place yet. The Fed’s decision to press the pause button on further rate hikes ensures that it will take at least another 18 months for monetary policy to turn restrictive. Global growth should accelerate by mid-2019, as Chinese stimulus kicks in and the headwinds facing Europe dissipate. Investors should overweight global equities and underweight bonds over the next 12 months. The leadership role in the equity space will gradually shift outside the United States. Feature The Long Shadow Of The Financial Crisis "Stability begets instability” declared Hyman Minsky in his widely cited, seldom-read book.1 By this, Minsky meant that periods of economic tranquility often encourage excessive risk-taking, sowing the seeds of their own demise. We would not quarrel with Minsky’s assessment, but we would point out that the converse is also true: Instability begets stability. Following periods of intense financial stress, lenders become more circumspect about whom they lend to, while borrowers become reluctant to take on debt. The result is economically bittersweet. On the plus side, the newfound caution of lenders and borrowers alike ensures that financial imbalances are slow to build up again. On the negative side, sluggish credit growth restrains spending. The net effect is a recovery that is often slow and uneven, but one which lasts longer than expected. Few Signs Of Major U.S. Economic Imbalances This is the world in which we find ourselves today. It took a decade following the subprime crisis for the U.S. to return to full employment. Much of Europe is not even there yet. Lenders continue to take risks. However, they have been quicker than usual to scale back exposure at the first sign of trouble. For example, as U.S. auto loan defaults began rising in 2015, banks tightened lending standards. As a result, the share of auto loans transitioning into delinquency peaked in Q4 of 2016 and has since drifted down modestly (Chart 1). Chart 1Lenders Are More Circumspect These Days: The Case Of Autos
Lenders Are More Circumspect These Days: The Case Of Autos
Lenders Are More Circumspect These Days: The Case Of Autos
A similar thing happened when corporate credit spreads blew out in 2015 following the crash in oil prices (Chart 2). Banks tightened lending standards starting in late 2015. Once defaults peaked in early 2017, banks started easing standards. Chart 2Banks Were Quick To Tighten Lending Standards In 2015
Banks Were Quick To Tighten Lending Standards In 2015
Banks Were Quick To Tighten Lending Standards In 2015
Tellingly, the distress in corporate debt markets in 2015-16 did not cause the financial system to seize up, as evidenced by the fact that financial stress indices only increased marginally during that period. This suggests that financial imbalances never had a chance to rise to a level that threatened the overall economy. The Preconditions For The Next U.S. Recession Are Not Yet In Place Today, the U.S. private-sector financial balance – the difference between what the private sector earns and spends – stands at a healthy surplus of 2.1% of GDP. Both of the last two recessions began when the private-sector balance was in deficit (Chart 3). Chart 3The Private Sector Is Not Living Beyond Its Means The Way It Was Before The Last Two Recessions
The Private Sector Is Not Living Beyond Its Means The Way It Was Before The Last Two Recessions
The Private Sector Is Not Living Beyond Its Means The Way It Was Before The Last Two Recessions
This raises an intriguing question: If the U.S. private sector is not suffering from any major imbalances, what is going to cause the next recession? That’s a very good question, with no obvious answer! The past two recessions were triggered by the bursting of asset bubbles – first the dotcom bubble and then the housing bubble. Today, U.S. equities are far from cheap, but with the S&P 500 trading at 16.1-times forward earnings, they are hardly in a bubble (Chart 4). The housing market is also on much firmer footing: The homeowner vacancy rate is near all-time lows, while the quality of mortgage lending has been very high (Chart 5). Chart 4While U.S. Stocks Are Not Cheap, They Aren't In A Bubble
While U.S. Stocks Are Not Cheap, They Aren't In A Bubble
While U.S. Stocks Are Not Cheap, They Aren't In A Bubble
Chart 5Housing Fundamentals Are Solid
Housing Fundamentals Are Solid
Housing Fundamentals Are Solid
Of course, recessions can occur for reasons other than the bursting of asset bubbles. The 1973-74 recession and the recessions of the early 1980s were triggered by a surge in oil prices, requiring the Fed to hike rates aggressively. Luckily, such an oil-induced recession is highly unlikely today. Inflation expectations are better anchored, while oil consumption represents a much smaller share of GDP than it did back then (Chart 6). In addition, the U.S. has become a major oil producer, which implies that the drag to consumers from higher oil prices would be partly offset by increased capital spending in the energy sector. At any rate, the ability of shale producers to respond to higher prices with additional output limits the extent to which prices can rise in the first place. Chart 6An Oil Price Shock Is Unlikely To Cause A Recession
An Oil Price Shock Is Unlikely To Cause A Recession
An Oil Price Shock Is Unlikely To Cause A Recession
Past economic downturns have also been caused by major adjustments in the cyclical parts of the economy. As a share of GDP, cyclical spending is lower today than it has been at the outset of most recessions (Chart 7). The proliferation of just-in-time inventory systems has also reduced the influence that inventory swings have on the economy (Chart 8). Chart 7Cyclical Spending Is Not Extended
Cyclical Spending Is Not Extended
Cyclical Spending Is Not Extended
Chart 8
A severe tightening of fiscal policy can also trigger a recession.2 Fortunately, the end of the government shutdown reduces the risk of such an outcome. Rightly or wrongly, voters blamed President Trump for the recent closure (Chart 9). As we speak, the Trump administration is negotiating with Democrats to avert another shutdown slated to begin on February 15. The key item of contention concerns funding for a border wall with Mexico. Even if a deal falls through, rather than shuttering the government again, Trump will probably pursue funding for the wall by declaring a national emergency. Our geopolitical strategists believe such an action will be challenged by the Democrats, but is likely to be upheld by the Supreme Court. Chart 9''I Am Proud To Shut Down The Government''
''I Am Proud To Shut Down The Government'''
''I Am Proud To Shut Down The Government'''
Global Growth Should Improve Admittedly, the external environment now has a greater influence on the U.S. economy than in the past. Nevertheless, given that exports are only 12% of GDP, it would take a sizeable external shock to knock the U.S. into recession. We think that such a shock is not in the cards. The trade war is likely to go on hiatus as Trump seeks to take credit for a deal with China. In addition, as we discussed two weeks ago, China will scale back its deleveraging campaign now that credit growth has fallen close to nominal GDP growth (Chart 10).3 Chart 10China: Time To Scale Back Deleveraging
China: Time To Scale Back Deleveraging
China: Time To Scale Back Deleveraging
Euro area growth should reaccelerate over the coming months thanks to lower oil prices, a revival in EM demand, modestly more stimulative fiscal policy, and the palliative effects from the decline in government bond yields across the region. We have also argued that the risks of a “Hard Brexit” should abate.4 Waiting... And Waiting For Inflation To Rise When the next recession rolls around, it will probably be sparked by a surge in inflation, which forces the Fed to raise interest rates much more rapidly than it has so far. Here is the thing though: Inflation is a highly lagging indicator. It usually only peaks long after a downturn has started and troughs after the recovery is well underway (Chart 11).
Chart 11
Consider the example of the 1960s. The unemployment rate fell below NAIRU in 1964, but it took another four years for inflation to break out in earnest (Chart 12). The U.S. unemployment rate has been below NAIRU only since 2017. The unemployment rate in Germany and Japan has been below NAIRU for much longer, yet inflation remains stubbornly low in both countries (Chart 13). Chart 12It Took An Overheated Economy For Inflation To Take Off In The Late-1960s
It Took An Overheated Economy For Inflation To Take Off In The Late-1960s
It Took An Overheated Economy For Inflation To Take Off In The Late-1960s
Chart 13The U.S., Japanese, And German Economies Are At Full Employment
The U.S., Japanese, And German Economies Are At Full Employment
The U.S., Japanese, And German Economies Are At Full Employment
Cheer Up This leaves us with a striking conclusion: Perhaps the next U.S. recession is not around the corner, as some grumpy economists seem to think. Perhaps this economic expansion can endure beyond 2020. The recent U.S. data has certainly been consistent with that thesis. The ISM manufacturing index rose 2.3 percentage points to 56.6 in January. New orders jumped by 6.9 percentage points to 58.2. Payroll growth has also accelerated. Real aggregate earnings are up 4.2% from a year earlier, the fastest pace since October 2015 (Chart 14). Chart 14U.S. Labor Income Growth Has Been Accelerating
U.S. Labor Income Growth Has Been Accelerating
U.S. Labor Income Growth Has Been Accelerating
Housing data are showing tentative evidence of stabilization. New home sales are rebounding, while mortgage applications are back near cycle-highs (Chart 15). Chart 15Housing Activity Is Stabilizing After Last Year's Weakness
Housing Activity Is Stabilizing After Last Year's Weakness
Housing Activity Is Stabilizing After Last Year's Weakness
Reflecting these positive developments, the Citigroup economic surprise index has jumped into positive territory (Chart 16). The New York Fed’s estimate for Q1 2019 GDP growth has also moved up to 2.4%. Chart 16U.S. Economic Data Are Beating Low Expectations
U.S. Economic Data Are Beating Low Expectations
U.S. Economic Data Are Beating Low Expectations
Investment Conclusions Recessions and bear markets usually overlap (Chart 17). With the next recession still at least 18 months away, it is premature to turn bearish on equities. We upgraded stocks in December following the post-FOMC sell-off. Although our tactical MacroQuant model is pointing to an elevated risk of a setback over the next few weeks, we continue to see global equities finishing the year 5%-to-10% above current levels. As global growth bottoms out mid-year, the leadership role in equity markets should increasingly move away from the U.S. towards EM and Europe. Chart 17Recessions And Bear Markets Usually Overlap
Recessions And Bear Markets Usually Overlap
Recessions And Bear Markets Usually Overlap
Bonds are a tougher call. We do not expect the Fed to raise rates again at least until June. This will limit the upside for bond yields, as well as the dollar, in the near term. Nevertheless, with the fed funds futures pricing in no rate hikes for the next few years, even a modest shift back to tightening in the second half of this year and beyond will push up bond yields, dampening total returns to fixed income. Looking beyond 2019, the case for maintaining a short duration stance in fixed-income portfolios is very strong. The longer the Fed allows the economy to overheat, the greater the eventual overshoot in inflation will be. Inflation expectations have fallen over the past few months (Chart 18). They should have risen. Ultimately, Gentle Jay Powell’s decision to press the pause button on further rate hikes means that rates will end up peaking at a higher level during this cycle than they would have otherwise. Chart 18Inflation Expectations Have Declined
Inflation Expectations Have Declined
Inflation Expectations Have Declined
Peter Berezin, Chief Global Strategist Global Investment Strategy peterb@bcaresearch.com Footnotes 1 As argued in Hyman P. Minsky, “Stabilizing an Unstable Economy,” Yale University Press, (1986). 2 Severe episodes of fiscal tightening have normally followed military demobilizations. These include the recessions following WW1, WW2, and the Korean War, and to a much lesser extent, the 1990-91 recession which was exacerbated by cuts to the defense budget at the end of the Cold War. 3 Please see Global Investment Strategy Weekly Report, “China’s Savings Problem,” dated January 25, 2019. 4 Please see Global Investment Strategy Weekly Report, “Patient Jay,” dated January 18, 2019. Strategy & Market Trends MacroQuant Model And Current Subjective Scores
Chart 19
Tactical Trades Strategic Recommendations Closed Trades
Highlights Our non-consensus inflation and Fed views just got even more non-consensus: Media and sell-side commentators were quick to speculate about an end to the tightening cycle following Wednesday’s FOMC meeting, but we don’t see any basis for changing our stance. December and January have been a wild couple of months, … : It’s not unusual for a swing in one direction to be following by a swing in the other, but the S&P 500 went from the 2nd percentile in December to the 96th percentile in January. … and we’re turning to our equity checklist to regain our bearings: Checklists help us maintain a healthy distance from day-to-day swings and focus on the key swing factors. For now, we don’t think anything much has changed, but the scope for a repricing of the entire Treasury curve has gotten bigger: The wider the disparity between our terminal fed funds rate expectation and the market’s, the greater the potential for yields to readjust. We continue to believe markets are being complacent about inflation pressures; their presence will force the Fed off the sidelines and ultimately spell the end of the expansion. Feature Brutal arctic cold swept the Midwest and the Northeast Corridor last week as the polar vortex clamped down on Canada and the upper U.S. The weather didn’t do anything to cool investors’ revived ardor for stocks, however. After finally taking a break from its nearly uninterrupted four-week sprint from 2,350 to 2,670 (that’s nearly 14% in just 17 sessions), the S&P 500 hung around the 2,640 level that supported it repeatedly during its October, November and early December travails (Chart 1). Then came Wednesday’s FOMC statement and press conference, and the S&P even poked its head above the 2,700 level that would seem to present a fairly stiff challenge (Chart 2). Chart 12,640 Lent Support Once Again …
2,640 Lent Support Once Again …
2,640 Lent Support Once Again …
Chart 2... Will The Next Round Number Offer A Little Resistance?
... Will The Next Round Number Offer A Little Resistance?
... Will The Next Round Number Offer A Little Resistance?
What Goes On One minute born, one minute doomed/ One minute up, and one minute down/ What goes on in your mind?/ I think that I am falling down If the conditions were polar out of doors, they were bipolar on traders’ screens. As much as the clients we spoke with in January were initially skeptical about our inflation view (it’s not dead) and our corresponding Fed call (at least three or four more hikes in response to budding price pressures), several of them seemed to come around before the meeting was over. They had a lot harder time with the two-part investment conclusion that risk assets would rally while the Fed was on hold, and the economy and corporate profits were able to gain a footing, before rolling over once the data become strong enough to bring the Fed back off the sidelines. Why would investors buy into the temporary part one? We offered the view that the selloff had gone too far, and seemed to have been founded upon a premise that the Fed had either already tightened into a recession, or had gotten uncomfortably close to doing so. We expect that a Fed pause will reveal that the market’s neutral-rate estimate had been way too low. Once the economy shows signs of life, and consensus earnings estimates stop declining and begin to rise again, stocks will rise, spreads will compress, and investors will get back to chasing performance. The renewed fundamental vigor could even allow the Fed to hike rates another couple of times without inspiring a new bout of market indigestion. After this week, we are the ones scratching our heads. The committee’s post-meeting statement did change more than it has since the gradual, 25-bps-per-quarter pace of hikes took hold at the end of 2016, but early January’s procession of Fed speakers who repeated “patience” like a mantra already telegraphed an extended pause. We did not read all that much into the substitution of “will be patient as it determines … [appropriate] adjustments” for “some further gradual increases,” even if the media and the markets did. We will have more to say about the Fed’s balance sheet in subsequent research, but suffice it to say for now that we do not think it will be terribly impactful. Bottom Line: While we were surprised by the intensity of the reaction to last week’s FOMC meeting, it remains our view that the pause in the Fed’s monetary tightening campaign will give equities and corporate bonds an opportunity to rally near their late September levels. Checking And Re-Checking Our Views Among our favorite trading-desk maxims is the advice to plan your trade, and trade your plan. Checklists help us plan and help establish a repeatable process. Having a process to fall back on when rapid-fire decisions have to be made allows an investor to react to conditions as they arise without suffering from analysis paralysis, just like a seasoned trader. Checklists aren’t magic, but they can help an investor keep his/her bearings in the midst of market tides that seem to sweep all before them. Confronting the combination of December’s despondency and January’s euphoria, we return to the equity downgrade checklist we rolled out in mid-October, and last formally reviewed in mid-November. The checklist attempts to look out for threats on four fronts: a looming recession, which would bring the curtain down on the bull market; earnings pressure independent of a full-fledged recession; inflation pressures that could compel the Fed to tighten policy with a renewed sense of urgency; and unsustainably positive sentiment, which could set equities up for a fall. At the moment, only the recession category could arguably be said to be flashing yellow. Recession Watch All three factors in our simple recession indicator are moving in the wrong direction, but the yield curve is the only one at a potentially problematic level (Chart 3, top panel). It would not be a disaster for equities or the economy if the curve inverted – it is habitually early, inverting a year before a recession, on average, and six months before the S&P 500 peaks – but we don’t think it will until markets begin pricing in new rate hikes. Assuming the three-month rate won’t move until they do, the curve could only invert if the 10-year Treasury yield were to fall into the 2.40s (Chart 3, bottom panel), which would be incompatible with our constructive economic view. By the time the Fed resumes hiking, the curve should have gained some breathing room, as an economy strong enough to require further tightening merits a 10-year Treasury yield at or above 3%. Chart 3The Curve Isn’t Ready To Invert Just Yet
The Curve Isn’t Ready To Invert Just Yet
The Curve Isn’t Ready To Invert Just Yet
Year-over-year growth in the leading economic indicator decelerated sharply over the last three months of 2018 (Chart 4). It is a ways away from contracting, however, and only a series of hefty month-over-month drops could make it do so this quarter. Our estimate of the equilibrium fed funds rate remains 50 bps above the 2.5% target rate and our model projects that equilibrium will rise throughout the rest of the year. If its 3.25-3.5% year-end estimate is on the money, the Fed would have to hike three or four more times by year end to provide the restrictive backdrop required for a recession. Chart 4Decelerating, But Not Contracting
Decelerating, But Not Contracting
Decelerating, But Not Contracting
Checking the final item in the recession section of the checklist, a 33-basis-point rise in the three-month moving average of the unemployment rate, would require a sharp hiring slowdown and/or a significant pickup in labor force participation. The January employment report makes a drop-off in hiring appear improbable, and we are skeptical that the participation rate can keep rising in spite of the drag from retiring baby boomers. If the unemployment rate were to rise because of a rising part rate, however, it might well be more likely to extend the expansion than end it. Bottom Line: The elements of our recession indicator are deteriorating, albeit slowly. A recession may not be more than a year away, but we can’t see it occurring until the Fed turns more hawkish. Earnings Pressure We have repeatedly offered our view that the labor market is as tight as a drum in print, calls and meetings. That is good for the economy because it increases households’ ability to consume, but it will eventually squeeze profit margins and induce the Fed to remove monetary accommodation. Compensation costs shouldn’t hurt margins if they grow at or below the sum of the rate of price-level and productivity gains. If inflation grows at the Fed’s 2% target, and productivity maintains its rough 1.25% growth pace, compensation growth of 3.25% shouldn’t pose a problem, but gains exceeding 3.5% might become problematic. The total compensation series of the employment cost index ticked up to 2.9% in the fourth quarter, but an assault on 3.25-3.5% does not appear to be at hand (Chart 5). Chart 5Wages Aren’t Pressuring Margins Yet
Wages Aren’t Pressuring Margins Yet
Wages Aren’t Pressuring Margins Yet
Dollar strength is a margin headwind for any company competing with multinationals, at home or abroad. After peaking in mid-November and mid-December, the DXY index has rolled over and is back to its early October level (Chart 6). The fourth-quarter blowout in spreads had us poised to check the “rising corporate yields” box, but there’s no need following last month’s reversal (Chart 7). The savings rate has recovered enough to support spending, and there’s currently no sign that consumers are about to pull back (Chart 8). We are monitoring conditions in emerging markets for spillover into the U.S., but the dollar’s decline and the broad recovery in risk assets worldwide have taken pressure off of EM corporate and sovereign borrowers. Chart 6The Dollar's Backed Off …
The Dollar's Backed Off …
The Dollar's Backed Off …
Chart 7... And Bond Yields Have, Too
... And Bond Yields Have, Too
... And Bond Yields Have, Too
Chart 8Ready, Willing And Able
Ready, Willing And Able
Ready, Willing And Able
Bottom Line: None of our proxy indicators suggests that corporate earnings face meaningful near-term pressure, either from tighter margins or lower revenues. Inflation Pressures Inflation poses a threat to equities if it makes the Fed uncomfortable enough to pull the plug on the expansion to keep the economy from overheating, or if it makes investors uncomfortable enough to apply a significant haircut to earnings multiples. Given the Fed’s “symmetric” target, we don’t think it will get anxious about core PCE inflation unless it threatens to exceed 2.5% (Chart 9). The 10-year and 5-year-on-5-year TIPS inflation breakevens have slid in lockstep with oil prices, and are nowhere near the 2.3-2.5% range that is consistent with the Fed’s 2% core PCE target (Chart 10); they offer no hint that longer-run inflation expectations might become unanchored. CPI is the go-to inflation series for investors and the media, and with both headline and core hanging around 2%, it is well short of levels that would promote anxiety among the public (Chart 11). Chart 9Realized Inflation Remains Contained …
Realized Inflation Remains Contained …
Realized Inflation Remains Contained …
Chart 10... And Expectations Have Only Fallen
... And Expectations Have Only Fallen
... And Expectations Have Only Fallen
Chart 11Nothing To See Here
Nothing To See Here
Nothing To See Here
Bottom Line: We expect that unnecessary fiscal stimulus and an extremely tight labor market will eventually produce inflation, but they’re not testing investors’ complacency yet. Overexuberance Runaway sentiment could spark a nasty correction if it sets the bar for expectations so high that stocks inevitably disappoint. BCA’s composite sentiment indicator, which aggregates the results from surveys of individual investors, professional investors and advisors, is at the lower end of its range, though not yet at levels that have often marked equity bottoms (Chart 12, bottom panel). Before falling with the S&P 500 last January, the share of consumers expecting stock prices to rise over the next twelve months had reached a level consistent with past peaks (Chart 13, bottom panel). It has since fallen to the lower end of its range, and would seem to suggest that investors had nearly given up on stocks when the January survey was taken. Chart 12Investor Sentiment Is Muted …
Investor Sentiment Is Muted …
Investor Sentiment Is Muted …
Chart 13... And So Is The General Public’s
... And So Is The General Public’s
... And So Is The General Public’s
Bottom Line: The fourth-quarter decline pushed investor sentiment from around the higher reaches of its historical range to a position well below the mean. From a contrarian perspective, washed-out sentiment could help extend the rally. Investment Implications Our equity downgrade checklist gives U.S. equities a clean bill of health. Although potential gains are lower now with the S&P 500 trading above 2,700 than they were when it was trading below 2,500 at the beginning of the year, we do not see a fundamental reason to downgrade equities from overweight. The multiple expansion required to produce a new closing high might be a stretch, but we believe the S&P 500 can advance well into the 2,800s. We upgraded corporate credit last week, and expect that spreads will narrow as the Fed stays on the sidelines. One should not expect new tights in spreads, but there is potential for investors to augment their coupon spreads with some modest capital appreciation. We dislike Treasuries, especially at longer maturities, even more than we did before last week’s bull flattening of the yield curve. With rate hikes fully priced out, the only way the 10-year Treasury yield could fall even further would be if the Fed cut rates, and that scenario is flatly incompatible with our assessment of the economy’s strength. Doug Peta, Senior Vice President U.S. Investment Strategy dougp@bcaresearch.com
Highlights So What? A 70% tax on Americans with income over $10 million is not far-fetched. Why? The median U.S. voter wants higher taxes on the wealthy; Both populism and geopolitics make it impossible to cut spending; The next recession, no matter how shallow, will elicit unconventional policy. Feature The New Year has brought a chill to the investment community. No, it is not the weather, but rather a proposal by U.S. Congresswoman Alexandria Ocasio-Cortez (AOC) to create a new top-income bracket, starting at $10,000,000, that would be taxed at 70%. The reaction to the self-described Democratic Socialist has been swift. Her strategy of soaking the rich would not work, would cause an exodus of job-creators out of the U.S., and would slow down the pace of growth. A CNBC headline screamed: “The super rich at Davos are scared of Alexandria Ocasio-Cortez’s proposal to hike taxes on the wealthy.”1 In these pages, we are not going to discuss the merits of the proposal, although it would not raise enough revenue to fund the Democrats’ other policy proposals. Instead, we are going to forecast that Representative Ocasio-Cortez will get what she wants. Within our investment horizon. Probably following the next recession, which is nigh. However, how she gets what she wants will ultimately matter more than what the tax rate is on every dollar over $10,000,000 of income. The Median American Voter Since before the 2016 U.S. election and the Brexit vote, we have argued that the Median Voter is moving to the Left, particularly in the laissez-faire economies of the U.S. and the U.K. These two Anglo-Saxon economies swerved most enthusiastically to the right of the economic spectrum during the 1980 supply-side revolutions. They embraced both neo-liberal economic policy and globalization. While these reforms allowed them to outperform their less enthusiastically capitalist peers on a number of measures of economic performance, they also produced higher income inequality and a slower pace of social mobility (Chart 1). Over time, and particularly following the 2008 Great Recession, this pernicious mix of factors produced a surge in populism.
Chart 1
There has been plenty of evidence that our view is on track. Take for example the performance of the über-left leaning Labour Party in the U.K.’s 2017 election or the breakdown of the Washington Consensus on global trade. Still, many clients have resisted our thesis. This is because President Trump did manage to push a sweeping supply-side tax cut through Congress in 2017. Given that we forecast that Republicans would get their way on tax cuts, our clients were left wondering how our thesis of a shift to the left could coexist with a Reagan-esque lowering of tax rates? The answer is that the move of the Median Voter to the left is a structural geopolitical view. A tax cut policy in 2017 was a tactical/cyclical view that deviated from the long-term trend. Trump was a candidate who promised faster economic growth while the Republican Party was a political machine that sought a low tax regime as a matter of policy and ideology. We expected the GOP, and House leader Paul Ryan, to use the Trump presidency as a way to get one last tax cut while they had control. However, since the tax cuts were passed, much has gone awry for America’s center-right party. First, the Democrats campaigned enthusiastically against the tax cuts in the midterm elections. On the other side of the aisle, Republican members of Congress quickly found out that they got no applause from constituents for their signature piece of legislation. The tax cut therefore disappeared from GOP messaging ahead of the November 2018 election. Steve Bannon, Trump’s political strategist, had apparently predicted this outcome when he cautioned against cutting tax rates for the top income bracket. He suggested a hike on taxes for the wealthy to boost Trump’s populist credentials. (Bannon’s proposal was for a 44% rate on those who earn income over $5,000,000, mathematically on the path towards Ocasio-Cortez’s end-point!).2 Second, the Republicans went on to lose their majority in the House. Granted, presidents usually lose their first midterm. However, with unemployment at 3.7% last November and the economy clocking in at a 3% clip, the GOP had a clear upper hand on economic messaging. And yet it did not avert major losses. The commentary from the right is that the Democrats are going to dig their own grave with their increasingly “Socialist” talk. But will they? We present three reasons that suggest that Ocasio-Cortez (and, ironically, Steve Bannon) are going to get what they want. Income taxes in America will rise over the next decade. Reason #1: The Median Voter Wants Higher Taxes On The Wealthy There is nothing sacred in politics. A society’s volonté générale swings like a pendulum between thesis and antithesis. The idea that Americans embody the laissez-faire spirit, while the French are socialists, is simply a product of linear extrapolation based on the timeline of a single generation.3 Chart 2 suggests a different story. As recently as the early 1970s, the U.S. and France were like peas in a pod when it came to income distribution, while the U.K. – the epicenter of the supply-side revolution — was the most redistributive Western economy. Chart 2France Was Once Less Socialist Than America!
France Was Once Less Socialist Than America!
France Was Once Less Socialist Than America!
Today, Americans are much more in line with AOC than with Paul Ryan, which is why only one of the two has a job in the U.S. Congress. Ryan knew when to take his winnings and go home. According to a poll published merely weeks after AOC’s proposal, 59% of Americans support the 70% marginal tax rate. Democrats support the idea at a 71% clip, which suggests that Ocasio-Cortez is not on the fringes of the party. Independents support it at 60% and even 45% of registered Republicans support the idea. One could argue that the much-cited poll above is merely a flash in the pan, that it signifies nothing. We disagree for two reasons. First, if 60% of Americans – including 45% of Republicans – support a 70% tax rate now, when the economy is firing on all cylinders, GDP growth is above potential, and unemployment is at 3.9%, what will they support 12-36 months from now, when the inevitable recession hits? Or when America’s indebted corporations begin to deleverage by shedding jobs because they took on massive debts in order to buy back equities and return value to shareholders (which, completely coincidentally, includes senior management)? Second, there is evidence that a majority of Americans has thought that “upper-income people” have not been paying their fair share for some time now. A Gallup poll run since the early 1990s shows that the sentiment for higher taxes on upper-income individuals is off its lows in 2010 (Chart 3). We are still far from the early 1990s highs, but the trajectory of the public opinion is clearly going in the Left’s direction and has always hovered around the 60% mark.
Chart 3
Bottom Line: It seems like ages ago that Grover Norquist, the anti-tax advocate, dominated the hallways of Congress, prodding legislators into pledging to “oppose any and all efforts to increase the marginal tax rate for individuals and businesses.” As recently as the 2012 election, 238 out of 242 House Republicans and 41 out of 47 Senate Republicans signed Norquist’s “Taxpayer Protection Pledge.” We subscribe to the theory that the median voter is the price maker in the political marketplace, the politician is the price taker. Trump and Ocasio-Cortez are merely vessels for the expression of the volonté générale, the median voter’s policy preference. And that preference runs counter to Norquist’s activism and the GOP’s tax cut policy in 2017. Reason #2: History Is On Ocasio-Cortez’s Side Chart 4 has already made the rounds, suggesting that Ocasio-Cortez is not making a ludicrous proposal given that the U.S. already had much higher marginal tax rates on top incomes in the past. Critics accuse her of simplifying history without considering context.
Chart 4
This is an important point. First, defense spending as a percent of GDP was at 37.5% in 1945 and still at an elevated 7.4% in 1965, twenty years later. The U.S. exited World War II and then almost immediately stumbled into two major conflicts, one on the Korean Peninsula and one in Vietnam. Meanwhile, the Cold War competition with the Soviet Union created an existential threat that had to be resisted on land, sea, and space, justifying higher tax rates. Second, while the U.S. did indeed cut its top marginal rates throughout the second half of the century, so did everyone else! Chart 5 shows that the rest of the Western world was largely in lock-step with the U.S. In fact, it was the U.S. that came down to French levels of taxation (!!!) throughout 1960s and 1970s (again, remember Chart 2).
Chart 5
As such, Chart 4 by itself is not a reason to excuse higher marginal rates. Of course we are completely disinterested in the merits of the policy. We are merely trying to forecast it. And Chart 4 does help us do so for two reasons. First, the key achievement of the Tax Cuts And Jobs Act of 2017 was the corporate tax cut to 21%. There is some bipartisan support for this policy, at least in the center of the Democratic Party (President Obama tried to cut the corporate tax rate from 35% to 28% in 2012). The last time corporate tax rates were this low, however, the top marginal income tax rate was at 79%. As such, we think that a bipartisan consensus could emerge on keeping corporate tax cuts at or below the OECD average of 24%, but at the cost of higher marginal tax rates for high-income earners. Second, it has been a key structural view of BCA’s Geopolitical Strategy, since inception, that the defining geopolitical feature of the twenty-first century will be the Sino-American conflict. If we are right on this issue, then perhaps an “existential conflict” to justify higher taxes on elites is already here. In other words, it is a fact that global challenges have required the U.S. to tax households and corporations at a higher rate in the past. It is also a fact that the U.S. faces greater global challenges today, specifically with China and Russia, than at anytime since the Cold War. Thus, while AOC may not be motivated by geopolitics, she may represent one aspect of a growing public policy consensus nonetheless. Simply put, with the U.S. facing both populism and geopolitical multipolarity, there is simply no political option for cutting either defense or non-defense spending. The only question is whether the U.S. will simultaneously shore up its ability to service its debts and maintain a reliable currency. AOC may find unlikely allies as geopolitical competition heats up. Reason #3: Policymakers Will Overreact To The Next Recession President Trump was elected in November 2016, with the recession having ended 88 months prior, with the unemployment rate down 5.6%, and the economy on the path to recovery. But his economic populist message resonated with a lot of voters who did not participate in that recovery. Our concern is that the next recession is close at hand. BCA’s House View is that the next recession will be relatively shallow in the U.S., in part because there aren’t any obvious bubbles. For one, cyclical spending as a percent of GDP is at mid-cycle levels (Chart 6). Corporate debt is elevated, but not by international standards (Chart 7). U.S. banks are in a much sounder position than in 2007. So, from a macroeconomic perspective, the next recession is nothing to fear. Chart 6Are We Even Mid-Cycle Yet?
Are We Even Mid-Cycle Yet?
Are We Even Mid-Cycle Yet?
Chart 7Corporate Debt Load Is Not Excessive
Corporate Debt Load Is Not Excessive
Corporate Debt Load Is Not Excessive
Policymakers, however, don’t care about macroeconomics. They care about the policy preferences of the Median Voter. And if that Median Voter elected an anti-establishment populist during relatively good times, who will he or she support when unemployment is high? Whoever is running the U.S. when the next recession happens, they will not wait around to find out. Unorthodox monetary, fiscal, and yes tax policy will overshoot norms and conventions regardless of how shallow the recession is. All bets are off at that point since policymakers will have a “recency bias” due to the trauma of 2008. While the recession may be shallow, the budget deficit will likely be at an elevated level. The U.S. is currently engaged in the first pro-cyclical economic stimulus since the late 1960s (Chart 8). This means that the recession will likely hit with the budget deficit already at around 5%-6% of GDP, compared to just 3%-4% when the last recession occurred. Given that the last four recessions raised the U.S. budget deficit by an average of 5% of GDP, it is safe to say that the U.S. budget deficit may rise to 2010 levels after the next downturn, regardless of how shallow the recession is. Chart 8Budget Deficits Will Be Very High In The Next Recession
Budget Deficits Will Be Very High In The Next Recession
Budget Deficits Will Be Very High In The Next Recession
As with the Great Recession, the public will demand that the government deals with the deficit. Unlike in the post-2008 environment, however, we think that the Median Voter will abandon the Norquist and Tea Party thesis of cutting spending and adopt the view that higher income brackets should see their taxes increased. That said, extremely high marginal rates at $10,000,000 will impact very few individuals and thus have a negligible revenue impact. What about higher marginal rates across the board? Chart 9 illustrates the evolution of marginal tax rates, using 2012 dollars for income brackets, across decades. The 1950s, 1960s, and 1970s saw multiple tax brackets, all with progressively higher marginal tax rates. In the 1970s, the 70% tax rate started at $460,000 in 2012 dollars, but a 50% rate began at $100,000 in 2012 dollars.
Chart 9
The question for investors is whether Ocasio-Cortez’s proposal is merely a branding exercise. A 70% tax rate that begins at $10,000,000 – Option 1 on Diagram 1 – is largely irrelevant, macroeconomically and politically. But if that is an end point of a curve, that is something that investors will want to know. This is because policymakers could draw those curves either by cutting lower-class and middle-class marginal rates – such as in Option 2 – or by simply replicating the 1970s curve, such as in Option 3. The impact of new taxes on the part of society with a higher marginal propensity to consume is an important consideration for policymakers recovering from a recession. Diagram 1Is Ocasio-Cortez’s Proposal An End Point Of A Curve Or Just A Branding Exercise?
Why Ocasio-Cortez Will Get What She Wants
Why Ocasio-Cortez Will Get What She Wants
At the moment, investors are probably not overly concerned about these issues. Options 2 and 3 look unlikely in the current political environment. But, again, they have been acceptable policy options in the past and could be revived if the Democratic Party decides to make income inequality the central issue of the 2020 election. Which makes the 2020 election the most significant U.S. election in a generation. Will Trump-style populism succeed or will Democratic Socialism emerge in the United States? At the moment, most of our clients would likely guess that trade and immigration – policy issues from 2016 – will dominate the debate again in 2020. This is likely incorrect linear extrapolation. Rarely do the same issues carry over from one election to another. As such, a left-leaning presidential candidate could push the Trump administration on its tax reform package and the continued growing income inequality, despite a falling unemployment rate. Throw in a potential recession and you have a witch’s brew. Not only would the rhetoric alarm the markets, but so would the electoral math. Democrats have a solid House majority while Republicans are clinging to a small Senate majority in a year when the electoral math clearly works in Democrats’ favor (20 out of 33 Senate seats up for reelection are held by the GOP). We are not ready to give a high conviction forecast on the presidential election – other than to say that a recession will virtually ensure Trump’s loss – but we do have a high conviction that whoever wins the White House in 2020 will also carry the Senate. As such, a Democratic sweep of both the White House and Congress is a possible scenario. At that point, the Options from Diagram 1 will no longer be an academic question. Finally, even if Trump emerges victorious, he may still have to agree with a Democratic Congress to modify his tax cuts in order to pay for his border wall, immigration reform, and a national infrastructure package. In that case, the median voter would have established the long-term bottom of U.S. tax rates even without a change in political parties. Marko Papic, Senior Vice President Chief Geopolitical Strategist marko@bcaresearch.com Footnotes 1 Please see CNBC Markets, “The super rich at Davos are scared of Alexandria Ocasio-Cortez’s proposal to hike taxes on the wealthy,” dated January 22, 2018, available at cnbc.com. 2 Please see “Steve Bannon’s Plan to Raise Taxes on the Rich? Not Happening,” Fortune, dated July 31, 2017, available at fortune.com. 3 Also known as stereotyping.
Dear Client, In lieu of next week’s report, I will be hosting a webcast on Wednesday, January 9th at 10 AM EST, when I will be discussing the economic and financial market outlook for 2019 and answering your questions. Best regards, Peter Berezin, Chief Global Strategist Highlights The lack of major financial and economic imbalances in the U.S., as well as the Fed’s ability to moderate the pace of rate hikes, reduce the risk of a vicious cycle where tighter financial conditions lead to slower economic growth and even tighter financial conditions. The scope for central banks to cut rates is more limited outside the United States. Imbalances are also greater abroad. Nevertheless, the news is not all bleak, with the recent rebound in China’s credit impulse being a case in point. We turned more bullish on risk assets following December’s post-FOMC equity sell-off. A moderately overweight position in global equities over a 12-month horizon is currently justified. While we continue to favor the U.S. over other bourses in dollar terms, our conviction level in this regional bias has decreased. Treasury yields are likely to rise in an environment where U.S. growth is strong enough to enable the Fed to continue raising rates. Outside Japan, global government bond yields will also increase in 2019. We are removing our long June-2019 Fed funds futures contract hedge, and we are now solely outright short the December-2020 contract. We are also taking profits on our March-2019 EEM ETF put for a gain of 104%. Feature Merry Crisis And A Happy New Fear Santa arrived early this year. The plunge in stocks allowed investors to buy some of the world’s premier companies at a mouthwatering 20%-to-30% discount to what they would have paid just a few months earlier. What a gift! Needless to say, most investors would not regard last month’s stock market performance in such a favorable light. But why not? One answer is that investors must mark their portfolios to market. Thus, even if the decline in equity prices raised future returns, it still implied a decline in present net worth. Yet, this cannot be the whole explanation, because if all investors expected stocks to bounce back quickly, they would not have sold in the first place. Clearly, many investors must have come to the conclusion that the stock market would not only go down but stay down. However, this presents a puzzle. The economic environment did not change that much in the weeks leading up to the October sell-off. Growth has slowed more recently (Chart 1), with this morning’s disappointing ISM manufacturing report being the latest example, but this appears to have been mainly a response to the souring market climate rather than the cause of it. Chart 1Tighter Financial Conditions Have Led To Slower Growth
Tighter Financial Conditions Have Led To Slower Growth
Tighter Financial Conditions Have Led To Slower Growth
Reverse Causality? This raises an intriguing possibility: What if the drop in stock prices and jump in credit spreads that began in late September hurt expectations of economic growth by enough to justify a further discount in risk asset valuations? Such a “Financial Conditions Index (FCI) doom loop” is not just a theoretical construct. The last two U.S. recessions were both the products of burst asset bubbles — first the dotcom bubble and then the housing bubble. Could such a self-fulfilling vicious cycle be erupting again? If so, any rally in stocks or credit should be sold into, just as was the case in both 2001 and 2007. U.S. Fairly Resilient To A Doom Loop Fortunately, there are two reasons to think that such an outcome will not reoccur, at least not in the United States. First, as Box 1 explains, an FCI doom loop is more likely to unfold when economic growth becomes very sensitive to changes in financial conditions. This normally happens when economic and financial imbalances are elevated. That does not appear to be the case today. Unlike in the lead-up to the last two recessions, the U.S. private sector is a net saver whose income outstrips spending by 2.1% of GDP (Chart 2). Cyclical spending – the sum of residential investment, business capex, and expenditures on consumer durable goods – is also far below prior business-cycle peaks as a share of GDP (Chart 3). Chart 2The U.S. Private Sector Is A Net Saver
The U.S. Private Sector Is A Net Saver
The U.S. Private Sector Is A Net Saver
Chart 3U.S. Economy: Cyclical Spending Is Still Restrained
U.S. Economy: Cyclical Spending Is Still Restrained
U.S. Economy: Cyclical Spending Is Still Restrained
Despite recent releveraging in some categories, U.S. household debt has continued to decline in relation to the size of the economy. The ratio of personal debt-to-disposable income is now 34 percentage points below pre-crisis levels (Chart 4). Chart 4Household Leverage Is Below Its Peak
Household Leverage Is Below Its Peak
Household Leverage Is Below Its Peak
U.S. corporate debt has moved in the opposite direction. Nevertheless, while the ratio of U.S. corporate debt-to-GDP has climbed to a record high, it is still quite low by global standards (Chart 5). Perhaps more importantly, corporate debt is generally held by non-leveraged institutions. If corporate defaults were to rise unexpectedly, the losses to lenders would not pose the same systemic risk to the financial sector as mortgage defaults did during the Global Financial Crisis. Chart 5U.S. Corporate Debt Is High, But It Is Higher Elsewhere
U.S. Corporate Debt Is High, But It Is Higher Elsewhere
U.S. Corporate Debt Is High, But It Is Higher Elsewhere
The Fed’s Reaction Function It is not surprising that the stock market sell-off accelerated in early October following Fed Chairman, and failed golfer, Jay Powell’s comment that interest rates were “far from neutral.” We think that worries that the Fed will tighten too quickly are misplaced. Yes, monetary policy operates with “long and variable lags.” However, financial conditions, which lead growth, can be observed in real time (Chart 6). Chart 6Global Financial Conditions Have Tightened
Global Financial Conditions Have Tightened
Global Financial Conditions Have Tightened
Most of the tightening in financial conditions since late September has been due to falling equity prices. Our baseline scenario envisions a gain of roughly 10% in the S&P 500 in 2019. A rebound in stocks of this magnitude will reverse most of the recent FCI tightening, thereby allowing the Fed to raise rates three times this year. But if equities continue to sag, the Fed will scale back further monetary tightening or even cut rates. The mere possibility of such a policy response reduces the odds of an FCI doom loop. A Mixed Bag Outside The U.S. The economic outlook is murkier outside the United States. Economic and financial imbalances are greater in the EM space and parts of Europe. Non-U.S. central banks also have less scope to respond to adverse shocks, either because of fears that looser monetary policy will spark capital outflows (as is the case in many emerging markets) or because of the presence of the zero-bound constraint on interest rates (as is the case in the euro area and Japan). Nevertheless, the situation is not that bad. EM assets have been fairly resilient over the past few months, at least in comparison to their developed economy counterparts (Chart 7). China’s credit impulse has actually perked up, an indication that while credit growth is falling, it is doing so at a slower pace. Chart 8 shows that the Chinese credit impulse is highly correlated with global industrial commodity prices. We still expect global growth to slow in the first half of 2019, but at this point, much of the slowdown has been discounted in asset markets. With that in mind, we are raising the stop on our short AUD/JPY trade to 10% and instituting a profit target of 15%. Chart 7EM Assets Have Been Outperforming Recently
EM Assets Have Been Outperforming Recently
EM Assets Have Been Outperforming Recently
Chart 8The Increase In China's Credit Impulse Bodes Well For Industrial Commodity Prices
The Increase In China's Credit Impulse Bodes Well For Industrial Commodity Prices
The Increase In China's Credit Impulse Bodes Well For Industrial Commodity Prices
The Perils Of Discrete Decision-Making One of the annoyances of being an investment strategist is that you often feel compelled to take discrete views on where the markets are heading. Are you bullish, bearish, or neutral? Actually, it is usually just bullish or bearish because most people regard neutral views as lacking in conviction and insight. This incentive structure is counterproductive. Not only does it cause analysts to turn a blind eye to incoming data that may challenge their thesis, it disregards how professional investors actually operate. Successful investors scale into positions as the market gets cheaper and scale out as it becomes more expensive. Trying to time the bottom (or the top) with exact precision is futile. With that in mind, we are going to tweak the way we make recommendations going forward in order to improve transparency, accountability, and accuracy. Rather than simply stating whether we are bullish, bearish, or neutral, we will assign the main asset classes a subjective score between zero and one hundred, with 0-to-40 being bearish, 40-to-60 being neutral, and 60-to-100 being bullish. We will adjust the score in every publication. To add analytic rigor to this framework, we will also compare our subjective model score with that of our MacroQuant model. Where Things Now Stand We downgraded global equities last June, but moved back to overweight following December’s post-FOMC meeting sell-off, as valuations reached that rather blurry line at which a modest equity overweight was warranted. Our subjective score for global equities currently stands at 65%, above the model’s estimate of 50%. Our moderately bullish view reflects our expectation that global growth will stabilize by mid-year and monetary policy will remain accommodative, even if the Fed raises rates by more than what the markets are currently discounting. Tempering our enthusiasm is the recognition that the business cycle is getting long in the tooth – especially in the U.S. – and that global equity valuations, while far cheaper than they were a few months ago, are still significantly less favorable than they were near past market bottoms (Chart 9). Chart 9Global Equity Valuations Have Improved
Global Equity Valuations Have Improved
Global Equity Valuations Have Improved
Regionally, we continue to favor U.S. stocks over other developed markets, and DM over EM more broadly. However, our conviction level on this view is not high, and we are prepared to revise it if it looks like global growth is accelerating, an outcome that would limit any further dollar strength (our subjective dollar score currently stands at 70%, below the model’s estimate of 92%). Reflecting our expectation of decent global equity returns in 2019 and our waning conviction to be underweight EM, we are taking profits on in our March-2019 EEM ETF put for a gain of 104%. Please note that our view on EM is more optimistic than that of Arthur Budaghyan, BCA’s chief emerging markets strategist, who continues to see considerable downside risks to EM assets. For now, Treasury yields are likely to rise in an environment where U.S. growth is strong enough to enable the Fed to continue raising rates. We assign the 10-year yield a score of 30%, which is close to our model estimate of 32%. Accordingly, we are removing our long June-2019 Fed funds futures contract hedge, and we are now solely outright short the December-2020 contract. Core European bond yields will increase, reflecting diminished excess capacity in the euro area and the end of ECB net asset purchases. U.K. yields should also grind higher, as the odds of a soft Brexit (or no Brexit) improve. Only in Japan will yields remain contained, thanks to the BoJ’s ongoing yield curve control regime. We do not expect spread product to have a banner year, but the current yield pick-up should be sufficient to ensure that risky credit outperforms cash. Peter Berezin, Chief Global Strategist Global Investment Strategy peterb@bcaresearch.com Box 1 The Analytics Of Doom Loops When will a tightening in financial conditions stemming from lower equity prices and higher borrowing costs lead to a vicious circle of slower economic growth and even tighter financial conditions? The answer depends on how sensitive economic growth is to financial conditions in relation to how sensitive financial conditions are to growth. Figure 1 shows two equilibrium schedules, one for the economy (EE) and one for asset markets (AA). Both schedules slope downward. The EE schedule is downward-sloping because easier financial conditions boost growth. If growth is too strong given the prevailing level of financial conditions, economic activity will slow (Panel A). The AA schedule is downward-sloping because equity prices tend to fall and credit spreads rise when growth slows. If equity prices are too high and credit spreads are too narrow for a certain level of growth, then financial conditions will tighten (Panel B). Suppose economic growth is not very sensitive to changes in financial conditions, perhaps because imbalances in the economy are limited (Panel C). Then changes in financial conditions will be fleeting: A decline in equity prices or a widening in credit spreads will not hurt growth very much, allowing the stock market and credit market to quickly normalize. In contrast, suppose that economic growth is very sensitive to financial conditions, so much so that the EE schedule is flatter than the AA schedule. In this case, the economy will be vulnerable to self-reinforcing booms and busts (Panel D). In particular, a small random jump from U to UI will send the economy careening towards a doom loop of ever-weaker growth and tighter financial conditions.
Chart 10
Strategy & Market Trends MacroQuant Model And Current Subjective Scores
Chart 11
Tactical Trades Strategic Recommendations Closed Trades
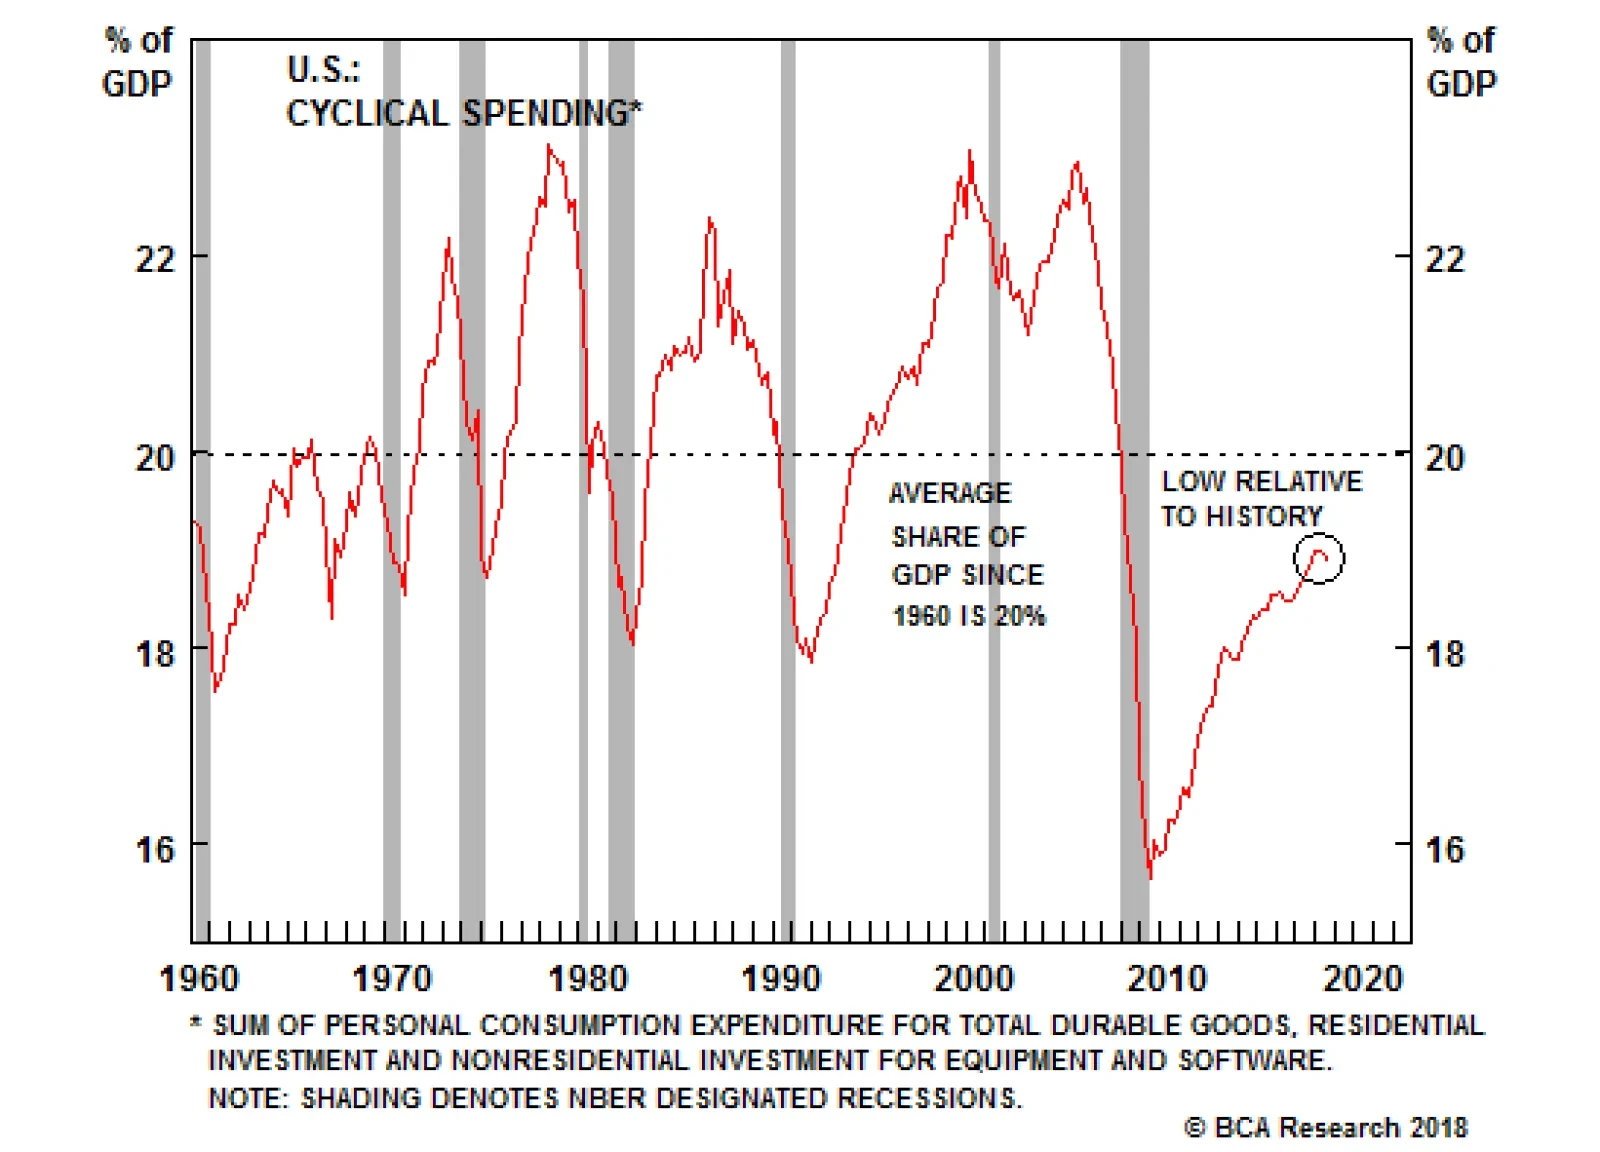
One of my favorite recession indicators is the percent of cyclical spending as a share of GDP. Cyclical spending includes corporate investment, residential investment, and consumer spending on durables. The chart above shows that when cyclical spending…
Mr. X and his daughter, Ms. X, are long-time BCA clients who visit our office toward the end of each year to discuss the economic and financial market outlook. This report is an edited transcript of our recent conversation. Mr. X: I have been eagerly looking forward to this meeting given the recent turbulence in financial markets. Our investments have done poorly in the past year and, with hindsight, I wish I had followed my instincts to significantly cut our equity exposure at the end of 2017, although we did follow your advice to move to a neutral stance in mid-2018. I remain greatly troubled by economic and political developments in many countries. I have long believed in open and free markets and healthy political discourse, and this all seems under challenge. As always, there is much to talk about. Ms. X: Let me add that I also am pleased to have this opportunity to talk through the key issues that will influence our investment strategy over the coming year. As I am sure you remember, I was more optimistic than my father about the outlook when we met a year ago but things have not worked out as well as I had hoped. In retrospect, I should have paid more attention to your view that markets and policy were on a collision course as that turned out to be a very accurate prediction. When I joined the family firm in early 2017, I persuaded my father that we should have a relatively high equity exposure and that was the correct stance. However, this success led us to maintain too much equity exposure in 2018, and my father has done well to resist the temptation to say “I told you so.” So, we are left with a debate similar to last year: Should we move now to an underweight in risk assets or hold off on the hope that prices will reach new highs in the coming year? I am still not convinced that we have seen the peak in risk asset prices as there is no recession on the horizon and equity valuations are much improved, following recent price declines. I will be very interested to hear your views. BCA: Our central theme for 2018 that markets and policy would collide did turn out to be appropriate and, importantly, the story has yet to fully play out. The monetary policy tightening cycle is still at a relatively early stage in the U.S. and has not even begun in many other regions. Yet, although it was a tough year for most equity markets, the conditions for a major bear market are not yet in place. One important change to our view, compared to a year ago, is that we have pushed back the timing of the next U.S. recession. This leaves a window for risk assets to show renewed strength. It remains to be seen whether prices will reach new peaks, but we believe it would be premature to shift to an underweight stance on equities. For the moment, we are sticking with our neutral weighting for risk assets, but may well recommend boosting exposure if prices suffer further near-term weakness. We will need more clarity about the timing of a recession before we consider aggressively cutting exposure. Mr. X: I can see we will have a lively discussion because I do not share your optimism. My list of concerns is long and I hope we have time to get through them all. But first, let’s briefly review your predictions from last year. BCA: That is always interesting to do, although sometimes rather humbling. A year ago, our key conclusions were that: The environment of easy money, low inflation and healthy profit growth that has been so bullish for risk assets will start to change during the coming year. Financial conditions, especially in the U.S., will gradually tighten as decent growth leads to building inflationary pressures, encouraging central banks to withdraw stimulus. With U.S. equities at an overvalued extreme and investor sentiment overly optimistic, this will set the scene for an eventual collision between policy and the markets. The conditions underpinning the bull market will erode only slowly which means that risk asset prices should continue to rise for at least the next six months. However, long-run investors should start shifting to a neutral exposure. Given our economic and policy views, there is a good chance that we will move to an underweight position in risk assets during the second half of 2018. The U.S. economy is already operating above potential and thus does not need any boost from easier fiscal policy. Any major tax cuts risk overheating the economy, encouraging the Federal Reserve to hike interest rates and boosting the probability of a recession in 2019. This is at odds with the popular view that tax cuts will be good for the equity market. A U.S. move to scrap NAFTA would add to downside risks. For the second year in a row, the IMF forecasts of economic growth for the coming year are likely to prove too pessimistic. The end of fiscal austerity has allowed the Euro Area economy to gather steam and this should be sustained in 2018. However, the slow progress in negotiating a Brexit deal with the EU poses a threat to the U.K. economy. China’s economy is saddled with excessive debt and excess capacity in a number of areas. Any other economy would have collapsed by now, but the government has enough control over banking and other sectors to prevent a crisis. Growth should hold above 6% in the next year or two, although much will depend on how aggressively President Xi pursues painful reforms. The market is too optimistic in assuming that the Fed will not raise interest rates by as much as indicated in their “dots” projections. There is a good chance that the U.S. yield curve will become flat or inverted by late 2018. Bonds are not an attractive investment at current yields. Only Greece and Portugal have real 10-year government bond yields above their historical average. Corporate bonds should outperform governments, but a tightening in financial conditions will put these at risk in the second half of 2018. The Euro Area and Japanese equity markets should outperform the U.S. over the next year reflecting their better valuations and more favorable financial conditions. Developed markets should outperform the emerging market index. Historically, the U.S. equity market has led recessions by between 3 and 12 months. If, as we fear, a U.S. recession starts in the second half of 2019, then the stock market would be at risk from the middle of 2018. The improving trend in capital spending should favor industrial stocks. Our other two overweight sectors are energy and financials. The oil price will be well supported by strong demand and output restraint by OPEC and Russia. The Brent price should average $65 a barrel over the coming year, with risks to the upside. We expect base metals prices to trade broadly sideways but will remain highly dependent on developments in China. Modest positions in gold are warranted. Relative economic and policy trends will favor a firm dollar in 2018. Unlike at the start of 2017, investors are significantly short the dollar which is bullish from a contrary perspective. Sterling is quite cheap but Brexit poses downside risks. The key market-relevant geopolitical events to monitor will be fiscal policy and mid-term elections in the U.S., and reform policies in China. With the former, the Democrats have a good chance of winning back control of the House of Representatives, creating a scenario of complete policy gridlock. A balanced portfolio is likely to generate average returns of only 3.3% a year in nominal terms over the next decade. This compares to average returns of around 10% a year between 1982 and 2017. As already noted, the broad theme that policy tightening – especially in the U.S. – would become a problem for asset markets during the year was supported by events. However, the exact timing was hard to predict. The indexes for non-U.S. developed equity markets and emerging markets peaked in late-January 2018, and have since dropped by around 18% and 24%, respectively (Chart 1). On the other hand, the U.S. market, after an early 2018 sell-off, hit a new peak in September, before falling anew in the past couple of months. The MSCI All-Country World index currently is about 6% below end-2017 levels in local-currency terms. Chart 1Our 'Collision Course' Theme For 2018 Played Out
Our 'Collision Course' Theme For 2018 Played Out
Our 'Collision Course' Theme For 2018 Played Out
We started the year recommending an overweight in developed equity markets but, as you noted, shifted that to a neutral position mid-year. A year ago, we thought we might move to an underweight stance in the second half of 2018 but decided against this because U.S. fiscal stimulus boosted corporate earnings and extended the economic cycle. Our call that emerging markets would underperform was on target. Although it was U.S. financial conditions that tightened the most, Wall Street was supported by the large cut in the corporate tax rate while the combination of higher bond yields and dollar strength was a major problem for many indebted emerging markets. Overall, it was not a good year for financial markets (Table 1). Table 1Market Performance
OUTLOOK 2019: Late-Cycle Turbulence
OUTLOOK 2019: Late-Cycle Turbulence
As far as the overall macro environment was concerned, we were correct in predicting that the IMF was too pessimistic on economic growth. A year ago, the IMF forecast that the advanced economies would expand by 2% in 2018 and that has since been revised up to 2.4% (Table 2). This offset a slight downgrading to the performance of emerging economies. The U.S., Europe and Japan all grew faster than previously expected. Not surprisingly, inflation also was higher than forecast, although in the G7, it has remained close to the 2% level targeted by most central banks. Table 2IMF Economic Forecasts
OUTLOOK 2019: Late-Cycle Turbulence
OUTLOOK 2019: Late-Cycle Turbulence
Despite widespread fears to the contrary, the data have supported our view that Chinese growth would hold above a 6% pace in 2018. Nevertheless, a slowdown currently is underway and downside risks remain very much in place in terms of excessive credit and trade pressures. Another difficult year lies ahead for the Chinese authorities and we will no doubt return to this topic later. As far as our other key forecasts are concerned, we were correct in our views that oil prices and the U.S. dollar would rise and that the market would be forced to revise up its predictions of Fed rate hikes. Of course, oil has recently given back its earlier gains, but we assume that is a temporary setback. On the sector front, our macro views led us to favor industrials, financials and energy, but that did not work out well as concerns about trade took a toll on cyclical sectors. Overall, there were no major macro surprises in 2018, and it seems clear that we have yet to resolve the key questions and issues that we discussed a year ago. At that time, we were concerned about the development of late-cycle pressures that ultimately would undermine asset prices. That story has yet to fully play out. It is hard to put precise timing on when the U.S. economy will peak and, thus, when asset prices will be at maximum risk. Nevertheless, our base case is that there likely will be a renewed and probably final run-up in asset prices before the next recession. Late-Cycle Challenges Mr. X: This seems like déjà-vu all over again. Since we last met, the cycle is one year older and, as you just said, the underlying challenges facing economies and markets have not really changed. If anything, things are even worse: Global debt levels are higher, inflation pressures more evident, Fed policy is moving closer to restrictive territory and protectionist policies have ratcheted up. If it was right to be cautious six months ago, then surely we should be even more cautious now. Ms. X: Oh dear, it does seem like a repeat of last year’s discussion because, once again, I am more optimistic than my father. Obviously, there are structural problems in a number of countries and, at some point, the global economy will suffer another recession. But timing is everything, and I attach very low odds to a downturn in the coming year. Meanwhile, I see many pockets of value in the equity market. Rather than cut equity positions, I am inclined to look for buying opportunities. BCA: We sympathize with your different perspectives because the outlook is complex and we also have lively debates about the view. The global equity index currently is a little below where it was when we met last year, but there has been tremendous intra-period volatility. That pattern seems likely to be repeated in 2019. In other words, it will be important to be flexible about your investment strategy. You both make good points. It is true that there are several worrying problems regarding the economic outlook, including excessive debt, protectionism and building inflation risks. At the same time, the classic conditions for an equity bear market are not yet in place, and may not be for some time. This leaves us in the rather uncomfortable position of sitting on the fence with regard to risk asset exposure. We are very open to raising exposure should markets weaken further in the months ahead, but also are keeping careful watch for signs that the economic cycle is close to peaking. In other words, it would be a mistake to lock in a 12-month strategy right now. Mr. X: I would like to challenge the consensus view, shared by my daughter, that the next recession will not occur before 2020, and might even be much later. The main rationale seems to be that the policy environment remains accommodative and there are none of the usual imbalances that occur ahead of recessions. Of course, U.S. fiscal policy has given a big boost to growth in the past year, but I assume the effects will wear off sharply in 2019. More importantly, there is huge uncertainty about the level of interest rates that will trigger economic problems. It certainly has not taken much in the way of Fed rate hikes to rattle financial markets. Thus, monetary policy may become restrictive much sooner than generally believed. I also strongly dispute the idea that there are no major financial imbalances. If running U.S. federal deficits of $1 trillion in the midst of an economic boom is not an imbalance, then I don’t know what is! At the same time, the U.S. corporate sector has issued large amounts of low-quality debt, and high-risk products such as junk-bond collateralized debt obligations have made an unwelcome reappearance. It seems that the memories of 2007-09 have faded. It is totally normal for long periods of extremely easy money to be accompanied by growing leverage and increasingly speculative financial activities, and I don’t see why this period should be any different. And often, the objects of speculation are not discovered until financial conditions become restrictive. Finally, there are huge risks associated with rising protectionism, the Chinese economy appears to be struggling, Italy’s banks are a mess, and the Brexit fiasco poses a threat to the U.K. economy. Starting with the U.S., please go ahead and convince me why a recession is more than a year away. BCA: It is natural for you to worry that a recession is right around the corner. The current U.S. economic expansion will become the longest on record if it makes it to July 2019, at which point it will surpass the 1990s expansion. Economists have a long and sad history of failing to forecast recessions. Therefore, a great deal of humility is warranted when it comes to predicting the evolution of the business cycle. The Great Recession was one of the deepest downturns on record and the recovery has been fairly sluggish by historic standards. Thus, it has taken much longer than usual for the U.S. economy to return to full employment. Looking out, there are many possible risks that could trip up the U.S. economy but, for the moment, we see no signs of recession on the horizon (Chart 2). For example, the leading economic indicator is still in an uptrend, the yield curve has not inverted and our monetary indicators are not contracting. Our proprietary recession indicator also suggests that the risk is currently low, although recent stock market weakness implies some deterioration. Chart 2Few U.S Recession 'Red Flags'
Few U.S Recession 'Red Flags'
Few U.S Recession 'Red Flags'
The buildup in corporate debt is a cause for concern and we are not buyers of corporate bonds at current yields. However, the impact of rising yields on the economy is likely to be manageable. The interest coverage ratio for the economy as a whole – defined as the profits corporations generate for every dollar of interest paid – is still above its historic average (Chart 3). Corporate bonds are also generally held by non-leveraged investors such as pension funds, insurance companies, and ETFs. The impact of defaults on the economy tends to be more severe when leveraged institutions are the ones that suffer the greatest losses. Chart 3Interest Costs Not Yet A Headwind
Interest Costs Not Yet A Headwind
Interest Costs Not Yet A Headwind
We share your worries about the long-term fiscal outlook. However, large budget deficits do not currently imperil the economy. The U.S. private sector is running a financial surplus, meaning that it earns more than it spends (Chart 4). Not only does this make the economy more resilient, it also provides the government with additional savings with which to finance its budget deficit. If anything, the highly accommodative stance of fiscal policy has pushed up the neutral rate of interest, giving the Fed greater scope to raise rates before monetary policy enters restrictive territory. The impetus of fiscal policy on the economy will be smaller in 2019 than it was in 2018, but it will still be positive (Chart 5). Chart 4The U.S. Private Sector Is Helping To Finance The Fiscal Deficit
The U.S. Private Sector Is Helping To Finance The Fiscal Deficit
The U.S. Private Sector Is Helping To Finance The Fiscal Deficit
Chart 5U.S. Fiscal Policy Still Stimulative In 2019
U.S. Fiscal Policy Still Stimulative In 2019
U.S. Fiscal Policy Still Stimulative In 2019
The risks to growth are more daunting outside the U.S. As you point out, Italy is struggling to contain borrowing costs, a dark cloud hangs over the Brexit negotiations, and China and most other emerging markets have seen growth slow meaningfully. The U.S., however, is a relatively closed economy – it is not as dependent on trade as most other countries. Its financial system is reasonably resilient thanks to the capital its banks have raised over the past decade. In addition, Dodd-Frank and other legislation have made it more difficult for financial institutions to engage in reckless risk-taking. Mr. X: I would never take a benign view of the ability and willingness of financial institutions to engage in reckless behavior, but maybe I am too cynical. Even if you are right that debt does not pose an immediate threat to the market, surely it will become a huge problem in the next downturn. If the U.S. federal deficit is $1 trillion when the economy is strong, it is bound to reach unimaginable levels in a recession. And, to make matters worse, the Federal Reserve may not have much scope to lower interest rates if they peak at a historically low level in the next year or so. What options will policymakers have to respond to the next cyclical downturn? Is there a limit to how much quantitative easing central banks can do? BCA: The Fed is aware of the challenges it faces if the next recession begins when interest rates are still quite low. Raising rates rapidly in order to have more “ammunition” for counteracting the downturn would hardly be the best course of action as this would only bring forward the onset of the recession. A better strategy is to let the economy overheat a bit so that inflation rises. This would allow the Fed to push real rates further into negative territory if the recession turns out to be severe. There is no real limit on how much quantitative easing the Fed can undertake. The FOMC will undoubtedly turn to asset purchases and forward guidance again during the next economic downturn. Now that the Fed has crossed the Rubicon into unorthodox monetary policy without generating high inflation, policymakers are likely to try even more exotic policies, such as price-level targeting. The private sector tends to try to save more during recessions. Thus, even though the fiscal deficit would widen during the next downturn, there should be plenty of buyers for government debt. However, once the next recovery begins, the Fed may feel increasing political pressure to keep rates low in order to allow the government to maintain its desired level of spending and taxes. The Fed guards its independence fiercely, but in a world of increasingly political populism, that independence may begin to erode. This will not happen quickly, but to the extent that it does occur, higher inflation is likely to be the outcome. Ms. X: I would like to explore the U.S.-China dynamic a bit more because I see that as one of the main challenges to my more optimistic view. I worry that President Trump will continue to take a hard line on China trade because it plays well with his base and has broad support in Congress. And I equally worry that President Xi will not want to be seen giving in to U.S. bullying. How do you see this playing out? BCA: Investors hoping that U.S. President Donald Trump and his Chinese counterpart Xi Jinping will reach a deal to end the trade war on the sidelines of the forthcoming G20 leaders' summit in Buenos Aires are likely to be disappointed. President Trump's fiscal policy is completely inconsistent with his trade agenda. Fiscal stimulus in a full-employment economy will suck in imports. It also forces the Fed to raise rates more aggressively than it otherwise would, leading to a stronger dollar. The result will be a larger U.S. trade deficit. Trump will not be able to blame Canada or Mexico for a deteriorating trade position because he just signed a trade agreement with them. The new USMCA agreement is remarkably similar to NAFTA, with the notable exception that it contains a clause barring Canada and Mexico from negotiating bilateral trade deals with China. This means Trump needs a patsy who will take the blame for America's burgeoning trade deficit and China will fill that role. For his part, President Xi knows full well that he will still be China’s leader when Trump is long gone. Giving in to Trump’s demands would hurt him politically. All this means that the trade war will persist. Mr. X: I see a trade war as a major threat to the economy, but it is not the only thing that could derail the economic expansion. Let’s explore that issue in more detail. The Economic Outlook Mr. X: You have shown in previous research that housing is often a very good leading indicator of the U.S. economy, largely because it is very sensitive to changes in the monetary environment. Are you not concerned about the marked deterioration in recent U.S. housing data? BCA: Recent trends in housing have indeed been disappointing, with residential investment acting as a drag on growth for three consecutive quarters. The weakness has been broad-based with sales, the rate of price appreciation of home prices, and builder confidence all declining (Chart 6). Even though the level of housing affordability is decent by historical standards, there has been a fall in the percentage of those who believe that it is a good time to buy a home. Chart 6Recent Softness In U.S. Housing
Recent Softness In U.S. Housing
Recent Softness In U.S. Housing
There are a few possible explanations for the weakness. First, the 2007-09 housing implosion likely had a profound and lasting impact on the perceived attractiveness of home ownership. The homeownership rate for people under 45 has remained extremely low by historical standards. Secondly, increased oversight and tighter regulations have curbed mortgage supply. Finally, the interest rate sensitivity of the sector may have increased with the result that even modest increases in the mortgage rate have outsized effects. That, in turn, could be partly explained by recent tax changes that capped the deduction on state and local property taxes, while lowering the limit on the tax deductibility of mortgage interest. The trend in housing is definitely a concern, but the odds of a further major contraction seem low. Unlike in 2006, the home vacancy rate stands near record levels and the same is true for the inventory of homes. The pace of housebuilding is below the level implied by demographic trends and consumer fundamentals are reasonably healthy. The key to the U.S. economy lies with business investment and consumer spending and these areas are well supported for the moment. Consumers are benefiting from continued strong growth in employment and a long overdue pickup in wages. Meanwhile, the ratio of net worth-to-income has surpased the previous peak and the ratio of debt servicing-to-income is low (Chart 7). Last year, we expressed some concern that the depressed saving rate might dampen spending, but the rate has since been revised substantially higher. Based on its historical relationship with U.S. household net worth, there is room for the saving rate to fall, fueling more spending. Real consumer spending has grown by 3% over the past year and there is a good chance of maintaining that pace during most of 2019. Chart 7U.S. Consumer Fundamentals Are Healthy
U.S. Consumer Fundamentals Are Healthy
U.S. Consumer Fundamentals Are Healthy
Turning to capital spending, the cut in corporate taxes was obviously good for cash flow, and surveys show a high level of business confidence. Moreover, many years of business caution toward spending has pushed up the average age of the nonresidential capital stock to the highest level since 1963 (Chart 8). Higher wages should also incentivize firms to invest in more machinery. Absent some new shock to confidence, business investment should stay firm during the next year. Chart 8An Aging Capital Stock
An Aging Capital Stock
An Aging Capital Stock
Overall, we expect the pace of U.S. economic growth to slow from its recent strong level, but it should hold above trend, currently estimated to be around 2%. As discussed earlier, that means capacity pressures will intensify, causing inflation to move higher. Ms. X: I share the view that the U.S. economy will continue to grow at a healthy pace, but I am less sure about the rest of the world. BCA: You are right to be concerned. We expected U.S. and global growth to diverge in 2018, but not by as much as occurred. Several factors have weighed on CEO confidence outside of the U.S., including trade wars, a strong dollar, higher oil prices, emerging market turbulence, the return of Italian debt woes, and a slowdown in the Chinese economy. The stress has shown up in the global manufacturing PMI, although the latter is still at a reasonably high level (Chart 9). Global export growth is moderating and the weakness appears to be concentrated in capex. Capital goods imports for the major economies, business investment, and the production of investment-related goods have all decelerated this year. Chart 9Global Manufacturing Slowdown
Global Manufacturing Slowdown
Global Manufacturing Slowdown
Our favorite global leading indicators are also flashing yellow (Chart 10). BCA’s global leading economic indicator has broken below the boom/bust line and its diffusion index suggests further downside. The global ZEW composite and the BCA boom/bust indicator are both holding below zero. Chart 10Global Growth Leading Indicators
Global Growth Leading Indicators
Global Growth Leading Indicators
Current trends in the leading indicators shown in Chart 11 imply that the growth divergence between the U.S. and the rest of the world will remain a key theme well into 2019. Among the advanced economies, Europe and Japan are quite vulnerable to the global soft patch in trade and capital spending. Chart 11Global Economic Divergence Will Continue
Global Economic Divergence Will Continue
Global Economic Divergence Will Continue
The loss of momentum in the Euro Area economy, while expected, has been quite pronounced. Part of this is due to the dissipation of the 2016/17 economic boost related to improved health in parts of the European banking system that sparked a temporary surge in credit growth. The tightening in Italian financial conditions following the government’s budget standoff with the EU has weighed on overall Euro Area growth. Softer Chinese demand for European exports, uncertainties related to U.S. trade policy and the torturous Brexit negotiations, have not helped the situation. Real GDP growth decelerated to close to a trend pace by the third quarter of 2018. The manufacturing PMI has fallen from a peak of 60.6 in December 2017 to 51.5, mirroring a 1% decline in the OECD’s leading economic indicator for the region. Not all the economic news has been bleak. Both consumer and industrial confidence remain at elevated levels according to the European Commission (EC) surveys, consistent with a resumption of above-trend growth. Even though exports have weakened substantially from the booming pace in 2017, the EC survey on firms’ export order books remains at robust levels (Chart 12). Importantly for the Euro Area, the bank credit impulse has moved higher.The German economy should also benefit from a rebound in vehicle production which plunged earlier this year following the introduction of new emission standards. Chart 12Europe: Slowing, But No Disaster
Europe: Slowing, But No Disaster
Europe: Slowing, But No Disaster
We interpret the 2018 Euro Area slowdown as a reversion-to-the-mean rather than the start of an extended period of sub-trend growth. Real GDP growth should fluctuate slightly above trend pace through 2019. Given that the Euro Area’s output gap is almost closed, the ECB will not deviate from its plan to end its asset purchase program by year end. Gradual rate hikes should begin late in 2019, assuming that inflation is closer to target by then. In contrast, the Bank of Japan (BoJ) is unlikely to change policy anytime soon. The good news is that wages have finally begun to grow at about a 2% pace, although it required extreme labor shortages. Yet, core inflation is barely positive and long-term inflation expectations are a long way from the 2% target. The inflation situation will have to improve significantly before the BoJ can consider adjusting or removing the Yield Curve Control policy. This is especially the case since the economy has hit a bit of an air pocket and the government intends to raise the VAT in 2019. Japan’s industrial production has stalled and we expect the export picture to get worse before it gets better. We do not anticipate any significant economic slack to develop, but even a sustained growth slowdown could partially reverse the gains that have been made on the inflation front. Ms. X: We can’t talk about the global economy without discussing China. You have noted in the past how the authorities are walking a tightrope between trying to unwind the credit bubble and restructure the economy on the one hand, and prevent a destabilizing economic and financial crisis on the other. Thus far, they have not fallen off the tightrope, but there has been limited progress in resolving the country’s imbalances. And now the authorities appear to be stimulating growth again, risking an even bigger buildup of credit. Can it all hold together for another year? BCA: That’s a very good question. Thus far, there is not much evidence that stimulus efforts are working. Credit growth is still weak and leading economic indicators have not turned around (Chart 13). There is thus a case for more aggressive reflation, but the authorities also remain keen to wean the economy off its addiction to debt. Chart 13China: No Sign Of Reacceleration
China: Credit Impulse Remains Weak
China: Credit Impulse Remains Weak
Waves of stimulus have caused total debt to soar from 140% of GDP in 2008 to about 260% of GDP at present (Chart 14). As is usually the case, rapid increases in leverage have been associated with a misallocation of capital. Since most of the new credit has been used to finance fixed-asset investment, the result has been overcapacity in a number of areas. For example, the fact that 15%-to-20% of apartments are sitting vacant is a reflection of overbuilding. Meanwhile, the rate of return on assets in the state-owned corporate sector has fallen below borrowing costs. Chart 14China: Debt Still Rising
China: Debt Still Rising
China: Debt Still Rising
Chinese exports are holding up well so far, but this might only represent front-running ahead of the implementation of higher tariffs. Judging from the steep drop in the export component of both the official and private-sector Chinese manufacturing PMI, exports are likely to come under increasing pressure over the next few quarters as the headwinds from higher tariffs fully manifest themselves (Chart 15). Chart 15Chinese Exports About To Suffer
Chinese Exports About To Suffer
Chinese Exports About To Suffer
The most likely outcome is that the authorities will adjust the policy dials just enough to stabilize growth sometime in the first half of 2019. The bottoming in China’s broad money impulse offers a ray of hope (Chart 16). Still, it is a tentative signal at best and it will take some time before this recent easing in monetary policy shows up in our credit impulse measure and, later, economic growth. A modest firming in Chinese growth in the second half of 2019 would provide a somewhat stronger demand backdrop for commodities and emerging economies that sell goods to China. Chart 16A Ray Of Hope From Broad Money
bca.bca_mp_2018_12_01_c16
bca.bca_mp_2018_12_01_c16
Ms. X: If you are correct about a stabilization in the Chinese economy next year, this presumably would be good news for emerging economies, especially if the Fed goes on hold. EM assets have been terribly beaten down and I am looking for an opportunity to buy. BCA: Fed rate hikes might have been the catalyst for the past year’s pain in EM assets, but it is not the underlying problem. As we highlighted at last year’s meeting, the troubles for emerging markets run much deeper. Our long-held caution on emerging economies and markets is rooted in concern about deteriorating fundamentals. Excessive debt is a ticking time bomb for many of these countries; EM dollar-denominated debt is now as high as it was in the late 1990s as a share of both GDP and exports (Chart 17). Moreover, the declining long-term growth potential for emerging economies as a group makes it more difficult for them to service the debt. The structural downtrend in EM labor force and productivity growth underscores that trend GDP growth has collapsed over the past three decades (Chart 17, bottom panel). Chart 17EM Debt A Problem Given Slowing Supply-Side...
EM Debt A Problem Given Slowing Supply-Side...
EM Debt A Problem Given Slowing Supply-Side...
Decelerating global growth has exposed these poor fundamentals. EM sovereign spreads have moved wider in conjunction with falling PMIs and slowing industrial production and export growth. And it certainly does not help that the Fed is tightening dollar-based liquidity conditions. EM equities usually fall when U.S. financial conditions tighten (Chart 18). Chart 18...And Tightening Financial Conditions
...And Tightening Financial Conditions
...And Tightening Financial Conditions
Chart 19 highlights the most vulnerable economies in terms of foreign currency funding requirements, and foreign debt-servicing obligations relative to total exports. Turkey stands out as the most vulnerable, along with Argentina, Brazil, Indonesia, Chile, and Colombia. In contrast, Emerging Asia appears to be in better shape relative to the crisis period of the late 1990s. Chart 19Spot The Outliers
OUTLOOK 2019: Late-Cycle Turbulence
OUTLOOK 2019: Late-Cycle Turbulence
The backdrop for EM assets is likely to get worse in the near term, given our view that the Fed will continue to tighten and China will be cautious about stimulating more aggressively. Our base case outlook sees some relief in the second half of 2019, but it is more of a “muddle-through” scenario than a V-shaped economic recovery. Mr. X: Perhaps EM assets could enjoy a bounce next year if the Chinese economy stabilizes, but the poor macro fundamentals you mentioned suggest that it would be a trade rather than a buy-and-hold proposition. I am inclined to avoid the whole asset class in 2019. Bond Market Prospects Ms. X: Let’s turn to fixed income now. I was bearish on bonds in 2018, but yields have risen quite a bit, at least in the United States. The Fed has lifted the fed funds rate by 100 basis points over the past year and I don’t see a lot of upside for inflation. So perhaps yields have peaked and will move sideways in 2019, which would be good for stocks in my view. BCA: Higher yields have indeed improved bond value recently. Nonetheless, they are not cheap enough to buy at this point (Chart 20). The real 10-year Treasury yield, at close to 1%, is still depressed by pre-Lehman standards. Long-term real yields in Germany and Japan remain in negative territory at close to the lowest levels ever recorded. Chart 20Real Yields Still Very Depressed
Real Yields Still Very Depressed
Real Yields Still Very Depressed
We called the bottom in global nominal bond yields in 2016. Our research at the time showed that the cyclical and structural factors that had depressed yields were at an inflection point, and were shifting in a less bond-bullish direction. Perhaps most important among the structural factors, population aging and a downward trend in underlying productivity growth resulted in lower equilibrium bond yields over the past couple of decades. Looking ahead, productivity growth could stage a mild rebound in line with the upturn in the growth rate of the capital stock (Chart 21). As for demographics, the age structure of the world population is transitioning from a period in which aging added to the global pool of savings to one in which aging is beginning to drain that pool as people retire and begin to consume their nest eggs (Chart 22). The household saving rates in the major advanced economies should trend lower in the coming years, placing upward pressure on equilibrium global bond yields. Chart 21Productivity Still Has Some Upside
Productivity Still Has Some Upside
Productivity Still Has Some Upside
Chart 22Demographics Past The Inflection Point
Demographics Past The Inflection Point
Demographics Past The Inflection Point
Cyclical factors are also turning against bonds. U.S. inflation has returned to target and the Fed is normalizing short-term interest rates. The market currently is priced for only one more rate hike after December 2018 in this cycle, but we see rates rising more than that. Treasury yields will follow as market expectations adjust. Long-term inflation expectations are still too low in the U.S. and most of the other major economies to be consistent with central banks’ meeting their inflation targets over the medium term. As actual inflation edges higher, long-term expectations built into bond yields will move up. The term premium portion of long-term bond yields is also too low. This is the premium that investors demand to hold longer-term bonds. Our estimates suggest that the term premium is still negative in the advanced economies outside of the U.S., which is not sustainable over the medium term (Chart 23). Chart 23Term Premia Are Too Low
Term Premia Are Too Low
Term Premia Are Too Low
We expect term premia to rise for two main reasons. First, investors have viewed government bonds as a good hedge for their equity holdings because bond prices have tended to rise when stock prices fell. Investors have been willing to pay a premium to hold long-term bonds to benefit from this hedging effect. But the correlation is now beginning to change as inflation and inflation expectations gradually adjust higher and output gaps close. As the hedging benefit wanes, the term premium should rise back into positive territory. Second, central bank bond purchases and forward guidance have depressed yields as well as interest-rate volatility. The latter helped to depress term premia in the bond market. This effect, too, is beginning to unwind. The Fed is letting its balance sheet shrink by about $50 billion per month. The Bank of England has kept its holdings of gilts and corporate bonds constant for over a year, while the ECB is about to end asset purchases. The Bank of Japan continues to buy assets, but at a much reduced pace. All this means that the private sector is being forced to absorb a net increase in government bonds for the first time since 2014 (Chart 24). Chart 25 shows that bond yields in the major countries will continue to trend higher as the rapid expansion of central bank balance sheets becomes a thing of the past. Chart 24Private Sector To Absorb More Bonds
OUTLOOK 2019: Late-Cycle Turbulence
OUTLOOK 2019: Late-Cycle Turbulence
Chart 25QE Unwind Will Weigh On Bond Prices
QE Unwind Will Weigh On Bond Prices
QE Unwind Will Weigh On Bond Prices
Ms. X: I’m not a fan of bonds at these levels, but that sounds overly bearish to me, especially given the recent plunge in oil prices. BCA: Lower oil prices will indeed help to hold down core inflation to the extent that energy prices leak into non-energy prices in the near term. Nonetheless, in the U.S., this effect will be overwhelmed by an overheated economy. From a long-term perspective, we believe that investors still have an overly benign view of the outlook for yields. The market expects that the 10-year Treasury yield in ten years will only be slightly above today’s spot yield, which itself is still very depressed by historical standards (Chart 26). And that also is the case in the other major bond markets. Chart 26Forward Yields Are Too Low
Forward Yields Are Too Low
Forward Yields Are Too Low
Of course, it will not be a straight line up for yields – there will be plenty of volatility. We expect the 10-year Treasury yield to peak sometime in 2019 or early 2020 in the 3.5%-to-4% range, before the next recession sends yields temporarily lower. Duration should be kept short at least until the middle of 2019, with an emphasis on TIPS relative to conventional Treasury bonds. We will likely downgrade TIPS versus conventionals once long-term inflation expectations move into our target range, which should occur sometime during 2019. The ECB and Japan will not be in a position to raise interest rates for some time, but the bear phase in U.S. Treasurys will drag up European and Japanese bond yields (at the very long end of the curve for the latter). Total returns are likely to be negative in all of the major bond markets in 2019. Real 10-year yields in all of the advanced economies are still well below their long-term average, except for Greece, Italy and Portugal (Chart 27). Chart 27Valuation Ranking Of Developed Bond Markets
OUTLOOK 2019: Late-Cycle Turbulence
OUTLOOK 2019: Late-Cycle Turbulence
Within global bond portfolios, we recommend being underweight bond markets where central banks are in a position to raise short-term interest rates (the U.S. and Canada), and overweight those that are not (Japan and Australia). The first ECB rate hike is unlikely before the end of 2019. However, the imminent end of the asset purchase program argues for no more than a benchmark allocation to core European bond markets within global fixed-income portfolios, especially since real 10-year yields in parts of continental Europe are the furthest below their long-term average. We are overweight gilts at the moment, but foresee shifting to underweight in 2019, depending on how Brexit plays out. Ms. X: What about corporate bonds? I know that total returns for corporates will be poor if government bond yields are rising. But you recommended overweighting corporate bonds relative to Treasurys last year. Given your view that the next U.S. recession is more than a year away, it seems reasonable to assume they will outperform government bonds. BCA: We were overweight corporates in the first half of 2018, but took profits in June and shifted to neutral at the same time that we downgraded our equity allocation. Spreads had tightened to levels that did not compensate investors for the risks. Recent spread widening has returned some value to U.S. corporates. The 12-month breakeven spreads for A-rated and Baa-rated corporate bonds are almost back up to their 50th percentile relative to history (Chart 28). Still, these levels are not attractive enough to justify buying based on valuation alone. As for high-yield, any rise in the default rate would quickly overwhelm the yield pickup in this space. Chart 28Corporate Bond Yields Still Have Upside
Corporate Bond Yields Still Have Upside
Corporate Bond Yields Still Have Upside
It is possible that some of the spread widening observed in October and November will reverse, but corporates offer a poor risk/reward tradeoff, even if the default rate stays low. Corporate profit growth is bound to decelerate in 2019. This would not be a disaster for equities, but slowing profit growth is more dangerous for corporate bond excess returns because the starting point for leverage is already elevated. As discussed above, at a macro level, the aggregate interest coverage ratio for the U.S. corporate sector is decent by historical standards. However, this includes mega-cap companies that have little debt and a lot of cash. Our bottom-up research suggests that interest coverage ratios for firms in the Bloomberg Barclays corporate bond index will likely drop close to multi-decade lows during the next recession, sparking a wave of downgrade activity and fallen angels. Seeing this coming, investors may require more yield padding to compensate for these risks as profit growth slows. Our next move will likely be to downgrade corporate bonds to underweight. We are watching the yield curve, bank lending standards, profit growth, and monetary indicators for signs to further trim exposure. You should already be moving up in quality within your corporate bond allocation. Mr. X: We have already shifted to underweight corporate bonds in our fixed income portfolio. Even considering the cheapening that has occurred over the past couple of months, spread levels still make no sense in terms of providing compensation for credit risk. Equity Market Outlook Ms. X: While we all seem to agree that corporate bonds are not very attractive, I believe that enough value has been restored to equities that we should upgrade our allocation, especially if the next recession is two years away. And I know that stocks sometimes have a powerful blow-off phase before the end of a bull market. Mr. X: This is where I vehemently disagree with my daughter. The recent sell-off resembles a bloodbath in parts of the global market. It has confirmed my worst fears, especially related to the high-flying tech stocks that I believe were in a bubble. Hopes for a blow-off phase are wishful thinking. I’m wondering if the sell-off represents the beginning of an extended bear market. BCA: Some value has indeed been restored. However, the U.S. market is far from cheap relative to corporate fundamentals. The trailing and 12-month forward price-earnings ratios (PER) of 20 and 16, respectively, are still far above their historical averages, especially if one leaves out the tech bubble period of the late 1990s. And the same is true for other metrics such as price-to-sales and price-to-book value (Chart 29). BCA’s composite valuation indicator, based on 8 different valuation measures, is only a little below the threshold of overvaluation at +1 standard deviation because low interest rates still favor equities on a relative yield basis. Chart 29U.S. Equities Are Not Cheap
U.S. Equities Are Not Cheap
U.S. Equities Are Not Cheap
It is true that equities can reward investors handsomely in the final stage of a bull market. Chart 30 presents cumulative returns to the S&P 500 in the last nine bull markets. The returns are broken down by quintile. The greatest returns, unsurprisingly, generally occur in the first part of the bull market (quintile 1). But total returns in the last 20% of the bull phase (quintile 5) have been solid and have beaten the middle quartiles. Chart 30Late-Cycle Blow-Offs Can Be Rewarding
OUTLOOK 2019: Late-Cycle Turbulence
OUTLOOK 2019: Late-Cycle Turbulence
Of course, the tricky part is determining where we are in the bull market. We have long viewed financial markets through the lens of money and credit. This includes a framework that involves the Fed policy cycle. The historical track record for risk assets is very clear; they tend to perform well when the fed funds rate is below neutral, whether rates are rising or falling. Risk assets tend to underperform cash when the fed funds rate is above neutral (Table 3). Table 3Stocks Do Well When The Fed Funds Rate Is Below Neutral
OUTLOOK 2019: Late-Cycle Turbulence
OUTLOOK 2019: Late-Cycle Turbulence
We believe the fed funds rate is still in easy territory. This suggests that it is too early to shift to underweight on risk assets. We may even want to upgrade to overweight if stocks become cheap enough, as long as Fed policy is not restrictive. That said, there is huge uncertainty about the exact level of rates that constitutes “neutral” (or R-star in the Fed’s lingo). Even the Fed is unsure. This means that we must watch for signs that the fed funds rate has crossed the line into restrictive territory as the FOMC tightens over the coming year. An inversion of the 3-month T-bill/10-year yield curve slope would be a powerful signal that policy has become tight, although the lead time of an inverted curve and declining risk asset prices has been quite variable historically. Finally, it is also important to watch U.S. profit margins. Some of our research over the past couple of years focused on the late-cycle dynamics of previous long expansions, such as the 1960s, 1980s and 1990s. We found that risk assets came under pressure once U.S. profit margins peaked. Returns were often negative from the peak in margins to the subsequent recession. Mr. X: U.S. profit margins must be close to peak levels. I’ve seen all sorts of anecdotal examples of rising cost pressures, not only in the labor market. BCA: We expected to see some margin pressure to appear by now. S&P 500 EPS growth will likely top out in the next couple of quarters, if only because the third quarter’s 26% year-over-year pace is simply not sustainable. But it is impressive that our margin proxies are not yet flagging an imminent margin squeeze, despite the pickup in wage growth (Chart 31). Chart 31U.S. Margin Indicators Still Upbeat
U.S. Margin Indicators Still Upbeat
U.S. Margin Indicators Still Upbeat
Margins according to the National Accounts (NIPA) data peaked in 2014 and have since diverged sharply with S&P 500 operating margins. It is difficult to fully explain the divergence. The NIPA margin is considered to be a better measure of underlying U.S. corporate profitability because it includes all companies (not just 500), and it is less subject to accounting trickery. That said, even the NIPA measure of margins firmed a little in 2018, along with the proxies we follow that correlate with the S&P 500 measure. The bottom line is that the macro variables that feed into our top-down U.S. EPS model point to a continuing high level of margins and fairly robust top-line growth, at least for the near term. For 2019, we assumed slower GDP growth and incorporated some decline in margins into our projection just to err on the conservative side. Nonetheless, our EPS model still projects a respectable 8% growth rate at the end of 2019 (Chart 32). The dollar will only be a minor headwind to earnings growth unless it surges by another 10% or more. Chart 32EPS Growth Forecasts
EPS Growth Forecasts
EPS Growth Forecasts
The risks to EPS growth probably are to the downside relative to our forecast, but the point is that U.S. earnings will likely remain supportive for the market unless economic growth is much weaker than we expect. None of this means that investors should be aggressively overweight stocks now. We trimmed our equity recommendation to benchmark in mid-2018 for several reasons. At the time, value was quite poor and bottom-up earnings expectations were too high, especially on a five-year horizon. Also, sentiment measures suggested that investors were overly complacent. As you know, we are always reluctant to chase markets into highly overvalued territory, especially when a lot of good news has been discounted. As we have noted, we are open to temporarily shifting back to overweight in equities and other risk assets. The extension of the economic expansion gives more time for earnings to grow. The risks facing the market have not eased much but, given our base-case macro view, we would be inclined to upgrade equities if there is another meaningful correction. Of course, our profit, monetary and economic indicators would have to remain supportive to justify an upgrade. Mr. X: But you are bearish on bonds. We saw in October that the equity market is vulnerable to higher yields. BCA: It certainly won’t be smooth sailing through 2019 as interest rates normalize. Until recently, higher bond yields reflected stronger growth without any associated fears that inflation was a growing problem. The ‘Fed Put’ was seen as a key backstop for the equity bull market. But now that the U.S. labor market is showing signs of overheating, the bond sell-off has become less benign for stocks because the Fed will be less inclined to ease up at the first sign of trouble in the equity market. How stocks react in 2019 to the upward trend in yields depends a lot on the evolution of actual inflation and long-term inflation expectations. If core PCE inflation hovers close to or just above 2% for a while, then the Fed Put should still be in place. However, it would get ugly for both bonds and stocks if inflation moves beyond 2.5%. Our base case is that this negative dynamic won’t occur until early 2020, but obviously the timing is uncertain. One key indicator to watch is long-term inflation expectations, such as the 10-year TIPS breakeven inflation rate (Chart 33). It is close to 2% at the moment. If it shifts up into the 2.3%-2.5% range, it would confirm that inflation expectations have returned to a level that is consistent with the Fed meeting its 2% inflation target on a sustained basis. This would be a signal to the Fed that it is must become more aggressive in calming growth, with obvious negative consequences for risk assets. Chart 33Watch For A Return To 2.3%-2.5% Range
Watch For A Return To 2.3%-2.5% Range
Watch For A Return To 2.3%-2.5% Range
Mr. X: I am skeptical that the U.S. corporate sector can pull off an 8% earnings gain in 2019. What about the other major markets? Won’t they get hit hard if global growth continues to slow as you suggest? BCA: Yes, that is correct. It is not surprising that EPS growth has already peaked in the Euro Area and Japan. The profit situation is going to deteriorate quickly in the coming quarters. Industrial production growth in both economies has already dropped close to zero, and we use this as a proxy for top-line growth in our EPS models. Nominal GDP growth has decelerated sharply in both economies in absolute terms and relative to the aggregate wage bill. These trends suggest that profit margins are coming under significant downward pressure. Even when we build in a modest growth pickup and slight rebound in margins in 2019, EPS growth falls close to zero by year-end according to our models. Both the Euro Area and Japanese equity markets are cheap relative to the U.S., based on our composite valuation indicators (Chart 34). However, neither is above the threshold of undervaluation (+1 standard deviation) that would justify overweight positions on valuation alone. We think the U.S. market will outperform the other two at least in the first half of 2019 in local and, especially, common-currency terms. Chart 34Valuation Of Nonfinancial Equity Markets Relative To The U.S.
OUTLOOK 2019: Late-Cycle Turbulence
OUTLOOK 2019: Late-Cycle Turbulence
Ms. X: It makes sense that U.S. profit growth will outperform the other major developed countries in 2019. I would like to circle back to emerging market assets. I understand that many emerging economies have deep structural problems. But you admitted that the Chinese authorities will eventually stimulate enough to stabilize growth, providing a bounce in EM growth and asset prices next year. These assets seem cheap enough to me to warrant buying now in anticipation of that rally. As we all know, reversals from oversold levels can happen in a blink of an eye and I don’t want to miss it. BCA: We are looking for an opportunity to buy as well, but are wary of getting in too early. First, valuation has improved but is not good enough on its own to justify buying now. EM stocks are only moderately undervalued based on our EM composite valuation indicator and the cyclically-adjusted P/E ratio (Chart 35). EM currencies are not particularly cheap either, outside of Argentina, Turkey and Mexico (Charts 36A and 36B). Valuation should only play a role in investment strategy when it is at an extreme, and this is not the case for most EM countries. Chart 35EM Stocks Are Not At Capitulation Levels...
bca.bca_mp_2018_12_01_c35
bca.bca_mp_2018_12_01_c35
Chart 36A…And Neither Are EM Currencies
...And Neither Are EM Currencies
...And Neither Are EM Currencies
Chart 36B…And Neither Are EM Currencies
...And Neither Are EM Currencies
...And Neither Are EM Currencies
Second, corporate earnings growth has plenty of downside potential in the near term. Annual growth in EM nonfinancial EBITDA, currently near 10%, is likely to turn negative next year, based on our China credit and fiscal impulse indicator (Chart 37). And, as we emphasized earlier, China is not yet pressing hard on the gas pedal. Chart 37EM Earnings Growth: Lots Of Downside
EM Earnings Growth: Lots Of Downside
EM Earnings Growth: Lots Of Downside
Third, it will take time for more aggressive Chinese policy stimulus, if it does occur, to show up in EM stocks and commodity prices. Trend changes in money growth and our credit and fiscal impulse preceded the trough in EM stocks and commodity prices in 2015, and again at the top in stocks and commodities in 2017 (Chart 38). However, even if these two indicators bottom today, it could take several months before the sell-off in EM financial markets and commodity prices abates. Chart 38Chinese Money And Credit Leads EM And Commodities
Chinese Money And Credit Leads EM And Commodities
Chinese Money And Credit Leads EM And Commodities
Finally, if Chinese stimulus comes largely via easier monetary policy rather than fiscal stimulus, then the outcome will be a weaker RMB. We expect the RMB to drift lower in any event, because rate differentials vis-à-vis the U.S. will move against the Chinese currency next year. A weaker RMB would add to the near-term headwinds facing EM assets. The bottom line is that the downside risks remain high enough that you should resist the temptation to bottom-fish until there are concrete signs that the Chinese authorities are getting serious about boosting the economy. We are also watching for signs outside of China that the global growth slowdown is ending. This includes our global leading economic indicator and data that are highly sensitive to global growth, such as German manufacturing foreign orders. Mr. X: Emerging market assets would have to become a lot cheaper for me to consider buying. Debt levels are just too high to be sustained, and stronger Chinese growth would only provide a short-term boost. I’m not sure I would even want to buy developed market risk assets based solely on some Chinese policy stimulus. BCA: Yes, we agree with your assessment that buying EM in 2019 would be a trade rather than a buy-and-hold strategy. Still, the combination of continued solid U.S. growth and a modest upturn in the Chinese economy would alleviate a lot of investors’ global growth concerns. The result could be a meaningful rally in pro-cyclical assets that you should not miss. We are defensively positioned at the moment, but we could see becoming more aggressive in 2019 on signs that China is stimulating more firmly and/or our global leading indicators begin to show some signs of life. Besides upgrading our overall equity allocation back to overweight, we would dip our toes in the EM space again. At the same time, we will likely upgrade the more cyclical DM equity markets, such as the Euro Area and Japan, while downgrading the defensive U.S. equity market to underweight. We are currently defensively positioned in terms of equity sectors, but it would make sense to shift cyclicals to overweight at the same time. Exact timing is always difficult, but we expect to become more aggressive around the middle of 2019. We also think the time is approaching to favor long-suffering value stocks over growth stocks. The relative performance of growth-over-value according to standard measures has become a sector call over the past decade: tech or financials. The sector skew complicates this issue, especially since tech stocks have already cracked. But we have found that stocks that are cheap within equity sectors tend to outperform expensive (or growth) stocks once the fed funds rate moves into restrictive territory. This is likely to occur in the latter half of 2019. Value should then have its day in the sun. Currencies: Mr. X: We don’t usually hedge our international equity exposure, so the direction of the dollar matters a lot to us. As you predicted a year ago, the U.S. dollar reigned supreme in 2018. Your economic views suggest another good year in 2019, but won’t this become a problem for the economy? President Trump’s desire to lower the U.S. trade deficit suggests that the Administration would like the dollar to drop and we could get some anti-dollar rhetoric from the White House. Also, it seems that the consensus is strongly bullish on the dollar which is always a concern. BCA: The outlook for the dollar is much trickier than it was at the end of 2017. As you highlighted, traders are already very long the dollar, implying that the hurdle for the greenback to surprise positively is much higher now. However, a key driver for the dollar is the global growth backdrop. If the latter is poor in the first half of 2019 as we expect, it will keep a bid under the greenback. Interest rates should also remain supportive for the dollar. As we argued earlier, current market expectations – only one more Fed hike after the December meeting – are too sanguine. If the Fed increases rates by more than currently discounted, the dollar’s fair value will rise, especially if global growth continues to lag that of the U.S. Since the dollar’s 2018 rally was largely a correction of its previous undervaluation, the currency has upside potential in the first half of the year (Chart 39). Chart 39U.S. Dollar Not Yet Overvalued
U.S. Dollar Not Yet Overvalued
U.S. Dollar Not Yet Overvalued
A stronger dollar will dampen foreign demand for U.S.-produced goods and will boost U.S. imports. However, do not forget that a rising dollar benefits U.S. consumers via its impact on import prices. Since the consumer sector represents 68% of GDP, and that 69% of household consumption is geared toward the (largely domestic) service sector, a strong dollar will not be as negative for aggregate demand and employment as many commentators fear, unless it were to surge by at least another 10%. In the end, the dollar will be more important for the distribution of U.S. growth than its overall level. Where the strong dollar is likely to cause tremors is in the political arena. You are correct to point out that there is a large inconsistency between the White House’s desires to shore up growth, while simultaneously curtailing the trade deficit, especially if the dollar appreciates further. As long as the Fed focuses on its dual mandate and tries to contain inflationary pressures, the executive branch of the U.S. government can do little to push the dollar down. Currency intervention cannot have a permanent effect unless it is accompanied by shifts in relative macro fundamentals. For example, foreign exchange intervention by the Japanese Ministry of Finance in the late 1990s merely had a temporary impact on the yen. The yen only weakened on a sustained basis once interest rate differentials moved against Japan. This problem underpins our view that the Sino-U.S. relationship is unlikely to improve meaningfully next year. China will remain an easy target to blame for the U.S.’s large trade deficit. What ultimately will signal a top in the dollar is better global growth, which is unlikely until the second half of 2019. At that point, expected returns outside the U.S. will improve, causing money to leave the U.S., pushing the dollar down. Mr. X: While 2017 was a stellar year for the euro, 2018 proved a much more challenging environment. Will 2019 be more like 2017 or 2018? BCA: We often think of the euro as the anti-dollar; buying EUR/USD is the simplest, most liquid vehicle for betting against the dollar, and vice versa. Our bullish dollar stance is therefore synonymous with a negative take on the euro. Also, the activity gap between the U.S. and the Euro Area continues to move in a euro-bearish fashion (Chart 40). Finally, since the Great Financial Crisis, EUR/USD has lagged the differential between European and U.S. core inflation by roughly six months. Today, this inflation spread still points toward a weaker euro. Chart 40Relative LEI's Moving Against Euro
Relative LEI's Moving Against Euro
Relative LEI's Moving Against Euro
It is important to remember that when Chinese economic activity weakens, European growth deteriorates relative to the U.S. Thus, our view that global growth will continue to sputter in the first half of 2019 implies that the monetary policy divergence between the Fed and the ECB has not yet reached a climax. Consequently, we expect EUR/USD to trade below 1.1 in the first half of 2019. By that point, the common currency will be trading at a meaningful discount to its fair value, which will allow it to find a floor (Chart 41). Chart 41Euro Heading Below Fair Value Before Bottoming
Euro Heading Below Fair Value Before Bottoming
Euro Heading Below Fair Value Before Bottoming
Mr. X: The Bank of Japan has debased the yen, with a balance sheet larger than Japan’s GDP. This cannot end well. I am very bearish on the currency. BCA: The BoJ’s monetary policy is definitely a challenge for the yen. The Japanese central bank rightfully understands that Japan’s inability to generate any meaningful inflation – despite an economy that is at full employment – is the consequence of a well-established deflationary mindset. The BoJ wants to shock inflation expectations upward by keeping real rates at very accommodative levels well after growth has picked up. This means that the BoJ will remain a laggard as global central banks move away from accommodative policies. The yen will continue to depreciate versus the dollar as U.S. yields rise on a cyclical horizon. That being said, the yen still has a place within investors’ portfolios. First, the yen is unlikely to collapse despite the BoJ’s heavy debt monetization. The JPY is one of the cheapest currencies in the world, with its real effective exchange rate hovering at a three-decade low (Chart 42). Additionally, Japan still sports a current account surplus of 3.7% of GDP, hardly the sign of an overstimulated and inflationary economy where demand is running amok. Instead, thanks to decades of current account surpluses, Japan has accumulated a positive net international investment position of 60% of GDP. This means that Japan runs a constant and large positive income balance, a feature historically associated with strong currencies. Chart 42The Yen Is Very Cheap
The Yen Is Very Cheap
The Yen Is Very Cheap
Japan’s large net international investment position also contributes to the yen’s defensive behavior as Japanese investors pull money back to safety at home when global growth deteriorates. Hence, the yen could rebound, especially against the euro, the commodity currencies, and EM currencies if there is a further global growth scare in the near term. Owning some yen can therefore stabilize portfolio returns during tough times. As we discussed earlier, we would avoid the EM asset class, including currency exposure, until global growth firms. Commodities: Ms. X: Once again, you made a good call on the energy price outlook a year ago, with prices moving higher for most of the year. But the recent weakness in oil seemed to come out of nowhere, and I must admit to being confused about where we go next. What are your latest thoughts on oil prices for the coming year? BCA: The fundamentals lined up in a very straightforward way at the end of 2017. The coalition we have dubbed OPEC 2.0 – the OPEC and non-OPEC producer group led by the Kingdom of Saudi Arabia (KSA) and Russia – outlined a clear strategy to reduce the global oil inventory overhang. The producers that had the capacity to increase supply maintained strict production discipline which, to some analysts, was still surprising even after the cohesiveness shown by the group in 2017. Outside that core group output continued to fall, especially in Venezuela, which remains a high-risk producing province. The oil market was balanced and prices were slowly moving higher as we entered the second quarter of this year, when President Trump announced the U.S. would re-impose oil export sanctions against Iran beginning early November. The oft-repeated goal of the sanctions was to reduce Iranian exports to zero. To compensate for the lost Iranian exports, President Trump pressured OPEC, led by KSA, to significantly increase production, which they did. However, as we approached the November deadline, the Trump Administration granted the eight largest importers of Iranian oil 180-day waivers on the sanctions. This restored much of the oil that would have been lost. Suddenly, the market found itself oversupplied and prices fell. As we move toward the December 6 meeting of OPEC 2.0 in Vienna, we are expecting a production cut from the coalition of as much as 1.4mm b/d to offset these waivers. The coalition wishes to keep global oil inventories from once again over-filling and dragging prices even lower in 2019. On the demand side, consumption continues to hold up both in the developed and emerging world, although we have somewhat lowered our expectations for growth next year. We are mindful of persistent concerns over the strength of demand – particularly in EM – in 2019. Thus, on the supply side and the demand side, the level of uncertainty in the oil markets is higher than it was at the start of 2018. Nonetheless, our base-case outlook is on the optimistic side for oil prices in 2019, with Brent crude oil averaging around $82/bbl, and WTI trading $6/bbl below that level (Chart 43). Chart 43Oil Prices To Rebound In 2019
Oil Prices To Rebound In 2019
Oil Prices To Rebound In 2019
Ms. X: I am skeptical that oil prices will rebound as much as you expect. First, oil demand is likely to falter if your view that global growth will continue slowing into early 2019 proves correct. Second, U.S. shale production is rising briskly, with pipeline bottlenecks finally starting to ease. Third, President Trump seems to have gone from taking credit for high equity prices to taking credit for low oil prices. Trump has taken a lot flack for supporting Saudi Arabia following the killing of The Washington Post journalist in Turkey. Would the Saudis really be willing to lose Trump’s support by cutting production at this politically sensitive time? BCA: Faltering demand growth remains a concern. However, note that in our forecasts we do expect global oil consumption growth to slow down to 1.46mm b/d next year, somewhat lower than the 1.6mm b/d growth we expect this year. In terms of the U.S. shale sector, production levels over the short term can be somewhat insensitive to changes in spot and forward prices, given the hedging activity of producers. Over the medium to longer term, however, lower spot and forward prices will disincentivize drilling by all but the most efficient producers with the best, lowest-cost acreage. If another price collapse were to occur – and were to persist, as the earlier price collapse did – we would expect a production loss of between 5% and 10% from the U.S. shales. Regarding KSA, the Kingdom needs close to $83/bbl to balance its budget this year and next, according to the IMF’s most recent estimates. If prices remain lower for longer, KSA’s official reserves will continue to fall, as its sovereign wealth fund continues to be tapped to fill budget gaps. President Trump’s insistence on higher production from KSA and the rest of OPEC is a non-starter – it would doom those economies to recession, and stifle further investment going forward. The U.S. would also suffer down the road, as the lack of investment significantly tightens global supply. So, net, if production cuts are not forthcoming from OPEC at its Vienna meeting we – and the market – will be downgrading our oil forecast. Ms. X: Does your optimism regarding energy extend to other commodities? The combination of a strong dollar and a China slowdown did a lot of damage to industrial commodities in 2018. Given your view that China’s economy should stabilize in 2019, are we close to a bottom in base metals? BCA: It is too soon to begin building positions in base metals because the trade war is going to get worse before it gets better. Exposure to base metals should be near benchmark at best entering 2019, although we will be looking to upgrade along with other risk assets if Chinese policy stimulus ramps up. Over the medium term, the outlook for base metals hinges on how successfully China pulls off its pivot toward consumer- and services-led growth, away from heavy industrial-led development. China accounts for roughly half of global demand for these base metals. Commodity demand from businesses providing consumer goods and services is lower than that of heavy industrial export-oriented firms. But demand for commodities used in consumer products – e.g., copper, zinc and nickel, which go into stainless-steel consumer appliances such as washers and dryers – will remain steady, and could increase if the transition away from heavy industrial-led growth is successful. Gasoline and jet fuel demand will also benefit, as EM consumers’ demand for leisure activities such as tourism increases with rising incomes. China is also going to be a large producer and consumer of electric vehicles, as it attempts to reduce its dependence on imported oil. Although timing the production ramp-up is difficult, in the long term these trends will be supportive for nickel and copper. Mr. X: You know I can’t let you get away without asking about gold. The price of bullion is down about 5% since the end of 2017, but that is no worse than the global equity market and it did provide a hedge against economic, financial or political shocks. The world seems just as risky as it did a year ago, so I am inclined to hold on to our gold positions, currently close to 10% of our portfolio. That is above your recommended level, but keeping a solid position in gold is one area where my daughter and I have close agreement regarding investment strategy. BCA: Gold did perform well during the risk asset corrections we had in 2018, and during the political crises as well. The price is not too far away from where we recommended going long gold as a portfolio hedge at the end of 2017 ($1230.3/oz). We continue to expect gold to perform well as a hedge. When other risk assets are trading lower, gold holds value relative to equities and tends to outperform bonds (Chart 44). Likewise, when other risk assets are rising, gold participates, but does not do as well as equities. It is this convexity – outperforming on the downside but participating on the upside with other risk assets – that continues to support our belief that gold has a role as a portfolio hedge. However, having 10% of your portfolio in gold is more than we would recommend – we favor an allocation of around 5%. Chart 44Hold Some Gold As A Hedge
OUTLOOK 2019: Late-Cycle Turbulence
OUTLOOK 2019: Late-Cycle Turbulence
Geopolitics Ms. X: I’m glad that the three of us agree at least on one thing – hold some gold! Let’s return to the geopolitical situation for a moment. Last year, you correctly forecast that divergent domestic policies in the U.S. and China – stimulus in the former and lack thereof in the latter – would be the most investment-relevant geopolitical issue. At the time, I found this an odd thing to highlight, given the risks of protectionism, populism, and North Korea. Do you still think that domestic policies will dominate in 2019? BCA: Yes, policy divergence between the U.S. and China will also dominate in 2019, especially if it continues to buoy the U.S. economy at the expense of the rest of the world. Of course, Beijing may decide to do more stimulus to offset its weakening economy and the impact of the trade tariffs. A headline rate cut, cuts to bank reserve requirements, and a boost to local government infrastructure spending are all in play. In the context of faltering housing and capex figures in the U.S., the narrative over the next quarter or two could be that the policy divergence is over, that Chinese policymakers have “blinked.” We are pushing back against this narrative on a structural basis. We have already broadly outlined our view that China will not be pressing hard to boost demand growth. Many of its recent policy efforts have focused on rebalancing the economy away from debt-driven investment (Chart 45). The problem for the rest of the world is that raw materials and capital goods comprise 85% of Chinese imports. As such, efforts to boost domestic consumption will have limited impact on the rest of the world, especially as emerging markets are highly leveraged to “old China.” Chart 45Rebalancing Of The Chinese Economy
Rebalancing Of The Chinese Economy
Rebalancing Of The Chinese Economy
Meanwhile, the Trump-Democrat gridlock could yield surprising results in 2019. President Trump is becoming singularly focused on winning re-election in 2020. As such, he fears the “stimulus cliff” looming over the election year. Democrats, eager to show that they are not merely the party of “the Resistance,” have already signaled that an infrastructure deal is their top priority. With fiscal conservatives in the House all but neutered by the midterm elections, a coalition between Trump and likely House Speaker Nancy Pelosi could emerge by late 2019, ushering in even more fiscal stimulus. While the net new federal spending will not be as grandiose as the headline figures, it will be something. There will also be regular spending increases in the wake of this year’s bipartisan removal of spending caps. We place solid odds that the current policy divergence narrative continues well into 2019, with bullish consequences for the U.S. dollar and bearish outcomes for EM assets, at least in the first half of the year. Mr. X: Your geopolitical team has consistently been alarmist on the U.S.-China trade war, a view that bore out throughout 2018. You already stated that you think trade tensions will persist in 2019. Where is this heading? BCA: Nowhere good. Rising geopolitical tensions in the Sino-American relationship has been our premier geopolitical risk since 2012. The Trump administration has begun tying geopolitical and strategic matters in with the trade talks. No longer is the White House merely asking for a narrowing of the trade deficit, improved intellectual property protections, and the removal of non-tariff barriers to trade. Now, everything from surface-to-air missiles in the South China Sea to Beijing’s “Belt and Road” project are on the list of U.S. demands. Trade negotiations are a “two-level game,” whereby policymakers negotiate in parallel with their foreign counterparts and domestic constituents. While Chinese economic agents may accept U.S. economic demands, it is not clear to us that its military and intelligence apparatus will accept U.S. geopolitical demands. And Xi Jinping himself is highly attuned to China’s geopolitical position, calling for national rejuvenation above all. We would therefore downplay any optimistic news from the G20 summit between Presidents Trump and Xi. President Trump could freeze tariffs at current rates and allow for a more serious negotiating round throughout 2019. But unless China is willing to kowtow to America, a fundamental deal will remain elusive in the end. For Trump, a failure to agree is still a win domestically, as the median American voter is not asking for a resolution of the trade war with China (Chart 46). Chart 46Americans Favor Being Tough On China
OUTLOOK 2019: Late-Cycle Turbulence
OUTLOOK 2019: Late-Cycle Turbulence
Ms. X: Could trade tensions spill into rising military friction? BCA: Absolutely. Minor military skirmishes will likely continue and could even escalate. We believe that there is a structural bull market in “war.” Investors should position themselves by being long global defense stocks. Mr. X: That is not encouraging. What about North Korea and Iran? Could they become geopolitical risks in 2019? BCA: Our answer to the North Korea question remains the same as 12 months ago: we have seen the peak in the U.S.’ display of a “credible military threat.” But Iran could re-emerge as a risk mid-year. We argued in last year’s discussion that President Trump was more interested in playing domestic politics than actually ratcheting up tensions with Iran. However, in early 2018 we raised our alarm level, particularly when staffing decisions in the White House involved several noted Iran hawks joining the foreign policy team. This was a mistake. Our initial call was correct, as President Trump ultimately offered six-month exemptions to eight importers of Iranian crude. That said, those exemptions will expire in the spring. The White House may, at that point, ratchet up tensions with Iran. This time, we will believe it when we see it. Intensifying tensions with Iran ahead of the U.S. summer vacation season, and at a time when crude oil markets are likely to be finely balanced, seems like folly, especially with primary elections a mere 6-to-8 months away. What does President Trump want more: to win re-election or to punish Iran? We think the answer is obvious, especially given that very few voters seem to view Iran as the country’s greatest threat (Chart 47). Chart 47Americans Don’t See Iran As A Major Threat
OUTLOOK 2019: Late-Cycle Turbulence
OUTLOOK 2019: Late-Cycle Turbulence
Ms. X: Let’s turn to Europe. You have tended to dismiss Euroskeptics as a minor threat, which has largely been correct. But don’t you think that, with Brexit upon us and Chancellor Angela Merkel in the twilight, populism in continental Europe will finally have its day? BCA: Let’s first wait to see how Brexit turns out! The next few months will be critical. Uncertainty is high, with considerable risks remaining. We do not think that Prime Minister May has the votes in the House of Commons to push through any version of soft Brexit that she has envisioned thus far. If the vote on the U.K.-EU exit deal falls through, a new election could be possible. This will require an extension of the exit process under Article 50 and a prolonged period of uncertainty. The probability of a no-deal Brexit is lower than 10%. It is simply not in the interest of anyone involved, save for a smattering of the hardest of hard Brexit adherents in the U.K. Conservative Party. Put simply, if the EU-U.K. deal falls through in the House of Commons, or even if PM May is replaced by a hard-Brexit Tory, the most likely outcome is an extension of the negotiation process. This can be easily done and we suspect that all EU member states would be in favor of such an extension given the cost to business sentiment and trade that would result from a no-deal Brexit. It is not clear that Brexit has emboldened Euroskeptics. In fact, most populist parties in the EU have chosen to tone down their Euroskepticism and emphasize their anti-immigrant agenda since the Brexit referendum. In part, this decision has to do with how messy the Brexit process has become. If the U.K. is struggling to unravel the sinews that tie it to Europe, how is any other country going to fare any better? The problem for Euroskeptic populists is that establishment parties are wise to the preferences of the European median voter. For example, we now have Friedrich Merz, a German candidate for the head of the Christian Democratic Union – essentially Merkel’s successor – who is both an ardent Europhile and a hardliner on immigration. This is not revolutionary. Merz simply read the polls correctly and realized that, with 83% of Germans supporting the euro, the rise of the anti-establishment Alternative for Germany (AfD) is more about immigration than about the EU. As such, we continue to stress that populism in Europe is overstated. In fact, we expect that Germany and France will redouble their efforts to reform European institutions in 2019. The European parliamentary elections in May will elicit much handwringing by the media due to a likely solid showing by Euroskeptics, even though the election is meaningless. Afterwards, we expect to see significant efforts to complete the banking union, reform the European Stability Mechanism, and even introduce a nascent Euro Area budget. But these reforms will not be for everyone. Euroskeptics in Central and Eastern Europe will be left on the outside looking in. Brussels may also be emboldened to take a hard line on Italy if institutional reforms convince the markets that the core Euro Area is sheltered from contagion. In other words, the fruits of integration will be reserved for those who play by the Franco-German rules. And that could, ironically, set the stage for the unraveling of the European Union as we know it. Over the long haul, a much tighter, more integrated, core could emerge centered on the Euro Area, with the rest of the EU becoming stillborn. The year 2019 will be a vital one for Europe. We are sensing an urgency in Berlin and Paris that has not existed throughout the crisis, largely due to Merkel’s own failings as a leader. We remain optimistic that the Euro Area will survive. However, there will be fireworks. Finally, a word about Japan. The coming year will see the peak of Prime Minister Shinzo Abe’s career. He is promoting the first-ever revision to Japan’s post-war constitution in order to countenance the armed forces. If he succeeds, he will have a big national security success to couple with his largely effective “Abenomics” economic agenda – after that, it will all be downhill. If he fails, he will become a lame duck. This means that political uncertainty will rise in 2019, after six years of unusual tranquility. Conclusions Mr. X: This is a good place to conclude our discussion. We have covered a lot of ground and your views have reinforced my belief that 2019 could be even more turbulent for financial markets than the past has been. I accept your opinion that a major global economic downturn is not around the corner, but with valuations still stretched, I feel that it makes good sense to focus on capital preservation. I may lose out on the proverbial “blow-off” rally, but so be it – I have been in this business long enough to know that it is much better to leave the party while the music is still playing! Ms. X: I agree with my father that the risks surrounding the outlook have risen as we have entered the late stages of this business-cycle expansion. Yet, if global growth does temporarily stabilize and corporate earnings continue to expand, I fear that being out of the market will be very painful. The era of hyper-easy money may be ending, but interest rates globally are still nowhere near restrictive territory. This tells me that the final stages of this bull market could be very rewarding. A turbulent market is not only one where prices go down – they can also go up a lot! BCA: The debate you are having is one we ourselves have had on numerous occasions. There is always a trade-off between maximizing short-term returns and taking a longer-term approach. Valuations are the ultimate guidepost for long-term returns. While most assets have cheapened over the past year, prices are still fairly elevated. Table 4 shows our baseline calculations of what a balanced portfolio will earn over the coming decade. We estimate that such a portfolio will deliver average annual returns of 4.9% over the next ten years, or 2.8% after adjusting for inflation. That is an improvement over our inflation-adjusted estimate of 1.3% from last year, but still well below the 6.6% real return that a balanced portfolio earned between 1982 and 2018. Table 410-Year Asset Return Projections
OUTLOOK 2019: Late-Cycle Turbulence
OUTLOOK 2019: Late-Cycle Turbulence
Our return calculations for equities assume that profit margins decline modestly over the period and that multiples mean revert to their historical average. These assumptions may turn out to be too pessimistic if underlying changes in the economy keep corporate profits elevated as a share of GDP. Structurally lower real interest rates may also justify higher P/E multiples, although this would be largely offset by the prospect of slower economic growth, which will translate into slower earnings growth. In terms of the outlook for the coming year, a lot hinges on our view that monetary policy in the main economies stays accommodative. This seems like a safe assumption in the Euro Area and Japan, where rates are near historic lows, as well as in China, where the government is actively loosening monetary conditions. It is not such a straightforward conclusion for the U.S., where the Fed is on track to keep raising rates. If it turns out that the neutral interest rate is not far above where rates are already, we could see a broad-based slowdown of the U.S. economy that ripples through to the rest of the world. And even if U.S. monetary policy does remain accommodative, many things could still upset the apple cart, including a full-out trade war, debt crises in Italy or China, or a debilitating spike in oil prices. As the title of our outlook implies, 2019 is likely to be a year of increased turbulence. Ms. X: As always, you have left us with much to think about. My father has looked forward to these discussions every year and now that I am able to join him, I understand why. Before we conclude, it would be helpful to have a recap of your key views. BCA: That would be our pleasure. The key points are as follows: The collision between policy and markets that we discussed last year finally came to a head in October. Rather than falling as they normally do when stocks plunge, U.S. bond yields rose as investors reassessed the willingness of the Fed to pause hiking rates even in the face of softer growth. Likewise, hopes that China would move swiftly to stimulate its economy were dashed as it became increasingly clear that the authorities were placing a high emphasis on their reform agenda of deleveraging and capacity reduction. The ongoing Brexit saga and the stalemate between the populist Italian government and the EU have increased uncertainty in Europe at a time when the region was already beginning to slow. We expect the tensions between policy and markets to be an ongoing theme in 2019. With the U.S. unemployment rate at a 48-year low, it will take a significant slowdown for the Fed to stop hiking rates. Despite the deterioration in economic data over the past month, real final domestic demand is still tracking to expand by 3% in the fourth quarter, well above estimates of the sustainable pace of economic growth. Ultimately, the Fed will deliver more hikes next year than discounted in the markets. This will push up the dollar and keep the upward trend in Treasury yields intact. The dollar should peak midway next year. China will also become more aggressive in stimulating its economy, which will boost global growth. However, until both of these things happen, emerging markets will remain under pressure. For the time being, we continue to favor developed market equities over their EM peers. We also prefer defensive equity sectors such as health care and consumer staples over cyclical sectors such as industrials and materials. Within the developed market universe, the U.S. will outperform Europe and Japan for the next few quarters, especially in dollar terms. A stabilization in global growth could ignite a blow-off rally in global equities. If the Fed is raising rates in response to falling unemployment, this is unlikely to derail the stock market. However, once supply-side constraints begin to fully bite in early 2020 and inflation rises well above the Fed’s target of 2%, stocks will begin to buckle. This means that a window exists next year where stocks will outperform bonds. We would maintain a benchmark allocation to stocks for now, but increase exposure if global bourses were to fall significantly from current levels without a corresponding deteriorating in the economic outlook. Corporate credit will underperform stocks as government bond yields rise. A major increase in spreads is unlikely as long as the economy is still expanding, but spreads could still widen modestly given their low starting point. U.S. shale companies have been the marginal producers in the global oil sector. With breakeven costs in shale close to $50/bbl, crude prices are unlikely to rise much from current levels over the long term. However, over the next 12 months, we expect production cuts in Saudi Arabia will push prices up, with Brent crude averaging around $82/bbl in 2019. A balanced portfolio is likely to generate average returns of only 2.8% a year in real terms over the next decade. This compares to average returns of around 6.6% a year between 1982 and 2018. We would like to take this opportunity to wish you and all of our clients a very peaceful, healthy and prosperous New Year. The Editors November 26, 2018
Highlights Equities had a wild ride in October, ... : The S&P 500 has bounced smartly off of its October 29th lows, but the decline that preceded the bounce was unusually severe. ... that unsettled a lot of investors, and made us reconsider our constructive take on risk assets: To judge by the November 5th Barron's, and some client conversations, several technically-minded investors are unconvinced by the bounce. Nothing has changed with our equity downgrade checklist, however, ... : The fundamental picture hasn't changed at all - neither corporate revenues nor margins appear to be in any immediate difficulty; though we still expect inflation to surprise to the upside, the latest data will not push the Fed to speed up its gradual rate-hike pace; and the combination of blockbuster third-quarter earnings and October's selloff made valuations more reasonable. ... so we see no reason to downgrade equities now, though we do have the admonition of a Wall Street legend ringing in our ears: If the fundamental backdrop remained unchanged, we would be inclined to upgrade equities if the S&P 500 got back to the 2,600-2,640 range, even though we are operating with a heightened sense of vigilance befitting the lateness of the hour. Feature It has been just four weeks since we rolled out our equity downgrade checklist. We would not ordinarily devote an entire Weekly Report to reviewing all of its components, but the last four weeks have hardly been ordinary. The swiftness of the decline, and the apparent lateness of the cycle, have unsettled investors enough to make several of them reconsider just how long they want to stay at the bull-market party. At times when market action provokes emotional gut checks, it is essential for investors to have a process to fall back on. Process provides a rational, objective haven from noise and emotion, and should help foster better decision-making. Our commitment to process underpins our fondness for checklists. They will never be comprehensive - as usual, we have our minds on other important inputs - but they help to ground our thinking, and we're happy to have them when markets make wild swings. Has The Recession Timetable Speeded Up? We are not interested in recessions for their own sake - we'll let the NBER's Business Cycle Dating Committee tell us when recessions begin and end, several months after the fact - but they're poison for risk assets. Any asset allocator who can recognize them in a timely fashion has a leg up on outperforming the competition. We therefore have been repeatedly monitoring the individual components of our recession indicator (Table 1). They do not betray any more concern than they did four weeks ago. Table 1Equity Downgrade Checklist
Checking In On Our Equity Downgrade Checklist
Checking In On Our Equity Downgrade Checklist
The yield curve is clearly flattening, just as one would expect as the Fed gets further into a rate-hiking campaign, but it is still a comfortable distance from inverting (Chart 1). We think yields at the long end have a way to go before they stop rising, so we expect the fed funds rate will have to get well into the 3's before the 3-month bill rate can overtake the 10-year Treasury yield. The Conference Board's Leading Economic Indicator is still expanding at a robust clip (Chart 2). Finally, we estimate the fed funds rate is about a year away from exceeding the equilibrium rate, thus signaling that policy has turned restrictive. Chart 1The Yield Curve Is Flattening, But It's Not About To Invert ...
The Yield Curve Is Flattening, But It's Not About To Invert ...
The Yield Curve Is Flattening, But It's Not About To Invert ...
Chart 2... And Leading Economic Indicators Are Still Surging
... And Leading Economic Indicators Are Still Surging
... And Leading Economic Indicators Are Still Surging
The unemployment rate continues to fall. Reversing the trend so that the three-month moving average could back up by the third of a percentage point that has unfailingly accompanied recessions (Chart 3) would require net monthly payroll additions to crater. Assuming annual population growth of 1%, and a constant labor force participation rate, net monthly job gains would have to fall to 100,000 for the three-month moving average to back up to 4% in 2020; if the pace of gains merely held at 120,000, the unemployment recession signal wouldn't be issued until 2021 (Chart 4). We applied the same conditions to the Atlanta Fed's online unemployment calculator to see what it would take for the unemployment rate to cross into the danger zone in 2019 (Table 2). Since the seven-year trend of 200,000 monthly net payroll additions would have to reverse on a dime for unemployment to issue a near-term warning, we do not foresee checking this box anytime soon. Chart 3Investors Should Beware An Uptick In The Unemployment Rate ...
Investors Should Beware An Uptick In The Unemployment Rate ...
Investors Should Beware An Uptick In The Unemployment Rate ...
Chart 4... But None Is Forthcoming ...
... But None Is Forthcoming ...
... But None Is Forthcoming ...
Table 2... Unless Hiring Falls Off A Cliff
Checking In On Our Equity Downgrade Checklist
Checking In On Our Equity Downgrade Checklist
Are Corporate Earnings Coming Under Pressure? As we mentioned last week, we view the labor market as tight and getting tighter. We thereby expect that wages are on their way to rising enough to crimp corporate margins, albeit slowly. The composite employment cost index has been in an uptrend since 2016, but it ticked lower last month, and remains well below its cyclical highs ahead of the last two recessions (Chart 5). Chart 5Snails, Godot, Molasses And Wages
Snails, Godot, Molasses And Wages
Snails, Godot, Molasses And Wages
October's global upheaval was good for the safe-haven dollar, which surged to a new year-to-date high (Chart 6). The DXY dollar index is now within 3% of the 100 level that would lead us to check the dollar strength box. Even though we're not checking the box yet, the dollar's 10% advance since mid-February will exert a modest drag on S&P 500 earnings for the next few quarters. Triple-B corporate yields have ticked a little higher since we rolled out the checklist, extending their six-year highs (Chart 7), though we still view them as manageable. Chart 6A Gentle Headwind (For Now)
A Gentle Headwind (For Now)
A Gentle Headwind (For Now)
Chart 7Higher Yields Aren't Biting Yet
Higher Yields Aren't Biting Yet
Higher Yields Aren't Biting Yet
A rising savings rate would cancel out some of the top-line benefits from employment gains. It fell pretty sharply in the third quarter, however, amplifying the self-reinforcing effect of new hiring. It's at the bottom of the range that's prevailed since 2014 (Chart 8), but could go still lower if consumption tracks the robust consumer confidence readings, as it consistently has in the past. Chart 8Consumers Are Well-Fortified
Consumers Are Well-Fortified
Consumers Are Well-Fortified
EM economies have become considerably more indebted since the crisis, as developed-world savings sought an outlet; corporate profits are falling; and a stronger dollar makes it harder for EM borrowers to service their USD-denominated debt. A credit crisis (or multiple credit crises) could slow global activity enough to pressure multinationals' earnings, even if the U.S. economy is mostly insulated from EM wobbles. EM equities have gotten a respite since global equities put in their year-to-date lows, and Chinese stimulus could extend EM economies a lifeline, though BCA expects that Beijing will disappoint investors hoping for a meaningful boost. We remain bearish on emerging markets as a firm, but EM distress is not anywhere near acute enough to justify ticking the box. Is Inflation Starting To Make The Fed Uneasy? There are two channels by which inflation could pose a problem for equities. The first is the Fed: if it is discomfited by what it sees in realized inflation, or perceives that inflation expectations could become unanchored, it is likely to move forcefully to quash upward pressure on prices. A forceful pace is considerably faster than a gradual pace, and would bring forward a monetary policy inflection. If policy flips from accommodative to restrictive sooner than we expect, the window for risk-asset outperformance will shrink. With all of its talk about symmetric inflation targets, the FOMC has made it clear that it will not make any attempt to defend its 2% core PCE inflation target. It is comfortable with an overshoot, and has indeed openly wished for one for much of the post-crisis era. There are limits to its indulgence, however, and we suspect that the Fed would not be comfortable if core PCE inflation were to make a new 20-year high above 2.5%. With that red line far off (Chart 9), inflation is not yet likely to encourage the Fed to quicken the pace at which it removes accommodation. Chart 9Turtles, Sloths And Inflation
Turtles, Sloths And Inflation
Turtles, Sloths And Inflation
Inflation expectations aren't yet pressing the Fed to speed things up, either. Long-maturity TIPS break-evens have retreated slightly since mid-October, and have yet to enter the range consistent with the 2% inflation target (Chart 10). The media and the broad mass of investors don't bother with symmetric targets, or implied break-evens; they take their cues from consumer prices. A multiple haircut driven by popular inflation fears is the second channel by which inflation could halt the equity advance, but CPI remains well below the mid-3% levels that would provoke concern (Chart 11). Chart 10Stubbornly Well-Anchored
Stubbornly Well-Anchored
Stubbornly Well-Anchored
Chart 11No Reason To Trim Multiples Yet
No Reason To Trim Multiples Yet
No Reason To Trim Multiples Yet
So What's To Worry About? Irrational exuberance is always a concern after an extended period of gains, but there's no sign of it in broad market measures right now. Blockbuster earnings gains have pulled the S&P 500's forward P/E multiple back down to the 15s from its January peak above 18. Secondary measures like price-to-sales, price-to-book, and price-to-cash-flow are well below extreme levels in the aggregate. If the S&P 500 is going to get silly, it will have to surge first. That said, the latter stages of bull markets and expansions can be perilous, and we are on high alert. We continue to actively seek out any evidence that challenges our broadly constructive take on risk assets and the U.S. economy. Though we have yet to find anything compelling, an admonition from legendary technical analyst and strategist Bob Farrell has lodged in our mind. Rule number nine of Farrell's ten market rules to remember states, "When all the experts and forecasts agree - something else is going to happen." It's much more fun to bring novel views and analysis to our clients, but we don't get overly concerned about agreeing with investor consensus. It's inevitable that a lot of people will agree in the middle of extended cycles; we simply strive to be among the first to recognize the major macro inflection points and determine the optimal asset-allocation framework to benefit from them. We get a little antsy, though, when everyone knows that something is either certain to happen, or cannot happen by any stretch of the imagination. The near-unanimity with which the investment community believes that a recession cannot begin in 2019 is increasingly eating at us. We have been checking and re-checking the data, and checking and re-checking our colleagues' various models, in search of trouble, but to no avail. Even though recessions begin at economic peaks, and the economy nearly always appears to be in fine fettle when the downturn asserts itself, the sizable fiscal thrust on tap for 2019 seems to obviate the possibility of a contraction. When discussing potential risks in face-to-face meetings with clients this week, we most often cited trade tensions, as any material rollback of globalization would erode corporate profit margins and would strike at global trade, on which much of the rest of world's economies rely. A dramatic worsening of the trade picture is not our base case, but we do expect upside surprises in inflation, and an attendant upside surprise in the terminal fed funds rate. We have been considering that view mainly from the perspective of fixed-income positioning: underweight Treasuries and maintain below-benchmark duration. We also have been assuming that the FOMC would lift the fed funds rate to 3.5% at the end of 2019 via four quarter-point rate hikes, and possibly take it all the way to 4% in the first half of 2020. If it were to speed up its pace, and take the fed funds rate to 3.5% by the middle of next year, and 4% by the end, we believe financial conditions would tighten enough to choke off the expansion. Monetary policy impacts the economy with a lag, so a recession may still not begin until 2020 in that scenario, but we'd bet that an equity bear market would begin in 2019. Investment Implications Balanced investors should maintain at least an equal weight position in equities. Although our checklist is a downgrade checklist, we're alert to opportunities to upgrade as well as downgrade. As we first wrote one week before the October selloff ended, we would look to overweight equities if the S&P 500 were to dip back into the 2,600-2,640 range (Chart 12). If U.S. equities wobble again in line with our Global Investment Strategy team's MacroQuant model's near-term discomfort, investors may get another opportunity before the year is out. Chart 12Only One Chance To Upgrade So Far, But There May Be More
Only One Chance To Upgrade So Far, But There May Be More
Only One Chance To Upgrade So Far, But There May Be More
Doug Peta, Senior Vice President U.S. Investment Strategy dougp@bcaresearch.com