Sectors
As this winter’s fall in bond yields boosted high dividend yielding stocks, the S&P telecom services index enjoyed a brief respite from its decade long more-or-less steady underperformance. Furthermore, the massive deflation in telco selling prices looked…

Tough Times For Telco Top Lines
Tough Times For Telco Top Lines
Tough Times For Telco Top Lines
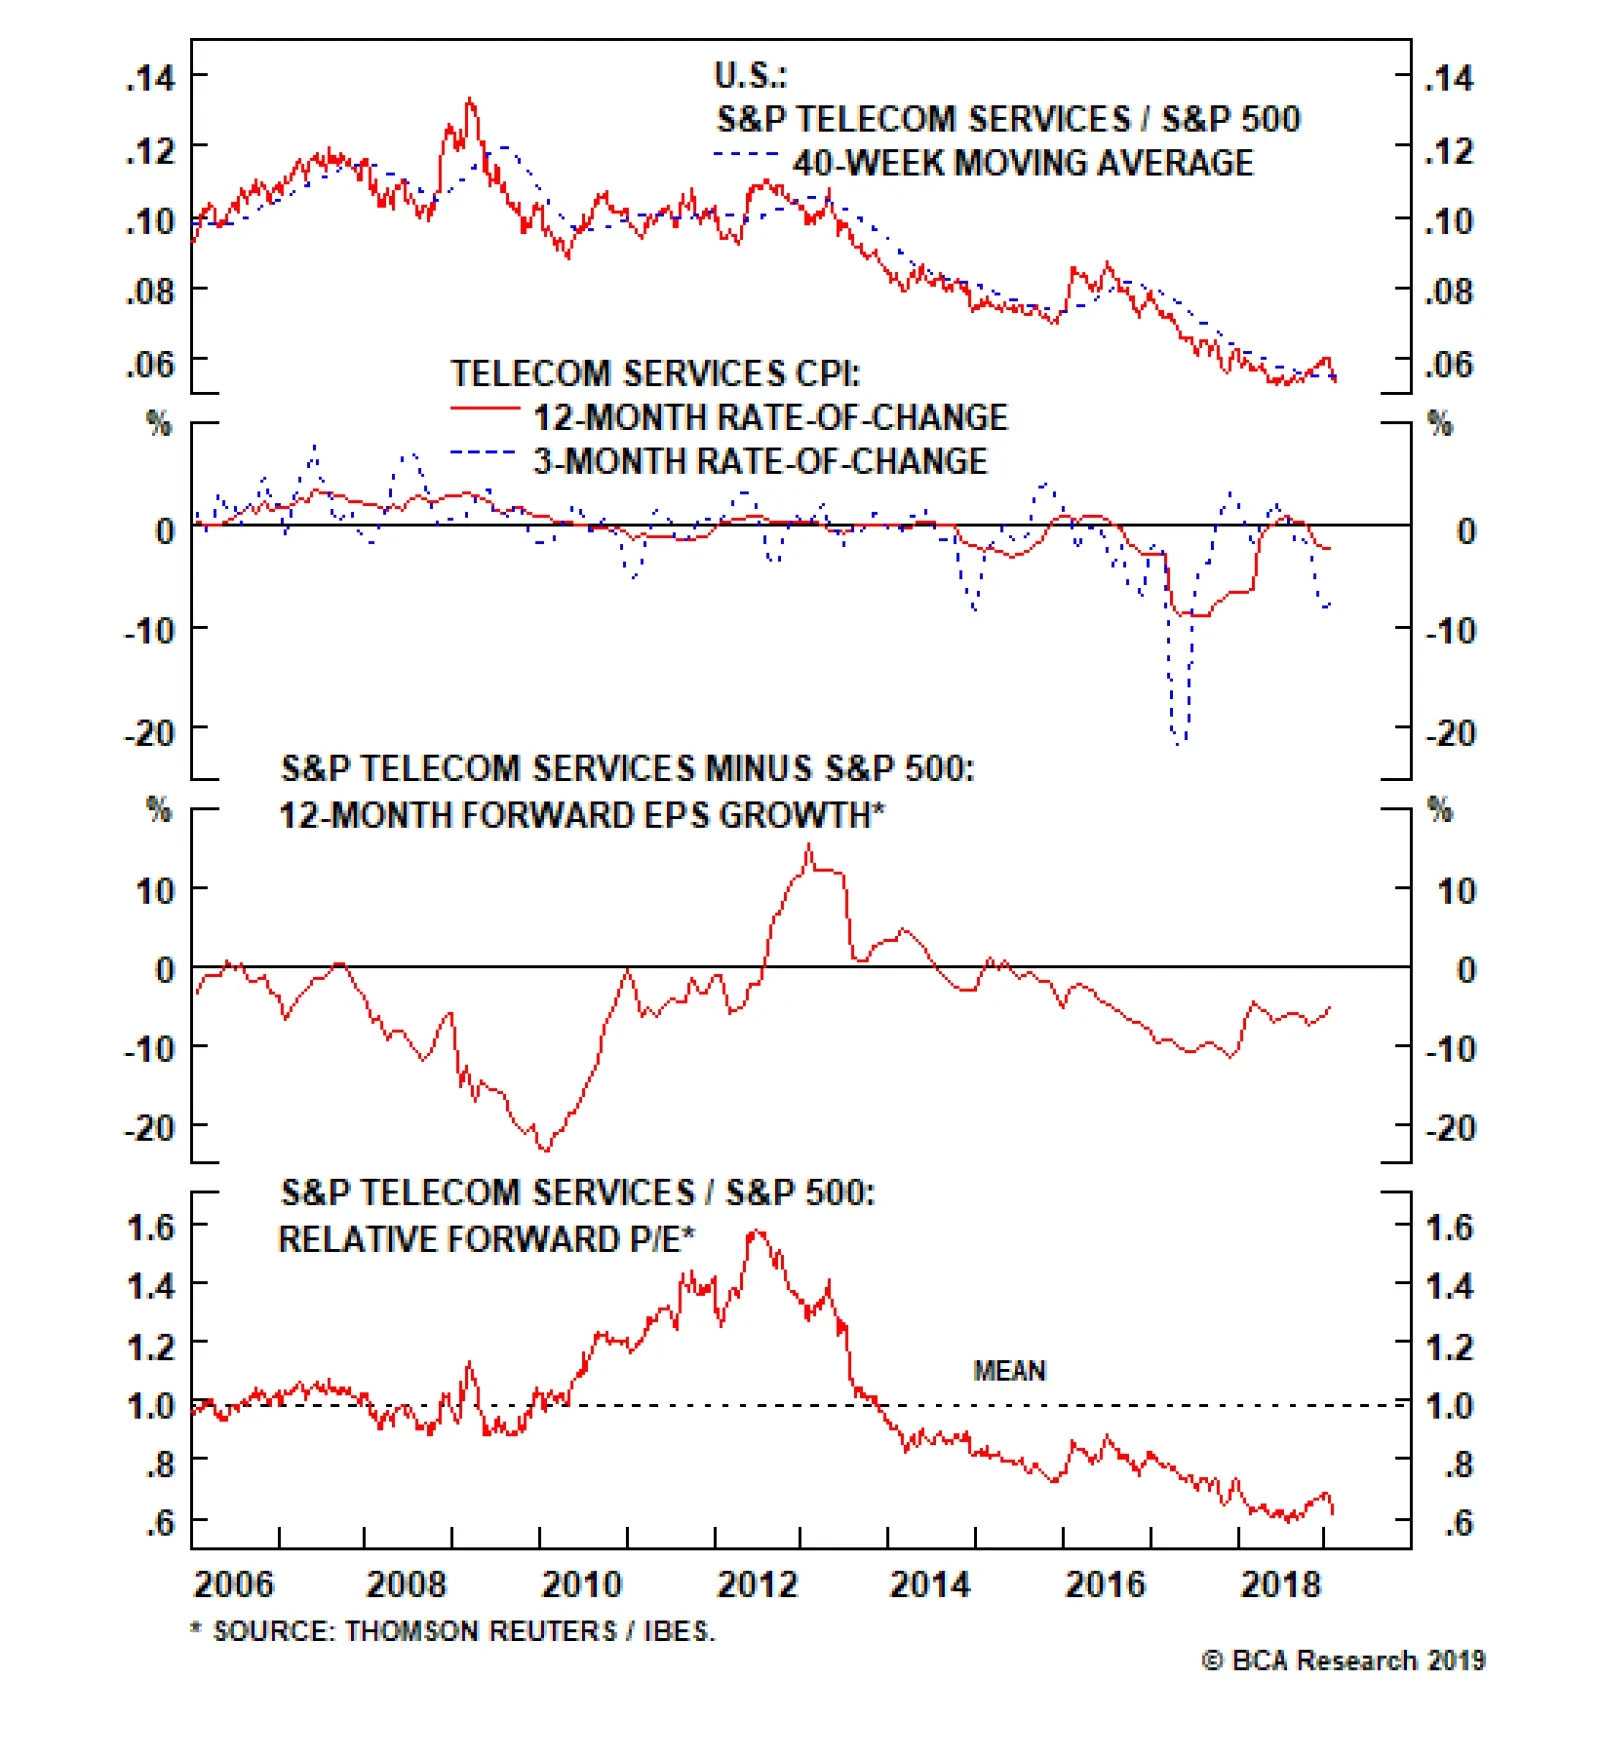
Underweight The S&P telecom services index had recently been enjoying a brief respite from their mostly steady relative performance decline over the past decade, as a fall in yields boosted these high dividend yielding stocks. Further, the massive deflation in selling prices looked like it had taken a breather (second panel). However, yields have since stabilized and selling prices have resumed their descent and the S&P telecom services index in 2019 has given up all the ground it made in the back half of 2018. Despite the negative pricing picture facing telcos, relative EPS growth has been fairly stable although estimates continue to trail the growth of the broad market (third panel). This sell side optimism seems misplaced as the current trajectory of selling prices resembles the fall in late-2016. Should a wave of downward revisions arrive, the sector’s valuation discount (bottom panel) would likely evaporate. Further, we continue to expect rates to rise in the back half of this year, adding another headwind to the troubled sector; stay underweight the S&P telecom services index. The ticker symbols for the stocks in this index are: BLBG: S5TELSX - T, VZ, CTL.
Pharmaceutical companies have been nearly uninterruptedly raising prices for the past four decades. Higher selling prices have been synonymous with higher profits and thus, higher share prices. However, profit margins crested right after the late-1990’s…
Soft Drinks Have Gone Flat
Soft Drinks Have Gone Flat
Underweight S&P soft drinks index heavyweight Coke reported its results last week and though it beat earnings estimates, the stock offered its worst performance in more than a decade. This is despite solid pricing gains for the industry as a whole (second panel) and for Coke in particular. The reason for the fall was weak guidance for the year ahead; Coke flagged weakening EM consumer trends and currency headwinds as the key culprits behind the softening results. This jives with the pain all consumer products exporters are feeling (third panel), perhaps more acutely by Coke given the majority of their revenues are derived overseas. Regardless of a supportive pricing environment, S&P soft drinks sector EPS growth has been trailing the broad market for the better part of the last ten years (fourth panel). Even with the recent drubbing the index has taken, it continues to sport a more than 20% premium to the broad market (bottom panel). Stay underweight. The ticker symbols for the stocks in this index are: BLBG: S5SOFD - PEP, KO, DPS, MNST.
Overweight S&P Biotech
Overweight…
Highlights Equities can continue to outperform bonds for a few months longer. The pro-cyclical equity sector stance that has worked well since last October can also continue for a few months longer. Overweight pro-cyclical Sweden versus pro-defensive Denmark. The caveat is that these short-term trends are unlikely to persist and will viciously reverse later in the year. European ‘soft’ luxury goods companies are an excellent structural investment opportunity. Take profits on the 75 percent rally in Litecoin and 50 percent rally in Ethereum. Feature Why should European investors care so much about China? The Chart of the Week provides one emphatic answer. For Europe’s $500 billion basic resources sector, the three most important things in the world are: China, China, and China. Through the past decade, the share price performance of the resource behemoths BHP, Anglo American, Rio Tinto, and Glencore have been joined at the hip to China’s short-term credit impulse (Chart I-2 and Chart I-3). Chart of the WeekFor European Basic Resources, The Three Most Important Things In the World Are: China, China, And China
For European Basic Resources, The Three Most Important Things In the World Are: China, China, And China
For European Basic Resources, The Three Most Important Things In the World Are: China, China, And China
Chart I-2BHP, Anglo American, And Rio Tinto Have Been Rallying For Several Months
BHP, Anglo American, And Rio Tinto Have Been Rallying For Several Months
BHP, Anglo American, And Rio Tinto Have Been Rallying For Several Months
Chart I-3BHP Is Joined At The Hip To China's Short-Term Credit Impulse
BHP Is Joined At The Hip To China's Short-Term Credit Impulse
BHP Is Joined At The Hip To China's Short-Term Credit Impulse
But China has a much deeper importance to Europe. According to Mario Draghi, the recent cycle in Europe is ‘made in China’. On the euro area’s domestic fundamentals, Draghi is upbeat, citing “supportive financing conditions, favourable labour market dynamics and rising wage growth”. Yet the economic data have continued to be weaker than expected. Why? Draghi blames a “slowdown in external demand” and specifically, vulnerabilities in emerging markets. He claims that as soon as there is clarity on the exports and the trade sector, much of the euro area’s weakness will wash out. Federal Reserve Chairman, Jay Powell presented a remarkably similar narrative to justify the recent pause in the Fed’s sequential rate hikes: “The U.S. economy is in a good place… but growth has slowed in some major foreign economies.” If Powell claims that the U.S. domestic economy is in a good place and Draghi points out that the euro area domestic fundamentals are fine, then the explanation for what has happened – and what will happen – can only come from one place: China. Optimistically, Draghi adds: “everything we know says that China’s government is actually taking strong measures to address the slowdown.” The good news is that we can independently corroborate Draghi’s optimism, at least in the near-term (Chart I-4). Chart I-4China's Short-Term Credit Impulse Is Up Sharply, And Commodities Have Rebounded
China's Short-Term Credit Impulse Is Up Sharply, And Commodities Have Rebounded
China's Short-Term Credit Impulse Is Up Sharply, And Commodities Have Rebounded
Why China Matters To Europe Chart I-5 shows the short-term credit impulses in the euro area, U.S., and China through the past twenty years. They are all expressed in dollars to allow an apples for apples comparison between the three major economies. The comparison reveals a fascinating transformation. The dominant short-term impulse – the one with the highest amplitude – charts the shift in global economic power and influence from Europe and the U.S. to China. Chart I-5The Shift In Global Economic Power From Europe And The U.S. To China
The Shift In Global Economic Power From Europe And The U.S. To China
The Shift In Global Economic Power From Europe And The U.S. To China
Before 2008, the short-term impulses in the euro area and the U.S. dominated. But the global financial crisis was a major turning point: the credit stimulus from China dwarfed the responses from the western economies. Then through 2009-12 the impulse oscillations from the three major economies took it in turns to dominate. For example, the 2011-12 global downturn was definitely ‘made in Europe’. However, since 2013 China has taken on the undisputed mantle of dominant impulse. Most recently, last year’s peak to trough decline in China’s short-term impulse amounted to $1 trillion, equivalent to a 1.5 percent drag on global GDP. By comparison, the declines in the euro area and the U.S. amounted to a much more modest $200 billion. Likewise, the recent rebound in the China’s short-term impulse, in dollar terms, has been much larger than the respective rebounds in the euro area and the U.S. Credit Impulses And Speeding Tickets Clients complain that they are confused by the conflicting messages from differently calculated credit impulses. So let’s digress for a moment to present a powerful analogy which should clear the confusion once and for all. Imagine you floored the accelerator pedal of your car (analogous to a huge stimulus). After a hundred metres or so, the stimulus would become very apparent. Your speed over that short sprint would have surged, and possibly have become illegal! But your average speed measured over the previous kilometre would have barely changed. Now imagine a police officer rightfully presents you with a speeding ticket. To protest your innocence, you argue that you couldn’t have floored the accelerator pedal because your average speed over the previous kilometre had barely changed! Clearly, you would never offer such a ludicrous defence for pushing the pedal to the metal. Yet when assessing the impact of an economic stimulus, it is commonplace to make the same mistake. The crucial point is that a stimulus – like flooring the accelerator pedal of your car – will barely move the needle for a longer-term rate of change, but it will become very apparent in a short-term rate of change. For this reason, financial markets never wait for the long-term rates of change to pick up. They always move up or down on the evolution of short-term rates of change. It follows that the credit impulse calculation that is most relevant is the one that provides the best explanatory power for the cycles that we actually observe in the economic and financial market data. As we described in our Special Report, “The Cobweb Theory And Market Cycles”, both the theory and evidence powerfully identify the 6-month credit impulse as the one with the best explanatory power for the oscillations that we actually observe in the economy and markets.1 For the sceptics, the charts in this report should finally dispel any lingering doubts. China’s 6-month impulse gives a spookily perfect explanation for the industrial commodity inflation cycle, and thereby the share price performance of the basic resources sector, as well as the other classically cyclical sectors (Chart I-6 and Chart I-7). Chart I-6China's Short-Term Impulse Perfectly Explains Industrial Commodity Inflation
China's Short-Term Impulse Perfectly Explains Industrial Commodity Inflation
China's Short-Term Impulse Perfectly Explains Industrial Commodity Inflation
Chart I-7Semiconductors Are A Modern Day Cyclical
Semiconductors Are A Modern Day Cyclical
Semiconductors Are A Modern Day Cyclical
The good news is that China’s short-term impulse has indisputably been in a mini-upswing in recent months, and this is the reason that the classical cyclical sectors have simultaneously rebounded or, at the very least, stabilised. The bad news is that the shelf-life of such mini-upswings averages no more than eight months or so. Intuitively, this is because just as you cannot accelerate your car indefinitely, it is likewise impossible to stimulate credit growth indefinitely. The investment conclusion is that the pro-cyclical equity sector stance that has worked well since last October can continue for a few months longer. This sector stance necessarily impacts regional and country allocation. For example, it is still right to be overweight pro-cyclical Sweden versus pro-defensive Denmark (Chart I-8 and Chart I-9). Chart I-8Overweight Pro-Cyclical Sweden Versus Denmark...
Overweight Pro-Cyclical Sweden Versus Denmark...
Overweight Pro-Cyclical Sweden Versus Denmark...
Chart I-9...And Versus Norway
...And Versus Norway
...And Versus Norway
From an asset allocation perspective, it means that equities can continue to outperform bonds for the time being. But the caveat is that these short-term trends are unlikely to persist, and most likely, they will viciously reverse later in the year. Stay tuned for the signal to switch. Stay Structurally Overweight ‘Soft’ Luxuries A common question we get concerns the European luxury goods sector: is it, just like the basic resources sector, a direct play on China’s growth cycle? The answer is no. Recently, the connection between the fortunes of ‘soft’ luxury goods brands like LVMH, Hermes, and Kering and China’s growth cycle has been weak (Chart I-10). Broadly, this is also true for ‘hard’ luxury brands – for example, luxury watches – like Richemont (Chart I-11). Chart I-10European 'Soft' Luxuries Are No Longer A China Play...
European 'Soft' Luxuries Are No Longer A China Play...
European 'Soft' Luxuries Are No Longer A China Play...
Chart I-11...Neither Are European 'Hard' Luxuries
...Neither Are European 'Hard' Luxuries
...Neither Are European 'Hard' Luxuries
As we highlighted in Buying European Clothes: An Investment Megatrend, the much bigger driver for the ‘soft’ luxury brands is the structural increase in female labour participation rates, and the feminisation of consumer spending. We expect this trend to persist for the next decade.2 Hence, we are happy to buy and hold the European clothes and accessories companies with a dominant or significant exposure to women’s clothes and/or accessories; provided they have a top-end brand (or brands) giving pricing power, and mitigating the very strong deflation in clothes prices. In summary, while European basic resources are a good tactical investment opportunity, European ‘soft’ luxury goods companies are an excellent structural investment opportunity. Fractal Trading System* We are delighted to report that the fractal trading system perfectly identified the sharp recent rebound in cryptocurrencies. Our long Litecoin and Ethereum position has hit its 60 percent profit target with Litecoin up 75 percent and Ethereum up 50 percent since trade initiation on December 19. Additionally, long industrials versus utilities has also hit its profit target. With no new trades this week, the fractal trading system now has five open positions. For any investment, excessive trend following and groupthink can reach a natural point of instability, at which point the established trend is highly likely to break down with or without an external catalyst. An early warning sign is the investment’s fractal dimension approaching its natural lower bound. Encouragingly, this trigger has consistently identified countertrend moves of various magnitudes across all asset classes. Chart I-12
Litecoin Is Oversold On A 65-Day Horizon
Litecoin Is Oversold On A 65-Day Horizon
The post-June 9, 2016 fractal trading model rules are: When the fractal dimension approaches the lower limit after an investment has been in an established trend it is a potential trigger for a liquidity-triggered trend reversal. Therefore, open a countertrend position. The profit target is a one-third reversal of the preceding 13-week move. Apply a symmetrical stop-loss. Close the position at the profit target or stop-loss. Otherwise close the position after 13 weeks. Use the position size multiple to control risk. The position size will be smaller for more risky positions. * For more details please see the European Investment Strategy Special Report “Fractals, Liquidity & A Trading Model,” dated December 11, 2014, available at eis.bcaresearch.com Dhaval Joshi, Senior Vice President Chief European Investment Strategist dhaval@bcaresearch.com Footnote 1 Please see the European Investment Strategy Special Report “The Cobweb Theory And Market Cycles” January 11, 2018 available at eis.bcaresearch.com 2 Please see the European Investment Strategy Special Report “Buying European Clothes: An Investment Megatrend” December 6, 2018 available at eis.bcaresearch.com Fractal Trading System Recommendations Asset Allocation Equity Regional and Country Allocation Equity Sector Allocation Bond and Interest Rate Allocation Currency and Other Allocation Closed Fractal Trades Trades Closed Trades Asset Performance Currency & Bond Equity Sector Country Equity Indicators Bond Yields Chart II-1Indicators To Watch - Bond Yields
Indicators To Watch - Bond Yields
Indicators To Watch - Bond Yields
Chart II-2Indicators To Watch - Bond Yields
Indicators To Watch - Bond Yields
Indicators To Watch - Bond Yields
Chart II-3Indicators To Watch - Bond Yields
Indicators To Watch - Bond Yields
Indicators To Watch - Bond Yields
Chart II-4Indicators To Watch - Bond Yields
Indicators To Watch - Bond Yields
Indicators To Watch - Bond Yields
Interest Rate Chart II-5Indicators To Watch - Interest Rate Expectations
Indicators To Watch - Interest Rate Expectations
Indicators To Watch - Interest Rate Expectations
Chart II-6Indicators To Watch - Interest Rate Expectations
Indicators To Watch - Interest Rate Expectations
Indicators To Watch - Interest Rate Expectations
Chart II-7Indicators To Watch - Interest Rate Expectations
Indicators To Watch - Interest Rate Expectations
Indicators To Watch - Interest Rate Expectations
Chart II-8Indicators To Watch - Interest Rate Expectations
Indicators To Watch - Interest Rate Expectations
Indicators To Watch - Interest Rate Expectations
...Pharmas Pain
...Pharmas Pain
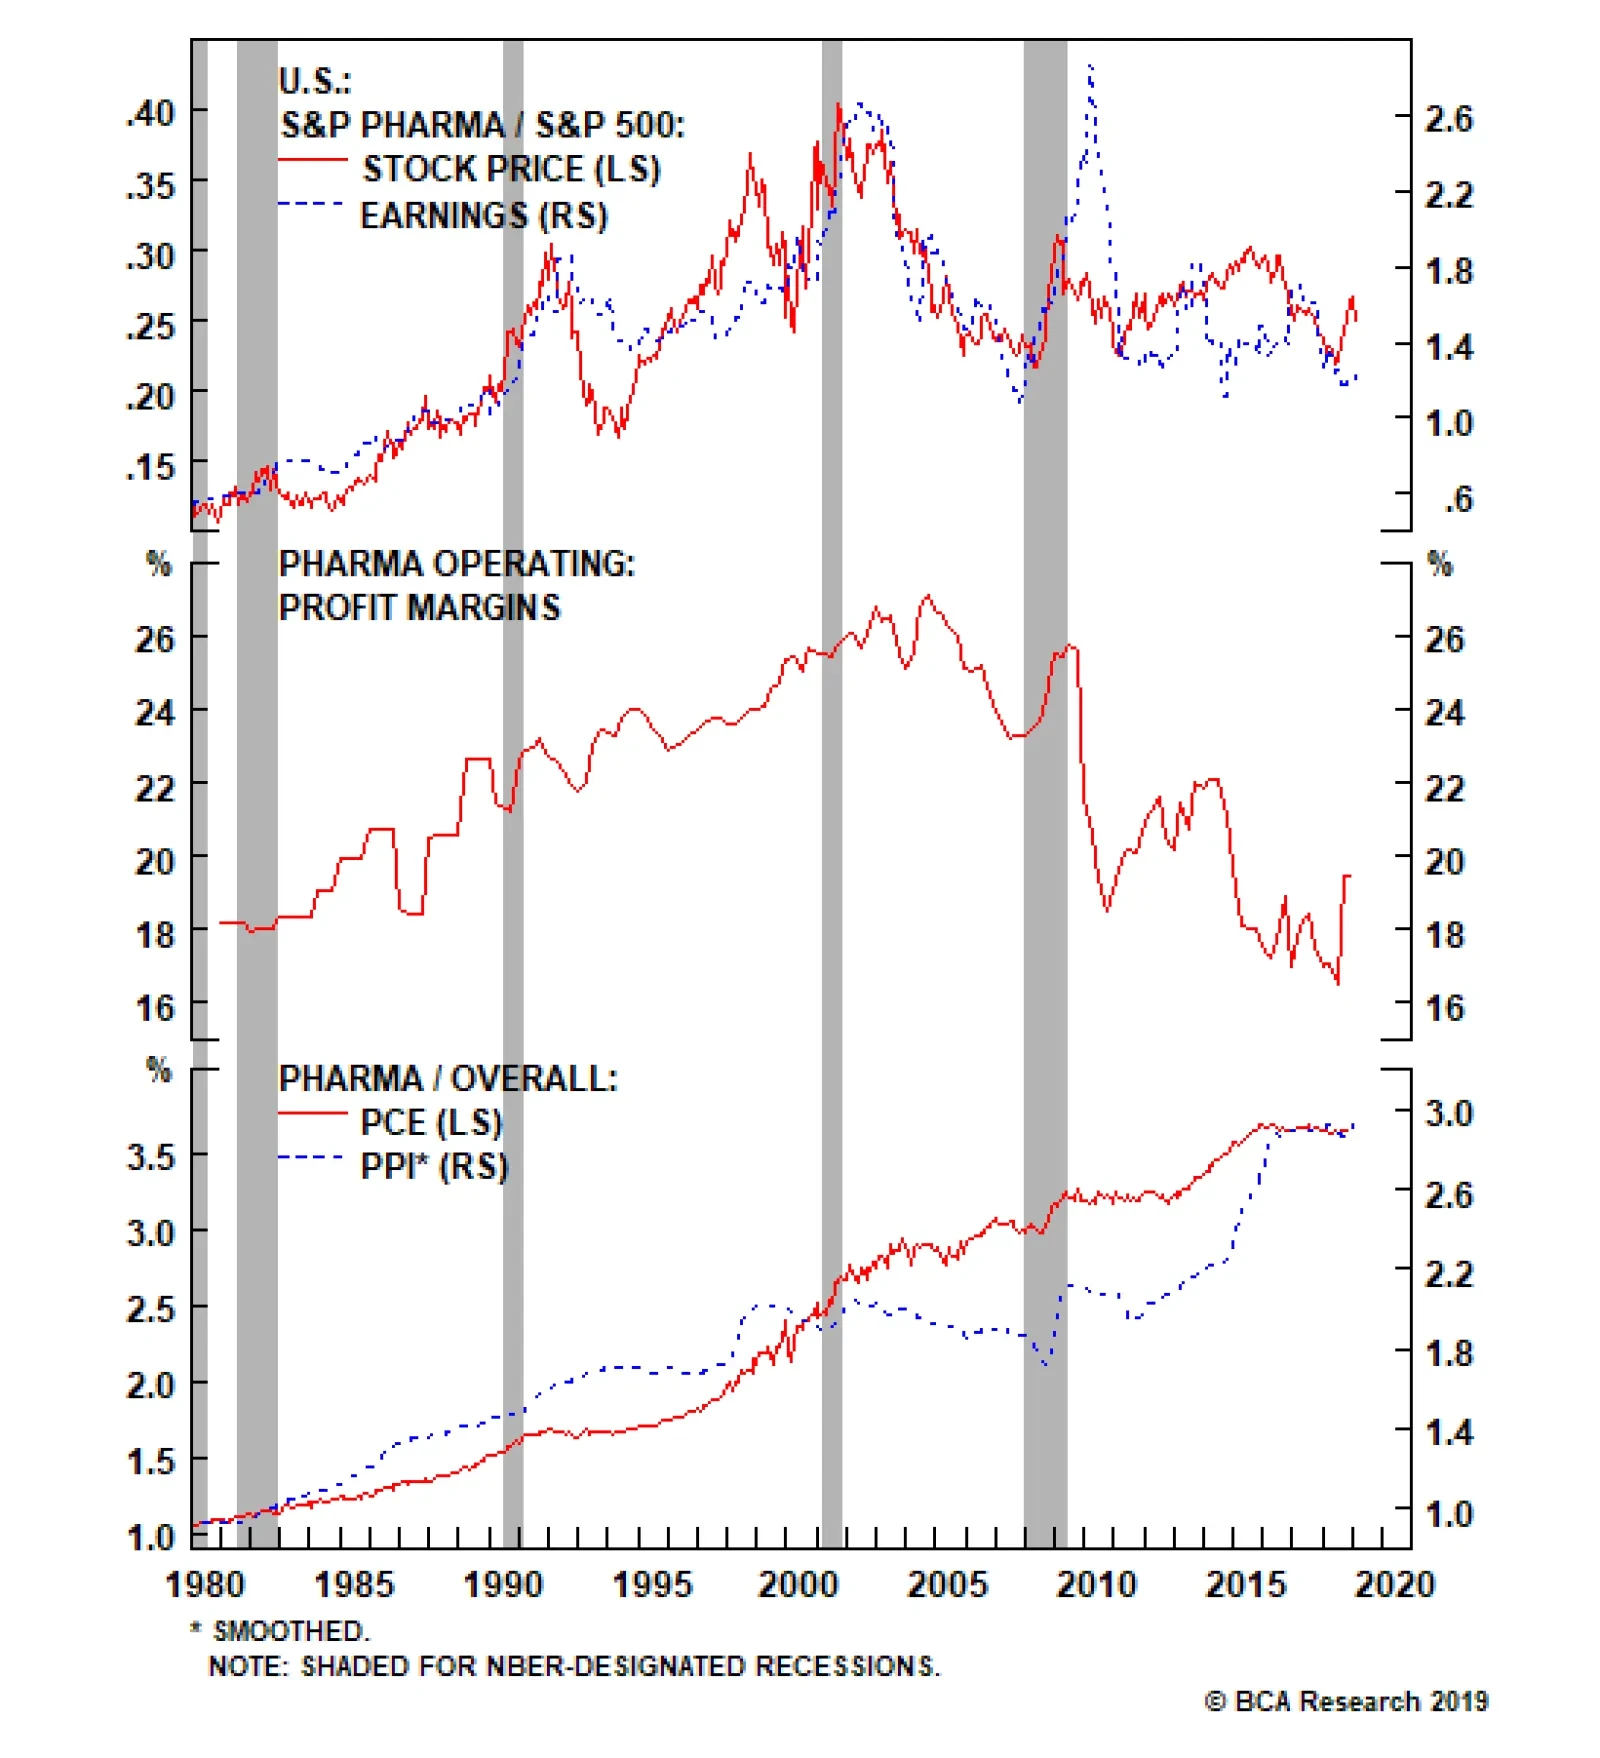
Underweight In mid-2017, we went underweight the S&P pharma index and booked healthy gains roughly a year later when we lifted exposure to neutral. Since then, Big Pharma has enjoyed a reprieve on the back of congressional inaction and the fact that the Trump Administration’s drug pricing wrath was less severe than initially feared. However, the time has come to trim the S&P pharma index to underweight. The top panel shows that pharmaceutical companies have been nearly uninterruptedly raising prices for the past four decades. Higher selling prices have been synonymous with higher profits and thus higher share prices. However, profit margins crested in the midst of the late-1990’s M&A boom and have never reclaimed their previous zenith (middle panel). Neither have relative share prices. Worryingly, pharma prices have hit a wall during the past four years and can barely keep up with overall inflation, despite still being opaque (bottom panel). As both Democrats and Republicans are united to bring down health care costs in general and drug prices in particular, pharma profits will likely suffer a secular downdraft. The implication is that, as pharma revenues erode they will deal a blow to profits. Consequently, the outlook for relative share prices is dim. Bottom Line: We trimmed the S&P pharma index to underweight yesterday; please see our Weekly Report for more details. The ticker symbols for the stocks in this index are: BLBG: S5PHAR – JNJ, PFE, MRK, LLY, BMY, ZTS, AGN, MYL, NKTR, PRGO.
Biotechs Gain Is...
Biotechs Gain Is...
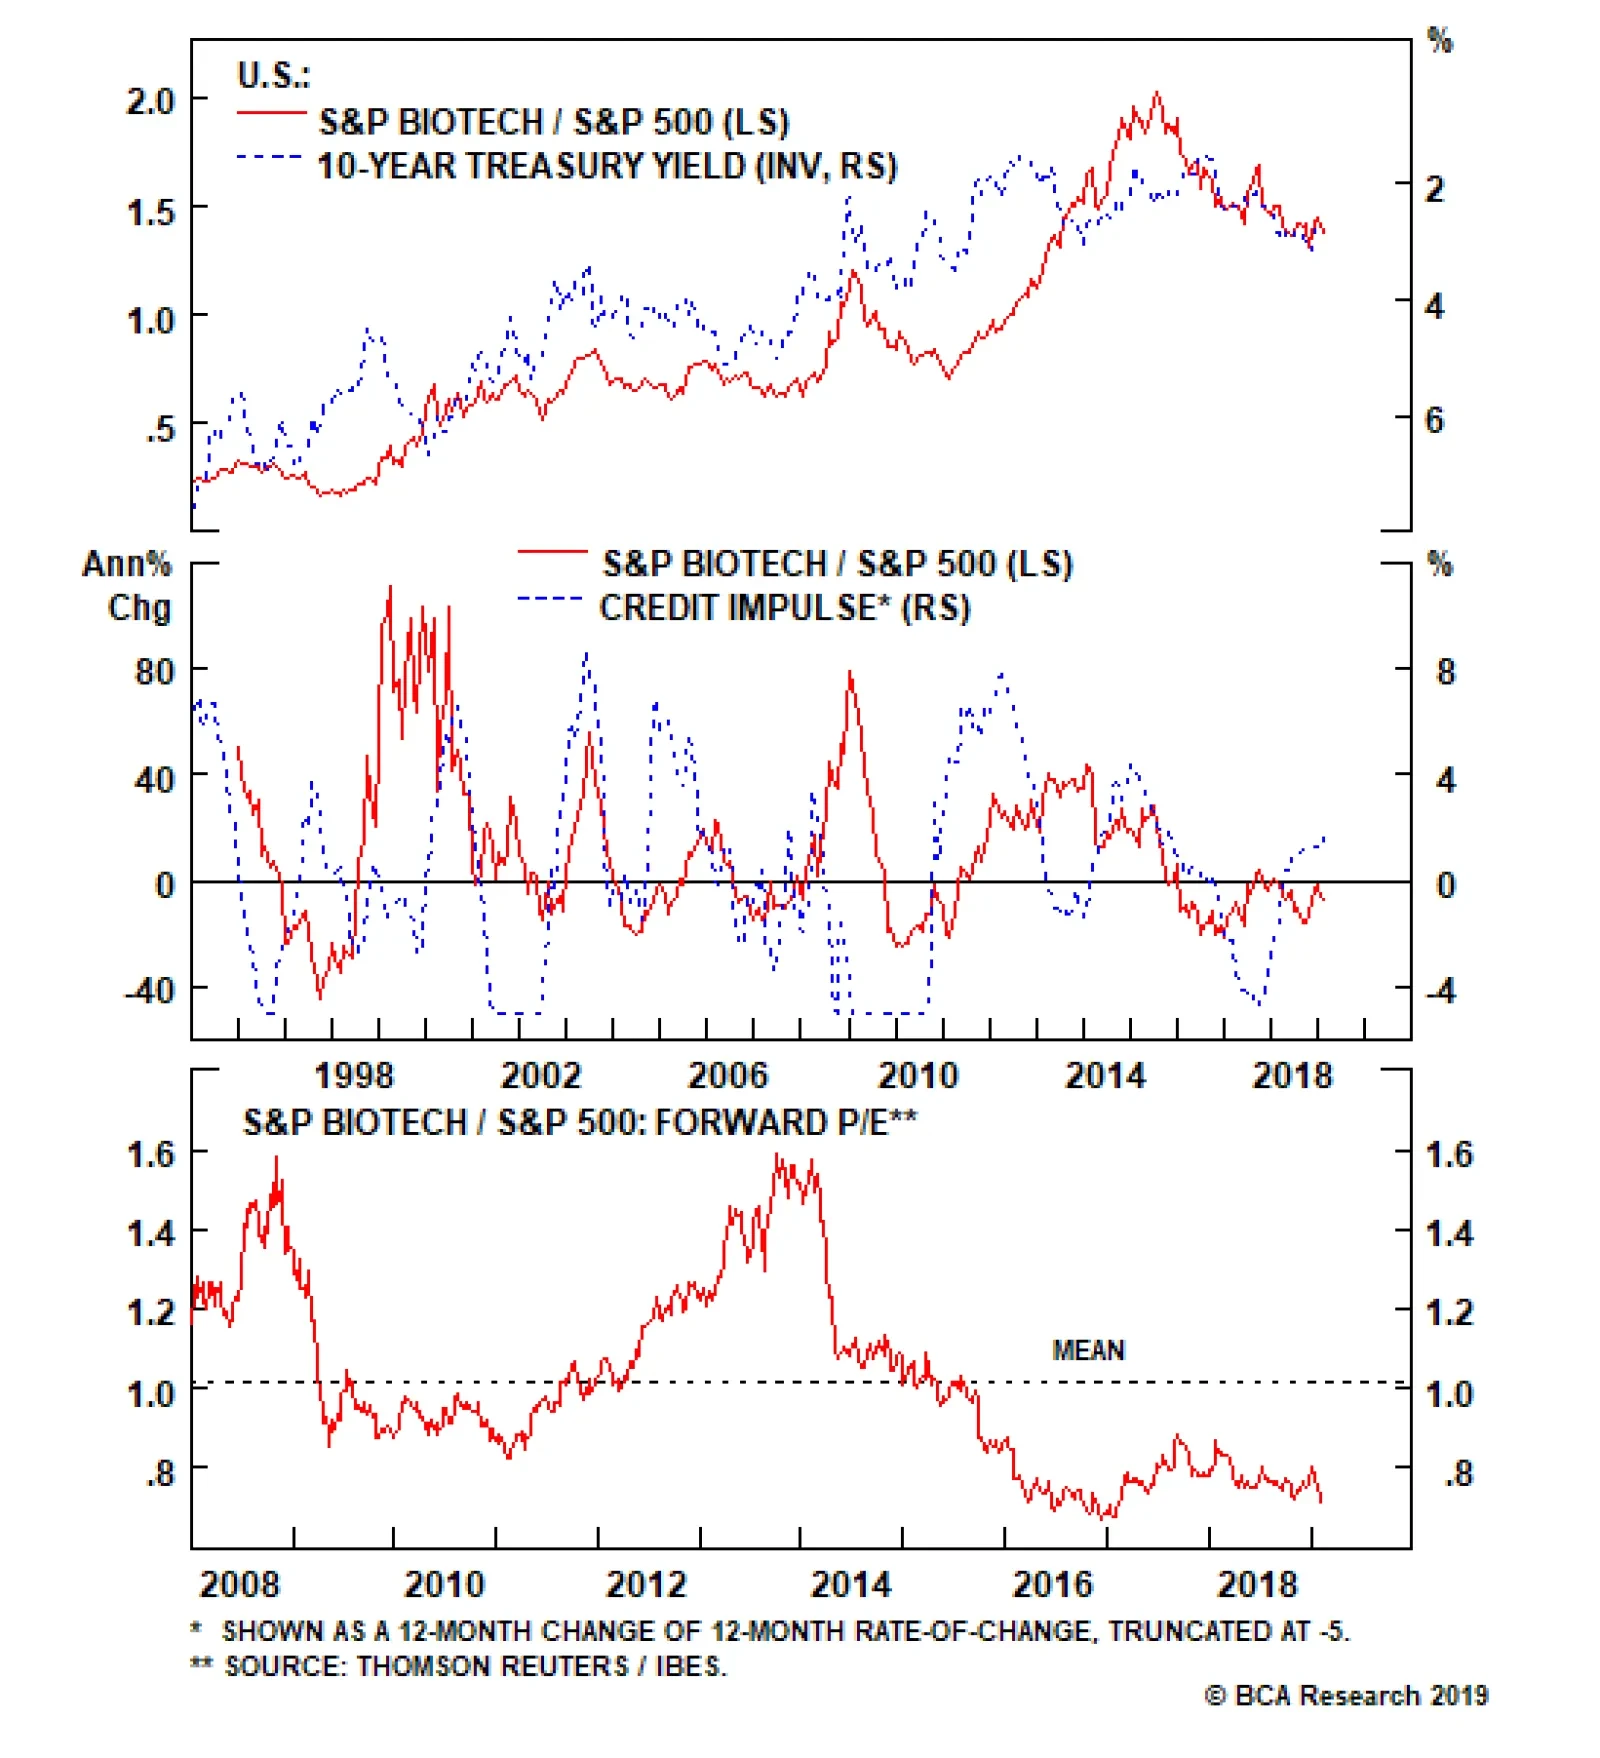
Overweight Biotech stocks have been the center of attention recently as the BMY/CELG deal put the whole sector in play, and yesterday we boosted exposure to overweight in the S&P biotech index. We doubt the merger mania is over and we continue to believe that more mega deals are in store, either intra or inter-industry, with Big Pharma hungry and in a hurry to replenish their drug pipeline. In our Weekly Report, we highlight a number of positive catalysts that can propel the S&P biotech index higher but surprisingly, the sell-side community does not share our enthusiasm. Relative profit growth is forecast to be nil in the next year. In the coming five years, biotech stocks are expected to trail the overall market’s profit growth by 4%/annum (second panel, Chart 8). This is extremely pessimistic and a first in the 24-year history of the I/B/E/S data set, and it is contrarily positive. Relative revenue growth forecasts are also grim for the upcoming 12 months and both revenue and profit forecasts present low hurdles to overcome (third panel). Meanwhile, from a valuation perspective, the S&P biotech index trades at a 25% discount to the SPX forward P/E and well below the historical mean (bottom panel). Bottom Line: We lifted the S&P biotech index to overweight yesterday; please see our Weekly Report for more details. The ticker symbols for the stocks in this index are: BLBG: S5BIOT – ABBV, AMGN, GILD, BIIB, CELG, VRTX, REGN, ALXN, INCY.
Highlights Portfolio Strategy The path of least resistance is higher for the broad equity market on the back of a reflationary impulse and a less dogmatic Fed. Now that the SPX forward EPS bar has been lowered to the ground, upward surprises loom, especially if the third catalyst we have been highlighting in recent research materializes: a positive resolution to the U.S./China trade spat. The recent M&A fever, a less dogmatic Fed that has suppressed the 10-year Treasury yield and a pick up in the U.S. credit impulse can serve as catalysts to unlock excellent value in the S&P biotech index. Upgrade to overweight. A profit margin squeeze on the back of soft pharma pricing power, weak operating conditions and a race to buy out biotech stocks to build up drug pipelines warn that the derating phase has just began for the S&P pharma index. Downgrade to underweight. Recent Changes Boost the S&P biotech index to overweight today. Trim the S&P pharma index to underweight today. Table 1
Reflating Away
Reflating Away
Featured The S&P 500 has been flirting with its 200 day moving average and once it categorically clears this hurdle there are high odds that previous resistance will turn into support. The next important level is 2,800, as we highlighted in recent research, a level where the SPX failed numerous times last year.1 Encouragingly, the character of the market has changed from December’s extreme daily weakness to this year’s significant daily resilience. As we first posited on January 18, while everyone is looking for a retest to re-enter the equity market, we already had the retest in December and are now in a slingshot recovery eerily similar to the 2016 and 1998 episodes.2 Importantly, what has changed since the post-December Fed meeting carnage is that the bond market has completely priced out Fed hikes for 2019 and the 10-year Treasury yield is 15bps lower. Chart 1 highlights this reflationary backdrop for U.S. stocks. Our proprietary Reflation Gauge (RG, comprising oil prices, interest rates and the U.S. dollar) is probing levels last hit in 2012. Historically, our RG and equity momentum have been joined at the hip and the current message is to expect a rebound in the latter. Chart 1Heed The Reflation Message
Heed The Reflation Message
Heed The Reflation Message
The latest ISM manufacturing survey also corroborates the signal from our RG. The jump in the ISM new orders-to-inventories ratio underscores that the rebound in stocks has further to run (bottom panel, Chart 1). Granted, a lot rests on EPS and in order for stocks to propel to fresh all-time highs later this year, as we expect, profits will have to deliver. On that front, despite recent steep downward EPS revisions across the board, we believe the level of quarterly EPS will hit fresh all-time highs in the back half of the year, carrying stocks into uncharted territory (Chart 2). As a reminder, BCA’s view remains that the U.S. will avoid recession in 2019. Chart 2Joined At The Hip
Joined At The Hip
Joined At The Hip
One key profit driver that has put pressure on recent earnings releases and will continue to weigh on internationally-exposed P&Ls is the greenback. With a delayed effect, the first two quarters of this year should bear the brunt of last year’s steep U.S. dollar climb, but that effect will reverse in the back half of 2019. Not only is the greenback inversely correlated with the SPX, but also with the global manufacturing PMI (trade-weighted U.S. dollar shown inverted and advanced, Chart 3). Chart 3Dollar The Reflator...
Dollar The Reflator...
Dollar The Reflator...
Thus, the greenback is a key macro variable that we are closely monitoring. On that front, global U.S. dollar based liquidity is one of the most important determinants/drivers of global growth. The longer U.S. dollar liquidity gets drained, the more downward pressure it will put on SPX momentum and SPX EPS (Chart 4). Once U.S. dollar based liquidity starts to get replenished at the margin, it can serve as a catalyst for a global growth recovery. A Fed tightening cycle pause and recent acknowledgment that the balance sheet asset roll off is important and the Fed stands ready to tweak it, are a net positive for at least a trough in global U.S. dollar liquidity. Chart 4...But Watch Global Dollar Liquidity
...But Watch Global Dollar Liquidity
...But Watch Global Dollar Liquidity
Adding it up, the path of least resistance is higher for the broad equity market on the back of a reflationary impulse and a less dogmatic Fed. Now that the SPX forward EPS bar has been lowered to the ground, upward surprises loom, especially if the third catalyst we have been highlighting in recent research materializes: a positive resolution to the U.S./China trade spat.3 This week we make a couple of subsurface changes to a defensive sector; these changes do not alter our recommended benchmark allocation to the overall sector. Biotech’s Gain Is... Biotech stocks have been the center of attention recently as the BMY/CELG deal put the whole sector in play, and today we are boosting exposure to overweight in the S&P biotech index. We doubt the merger mania is over and we continue to believe that more mega deals are in store, either intra or inter-industry, with Big Pharma hungry and in a hurry to replenish their drug pipeline. While this is not the sole reason for an above benchmark allocation, 50-60% M&A deal premia are a boon for investors (Chart 5). Chart 5M&A Frenzy
M&A Frenzy
M&A Frenzy
From a long-term macro perspective biotech stocks have been the primary beneficiaries of the 35-year bond bull market. In other words, the multi-decade grind lower in the U.S. Treasury yield has been synonymous with biotech outperformance (10-year U.S. Treasury yield shown inverted, Chart 6). Chart 6Biotech Equities And Rates Move In Opposite Direction
Biotech Equities And Rates Move In Opposite Direction
Biotech Equities And Rates Move In Opposite Direction
The Fed’s recent monetary policy U-turn is a welcome development and these high growth stocks will benefit from the 55bps fall in the 10-year Treasury yield since the early-November peak. In addition, another macro tailwind is working in the S&P biotech index’s favor. The resurgent U.S. credit impulse is unambiguously bullish for this health care index that excels when margin debt availability is rising and liquidity is plentiful (bottom panel, Chart 7). Chart 7Revving Credit Impulse Says Buy Biotech Stocks
Revving Credit Impulse Says Buy Biotech Stocks
Revving Credit Impulse Says Buy Biotech Stocks
Surprisingly, the sell-side community does not share our enthusiasm on any of these positive catalysts. Relative profit growth is forecast to be nil in the next year. In the coming five years, biotech stocks are expected to trail the overall market’s profit growth by 4%/annum (middle panel, Chart 8). This is extremely pessimistic and a first in the 24-year history of the I/B/E/S data set, and it is contrarily positive. Relative revenue growth forecasts are also grim for the upcoming 12 months and both revenue and profit forecasts present low hurdles to overcome (fourth panel, Chart 8). Chart 8Analysts Have Thrown In The Towel
Analysts Have Thrown In The Towel
Analysts Have Thrown In The Towel
With regard to technicals and valuations, investors are doubtful that biotech stocks can stage a playable turnaround. Cyclical momentum remains moribund, printing below the zero line. Meanwhile, the S&P biotech index trades at a 25% discount to the SPX forward P/E and well below the historical mean (second & bottom panels, Chart 8). Chart 9 shows that biotech stocks are also cheap on a relative dividend yield basis. The S&P biotech index has been so oversold that it now sports a dividend yield higher than the S&P 500. Nevertheless, there is one key risk we are closely monitoring. Biotech initial public offerings are at all-time highs, with private equity and venture capital funds rushing for the exit doors. This is worrisome as it offsets the supply reduction owing to the M&A fever and has historically coincided with biotech relative share price peaks (Chart 10). Chart 9Compelling Relative Value
Compelling Relative Value
Compelling Relative Value
Chart 10Watch This Risk
Watch This Risk
Watch This Risk
Netting it all out, the recent M&A fever, a less dogmatic Fed that has suppressed the 10-year Treasury yield and a pick up in the U.S. credit impulse can serve as catalysts to unlock excellent value in the S&P biotech index. Bottom Line: Boost the S&P biotech index to overweight today. The ticker symbols for the stocks in this index are: BLBG: S5BIOT – ABBV, AMGN, GILD, BIIB, CELG, VRTX, REGN, ALXN, INCY. …Pharma’s Pain In mid-2017 we went underweight the S&P pharma index and booked healthy gains roughly a year later when we lifted exposure to neutral. Since then, Big Pharma has enjoyed a reprieve on the back of congressional inaction and the fact that the Trump Administration’s drug pricing wrath was less severe than initially feared. However, the time has come to trim the S&P pharma index to underweight. Chart 11 shows that pharmaceutical companies have been nearly uninterruptedly raising prices for the past four decades. Higher selling prices have been synonymous with higher profits and thus higher share prices. Chart 11Margin Trouble
Margin Trouble
Margin Trouble
But, something happened in the new millennium. Relative performance peaked as pharma embarked on a mega M&A boom in the late-1990s with the Pfizer/Warner Lambert deal breaking all-time industry M&A records. Why? Because profit margins crested and have never reclaimed their previous zenith (top and middle panels, Chart 11). Neither have relative share prices. Worryingly, pharma prices have hit a wall during the past four years and can barely keep up with overall inflation, despite still being opaque (bottom panel, Chart 11). As both Democrats and Republicans are united to bring down health care costs in general and drug prices in particular, pharma profits will likely suffer a secular downdraft. The implication is that, as pharma revenues erode they will deal a blow to profits. Consequently, the outlook for relative share prices is dim. Importantly, pharma executives have not been frugal enough to offset the soft pricing power backdrop. Headcount has been expanding consistently since 2012 and a wide gap has opened up relative to industry selling price inflation, akin to the one in the mid-2000s that suppressed relative share prices (Chart 12). Chart 12Pricing Power Pressure
Pricing Power Pressure
Pricing Power Pressure
Similar to the M&A boom of the late-1990s, there has been a global pharma M&A race with multiple deal announcements in the past few months, underscoring that the industry is not standing still. As Big Pharma CEOs compete to outdo their peers and buy drug pipelines mostly in the biotech space (Chart 5), they will continue to degrade the industry balance sheet (third panel, Chart 12). Our strategy is to overweight the hunted (biotech) and avoid the hunters (Big Pharma). On the operating front, a supply check reveals that pharma wholesale and manufacturing inventories are growing, whereas shipments are on the verge of contraction. Pharma industrial production has petered out and industry productivity gains are waning (Chart 13). This deteriorating operating backdrop will weigh on relative profits. Chart 13Deteriorating Operating Metrics...
Deteriorating Operating Metrics...
Deteriorating Operating Metrics...
With regard to the macro front, a vibrant U.S. economy – with the ISM manufacturing survey ticking higher and the labor market firing on all cylinders – suggests that defensive pharma relative profits will resume their downtrend (bottom panel, Chart 13). Tack on the U.S. dollar’s reversal since the November peak and defensive pharma equities will remain under pressure (second panel, Chart 14). Chart 14...But EPS Bar Is On The Floor
...But EPS Bar Is On The Floor
...But EPS Bar Is On The Floor
Nevertheless, there are three risks to our negative S&P pharma view. First, the M&A fever dies down and there are no additional purchases of biotech outfits. Second, Congress and the President drag their feet and fail to agree on new hawkish pharma pricing legislation. Finally, sell-side analysts have thrown in the towel and maybe most of the bad news is reflected in bombed out relative profit and sales growth estimates (third & fourth panels, Chart 14). In sum, a profit margin squeeze on the back of soft pharma pricing power, weak operating conditions and a race to buy out biotech stocks to build up drug pipelines warn that the derating phase (bottom panel, Chart 14) has just began for the S&P pharma index. Downgrade to underweight. Bottom Line: Trim the S&P pharma index to underweight. The ticker symbols for the stocks in this index are: BLBG: S5PHAR – JNJ, PFE, MRK, LLY, BMY, ZTS, AGN, MYL, NKTR, PRGO. Health Care Remains In The Neutral Column Despite these two subsurface health care sector moves, our overall exposure to the S&P health care sector remains intact at neutral. Please look forward to reading our upcoming research where we will be updating the S&P managed health care, S&P health care facilities and S&P health care equipment subsectors. Anastasios Avgeriou, Vice President U.S. Equity Strategy anastasios@bcaresearch.com Footnotes 1 Please see BCA U.S. Equity Strategy Weekly Report, “Trader’s Paradise” dated January 28, 2019, available at uses.bcaresearch.com. 2 Please see BCA U.S. Equity Strategy Insight Report, “Don’t Bet On A Retest” dated January 18, 2019, available at uses.bcaresearch.com. 3 Please see BCA U.S. Equity Strategy Weekly Report, “Dissecting 2019 Earnings” dated January 22, 2019, available at uses.bcaresearch.com. Current Recommendations Current Trades Size And Style Views Favor value over growth Favor large over small caps
Hospitals Are Facing Margin Pressure
Hospitals Are Facing Margin Pressure
Neutral The S&P health care facilities index was an exceptionally solid performer last year as investors sought safe harbor from the headwinds to global trade in wholly domestic stocks. This outperformance belied some deeper issues on the operating front. Hospitals’ pricing power is currently accelerating at the slowest rate since the GFC, which bodes ill for revenue growth (second panel). Tack on spiking labor costs (third panel) and the EPS growth prospects of this defensive sector appear at serious risk. However, there are a number of potential offsets to this weak picture. The first is the much lower write-offs that hospitals can expect given the generationally low unemployment rate. A second lies in declining hospital construction (bottom panel) which could serve to both bolster free cash flow despite weakening operating earnings as well as reverse the fall in pricing power if supply is constrained. Regardless of the operating picture, the S&P health care facilities index is unlikely to move dramatically in either direction without a resolution to the current trade war, either positive or negative. Net, we reiterate our neutral stance on the S&P health care facilities index. The ticker symbols for the stocks in this index are: BLBG: S5HCFA - UHS, HCA.