Sectors

Underweight The spike in UST yields have been weighing on fixed income-proxy sectors with REITs foremost among them. As noted in the top panel of the chart, excluding the inflating of the property bubble in advance of the GFC, REITs have had a very tight inverse correlation with UST yields; the resulting downward pressure on the S&P REITs index is thus very predictable. Such downward pressure could be overlooked if all was well on an operating basis but this is not the case. Non-residential construction continues to rise (albeit more slowly than last year) in the face of higher borrowing rates (second panel). Further, demand looks slack as occupancy rates clearly crested at the beginning of last year (bottom panel). As well, on the residential front, multi-family housing starts remain elevated which should prove deflationary to rents. Bottom Line: We reiterate our underweight recommendation on the S&P REITs index. The ticker symbols for the stocks in this index are BLBG: S5REITS - IRM, MAA, AMT, BXP, PLD, ESS, CCI, PSA, O, VTR, VNO, WY, EQIX, DLR, EXR, DRE, FRT, WELL, SBAC, HCP, GGP, KIM, EQR, UDR, REG, MAC, HST, SPG, AVB, AIV, SLG, ARE.
FX15 Moving On Out
FX15 Moving On Out
Underweight September was a tough month for the S&P hotels, resorts and cruise lines index. First, Carnival Corp, the largest cruise line operator warned that net revenue yield growth was slowing as prices for next year are flat; their share price (and those of their competitors) fell significantly. Next, the CEO of Marriott warned that the trade war was already having an impact on tourism, with Europe capturing a larger share of Chinese outbound travel. As with cruise lines, these comments weighed heavily on the hotel operators. Our negative thesis is unchanged with respect to cruise lines; we believe volume gains (the source of margin improvements) have peaked and, in the absence of better pricing, margins will suffer in the face of rising costs, particularly fuel (third panel). Further, despite recovering pricing in hotels, the splurging on new construction should mean a return to price competition (bottom panel), particularly if tourism from China is truly retrenching. Overall, we reiterate our underweight recommendation. The ticker symbols for the stocks in this index are: BLBG: S5HOTL - MAR, CCL, RCL, HLT, WYN, NCLH.
Here Be Dragons
Here Be Dragons
Highlights Set your overall investment strategy with two 'rules of 4' based on 10-year bond yields: If either the Italian BTP or the sum of the U.S. T-bond, German bund and JGB stays above 4 percent, then sell equities and buy bonds. If both the Italian BTP and the sum of the U.S. T-bond, German bund and JGB are in the 3-4 percent range, then remain broadly neutral. If both the Italian BTP and the sum of the U.S. T-bond, German bund and JGB fall below 3 percent, then buy equities and sell bonds. Stay neutral to Italy's MIB and Italian banks for the time being. Among the mainstream European equity markets our top pick remains France's CAC. Feature Many people believe that Italy has one of the world's most indebted economies, but this widely-held belief is wrong. Although Italy's public indebtedness is high, Italy's private indebtedness is one of the lowest in the world (Chart of the Week). This means that Italy's total indebtedness is less than that of France and the U.K., and broadly similar to that of the U.S. (Chart I-2 - Chart 1-5).1 Chart of the WeekItaly's Private Sector Indebtedness Is One Of The Lowest In The World
Italy's Private Sector Indebtedness Is One Of The Lowest In The World
Italy's Private Sector Indebtedness Is One Of The Lowest In The World
Chart I-2Italy: Total Indebtedness = 260% Of GDP
Italy: Total Debt Up From 195% To 265% Of GDP
Italy: Total Debt Up From 195% To 265% Of GDP
Chart I-3France: Total Indebtedness = 305% Of GDP
France: Total Debt Up From 190% To 305% Of GDP
France: Total Debt Up From 190% To 305% Of GDP
Chart I-4U.K.: Total Indebtedness = 280% Of GDP
U.K.: Total Indebtedness = 280% Of GDP
U.K.: Total Indebtedness = 280% Of GDP
Chart I-5U.S.: Total Indebtedness = 250% Of GDP
U.S.: Total Indebtedness = 250% Of GDP
U.S.: Total Indebtedness = 250% Of GDP
The Myth Of Italian Indebtedness An economy's debt sustainability depends on its total indebtedness, and not on its public indebtedness or its private indebtedness in isolation. Debt becomes unsustainable when the marginal extra euro of debt results in misallocation of resources and mal-investment. At this point, the extra debt adds nothing to growth or, worse, it subtracts from growth. Therefore, debt reaches its sustainable limit when the economy has exhausted all productive uses for it. But it does not matter whether these productive uses are funded with private debt or with public debt. For example, successful economies require investment in high-quality healthcare and education. Some economies fund this with private debt, while others fund it with public debt. This means that if productive private indebtedness is low, there is more scope for productive public indebtedness. The crucial point is that Italy has extremely low private indebtedness, which means that it can afford relatively high public indebtedness before reaching the limit of debt sustainability. Right now, this is especially true because the Italian banking system remains dysfunctional, preventing the private sector from borrowing (Chart I-6). Under these circumstances, the Italian government can borrow the private sector's excess savings and debt repayments and put them to highly productive use - which will paradoxically reduce the deficit in the long term. Chart I-6Italy's Private Sector Is Not Borrowing
Italy's Private Sector Is Not Borrowing
Italy's Private Sector Is Not Borrowing
Hence, the M5S/Lega government is following excellent economic policy in proposing a modest increase in the fiscal deficit in 2019. An appropriately sized and targeted fiscal stimulus is exactly what Italy needs right now. But this excellent economic policy will take time to bear fruit and show up in Italy's growth and deficit data. Italy's big problem is that bond vigilantes do not wait, they shoot first and ask questions later. Italy Is Especially Vulnerable To Bond Vigilantes Italy is also a world leader in running primary surpluses (Chart I-7 and Table I-1). In plain English, this means that the Italian government spends considerably less than it receives, if interest payments are excluded. Chart I-7Italy Is A World Leader In Running Primary Surpluses
Italy Is A World Leader In Running Primary Surpluses
Italy Is A World Leader In Running Primary Surpluses
Table I-1Italy Has Consistently Run Primary Surpluses
Italy, Bond Vigilantes, And Bubbles
Italy, Bond Vigilantes, And Bubbles
Put differently, Italy's government deficit results not from its operational spending relative to its income, but from the interest payments on its debt. This makes Italy especially vulnerable to the bond vigilantes. If the bond vigilantes distort Italy's interest rate, they can tip the Italian government into financial distress, even if that distress is not justified by the economic fundamentals. Is this a real risk? Sadly, yes. The euro debt crisis was essentially a liquidity crisis which resulted from bond vigilantes running amok. When irrational markets refuse to lend to sovereigns at a fair interest rate, maturing debt has to be refinanced at a penalising interest rate, causing an undeserved deterioration in the government's finances. Thereby, the irrational fear of insolvency becomes a self-fulfilling prophecy. Italy has an additional problem. When Italian bond prices decline, it erodes the value of the banking system's euro 350 billion portfolio of BTPs and weakens the banks' fragile balance sheets. If a bank's equity capital no longer covers its net non-performing loans (NPLs), investors get nervous. In this regard, the largest Italian banks now have euro 160 billion of equity capital against euro 130 billion of net NPLs, implying a cushion of euro 30 billion (Chart I-8). Chart I-8Italian Banks' Equity Capital Exceeds ##br##Net NPLs By Euro 30 Bn...
Italian Banks' Equity Capital Exceeds Net NPLs By €30 Bn...
Italian Banks' Equity Capital Exceeds Net NPLs By €30 Bn...
So the markets would start to worry about Italian banks' mark-to-market solvency if their bond portfolios sustained a loss of €30 billion. We estimate this equates to the 10-year BTP yield breaching and remaining above 4 percent (Chart I-9).2 Chart I-9...The Excess Would Disappear If The 10-Year BTP Yield Stayed Above 4%
...The Excess Would Disappear If The 10-Year BTP Yield Stayed Above 4%
...The Excess Would Disappear If The 10-Year BTP Yield Stayed Above 4%
The ECB solved the euro debt crisis at a stroke by committing to act as lender of last resort to distressed sovereigns at an 'undistorted' interest rate. Indeed, the commitment alone was enough to defeat the bond vigilantes without the ECB spending a single cent from its Outright Monetary Transaction (OMT) program.3 But recall that the ECB only threatened its firepower when the 2-year Spanish Bono yield had breached 6.5 percent and the 10-year yield had breached 7.5 percent. It follows that if the 10-year Italian BTP yield breached 4 percent, the yield would be high enough to hurt the Italian banks, but not nearly high enough for any powerful intervention from the ECB. Hence, the 10-year BTP yield at 4 percent is the level at which we would return to a pro-defensive strategy. Conversely, a level below 3 percent would create some margin of safety providing one precondition for a more pro-cyclical investment stance. In the meantime, the current level at 3.3 percent justifies a neutral cyclical stance to Italy's MIB and Italian banks. Among the mainstream European equity markets our top pick remains France's CAC. The Connection Between Bubbles And Liquidity Crises Bubble formation may seem to have no connection with a liquidity crisis but the two phenomena are closely related. Bubble formation is simply a brewing liquidity crisis resulting from irrational euphoria rather than irrational fear. A bubble forms when value investors stop investing on the basis of a valuation framework. Instead, they get lured into the momentum herd that is participating in a strong rally, and the additional buy orders fuel the euphoria. However, once all of the value investors have joined the momentum herd, and a value investor then suddenly reverts to type and puts in a sell order, the market will suffer a liquidity crisis. There are no buyers left! And finding one might require a substantial reversal in the price to attract an ultra-long-term deep value investor. As regular readers know, fractal analysis measures whether the herding behaviour in any financial instrument is becoming excessive. The analysis suggests that developed market equities are not yet at the tipping point of excessive euphoria that signalled the last two trend exhaustions in May 2017 and January 2018 (Chart I-10). But this does not mean that there are clear blue skies ahead. Chart I-10Developed Market Equities Are Not Yet At A Trend Exhaustion
Developed Market Equities Are Not Yet At A Trend Exhaustion
Developed Market Equities Are Not Yet At A Trend Exhaustion
The danger is not that the rich valuation is irrationally excessive, but that it is hyper-sensitive to bond yields. At low bond yields, bonds offer no price upside but substantial price downside. Confronted with this increased riskiness of bonds, equity returns justifiably collapse to the feeble returns offered by bonds with no additional 'risk premium', giving equity valuations an exponential uplift. But if bond yields normalise, the process goes into vicious reverse - the rich valuation of equities must decline as exponentially as it rose. We have defined the danger point as when the sum of the 10-year yields on the U.S. T-bond, German bund, and JGB breaches and stays above 4 percent. In summary, set your overall investment strategy with two 'rules of 4' based on 10-year bond yields: If either the Italian BTP or the sum of the U.S. T-bond, German bund and JGB stays above 4 percent, then sell equities and buy bonds. If both the Italian BTP and the sum of the U.S. T-bond, German bund and JGB are in the 3-4 percent range, then remain broadly neutral. If both the Italian BTP and the sum of the U.S. T-bond, German bund and JGB fall below 3 percent, then buy equities and sell bonds. Dhaval Joshi, Senior Vice President Chief European Investment Strategist dhaval@bcaresearch.com 1 Indebtedness defined as a share of GDP. 2 Assuming that the average maturity of Italian banks' BTPs is around 5 years. 3 The ECB's Outright Monetary Transaction (OMT) program was created in 2012 in response to the euro debt crisis and facilitates the ECB's lender of last resort function to solvent but illiquid sovereign borrowers. Fractal Trading Model* We are pleased to report that our long China/short India trade achieved its 9% profit target and is now closed. This week, we note that the underperformance of the Eurostoxx50 versus the Nikkei225 is technically stretched, with a 65-day fractal dimension approaching the limit which signaled a very recent trend reversal. Hence, this week's recommended trade is long Eurostoxx50 versus Nikkei225. The profit target is 3.5% with a symmetrical stop-loss. For any investment, excessive trend following and groupthink can reach a natural point of instability, at which point the established trend is highly likely to break down with or without an external catalyst. An early warning sign is the investment's fractal dimension approaching its natural lower bound. Encouragingly, this trigger has consistently identified countertrend moves of various magnitudes across all asset classes. Chart I-11
Long Eurostoxx50 VS. Nikkei 225
Long Eurostoxx50 VS. Nikkei 225
The post-June 9, 2016 fractal trading model rules are: When the fractal dimension approaches the lower limit after an investment has been in an established trend it is a potential trigger for a liquidity-triggered trend reversal. Therefore, open a countertrend position. The profit target is a one-third reversal of the preceding 13-week move. Apply a symmetrical stop-loss. Close the position at the profit target or stop-loss. Otherwise close the position after 13 weeks. Use the position size multiple to control risk. The position size will be smaller for more risky positions. * For more details please see the European Investment Strategy Special Report "Fractals, Liquidity & A Trading Model," dated December 11, 2014, available at eis.bcaresearch.com Fractal Trading Model Recommendations Equities Bond & Interest Rates Currency & Other Positions Closed Fractal Trades Trades Closed Trades Asset Performance Currency & Bond Equity Sector Country Equity Indicators Bond Yields Chart II-1Indicators To Watch - Bond Yields
Indicators To Watch - Bond Yields
Indicators To Watch - Bond Yields
Chart II-2Indicators To Watch - Bond Yields
Indicators To Watch - Bond Yields
Indicators To Watch - Bond Yields
Chart II-3Indicators To Watch - Bond Yields
Indicators To Watch - Bond Yields
Indicators To Watch - Bond Yields
Chart II-4Indicators To Watch - Bond Yields
Indicators To Watch - Bond Yields
Indicators To Watch - Bond Yields
Interest Rate Chart II-5Indicators To Watch - Interest Rate Expectations
Indicators To Watch - Interest Rate Expectations
Indicators To Watch - Interest Rate Expectations
Chart II-6Indicators To Watch - Interest Rate Expectations
Indicators To Watch - Interest Rate Expectations
Indicators To Watch - Interest Rate Expectations
Chart II-7Indicators To Watch - Interest Rate Expectations
Indicators To Watch - Interest Rate Expectations
Indicators To Watch - Interest Rate Expectations
Chart II-8Indicators To Watch - Interest Rate Expectations
Indicators To Watch - Interest Rate Expectations
Indicators To Watch - Interest Rate Expectations
Highlights Investors who are betting on a quick resolution to the U.S./China trade war following the "new NAFTA" deal and the U.S. midterm elections have likely been taken in by false hope. Stay neutral China relative to global stocks, and overweight low-beta sectors within the investable equity universe. The relative performance of Chinese industry groups since mid-June has been almost entirely determined by their beta characteristic, with almost all low-beta industry groups outperforming. Energy stocks have been among the top outperformers within the Chinese equity universe, and several factors support our recommendation that investors initiate an outright long position. While it is likely paused rather than stalled, broad "reform" as an investment theme will be less relevant over the coming 6-12 months. Consequently, we are closing our long ESG leaders / short benchmark trade. Feature September's PMI releases, both official and private, confirm that China's export outlook is deteriorating rapidly. Chart 1 highlights that the Caixin PMI is about to fall below the boom/bust line, and the new export orders component of the official PMI has sunk to a 2 ½ year low. Somewhat oddly, investors do not seem to be responding negatively to the de-facto announcement of a 25% rate on the second round of U.S. import tariffs against China. Chart 2 shows that domestic infrastructure stocks have actually been rising relative to global stocks since mid-September, and our BCA China Play Index appears to have entered a (so far very modest) uptrend. Chart 1The Export Shock Is Coming...
The Export Shock Is Coming...
The Export Shock Is Coming...
Chart 2...But Investors Have Been Incrementally Upbeat
...But Investors Have Been Incrementally Upbeat
...But Investors Have Been Incrementally Upbeat
One possible explanation for this is that investors are doubling down on the idea that China will have to aggressively stimulate in response to the shock. We have leaned against this narrative, by arguing in past reports that China's policy response to the upcoming export shock is not likely to be heavily credit-based, and that increases in fiscal spending today will involve more "soft infrastructure" than in the past.1 Chart 3 certainly shows no evidence of a spike in broad money or total credit; adjusted total social financing growth barely accelerated in August, against the backdrop of promises to front-run planned fiscal spending over the coming year. Chart 3No Major Acceleration In Credit Growth Evident Yet
No Major Acceleration In Credit Growth Evident Yet
No Major Acceleration In Credit Growth Evident Yet
Chart 4Americans Support A Tough Stance Against China
False Hope
False Hope
But a second explanation of recent investor behavior, one that we have been hearing more loudly from some market participants, is that China is waiting until after the midterm elections in the U.S. to make a deal, in anticipation that Republican losses in Congress will weaken Trump and change the political reality in terms of trade policy towards China. There are three reasons why investors holding this view are likely mistaken, and have been taken in by false hope: In the U.S., the actual implementation of tariffs lies within the control of the Presidency. Congress has delegated substantial authority to the president that would take time to be clawed back. Moreover, the president controls the execution of tariffs, and has a general prerogative over national security issues, which certainly includes the trade war with China. Democratic control of the House or Senate may cause President Trump to act even more forcefully against China, as trade will be among the few relatively unfettered policy options left to him. Chart 4 highlights that a sizeable majority of the American public views Chinese trade policy towards the U.S. as unfair, unlike the U.S.' other major trade partners. Reflecting this point, Democrats themselves maintain a hawkish stance on trade with China. This suggests that Trump will have a strong mandate to continue to demand major concessions from China even after the elections. We agree that Chinese stocks have already priced in a sizeable earnings decline, but we would still characterize buying now as an ill-advised case of trying to catch a falling knife. We highlighted in our September 19 Weekly Report that during the 2014-2016 episode Chinese stocks bottomed several months after stimulus began to take effect,2 because of a delayed decline in forward earnings. A similar situation would appear to be developing this time around: the third round of tariffs against China will likely soon be announced, the shock to Chinese export growth will soon manifest itself in the data, and yet Chinese forward earnings have only fallen 5-6% from their June peak. Bottom Line:Investors who are betting on a resolution to the U.S./China trade war following the U.S. midterm elections have likely been taken in by false hope. Stay neutral China relative to global stocks, and overweight low-beta sectors within the investable equity universe. Recent Sector Performance: A Beta Story, And A New Trade Idea Chart 5Last Week We Closed One Of Our Most Successful Calls
Last Week We Closed One Of Our Most Successful Calls
Last Week We Closed One Of Our Most Successful Calls
We recommended closing one of our most successful trades of the past year in a brief Special Report last week.3 The report outlined major changes to the global industry classification standard (GICS) that took effect this week, as well as the implications for China's stock market. One key change is that Alibaba, one of the "BATs", is now part of the consumer discretionary sector and makes up roughly 60% of its market capitalization. Given this fundamental shift in the risk/reward profile of the position, we recommended closing our long MSCI China Consumer Staples / short MSCI China Consumer Discretionary trade for a profit of 47% (Chart 5). With the goal of identifying new trade ideas that are likely to outperform within the context of a trade war, Chart 6 presents the alpha and beta characteristics of 23 industry groups in the MSCI China index (the investable benchmark) from mid-June to the end of September. The x-axis of the chart represents the group's beta versus the benchmark, whereas the y-axis shows standardized alpha over the period. The chart also distinguishes between out/underperforming sectors. Chart 6Since Mid-June, Sector Performance Has Largely Been Beta-Driven
False Hope
False Hope
Several points are notable: Largely speaking, the relative performance of Chinese industry groups since mid-June has been determined by their beta characteristic (with almost all low-beta industry groups outperforming). This supports our existing position of favoring low-beta sectors within the MSCI China index, a trade that we initiated on June 27.4 Four industry groups that belong to traditionally cyclical sectors have outperformed since mid-June and have had a beta less than 1: energy, capital goods, banks, and consumer durables and apparel. Energy and capital goods have been particularly notable, having outperformed by 24% and 15%, respectively. Technology-related industry groups have underperformed, including the pharma, biotech, and life sciences industry group within health care. Consumer services and retailers have significantly underperformed, due to the heavy influence of travel-related businesses in both indexes. Among the top performing industry groups over the past three months, Chinese energy stocks look like the most compelling trade in absolute terms. While we are normally reluctant to chase performance, several factors support an outright long position: BCA's Commodity & Energy Strategy service is bullish on oil prices, and recently increased their 2019 Brent price forecast to $95/bbl based on both supply and demand factors.5 Despite the recent outperformance of Chinese energy companies within the investable universe, they remain cheap versus global energy companies based on cash flow-based valuation metrics (Chart 7). This is true even after accounting for the fact that they are typically discounted relative to their global peers due to heavy state ownership. Chinese energy companies look reasonably priced relative to the value of global oil production (Chart 8). Chinese energy companies largely receive their revenue in U.S. dollars, which is an attractive hedge in an environment where CNY-USD may decline further. Chart 7Chinese Energy Stocks Are Cheap Versus Their Global Peers...
Chinese Energy Stocks Are Cheap Versus Their Global Peers...
Chinese Energy Stocks Are Cheap Versus Their Global Peers...
Chart 8...And Versus The Value Of Global Oil Production
...And Versus The Value Of Global Oil Production
...And Versus The Value Of Global Oil Production
Given this, we are updating our trade book and recommend that investors initiate an outright long position in Chinese energy stocks as of today. Chart 9Despite Outperforming, Absolute Capital Goods Performance Has Been Lackluster
Despite Outperforming, Absolute Capital Goods Performance Has Been Lackluster
Despite Outperforming, Absolute Capital Goods Performance Has Been Lackluster
What about Chinese capital goods companies? For now, we are content with relative rather than absolute exposure, which (surprisingly) exists in our low-beta sectors trade. Capital goods companies account for almost 70% of the Chinese industrial sector, and industrial stocks have been less volatile than the broad market over the past year, in large part because they underperformed so significantly in 2017. Given this, they have been included in our low-beta sectors portfolio, despite being typically pro-cyclical. In absolute terms, though, it is far from clear that Chinese capital goods stocks will trend higher (Chart 9). Some investors are hopeful that capital goods producers will benefit from a significant acceleration in infrastructure spending but, as we noted above, the bar is high for the type of stimulus that investors have come to expect. In addition, potential weakness in property construction could be a drag, and could offset gains from a pickup in infrastructure investment.6 We recommend that investors stick with a relative position, until compelling signs of a stimulus overshoot emerge. Bottom Line: The relative performance of Chinese industry groups since mid-June has been almost entirely determined by their beta characteristic, with almost all low-beta industry groups outperforming. Energy stocks have been among the top outperformers within the Chinese equity universe, and several factors support our recommendation that investors initiate an outright long position. A Pause In Broad "Reform" As An Investment Theme Following last November's Communist Party Congress, we noted that China was likely to step up its reform efforts in 2018, and would take meaningful steps to: Pare back heavy-polluting industry Hasten the transition of China's economy to "consumer-led" growth Slow or halt leveraging in the corporate/financial sector Eliminate corruption and graft We argued that Chinese policymakers would have to set the pace of reforms to avoid a significant slowdown in the economy, but we noted that a policy mistake (moving too aggressively) could not be ruled out. We introduced the BCA China Reform Monitor as a way of tracking the intensity of the reforms, which was calculated as an equally-weighted average of the four "winner" sectors that emerged in the month following the Party Congress (energy, consumer staples, health care, and technology) relative to an equally-weighted average of the remaining seven sectors (Chart 10). In particular, we argued that a rise in the monitor that was driven by the underperformance of the denominator would be a warning sign that reforms had become too aggressive for the economy to withstand. Chart 10Reform, As A Broad Theme, Will Be Less Relevant In The Year Ahead
Reform, As A Broad Theme, Will Be Less Relevant In The Year Ahead
Reform, As A Broad Theme, Will Be Less Relevant In The Year Ahead
Chart 10 highlights that the reform monitor rose for the first half of the year, driven by the gains of the numerator rather than losses in the denominator. The message of a sustainable pace of reforms, even against the backdrop of brewing trade tension, was consistent with the relative performance of Chinese stocks and was part of the reason we recommended staying overweight versus the global benchmark in Q1 and the majority of Q2.7 Since mid-June, however, the reform theme has been thrown into reverse: our reform monitor has declined, alongside absolute declines in both "winner" and "loser" sectors. The timing of this inflection point is clearly aligned with President Trump's announcement of the second round of tariffs. Given this, and our view that the U.S./China trade war is likely to get worse over the coming 6-12 months, it is likely that broad "reform" as an investment theme will be less relevant for the foreseeable future, at least relative to policymaker efforts to stabilize the economy. However, for several reasons, we view this as a pause in the theme, rather than an end: On the environmental front, Chart 11 highlights that China continues to pursue a clean air policy, at least in large population centers. Anti-pollution efforts are a signature policy of President Xi Jinping. They affect quality of life and ultimately the legitimacy of the regime, so they cannot be postponed entirely or indefinitely. Chart 11China Continues To Clamp Down On Air Quality
China Continues To Clamp Down On Air Quality
China Continues To Clamp Down On Air Quality
Shifting China's growth model away from primary and secondary industry remains a long-term goal of policymakers. Chart 12 highlights that tertiary industry has already risen non-trivially as a share of GDP. This trend is also clearly visible in the electricity consumption data, which shows that residential and tertiary industry consumption has risen quite materially over the past several years. Chinese policymakers will clearly ease up on the brake over the coming year in terms of deleveraging, but it is far from clear that they will aim for another wave of aggressive private sector debt growth. We highlighted one key reason for this in a recent Special Report: comparing adjusted state-owned enterprise (SOE) return on assets to borrowing costs suggests that the marginal operating gain from debt has become negative for these firms (Chart 13). This implies that further aggressive leveraging of SOEs could push them into a debt trap. In fact, if policymakers do refrain from promoting a major private sector credit expansion over the coming year, that restraint will directly reflect the reform agenda. Chart 12Policymakers Continue To Emphasize A Transition Towards Services
Policymakers Continue To Emphasize A Transition Towards Services
Policymakers Continue To Emphasize A Transition Towards Services
Chart 13SOEs Now Appear To Have A Negative Financial Gain From Debt
SOEs Now Appear To Have A Negative Financial Gain From Debt
SOEs Now Appear To Have A Negative Financial Gain From Debt
Chart 14 highlights that while anti-corruption cases involving gifts and the improper use of public funds are off of their high from early this year, they remain elevated and are not trending lower. As a final point, Chart 15 shows that our long MSCI China environmental, social, and governance (ESG) leaders / short MSCI China trade has been negatively impacted by the pause in reform as an investment theme. While MSCI's ESG indexes aim to generate low tracking error relative to the underlying equity market of each country, technology companies are typically overrepresented in ESG indexes because of the low emissions nature of their business model. In China's case, we noted above that technology industry groups have fared poorly since mid-June, and panel 2 of Chart 15 shows that the underperformance of Chinese investable technology companies since mid-June lines up with the latest leg of ESG underperformance. Chart 14China's Anti-Corruption Drive Is Still In Effect
China's Anti-Corruption Drive Is Still In Effect
China's Anti-Corruption Drive Is Still In Effect
Chart 15Favor ESG Leaders Again When The Reform Theme Reasserts Itself
Favor ESG Leaders Again When The Reform Theme Reasserts Itself
Favor ESG Leaders Again When The Reform Theme Reasserts Itself
It remains unclear how much of tech's underperformance has been due to rich multiples versus concerns that the U.S. crackdown on Chinese technology transfer and intellectual property theft will negatively impact the market share of China's tech companies (via an opening of the market and a rise in the market share of foreign competitors). But we believe that the latter is a factor, and we recommend closing our long ESG leaders / short benchmark trade until "reform", both environmental and otherwise, reasserts itself as a driving factor for the Chinese equity market. Bottom Line: While it is likely paused rather than stalled, broad "reform" as an investment theme will be less relevant over the coming 6-12 months relative to policymaker efforts to stabilize the economy. We are closing our long ESG leaders / short benchmark trade at a loss of 5.5%. Jonathan LaBerge, CFA, Vice President Special Reports jonathanl@bcaresearch.com 1 Pease see China Investment Strategy Special Report "China: How Stimulating Is The Stimulus?" dated August 8, 2018, available at cis.bcaresearch.com. 2 Pease see China Investment Strategy Weekly Report "Investing In The Middle Of A Trade War", dated September 19, 2018, available at cis.bcaresearch.com. 3 Pease see China Investment Strategy Special Report "GICS Sector Changes: The Implications For China", dated September 26, 2018, available at cis.bcaresearch.com. 4 Pease see China Investment Strategy Weekly Report "Now What?", dated June 27, 2018, available at cis.bcaresearch.com. 5 Pease see Commodity & Energy Strategy Weekly Report "Odds Of Oil-Price Spike In 1H19 Rise; 2019 Brent Forecast Lifted $15 To $95/bbl", dated September 20, 2018, available at ces.bcaresearch.com. 6 Pease see China Investment Strategy Special Report "China's Property Market: Where Will It Go From Here?", dated September 13, 2018, available at cis.bcaresearch.com. 7 The rapidly escalating trade war between China and the U.S. caused us to recommended putting Chinese stocks on downgrade watch at the end of March, and we recommended that investors cut their exposure to neutral on June 20. Pease see China Investment Strategy Weekly Report "Chinese Stocks: Trade Frictions Make For A Tenuous Overweight", dated March 28, 2018, and China Investment Strategy Special Report "Downgrade Chinese Stocks To Neutral", dated June 20, 2018, both available at cis.bcaresearch.com. Cyclical Investment Stance Equity Sector Recommendations
Neutral As part of this week's Special Report analyzing the rebadging of the S&P communication services index, we initiated coverage on the new S&P interactive media & services sector. Not doing so would leave a significant gap as the new index (comprised almost entirely of Alphabet & Facebook) makes up half of the market cap weight of the renamed GICS1 sector. We have not overcomplicated our thesis on interactive media & services: we expect that as long as everyone who wants a job has a job, consumer confidence will remain at record highs. This should ensure the flow of advertising dollars that dominate the revenues of the constituent firms, meaning profit growth, and hence stock performance, outpaces the broad market. Still, three risks keep us on the fence: a renewed regulatory focus, rapid unpredictable changes in tastes & technology and the threat of an appreciating U.S. dollar that threatens to sap growth in the key foreign segments. Bottom Line: We are initiating coverage with a neutral rating; please see Monday's Special Report for more details. The tickers in this index are BLBG: S5INMS - GOOG, GOOGL, FB, TWTR, TRIP.
Social Network Neutrality
Social Network Neutrality
Highlights Chart 1Second Half Rebound
Second Half Rebound
Second Half Rebound
The leveling-off of bullish sentiment toward the dollar and the perception of fading political risk have caused spread product to rally hard since the end of June. Indeed, corporate bonds are almost back into the black versus Treasuries for the year (Chart 1). We caution against buying into either of these trends. We have demonstrated that divergences between the U.S. and the rest of the world usually end with weaker U.S. growth,1 and our geopolitical strategists warn that American tensions with both Iran and China are poised to ramp up after the November midterms.2 Add in persistent monetary tightening and corporate profit growth that is barely keeping pace with debt growth, and it becomes clear that the corporate spread environment is turning more negative. Investors should maintain below-benchmark portfolio duration and only a neutral allocation to spread product versus Treasuries. Evidence of deteriorating profit growth is required before turning more negative on spread product. Feature Investment Grade: Neutral Chart 2Investment Grade Market Overview
Investment Grade Market Overview
Investment Grade Market Overview
Investment grade corporate bonds outperformed the duration-equivalent Treasury index by 78 basis points in September, bringing year-to-date excess returns up to -16 bps. The index option-adjusted spread tightened 8 bps on the month, and currently sits at 114 bps. Corporate bonds remain expensive with 12-month breakeven spreads for both A and Baa-rated credit tiers below their 25th percentiles since 1989 (Chart 2). Further, with inflation now at the Fed's target, monetary policy will provide less and less support for corporate bond returns going forward. These are the two main reasons we downgraded our cyclical corporate bond exposure to neutral in June.3 Gross leverage for the nonfinancial corporate sector declined in Q2, for the third consecutive quarter (panel 4), though the declines have been quite modest. Dollar strength and accelerating wage growth will weigh on corporate profits in the second half of the year, and with corporate profit growth just barely keeping pace with debt growth (bottom panel), odds are that leverage will start to rise. Midstream and Independent Energy companies remain attractively valued after adjusting for duration and credit rating (Table 3). These two sectors stand to benefit from rising oil prices into next year, as is expected by our commodity strategists.4 Table 3ACorporate Sector Relative Valuation And Recommended Allocation*
Complacent
Complacent
Table 3BCorporate Sector Risk Vs. Reward*
Complacent
Complacent
High-Yield: Neutral Chart 3High-Yield Market Overview
High-Yield Market Overview
High-Yield Market Overview
High-Yield outperformed the duration-equivalent Treasury index by 104 basis points in September, bringing year-to-date excess returns up to +326 bps. The average index option-adjusted spread tightened 22 bps on the month, and currently sits at 316 bps. Our measure of the excess spread available in the High-Yield index after accounting for default losses is currently 209 bps, below the long-run mean of 247 bps (Chart 3). This tells us that if default losses are in line with our expectations during the next 12 months, we should expect high-yield returns of 209 bps in excess of duration-matched Treasuries, assuming also no capital gains/losses from spread tightening/widening. But the default loss expectations embedded in our calculation are also extremely low relative to history (panel 4). Our assumption, derived from the Moody's baseline default rate forecast and our own forecast of the recovery rate, calls for default losses of 1.07% during the next 12 months. Default losses have rarely come in below that level. While most indicators suggest that default losses will remain low for the next 12 months, historical context clearly demonstrates that the risks are to the upside. Meanwhile, with gross corporate leverage likely to rise in the second half of the year,5 and job cut announcements already trending higher (bottom panel), current default loss forecasts appear overly optimistic. MBS: Neutral Chart 4MBS Market Overview
MBS Market Overview
MBS Market Overview
Mortgage-Backed Securities outperformed the duration-equivalent Treasury index by 11 basis points in September, bringing year-to-date excess returns up to -7 bps. The conventional 30-year zero-volatility MBS spread tightened 5 bps on the month, driven by a 4 bps decline in the compensation for prepayment risk (option cost) and a 1 bp tightening in the option-adjusted spread. The excess return Bond Map on page 15 shows that MBS offer a relatively poor risk/reward trade-off, particularly compared to Aaa-rated non-Agency CMBS, High-Yield and Sovereigns. However, our Bond Map does not account for the macro environment, which remains favorable for the sector. Refi activity is tepid, and continued Fed rate hikes will ensure that it stays that way (Chart 4). Meanwhile, lending standards have been slowly easing since 2014 (bottom panel). Despite the steady easing, the Fed's most recent Senior Loan Officer Survey reports that mortgage lending standards remain at the tighter end of the range since 2005. This suggests that further easing is likely going forward. In a recent report we noted that residential investment has decelerated in recent months, with the weakness mostly stemming from multi-family construction.6 Demand for single-family housing remains robust, and we see no potential negative impact on MBS spreads during the next 6-12 months. Government-Related: Underweight Chart 5Government-Related Market Overview
Government-Related Market Overview
Government-Related Market Overview
The Government-Related index outperformed the duration-equivalent Treasury index by 48 basis points in September, bringing year-to-date excess returns up to +38 bps. Sovereign debt outperformed the Treasury benchmark by 151 bps, bringing year-to-date excess returns up to +67 bps. Foreign Agencies outperformed by 70 bps on the month, bringing year-to-date excess returns up to +34 bps. Local Authorities outperformed by 50 bps, bringing year-to-date excess returns up to +91 bps. Supranationals outperformed Treasuries by 4 bps, bringing year-to-date excess returns up to +16 bps. Domestic Agency bonds outperformed by 6 bps, bringing year-to-date excess returns up to +10 bps. After adjusting for differences in credit rating and duration, the average spread available from the USD-denominated Sovereign index is unattractive compared to the U.S. corporate bond space (Chart 5). Dollar strength should also cause Sovereign debt to underperform U.S. corporates in the coming months (panel 3). But the outlook could be worse for the Sovereign index. Mexico, Colombia and the Philippines make up approximately 50% of the index's market cap, and our Emerging Markets Strategy team has found that none of those countries are particularly vulnerable to a slowdown in Chinese aggregate demand.7 Mexico and Columbia are particularly insulated. Municipal Bonds: Overweight Chart 6Municipal Market Overview
Municipal Market Overview
Municipal Market Overview
Municipal bonds outperformed the duration-equivalent Treasury index by 36 basis points in September, bringing year-to-date excess returns up to +153 bps (before adjusting for the tax advantage). The average Aaa-rated Municipal / Treasury (M/T) yield ratio rose 2% in September, and currently sits at 87% (Chart 6). This is about one standard deviation below its post-crisis mean and only slightly above the average of 81% that was observed in the late stages of the previous cycle, between mid-2006 and mid-2007. In a recent report we demonstrated that while M/T yield ratios are low, municipal bonds offer attractive yields compared to corporate bonds.8 For example, we observe that a 5-year Aa-rated municipal bond carries a yield of 2.40% versus a yield of 3.42% for a comparable corporate bond index. This implies that an investor with an effective tax rate of 30% should be indifferent between the two bonds. Moving further out the curve, the breakeven tax rate falls to 23% at the 10-year maturity point and is even lower at the 20-year maturity point. The greater attractiveness of long-maturity munis is consistent across credit tiers, and investors should favor long-dated over short-dated municipal debt (bottom panel). Treasury Curve: Favor The 7-Year Bullet Over The 1/20 Barbell Chart 7Treasury Yield Curve Overview
Treasury Yield Curve Overview
Treasury Yield Curve Overview
The Treasury curve underwent a roughly parallel upward shift in September. While the 10-year Treasury yield rose 19 bps, the 2/10 slope was unchanged at 24 bps and the 5/30 slope flattened 3 bps to reach 25 bps. The yield curve is already quite flat, and our models suggest that a lot more flattening is discounted. For example, our 1/7/20 butterfly spread model shows that 32 bps of 1/20 flattening is priced into the 1/7/20 butterfly spread for the next six months (Chart 7).9 With the U.S. economy growing strongly and the Fed moving at a gradual +25 bps per quarter pace, the curve is likely to flatten by less than is currently discounted on a cyclical (6-12 month) horizon. This argues for positioning in curve steepeners. In a recent report we also made the case for owning steepeners as a hedge against the risk that weak foreign growth infiltrates the U.S. via a stronger dollar.10 We found that the yield pick-up is similar for the different steepener trades we considered, and also that the 7-year yield has the most downside in the event of a pause in the Fed's tightening cycle. This argues for maintaining our position long the 7-year bullet and short the 1/20 barbell, a position that has earned +37 bps since it was initiated in May. TIPS: Overweight Chart 8Inflation Compensation
Inflation Compensation
Inflation Compensation
TIPS outperformed the duration-equivalent nominal Treasury index by 16 basis points in September, bringing year-to-date excess returns up to +138 bps. The 10-year TIPS breakeven inflation rate rose 6 bps on the month and currently sits at 2.14%. The 5-year/5-year forward TIPS breakeven inflation rate rose 7 bps and currently sits at 2.25%. Both the 10-year and 5-year/5-year forward TIPS breakeven inflation rates remain below the 2.3% to 2.5% range that has historically been consistent with inflation expectations that are well-anchored around the Fed's 2% target. TIPS breakeven rates have held firm in recent months, despite the sharp drop in commodity prices (Chart 8). This suggests that investors' inflation expectations are increasingly being swayed by U.S. core inflation, which is now more or less consistent with the Fed's target (bottom panel). In recent reports we showed that year-over-year core inflation (both CPI and PCE) is likely to flatten-off during the next six months.11 But continued inflation prints near the Fed's target should be sufficient to drive long-dated breakevens higher, into our target range. This will occur as persistent prints near target cause investors' fears of deflation to gradually ebb. ABS: Neutral Chart 9ABS Market Overview
ABS Market Overview
ABS Market Overview
Asset-Backed Securities outperformed the duration-equivalent Treasury index by 11 basis points in September, bringing year-to-date excess returns up to +29 bps. The index option-adjusted spread for Aaa-rated ABS narrowed 4 bps on the month and now stands at 33 bps, just below its pre-crisis minimum. The excess return Bond Map on page 15 shows that consumer ABS offer attractive return potential compared to other high-rated spread products - such as Agency CMBS and Domestic Agencies - but also carry a greater risk of losses. The Bond Map also reveals that Aaa-rated credit card ABS offer a more attractive risk/reward trade-off than Aaa-rated auto loan ABS. We continue to recommend favoring the former over the latter. Credit quality trends have been slowly moving against the ABS sector and we think caution is warranted. The consumer credit delinquency rate bottomed in 2015, albeit from a very low level, and it should continue to head higher based on the trend in household interest coverage (Chart 9). Average consumer credit bank lending standards have also been tightening for nine consecutive quarters (bottom panel). Non-Agency CMBS: Underweight Chart 10CMBS Market Overview
CMBS Market Overview
CMBS Market Overview
Non-Agency Commercial Mortgage-Backed Securities outperformed the duration-equivalent Treasury index by 41 basis points in September, bringing year-to-date excess returns up to +167 bps. The index option-adjusted spread for non-agency Aaa-rated CMBS tightened 6 bps on the month and currently sits at 83 bps (Chart 10). In a recent report we showed that the macro picture for CMBS is decidedly mixed.12 A typical negative environment for CMBS is characterized by tightening bank lending standards for commercial real estate loans and falling demand. At present, both lending standards and demand for nonresidential real estate loans are close to unchanged (bottom two panels). Agency CMBS: Overweight Agency CMBS outperformed the duration-equivalent Treasury index by 13 basis points in September, bringing year-to-date excess returns up to +54 bps. The index option-adjusted spread tightened 1 bp on the month and currently sits at 44 bps. The Bond Maps on page 15 show that Agency CMBS offer high potential return compared to other low risk spread products. An overweight allocation to this defensive sector continues to make sense. The BCA Bond Maps The following page presents excess return and total return Bond Maps that we use to assess the relative risk/reward trade-off between different sectors of the U.S. fixed income market. The Maps employ volatility-adjusted breakeven spread/yield analysis to show how likely it is that a given sector will earn/lose money during the subsequent 12 months. The Maps do not impose any macroeconomic view. The Excess Return Bond Map The horizontal axis of the excess return Bond Map shows the number of days of average spread widening required for each sector to lose 100 bps versus a position in duration-matched Treasuries. Sectors plotting further to the left require more days of average spread widening and are therefore less likely to see losses. The vertical axis shows the number of days of average spread tightening required for each sector to earn 100 bps in excess of duration-matched Treasuries. Sectors plotting further toward the top require fewer days of spread tightening and are therefore more likely to earn 100 bps in excess of Treasuries. The Total Return Bond Map The horizontal axis of the total return Bond Map shows the number of days of average yield increase required for each sector to lose 5% in total return terms. Sectors plotting further to the left require more days of yield increases and are therefore less likely to lose 5%. The vertical axis shows the number of days of average yield decline required for each sector to earn 5% in total return terms. Sectors plotting further toward the top require fewer days of yield decline and are therefore more likely to earn 5%. Chart 11Excess Return Bond Map (As Of September 28, 2018)
Complacent
Complacent
Chart 12Total Return Bond Map (As Of September 28, 2018)
Complacent
Complacent
Table 4Butterfly Strategy Valuation (As Of September 28, 2018)
Complacent
Complacent
Table 5Discounted Slope Change During Next 6 Months (BPs)
Complacent
Complacent
Ryan Swift, Vice President U.S. Bond Strategy rswift@bcaresearch.com 1 Please see U.S. Bond Strategy Weekly Report, "An Oasis Of Prosperity?", dated August 21, 2018, available at usbs.bcaresearch.com 2 Please see Geopolitical Strategy Weekly Report, "A Story Told Through Charts: The U.S. Midterm Election", dated September 19, 2018, available at gps.bcaresearch.com 3 Please see U.S. Bond Strategy Special Report, "Go To Neutral On Spread Product", dated June 26, 2018, available at usbs.bcaresearch.com 4 Please see Commodity & Energy Strategy Weekly Report, "Odds Of Oil-Price Spike In 1H19 Rise; 2019 Brent Forecast Lifted $15 To $95/bbl", dated September 20, 2018, available at ces.bcaresearch.com 5 Please see U.S. Bond Strategy Weekly Report, "More Than One Reason To Own Steepeners", dated September 25, 2018, available at usbs.bcaresearch.com 6 Please see U.S. Bond Strategy Weekly Report, "More Than One Reason To Own Steepeners", dated September 25, 2018, available at usbs.bcaresearch.com 7 Please see Emerging Markets Strategy Special Report, "Deciphering Global Trade Linkages", dated September 27, 2018, available at ems.bcaresearch.com 8 Please see U.S. Bond Strategy Weekly Report, "An Oasis Of Prosperity?", dated August 21, 2018, available at usbs.bcaresearch.com 9 For further details on our yield curve models please see U.S. Bond Strategy Special Report, "More Bullets, Barbells And Butterflies", dated May 15, 2018, available at usbs.bcaresearch.com 10 Please see U.S. Bond Strategy Weekly Report, "More Than One Reason To Own Steepeners", dated September 25, 2018, available at usbs.bcaresearch.com 11 Please see U.S. Bond Strategy Weekly Report, "No Excuses", dated September 18, 2018, available at usbs.bcaresearch.com 12 Please see U.S. Bond Strategy Weekly Report, "The Fed's Balance Sheet Problem", dated July 17, 2018, available at usbs.bcaresearch.com Fixed Income Sector Performance Recommended Portfolio Specification Corporate Sector Relative Valuation And Recommended Allocation Total Return Comparison: 7-Year Bullet Versus 2-20 Barbell (6-Month Investment Horizon)
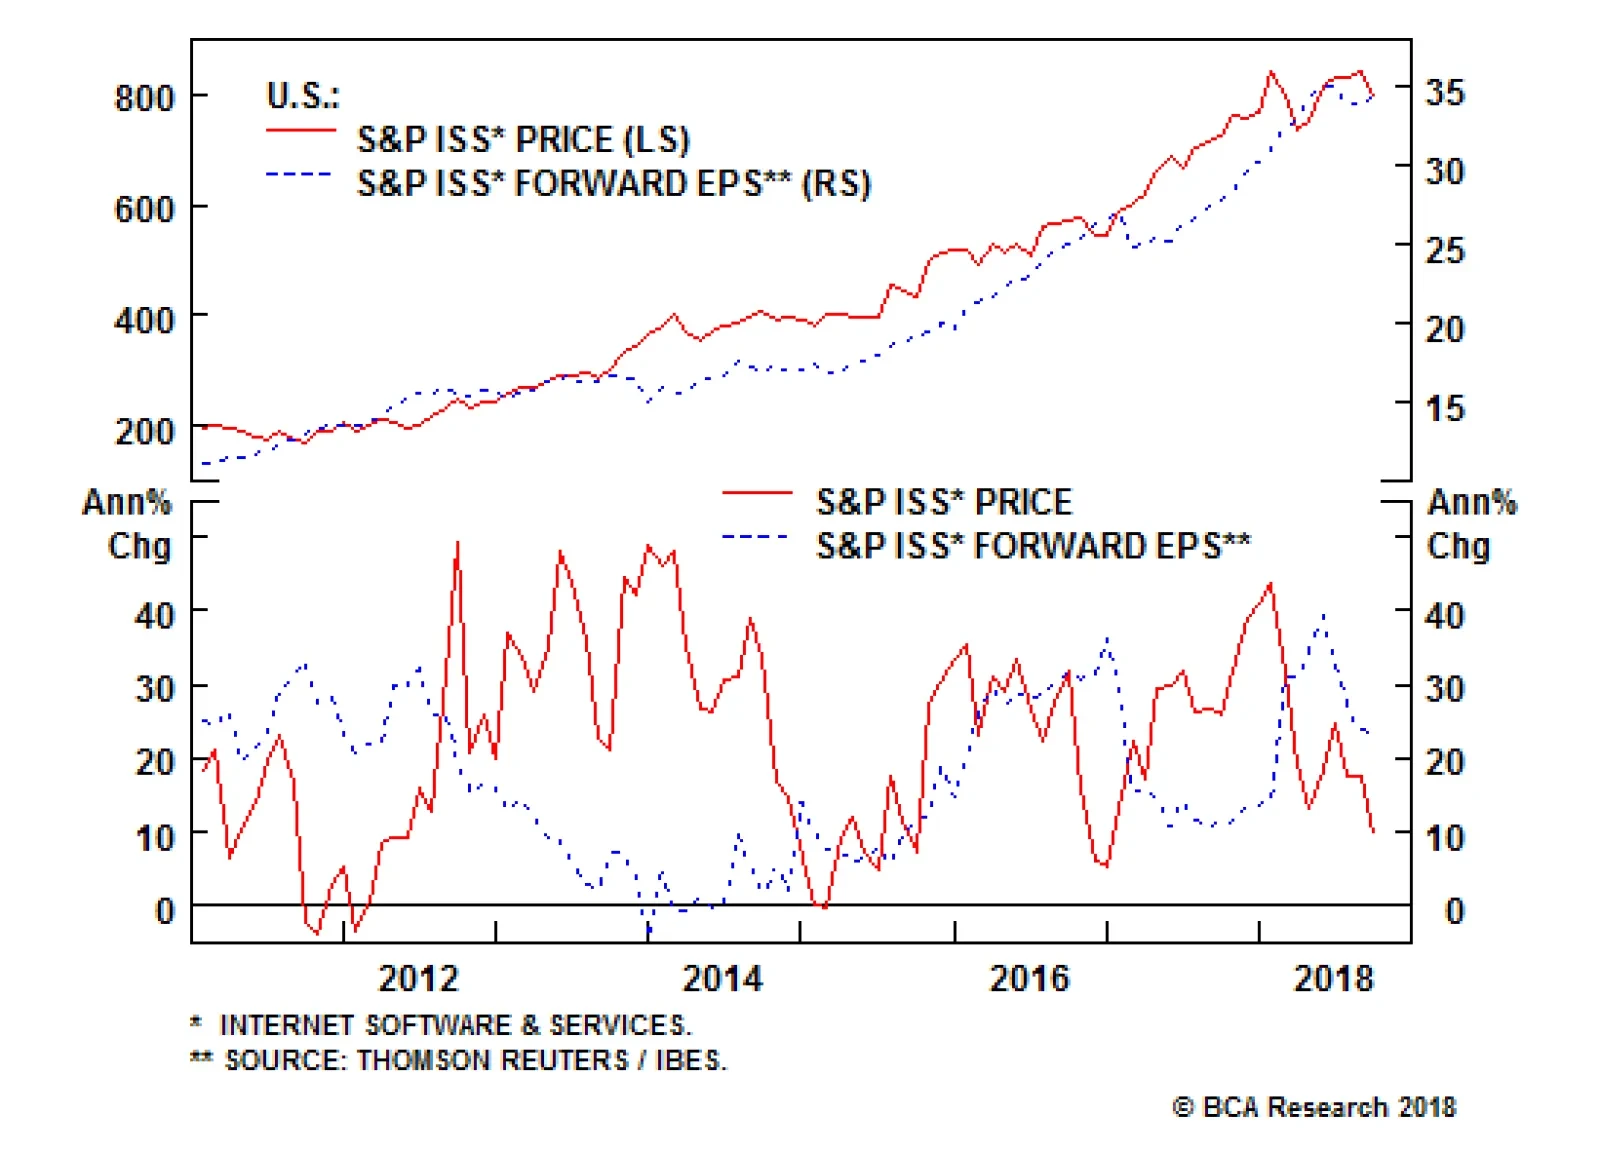
Interactive Media & Services - Breaking Out?
…
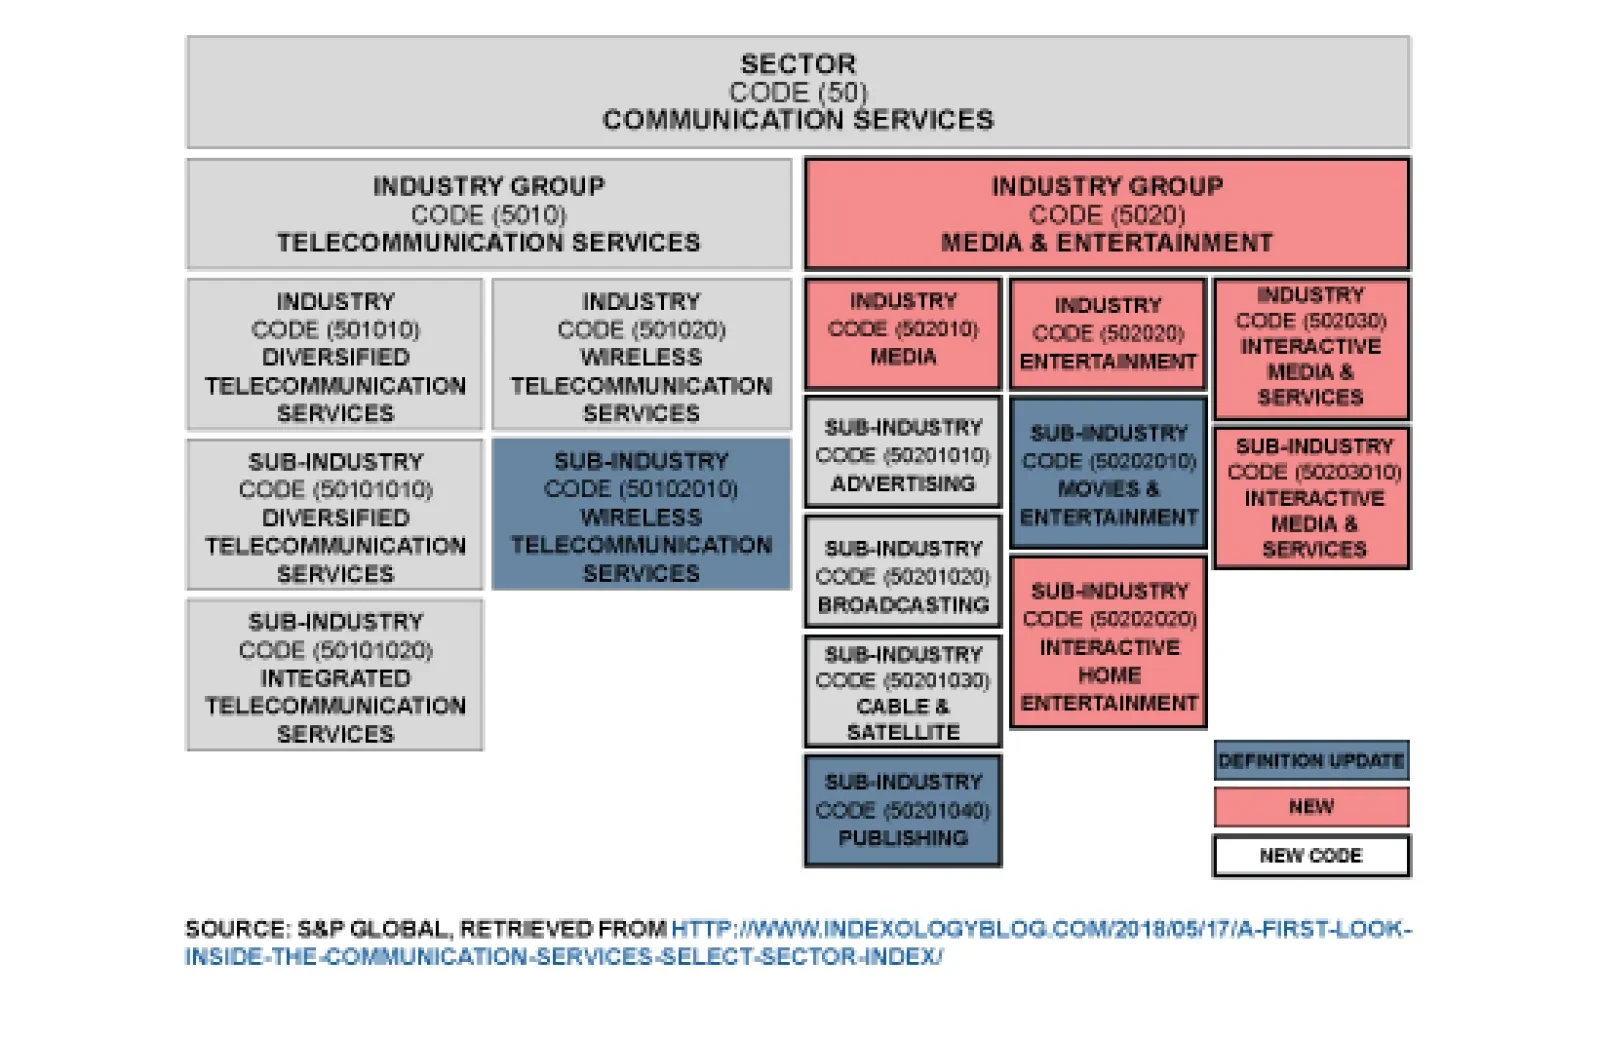
The reshuffling dilutes what until recently was a pure-play safe haven index. Previously, telecommunications services was an ultra-low beta, high-dividend, zero currency-exposure prototypical defensive index. Communication services will be dominated by…
Underweight At the market's close last Friday, investors welcomed a new (rather, a renamed) GICS1 sector to the industry taxonomy: the S&P communication services sector. The change had long been overdue as the progenitor sector, telecommunication services, had been hollowed down to three companies and represented approximately 2% of the S&P 500. Further, finding homes for various new media and technology companies had left a hodgepodge of consumer discretionary and information technology subsectors that bore little resemblance to their respective peers. In short, we welcome the new taxonomy. That said, we are not changing our recommendations on the sub-sectors that are changing or moving in to the new GICS1 sector (with the exception of the new S&P interactive media & services index that we initiated coverage on yesterday with a neutral rating ). Accordingly, telecom services remains an underweight subsector under the new banner. We are moving four indexes from consumer discretionary to communication services: advertising (overweight), cable & satellite (neutral), movies & entertainment (neutral) and publishing (neutral). Though the new sector has one overweight subsector (advertising) and one underweight subsector (telecom services), the much greater weight of the latter subsector biases our recommendation on the communication services sector to underweight. Bottom Line: Our initial recommendation for the new S&P communication services sector is underweight. For investors seeking tech exposure we continue to recommend the S&P software and S&P tech hardware, storage & peripherals tech sub-indexes that are high-conviction overweights. Please see yesterday's Special Report for more details, including our initiation of coverage on the new S&P interactive media & services.
New Lines Of Communication
New Lines Of Communication
Highlights Recommended Allocation
Quarterly - October 2018
Quarterly - October 2018
We don't see any change over the next six to 12 months to the current trends of strong U.S. growth, continuing Fed hikes, rising long-term interest rates, and an appreciating dollar. We stay neutral on global equities and continue to favor the U.S. and, to a degree, Japan. Given rising rates, a strengthening dollar, ongoing trade war and moderate slowdown in China, we expect EM assets to sell off further. We forecast the 10-year U.S. Treasuries yield to rise to 3.5% by H1 2019, and so we stay underweight fixed income, short duration, and continue to prefer TIPs. We are only neutral on credit within the (underweight) fixed-income bucket. We shift our equity sector weightings to reflect the GICS recategorization. We recommend a neutral on the new internet-heavy Communication sector, and underweight on Real Estate. We have a somewhat defensive sector bias, with overweights in Consumer Staples and Healthcare. Alternative risk assets, such as private equity and real estate, look increasingly overheated. We prefer hedge funds and farmland at this stage of the cycle. Overview More Of The Same When there's been a strong trend, it's always tempting to be contrarian and argue for a reversal. Tempting but, at the moment, we think wrong. This year has been characterized by a strong U.S. economy but slowing growth elsewhere, the outperformance of U.S. equities (up 10% year-to-date, compared to a 4% decline in the rest of the world), rising U.S. interest rates, dollar appreciation, and a big sell-off in emerging markets. While a short-term correction is always possible, we don't see a fundamental end to these trends over the next 6 to 12 months. Chart 1U.S. Growth Still Looks Strong
U.S. Growth Still Looks Strong
U.S. Growth Still Looks Strong
Chart 2Growth In Europe And Japan Has Slipped
Growth In Europe And Japan Has Slipped
Growth In Europe And Japan Has Slipped
U.S. growth is likely to remain strong. Consumer and business sentiment are both close to record highs; wage growth is beginning (finally) to accelerate; capex intentions are buoyant; and fiscal stimulus will add 0.7% to GDP growth this year and 0.8% next, as the budget deficit widens to close to 6% of GDP (Chart 1). Europe and Japan, by contrast, have slowed this year: both are more exposed to emerging markets than is the U.S.; fiscal policy in neither is particularly accommodative; and European banks suffer from weak loan growth and their EM exposure (Chart 2). The one trigger that would cause global ex-U.S. growth to accelerate relative to U.S. growth is a massive stimulus in China similar to 2009 and 2015. We think this unlikely because the authorities have reiterated their commitment to deleveraging and structural reform. Chinese credit growth and money supply data have as yet shown no signs of picking up, but they should be monitored carefully (Chart 3). Chart 3Chinese Stimilus, What Stimilus?
Chinese Stimilus, What Stimilus?
Chinese Stimilus, What Stimilus?
Chart 4Republicans Like Trump's Tough Trade Talk
Quarterly - October 2018
Quarterly - October 2018
An end to the trade war might also reverse the trends. U.S. markets have shrugged off the risk of escalating retaliatory tariffs on the (reasonable) grounds that trade has relatively little impact on the U.S. It is hard to see an end-game to the tariff war. President Trump's popularity has risen since he got tough on trade (Chart 4). He has changed his mind on many areas of policy during his career, but he's always consistently argued that the U.S. deficit shows that its trading partners treat it unfairly. The probability is high that the 10% tariff on $200 billion of Chinese goods will rise to 25% in January, and is eventually extended to all Chinese imports. It is equally unlikely that Xi Jinping will make concessions, since he can't be seen to bend to U.S. pressure and won't put at risk the crucial "Made in China 2025" plan. Chart 5Phillips Curve Working Again
Phillips Curve Working Again
Phillips Curve Working Again
Although tariffs may not hurt U.S. growth much, they could be inflationary. The price of washing machines, the subject of the earliest tariffs in January, rose by 18% over the next four months. This is just another reason why it's unlikely that the Fed will slow its pace of rate hikes. With the labor market now clearly tight, there are signs that the Phillips curve is beginning to reassert itself (Chart 5), and wage growth is accelerating. With core PCE inflation at its 2% target and the impact of fiscal stimulus still coming through, the Fed will feel comfortable about maintaining its current schedule of one 25 basis point hike a quarter until there are signs that the economy is slowing.1 Could the sell-off in emerging markets cause the Fed to move to hold? In the 1990s Asia Crisis, only when the fall in Asian stocks started to affect the U.S. economy (with, for example, the manufacturing ISM going below 50) and the U.S. stock market, did the Fed ease policy (Chart 6). Eventually, the slowdown in the rest of the world might start to hurt the U.S. In the past, when the global ex-U.S. Leading Economic Indicator has fallen below zero, it has usually been followed by U.S. growth also faltering (Chart 7). Chart 6In 1998, Fed Cut Only When EM Hurt The U.S.
In 1998, Fed Cut Only When EM Hurt The U.S.
In 1998, Fed Cut Only When EM Hurt The U.S.
Chart 7When The World Slows, Often U.S. Does Too
When The World Slows, Often U.S. Does Too
When The World Slows, Often U.S. Does Too
Table 1What To Watch For
Quarterly - October 2018
Quarterly - October 2018
Having in June lowered our recommendation on global equities to neutral (but keeping our overweight on U.S. stocks), we continue to monitor the factors that would make us turn negative on risk assets (Table 1 and Chart 8). None of them is yet flashing a warning signal, but it seems likely that we will need to move to an outright defensive stance sometime in H1 2019. One final key thing to watch: any signs that U.S. earnings growth is slipping. Much of the outperformance of U.S. equities this year is simply explained by better earnings growth, partly due to the tax cuts. Analysts' forecasts for 2019 have so far been very stable. If they start to be revised down, perhaps because of higher wages and export sales being dampened by the strong dollar, that would also be a signal to switch out of U.S. equities (Chart 9). Chart 8What To Watch For?
What To Watch For?
What To Watch For?
Chart 9Will Analysts Revise Down EPS Forecasts?
Will Analysts Revise Down EPS Forecasts?
Will Analysts Revise Down EPS Forecasts?
Garry Evans, Senior Vice President Global Asset Allocation garry@bcaresearch.com What Our Clients Are Asking Is The Fed Turning Dovish? Chart 10Fed Policy Still Accomodative
Fed Policy Still Accomodative
Fed Policy Still Accomodative
Many investors interpreted Fed Chair Powell's speech at Jackson Hole in August dovishly. Powell questioned whether "policymakers should navigate by [the] stars": r* (the neutral rate of interest) and u* (the natural rate of unemployment), since these are uncertain. He emphasized that policy will be data dependent. We read it differently. Powell also pointed out that "inflation is near our 2 percent objective, and most people who want a job are finding one", and concluded that a "gradual process of normalization remains appropriate". A speech in September by Lael Brainard, a dovish FOMC member, reinforced this. She separated the long-run neutral rate (the terminal rate in the Fed dot plot) from the short-term neutral rate (Chart 10, panel 1). Her conclusion was that "with fiscal stimulus in the pipeline and financial conditions supportive of growth, the shorter-run neutral interest rate is likely to move up somewhat further, and it may well surpass the long-run equilibrium rate." In other words, the Fed needs to continue its gradual pace of hikes. The market does not see it that way. Futures markets have priced in that the Fed will raise rates until June (when the Fed Funds Rate will be 2.75-3% in nominal terms) and then stop (panel 2). But this implies that the Fed will halt once the FFR is at the (current estimate of the) neutral rate. But inflation is likely to pick up further over the next 12 months. And the Fed is worried that, despite rate hikes, financial conditions haven't tightened much (panel 3). So we expect the Fed to keep tightening until there are signs that growth is slowing. Is The Worst Over For Emerging Markets? Chart 11Excess Debt Is Underlying Cause Of EM Sell-Off
Excess Debt Is Underlying Cause Of EM Sell-Off
Excess Debt Is Underlying Cause Of EM Sell-Off
Since the plunge in the Argentinian peso and Turkish lira, currencies in most emerging markets have fallen sharply. Does this present a buying opportunity for investors, or is there more contagion to come? While a short-term rebound is not impossible, we remain very negative on the outlook for most emerging market assets. Fed policy and rising U.S. interest rates can be seen as the trigger for, but not the underlying cause of, the recent sell-off. Since 1980 (Chart 11), there have been only two instances where EM stock prices collapsed amid rising U.S. rates: the 1982 Latin American debt crisis and the 1994 Mexican Tequila crisis. But both occurred because of poor EM fundamentals. We see similar underlying problems today. EM dollar-denominated debt as a share of GDP and exports is as high as it was during the Asia Crisis in the late 1990s. In addition, the EM business cycle will continue to decelerate in the medium term, as evidenced by falling manufacturing PMIs. Consequently, EM corporate earnings growth is slowing, and we expect it to fall meaningfully in this downturn. EM economies have become increasingly dependent on Chinese growth for their export demand. China is slowing, but we expect limited credit and fiscal stimulus from the authorities given their shift in focus towards de-leveraging and reforming the financial sector. Additionally, global trade is also weakening as seen by falling Asian exports and sluggish container freight movements. EM central banks have responded to currency weakness by raising rates, which in turn will lead to rising local currency bond yields and tightening financial conditions. A tightening of liquidity will slow money and credit creation, ultimately weighing on domestic demand. Moreover, with an accelerating U.S. economy, the U.S. dollar will continue to strengthen, eventually tightening global liquidity. We continue to advocate an underweight position in EM assets. Share prices will not bottom until EM interest rates fall on a sustainable basis, or until valuations reach clearly over-sold levels, which they have not yet. Chart 12The New Sectors Look Very Different
Quarterly - October 2018
Quarterly - October 2018
What Just Happened To GICS? Following Real Estate's 2016 separation from Financials to become the 11th sector within GICS, September 28 2018 marked an even more disruptive change to equity classification. The change, aimed at keeping up with innovation and the current market structure, affects three of the 11 sectors: Telecommunication Services, Consumer Discretionary, and Information Technology (Chart 12). In short, the Telecommunication Services sector, once a value, low-weight, low-beta, high-yield, defensive sector is broadened and renamed Communication Services, offering broad-based coverage of content on various internet and media platforms. It includes the Media group, as well as selected companies from Internet & Direct Marketing Retail, taken out of Consumer Discretionary. Additionally, selected companies from the Internet Software & Services, as well as Application and Home Entertainment Software move into the new sector from IT. The E-commerce group also grows, with selected companies moving out of IT into Consumer Discretionary. Telecom/Communication, which previously behaved like Utilities, has turned into a high-growth, low-dividend sector. It is also a cyclical rather than defensive. It should trade at much higher multiples than its previous incarnation. IT is also no longer be the same. The sector, which once represented nearly 20% of the ACWI index, has shrunk to 13%, now mostly comprises hardware and software companies, after losing constituents such as Alphabet, Facebook, and Tencent. Chart 13Three Ideas To Enhance Risk-Adjusted Return
Three Ideas To Enhance Risk-Adjusted Return
Three Ideas To Enhance Risk-Adjusted Return
Where To Find Yield In A Low-Return Environment? BCA's House View in June downgraded equities to neutral and moved cash to overweight. For U.S. investors, holding cash is quite attractive, as the yield on three-month Treasury bills is above 2%, higher than the 1.8% dividend yield on equities. But investors in Europe and Japan face negative yields on cash. Our recent Special Report analyzed three investment instruments that could enhance a balanced portfolio's risk-adjusted returns (Chart 13).2 Floating-Rate Notes. FRNs tend to be issued by government-sponsored enterprises and investment-grade corporations. They offer a nice yield pick-up over short-term U.S. Treasuries with significantly shorter duration. However, they do carry credit risk and so performed poorly in the 2007-9 recession. We, therefore, recommend investors fund these positions from their high-yield bucket. Leveraged Loans. These are floating-rate senior-secured bank loans. However, secured does not mean safe. Most are sub-investment grade and can be very illiquid, because physical delivery is often needed. They tend to be positively correlated with junk bonds but negatively correlated with the aggregate bond index. This suggests that adding bank loans to a portfolio can add diversification, and that replacing some high-yield holdings with bank loans can generate a sub-investment grade basket with a better risk/reward profile. Danish Mortgage Bonds. DMBs are covered mortgage bonds, with an average duration of five years and offering a yield to maturity of around 2% in Danish Krone. They have a strong track record: not a single bond has defaulted in the 200-year history of the market. This makes the market very attractive to euro zone and Japanese investors struggling with low bond yields. We find that adding DMBs to a standard bond portfolio significantly improves its risk/return profile. The main snags are that this is a fairly small market with a total outstanding market value of DKR2.7 trillion (around USD400 billion) - and is already 23% owned by foreigners. Global Economy Overview: The global economy will continue to be characterized by significant divergences. U.S. growth remains robust, pushing up inflation to the Fed's 2% target. By contrast, European and Japanese growth has weakened so far this year, meaning that central banks there remain cautious about tightening. Meanwhile, emerging markets will continue to deteriorate, faced with an appreciating dollar, rising U.S. interest rates, and lack of a big stimulus in China. U.S.: The ISM manufacturing index hit a 14-year high, above 60, in September before falling back slightly, to 59.8, in October. Core PCE inflation has reached 2%, the Fed's target. Wage growth, as measured by average hourly earnings, has finally begun to accelerate, reaching 2.9% YoY. With consumption and capex likely to remain robust, and the effect of fiscal stimulus not peaking until early next year, the U.S. economy will continue to grow strongly through 2019 (Chart 14). Only the recent slowdown in housing (probably caused by higher interest rates) remains a concern, but the sector is probably too small to derail overall economic growth. Chart 14Divergences Continue: U.S. Strong...
Divergences Continue: U.S. Strong...
Divergences Continue: U.S. Strong...
Chart 15...Rest Of The World Weakening
...Rest Of The World Weakening
...Rest Of The World Weakening
Euro Area: The decline in growth momentum seen since the start of the year has probably now bottomed. Both the PMI and ZEW indexes appear to have stabilized at a moderately positive level (Chart 15, panel 1). Core CPI inflation remains stable at about 1%, though headline inflation has been pushed up by higher oil prices. In this environment the ECB will be slow to raise rates, probably waiting until September next year and then hiking by only 10 basis points. Japan: The external sector has weakened, as shown by the industrial production data and leading economic indicators, probably because of slowing growth in China. However the domestic sector is showing signs of life, with corporate profits growing by more than 20% year-on-year, and capex rising at a rapid pace (6.4% YoY in Q2). However core inflation remains barely above zero, and therefore the Bank of Japan will continue its Yield Curve Control policy for the foreseeable future. Emerging Markets: Chinese growth continues to slow moderately, with the Caixin manufacturing PMI exactly at 50 (Chart 15, panel 3). The key question now is whether the authorities will implement massive stimulus, as they did in 2009 and 2015. The PBOC has cut rates and the government announced that it is bringing forward some fiscal spending. But the priority remains to deleverage and push ahead with structural reform. We do not expect, therefore, to see a significant acceleration of credit growth. Elsewhere in EM, central banks have significantly raised interest rates to defend their currencies, and this is likely to trigger recession in many countries within the next six months. Interest rates: Monetary policy divergences are likely to continue. The Fed will hike by 25 basis points a quarter until there are signs that growth is slowing and that tightness in the labor market is easing. Inflation is not showing signs of dramatic acceleration but, with the labor market so tight, the Fed will want to take out insurance against a future sharp rise. By contrast, the ECB and BOJ have no need to tighten (Chart 15, panel 4). Accordingly, we expect to see US long-term interest rates rise, with the 10-year Treasury bond yield reaching 3.5% in the first half of 2019. Chart 16When Will Earnings Turn Down?
When Will Earnings Turn Down?
When Will Earnings Turn Down?
Global Equities Stay Cautious: We turned cautious on equities in the previous Quarterly Strategy Outlook,3 by upgrading the low-beta U.S. equity market to overweight at the expense of the high-beta euro area, by taking profit in our pro-cyclical tilt and moving to more defensive sectors, and by maintaining our core position of overweight DM relative to EM. Those moves proved to be effective as DM outperformed EM by 6%, the U.S. outperformed the euro area by 7.5%, and defensives outperformed cyclicals by 1.2%. Because of the sharp underperformance of EM equities relative to DM peers, it's tempting to bottom-fish EM equities. However, we suggest investors refrain from such an urge because we think it's too early to take such risk (see nexts section below). We therefore maintain our defensive tilts in both regional and country allocation and global sector allocation (see table at the end of the report). Equity valuations are less stretched than at the beginning of the year, due to strong earnings growth. However, BCA's global earnings model shows that earnings growth will slow significantly next year (Chart 16, panels 1 & 2). With earnings growth for every sector in positive territory, and the DM profit margin near a historical high, it would not take much for analysts to revise down earnings expectations (bottom 3 panels). Reflecting the GICS sector reclassification, we have initiated a neutral on the Communication sector and an underweight on the Real Estate sector. Chart 17EM Underperformance To Continue
EM Underperformance To Continue
EM Underperformance To Continue
Continue To Underweight EM Vs. DM Equities Underweight EM equities vs. the DM counterparts has been a core position in GAA's global equity portfolio (in U.S. dollars and unhedged) this year. Despite the significant performance divergence over the past few months, we recommend investors continue to underweight EM equities, for the following reasons: First, BCA's House View is for the U.S. dollar to strengthen further, especially against EM currencies. This does not bode well for the EM equity performance relative to DM equities, given the close correlation of this with EM currencies (Chart 17, panel 1); Second, Chinese economic growth plays an important role in the EM economy. China's large weight in the EM equity index also makes the link prominent. With increasing concern from the trade war with the U.S., Chinese imports are likely to deteriorate, implying the sell-off in EM shares may have further to go (panel 2); Third, EM earnings growth is closely correlated with money supply as shown in panel 3. Forward earnings growth will have to be revised down given the slowing in money growth. Finally, even though EM equity valuations are now cheap on an absolute basis, EM equities have mostly traded in history at a discount to DM. Currently, the discount is still in line with historical averages (panel 4). Chart 18Real Estate Sector Looks Vulnerable
Real Estate Sector Looks Vulnerable
Real Estate Sector Looks Vulnerable
Sector Allocation: Underweight on Real Estate and Neutral on Communication With the recently implemented GICS reclassification, involving the creation of a new Communication Services Sector by moving the media component in Consumer Discretionary and the internet companies in IT to the old Telecom Services sector (see section below for more details), we are reviewing our global sector allocations. Since we were already neutral on IT and Telecom Services, and since the new Communication sector is dominated by internet companies, it's natural to be neutral on the new Communication sector. Real Estate was lifted out of the Financials sector in 2016 to be a separate sector. But we did not include this sector previously in our recommendations because it mostly consists of commercial real estate (CRE) investment trusts. In our alternative asset coverage, we had preferred direct real estate due to its lower correlation with equities in general. In July this year, however, we downgraded exposure to direct real estate.4 It's much easier to reduce REITS holdings than direct CREs. As such, we take this opportunity to initiate an underweight on the Real Estate sector, mainly because of the less favorable conditions in both the macro backdrop and industry fundamentals. From a macro perspective, the tailwind from declining interest rates has turned into a headwind as interest rates rise. Over the past few years, the relative performance of Real Estate to the overall equity index has been closely correlated with the rise and fall of the long-term interest rates. BCA expects 10-year interest rates to trend higher. This does not bode well for the sector's equity performance going forward (Chart 18, panel 1). Industry fundamentals look vulnerable as well. The occupancy rate has already started to decline (panel 2). CRE prices have been making new highs on an inflation-adjusted basis, fueled by a historically high level of CRE loans and low level of loan delinquencies (Chart 18, panels 3 and 4). All these make the CRE sector extremely vulnerable. Government Bonds Maintain Slight Underweight On Duration. The U.S. 10-year government bond yield traded in a tight range in Q3 between 2.8% and 3.1%. With the current yield at 3.07% and the most recent inflation reading below expectations, it's tempting to take a less bearish view on duration, especially given the weakness in EM economies and EM asset prices. We agree that the spillover from weak global growth into the U.S. might cause the Fed to pause its gradual 25bps-per-quarter rate hike cycle at some point in 2019; however, markets currently have priced in only two rate hikes in the entire year of 2019, which means the risk is already priced in. With increasing pressure from rising supply, we still see rates rising over the next 9-12 months and so our short duration recommendation for government bonds is unchanged (Chart 19). Chart 19Rising Supply Will Push Up Rates
Rising Supply Will Push Up Rates
Rising Supply Will Push Up Rates
Chart 20TIPS Breakevens Have A Little Further To Go
TIPS Breakevens Have A Little Further To Go
TIPS Breakevens Have A Little Further To Go
Favor Linkers Vs. Nominal Bonds. BCA's U.S. Bond Strategy still believes that the U.S. TIPS break-evens will reach to our target range of 2.3%-2.5% because core inflation should remain close to the Fed's 2% target going forward. The latest NFIB survey supports this view as wage pressure is still on the rise, with reports of compensation increases near a record high (Chart 20). Compared to the current breakeven level of 2.1%, this means 10-year TIPS have upside of 20-40bp, an important source of return in the low-return fixed-income space. Maintain overweight TIPS vs. nominal bonds. However, TIPS are no longer cheap. For those who have not already moved to overweight TIPS, we suggest "buying TIPS on dips". Inflation-linked bonds (ILBs) in Australia and Japan are also still very attractive vs. their respective nominal bonds. Overweighting ILBs in those two markets also fits well with our macro themes. Corporate Bonds Chart 21Spreads Not Attractive
Spreads Not Attractive
Spreads Not Attractive
After being overweight for over two years, last quarter we turned neutral on corporates, including high-yield credits, within a global bond portfolio. Developed market corporate bonds have performed poorly in 2018 led by weak returns in the Financials sector and steepening credit curves.5 On the positive side, global corporate health (Chart 21) has been improving, led by the resilience of the U.S. economy and tax cuts that have put corporations in a cyclically healthier position. However, this may not be sustainable as the tightening labor market is pushing up wage growth, which will pressure margins. Interest coverage has fallen in recent years despite strong profitability and low borrowing costs. The risk of downgrades will rise when the earnings outlook weakens or borrowing costs start to rise. An additional concern is that weaker global ex-U.S. growth and a stronger dollar will weigh on U.S. corporate revenues. In the euro area, interest coverage and liquidity continue to improve, supported by easy monetary policies that have lowered borrowing costs. However, with the ECB set to end its corporate bond purchase program along with purchases of sovereign bonds at the end of the year, euro area corporate bonds will lose a major support. In Japan, leverage has been steadily falling and return on capital rising, pushing up the interest coverage multiple to 9.6x, the highest in developed markets. With Japanese corporate profits at an all-time high, default risk is low. The BoJ's forward guidance suggests no tightening until 2020, giving corporates a low cost of borrowing and probably a weak currency. Excess spread from U.S. high-yield bonds after adjusting for expected default losses is 226 bps, slightly below the long-run mean of 247 bps. Most indicators suggest that default losses will remain low for the next 12 months, but it will be critical to track real-time indicators such as job cuts to see if there is any deterioration in growth which might start to push up default rates. With a global corporate bond portfolio, we prefer Japanese and U.S. credits to euro area corporates. Chart 22Prefer Oil Over Metals
Prefer Oil Over Metals
Prefer Oil Over Metals
Commodities Energy (Overweight): Oil prices will continue to be driven by demand/supply fundamentals. We believe that that supply shocks will have more influence on the crude oil price over the coming months than will lower demand from EM (Chart 22, panel 2). U.S. sanctions on Iranian oil exports are estimated to take 800K-1M barrels a day out of global supply. We also factor in the risk of political collapse in Venezuela and outages in Iraqi and Libyan production, which would push oil prices higher. BCA's energy team forecasts that Brent crude will average $80 until year-end, and $95 by the end of the first half of next year.6 Industrial Metals (Neutral): An appreciating dollar along with weaker consumption of base metals in China, the world's largest consumer, are likely to keep industrial metals' prices depressed and to increase volatility over the next few months (panel 3). Additionally, the easing of U.S. sanctions on some Russian oligarchs connected with aluminum producer Rusal is likely to keep a lid on aluminum prices for now. Precious Metals (Neutral): Gold has been weak despite global uncertainties and political tensions arising from the U.S.-China trade spat, Middle East politics, and EM weakness. Since we see further upside in inflation in the coming months and remain concerned about global risk, gold remains an attractive hedge. However, rising real interest rates and the strong dollar will limit the upside (panel 4). Chart 23Further Upside For The Dollar
Further Upside For The Dollar
Further Upside For The Dollar
Currencies U.S. Dollar: The dollar has continued its appreciation over the past couple of months, propelled by a moderately hawkish Fed and strong economic data. We see further upside to inflation, though the latest print fell short of expectations. Tighter financial conditions in the U.S. will add further upside to the currency on a broad trade-weighted basis, as well as against other majors (Chart 23, panels 1 and 2). EM Currencies: Dollar appreciation, higher interest rates, increasing trade tensions, and a slowdown in China, have put pressure on EM currencies. We expect these conditions to continue. Sharp interest rate hikes in Argentina and Turkey have not stopped the fall, probably because markets anticipate that the hikes will trigger recessions in these countries. Euro: Weak European economic data and downward growth revisions have put downward pressure on the currency. Additionally, looming political uncertainty in Italy, Europe's large exposure to EM, and continuing trade-war tensions make it likely that the euro will decline further (panel 4). The ECB confirmed its plan to end asset purchases by year-end, but is likely to raise rates only in late 2019. We maintain our view that EUR/USD will weaken to at least 1.12. GBP: Brexit issues continue to affect the pound: the only driver that could push GBP higher would be if both the European Union and the U.K. parliament agree to Theresa May's "Chequers plan". However, with strong opposition from both pro-Brexit Conservative MPs and the Labour Party, the chance of approval seem low. We remain bearish on the pound until there is more clarity on how Brexit will pan out and expect increasing volatility until then. Chart 24Signs Of Overheating In Alts?
Signs Of Overheating In Alts?
Signs Of Overheating In Alts?
Alternatives Alternative assets under management continue to grow to record highs, driven by positive sentiment, the global search for yield, and the need for uncorrelated returns. However, there are increasing signs of overheating in the core areas of this market. We analyze our allocation recommendations using a framework of three buckets: 1) return enhancers, 2) inflation hedges, 3) volatility dampeners. Return Enhancers: In H1 2018, private equity (PE) outperformed hedge funds by 6.4% (Chart 24). However, last quarter we recommended investors pare back on their PE allocations and increase hedge funds. Rising competition in PE has pushed deal valuations to new highs, and we expect to see funds raised in 2018-2019 produce poor long-term returns because of higher entry valuations.7 Within the hedge fund space, we recommend investors shift to macro hedge funds, as the end of the business cycle approaches. Inflation Hedges: In H1 2018, commodity futures outperformed direct real estate by over 7%. We remain cautious on commercial real estate (CRE). Loans to CRE have reached a record $4.3 trillion, 11% higher than at the pre-crisis peak. As central banks tighten monetary policy, financial stress is likely to appear in CRE. CRE prices peaked in late 2016 and have subsequently moved sideways, partly due to the downturn in shopping malls and retail. Commodity futures, on the other hand, have performed well on the back of rising energy prices. However, we expect increased volatility in commodities due to supply disruptions in oil, and a further slowdown in EM demand. Volatility Dampeners: In H2 2018, farmland and timberland outperformed structured products by 3%. Timberland has a stronger correlation with economic growth via the U.S. housing market. This year, lumber prices have fallen from over $600 to $340, mostly due to speculative action in the futures market. However, this will ultimately impact income from timber sales. Farmland is more insulated from the economy since food demand is autonomous consumption. Structured products face pressures as rising rates push lower-quality tranches closer to default. Investors should favor farmland over timberland, and maintain only a minimum allocation to structured products. Risks To Our View Our main scenario, as outlined in the Overview, is that this year's trends will continue. What might cause them to change? Chart 25China Has Cut Rates A Bit
China Has Cut Rates A Bit
China Has Cut Rates A Bit
Chart 26...But Fiscal Spending Not Yet Picking Up
...But Fiscal Spending Not Yet Picking Up
...But Fiscal Spending Not Yet Picking Up
The biggest risk is Chinese policy. A big stimulus, in line with those in 2009 and 2015, would boost growth in emerging markets, Europe and Japan, push up commodity prices, and weaken the dollar. The PBoC has cut rates (Chart 25) and lowered the reserve requirement. The government has said it will bring this year's budget plans forward, though for now fiscal spending is slowing compared to last year (Chart 26). Faced with a major slowdown and devastating trade war, the Chinese authorities would doubtless throw everything at the problem. But, up until that point, their priority remains deleverage and reform, and so we expect them to do no more than moderately cushion the downside. Chart 27Are Speculators Too Long The Dollar?
Quarterly - October 2018
Quarterly - October 2018
As always, a major factor is the U.S. dollar, which we expect to appreciate further, as the Fed tightens more than the market expects, and U.S. growth outpaces the rest of the world. What's the most likely reason we're wrong? Probably a situation like 2017, when speculators were very long the dollar just as growth in Europe started to accelerate relative to the U.S. Today, speculative positions are moderately long the dollar, but against the euro and yen not as much as in early 2017 (Chart 27). Aside from a Chinese reflation, it is hard to see what would propel an ex-U.S. growth spurt. True, Japanese capex and wages are showing some signs of life. But Japan worryingly intends to raise VAT in late 2019. And Europe faces considerable political risks - Brexit, Italy, troubled banks, contagion from Turkey - that make it unlikely that confidence will rebound. 1 For more details on this, please see section “What Our Clients Are Asking: Is The Fed Turning Dovish?” in this report. 2 Please see Global Asset Allocation Special Report, "Searching For Yield In A Low Return Environment," dated September 14, 2018 available at gaa.bcaresearch.com 3 Please see Global Asset Allocation "Quarterly - July 2018," dated July 2, 2018 available at gaa.bcaresearch.com 4 Please see Global Asset Allocation "Quarterly - July 2018," dated July 2, 2018 available at gaa.bcaresearch.com 5 Please see Global Fixed Income Strategy Weekly Report titled "A Performance Update On Global Corporate Bond Sectors," dated September 4, 2018 available at gfis.bcaresearch.com 6 Please see Commodity & Energy Strategy Weekly Report, "Odds of Oil-Price Spike in 1H19 Rise; 2019 Brent Forecast Lifted $15 To $95/bbl," dated September 20, 2018. 7 Please see Global Asset Allocation Special Report on private equity, "Private Equity: Have We Reached The Top?," dated September 26, 2018 available at gaa.bcaresearch.com GAA Asset Allocation